
Enhancement of Scan Strategy for Improving Surface Characteristics of the SLMed Inconel 718 Alloy Component


Abstract
1. Introduction
2. Materials and Instrument
2.1. Material
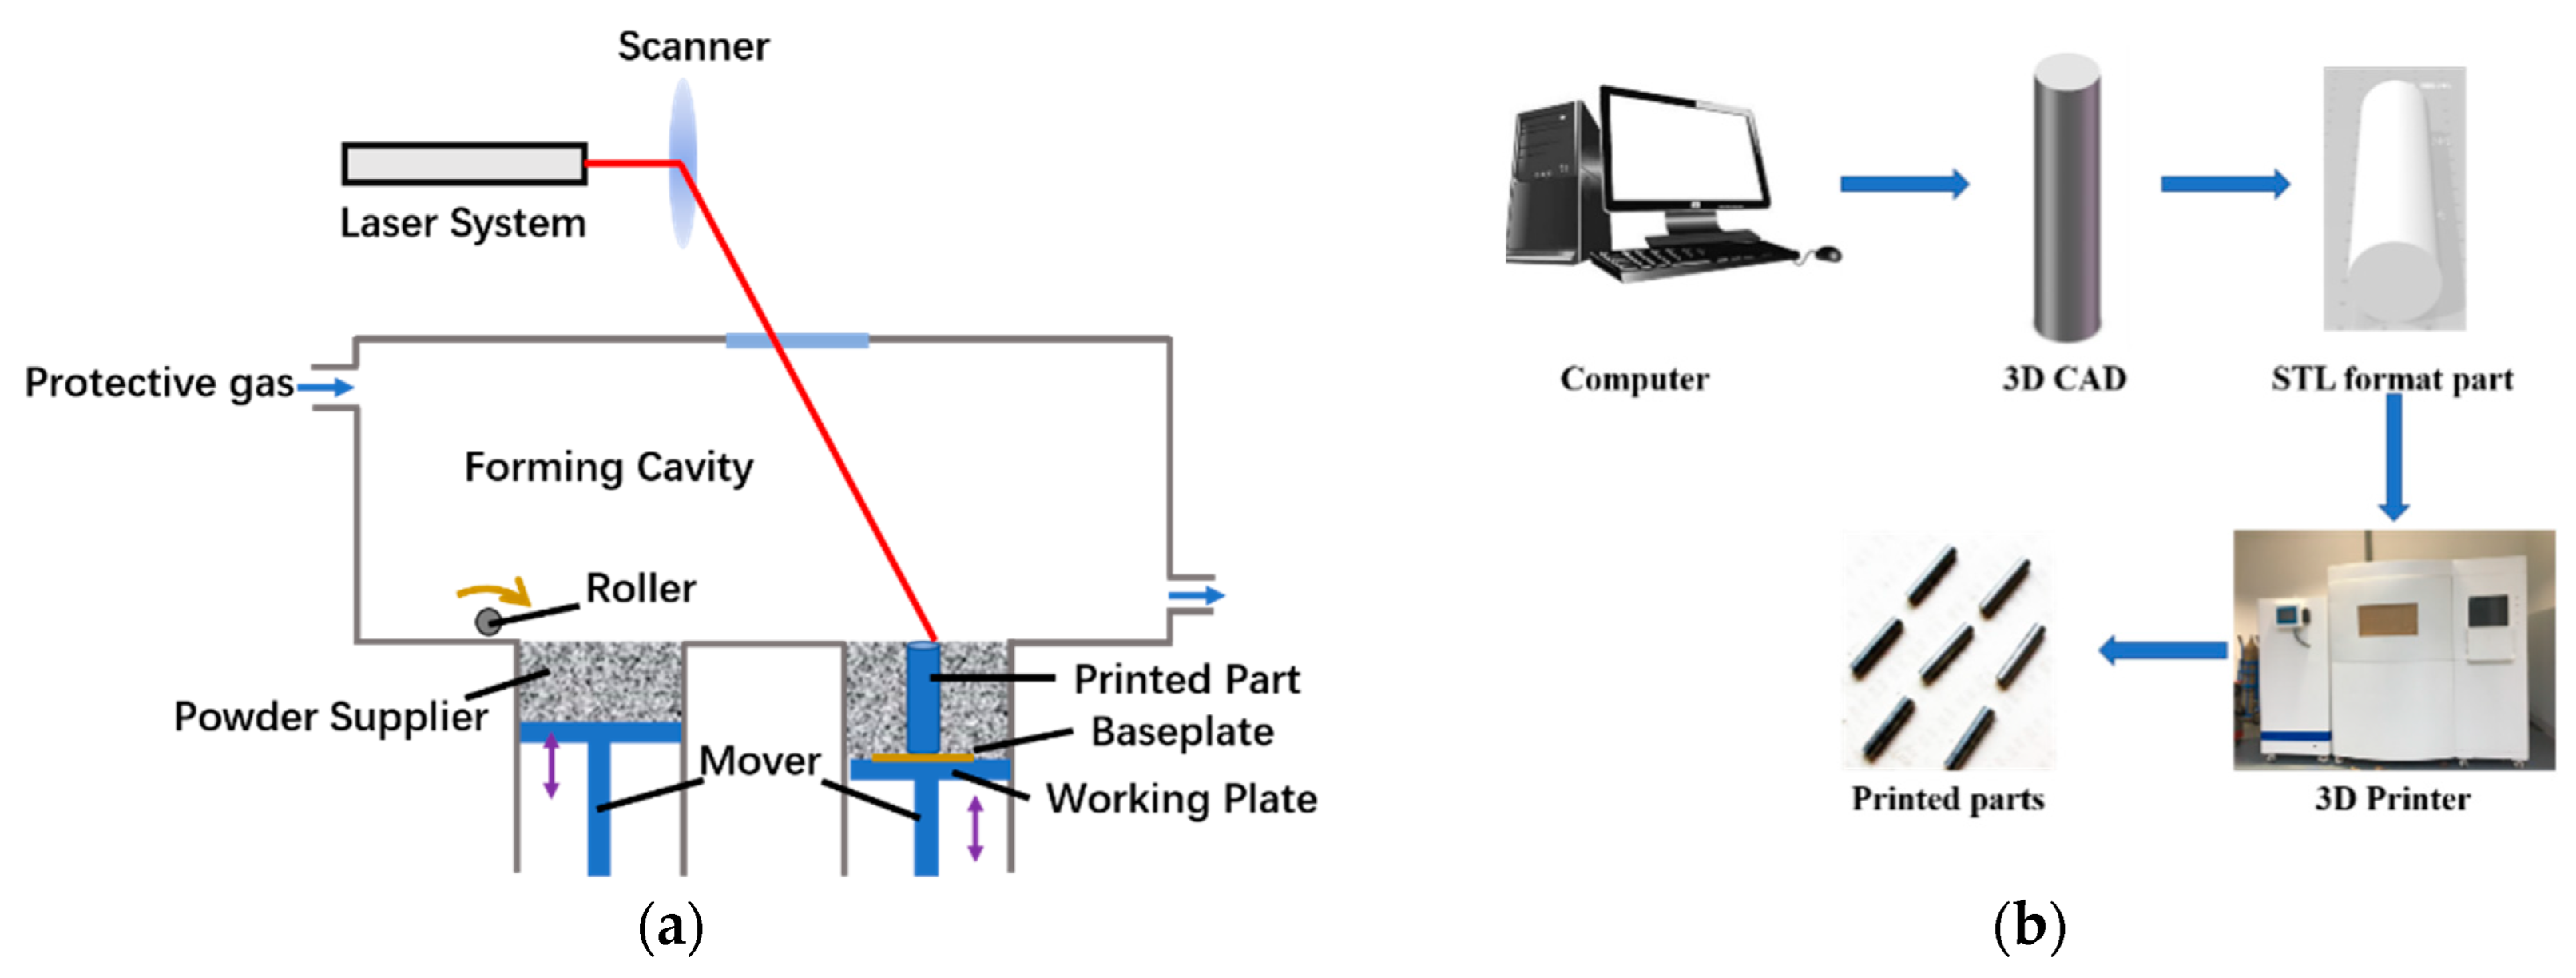
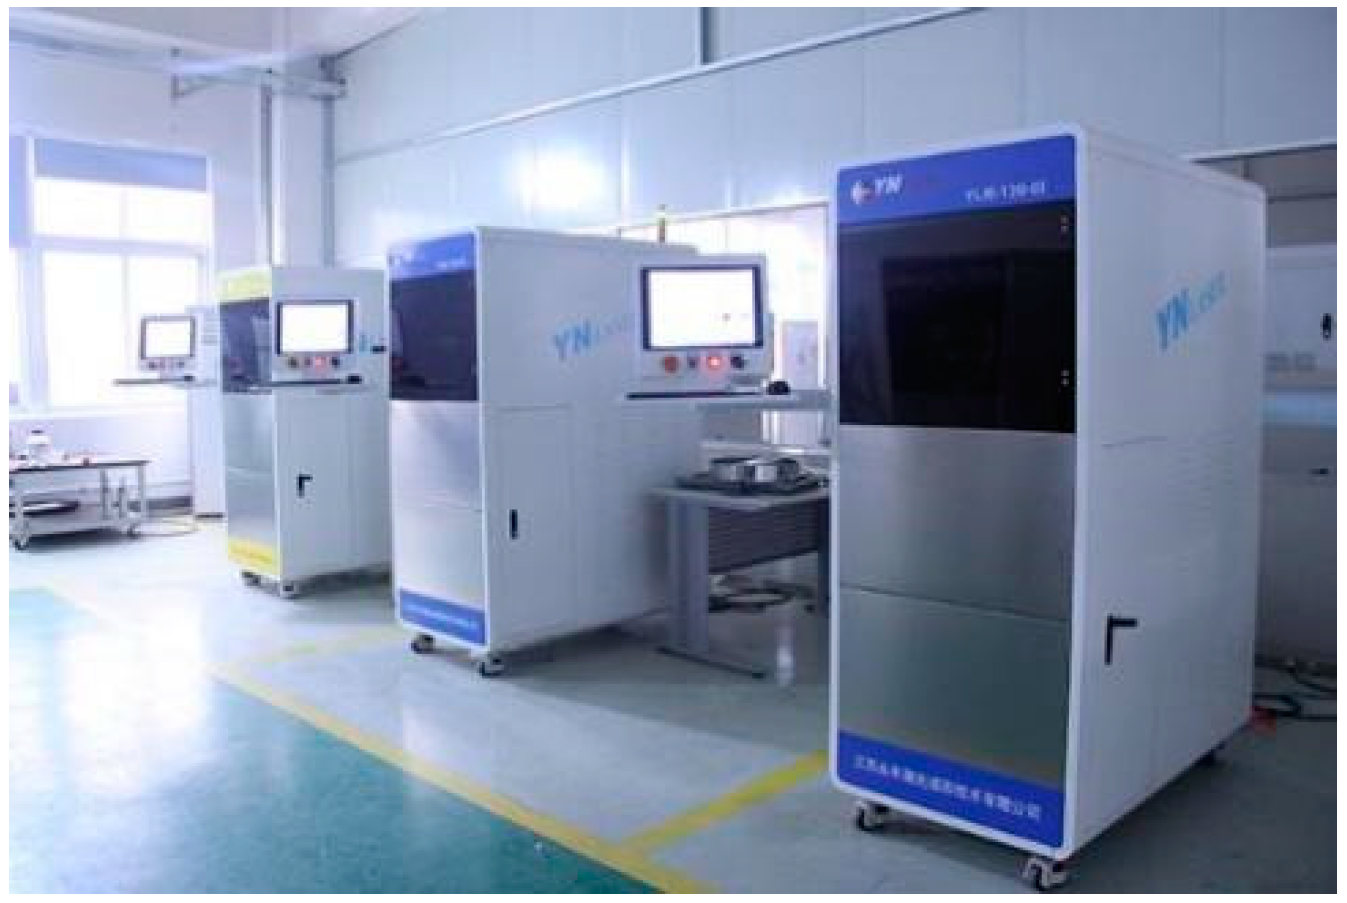
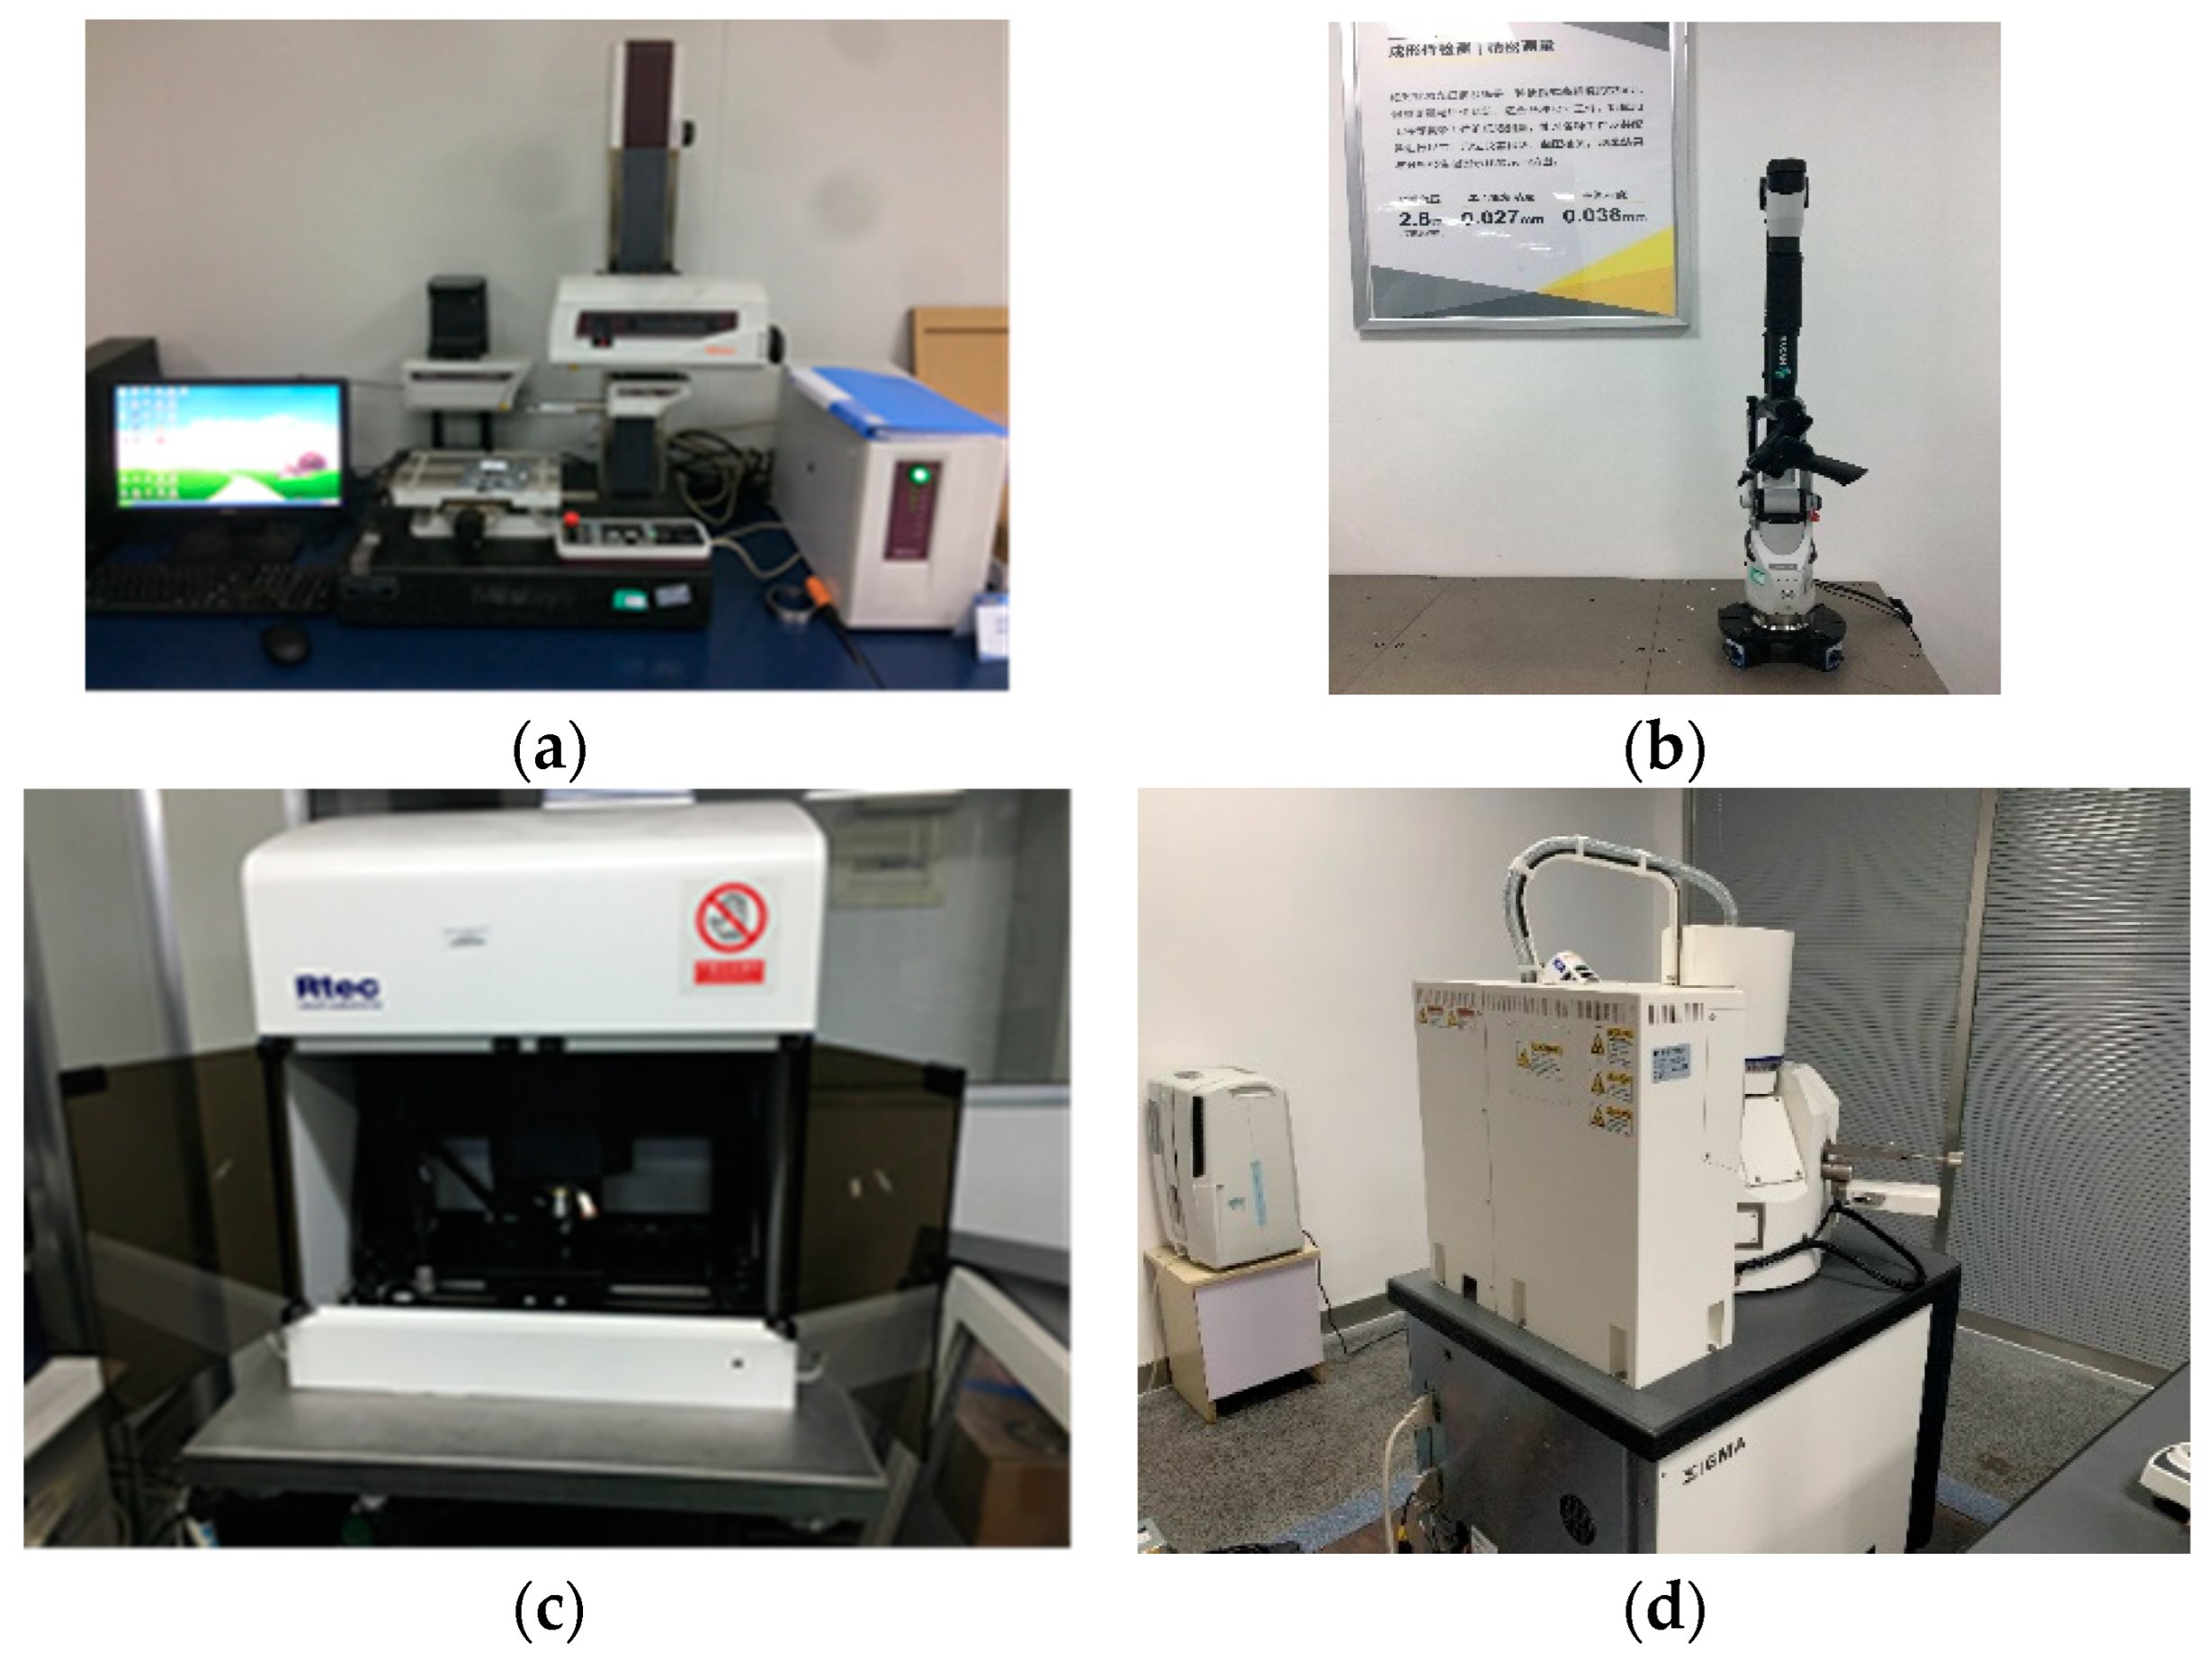
2.2. Instrument
3. Results and Discussion
4. Conclusions
- (1)
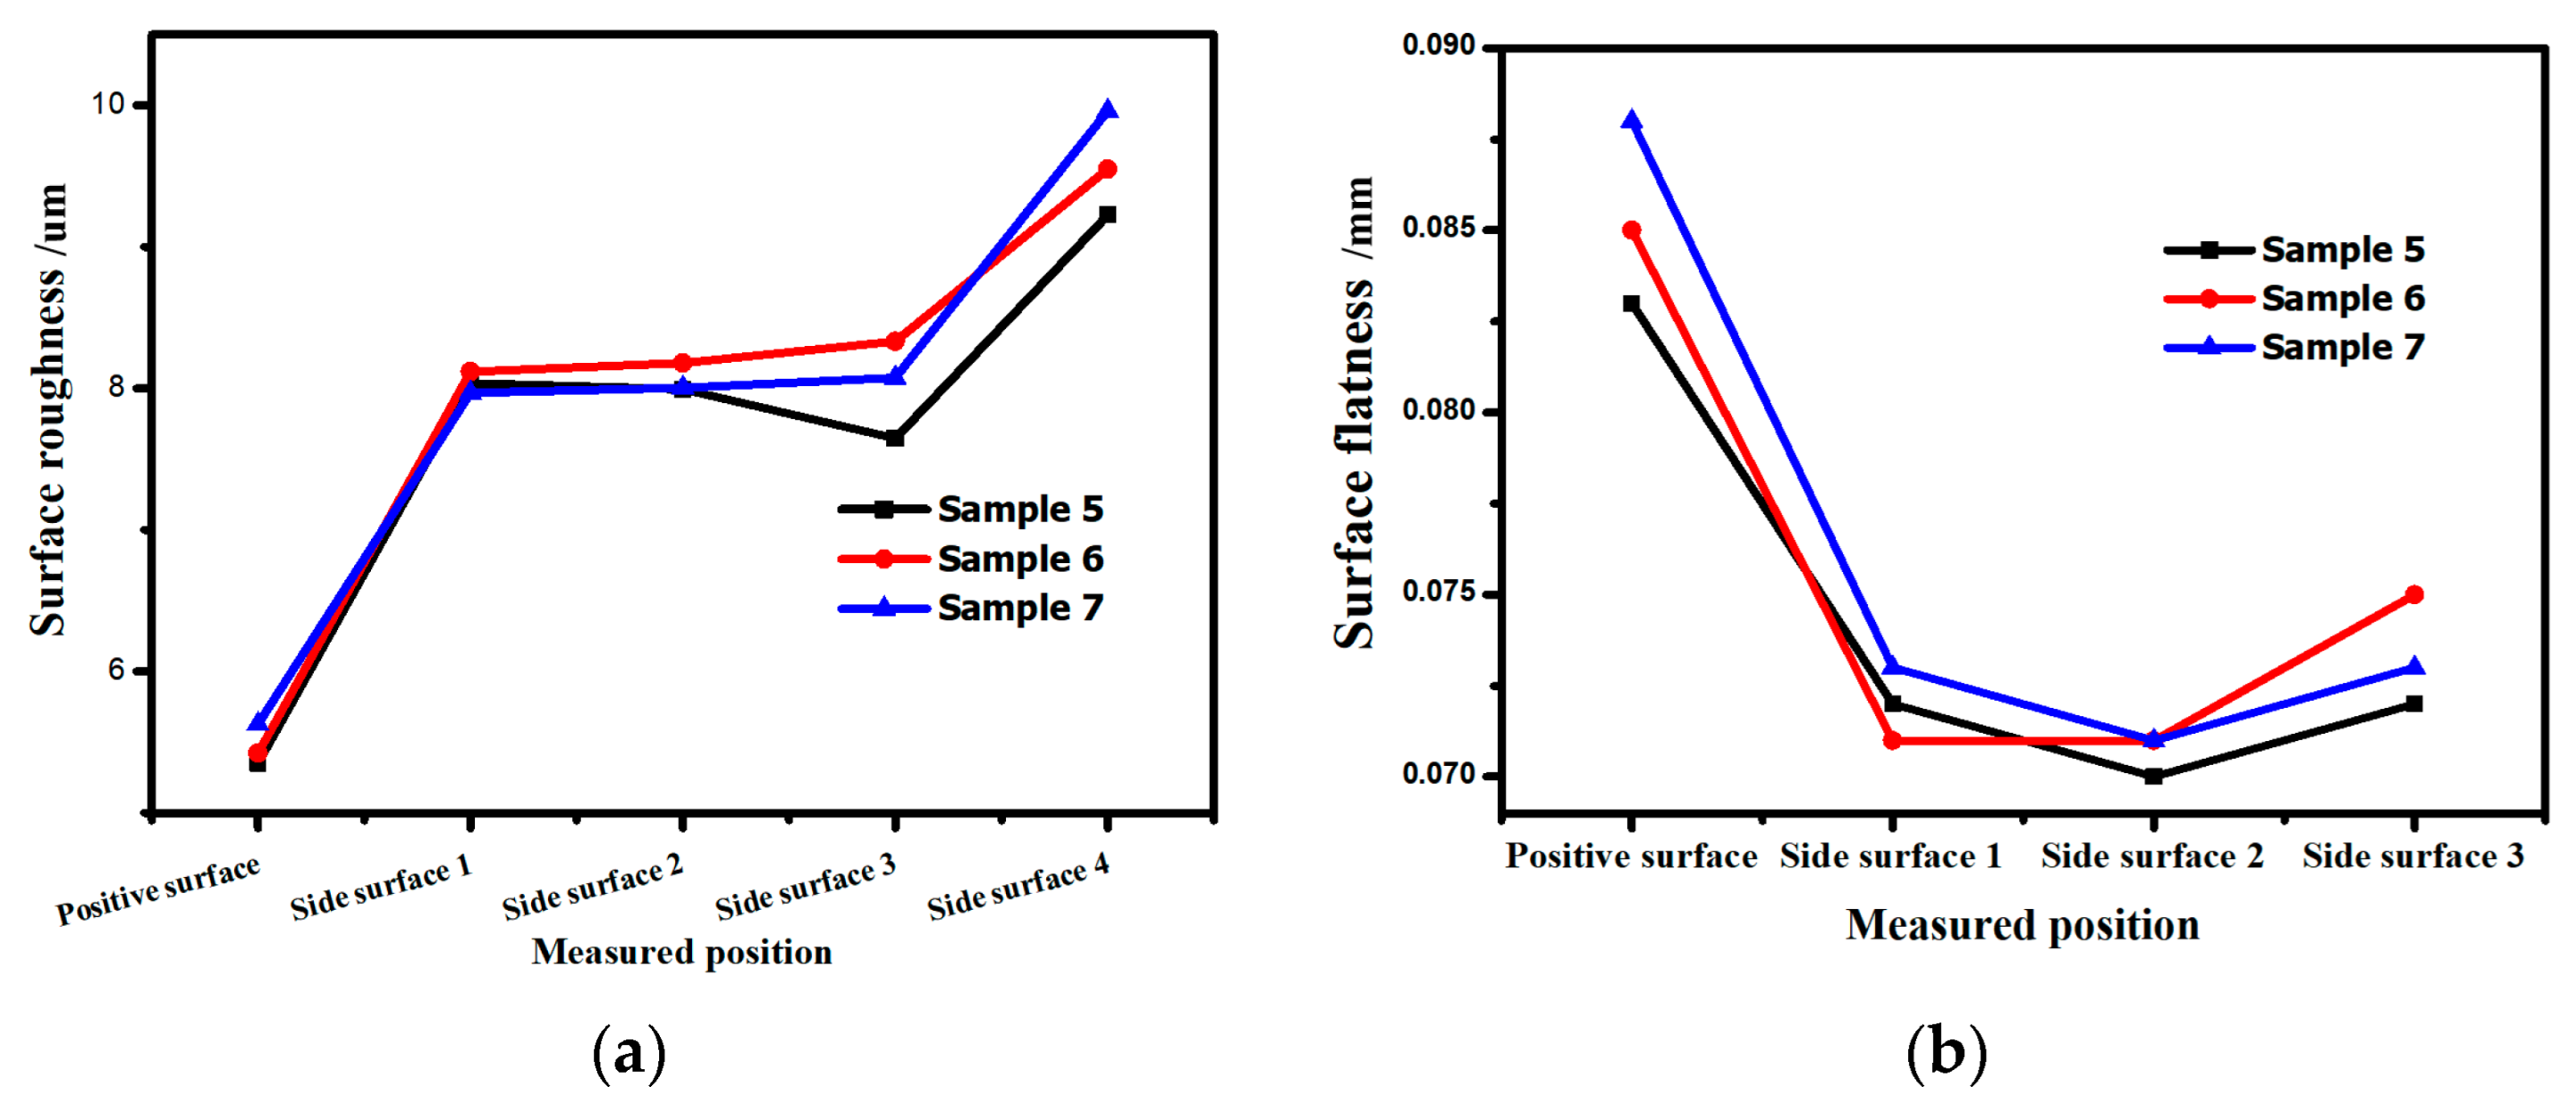
- The side surface roughness exhibited superior performance when printed along the scan path, as opposed to when printed vertically to the scan path, due to the fluctuation of laser power at the turning location. The flatness value exhibited minimal variation when printed using different scan paths.
- (2)
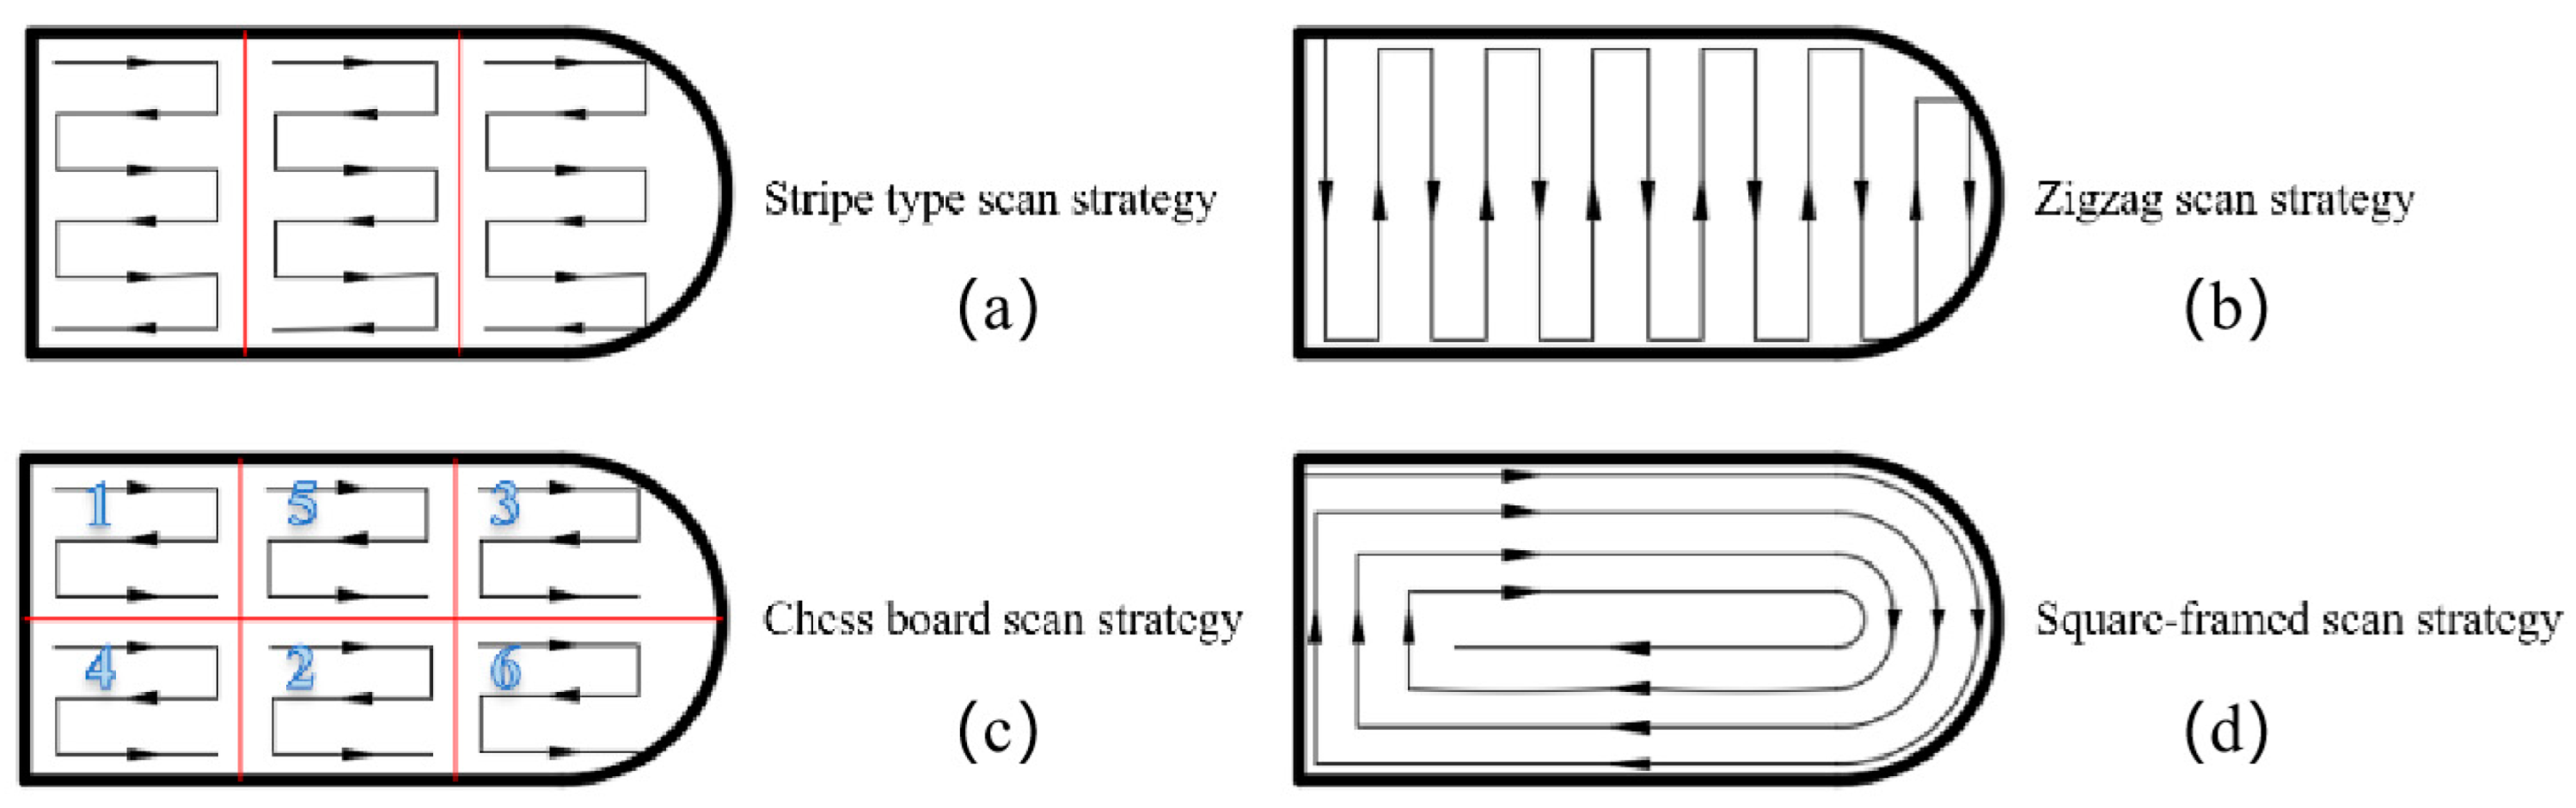
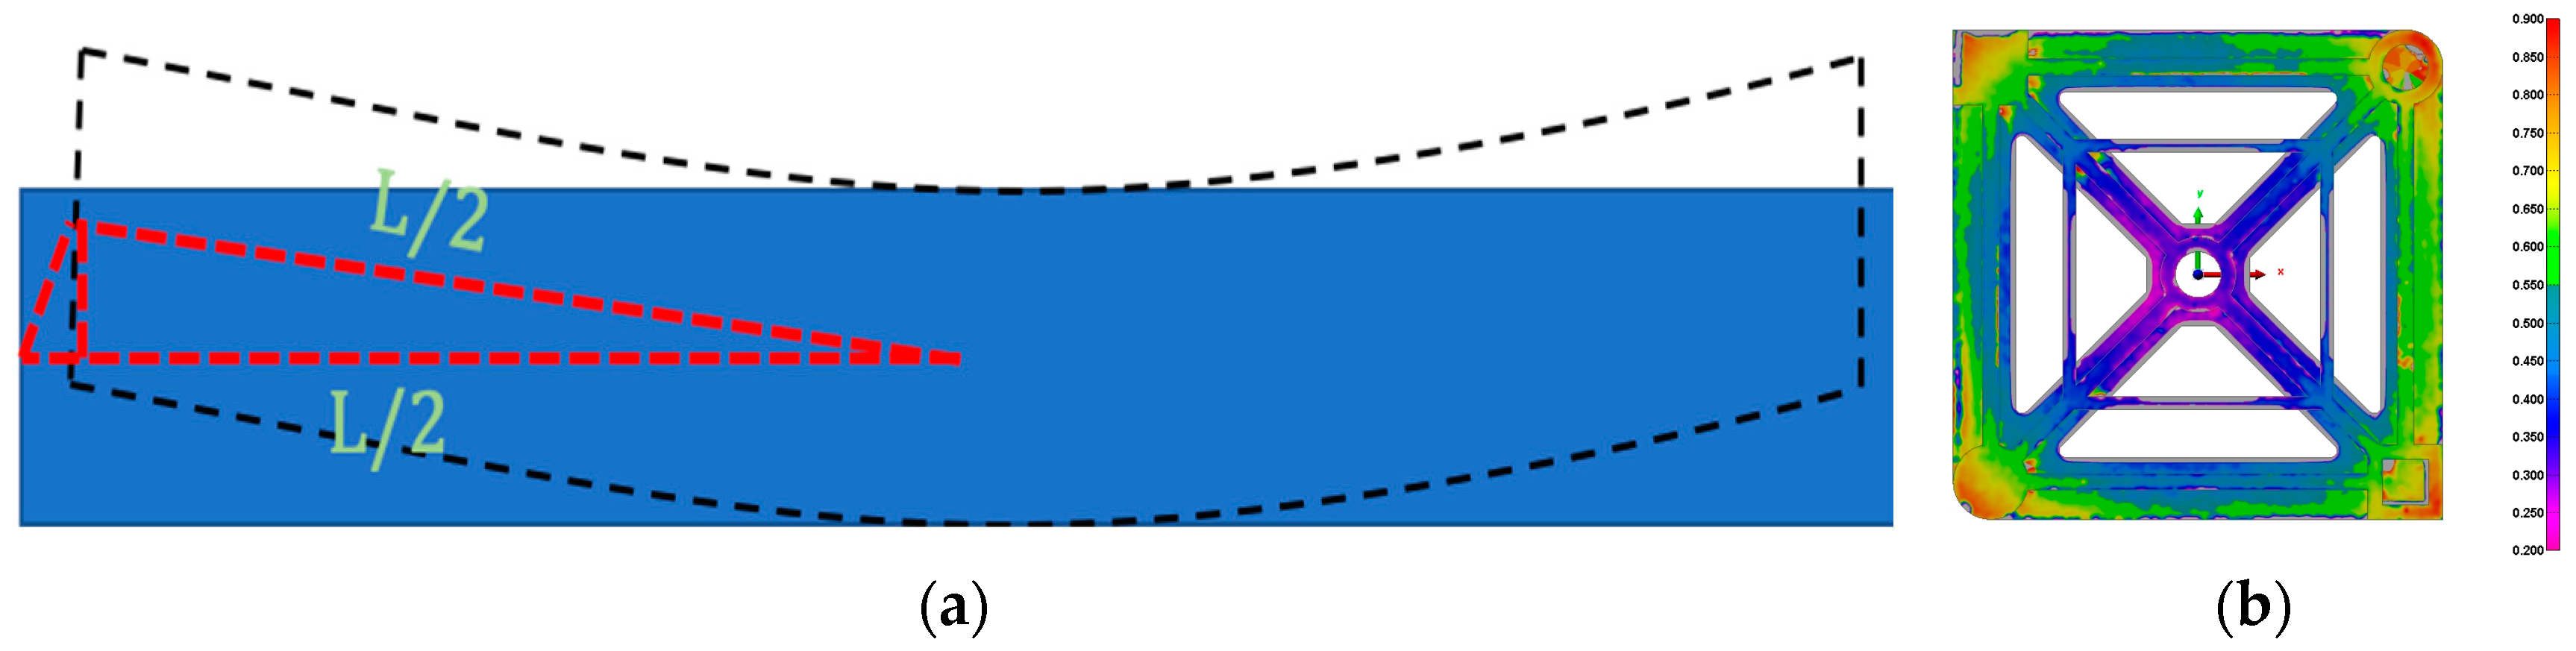
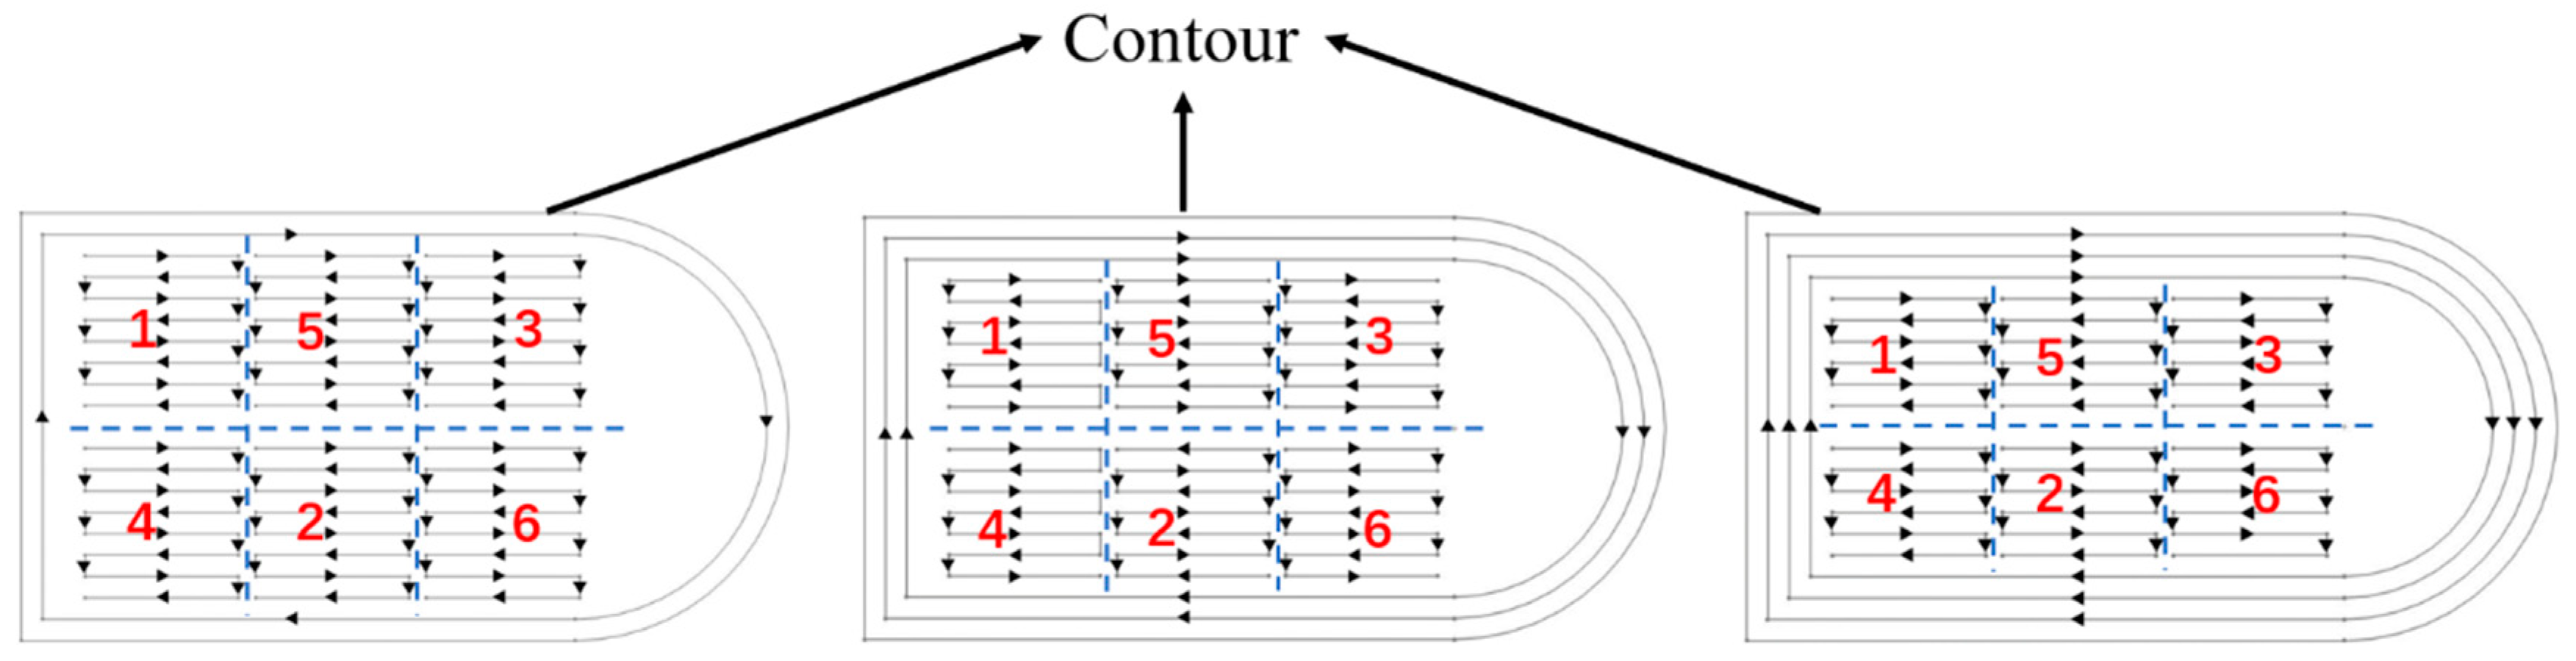
- The primary cause of variations in surface flatness is bending deformation, with the positive surface being the most affected due to the accumulation of deformation and its larger area compared to the side surface. The findings indicated that the chess board scan strategy exhibited a relatively ideal condition as a result of the printing process having a more uniform temperature distribution.
- (3)
- The newly proposed scan strategy combines the benefits of both the square-framed scan strategy and the chess board scan strategy. The flatness value of the positive surface was nearly identical to that printed using the chess board scan strategy, while the roughness value of the side surface was even lower compared to that printed using the square-framed scan method.
Author Contributions
Funding
Data Availability Statement
Conflicts of Interest
References
- Kruth, J.P.; Mercelis, P.; Van Vaerenbergh, J.; Froyen, L.; Rombouts, M. Binding mechanisms in selective laser sintering and selective laser melting. Rapid Prototyp. J. 2005, 11, 26–36. [Google Scholar] [CrossRef]
- Thijs, L.; Verhaeghe, F.; Craeghs, T.; Humbeeck, J.V.; Kruth, J.P. A study of the microstructural evolution during selective laser melting of ti–6al–4v. Acta Mater. 2010, 58, 3303–3312. [Google Scholar] [CrossRef]
- Pattanayak, D.K.; Fukuda, A.; Matsushita, T.; Takemoto, M.; Fujibayashi, S.; Sasaki, K.; Nishida, N.; Nakamura, T.; Kokubo, T. Bioactive ti metal analogous to human cancellous bone: Fabrication by selective laser melting and chemical treatments. Acta Biomater. 2011, 7, 1398–1406. [Google Scholar] [CrossRef] [PubMed]
- Zaeh, M.F.; Branner, G. Investigations on residual stresses and deformations in selective laser melting. Prod. Eng. 2010, 4, 35–45. [Google Scholar] [CrossRef]
- Mertens, R.; Clijsters, S.; Kempen, K.; Kruth, J.P. Optimization of scan strategies in selective laser melting of aluminum parts with downfacing areas. J. Manuf. Ence Eng. 2014, 136, 061012. [Google Scholar] [CrossRef]
- Rashid, R.; Masood, S.H.; Ruan, D.; Palanisamy, S.; Rahman Rashid, R.A.; Brandt, M. Effect of scan strategy on density and metallurgical properties of 17-4ph parts printed by selective laser melting (slm). J. Mater. Process. Technol. 2017, 249, 502–511. [Google Scholar] [CrossRef]
- Su, X.B.; Yang, Y.Q.; Liu, J. Theoretical study on overlapping mechanism in slm based on interlayer-staggered scan strategy. Appl. Mech. Mater. 2011, 44–47, 1482–1486. [Google Scholar] [CrossRef]
- Carter, L.N.; Martin, C.; Withers, P.J.; Attallah, M.M. The influence of the laser scan strategy on grain structure and cracking behaviour in slm powder-bed fabricated nickel superalloy. J. Alloys Compd. 2014, 615, 338–347. [Google Scholar] [CrossRef]
- Han, J.; Wu, M.; Duan, W. A proposed scan strategy used on slm inner structure part. Materials 2020, 13, 937. [Google Scholar] [CrossRef] [PubMed]
- Jhabvala, J.; Boillat, E.; Antignac, T.; Glardon, R. Study and simulation of different scanning strategies in SLM. In Innovative Developments in Design and Manufacturing; Routledge: London, UK, 2010; pp. 369–375. [Google Scholar]
- Qian, B.; Shi, Y.S.; Wei, Q.S.; Wang, H.B. The helix scan strategy applied to the selective laser melting. Int. J. Adv. Manuf. Technol. 2012, 63, 631–640. [Google Scholar]
- Ali, H.; Ghadbeigi, H.; Mumtaz, K. Effect of scanning strategies on residual stress and mechanical properties of selective laser melted ti6al4v. Mater. Sci. Eng. A 2018, 712, 175–187. [Google Scholar] [CrossRef]
- Parry, L.; Ashcroft, I.A.; Wildman, R.D. Understanding the effect of laser scan strategy on residual stress in selective laser melting through thermo-mechanical simulation. Addit. Manuf. 2016, 12, 1–15. [Google Scholar] [CrossRef]
- Dai, D.H.; Gu, D.D.; Zhang, H.; Xiong, J.P.; Ma, C.L.; Hong, C.; Poprawe, R. Influence of scan strategy and molten pool configuration on microstructures and tensile properties of selective laser melting additive manufactured aluminum based parts. Opt. Laser Technol. 2018, 99, 91–100. [Google Scholar] [CrossRef]
- Song, J.; Wu, W.H.; Zhang, L.; He, B.B.; Lu, L.; Ni, X.Q.; Long, Q.L.; Zhu, G.L. Role of scanning strategy on residual stress distribution in ti-6al-4v alloy prepared by selective laser melting. Optik 2018, 170, 342–352. [Google Scholar] [CrossRef]
- Geiger, F.; Kunze, K.; Etter, T. Tailoring the texture of IN738LC processed by selective laser melting (SLM) by specific scanning strategies. Mater. Sci. Eng. A 2016, 661, 240–246. [Google Scholar] [CrossRef]
- Yan, X.L.; Pang, J.C.; Jing, Y.L. Ultrasonic Measurement of Stress in SLM 316L Stainless Steel Forming Parts Manufactured Using Different Scanning Strategies. Materials 2019, 12, 17. [Google Scholar] [CrossRef] [PubMed]
- Koutny, D.; Palousek, D.; Pantelejev, L.; Hoeller, C.; Pichler, R.; Tesicky, L.; Kaiser, J. Influence of Scanning Strategies on Processing of Aluminum Alloy EN AW 2618 Using Selective Laser Melting. Materials 2018, 11, 298. [Google Scholar] [CrossRef] [PubMed]
- Cheng, B.; Shrestha, S.B.; Chou, K. Stress and deformation evaluations of scanning strategy effect in selective laser melting. Addit. Manuf. 2016, 12, 240–251. [Google Scholar]


| Chemical Composition /wt.% | Cr | Fe | Nb | Mo | Ti | Al | Co |
| 18.93 | 17.32 | 5.18 | 3.08 | 0.92 | 0.47 | 0.041 | |
| Cu | C | Si | Mn | P | S | Ni | |
| 0.058 | 0.05 | 0.056 | 0.13 | 0.0058 | 0.0038 | Bal | |
| Particle size distribution/μm | D10 | D50 | D90 | ||||
| 22.3 | 33.2 | 50.4 | |||||
| Process Parameters | Laser Power | Scan Speed | Layer Thickness | Defocusing Amount | Hatch Spacing | Protective Gas | Building Direction |
|---|---|---|---|---|---|---|---|
| Value | 200 W | 1000 mm/s | 70 μm | 0.0 mm | 0.08 mm | Argon | Y-axis |
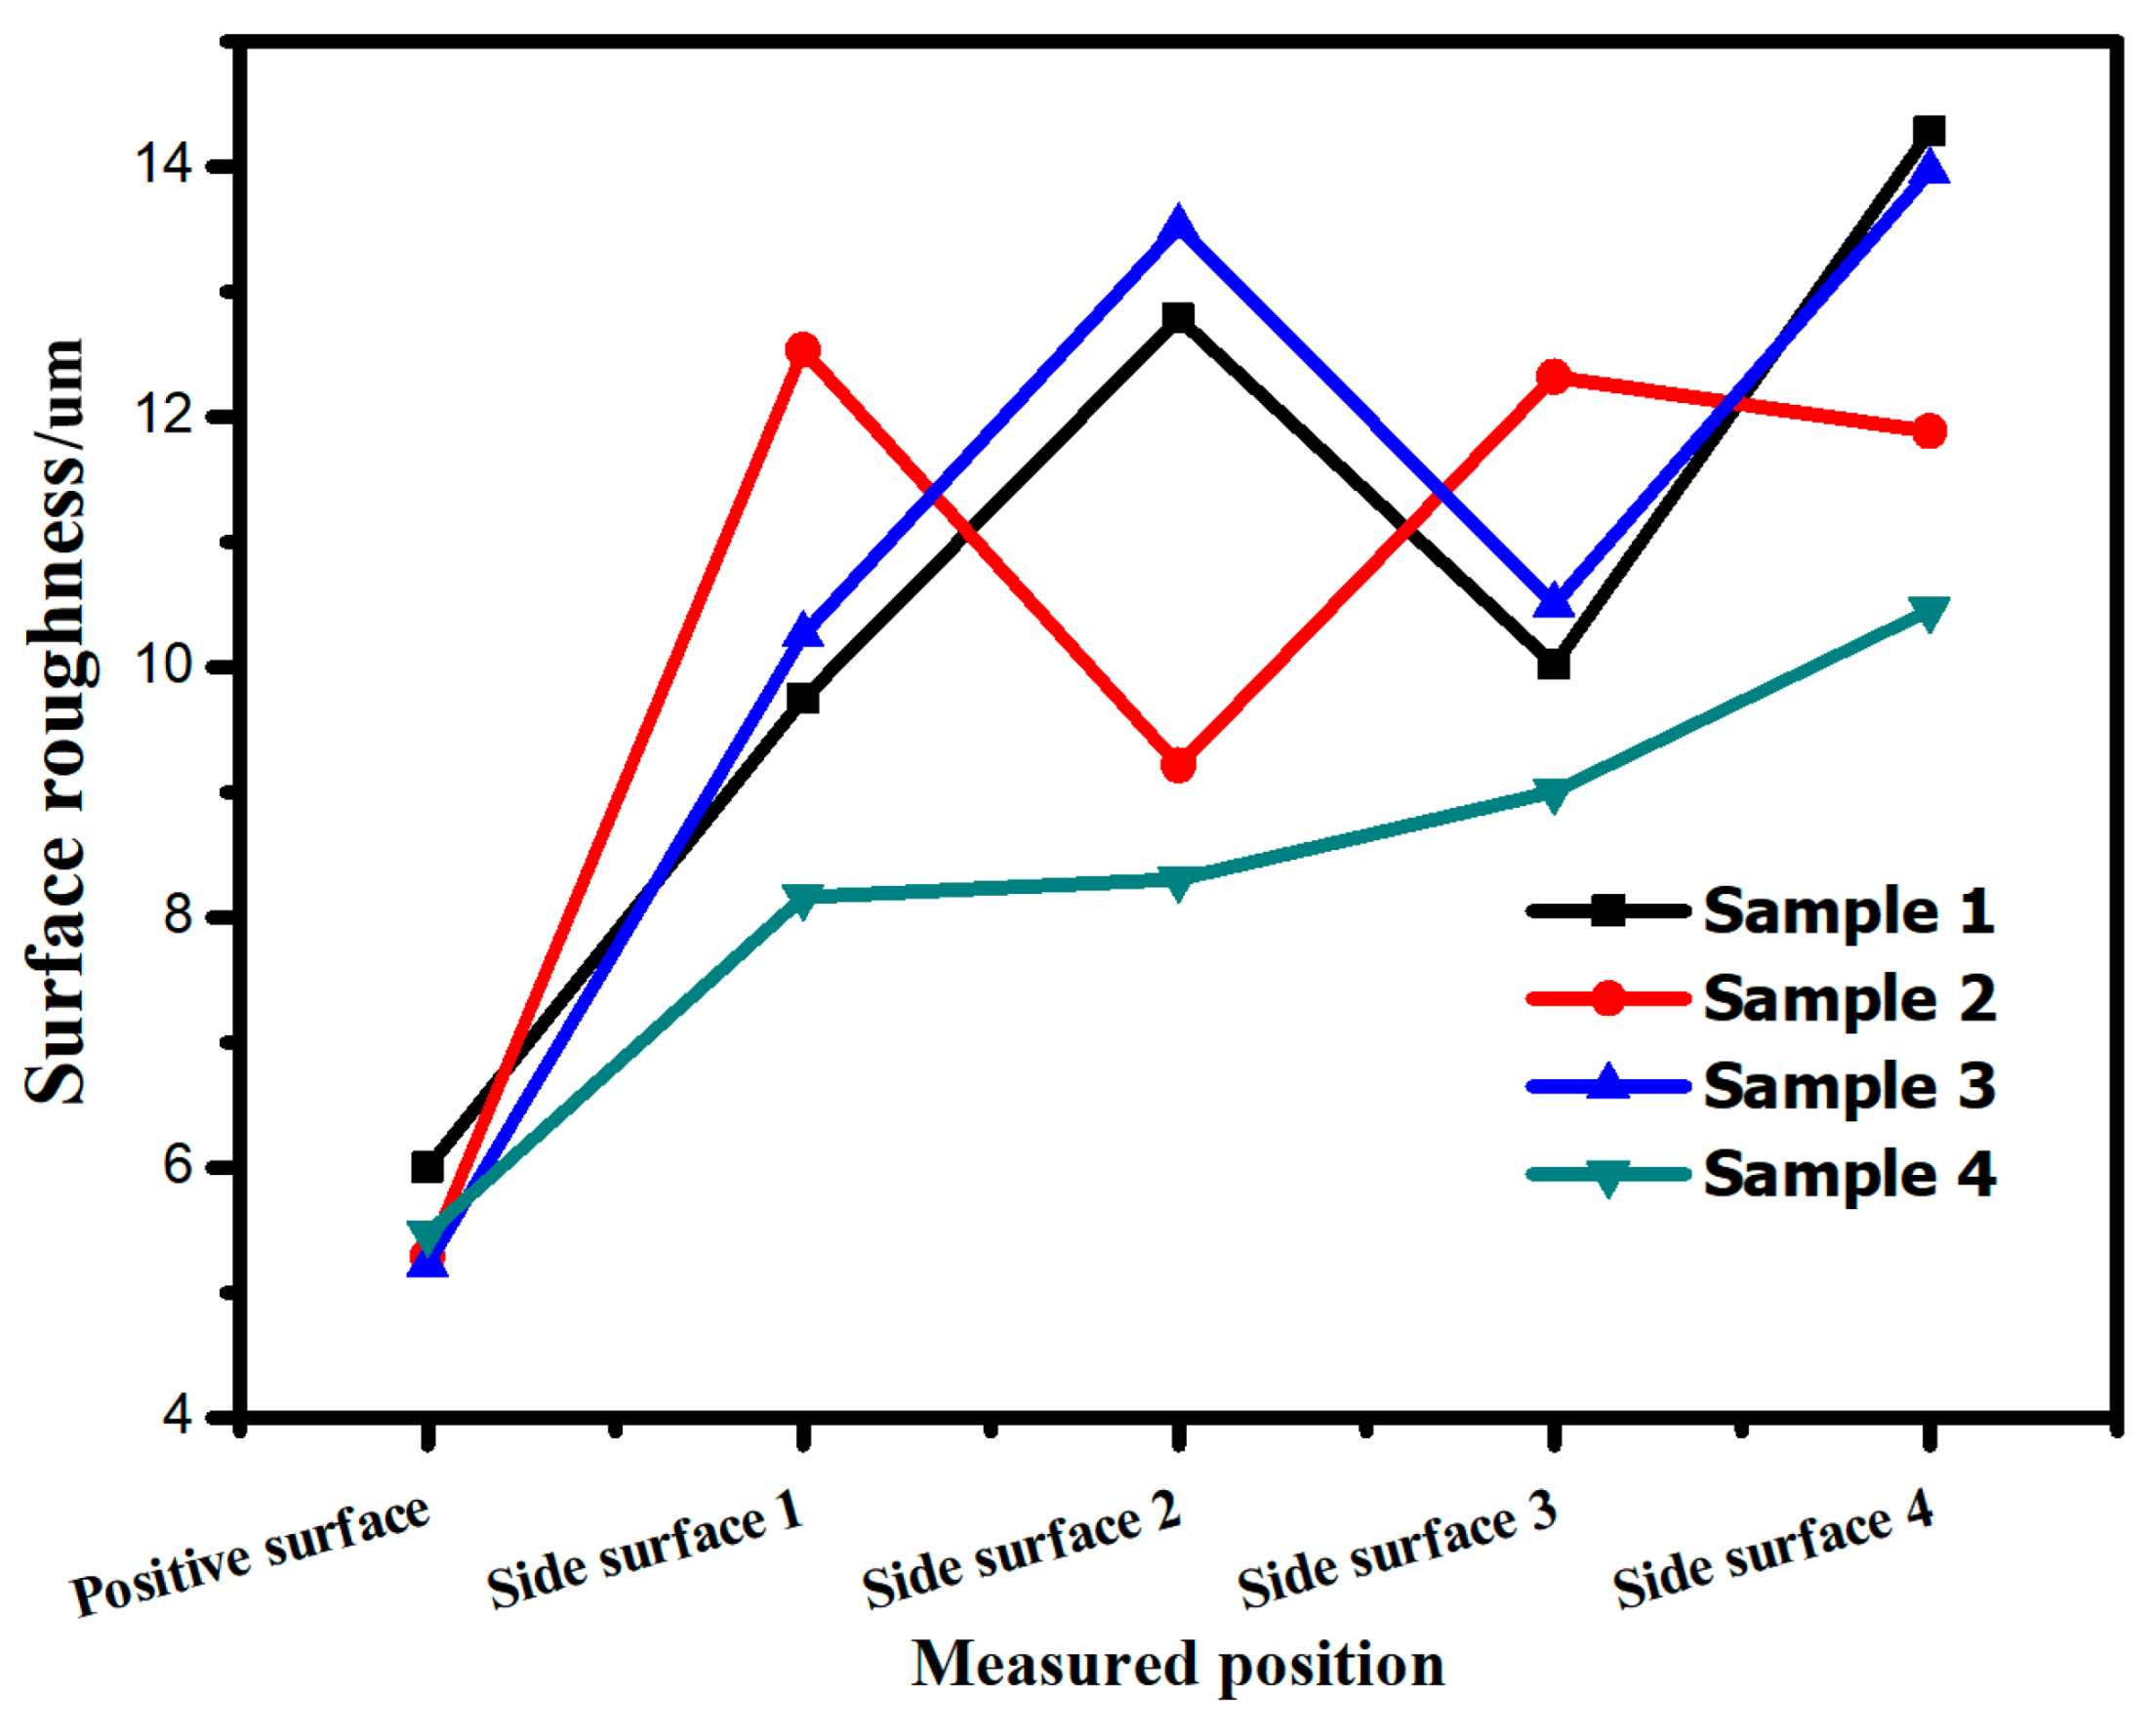
| Measured Position | Positive Surface/μm | Side Surface 1/μm | Side Surface 2/μm | Side Surface 3/μm | Side Surface 4/μm |
|---|---|---|---|---|---|
| Sample 1 | 6.003 | 9.745 | 12.785 | 10.021 | 14.277 |
| Sample 2 | 5.286 | 12.533 | 9.213 | 12.319 | 11.882 |
| Sample 3 | 5.229 | 10.257 | 13.522 | 10.503 | 13.963 |
| Sample 4 | 5.471 | 8.160 | 8.305 | 9.007 | 10.452 |
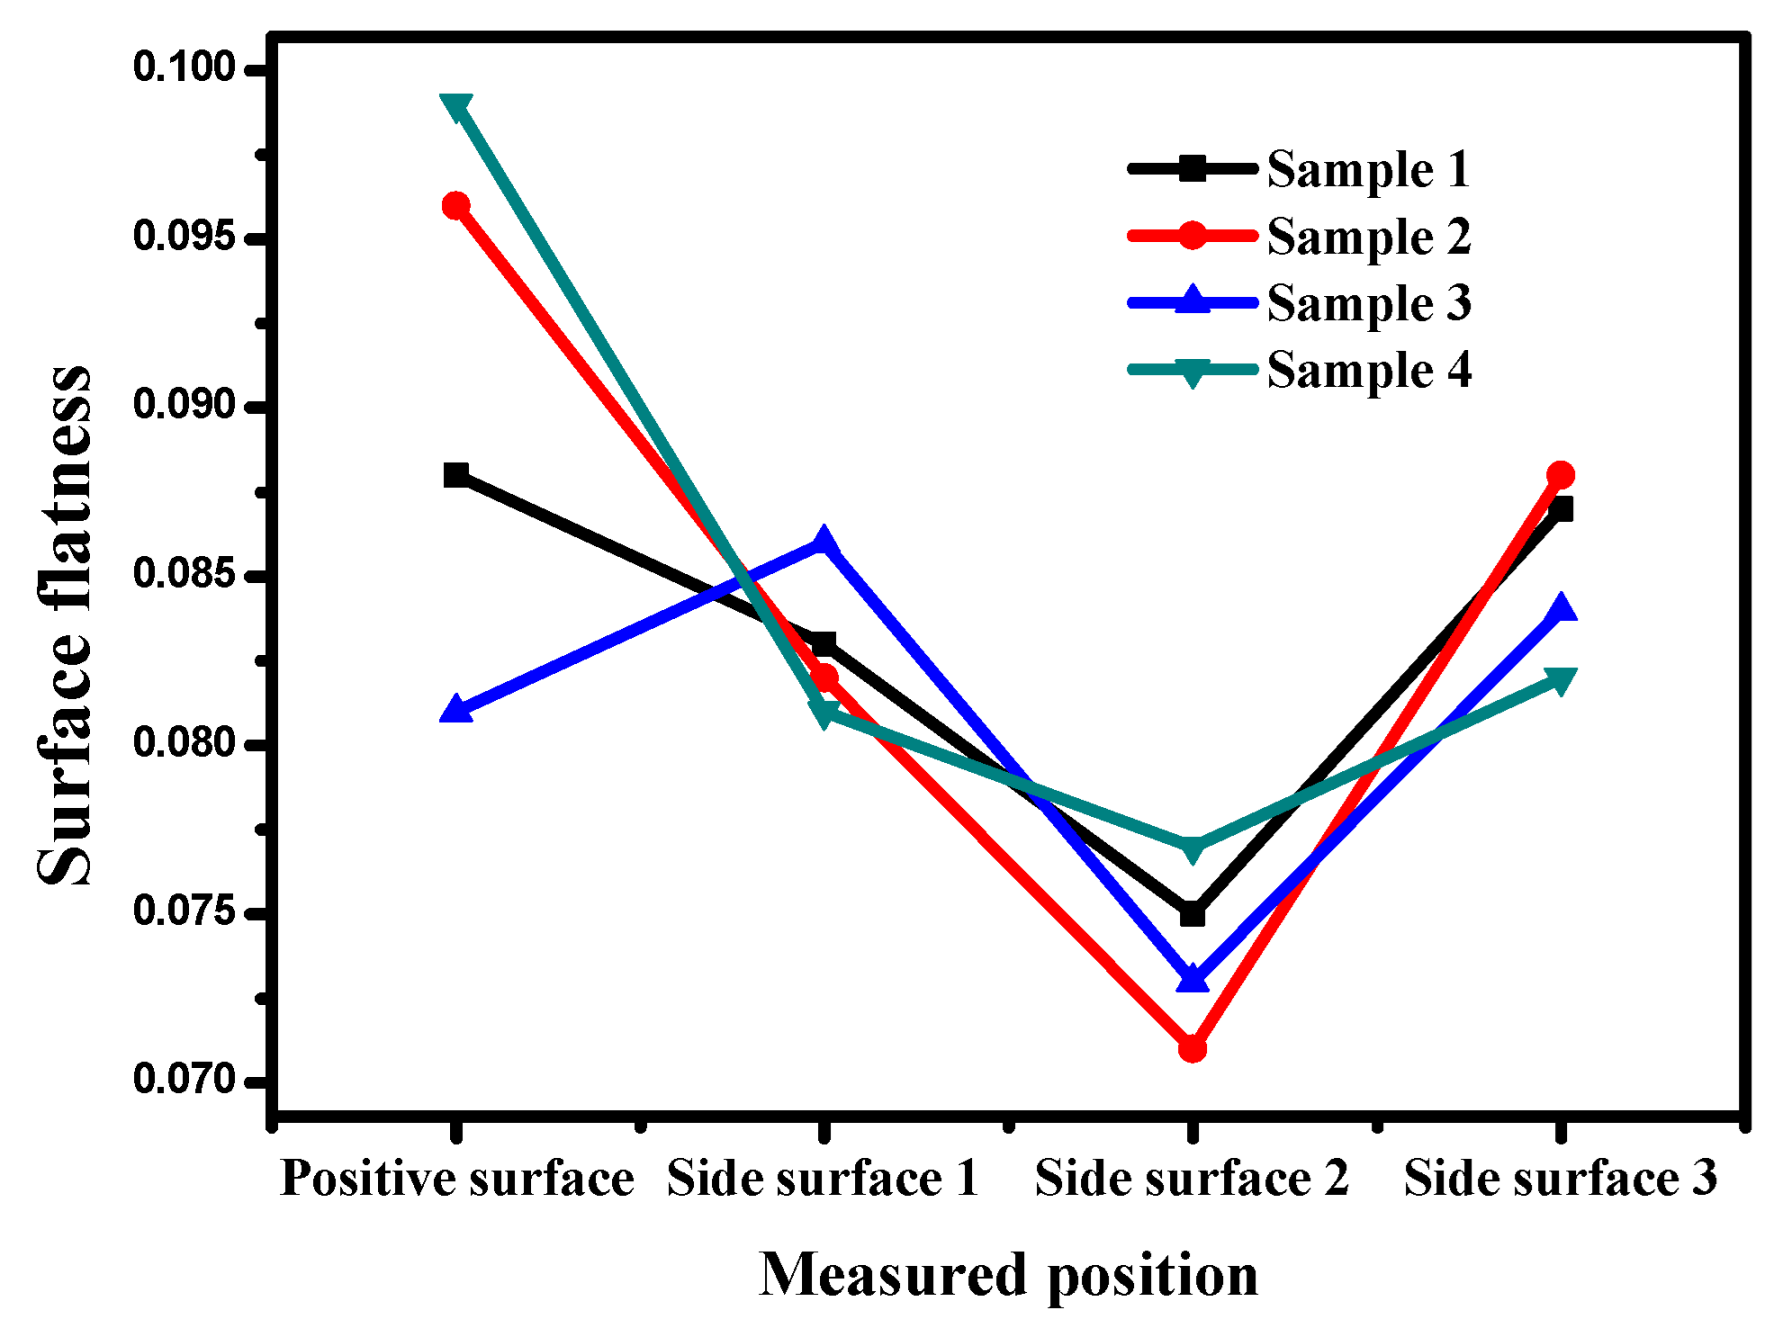
| Measured Position | Positive Surface/mm | Side Surface 1/mm | Side Surface 2/mm | Side Surface 3/mm |
|---|---|---|---|---|
| Sample 1 | 0.088 | 0.083 | 0.075 | 0.087 |
| Sample 2 | 0.096 | 0.082 | 0.071 | 0.088 |
| Sample 3 | 0.081 | 0.086 | 0.073 | 0.084 |
| Sample 4 | 0.099 | 0.081 | 0.077 | 0.082 |
| Roughness | Positive Surface/μm | Side Surface 1/μm | Side Surface 2/μm | Side Surface 3/μm | Side Surface 4/μm |
|---|---|---|---|---|---|
| Sample 5 | 5.351 | 8.035 | 7.993 | 7.645 | 9.225 |
| Sample 6 | 5.422 | 8.116 | 8.179 | 8.331 | 9.550 |
| Sample 7 | 5.627 | 7.967 | 8.003 | 8.074 | 9.961 |
| Flatness | Positive surface/mm | Side surface 1/mm | Side surface 2/mm | Side surface 3/mm | |
| Sample 5 | 0.083 | 0.072 | 0.070 | 0.072 | |
| Sample 6 | 0.085 | 0.071 | 0.071 | 0.075 | |
| Sample 7 | 0.088 | 0.073 | 0.071 | 0.073 | |
Disclaimer/Publisher’s Note: The statements, opinions and data contained in all publications are solely those of the individual author(s) and contributor(s) and not of MDPI and/or the editor(s). MDPI and/or the editor(s) disclaim responsibility for any injury to people or property resulting from any ideas, methods, instructions or products referred to in the content. |
© 2024 by the authors. Licensee MDPI, Basel, Switzerland. This article is an open access article distributed under the terms and conditions of the Creative Commons Attribution (CC BY) license (https://creativecommons.org/licenses/by/4.0/).
Share and Cite
Tang, S.; Han, J. Enhancement of Scan Strategy for Improving Surface Characteristics of the SLMed Inconel 718 Alloy Component. Crystals 2024, 14, 605. https://doi.org/10.3390/cryst14070605
Tang S, Han J. Enhancement of Scan Strategy for Improving Surface Characteristics of the SLMed Inconel 718 Alloy Component. Crystals. 2024; 14(7):605. https://doi.org/10.3390/cryst14070605
Chicago/Turabian StyleTang, Sida, and Jitai Han. 2024. "Enhancement of Scan Strategy for Improving Surface Characteristics of the SLMed Inconel 718 Alloy Component" Crystals 14, no. 7: 605. https://doi.org/10.3390/cryst14070605
APA StyleTang, S., & Han, J. (2024). Enhancement of Scan Strategy for Improving Surface Characteristics of the SLMed Inconel 718 Alloy Component. Crystals, 14(7), 605. https://doi.org/10.3390/cryst14070605