Abstract
Li-ion batteries used in portable electronic devices and electric vehicles require high safety standards, necessitating the use of high-performance structural materials for battery casings. Super duplex stainless steel (SDSS) is a structural material suitable for portable electronic products owing to its excellent strength and corrosion resistance. SDSS AISI2507 was used to construct a Li-ion battery casing, a Ag coating was applied via physical vapor deposition (PVD) after the heat treatment of AISI2507 with or without a secondary phase, and the coating thickness was controlled by varying the PVD time. The thickness of the Ag coating layer increased proportionally with time, thereby enhancing the electrical conductivity. The structure and coating behavior were confirmed using FE-SEM, XRD, and GDS. The secondary phase was crystallized by the segregation of the alloy and formed a BCC structure. The FCC lattice structure exhibited excellent coating behavior on the austenite (FCC structure) of AISI2507. Conversely, the secondary phase exhibited low adhesion owing to differences in composition and crystal structure. However, the Ag coating layer on AISI2507 exhibited excellent electrical conductivity, outperforming conventional Ni-plated Li-ion battery casings comprising AISI304. However, the precipitation of the secondary phase must be controlled, as the formation of the secondary phase acts as a factor that decreases electrical conductivity from 58.8 to 53.6 (ICAS) %. The excellent performance of Ag-coated AISI2507 makes it suitable for the fabrication of enhanced Li-ion battery casings.
1. Introduction
Recently, the demand for portable electronic devices and electric vehicles has significantly increased, leading to a surge in the annual demand for Li-ion batteries, which serve as energy storage media [1,2]. Owing to the high frequency of human interaction with these Li-ion batteries, enhancing safety in accordance with the demand for Li-ion batteries has become a crucial issue [3,4]. Among the various issues related to Li-ion batteries, thermal reactions are a significant concern because they are directly linked to user safety [5,6]. Various systems and catalysts are currently being investigated to minimize the hazard of thermal reactions. To improve battery safety, a system for monitoring battery temperature was developed [7,8]. A catalyst that absorbs heat has been developed to stabilize the battery temperature and thereby delay the occurrence of thermal reactions [9,10]. However, the efficient prevention of fire incidents resulting from battery heating remains a challenge. Although research on the materials used for battery cases is essential for enhancing battery safety, it is not commonly conducted.
Because Li-ion batteries exhibit differences in heat generation depending on the usage conditions, controlling heat generation is essential for battery safety [11,12]. However, explosions in portable electronic devices occur frequently, posing life-threatening risks, especially in the case of high-temperature heating, such as in cell phones and electric vehicles. A major safety issue known as thermal runaway occurs due to localized heat accumulation caused by the heat generation inside the battery outpacing the heat dissipation [13]. The battery temperature can increase to a maximum of 700 °C. Consequently, the material for battery cases has been changed from aluminum, which has a low melting point (670 °C), to stainless steel (AISI304, 1400 °C), resulting in enhanced battery safety during high-temperature heating [14,15]. Therefore, a viable approach for enhancing battery safety is by improving the battery case materials.
Stainless steel is classified based on its principal constituent phase into the austenite, ferrite, martensite, or duplex series. Among the stainless steels used for battery cases, AISI304, which belongs to the austenite series, is the most popular [16,17]. Austenite stainless steels display excellent corrosion resistance but are susceptible to sensitization due to insufficient high-temperature strength (170 MPa at 700 °C); furthermore, they undergo stress-induced transformation to martensite [18,19]. On the other hand, the ferrite and martensite series exhibit low corrosion resistance but are highly robust and display excellent high-temperature strength. The duplex series exhibits both excellent corrosion resistance and high-temperature strength (330 MPa at 700 °C) but presents challenges for process control [20,21]. The performance differences among the various types of stainless steel used should be distinguished according to the intended application. Therefore, to ensure stability at temperatures as high as 700 °C in Li-ion battery thermal reactions, materials that exhibit high strength and corrosion resistance at room temperature, as well as at high-temperature conditions, should be used.
Duplex stainless steel, consisting of austenite and ferrite, exhibits superior strength, corrosion resistance, and high-temperature strength. The excellent mechanical and electrochemical properties of duplex stainless steel are beneficial for battery safety during thermal reactions. Duplex stainless steel is graded according to its pitting resistance equivalent number (PREN). Super-duplex stainless steel (SDSS) (PREN, 40–50) exhibits excellent strength (780 MPa at room temperature), corrosion resistance (up to 50 years in seawater), and high-temperature strength, making it a suitable material for improving the safety of Li-ion batteries [19,22]. Among super duplex stainless steels, AISI2507, which has a chemical composition of 25 wt.% Cr and 7 wt.% Ni, shows a PREN of 42. Originally developed for marine plant materials, the application of AISI2507 in various other fields is being studied to exploit its outstanding characteristics [23,24]. Nillson investigated the volume fraction and corrosion resistance of SDSS under various heat treatment conditions, and Fande examined its microstructural characteristics after welding [20,21]. However, although numerous studies have been conducted on this topic, research on the plating behavior depending on the presence of secondary phases is lacking.
AISI304, which is utilized for constructing Li-ion battery cases, exhibits low electrical conductivity; therefore, to impart electrical conductivity, Ni plating has been employed [25,26]. However, owing to the stress induced by AISI304 processing, Ni plating does not result in favorable characteristics. Wang and Lee Ni studied the properties of Ni-plated AISI304 [27,28]. Although various characteristics of AISI304 have been extensively investigated, research on the Ag coating and processing of AISI2507 is scarce. Hence, AISI2507 processing and coating should be studied to evaluate its applicability as a material for Li-ion battery cases.
Among the various plating metals, Ni displays superior electrical conductivity (IACS, 23.8%) compared to iron (IACS, 1.8%); however, plating with other metals can promote thickness reduction and performance enhancement [29]. For example, coating with Ag (IACS, 105.0) instead of Ni can lead to reduced thickness and enhanced electrical conductivity. However, being a precious metal, Ag is expensive; therefore, it should be developed under conditions that are conducive to recycling. The minimal degradation of AISI2507 originating from its excellent strength and corrosion resistance render it recyclable. Ag is easily separable from stainless steel due to its high potential, which means that Ag can be easily recovered. The use of SDSS and Ag not only provides excellent performance but also facilitates recycling, thereby reducing the energy consumed in metal production. However, there have been no reported cases of Ag-coated AISI2507.
To manufacture Li-ion cases with improved safety, replacing AISI304 with AISI2507 and coating with Ag instead of Ni is proposed. This study analyzed the impact of secondary phases on the Ag coating and the electrochemical behavior of AISI 2507 after Ag coating via physical vapor deposition (PVD), considering the presence and absence of secondary phases. The formation behavior of the Ag coating layer was analyzed using field-emission scanning electron microscopy (FE-SEM), electron backscatter diffraction (EBSD), atomic force microscopy (AFM), X-ray diffraction (XRD), and glow discharge spectroscopy (GDS). The electrochemical behavior resulting from the Ag coating layer was analyzed using open-circuit potential (OCP) measurements and electrochemical impedance spectroscopy (EIS).
2. Materials and Methods
2.1. Materials
The materials used in this study were cast in an electric furnace, and their chemical compositions are listed in Table 1; the compositions were analyzed using inductively coupled plasma mass spectrometry (ICP-MS, Thermo Fisher Scientific, Waltham, MA, USA) [20,30]. The primary alloying elements were 25.2 wt.% Cr and 6.8 wt.% Ni. In stainless steel, elements such as Cr, Mo, and N are critical for enhancing the corrosion resistance. The PREN was calculated according to Equation (1). Based on the PREN of AISI 2507 (42), it is classified as a super duplex stainless steel [31,32].
Pitting resistance equivalent number, PREN = wt.% Cr + 3.3 wt.% Mo + 16 wt.% N

Table 1.
Chemical composition of casted super duplex stainless steel AISI2507 by ICP-MS.
Stainless steel enhances its corrosion resistance by forming a passivation layer on its surface, which consists of a Cr oxide layer (Cr2O3). Cr is a key alloying element in stainless steels because of its role in forming a passivation layer, which significantly enhances corrosion resistance. Because of its large lattice size, Mo increases the effectiveness of Cr, thereby contributing to the reinforcement of the passivation layer. As an interstitial element, N penetrates the lattice and further strengthens the passivation layer due to the increase in the Cr concentration on the surface. Also, N helps the passivation layer to form more uniformly and with fewer defects.
2.2. Heat Treatment
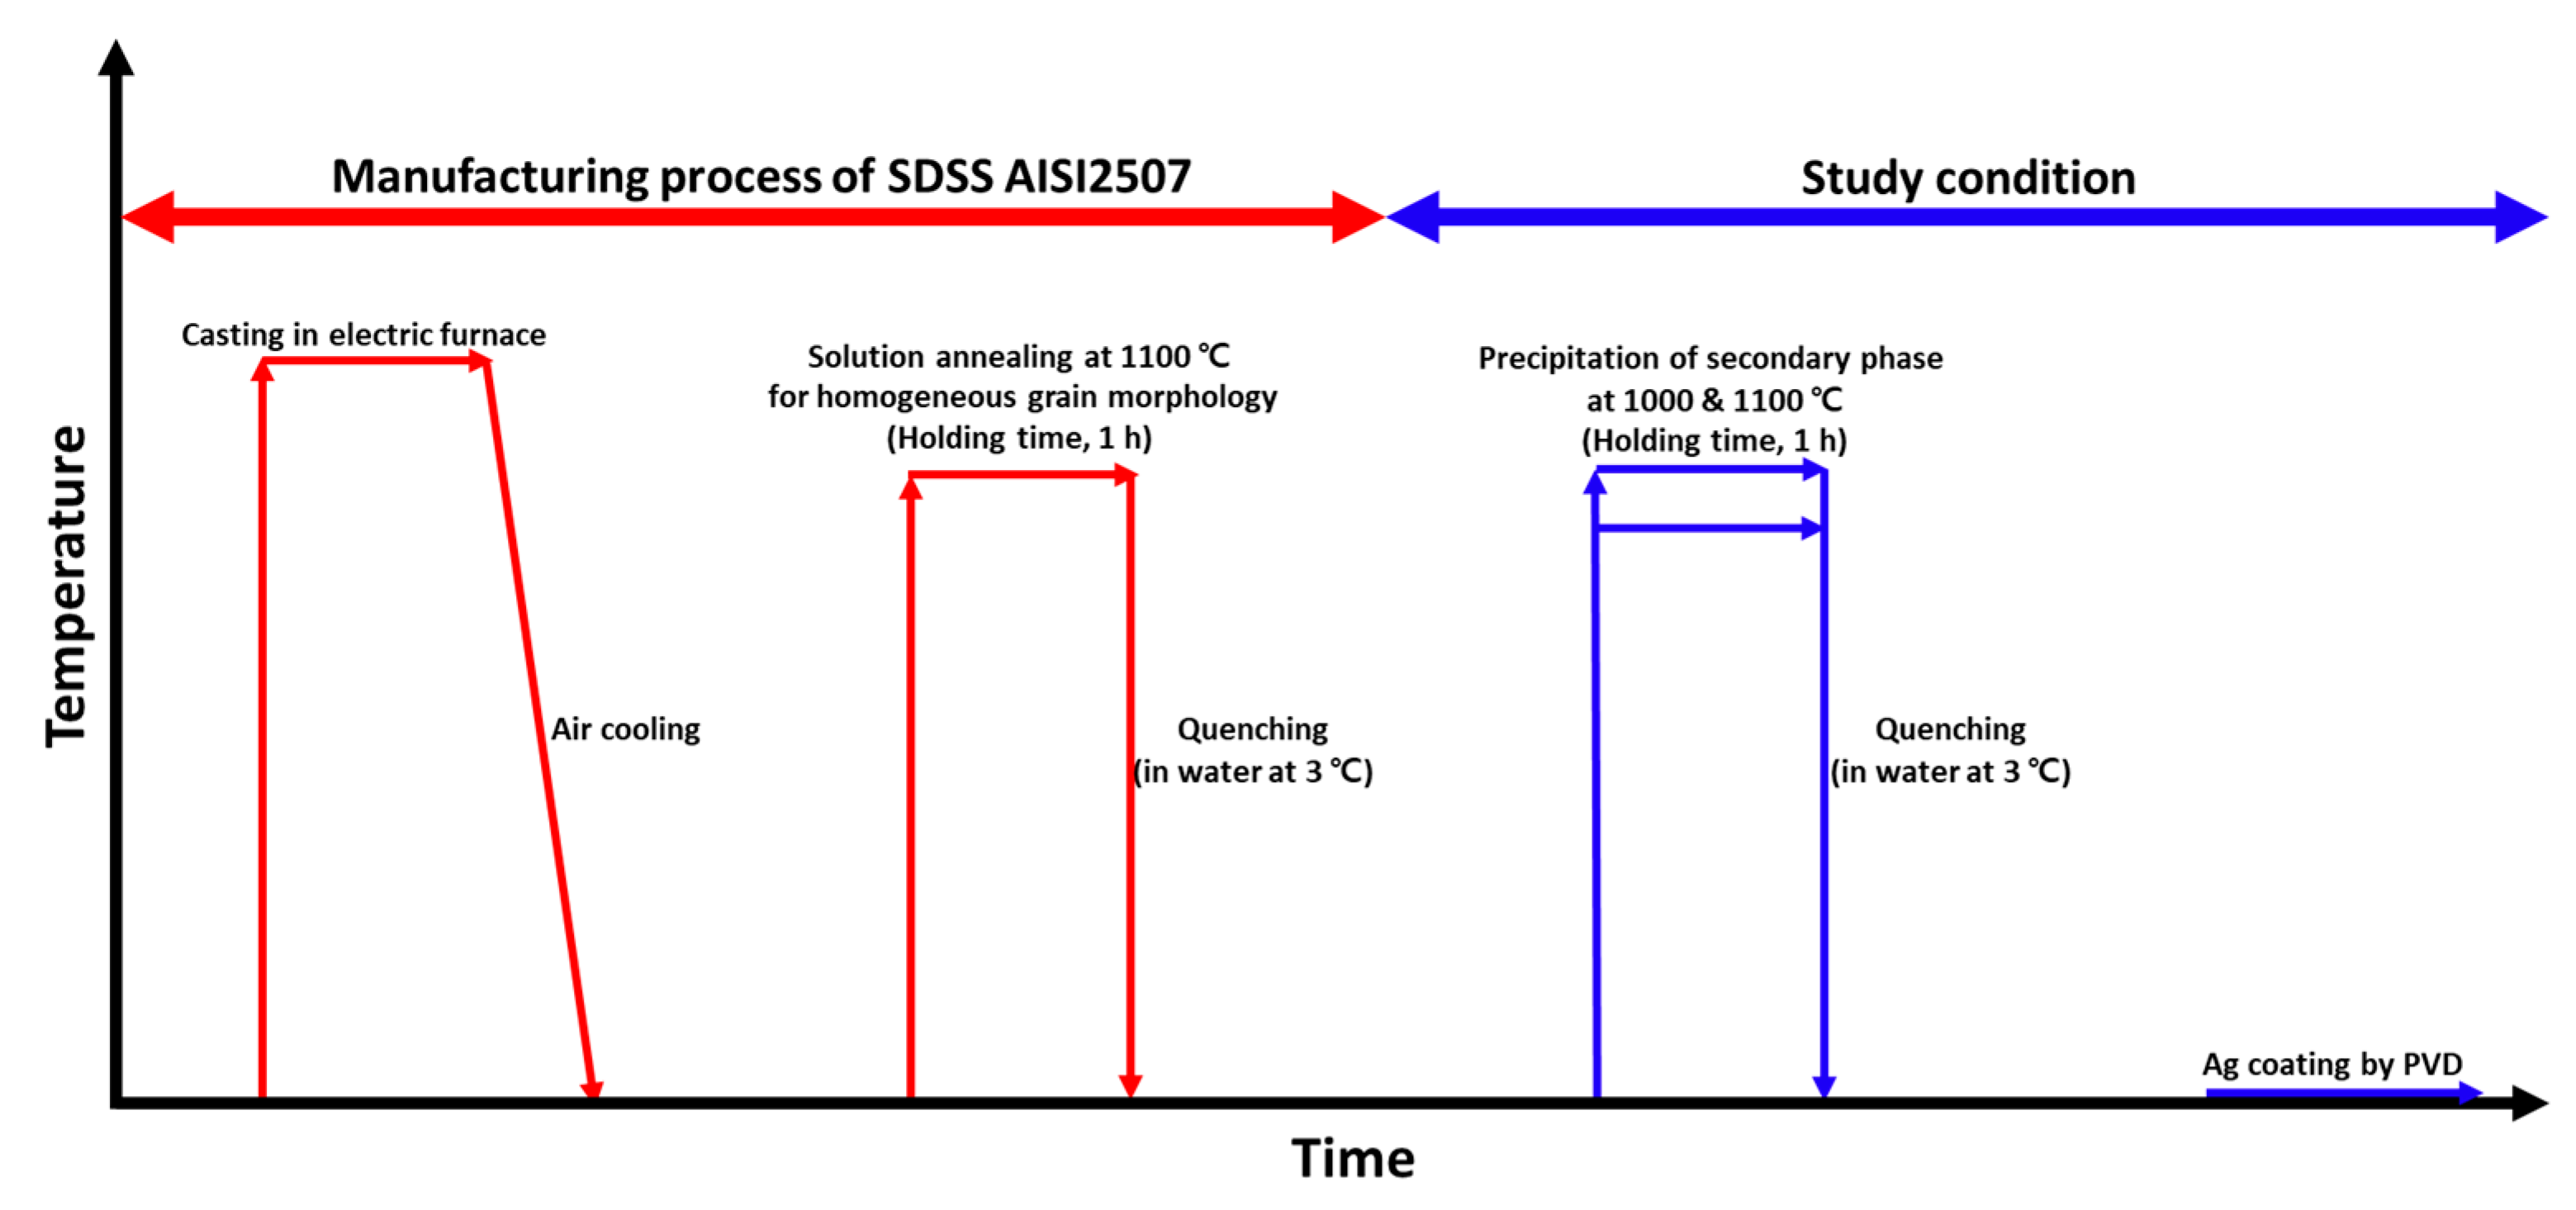
The electric furnace cast materials underwent heat treatment to precipitate secondary phases, as illustrated in Figure 1. Solution heat treatment was applied because of the heterogeneous nature of the as-cast microstructure [33,34]. This treatment was performed at 1100 °C to establish a stable microstructure. Subsequently, heat treatment was carried out at 1000 °C to precipitate the secondary phases. AISI 2507 precipitated secondary phases at 1000 °C, and after the precipitation of these phases, the Ag coating behavior was analyzed.
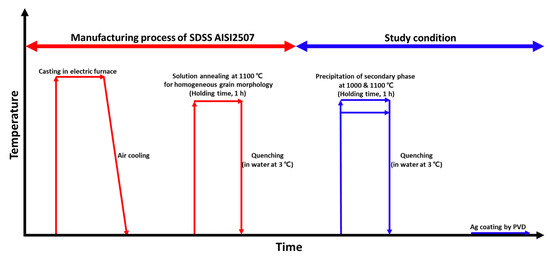
Figure 1.
Schematic diagram of the heat treatment conditions applied to super duplex stainless steel (SDSS) AISI2057 to study the effects of secondary phases on the Ag coating via physical vapor deposition (PVD).
After heat treatment, the microstructure was examined using FE-SEM (SUPRA 40VP system, Zeiss, Oberkochen, Germany) and EBSD (SUPRA 40VP system, Zeiss, Oberkochen, Germany). Precipitation and phase changes were analyzed using XRD (D8 VENTURE, Stanford, CA, USA). Changes in the phase fraction resulting from the heat treatment conditions were quantified by performing ASTM E 1245 on the FE-SEM images at 200× magnification, repeated seven times, and the average value was reported [21]. Surface characteristics with respect to coating duration were analyzed using FE-SEM and XRD.
2.3. Ag Coating
To enhance the electrical conductivity, SDSS AISI2507 was coated with Ag via PVD (Laon Tech, Anseong-si, Republic of Korea). The coating conditions are presented in Table 2. An electric current of 80 A was used to vaporize Ag, and the coating duration was 20 min [35,36].
Table 2.
Physical vapor deposition conditions for Ag coating of super duplex stainless steel AISI2507 for advanced Li-ion battery case.
The effects of Ag coating on SDSS were analyzed using FE-SEM, XRD, and GDS (Horiba Jobin Yvon, JY-10000 RF, Edouard Belin, France). FE-SEM was used to observe changes in the surface conditions under distinct Ag coating conditions. XRD was employed to analyze the phase changes on the surface arising from the varied Ag coating conditions. XRD analyses were performed over an area of 1 cm2, scanning from 20° to 80° with a step size of 0.5°/s [37,38]. AFM (Park system, Suwon, Republic of Korea) measurements were conducted over 500 μm, and the average maximum value and average value were determined. Five locations were analyzed, and the average was confirmed. The thickness of the coating layer was measured using GDS. For an in-depth analysis of the Ag coating layer, Cr, Ag, and Fe elements were analyzed using GDS, with measurements ranging from 1 to 2000 nm.
2.4. Electrochemical Behavior
The electrochemical behavior was analyzed using OCP measurements and EIS. A potentiostat (Versa State 4.0, AMETECK, Inc., Berwyn, PA, USA) and a three-electrode cell setup were utilized. The three-electrode cell consisted of a working electrode (WE) with a surface area of 1 cm2, a counter electrode (CE) comprising Pt mesh (20 × 20 mm), and a saturated calomel electrode (SCE) as the reference electrode (RE) in KCl electrolyte solution; 3.5 wt.% NaCl was used as the electrolyte for analysis, following ASTM G 61 standards [39,40].
OCP measurements monitor voltage changes over time to assess variations in the alloy or surface conditions [39,41]. These potential changes, which occur at a temperature at which hydrogen and oxygen react in the electrolyte solution, allow the observation of reactions on the metal surface, thereby being indicative of the influence of the Ag coating layer in this study. The measurement time was 3600 s and the step rate was 1 point/s.
EIS measures the changes in resistance with frequency variation, enabling the determination of variations in surface layers and thickness [39]. To measure the resistance of the coating and passivation layers, the frequency was varied from 10−2 to 106 Hz. The frequency measured changes in resistance and angle depending on the wavelength.
3. Results
3.1. Effect of Heat Treatment on Microstructure
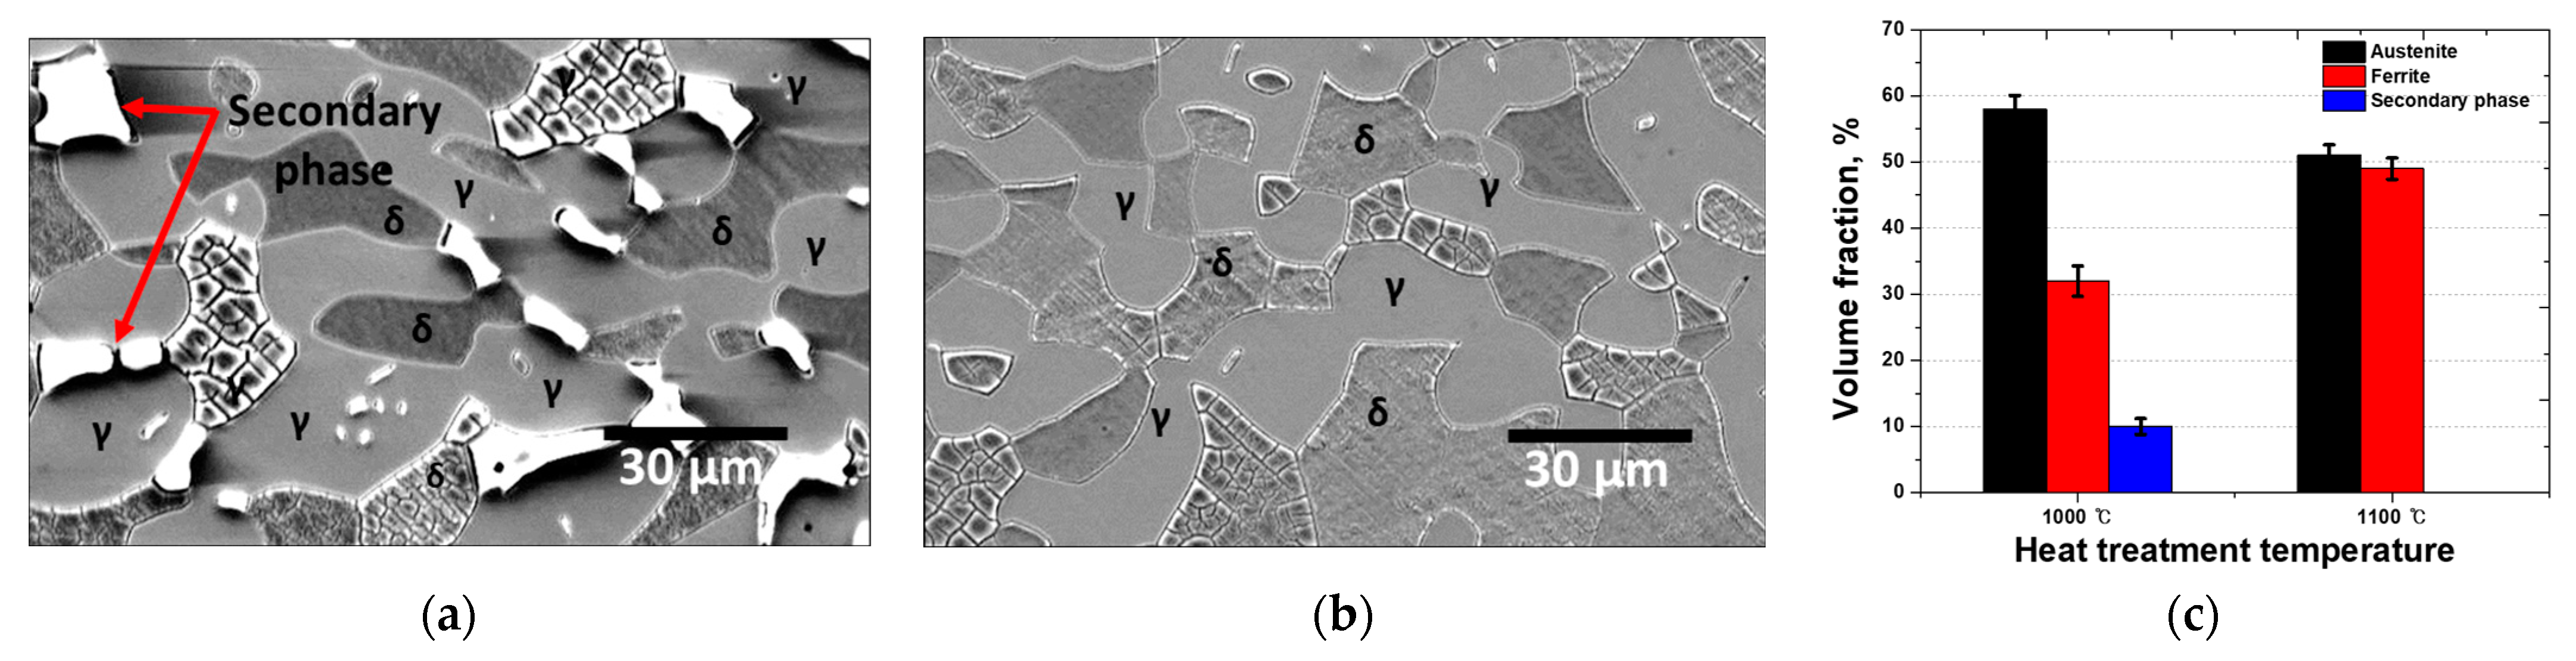
The microstructure of SDSS differed according to the heat treatment temperature, whereby the volume fractions of ferrite and austenite and the crystallization of secondary phases were affected [42,43]. To analyze the effect of these secondary phases on the performance of the Ag coatings on AISI2507, microstructural analysis was performed using FE-SEM and EBSD, and the results are shown in Figure 2 [24,44]. Austenite (γ) appears as bright-gray islands, whereas ferrite (δ) appears as a dark-gray matrix. Solution heat treatment at 1100 °C resulted in equal fractions of austenite and ferrite, whereas heat treatment at 1000 °C led to the precipitation of secondary phases [45,46]. These secondary phases, constituting 10% of the microstructure, are identified as bright white phases along the austenite grain boundaries.
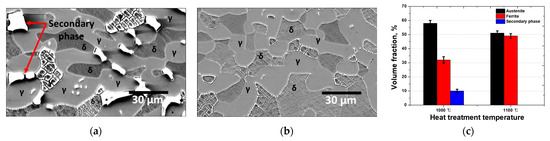
Figure 2.
Microstructure images of SDSS AISI2507 after heat treatment at (a) 1000 °C and (b) 1100 °C; and (c) volume fractions of AISI2507 after heat treatment at 1000 and 1100 °C.
The changes in the volume fractions after heat treatment indicate the locations of secondary-phase crystallization. After heat treatment at 1000 °C, the volume fraction of austenite increased by 8%, whereas that of ferrite decreased by 18% [20,47]. During this phase transformation, the volume fractions of secondary phases increased by 10% [48,49]. Austenite growth induced the precipitation of secondary phases along the grain boundaries, indicating that the transformation from ferrite to austenite was the driving force behind the crystallization and growth of the secondary phase.
Heat treatment at 1000 °C resulted in the coarsening of austenite, an increase in its fraction, a decrease in the volume fraction of ferrite, and an increase in the precipitation and fraction of secondary phases. Specifically, the 1000 °C heat treatment led to the coarsening of austenite and subsequent precipitation of secondary phases, accompanied by a reduction in the ferrite fraction.
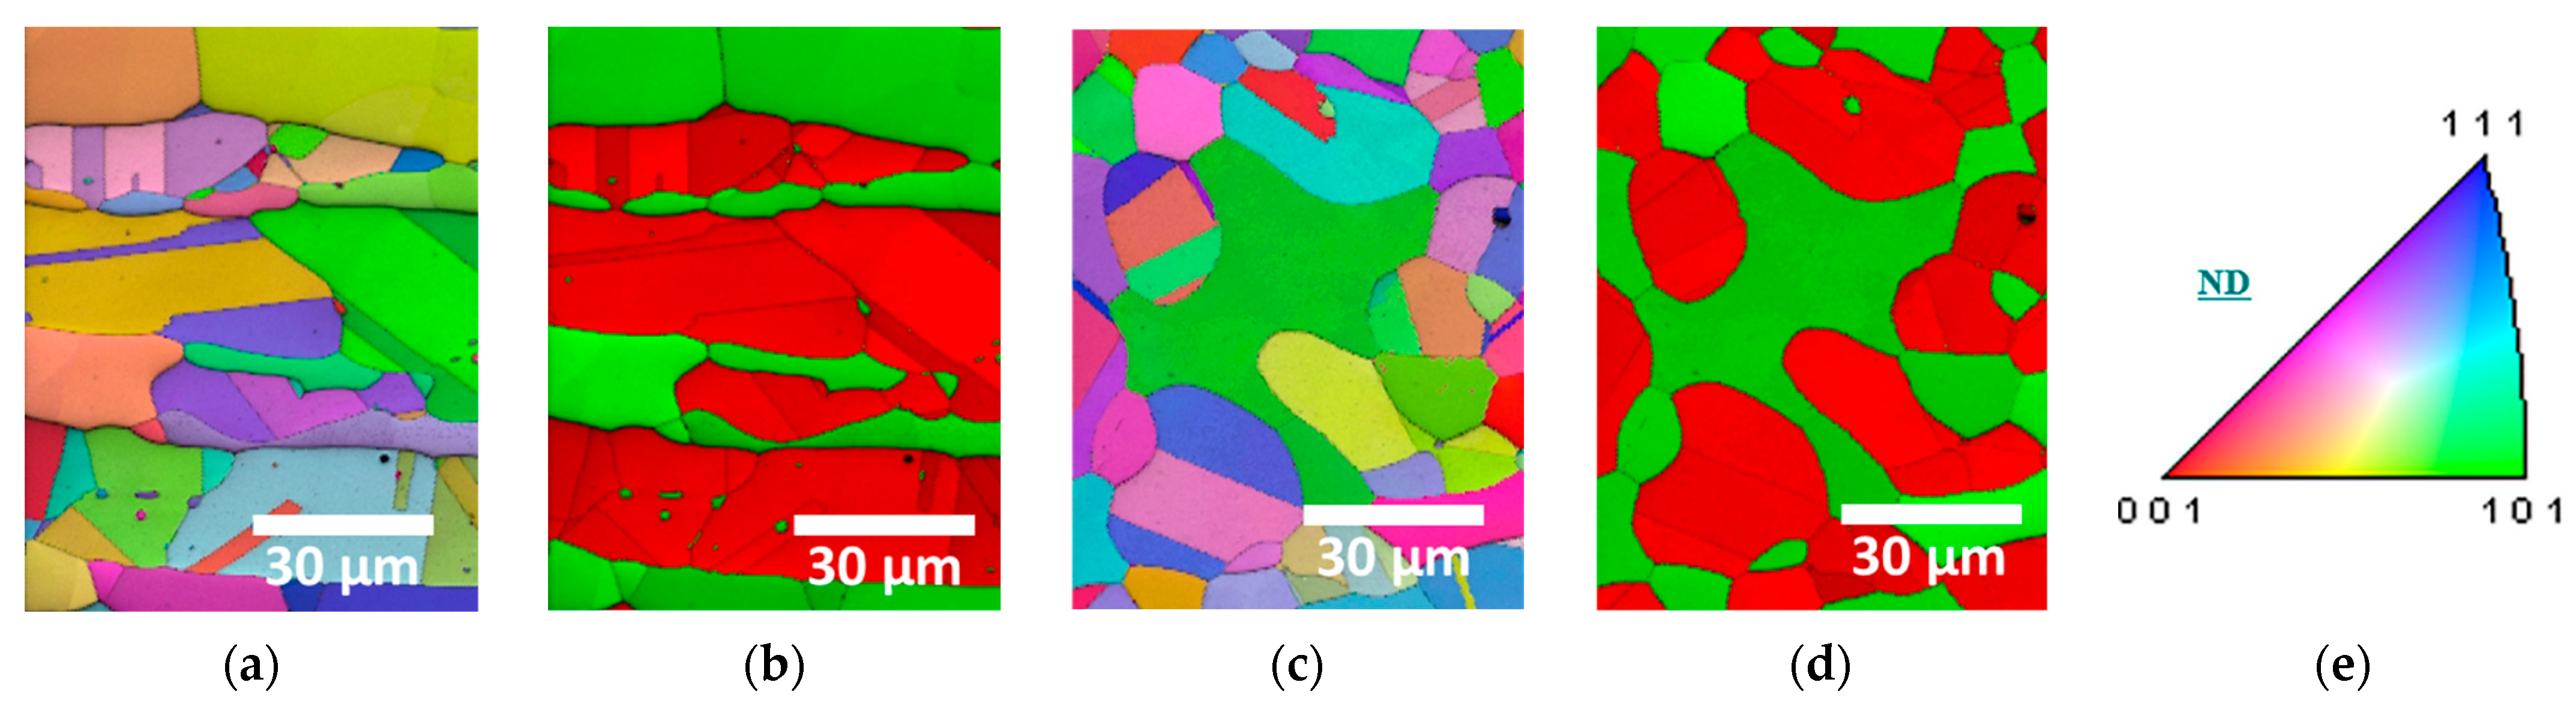
To distinguish the crystallization and morphology of the secondary phases formed at the two heat-treatment temperatures, EBSD analysis was conducted, as shown in Figure 3 [30,50]. In the EBSD Phase-IQ maps, austenite and the secondary phase are red, whereas ferrite and the secondary phase are green. Solution treatment homogenized the austenite morphology, whereas secondary-phase precipitation disrupted this uniformity, causing growth along the austenite boundaries to a fine size of <10 μm. The coarse austenite grains contained fine ferrite (<10 μm), which grew between the austenite grains.
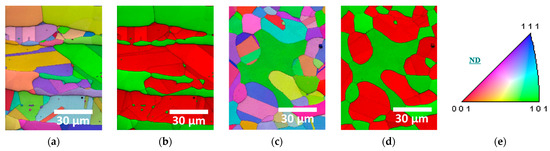
Figure 3.
EBSD images of SDSS AISI2507 after heat treatment at 1000 °C and 1100 °C: (a) IPF-IQ map at 1000 °C, (b) Phase-IQ map at 1000 °C, (c) IPF-IQ map at 1100 °C, (d) Phase-IQ map at 1100 °C, and (e) stereo-graphic triangle of IPF color map.
Austenite and ferrite exhibited similar crystallographic orientations, and the internal crystallographic orientation in coarse austenite containing fine ferrite varied [50,51]. Consequently, the orientation of the austenite and ferrite combination was influenced by the grain size of ferrite, and austenite grew in similar directions ((111) or (101)) due to its transformation from ferrite. However, the secondary-phase growth deviated from these orientations, crystallizing along the austenite grain boundaries. Secondary phases did not have a specific morphology but exhibited an irregular, elongated morphology.
A quantitative analysis of the grain size with and without secondary-phase precipitation was performed, and the results are presented in Figure 4. Secondary phases with a BCC and FCC structure formed fine grains (<10 μm, #a on the IPF-IQ map). After secondary-phase crystallization, the grain sizes of austenite and ferrite ranged from 20 to 40 μm (#b). After solution heat treatment, austenite grain sizes were in the range of 20–40 μm (#c) and ferrite grains were from 40 μm (#d). The heat treatment temperature influenced the crystallization of the secondary phases and the grain size.
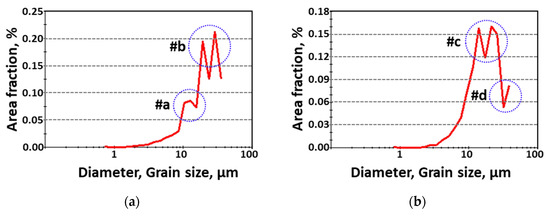
Figure 4.
Grain diameter (μm) and area fraction (%) curve showing the grain size (a) with and (b) without the secondary phase after heat treatment of SDSS AISI2507.
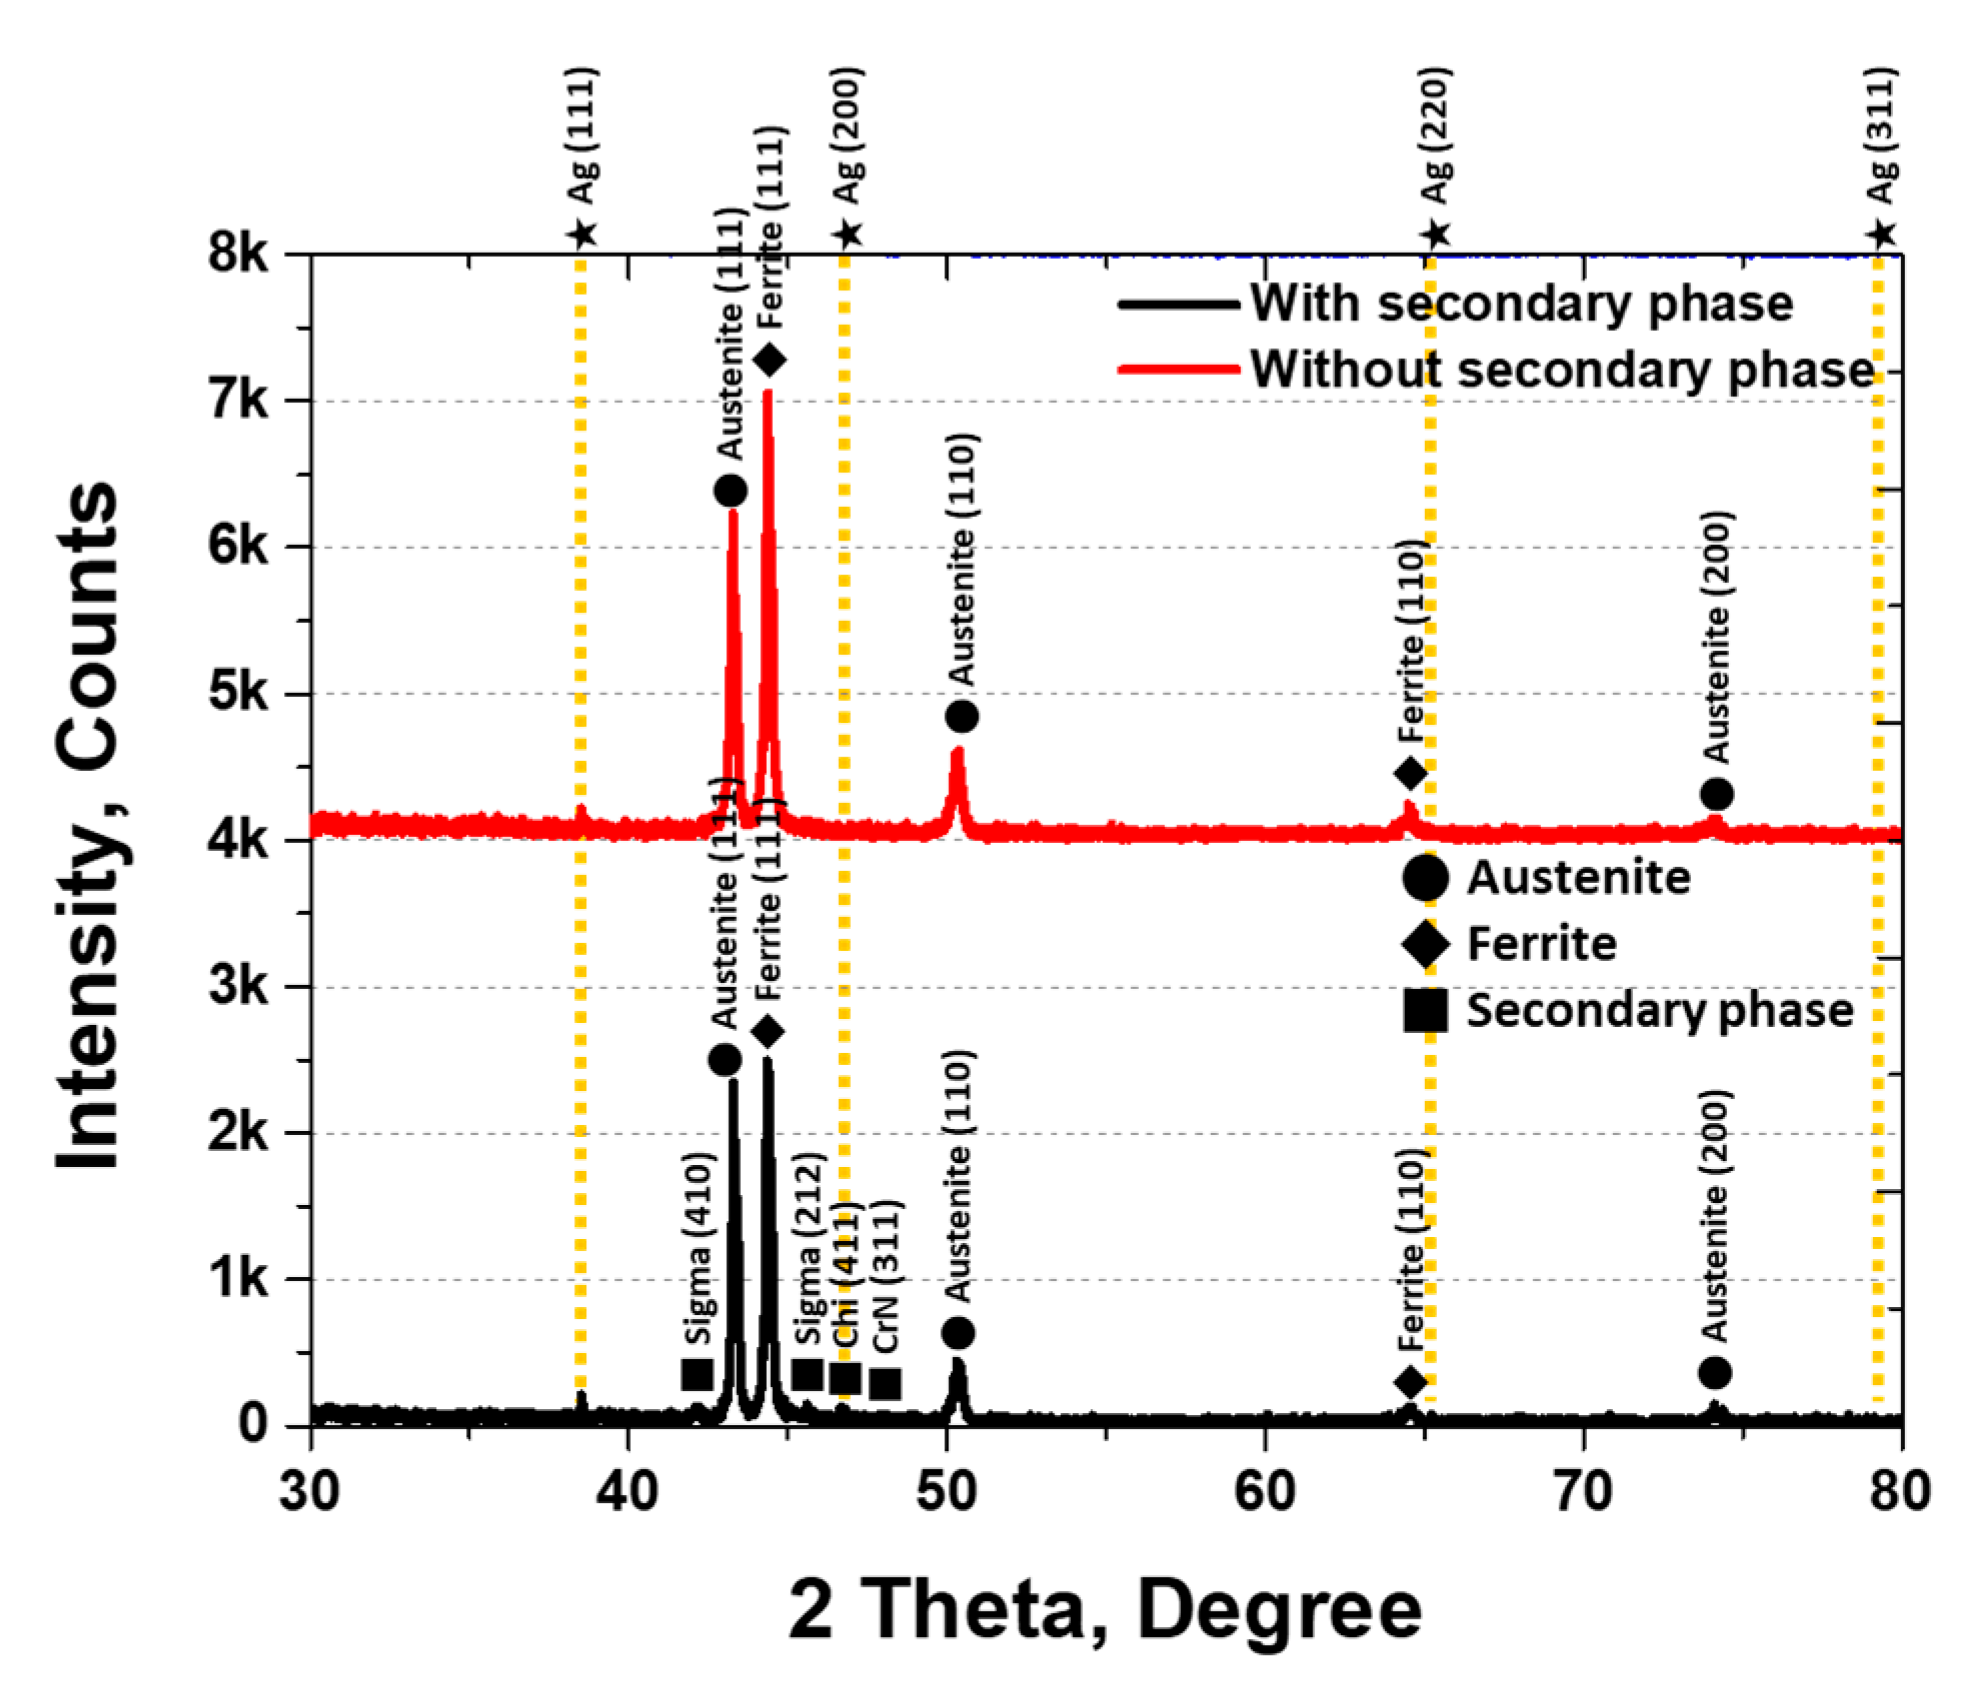
XRD analysis was conducted to identify the secondary phases, and the results are shown in Figure 5. The secondary phases were identified as sigma (σ), chi (χ), and CrN. The σ phase appeared at 42° (410) and 46° (212), χ at 47° (411), and CrN at 48° (311). The three secondary phases were observed at 1000 °C, with austenite peaks at 43° (111), 50° (110), and 74° (200) [30,45]. The XRD intensities varied with the presence of secondary phases, being higher for austenite at (111) and (110) and ferrite at (111) under solution heat treatment conditions.
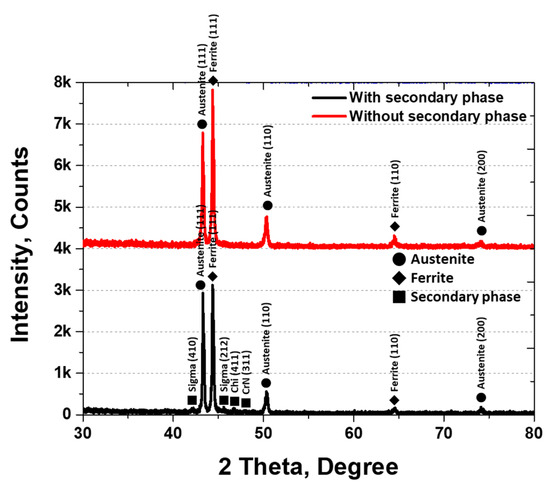
Figure 5.
Plot of X-ray diffraction (XRD) intensity (counts) at 2θ (degrees) showing the XRD pattern of AISI2507 with or without the secondary phase.
The secondary phases grew along the grain boundaries of austenite and into ferrite, thereby reducing the volume fraction of ferrite. Crystallization of the secondary phases was initiated by the segregation of Cr and Mo during austenite growth. The lower Cr and Mo contents in the austenite promoted secondary-phase precipitation at the austenite grain boundaries. The fine, elongated secondary phases (10 ± 4 μm) exhibited a BCC and FCC structure and were composed of σ, χ, and CrN phases, consistent with the literature. σ precipitated at 43.2° (410), χ at 45.4° (212), and CrN grew in both the (411) and (311) directions.
In conclusion, AISI2507 formed uniform austenite after solution treatment. At 1000 °C, three secondary phases, namely σ, χ, and CrN, precipitated along the grain boundaries of austenite as fine grains (<10 μm), increasing their volume fraction by up to 10%.
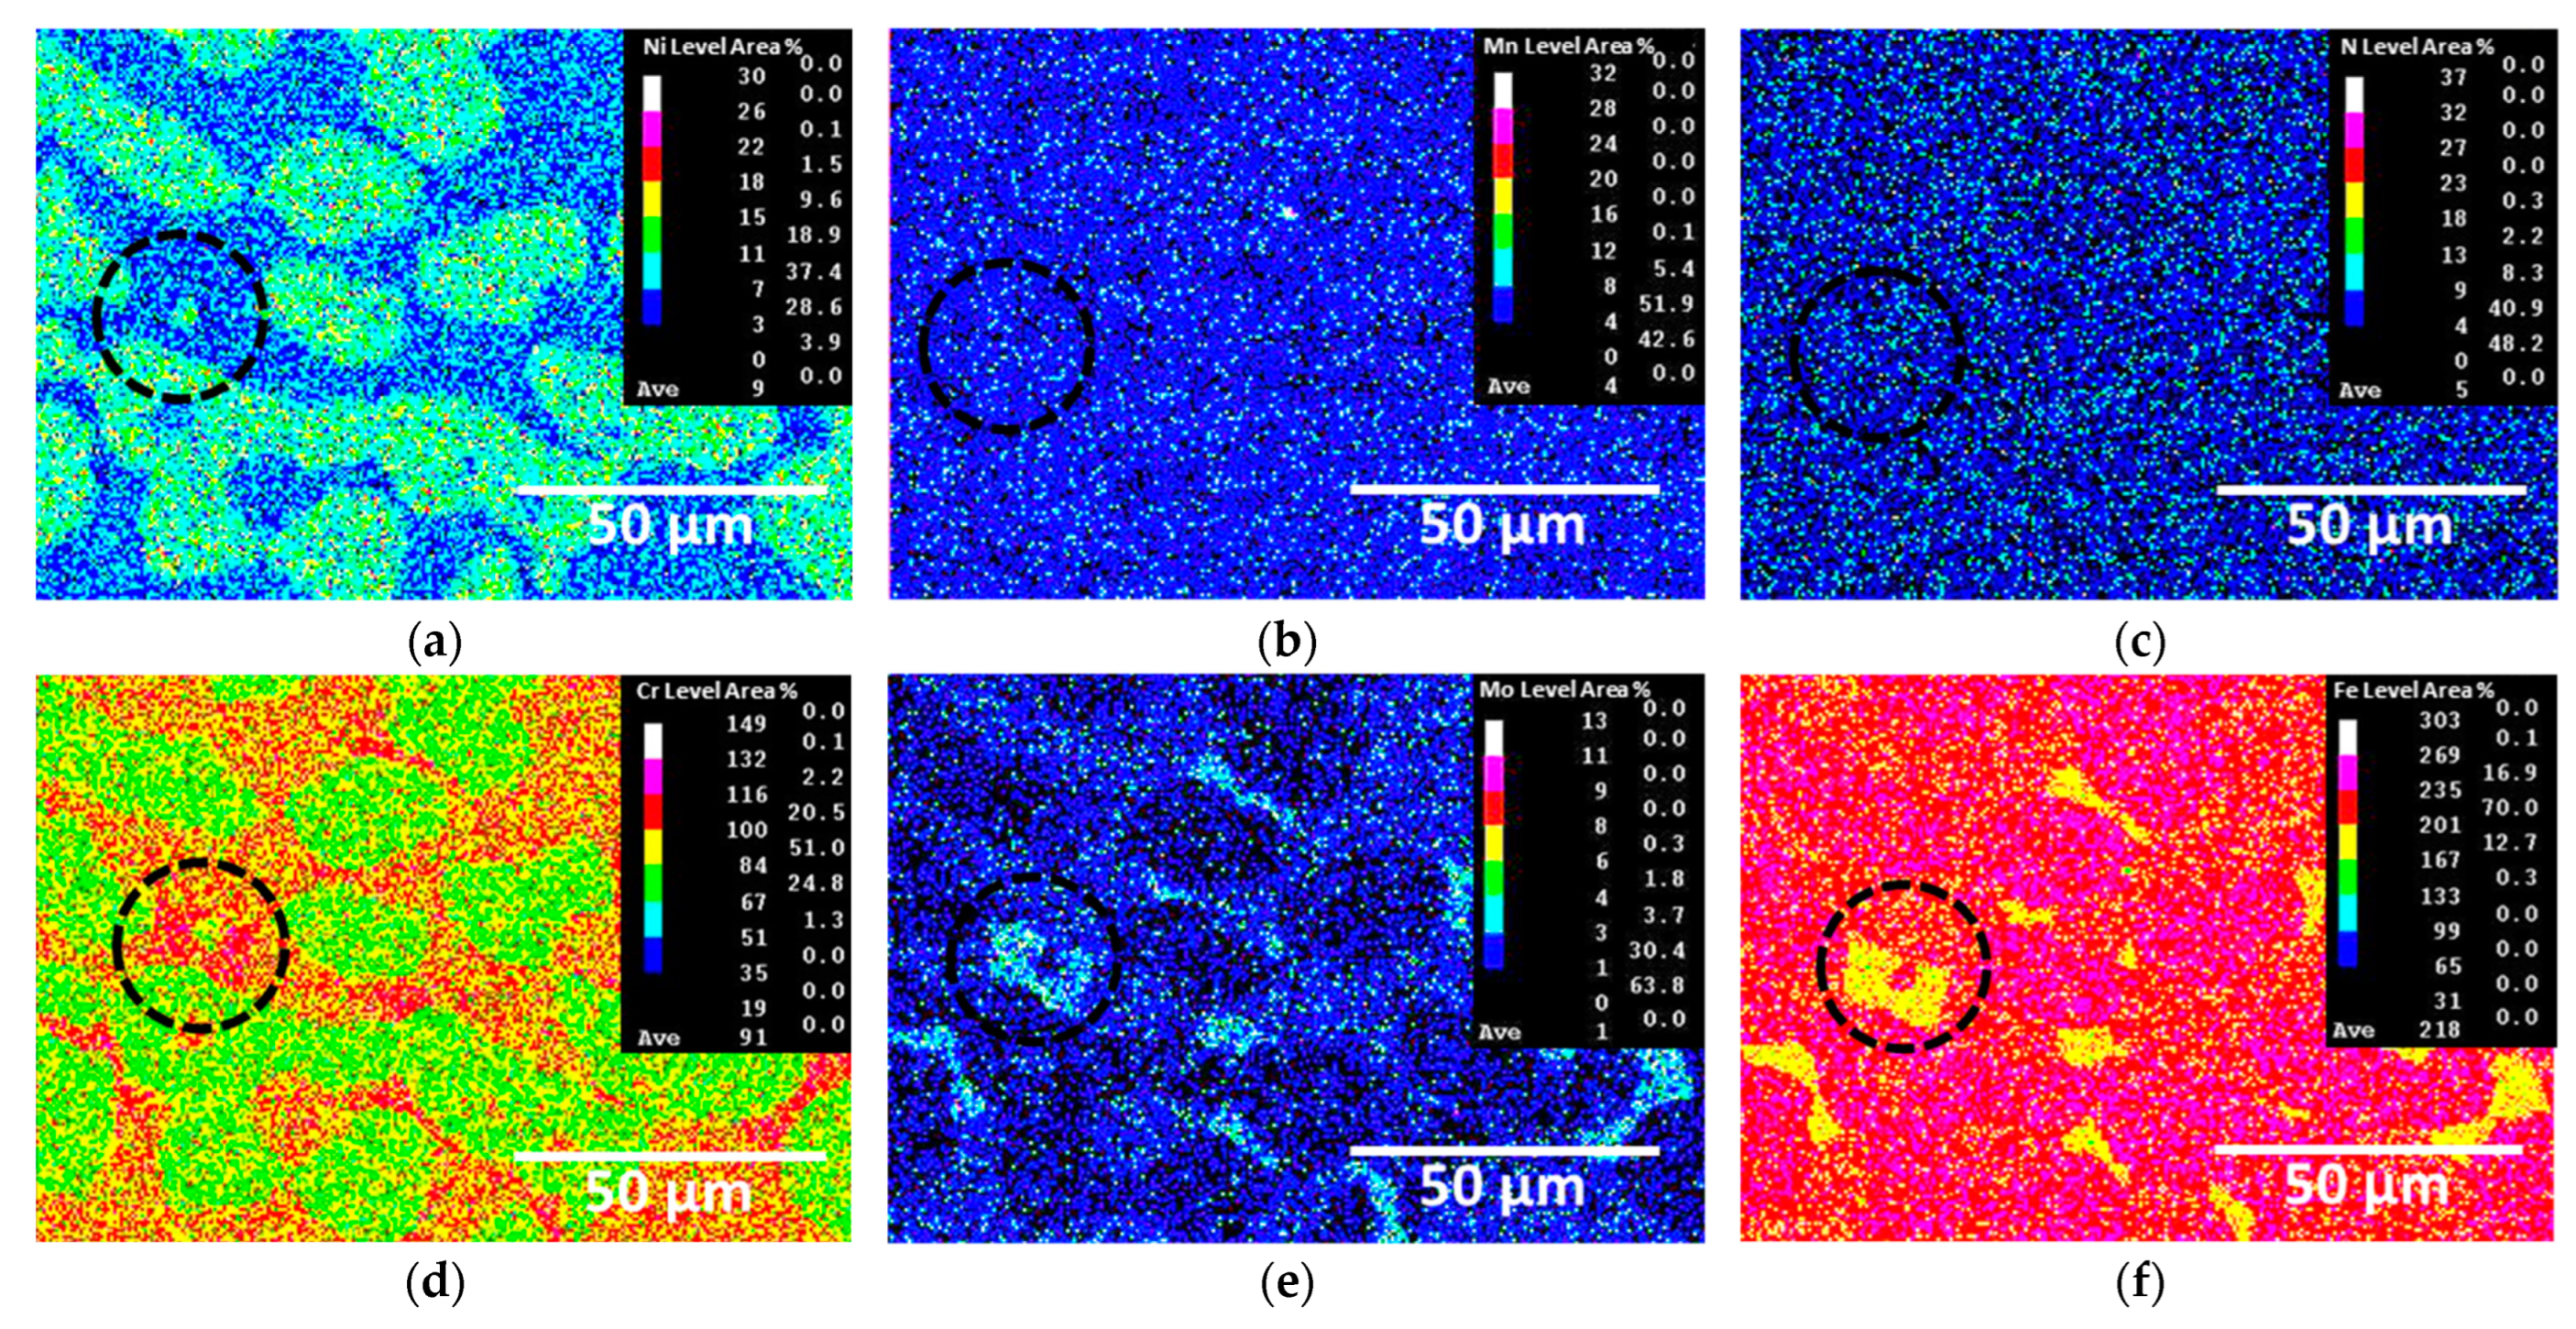
The secondary phases crystallized and grew during austenite formation. The compositions of the crystallized secondary phases were analyzed using EDS and EPMA, as shown in Figure 6 and Table 3, respectively. The crystallized secondary phases exhibited high concentrations of Cr and Mo, whereas Fe was present in lower concentrations. Specifically, the σ phase contained 37.2 wt.% Cr and 8.9 wt.% Mo, indicating that it precipitated owing to the saturation of Cr and Mo. The depletion of Cr and Mo around the σ phase led to the precipitation of the χ phase, which had lower concentrations of Cr and Mo. CrN formed from nitrogen, which was not incorporated into the other two secondary phases. These secondary phases were formed by the segregation of Cr and Mo, which in turn affected the Ag coating and electrical conductivity.
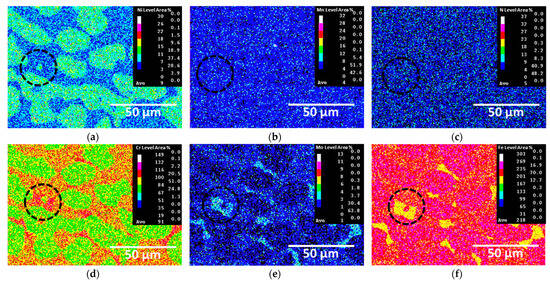
Figure 6.
EPMA maps after crystallization of secondary phases on SDSS AISI2507: (a) Ni, (b) Mn, (c) N, (d) Cr, (e) Mo, (f) Fe (black circle: secondary phase).
Table 3.
Chemical compositions of the secondary phases formed on super duplex stainless steel AISI2507 determined using EDS.
3.2. Effect of Ag Coating
The targeted thickness of the Ag coating layer was 1 μm. Prior to Ag coating, the surface was polished with sandpaper (up to #2000 grit); images of AISI2507 before and after coating are shown in Figure 7. The surface polishing marks were significantly reduced after Ag coating, indicating a decrease in the surface roughness.
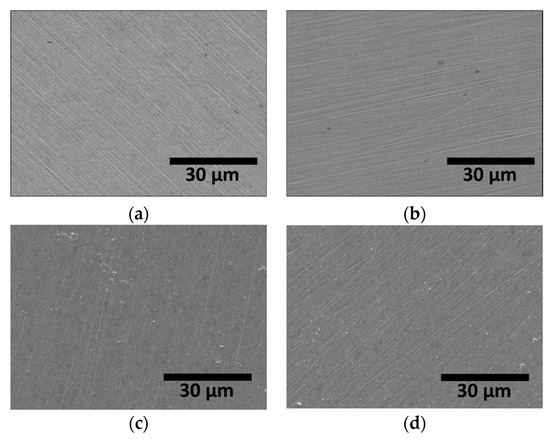
Figure 7.
FE-SEM images on surface of SDSS AISI2507 (a) with secondary phase, (b) without secondary phase, (c) (a) + Ag coating, and (d) (b) + Ag coating.
The coating material filled the surface irregularities, thereby reducing the surface roughness. The PVD-applied Ag coating effectively decreased the surface roughness, as shown in Figure 8 and Table 4 [38,52]. Five repeat AFM measurements were taken over a 500 μm distance and the average values are reported. After solution heat treatment, the surface roughness was 0.10 μm, increasing to 0.15 μm after the precipitation of secondary phases. The presence of secondary phases increased the surface roughness. However, following Ag coating, the surface roughness decreased to 0.05 μm, irrespective of the presence of secondary phases. Thus, the Ag coating effectively reduced surface roughness, consequently affecting the electrical properties of the surface.
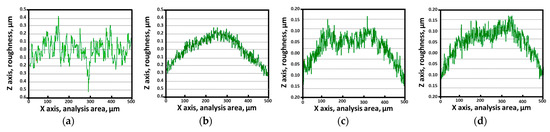
Figure 8.
AFM results before and after PVD of Ag coating on SDSS AISI2507 with or without secondary phase: (a) with secondary phase before Ag coating, (b) with secondary phase before Ag coating, (c) without secondary phase after Ag coating, (d) without secondary phase after Ag coating.
Table 4.
Surface roughness of SDSS AISI2057 before and after Ag coating with or without the secondary phase determined using AFM.
Ag exhibits superior electrical conductivity compared with steel, which was confirmed for the Ag coating. The results of the electrical conductivity measurements (Table 5), conducted using a four-point probe, show that the electrical conductivity of Ag was 8.4% higher than that of Cu. The following equations were used to calculate electrical conductivity and ICAS based on the resistivity of Ag:
Electrical conductivity, S/m = 1/Electrical resistivity of specimen
Electrical conductivity (IACS), % = (Electrical conductivity of specimen/Electrical conductivity of Cu) × 100%
Table 5.
Electroconductivity of SDSS AISI2507 before and after Ag coating with or without the secondary phase.
After Ag coating with or without a secondary phase, the electrical conductivity increased from 1.8% and 1.9% to 53.6% and 58.8%, respectively. This enhancement was attributed to the Ag coating layer. By coating AISI2507 with 1 μm Ag, electrical conductivity superior to that of pure Ni could be achieved for battery case materials. The electrical conductivity of AISI2507 was influenced by both the coating layer and the substrate. The precipitation of the secondary phases reduced the electrical conductivity from 58.8% to 53.6%. This occurred owing to alloy segregation and increased grain boundaries. The surface roughness also reduced the electrical conductivity by hindering electron movement. Therefore, controlling the surface roughness can improve electrical conductivity as a result of reduced electrical resistance.
XRD analysis confirmed the effects of the coating layer based on measurements taken from 30° to 80°, as shown in Figure 9. The XRD patterns exhibited Ag peaks at 39.6°, 44.9°, 65.2°, and 78.3° [53,54]. The primary growth direction of Ag (111) was aligned with the main FCC growth direction, showing the highest intensity. Because of the thinness of the Ag coating, the intensities of the Ag peaks of (111) were below 200 counts. The Ag coating grew preferentially along the (111) direction, demonstrating its excellent coating capability.
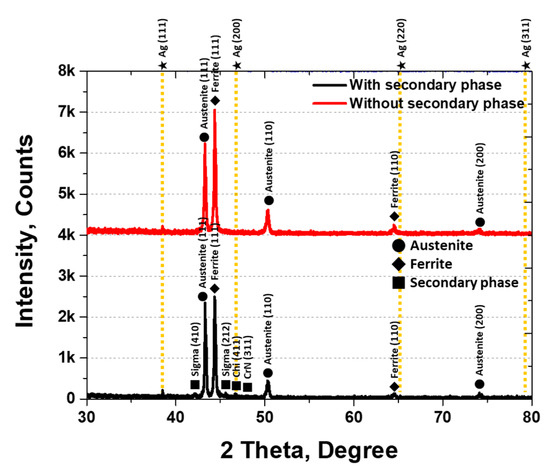
Figure 9.
XRD pattern of Ag coating after crystallization of secondary phase on SDSS AISI2507.
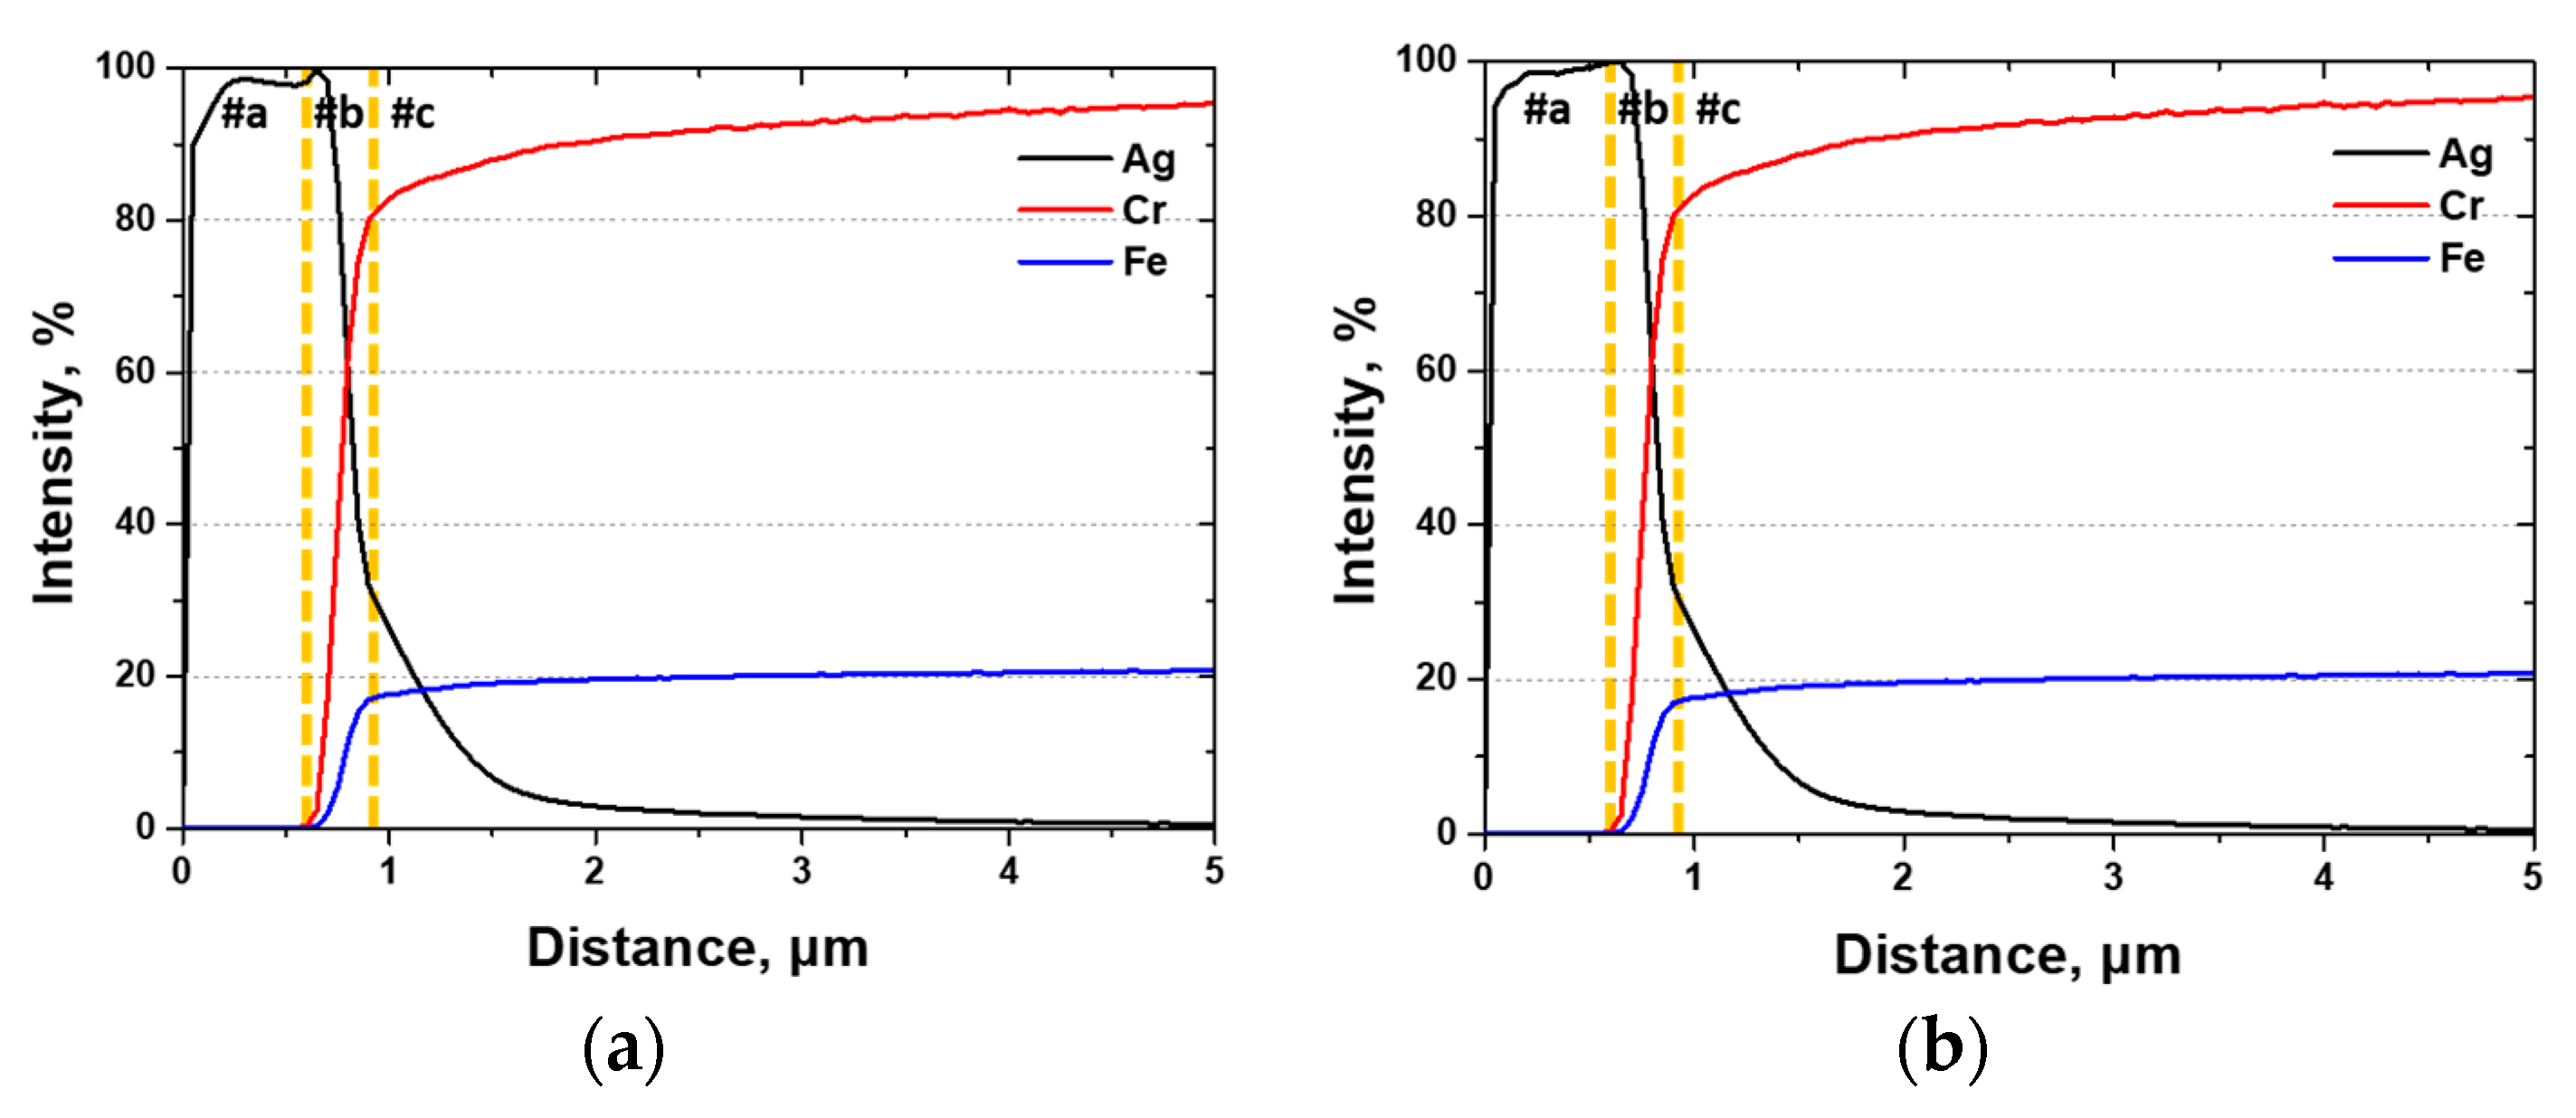
GDS analysis, which is suitable for evaluating the compositional distribution and interfacial elements of surfaces, was used to analyze the impact of the Ag coating. The results, shown in Figure 10, indicated the presence of a Ag coating with a thin diffusion layer of 3.6 μm (#c), a mixed zone of 0.3 μm (#b), and a thickness of 0.6 μm (#a). The thickness of the Ag coating layer was consistent regardless of the presence of the secondary phases, indicating that the secondary phases did not influence the coating thickness.
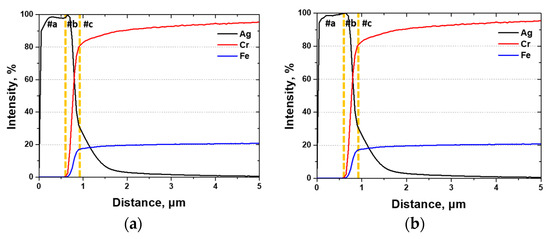
Figure 10.
Glow discharge spectroscopy (GDS) results of Ag, Cr, and Fe after Ag coating on SDSS AISI2507 via PVD (a) with secondary phase and (b) without secondary phase.
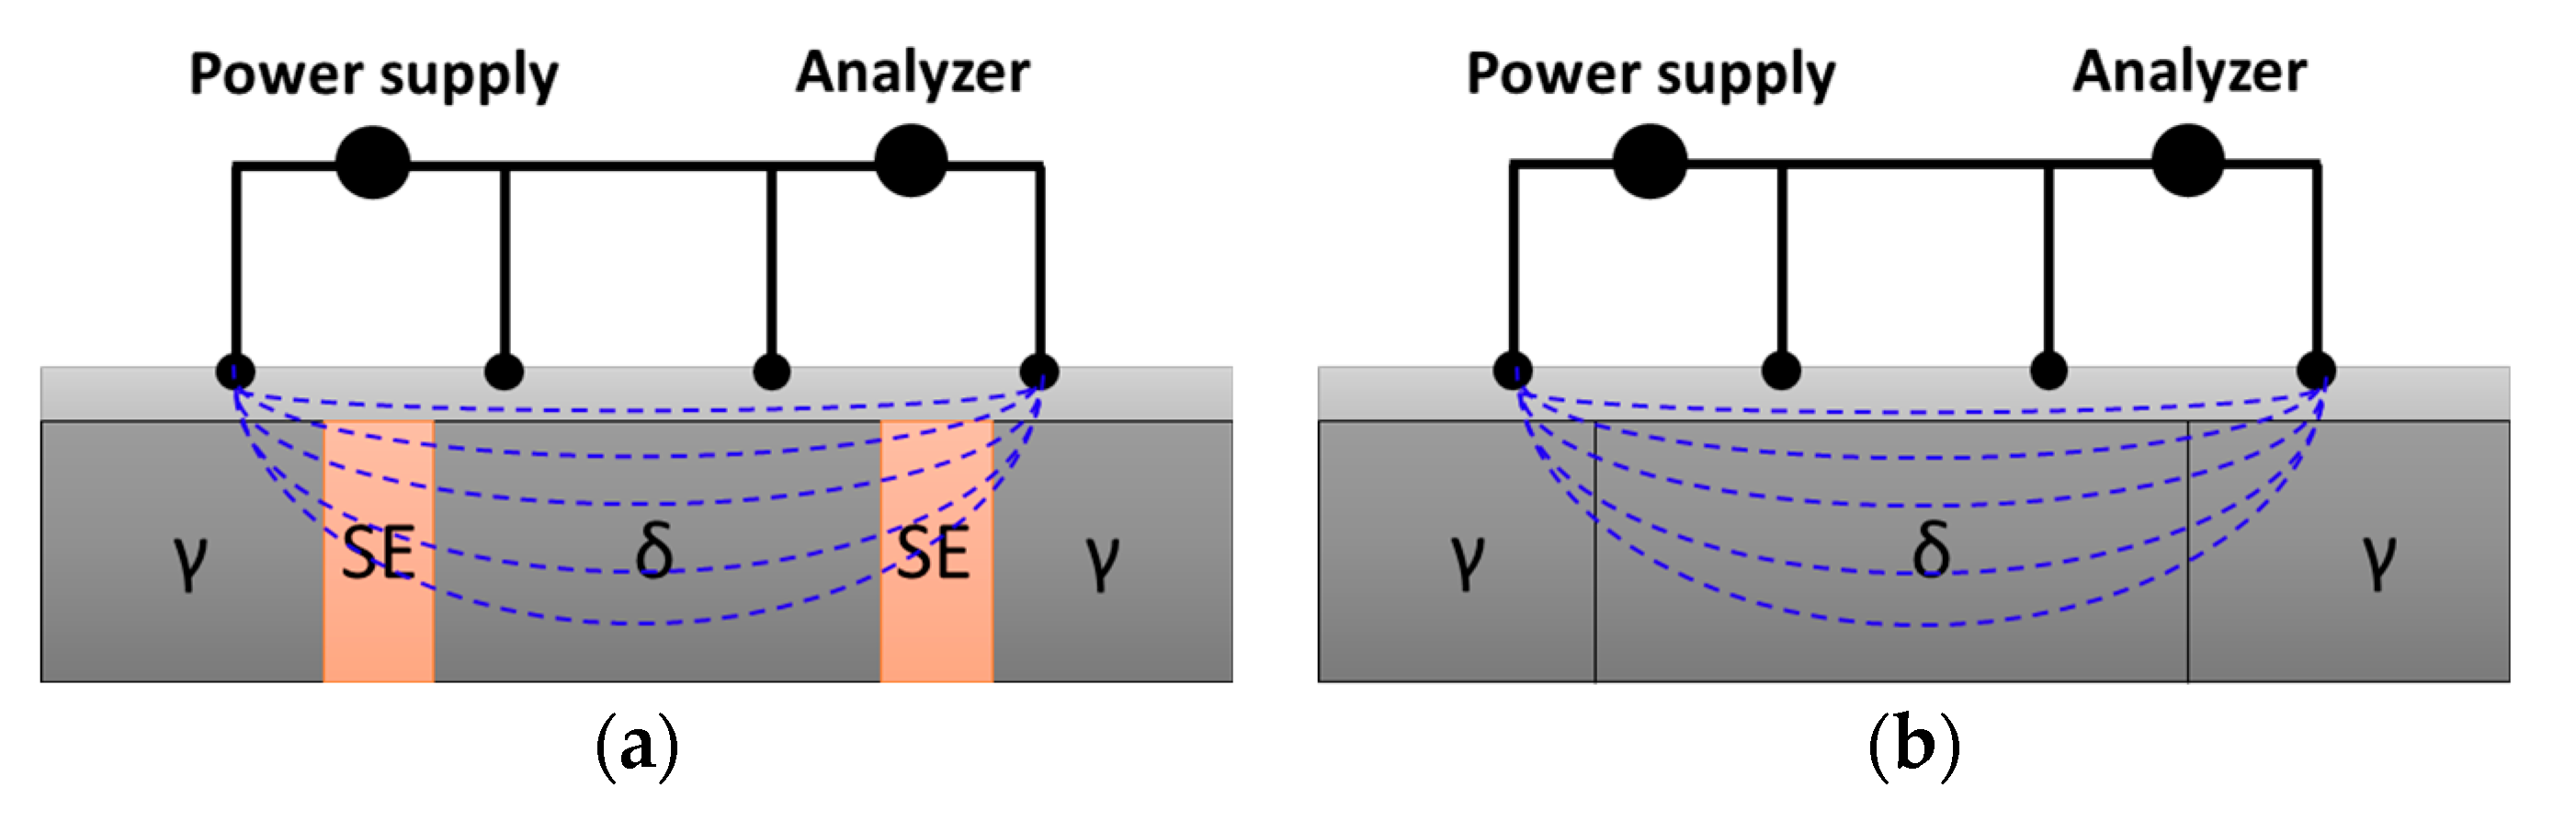
Although the secondary phases did not affect the Ag coating thickness, they decreased the electrical conductivity [29]. The effect on the electrical conductivity is illustrated in Figure 11. At the microscale, electron movement (blue dashed line) was influenced by both the coating layer and the substrate (dark gray). The secondary phases in the substrate increased the electrical resistance, thereby decreasing the electrical conductivity. The thin Ag coating layer (light gray) of less than 1 μm was affected by the substrate, resulting in a decrease in the ICAS from 58.8% to 53.6%. Therefore, to ensure adequate AISI2507 conductivity for Li-ion battery applications, the microstructure needed to be carefully controlled to minimize the crystallization of the secondary phases.
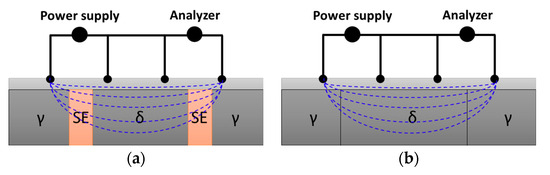
Figure 11.
Schematic diagram of the electroconductivity of SDSS AISI2507 after Ag coating (a) with secondary phase and (b) without secondary phase (bright gray: Ag coating layer, blue dashes: electron movement direction).
3.3. Electrochemical Behavior
Given that NaCl solution is widely used as the electrolyte in protocols adhering to the ASTM standard, the electrochemical behavior of 3.5 wt.% NaCl electrolyte solution was analyzed to provide baseline data for this study. The OCP was measured to assess the reactivity after Ag coating, and EIS was employed to analyze the passivation layer on both the Ag coating and AISI2507.
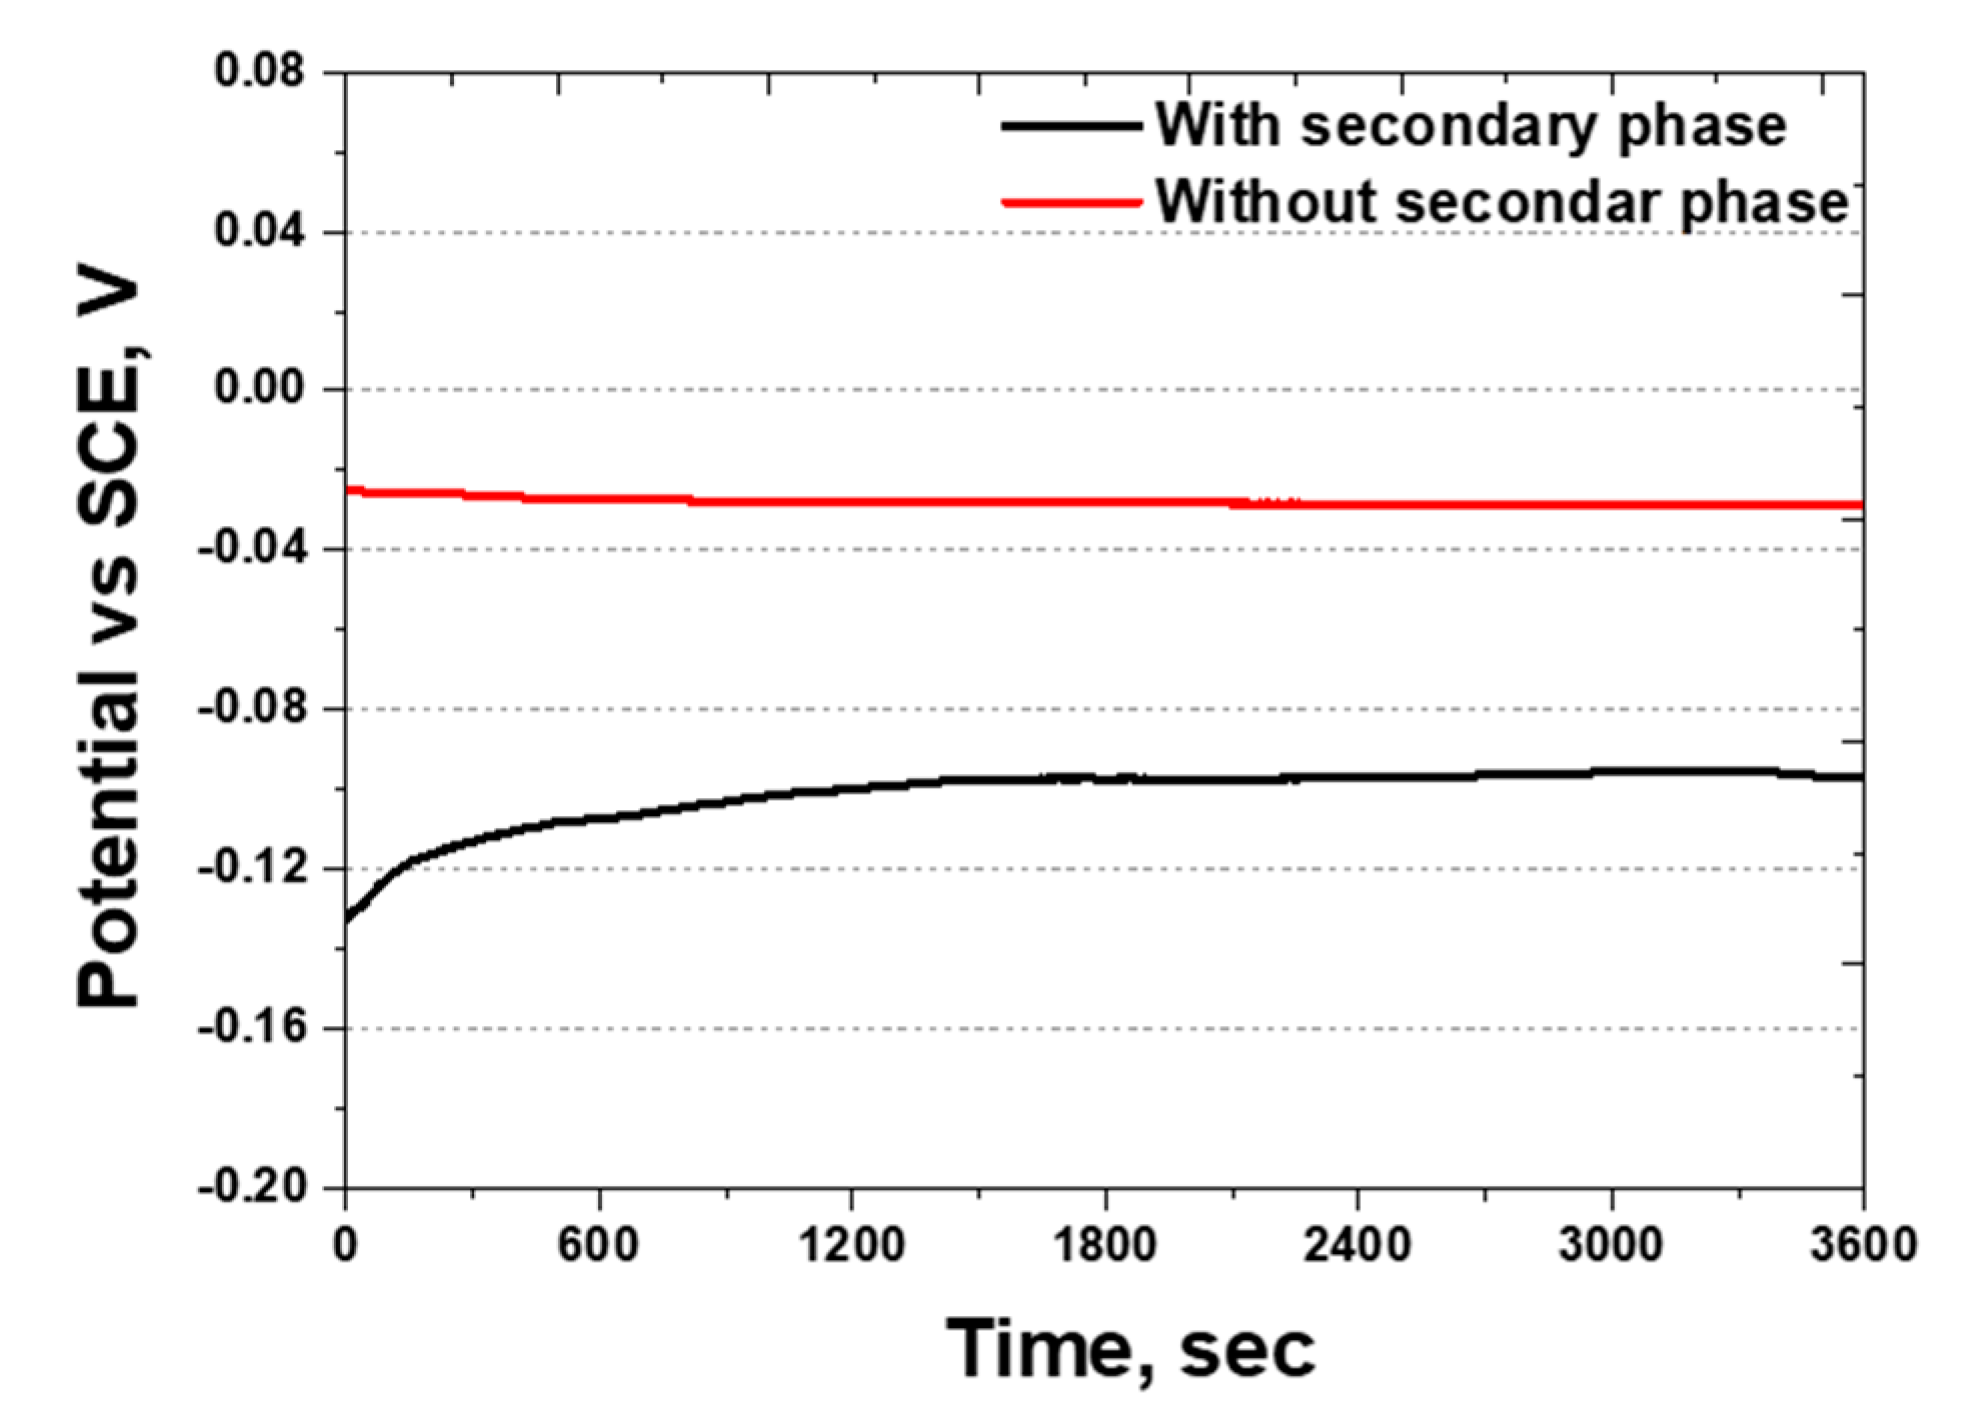
OCP measures the reactivity by identifying the conditions under which oxidation and reduction occur. The potential range for stainless steel is in the range of −0.3–0.2 V, whereas that for silver is 0.77 V [54,55]. The OCP was analyzed based on the presence of secondary phases, and the results are shown in Figure 12. The OCP values were found to be between −0.10 and −0.02 V, being within the potential range for stainless steel. This indicated that, although a Ag coating layer exists, uncoated areas remain where NaCl can react. Thus, the microscopic gaps in the coating allow NaCl to penetrate and participate in the corrosion process.

Figure 12.
Open-circuit potential (OCP) curve showing potential (V) vs. time (s) of SDSS AISI2507 after Ag coating with or without secondary phase in 3.5 wt.% NaCl electrolyte solution.
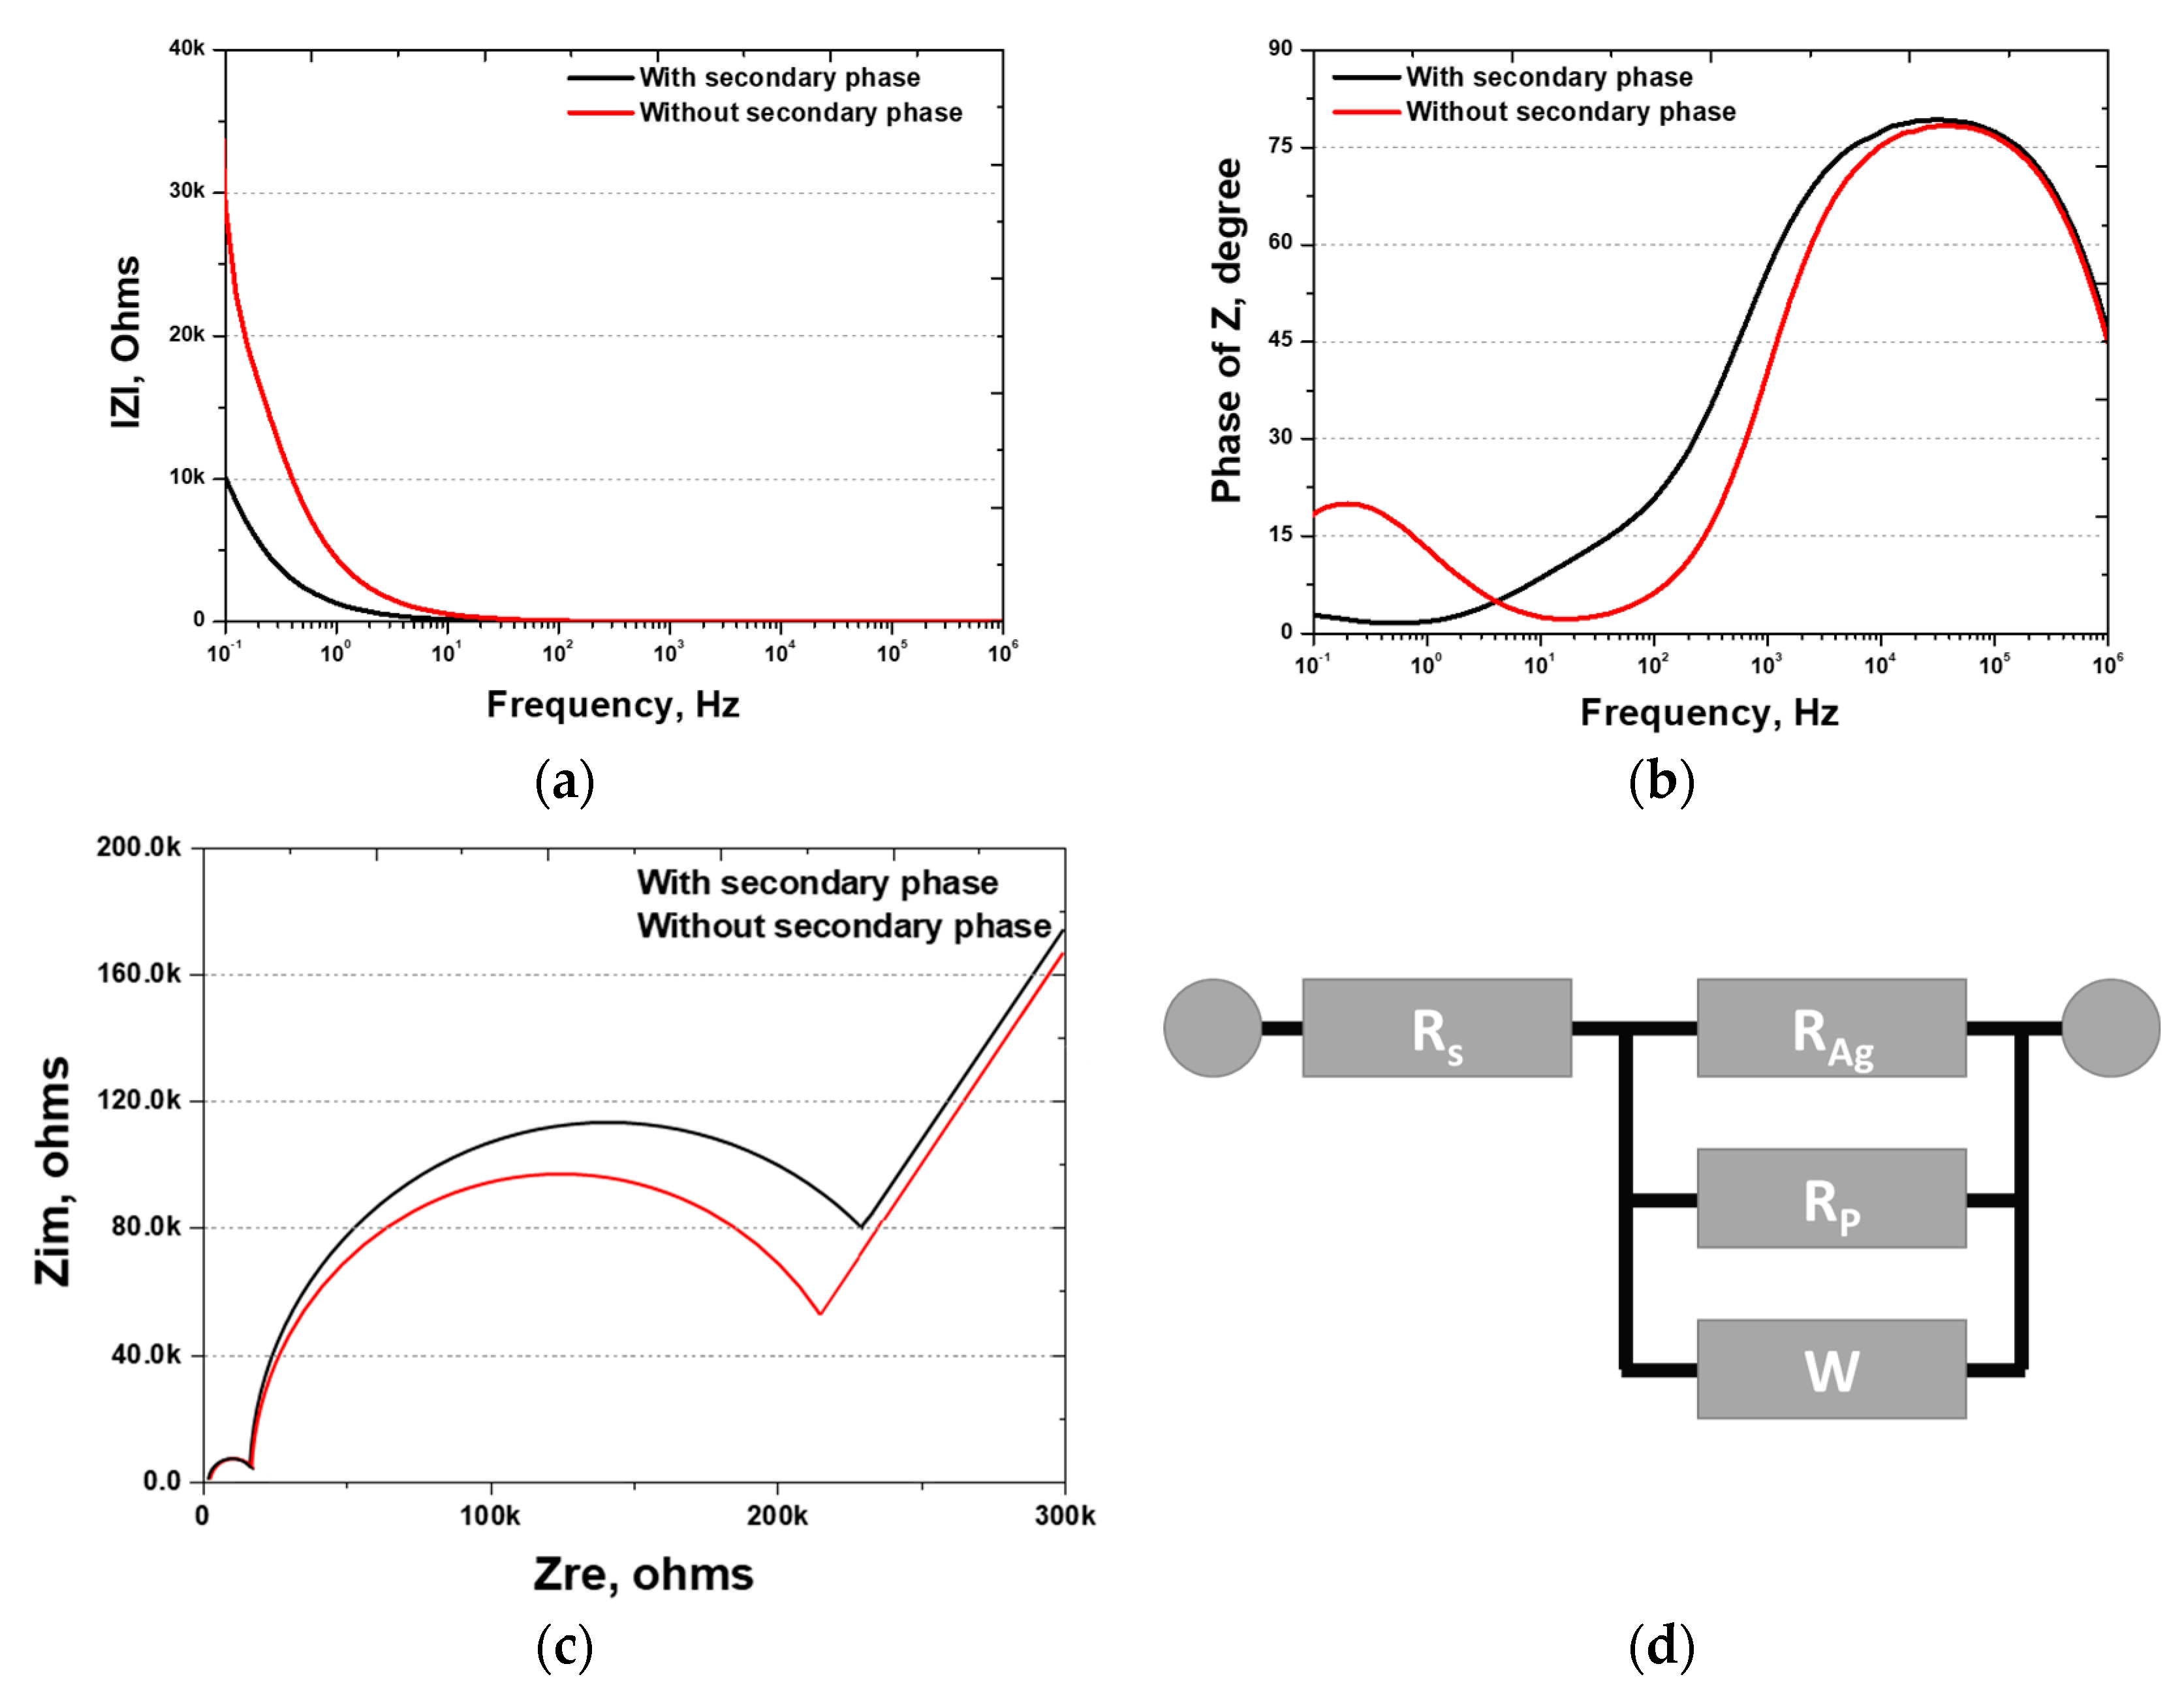
EIS, which measures resistance changes with frequency, was used to analyze the surface coating and passivation layers. The EIS results, presented in the form of Bode and Nyquist plots, were used to construct the equivalent circuit. The results are presented in Figure 13 and Table 6. The Bode plot reveals that the resistance and phase angle change with the frequency. Although the resistance exhibited a minimal change from 106 to 10−1 Hz, variations in the phase angle were observed.

Figure 13.
Electrochemical impedance spectroscopy (EIS) results after Ag coating of SDSS AISI2507 with or without secondary phase: (a) IZI (ohms) vs. frequency (Hz), bode plot; (b) phase of Z (degree) vs. frequency (Hz), bode plot; (c) Zim (Ω) vs. Zre (ohms), Nyquist plot; (d) EIS circuit.
Table 6.
EIS results for Ag-coated super duplex stainless steel AISI2507.
High-frequency resistance, indicative of solution resistance, was measured at 7 Ω, which is in agreement with typical values for 3.5 wt.% NaCl. Subsequently, the resistance of the Ag coating and the passivation layers were determined. The resistance curve is illustrated in Figure 13c, revealing three distinct resistance stages: the Ag coating layer, the passivation layer of AISI2507, and the base material. The Ag coating layer exhibited a consistent resistance of 10 kΩ, whereas the passivation layer showed varying resistance values of 215 and 247 kΩ. According to the EIS results, the presence of the secondary phases did not significantly affect the Ag coating. However, the passivation layer was affected by secondary phases, displaying non-uniform passivation and decreased resistance.
4. Conclusions
This study examined the impact of secondary-phase precipitation on the coating behavior and electrochemical properties of Ag-coated SDSS AISI2507, leading to the following conclusions:
- (1)
- Secondary phases began to crystallize at grain boundaries during the growth of austenite, displaying irregular shapes as they grew. At 1000 °C, the secondary phase constituted 10% of the microstructure and grew predominantly as (111) and (110). The grain size of the secondary phase precipitated at the austenite grain boundaries was found to be <10 μm, which was significantly smaller compared to that of austenite (20–40 μm) and ferrite (over 40 μm). These secondary phases were identified as sigma (σ), chi (χ), and CrN.
- (2)
- Surface characteristics were analyzed to evaluate the effects of the secondary phases on the Ag coating. After Ag coating, the surface roughness decreased from 0.15 and 0.10 μm to 0.05 μm, indicating that the Ag coating was not affected by the presence of the secondary phases. However, crystallization of the secondary phases influenced the electrical conductivity. Whereas ICAS increased from 1.9% to 58.8% after Ag coating, it decreased to 53.6% upon the precipitation of secondary phases due to increased grain boundary resistance and the segregation of the chemical composition.
- (3)
- Electrochemical analysis of the Ag-coated surface revealed the presence of microgaps where NaCl ions could react. The OCP ranged from −0.10 to −0.02 V due to reactions occurring at the microgaps, with secondary phases contributing to a decrease in the potential. The EIS analysis results showed that whereas the Ag coating formed uniformly irrespective of the presence of secondary phases, differences were observed in the passivation layer of the substrate.
- (4)
- Regarding the potential application of SDSS AISI2507 as an Li-ion battery case material, a 0.9 μm Ag coating achieved excellent electrical conductivity. However, the surface roughness was not stabilized and the uniform coating layer presented exposed areas susceptible to NaCl ion contact. Thus, although AISI2507 shows potential as an efficient Li-ion battery material, it is crucial to control its surface roughness and precipitation of the secondary phases to ensure the formation of a uniform plating layer.
Author Contributions
Conceptualization, B.-H.S., H.J., J.-W.O., Y.K., Y.-S.L. and J.-H.Y.; methodology, B.-H.S., S.K. (Shinho Kim), J.L., S.K. (Seongjun Kim) and J.-W.O.; software, Y.-S.L., B.-H.S. and J.P.; validation, B.-H.S., J.P. and J.-H.Y.; formal analysis, B.-H.S., Y.J. and S.K. (Shinho Kim); investigation, Y.-S.L. and B.-H.S.; resources, H.J., B.-H.S., Y.J., J.L. and S.K. (Shinho Kim); data curation, B.-H.S., Y.-S.L. and J.-W.O.; writing—original draft preparation, H.J., B.-H.S., J.-W.O. and S.K. (Seongjun Kim); writing—review and editing, J.-H.Y., J.P., J.L., J.-W.O. and Y.K.; visualization, B.-H.S. and S.K. (Seongjun Kim); supervision, B.-H.S. and J.P.; project administration, B.-H.S., S.K. (Shinho Kim) and Y.K.; funding acquisition, S.K. (Seongjun Kim), J.-H.Y. and Y.K. All authors have read and agreed to the published version of the manuscript.
Funding
This work was supported by grants from the Korea Basic Science Institute (grant number C330320).
Data Availability Statement
The original contributions presented in the study are included in the article. Further inquiries can be directed to the corresponding authors.
Conflicts of Interest
The authors declare no conflicts of interest.
References
- Park, J.; Fatima, S.A. A DFT Study of TiC3 as Anode Material for Li-Ion Batteries. Appl. Surf. Sci. 2023, 638, 158024. [Google Scholar] [CrossRef]
- Cicconi, P.; Kumar, P.; Varshney, P. A Support Approach for the Modular Design of Li-Ion Batteries: A Test Case with PCM. J. Energy Storage 2020, 31, 101684. [Google Scholar] [CrossRef]
- Bizeray, A.M.; Howey, D.A.; Monroe, C.W. Resolving a Discrepancy in Diffusion Potentials, with a Case Study for Li-Ion Batteries. J. Electrochem. Soc. 2016, 163, E223. [Google Scholar] [CrossRef]
- Kale, R.B.; More, S.S.; Khupse, N.D.; Kalubarme, R.S.; Kulkarni, M.V.; Rane, S.B.; Kale, B.B. High-Voltage Ionic Liquid-Based Flexible Solid Polymer Electrolyte for High-Performance Li-Ion Batteries. Sustain. Energy Fuels 2023, 7, 2934–2942. [Google Scholar] [CrossRef]
- Petit, M.; Prada, E.; Sauvant-Moynot, V. Development of an Empirical Aging Model for Li-Ion Batteries and Application to Assess the Impact of Vehicle-to-Grid Strategies on Battery Lifetime. Appl. Energy 2016, 172, 398–407. [Google Scholar] [CrossRef]
- Klink, J.; Hebenbrock, A.; Grabow, J.; Orazov, N.; Nylén, U.; Benger, R.; Beck, H.-P. Comparison of Model-Based and Sensor-Based Detection of Thermal Runaway in Li-Ion Battery Modules for Automotive Application. Batteries 2022, 8, 34. [Google Scholar] [CrossRef]
- Chang, W.-S.; Park, C.-M.; Kim, J.-H.; Kim, Y.-U.; Jeong, G.; Sohn, H.-J. Quartz (SiO2): A New Energy Storage Anode Material for Li-Ion Batteries. Energy Environ. Sci. 2012, 5, 6895–6899. [Google Scholar] [CrossRef]
- Mayyas, A.; Steward, D.; Mann, M. The Case for Recycling: Overview and Challenges in the Material Supply Chain for Automotive Li-Ion Batteries. Sustain. Mater. Technol. 2019, 19, e00087. [Google Scholar] [CrossRef]
- Rahman, A.; Lin, X.; Wang, C. Li-Ion Battery Anode State of Charge Estimation and Degradation Monitoring Using Battery Casing via Unknown Input Observer. Energies 2022, 15, 5662. [Google Scholar] [CrossRef]
- Tudoroiu, N.; Zaheeruddin, M.; Tudoroiu, R.-E.; Radu, M.S.; Chammas, H. Investigations on Using Intelligent Learning Techniques for Anomaly Detection and Diagnosis in Sensors Signals in Li-Ion Battery—Case Study. Inventions 2023, 8, 74. [Google Scholar] [CrossRef]
- Rahman, A.; Lin, X. Li-Ion Battery Individual Electrode State of Charge and Degradation Monitoring Using Battery Casing through Auto Curve Matching for Standard CCCV Charging Profile. Appl. Energy 2022, 321, 119367. [Google Scholar] [CrossRef]
- Tudoroiu, R.-E.; Zaheeruddin, M.; Tudoroiu, N.; Radu, S.M.; Chammas, H. Investigations of Different Approaches for Controlling the Speed of an Electric Motor with Nonlinear Dynamics Powered by a Li-Ion Battery-Case Study. In Electric Vehicles-Design, Modelling and Simulation; IntechOpen: London, UK, 2023. [Google Scholar]
- Mai, L.; Li, L.; Yang, J.; Tan, R.; Shu, W.; Low, C.J.; Zhang, Z.; Zhao, Y.; Li, C.; Zhang, Y. Industrial-Scale Nonmetal Current Collectors Designed to Regulate Heat Transfer and Enhance Battery Safety. Preprint, 2023. [Google Scholar] [CrossRef]
- Trinh, L.N.; Lee, D. The Characteristics of Laser Welding of a Thin Aluminum Tab and Steel Battery Case for Lithium-Ion Battery. Metals 2020, 10, 842. [Google Scholar] [CrossRef]
- Hariharan, S.; Saravanan, K.; Ramar, V.; Balaya, P. A Rationally Designed Dual Role Anode Material for Lithium-Ion and Sodium-Ion Batteries: Case Study of Eco-Friendly Fe3O4. Phys. Chem. Chem. Phys. 2013, 15, 2945–2953. [Google Scholar] [CrossRef] [PubMed]
- Hoosain, S.E.; Tshabalala, L.C.; Skhosana, S.; Freemantle, C.; Mndebele, N. Investigation of the Properties of Direct Energy Deposition Additive Manufactured 304 Stainless Steel. S. Afr. J. Ind. Eng. 2021, 32, 258–263. [Google Scholar] [CrossRef]
- Acharyya, S.G.; Khandelwal, A.; Kain, V.; Kumar, A.; Samajdar, I. Surface Working of 304L Stainless Steel: Impact on Microstructure, Electrochemical Behavior and SCC Resistance. Mater. Charact. 2012, 72, 68–76. [Google Scholar] [CrossRef]
- Speidel, M.O. Nitrogen Containing Austenitic Stainless Steels. Mater. Und Werkst. Entwickl. Fert. Prüfung Eig. Und Anwendungen Tech. Werkst. 2006, 37, 875–880. [Google Scholar] [CrossRef]
- Banaszczyk, J.; De Mey, G.; Anca, A.; Schwarz, A.; Van Langenhove, L. Contact Resistance Investigation between Stainless Steel Electroconductive Yarns. In Proceedings of the 2009 MIXDES-16th International Conference Mixed Design of Integrated Circuits & Systems, Lodz, Poland, 25–27 June 2009; IEEE: Piscataway, NJ, USA, 2009; pp. 417–419. [Google Scholar]
- Nilsson, J.-O. Super Duplex Stainless Steels. Mater. Sci. Technol. 1992, 8, 685–700. [Google Scholar] [CrossRef]
- Fande, A.W.; Taiwade, R. V Welding of Super Duplex Stainless Steel and Austenitic Stainless Steel:# Xd; Influence and Role of Bicomponent Fluxes. Mater. Manuf. Process. 2023, 38, 434–448. [Google Scholar]
- Tehovnik, F.; Arzensek, B.; Arh, B.; Skobir, D.; Pirnar, B.; Zuzek, B. Microstructure Evolution in SAF 2507 Super Duplex Stainless Steel. Mater. Technol. 2011, 45, 339–345. [Google Scholar]
- Linton, V.M.; Laycock, N.J.; Thomsen, S.J.; Klumpers, A. Failure of a Super Duplex Stainless Steel Reaction Vessel. Eng. Fail. Anal. 2004, 11, 243–256. [Google Scholar] [CrossRef]
- Lervåg, M.; Sørensen, C.; Robertstad, A.; Brønstad, B.M.; Nyhus, B.; Eriksson, M.; Aune, R.; Ren, X.; Akselsen, O.M.; Bunaziv, I. Additive Manufacturing with Superduplex Stainless Steel Wire by Cmt Process. Metals 2020, 10, 272. [Google Scholar] [CrossRef]
- Ha, H.-Y.; Lee, T.-H.; Bae, J.-H.; Chun, D.W. Molybdenum Effects on Pitting Corrosion Resistance of FeCrMnMoNC Austenitic Stainless Steels. Metals 2018, 8, 653. [Google Scholar] [CrossRef]
- Metikoš-Huković, M.; Babić, R.; Grubač, Z.; Petrović, Ž.; Lajçi, N. High Corrosion Resistance of Austenitic Stainless Steel Alloyed with Nitrogen in an Acid Solution. Corros. Sci. 2011, 53, 2176–2183. [Google Scholar] [CrossRef]
- Wang, D.; Li, F.; Liu, M.; Zhang, W.; Yu, X.; Da, W. Effect of Nanodiamond Content in the Plating Solution on the Corrosion Resistance of Nickel–Nanodiamond Composite Coatings Prepared on Annealed 45 Carbon Steel. Coatings 2022, 12, 1558. [Google Scholar] [CrossRef]
- Lee, H.-B.; Sheu, H.-H.; Jian, J.-S.; Chang, S.-Y.; Yen, C.-H.; Lin, H.-E. Supercritical-CO2 Electroless Nickel Plating Enhanced Anti-Corrosion Properties of Micro-Arc Oxidized AZ31 Magnesium Alloy. Mater. Today Commun. 2022, 33, 104475. [Google Scholar] [CrossRef]
- Jiang, S.; Xu, J.; Chen, Z.; Guo, R.; Miao, D.; Peng, L.; Wang, Y.; Shang, S. Enhanced Electro-Conductivity and Multi-Shielding Performance with Copper, Stainless Steel and Titanium Coating onto PVA Impregnated Cotton Fabric. J. Mater. Sci. Mater. Electron. 2018, 29, 5624–5633. [Google Scholar] [CrossRef]
- Paulraj, P.; Garg, R. Effect of Intermetallic Phases on Corrosion Behavior and Mechanical Properties of Duplex Stainless Steel and Super-Duplex Stainless Steel. Adv. Sci. Technol. Res. J. 2015, 9, 87–105. [Google Scholar] [CrossRef]
- Li, Y.; Chen, C.; Qin, G.; Jiang, Z.; Sun, M.; Chen, K. Influence of Crucible Material on Inclusions in 95Cr Saw-Wire Steel Deoxidized by Si-Mn. Int. J. Miner. Metall. Mater. 2020, 27, 1083–1099. [Google Scholar] [CrossRef]
- Elhoud, A.M.; Renton, N.C.; Deans, W.F. Hydrogen Embrittlement of Super Duplex Stainless Steel in Acid Solution. Int. J. Hydrogen Energy 2010, 35, 6455–6464. [Google Scholar] [CrossRef]
- Kannan, A.R.; Shanmugam, N.S.; Rajkumar, V.; Vishnukumar, M. Insight into the Microstructural Features and Corrosion Properties of Wire Arc Additive Manufactured Super Duplex Stainless Steel (ER2594). Mater. Lett. 2020, 270, 127680. [Google Scholar] [CrossRef]
- Sung, C.; Shin, B.-H.; Chung, W. Effect of Solution Annealing on Austenite Morphology and Pitting Corrosion of Super Duplex Stainless Steel UNS S 32750. Int. J. Electrochem. Sci. 2021, 16, 210813. [Google Scholar] [CrossRef]
- Gasana, E.; Westbroek, P.; Hakuzimana, J.; De Clerck, K.; Priniotakis, G.; Kiekens, P.; Tseles, D. Electroconductive Textile Structures through Electroless Deposition of Polypyrrole and Copper at Polyaramide Surfaces. Surf. Coat. Technol. 2006, 201, 3547–3551. [Google Scholar] [CrossRef]
- Ghosh, S.K.; Grover, A.K.; Dey, G.K.; Totlani, M.K. Nanocrystalline Ni–Cu Alloy Plating by Pulse Electrolysis. Surf. Coat. Technol. 2000, 126, 48–63. [Google Scholar] [CrossRef]
- Goksu, E.I.; Vanegas, J.M.; Blanchette, C.D.; Lin, W.-C.; Longo, M.L. AFM for Structure and Dynamics of Biomembranes. Biochim. Biophys. Acta (BBA)-Biomembr. 2009, 1788, 254–266. [Google Scholar] [CrossRef] [PubMed]
- Bogdan, D.; Grosu, I.-G.; Filip, C. How Thick, Uniform and Smooth Are the Polydopamine Coating Layers Obtained under Different Oxidation Conditions? An in-Depth AFM Study. Appl. Surf. Sci. 2022, 597, 153680. [Google Scholar] [CrossRef]
- Rybalka, K.V.; Beketaeva, L.A.; Davydov, A.D. Electrochemical Behavior of Stainless Steel in Aerated NaCl Solutions by Electrochemical Impedance and Rotating Disk Electrode Methods. Russ. J. Electrochem. 2006, 42, 370–374. [Google Scholar] [CrossRef]
- Faraji, H.; Teggar, M.; Arshad, A.; Arıcı, M.; Berra, E.M.; Choukairy, K. Lattice Boltzmann Simulation of Natural Convection Heat Transfer Phenomenon for Thermal Management of Multiple Electronic Components. Therm. Sci. Eng. Prog. 2023, 45, 102126. [Google Scholar] [CrossRef]
- Masarapu, C.; Subramanian, V.; Zhu, H.; Wei, B. Long-Cycle Electrochemical Behavior of Multiwall Carbon Nanotubes Synthesized on Stainless Steel in Li Ion Batteries. Adv. Funct. Mater. 2009, 19, 1008–1014. [Google Scholar] [CrossRef]
- Amatsuka, S.; Nishimoto, M.; Muto, I.; Kawamori, M.; Takara, Y.; Sugawara, Y. Micro-Electrochemical Insights into Pit Initiation Site on Aged UNS S32750 Super Duplex Stainless Steel. Npj Mater. Degrad. 2023, 7, 15. [Google Scholar] [CrossRef]
- Nilsson, J.O.; Wilson, A. Influence of Isothermal Phase Transformations on Toughness and Pitting Corrosion of Super Duplex Stainless Steel SAF 2507. Mater. Sci. Technol. 1993, 9, 545–554. [Google Scholar] [CrossRef]
- Shin, B.-H.; Park, J.; Kim, S.; Ok, J.-W.; Kim, D.-I.; Yoon, J.-H. Study of Electroless Nickel Plating on Super Duplex Stainless Steel for Lithium-Ion Battery Cases: Electrochemical Behaviour and Effects of Plating Time. Metals 2024, 14, 307. [Google Scholar] [CrossRef]
- Martins, M.; Casteletti, L.C. Sigma Phase Morphologies in Cast and Aged Super Duplex Stainless Steel. Mater. Charact. 2009, 60, 792–795. [Google Scholar] [CrossRef]
- Pettersson, N.; Pettersson, R.F.A.; Wessman, S. Precipitation of Chromium Nitrides in the Super Duplex Stainless Steel 2507. Metall. Mater. Trans. A 2015, 46, 1062–1072. [Google Scholar] [CrossRef]
- Sung, C.; Kim, K.; Chung, W.; Shin, B.-H. Electrochemical Properties of UNS S 32750 and UNS S 32760 Annealed Super Duplex Stainless Steels. Int. J. Electrochem. Sci. 2022, 17, 220526. [Google Scholar] [CrossRef]
- Topolska, S.; Łabanowski, J. Effect of Microstructure on Impact Toughness of Duplex and Superduplex Stainless Steels. J. Achiev. Mater. Manuf. Eng. 2009, 36, 142–149. [Google Scholar]
- Sung, C.; Shin, B.-H.; Chung, W. Effect of Heat Energy Input on Electrochemical Properties of Solution-Annealed Super-Duplex Stainless Steel UNS S 32750 Laser Welding. Int. J. Electrochem. Sci. 2022, 17, 220339. [Google Scholar] [CrossRef]
- Shin, B.-H.; Kim, S.; Park, J.; Ok, J.-W.; Kim, D.-I.; Kim, D.; Yoon, J.-H. Effect of Secondary Phase on Electroless Ni Plating Behaviour of Super Duplex Stainless Steel SAF2507 for Advanced Li-Ion Battery Case. Materials 2024, 17, 1441. [Google Scholar] [CrossRef] [PubMed]
- Moniruzzaman, F.N.U.M.; Shakil, S.I.; Shaha, S.K.; Kacher, J.; Nasiri, A.; Haghshenas, M.; Hadadzadeh, A. Study of Direct Aging Heat Treatment of Additively Manufactured PH13–8Mo Stainless Steel: Role of the Manufacturing Process, Phase Transformation Kinetics, and Microstructure Evolution. J. Mater. Res. Technol. 2023, 24, 3772–3787. [Google Scholar] [CrossRef]
- Fréchard, S.; Martin, F.; Clément, C.; Cousty, J. AFM and EBSD Combined Studies of Plastic Deformation in a Duplex Stainless Steel. Mater. Sci. Eng. A 2006, 418, 312–319. [Google Scholar] [CrossRef]
- Rajesh, D.; Sunandana, C.S. XRD, Optical and AFM Studies on Pristine and Partially Iodized Ag Thin Film. Results Phys. 2012, 2, 22–25. [Google Scholar] [CrossRef]
- Sen, S.K.; Paul, T.C.; Dutta, S.; Hossain, M.N.; Mia, M.N.H. XRD Peak Profile and Optical Properties Analysis of Ag-Doped h-MoO 3 Nanorods Synthesized via Hydrothermal Method. J. Mater. Sci. Mater. Electron. 2020, 31, 1768–1786. [Google Scholar] [CrossRef]
- Rajesh, D.; Sunandana, C.S. Briefly Brominated Ag Thin Films: XRD, FESEM, and Optical Studies of Surface Modification. Appl. Surf. Sci. 2012, 259, 276–282. [Google Scholar] [CrossRef]


Disclaimer/Publisher’s Note: The statements, opinions and data contained in all publications are solely those of the individual author(s) and contributor(s) and not of MDPI and/or the editor(s). MDPI and/or the editor(s) disclaim responsibility for any injury to people or property resulting from any ideas, methods, instructions or products referred to in the content. |
© 2024 by the authors. Licensee MDPI, Basel, Switzerland. This article is an open access article distributed under the terms and conditions of the Creative Commons Attribution (CC BY) license (https://creativecommons.org/licenses/by/4.0/).