Article

Synthesis and Characterization of Carboxymethylcellulose-Functionalized Magnetite Nanoparticles as Contrast Agents for THz Spectroscopy with Applications in Oncology

by
Oliver Daniel Schreiner
1,
Petrisor Samoila
2,
Thomas Gabriel Schreiner
1,3,
Diana Socotar
1 and
Romeo Cristian Ciobanu
1,*
1
Department of Electrical Measurements and Materials, Gheorghe Asachi Technical University, 700050 Iasi, Romania
2
“Petru Poni” Institute of Macromolecular Chemistry, Aleea Grigore Ghica Vodă 41A, 700487 Iași, Romania
3
Department of Medical Specialties III, Faculty of Medicine, University of Medicine and Pharmacy “Grigore T. Popa”, 700115 Iasi, Romania
*
Author to whom correspondence should be addressed.
Crystals 2024, 14(8), 696; https://doi.org/10.3390/cryst14080696
Submission received: 7 July 2024 / Revised: 26 July 2024 / Accepted: 28 July 2024 / Published: 30 July 2024

Abstract

:
This paper describes a process to obtain magnetite functionalized with carboxymethylcellulose via coprecipitation by means of a preliminary stabilization of magnetite in citric acid. The magnetite assemblies successfully passed in vitro and in vivo tests of bio-compatibility. The measured values for the dielectric loss factor are remarkably high, a prerequisite for the assemblies’ potential use as contrast agents. Broadband THz spectroscopy analysis was performed to identify the most relevant frequency bands (here, 3.2–4 THz) where the signal difference between normal cells and cancer cells is relevant for the particles’ potential use as contrast agents for THz imaging, with applications in oncology.

1. Introduction

Due to their insidious appearance, their rapid and non-specific spread with metastases in the body, their variable reactivity to oncolytic therapy, and their ability to evade immune responses, tumor formations are often detected at an advanced stage of carcinogenesis. Overall, a widely accessible and perfect methodology for the early detection of gastric neoplasia remains an unmet goal, even though endoscopic techniques have been developed [1,2,3,4]. Recently, terahertz (THz) radiation has gained attention due to its combined (dielectric and optical) detection capabilities, along with its non-invasive and non-ionizing properties. The principle of the THz test is to employ surface plasmon polaritons instead of photons as the exposure source. This approach permits the analysis of patterns with nanoscale dimensions, based on the near-field enhancement effects of THz detectors. The most prominent techniques in THz imaging encompass electro-optic (EO) imaging, single-shot imaging, close-field imaging, dark-field imaging, bistatic THz wave imaging, THz wave computed tomography (CT), and THz wave tomographic imaging employing Fresnel lenses. Presently, THz pulse imaging, THz time-domain spectroscopy (TDS-THz), and continuous-wave THz (CW-THz) are recognized as the most promising methodologies for biomedical applications [5,6,7,8,9,10,11,12,13,14,15,16], particularly when combined with innovative contrast agents capable of augmenting image contrast and selectivity. In the context of the differential mode, it was theoretically anticipated that the THz signal originating from cancer cells with contrast agents would be up to 30 times greater than that from cancer cells lacking nanoparticles. However, experimental evidence has not validated this projection, as observed increases have not surpassed a factor of three. The novel concept involving contrast nano-carriers tailored for the THz domain could be envisioned with the following attributes: biocompatibility, affinity for cancerous tissue, stability, efficiency, and facile elimination within a 24 h timeframe. These particles should be readily injectable or dispersible, with a prerequisite of non-coagulation and non-reactivity with gastric acid and other pertinent biological agents. Studies in this field have focused on highly dispersed nanostructured materials, including metallic (e.g., gold nanorods) and magnetic (e.g., derived from Fe2O3) materials, as well as nano-diamonds or dedicated metamaterials [17,18,19,20,21,22,23]. In spite of some reticence in using, e.g., Fe3O4 as a contrast agent [24,25], continuous efforts were made to improve the formulas of such agents and eventually develop new assemblies, as presented in [26,27,28], in order to enhance image contrast or resolution and achieve better bio-compatibility. It was demonstrated that magnetite nanoparticles with biocompatible coatings (mainly oleic acid or silica) are non-toxic and can be used in clinical trials [29]. In the case of medical applications of magnetite nanoparticles, their recommended size should be less than 20 nm [30], and magnetite nanoparticles with special coatings are approved for magnetic resonance imaging (MRI) [29,30].
Nowadays, there is a trend toward broadening the frequency range of THz analysis for studying cancer phenomena, extending from 1.8 THz, as outlined in [31], to 4 THz and beyond, as explored in [32,33,34]. On the other hand, THz contrast enhancement using contrast agents derived from those used in MRI leads to limited benefits and only applies to narrow THz frequency domains (such as, e.g., when gadolinium oxide is used [35]), an aspect that encourages future research on developing new contrast agents for THz medical imaging.
This paper presents the synthesis and characterization of carboxymethylcellulose-functionalized magnetite nanoparticles as contrast agents, tested primarily for THz spectroscopy within a broader frequency range of up to 4 GHz, in order to identify their suitability for applications in oncology and the bands where the contrast is sufficiently enhanced to clearly delimit tumor cells from normal ones. To achieve this objective, THz spectroscopy with enhanced absorption analysis was employed due to its higher sensitivity compared to other THz spectroscopic methods. Some previous studies have described techniques for obtaining magnetite–carboxymethylcellulose nanocomposites, e.g., [34,35,36,37,38], but none have addressed the technique of functionalizing magnetite in two stages, as proposed within this paper, to achieve dispersible media within living cells, and none have targeted the medical applications of magnetite–carboxymethylcellulose assemblies as contrast agents.

2. Materials and Preparation Method

Magnetite powder was obtained in the laboratory through the coprecipitation method. The coprecipitation process involved preparing magnetite powders by a wet method and then adding a basic solution to a solution containing iron (II) and (III) ions, in stoichiometric proportions, until a certain pH value was reached. Coprecipitation offers a series of advantages that are essential for obtaining magnetite powders with properties suitable for special applications; such powders cannot be obtained by conventional ceramic processes. Coprecipitation offers simple and fast preparation of the compounds, reproducibility of the chemical composition, and good control over the particle size distribution through coprecipitation process parameters [39]. It should be noted that the temperature is an important factor in the coprecipitation process, determining the primary size of the crystallites, the specific surface, and even the phases that are formed. The experimental setup used for magnetite synthesis is shown in Figure 1, and the chemical substances were purchased from Sigma-Aldrich (St. Louis, MO, USA). To obtain pre-defined magnetite nanopowder, precisely determined amounts of 0.04 mol of FeCl3·6H2O and 0.02 mol of FeCl2·4H2O were dissolved in 200 mL of distilled water that had been previously degassed under nitrogen flow (to prevent oxidation of the Fe2+ ions). The solution thus obtained was transferred to a 3-neck flask located on a water bath pre-heated to 75 °C. Later, 25 mL of a 25% NH4OH basic solution was added to the solution of iron cations as a coprecipitating agent. In a very short time, the appearance of a black precipitate characteristic of magnetite formation was observed (as shown in Figure 1). The mixture was kept under stirring for 30 min. It should be mentioned that the whole process was carried out in a controlled atmosphere by introducing a constant flow of 50 mL/min. of N2 into the system. The solid product (magnetite) was separated by magnetic decantation, washed with distilled water to remove excess basic solution, and dried in an oven at 50 °C for 12 h.
Before adding the carboxymethylcellulose, a dispersion and stabilization of magnetite in citric acid was performed, by dispersing the iron oxide in distilled water, heating the magnetic fluid thus obtained to 90 °C under continuous mechanical stirring, and adding a solution of 20% citric acid. The mixture thus prepared was kept under continuous stirring for 1 h. Then, the functionalization of magnetite with carboxymethylcellulose was achieved by preparing a magnetic fluid similar to that prepared for stabilization in citric acid. The magnetic fluid was ultrasonicated for 15 min, after which the 1% carboxymethylcellulose solution was added. The resulting mixture was ultrasonicated for 1 h at 50 °C for complete homogenization and dispersion of the coated magnetite particles.

3. Results and Discussion

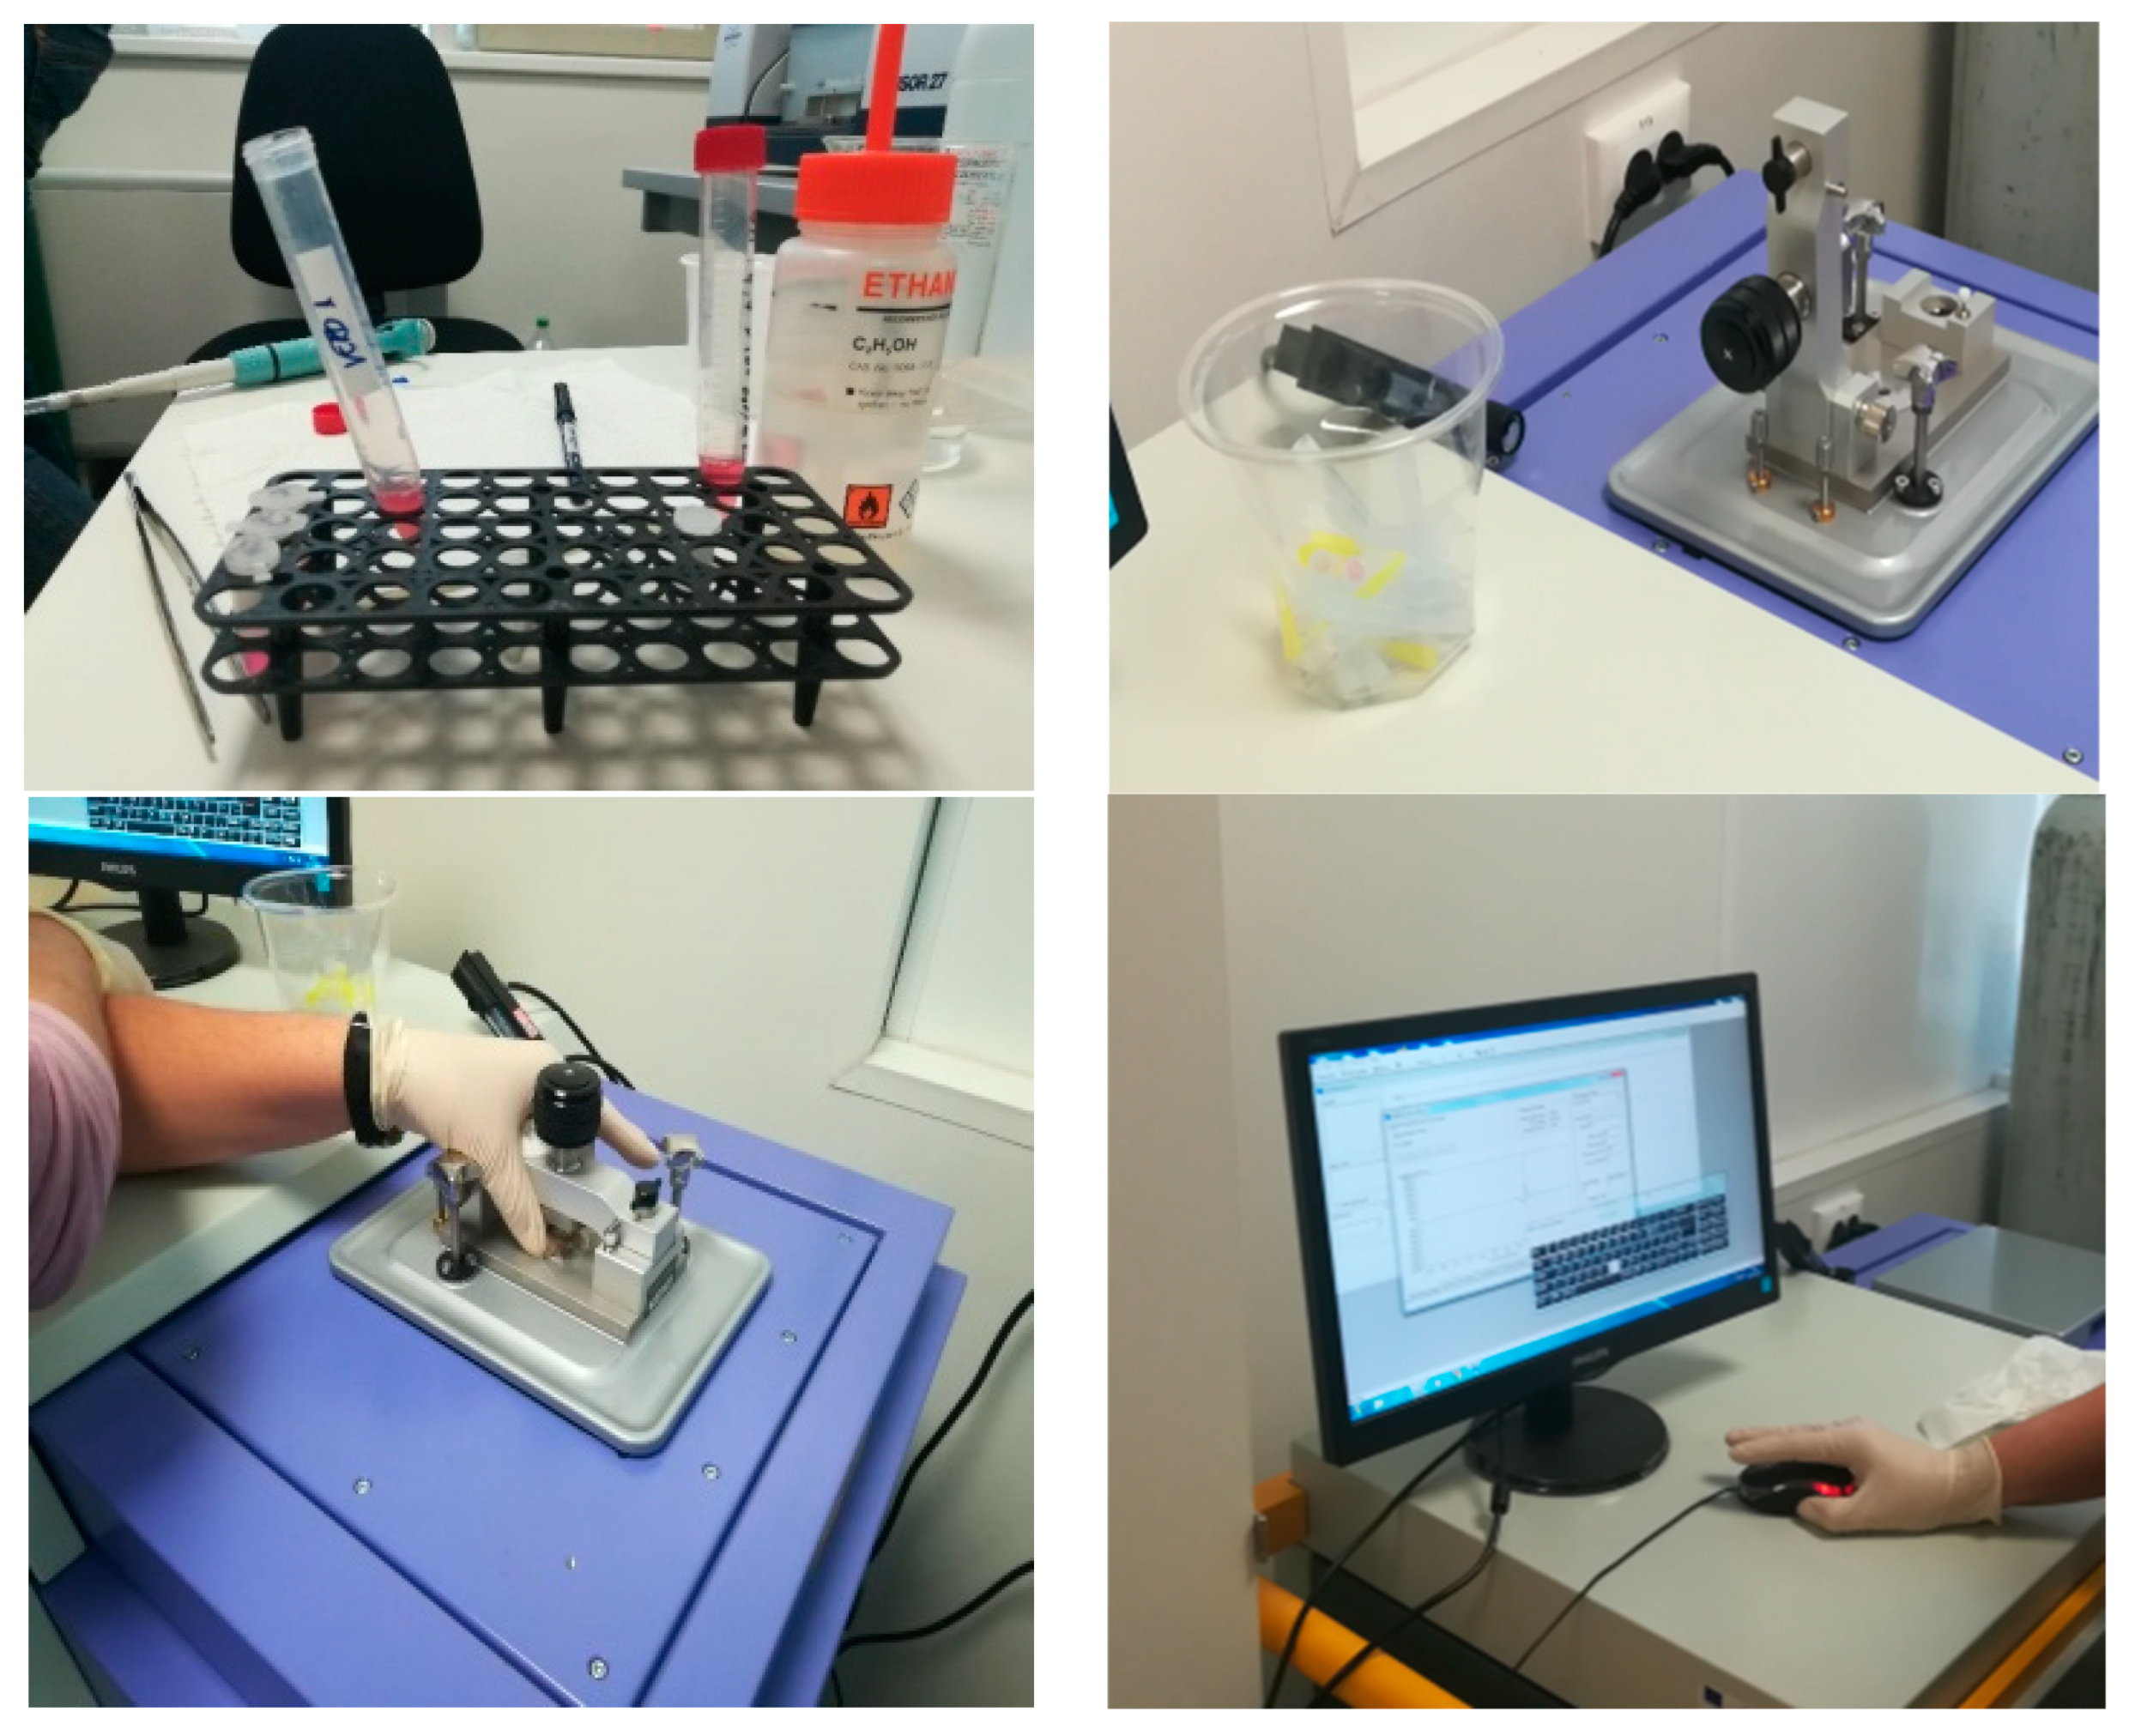
3.1. Characterization Equipment

Structural characterization was carried out by X-ray diffraction (XRD) using CuKα radiation with the Ni filter Bruker AXS D8 Advance with CuKα radiation (λ = 0.154 nm). Diffraction patterns were recorded at room temperature in Bragg–Brentano geometry at an angle 2θ from 20° to 65° at a rate of 0.6°/min (2θ)/min.
Transmission electron microscopy (TEM) results were obtained using a JEOL 2100 Plus transmission electron microscope operating at an accelerating voltage of 80 kV (JEOL Ltd., Akishima, Tokyo, Japan).
The dielectric properties were determined using the broadband dielectric spectroscopy method with a Solartron 1260A dielectric spectrometer (Solartron Analytical, Farnborough, UK).
The cell viability was tested by use of an Agilent BioTek Epoch 2 microplate spectrophotometer (Agilent Technologies Inc., Santa Clara, CA, USA).
THz analysis was performed by use of broadband TeraPulse Lx equipment (TeraView, based in Cambridge, UK).

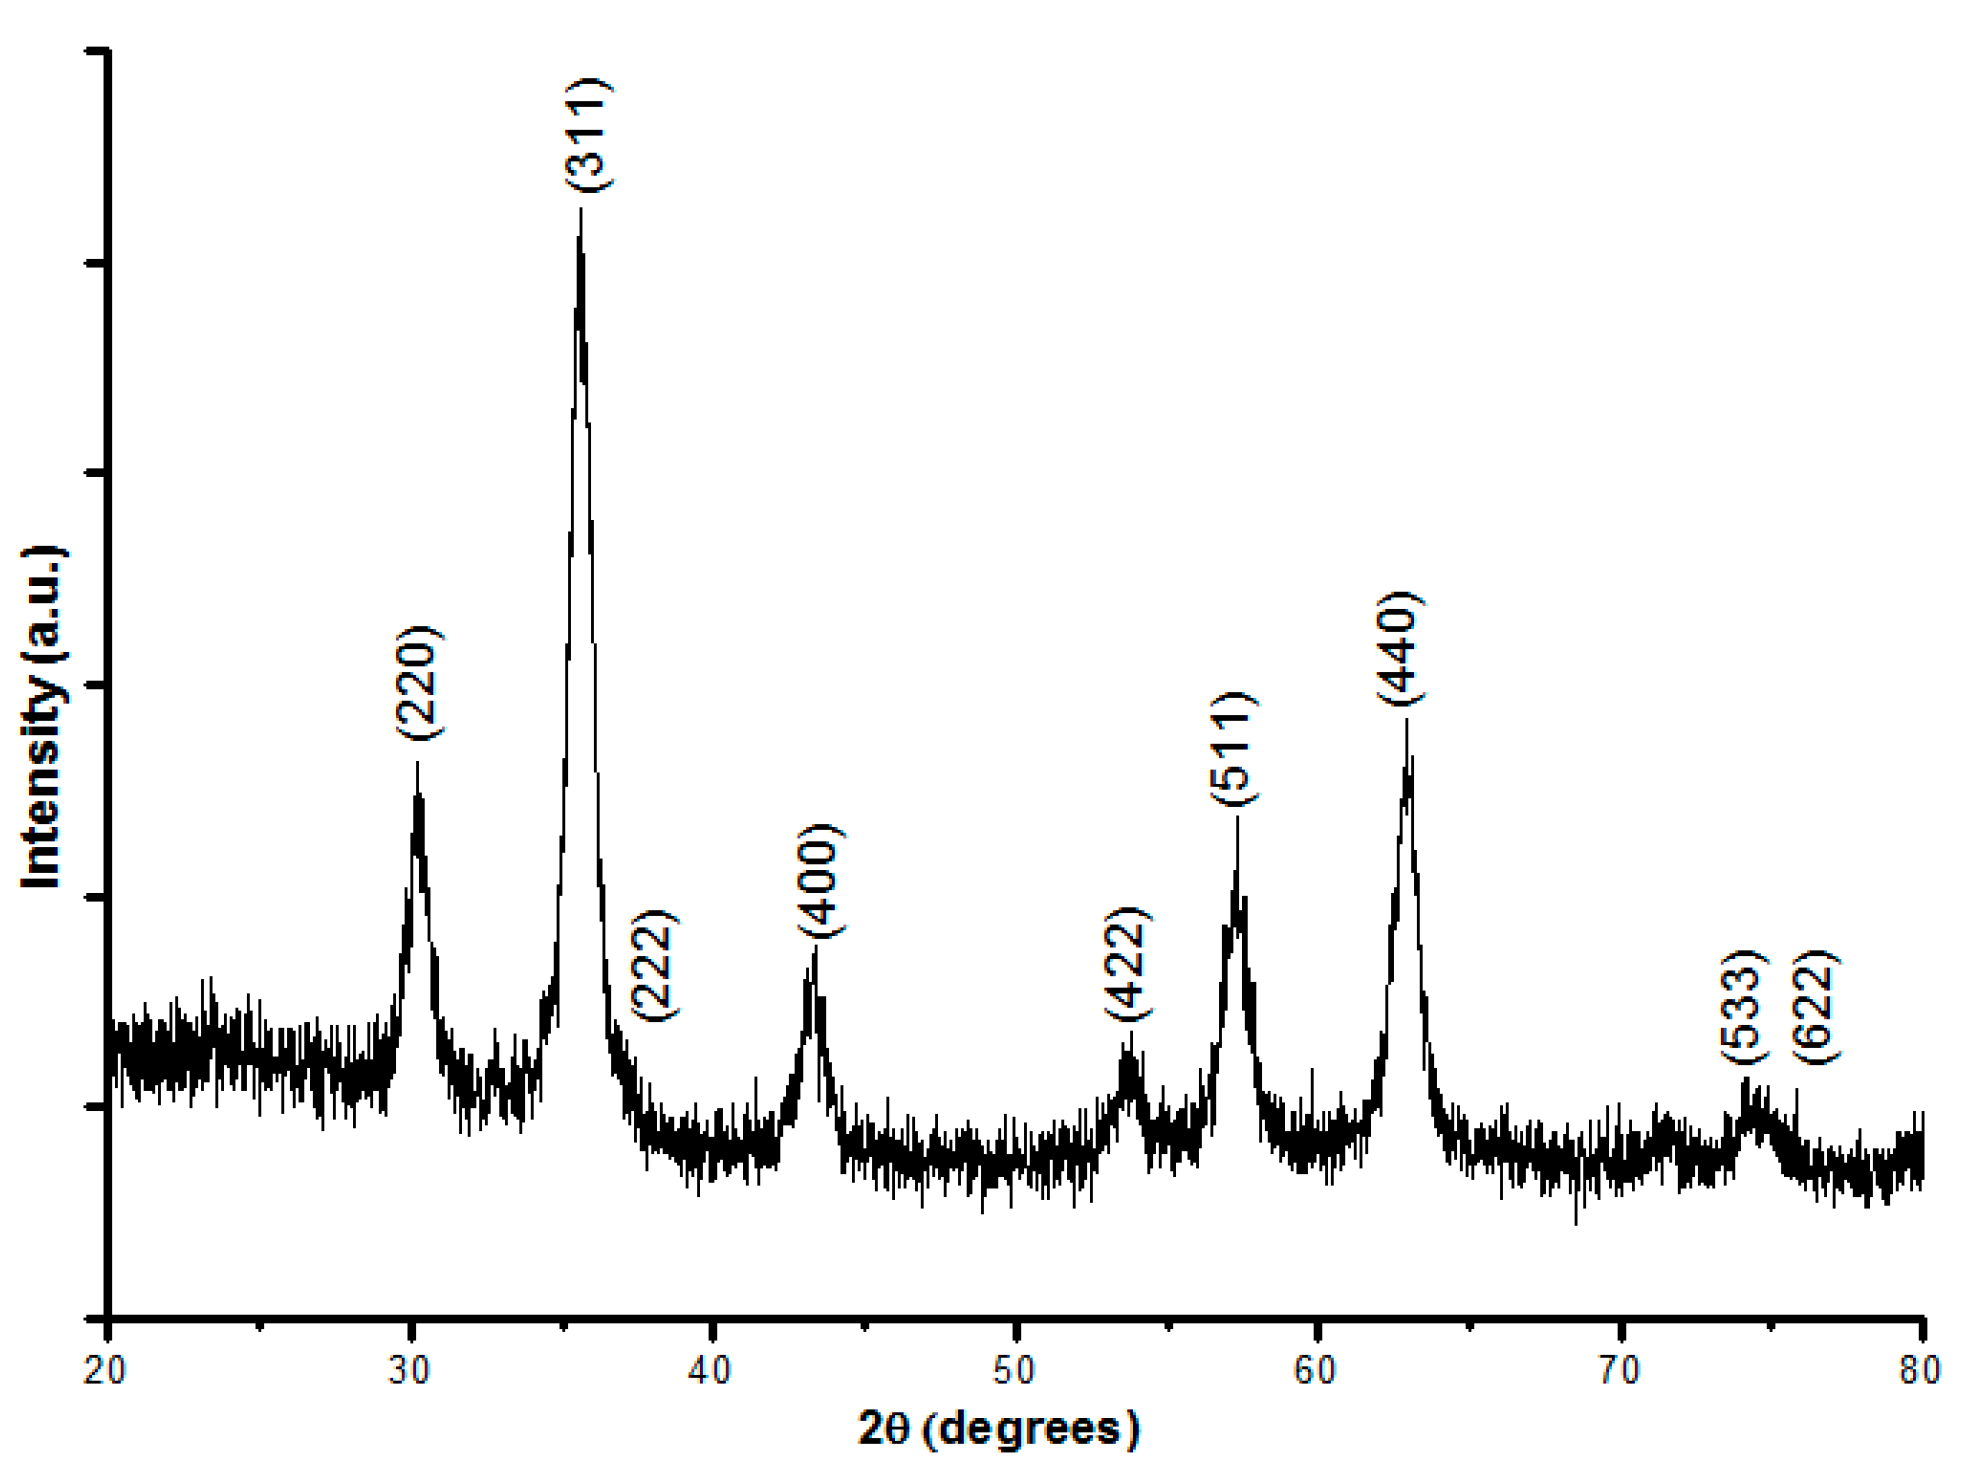
3.2. X-ray Diffraction Results
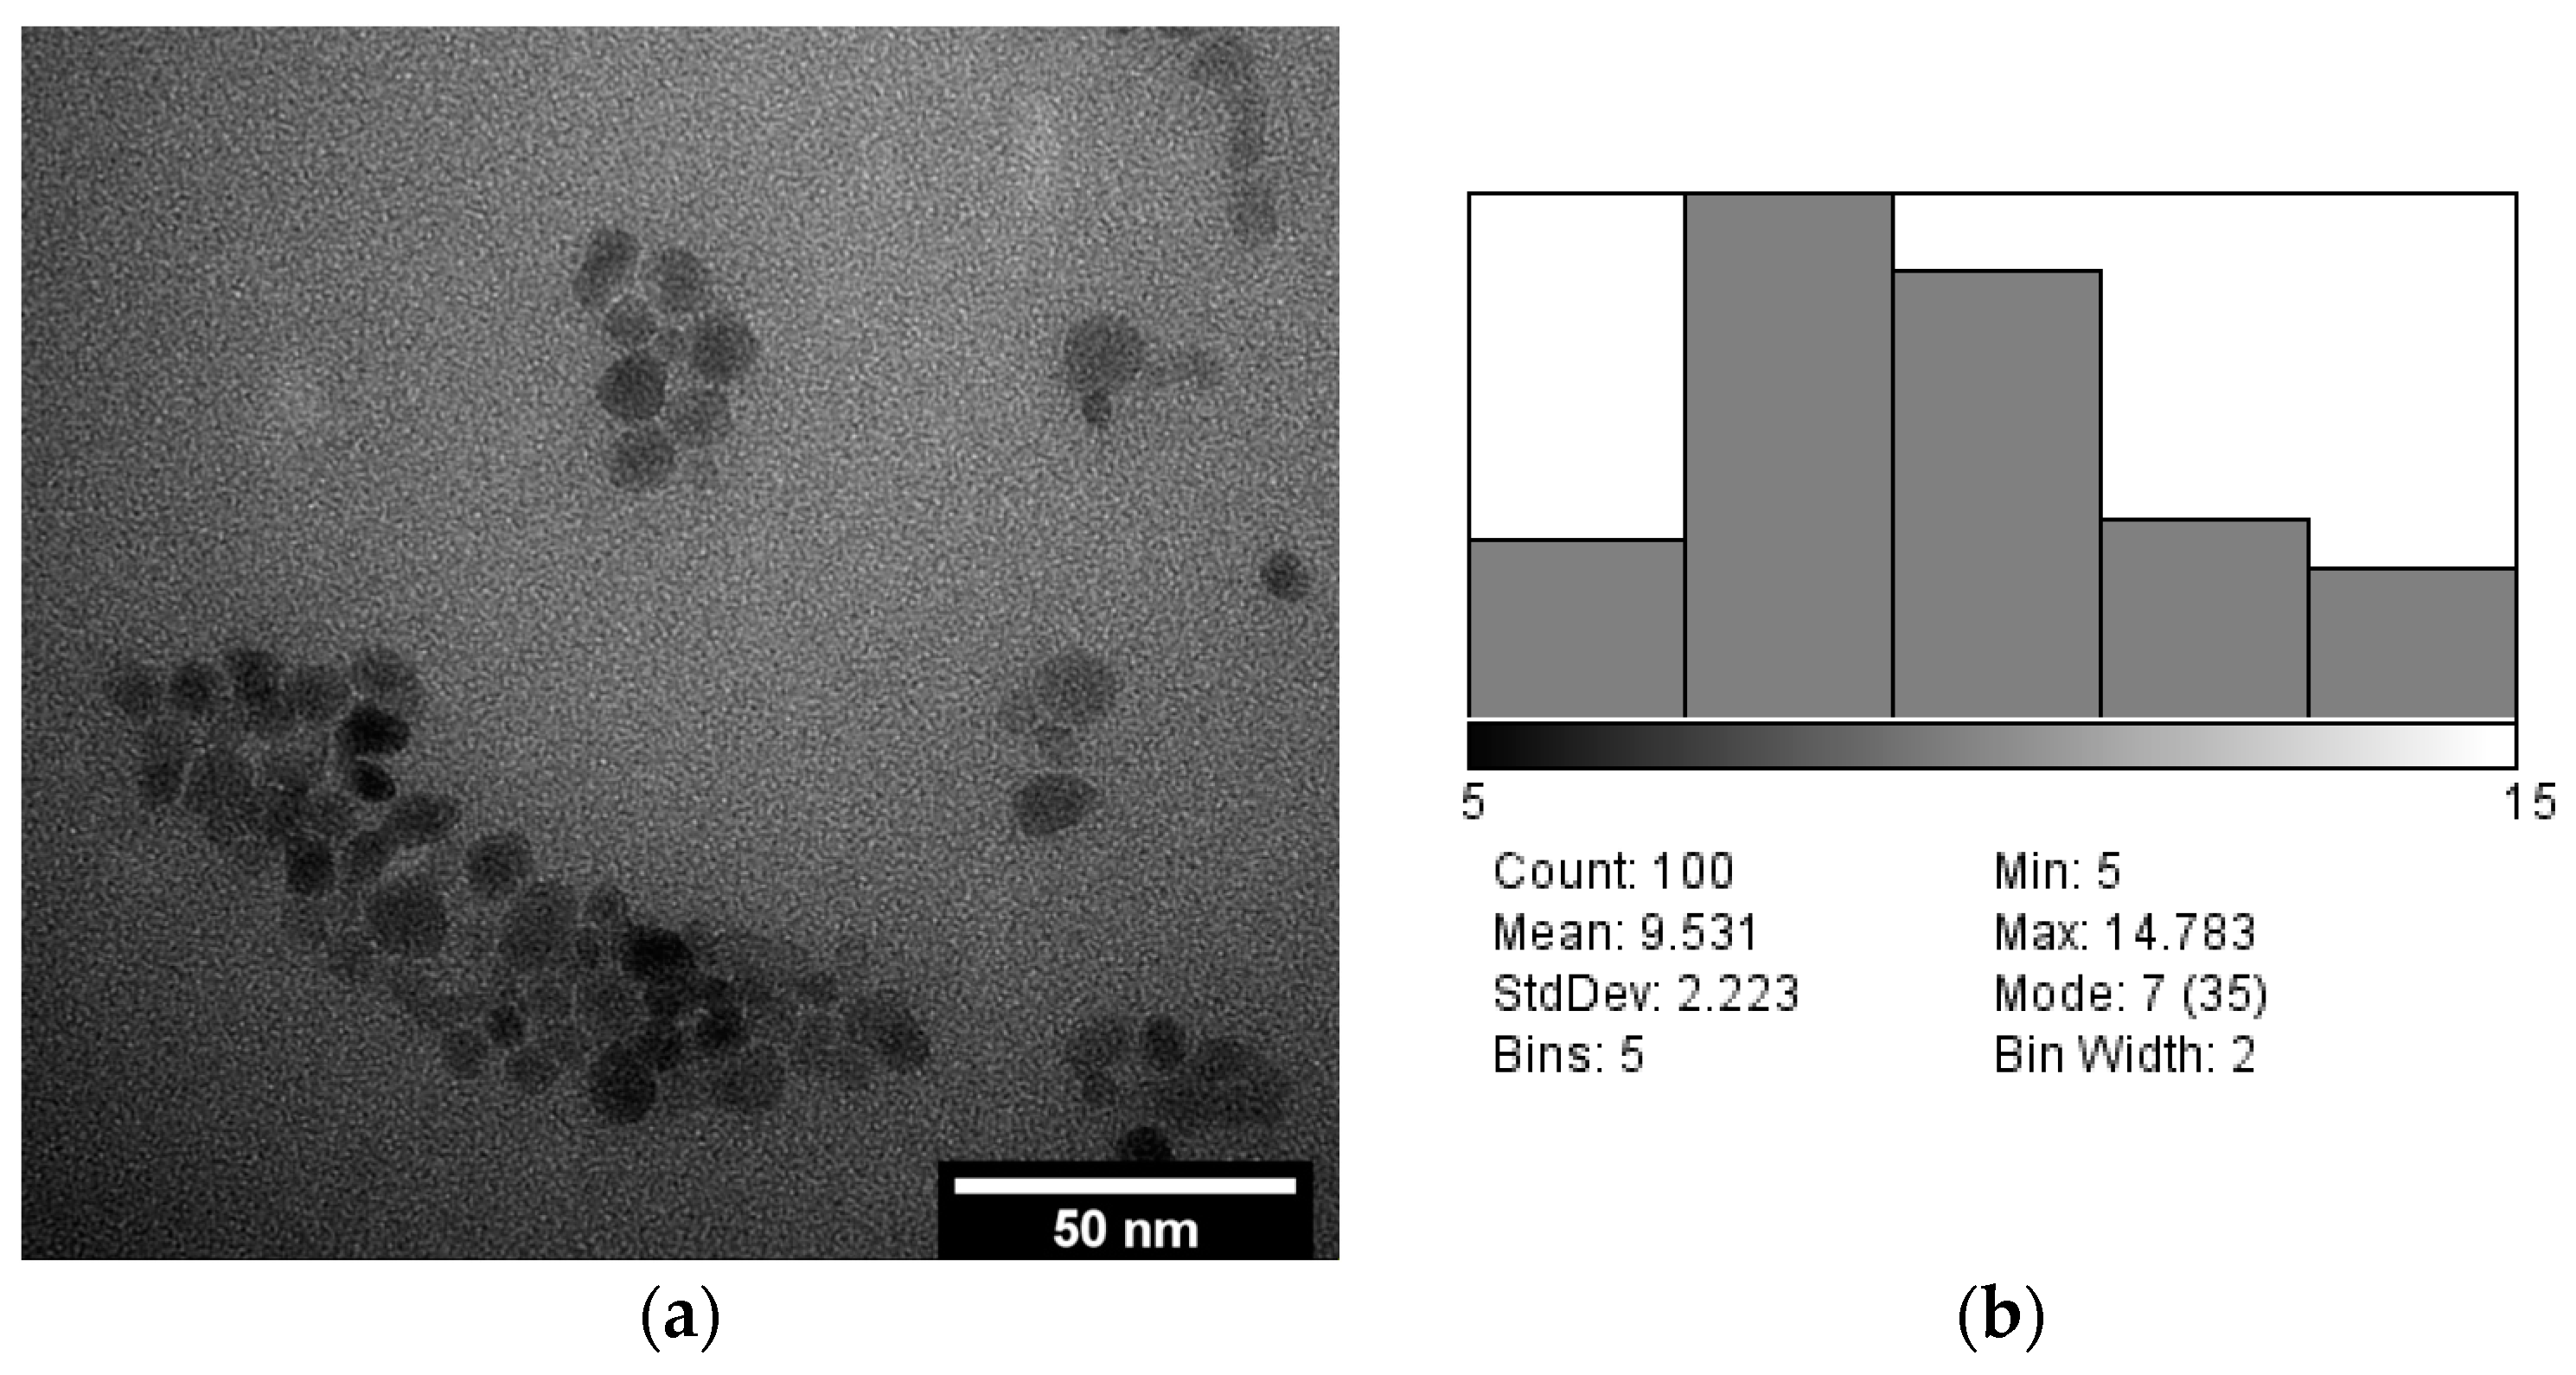
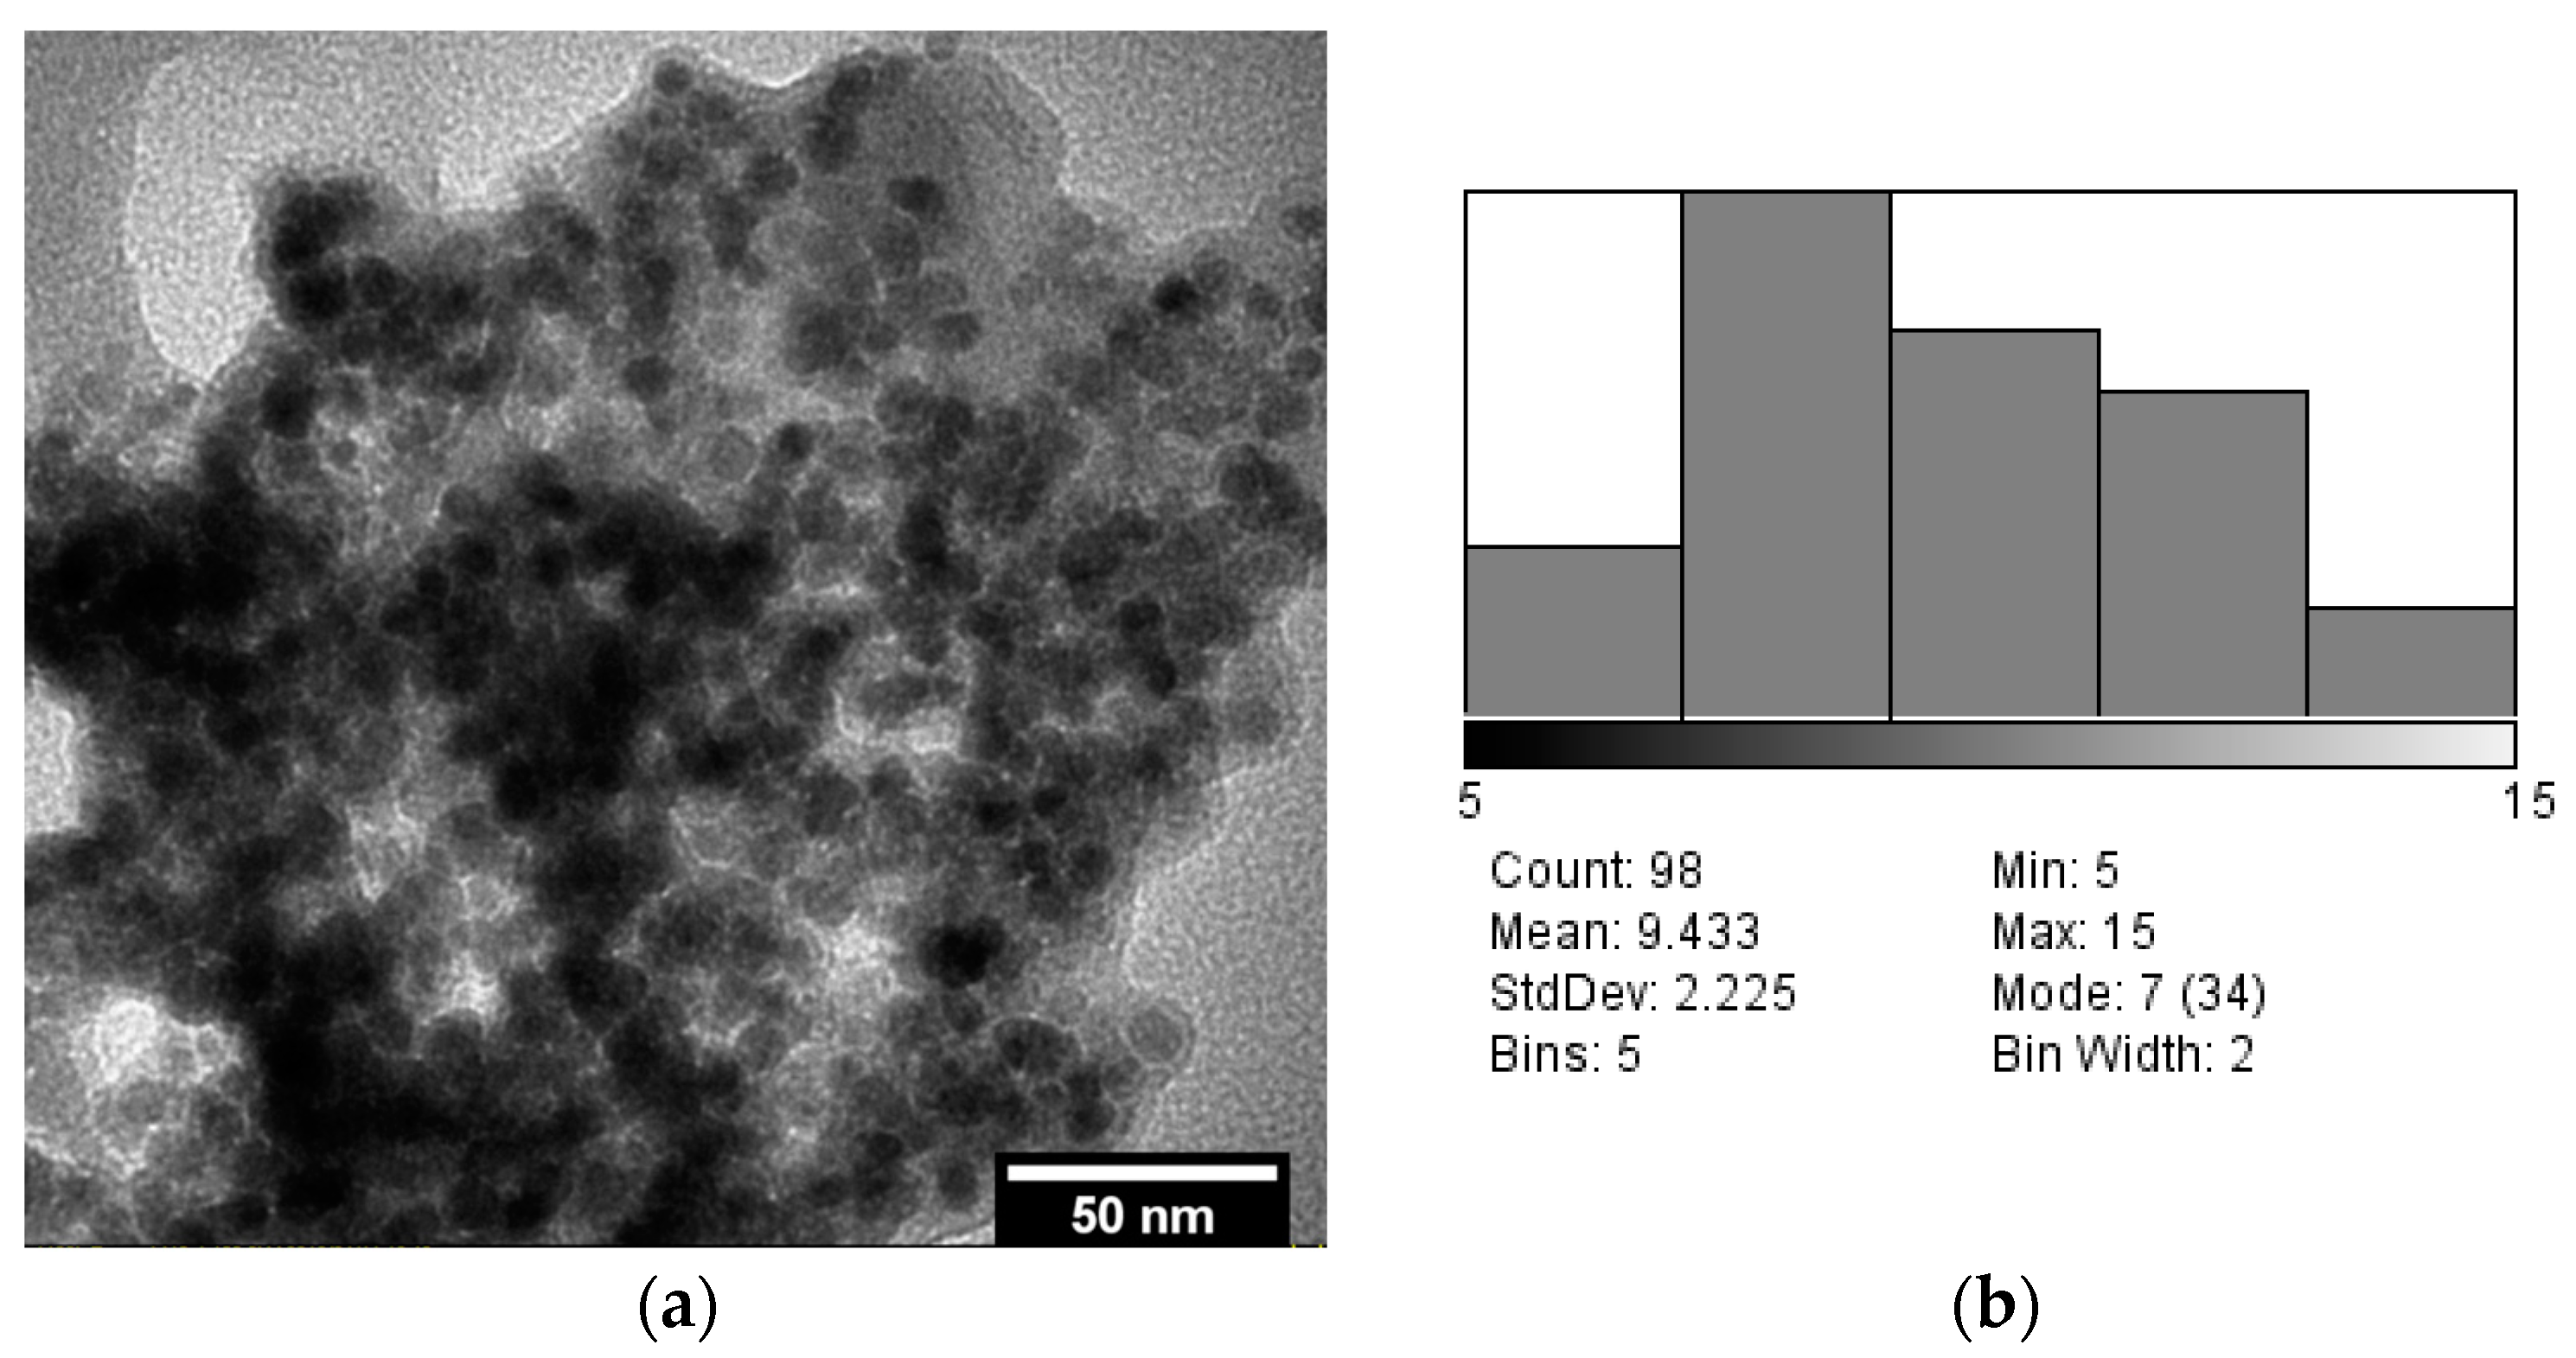
The obtained magnetite was characterized by X-ray diffraction (XRD) to verify the success of the synthesis process. X-ray diffraction is very useful for determining the qualitative phases of studied samples because all crystalline materials possess a characteristic “fingerprint”, determined by the size of the elementary cell and the numbers and positions of cations in the crystal lattice. The unequivocal identification of the crystalline phases present in the diffractograms was carried out according to the powder diffraction data collected in a database known as JCPDS (Joint Committee on Powder Diffraction Standards) [40]. The diffractogram recorded for the synthesized material is shown in Figure 2.
All diffraction maxima in Figure 2 can be identified and indexed according to JCPDS card no. 19-0629. Thus, the exclusive presence of maxima corresponding to planes (2 2 0), (3 1 1), (2 2 2), (4 0 0), (4 2 2), (5 1 1), and (4 4 0) is noted, with (6 2 0) and (5 3 3) confirming the formation of magnetite with a spinel-type structure. On the other hand, the narrow shape of the peaks indicates that the synthesized magnetite exhibited a very high degree of crystallinity.

3.3. TEM Analysis

Transmission electron microscopy (TEM) was used to characterize the magnetite that was obtained in order to determine the size of the particles and their morphology (Figure 3). The mean particle size and distribution were calculated by conducting a minimum of 100 measurements utilizing specialized software. It was initially observed that the largest particle size was 14.86 nm, which is suitable for coating applications, given the suggested maximum size of 20 nm, as stated in [30]. By examining the TEM images and the distribution of the particle sizes, it was determined that the magnetite nanoparticles had a mostly round shape, with a noticeable tendency to clump together, ranging in size from 5 to 15 nm, with an average size of 9.418 nm.
The TEM micrograph of the magnetite stabilized in citric acid is shown in Figure 4. There was a decrease in the degree of agglomeration due to dispersion in the tricarboxylic acid. It is obvious that the stabilization process did not influence the average size of the magnetic particles or the size distribution of the magnetic nanoparticles.
Ultimately, Figure 5 showcases the TEM examination of the magnetite modified with carboxymethylcellulose, emphasizing the proximity of the cellulose derivative to the inorganic part of the system. Similar to what was seen before, the magnetite particles’ size distribution and average size were unaffected by the functionalization with carboxymethylcellulose. The scattering of the magnetite particles is clearly visible despite the magnetite assemblies functionalized with carboxymethylcellulose appearing to be clustered together. Overall, the nano-assemblies obtained have smaller dimensions and greater uniformity compared to the similar assemblies obtained in [34,35,36,37,38], mostly because of the initial stabilization of magnetite in citric acid and improved control of the coprecipitation process parameters.

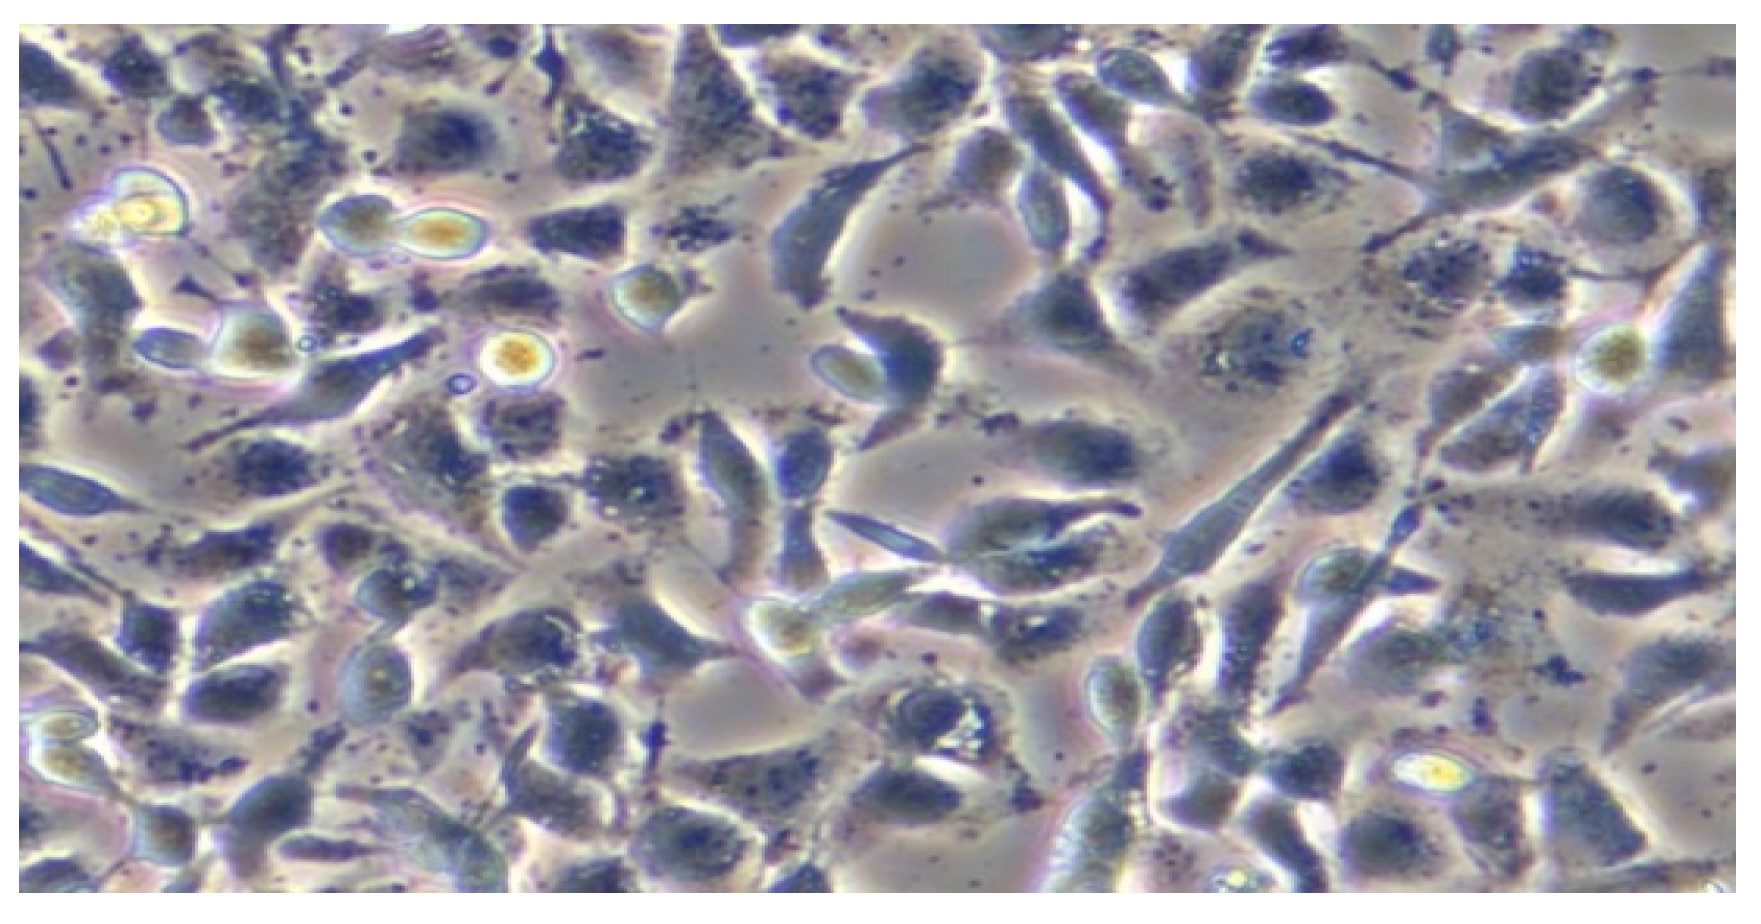
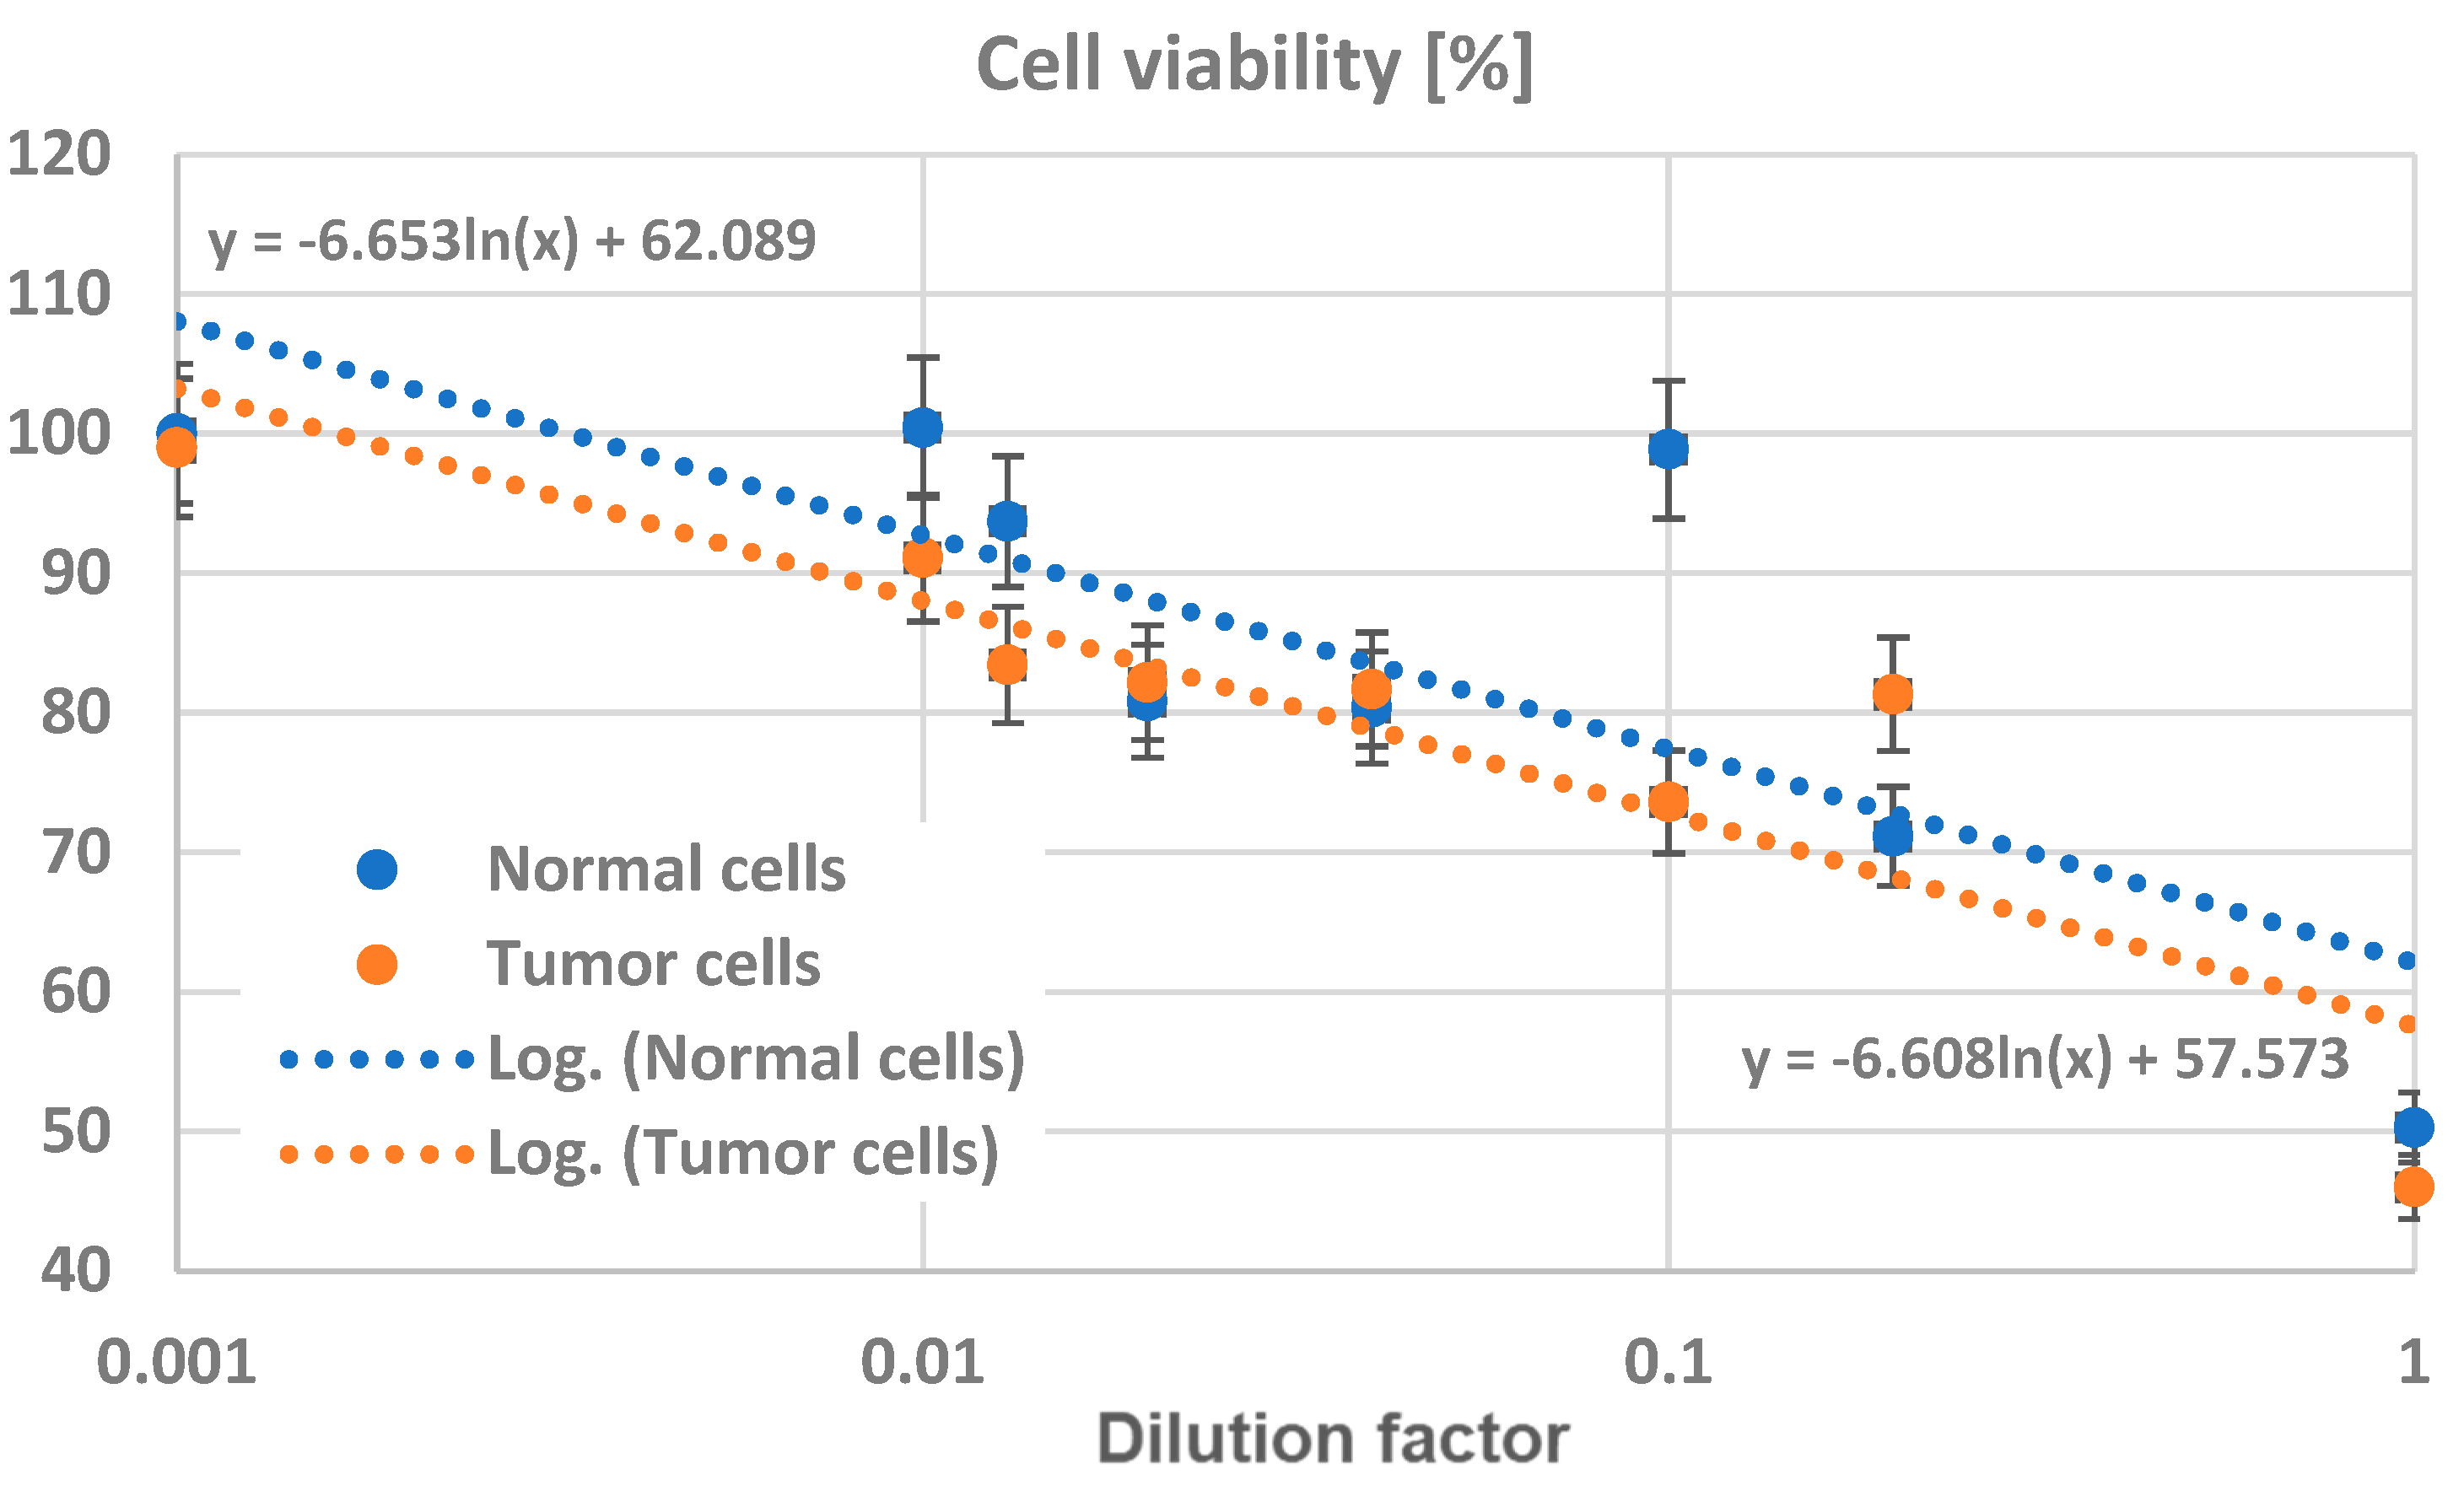
3.4. In Vitro Testing of Normal and Tumor Cells’ Survival and Viability in the Presence of Magnetite Nano-Assemblies

Two cell lines were used for testing the magnetite particles functionalized with carboxymethylcellulose: (1) the Vero cell line (normal cells, human gastric fibroblast cells, CRL-7869) and (2) AGS tumor cell line (human gastric adenocarcinoma cell line, CLS 300408). Both cell types were cultured in Dulbecco’s Modified Eagle Medium (DMEM, Biochrom AG, Berlin, Germany), supplemented with 10% fetal bovine serum (FBS, Biochrom AG, Germany), 100 μg/mL streptomycin (Biochrom AG, Germany), and 100 IU/mL penicillin (Biochrom AG, Germany). The cell cultures were then seeded in 24-well plates (10,000 cells/well), allowed to grow overnight, and maintained in a CO2 incubator at 37 °C. After the incubation period, the growth medium was removed, and the cells washed with PBS (phosphate-buffered saline). Following the removal of the initial medium and the washing of the cells, a fresh, complete DMEM medium, supplemented with functionalized magnetite–carboxymethylcellulose nanoparticles at consecutive dilutions of 1:1000, 1:100, 1:75, 1:50, 1:25, 1:10, 1:5, and 1:1, was added to the cells. The treatment duration was 24 h. The plates were initially examined using phase-contrast microscopy (Nikon TS2 inverted microscope, 200× magnification). The study concentrated on examining alterations in the cell shape and number and testing the nanoparticles’ compatibility with living tissue, as mentioned in references [41,42,43,44], for similar magnetite particles intended for medical applications. In order to maximize the effectiveness of particles as contrast agents, it is important to determine the smallest amount of dilution needed. In our research, a dilution ratio of 1:5 was identified based on the findings from both the in vitro and in vivo tests provided below. No significant changes in the cell morphology or density were noted, as shown in Figure 6 for the 1:5 dilution. It should be pointed out that the outcomes were comparable for greater dilutions.
The cell viability was assessed by the MTT (3-(4,5-dimethylthiazol-2-yl)-2,5-diphenyltetrazolium) assay. After the treatment time expired, the medium was discarded, and the cells were washed with PBS and overlaid with 100 µL of fresh complete medium. Then, 10 µL of MTT (5 mg/mL) was added to the medium, and the cells were incubated for 3 h. DMSO (dimethyl sulfoxide) was used to dissolve the formazan formed as a result of the metabolism of living cells, and their absorbance was recorded at 570 nm using a plate-reading spectrophotometer. The cell viability (%) was calculated using the following formula: % cell viability = sample [absorbance]/control [absorbance] × 100. The results are summarized in Figure 7. The experiments were performed in triplicate with similar results.
The number of nanoparticles in the cell medium affected the cell survival, with a significant drop in cell viability seen at higher concentrations, while the impact within the dilution range of 1:100–1:5 was deemed acceptable. Therefore, the 1:5 dilution was chosen as the maximum dilution for both achieving the optimal dispersion of nano-assemblies and ensuring an acceptable cell viability for conducting relevant in vivo tests in this particular case. These findings suggest that normal cells may have a slightly greater level of tolerance compared to tumor cells, most likely because they are better equipped to handle xenobiotic stressors. The presence of suitable tolerance of the modified nanoparticles in in vitro experiments implies a comparable lack of toxicity when administered to animals in experiments. It is important to consider that when it comes to cell cultures, exposure to nanoparticles occurs directly without any intermediary systems that can mitigate any negative effects caused by nanoparticles or their functionalizing agents in living organisms.

3.5. In Vivo Testing of the Toxicity and Action of Nano-Assemblies on Animal Model

Based on the results of the in vitro tests, in vivo tests were performed on an animal model. The contrast agents were administered in a single oral dose for exploration of the upper digestive tract, e.g., for diagnostic purposes. The assessment of the biocompatibility of the nanoparticles within the animal body consisted of the evaluation of acute systemic toxicity, considering that the tested nanoparticles would come into contact with different internal tissues. Before the experimental phase, the animals were acclimatized to their housing in clean and ventilated polyurethane cages. For 7 days before the start of the experiment, the animals were kept in standard temperature conditions (20 ± 4 °C), a light/dark cycle of 12 successive hours, and relative humidity 55 ± 10%. During the acclimatization period and, respectively, the experimental period, the animals received standard food and water ad libitum under laboratory conditions. To maintain cleanliness, the litter was freshly replaced every day or several times a day, depending on the need. A clinical welfare scoring system was developed. The experiment finally involved 3 separate cages with 18 animals in total. After acclimatization, the animals were weighed, randomly assigned to the 3 groups, and marked. Each batch consisted of 6 animals. All data related to the markings, allocation to the lots, and the weight of each animal were recorded in a special register. Each animal was taken out one by one, properly immobilized, and administered the appropriate solution with a volume of 0.3 mL/animal, calculated according to the individual body mass. Contrast agents were administered by gavage as a single dose with the optimum dilution limit of the nanoparticles considered after the in vitro tests (1:5). After each administration, the solution administered, the amount administered, the method of administration, and the time of administration were noted in the register for each individual animal. The animals were monitored for 96 h immediately following the administration to record any changes in their health status. The recording of food and water consumption was carried out with the help of metabolic cages in which the animals were housed for 24 h. At the end of this period, the weight of the animals and the consumption of food and water were recorded.
The experimental animals were evaluated from the point of view of their general state immediately after administration, as well as at different time intervals (30 min, and 1, 2, 4, 24, 48, and 96 h) to record and summarize any changes in their health status. The animals from the three cages were analyzed separately from a statistical viewpoint, and the results are similar. The results for 24 h (considered the critical period) are presented in Table 1 as the averages of all 18 animals.
Comparing the evaluation of the health status of the experimental animals at 24 h post-administration of the nanoparticles with the valence of the contrast agents for THz imaging with that of the animals in the control group did not reveal any significant changes, indicating very good biocompatibility. The results of further analyses are similar.

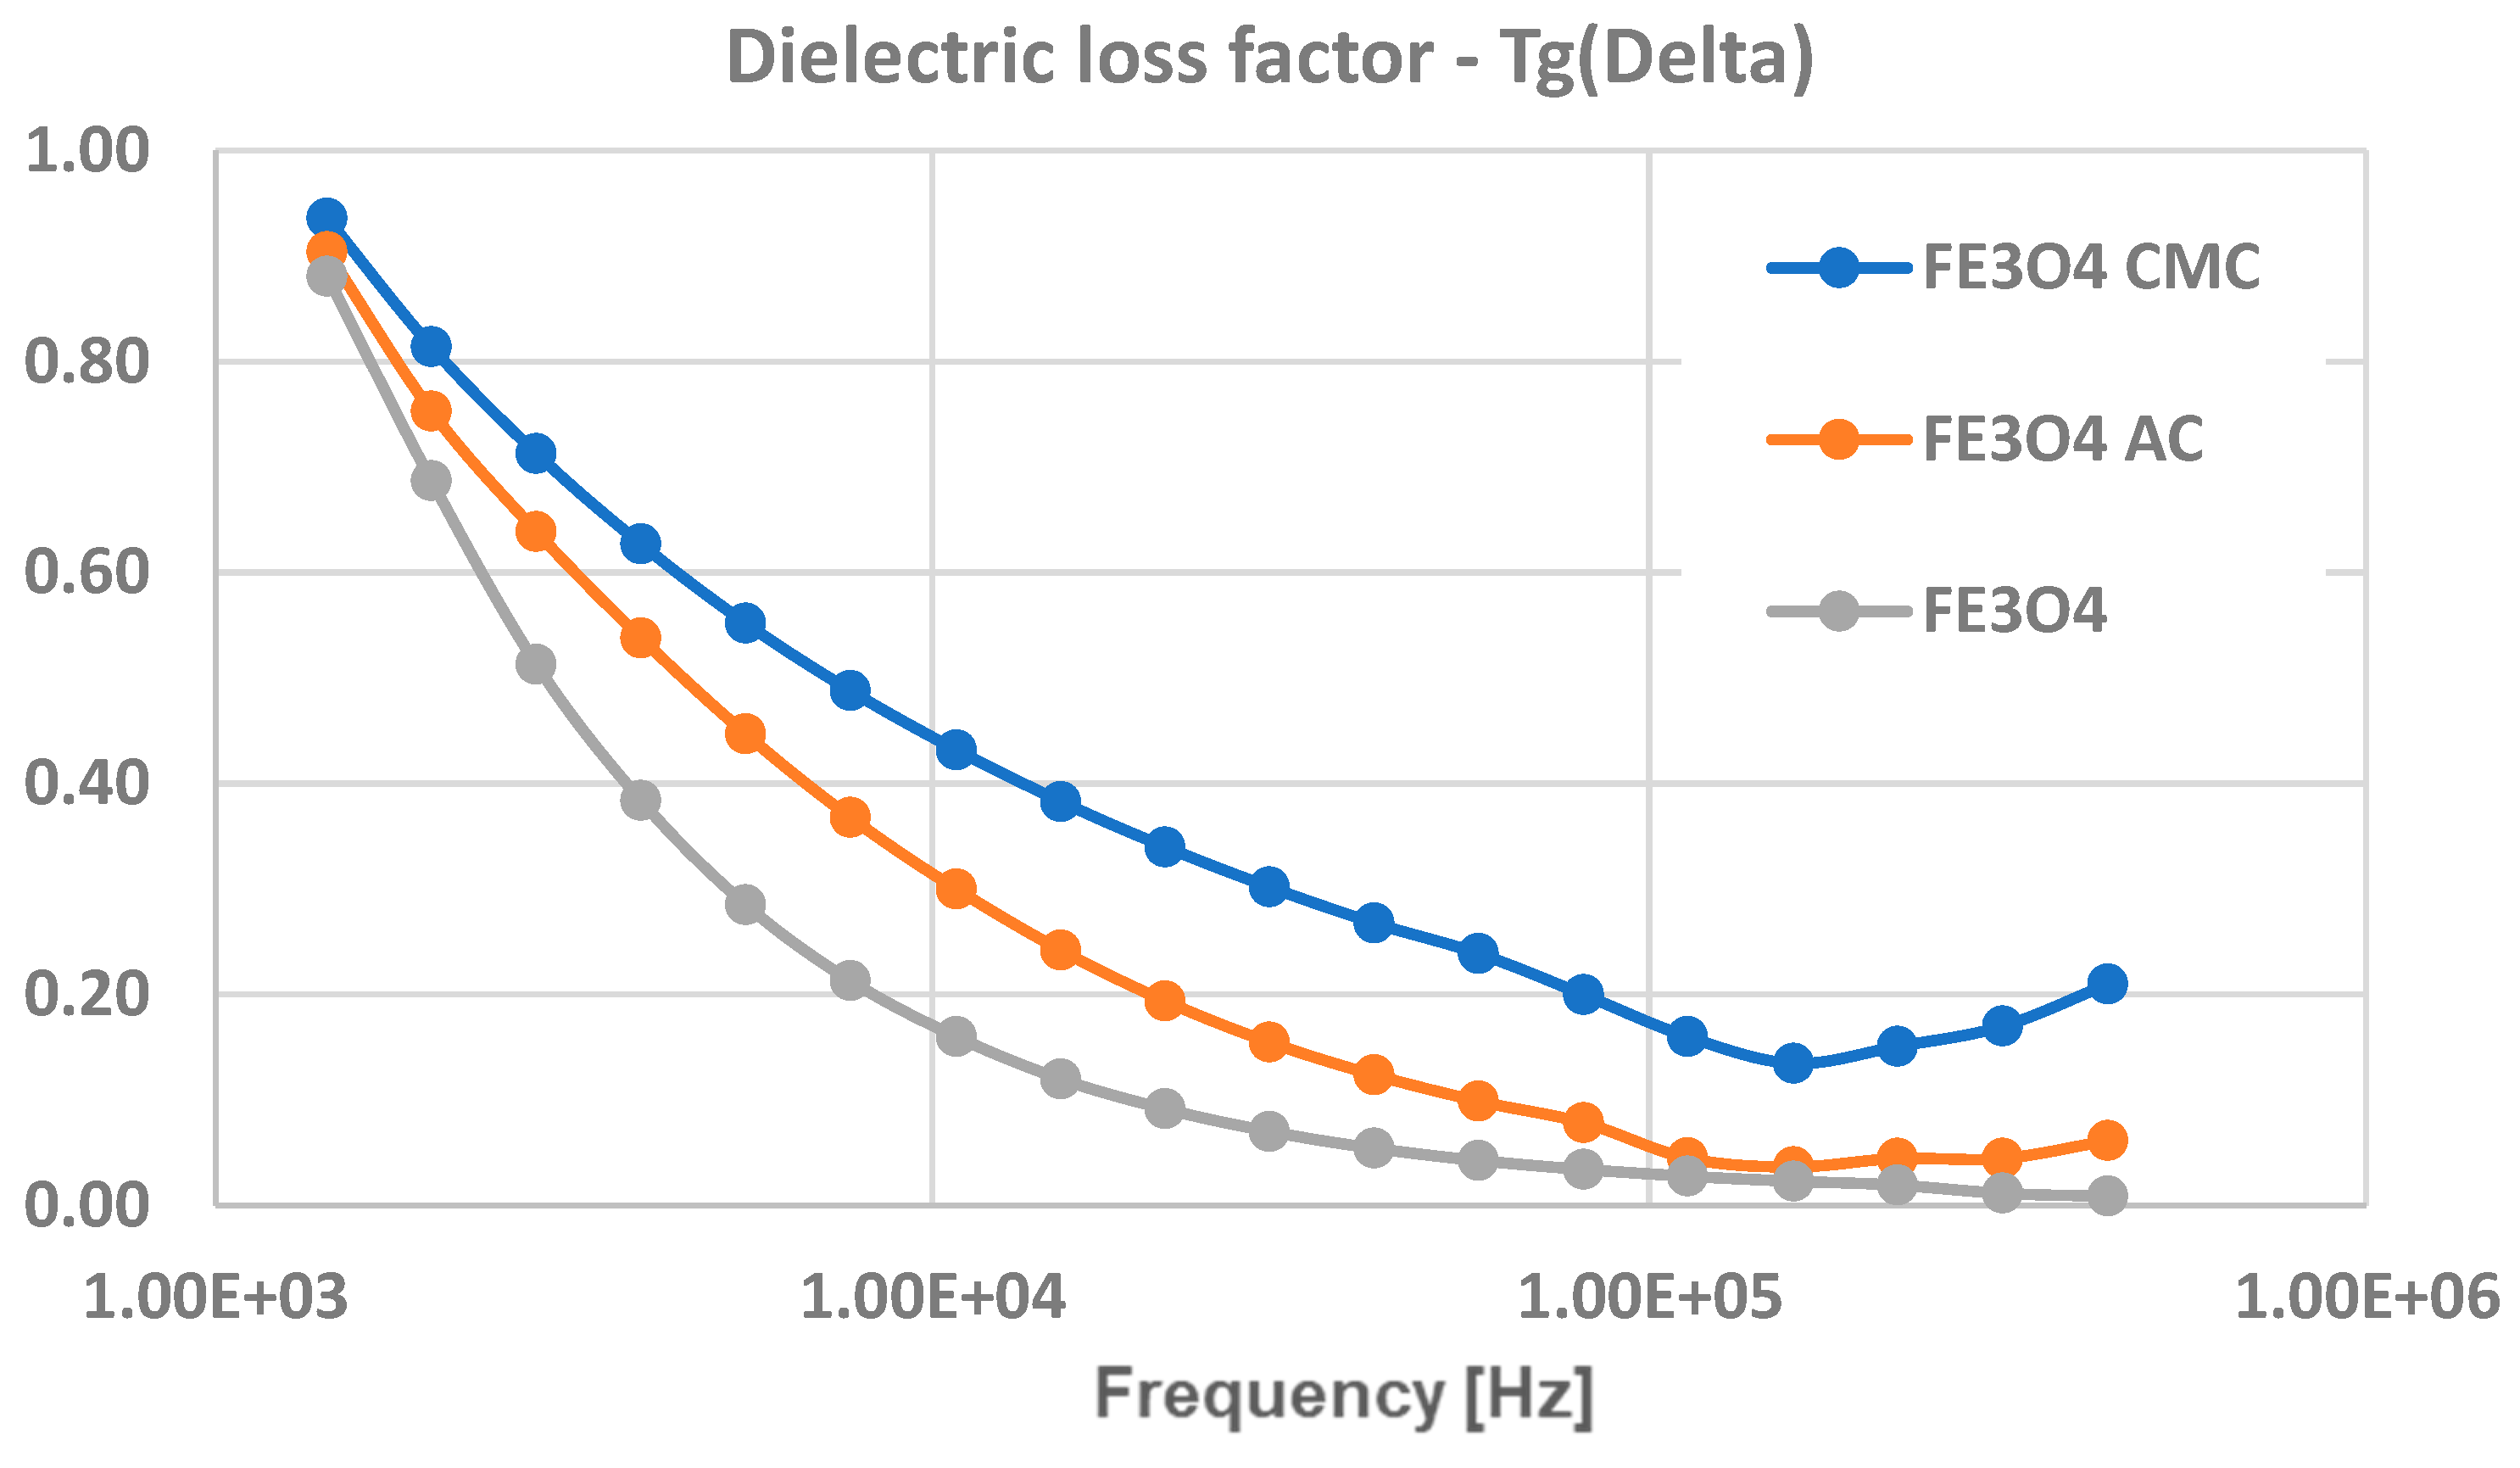
3.6. Dielectric Tests

The dielectric properties of the concentrated solutions of nanoparticles are presented in Figure 8 and Figure 9, to 1 MHz, which is the most relevant frequency for defining the polarization features. Regarding the relative dielectric permittivity, the high values can be seen in Figure 8, especially at lower frequencies, where interfacial polarization plays a relevant role for the activated magnetite samples. When the frequency increased, a normal decrease in the permittivity values was observed. The effect of additional dipolar polarization explains the higher permittivity of the magnetite functionalized with carboxymethylcellulose in all frequency domains.
The dielectric loss factor observations (Figure 9) agree with the dielectric permittivity results. Here, the interfacial polarization effect was obvious until 10 kHz, and after 100 kHz, the effect of dipolar polarization explains the higher values for magnetite functionalized with carboxymethylcellulose and the slight increase in dielectric loss at higher frequencies (over 100 kHz). In summary, the dielectric loss factor values were remarkably high, which is in fact a strong argument for the relevant activity of such assemblies in the electromagnetic field and a prerequisite for their potential use as contrast agents.

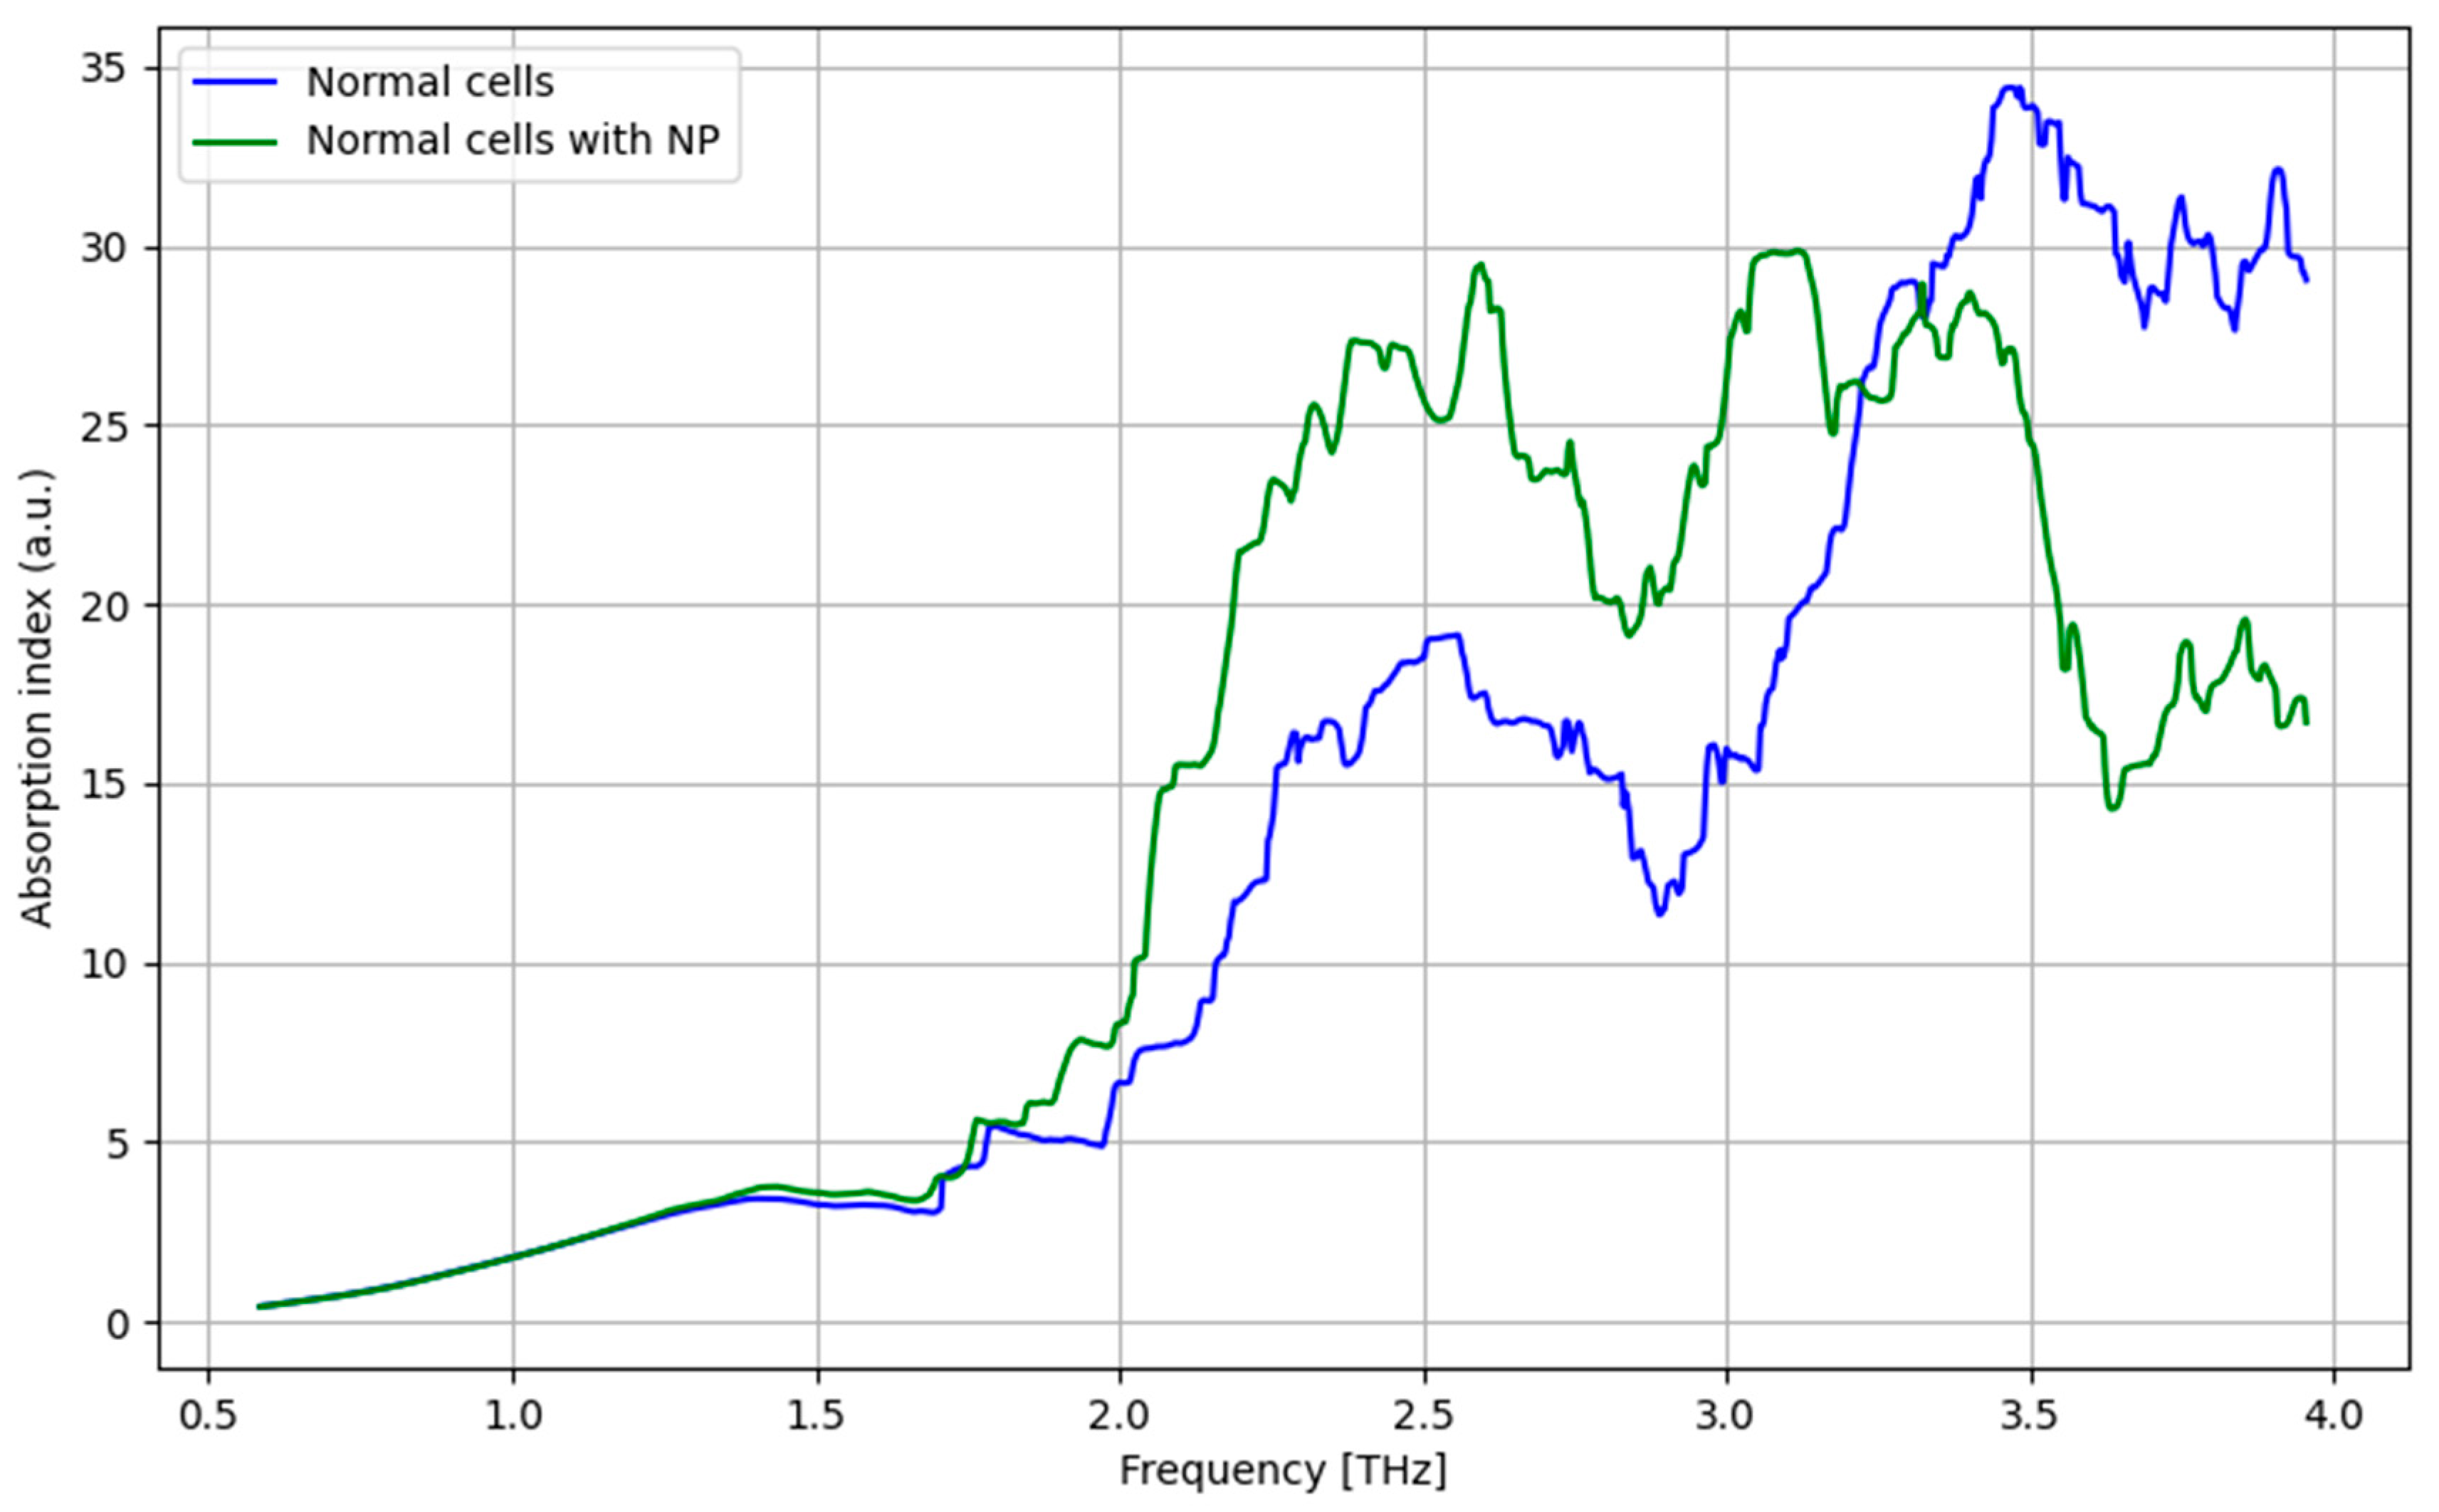
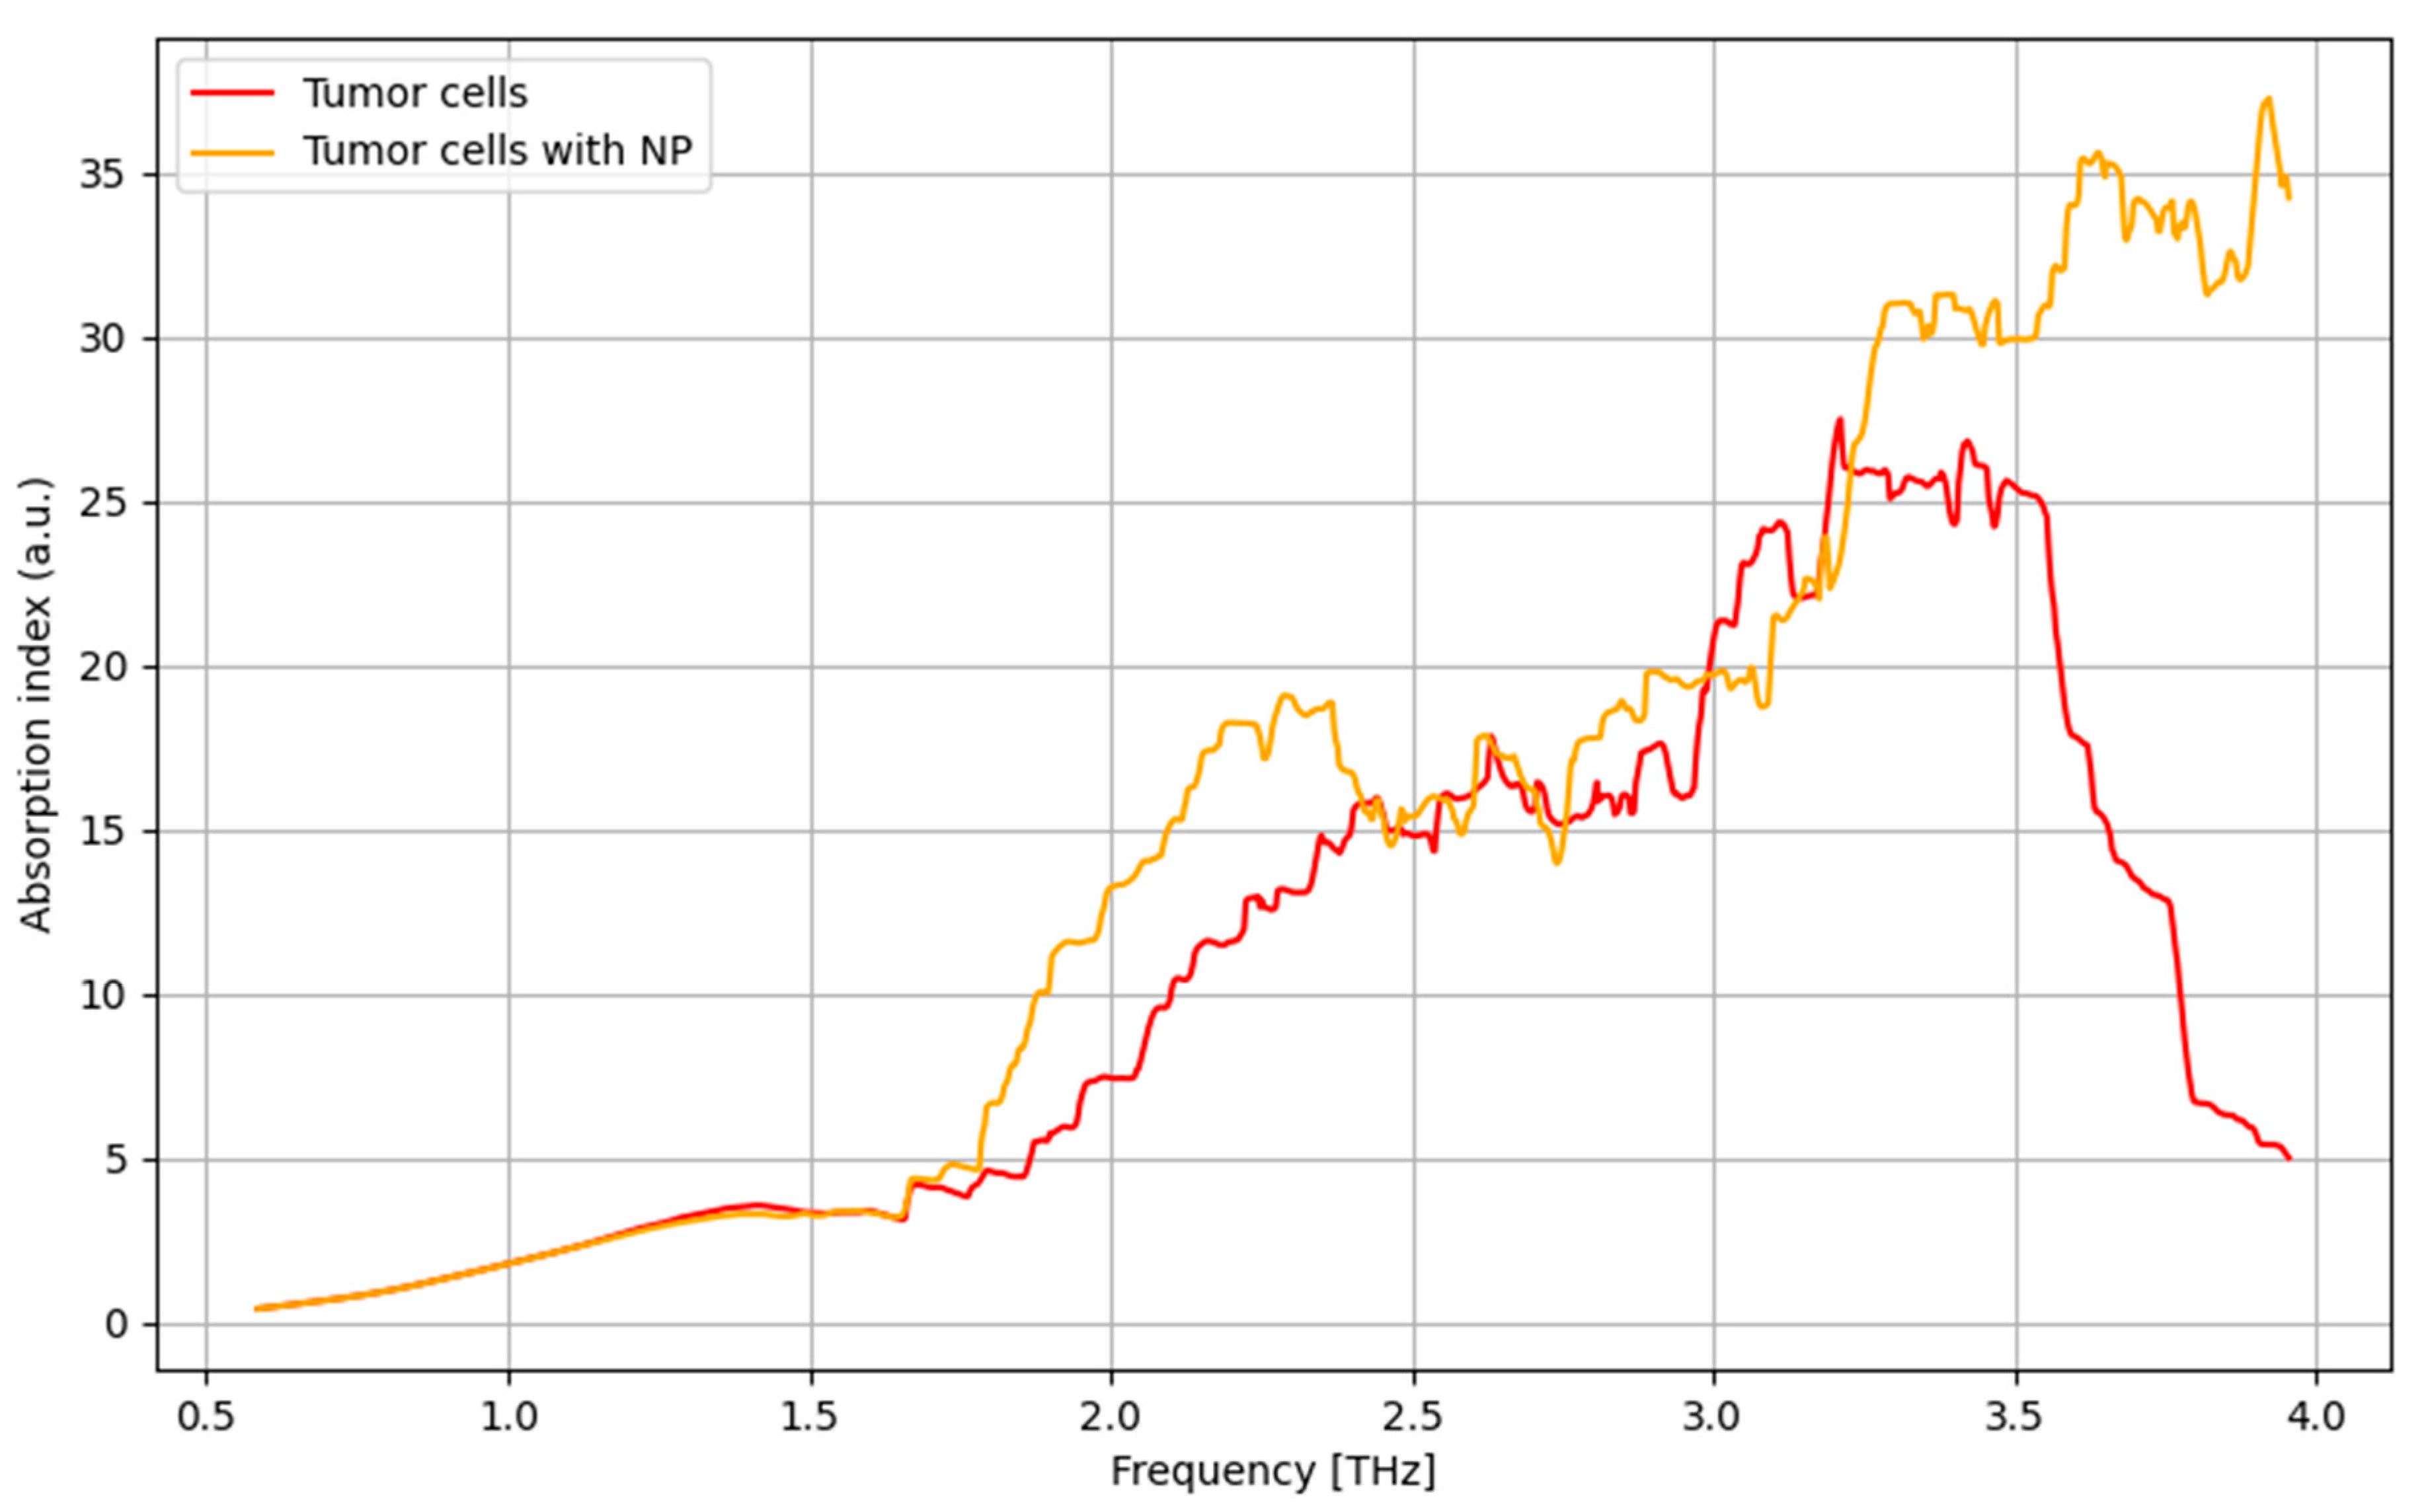
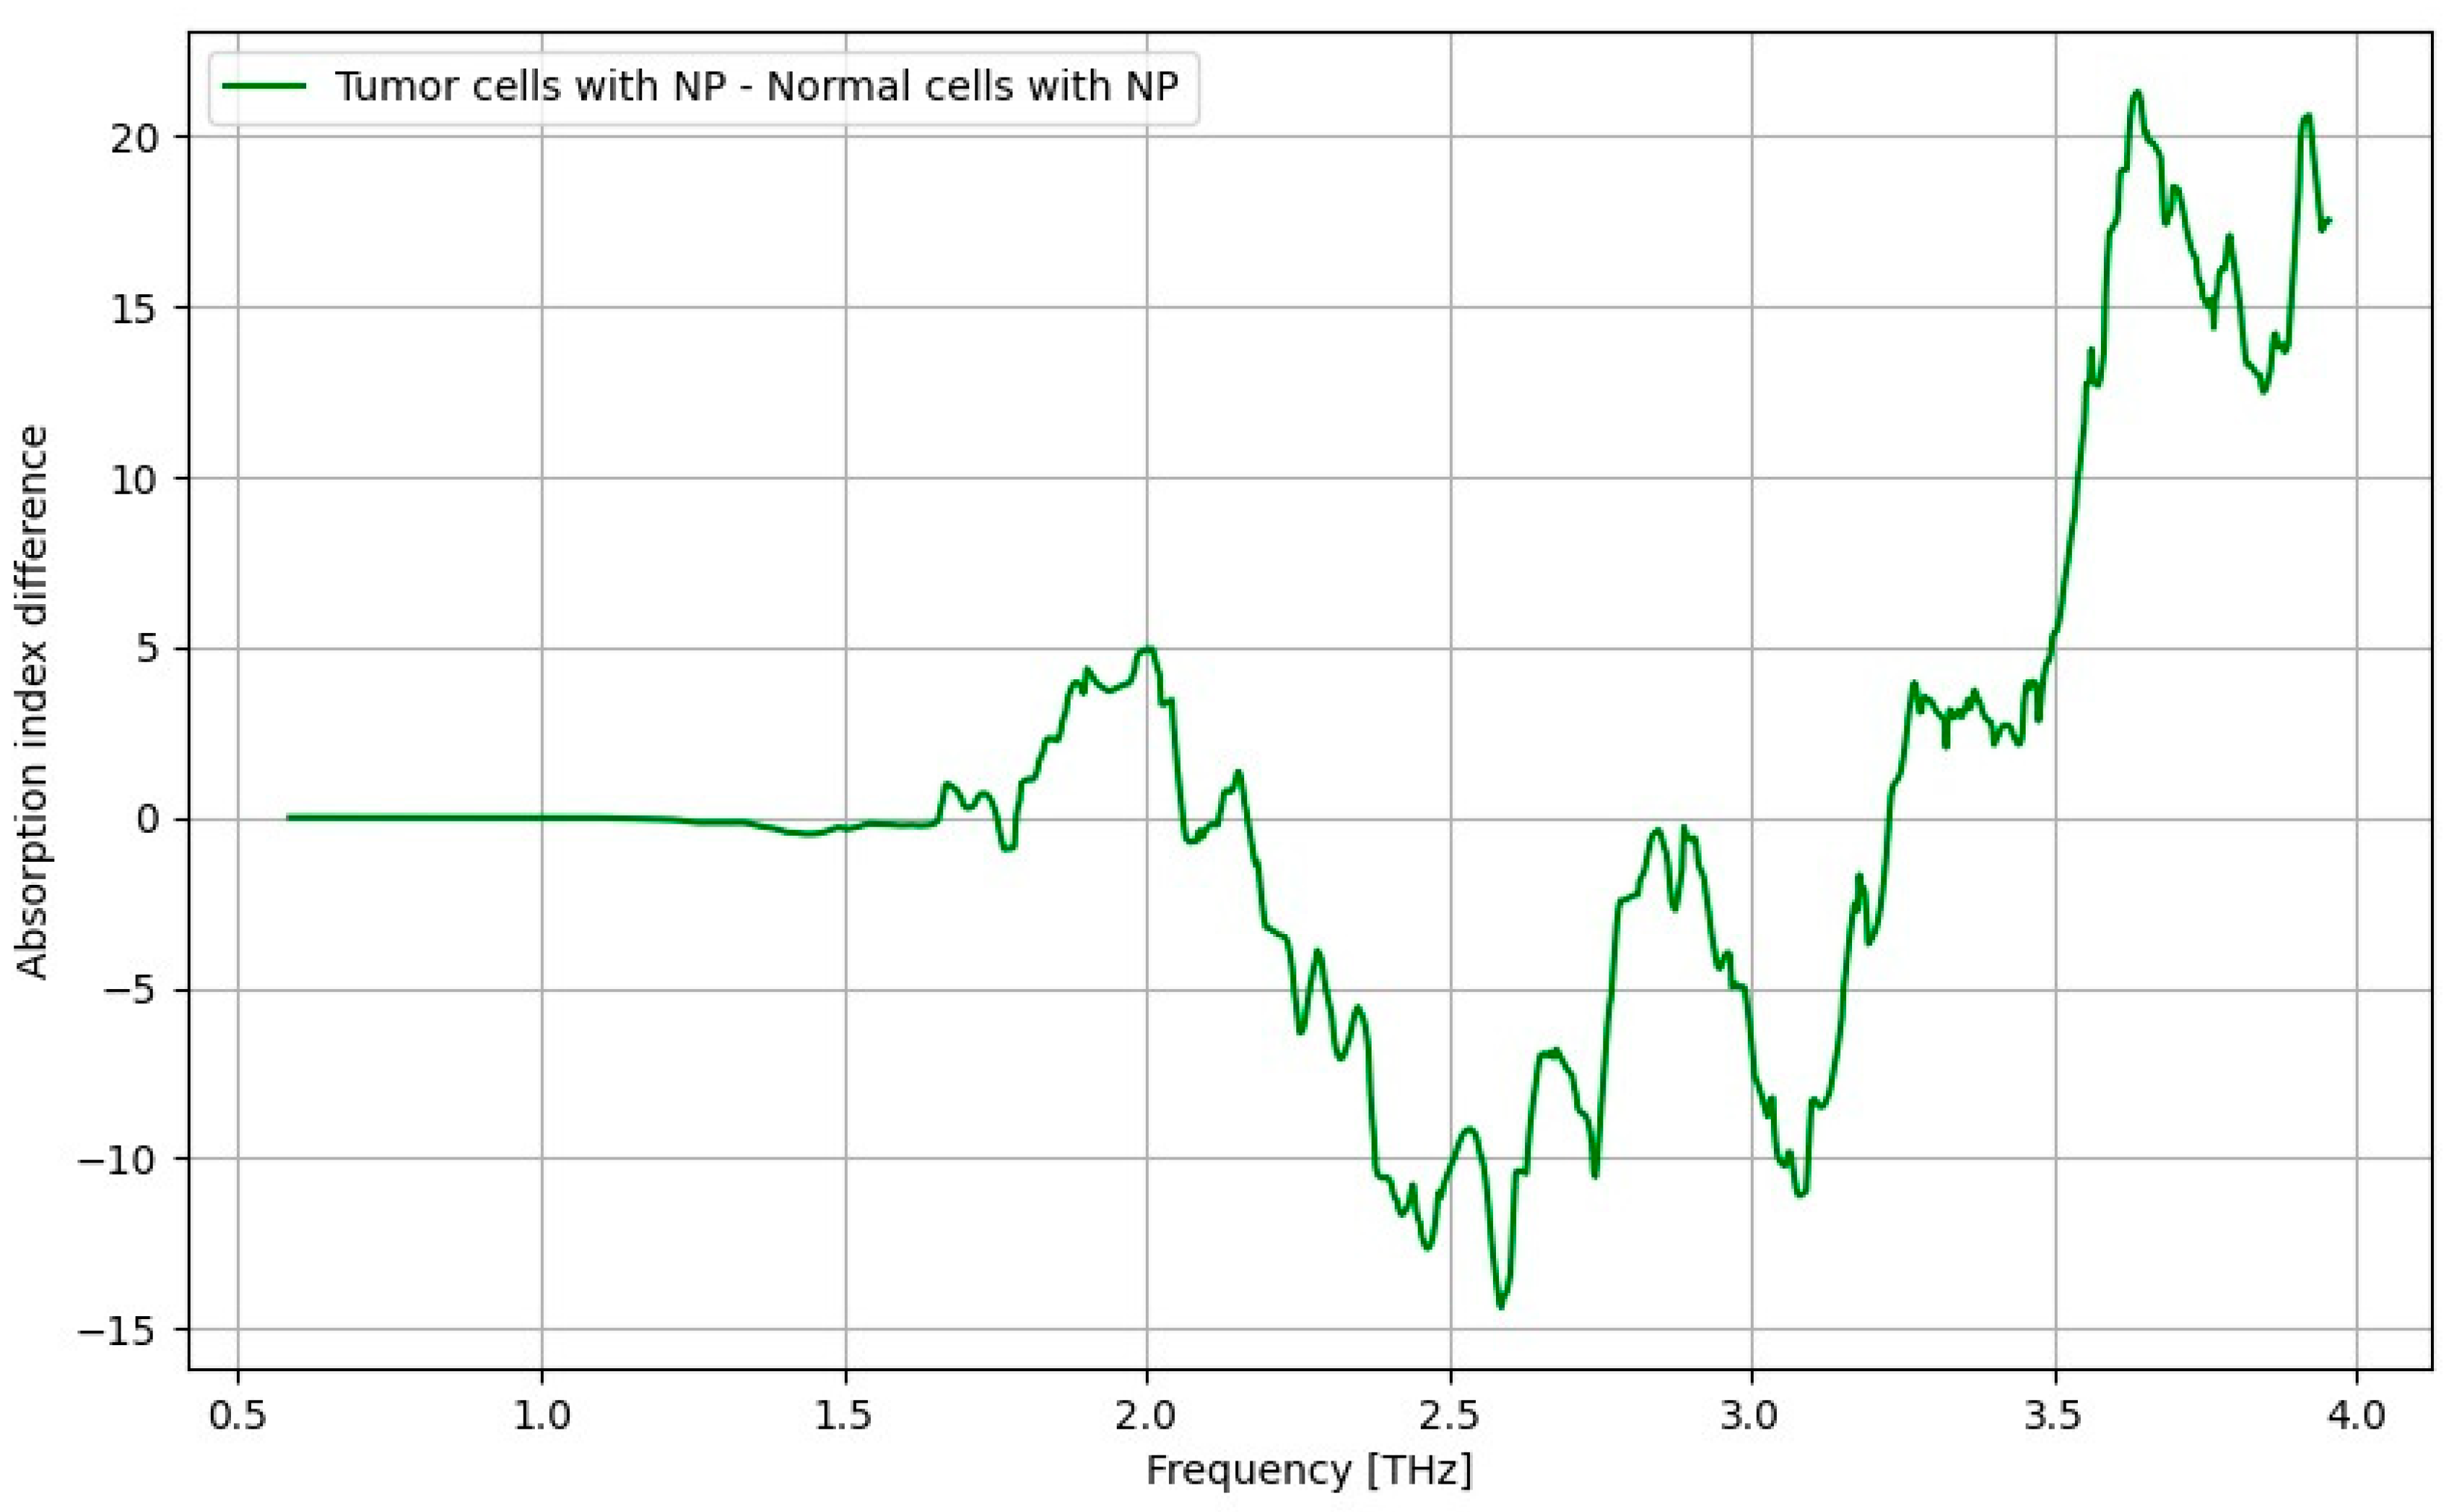
3.7. THz Spectroscopy Results

THz radiation is non-ionizing and associated with safe energy levels, and it has the potential to achieve high-resolution data related to cells or tissues, effectively combining both macroscopic and microscopic information. The procedural steps involved in the THz spectroscopy methodology up to 4 THz encompass the sample preparation for inclusion in the measurement cell, securing the measurement cell, device calibration, and subsequent data collection and processing, as illustrated in Figure 10 and detailed in [45].
The results of the THz spectroscopy analysis are presented vs. the applied frequency for a broader domain of 0.06–4 THz in Figure 11, Figure 12, Figure 13, Figure 14, Figure 15 and Figure 16 for normal cells and tumor cells, with and without the addition of nano-assemblies of magnetite functionalized with carboxymethylcellulose (marked as NP). As presented in Figure 11, no significant difference between the tumor and normal cells can be observed in the frequency domain up to 3.5 THz. Furthermore, the absorption behavior is disputable at the band limit. As presented in Figure 12 and Figure 13, a significant improvement in enhancing the signal or increasing the sensitivity for normal cells or tumor cells using contrast nanoparticles could not be achieved. Regarding normal cells, the addition of nanoparticles changed the signal values, and in tumor cells, the difference was practically imperceptible until the end of the THz band. However, as an indirect benefit of the addition of contrast agents, in the case of normal cells (Figure 12), a clear decrease in the signal was observed at over 3 THz, an aspect that is important if correlated with the significant increase in the signal for the same domain in tumor cells (Figure 13). In this case, the differences in the signals between the tumor and normal cells are extremely relevant, as discussed later. However, the last analysis that was necessary to carry out concerns how well the THz spectroscopic technique separates cancerous cells from normal cells when nanoparticles are present, as shown in Figure 14. Here, we are able to pinpoint a wider THz range, ranging from 3.2 THz to 4 THz, where variations in signal strength may become significant for our objectives.
Figure 15 and Figure 16 present the results of the analysis using the THz spectroscopy method with and without nanoparticle assistance. The analysis evaluated the signal difference, with the positive values being relevant. As can be observed in Figure 15, the signal difference was small and primarily occurred in the 2.8–3.2 THz domain, making it difficult to carry out a direct comparative examination of the tumor cells and normal cells. However, as Figure 16 shows, using nanoparticles can improve the direct comparison analysis between tumor and normal cells. The signal was amplified in the 3.2–4 THz range in this instance.
To verify the technique and/or the applicability of using the nanoparticles, it was first anticipated that the THz signal coming from cancer cells treated with contrast chemicals would be at least three times higher than that of normal cells treated with nanoparticles. Accordingly, comparing the signals in Figure 15 and Figure 16, we can see that the addition of magnetite functionalized with carboxymethylcellulose increases the signal by at least five times, making it possible to distinguish tumor cells from normal cells with more precision. However, the inclusion of nanoparticles changes the frequency range in which this kind of distinction is feasible (in our example, from 3 THz to 3.5 THz).
The most straightforward method for developing contrast agents specifically for THz spectroscopy is to evaluate and eventually chemically–physically modify existing medically approved and in-use contrast agents, such as those for MRI. This goal is aligned with the contrast agent that we have discussed in this paper. We anticipate that in the future, THz spectroscopy will be employed in specific narrow bands and that the effect of a particular contrast agent will be discovered in a particular narrow band, as long as all imagistic techniques remain effective in narrow bands. This is precisely the scenario that is detailed in this paper. It is evident that each type of contrast particle is relevant for a specific band in a wider THz domain—to be precisely identified—due to their chemical–physical parameters, which limit their absorption and/or transmission properties. However, achieving this goal without the use of specialized THz equipment is difficult. Nonetheless, we are confident that the creation of novel contrast agents and broadband THz equipment with endoscopic capabilities (as shown, for example, in [46,47]) will enable a significant advancement in clinical oncology.

4. Conclusions

The process for functionalizing magnetite with carboxymethylcellulose is described in this paper. It involves coprecipitation and preliminary stabilization of magnetite in citric acid. Physical analysis demonstrates that this process improves the nanoparticles’ dispersity and homogeneity, narrows their size distribution, and improves their interaction with carboxymethylcellulose. The average diameter of the nanoparticles is 10 nm.
Both the in vitro and in vivo biocompatibility tests were successfully completed by the magnetite assemblies.
As a need for their possible application as contrast agents, the measured values for the dielectric loss factor are impressively high, which is, in fact, a strong justification of the relevant activity of such assemblies in electromagnetic fields.
In order to distinguish cancer cells from normal cells in the presence of nanoparticles, the investigation of the THz spectroscopic method’s functionality focused on a wider THz domain, ranging from 3.2 THz to 4 THz, where the difference in signal intensity was significant. When carboxymethylcellulose-functionalized magnetite was added, the signal was at least five times stronger, making it possible to distinguish tumor cells more precisely from normal cells. However, the presence of nanoparticles changes the frequency range in which this kind of differentiation is possible.
We are confident that a significant advancement in clinical oncology will be made possible by the development of broadband THz equipment with endoscopic capabilities and innovative contrast agents.

Author Contributions

Conceptualization, O.D.S. and R.C.C.; methodology, R.C.C., O.D.S. and P.S.; validation, R.C.C., O.D.S. and D.S.; formal analysis, T.G.S., P.S., D.S. and O.D.S.; investigation, R.C.C., O.D.S., T.G.S., P.S. and D.S.; data curation, O.D.S., T.G.S., P.S. and D.S.; writing—original draft preparation, D.S. and R.C.C.; writing—review and editing, R.C.C. and O.D.S.; visualization, R.C.C. and T.G.S.; supervision, R.C.C. All authors have read and agreed to the published version of the manuscript.

Funding

This research received no external funding.

Data Availability Statement

Data are contained within the article.

Acknowledgments

The technical support for the in vitro and in vivo tests assured by CEMEX—the Center for Experimental Medicine of the University of Medicine and Pharmacy “Grigore T. Popa”, 700115 Iasi, Romania, is thankfully acknowledged.

Conflicts of Interest

The authors declare no conflicts of interest.

References

  1. Choi, K.S.; Suh, M. Screening for gastric cancer: The usefulness of endoscopy. Clin. Endosc. 2014, 47, 490–496. [Google Scholar] [CrossRef] [PubMed]
  2. Stomach Cancer Screening, 2023. Available online: https://www.cancer.gov/types/stomach/screening (accessed on 25 April 2024).
  3. Hibino, M.; Hamashima, C.; Iwata, M.; Terasawa, T. Radiographic and endoscopic screening to reduce gastric cancer mortality: A systematic review and meta-analysis. Lancet Reg. Health 2023, 35, 100741. [Google Scholar] [CrossRef] [PubMed]
  4. Mabe, K.; Inoue, K.; Kamada, T.; Kato, K.; Kato, M.; Haruma, K. Endoscopic screening for gastric cancer in Japan: Current status and future perspectives. Dig. Endosc. 2022, 34, 412–419. [Google Scholar] [CrossRef] [PubMed]
  5. Son, J.-H. Terahertz electromagnetic interactions with biological matter and their applications. J. Appl. Phys. 2009, 105, 102033. [Google Scholar] [CrossRef]
  6. Parrott, E.P.; Sy, S.M.Y.; Blu, T.; Wallace, V.P.; Pickwell-Macpherson, E. Terahertz pulsed imaging in vivo: Measurements and processing methods. J. Biomed. Opt. 2011, 16, 106010. [Google Scholar] [CrossRef] [PubMed]
  7. Yang, X.; Zhao, X.; Yang, K.; Liu, Y.; Liu, Y.; Fu, W.; Luo, Y. Biomedical Applications of Terahertz Spectroscopy and Imaging. Trends Biotechnol. 2016, 34, 810–824. [Google Scholar] [CrossRef]
  8. Yu, C.; Fan, S.; Sun, Y.; Pickwell-MacPherson, E. The potential of terahertz imaging for cancer diagnosis: A review of investigations to date. Quant. Imaging Med. Surg. 2012, 2, 33. [Google Scholar]
  9. Oh, S.J.; Huh, Y.M.; Suh, J.S.; Choi, J.; Haam, S.; Son, J.H. Cancer Diagnosis by Terahertz Molecular Imaging Technique. J. Infrared Millim. Terahertz Waves 2012, 33, 74–81. [Google Scholar] [CrossRef]
  10. Li, H.; Zhang, K.; Zhou, Q.; Mao, W.; Dong, P.; Tian, F. Case Report: Terahertz spectroscopy for cancer diagnosis. Int. J. Clin. Exp. Med. 2017, 10, 3766–3773. [Google Scholar]
  11. Oh, S.J.; Choi, J.; Maeng, I.; Park, J.Y.; Lee, K.; Huh, Y.-M.; Suh, J.-S.; Haam, S.; Son, J.-H. Molecular imaging with terahertz waves. Opt. Express 2011, 19, 4009–4016. [Google Scholar] [CrossRef]
  12. Doradla, P.; Alavi, K.; Joseph, C.; Giles, R. Detection of colon cancer by continuous-wave terahertz polarization imaging technique. J. Biomed. Opt. 2013, 18, 090504. [Google Scholar] [CrossRef]
  13. Chen, H.; Ma, S.; Wu, X.; Yang, W.; Zhao, T. Diagnose human colonic tissues by terahertz near-field imaging. J. Biomed. Opt. 2015, 20, 036017. [Google Scholar] [CrossRef] [PubMed]
  14. Terahertz Imaging Advances Toward Medical Diagnostics, 2022. Available online: https://www.laserfocusworld.com/test-measurement/article/14235398/terahertz-imaging-advances-toward-medical-diagnostics (accessed on 25 April 2024).
  15. Shi, S.; Yuan, S.; Zhou, J.; Jiang, P. Terahertz technology and its applications in head and neck diseases. iScience 2023, 26, 107060. [Google Scholar] [CrossRef] [PubMed]
  16. Gezimati, M.; Singh, G. Terahertz imaging technology for localization of cancer tumors: A technical review. Multimed. Tools Appl. 2024, 83, 33675–33711. [Google Scholar] [CrossRef]
  17. Hellebust, A.; Richards-Kortum, R. Advances in molecular imaging: Targeted optical contrast agents for cancer diagnostics. Nanomedicine 2012, 7, 429–445. [Google Scholar] [CrossRef] [PubMed]
  18. Oh, S.J.; Maeng, I.; Shin, H.J.; Lee, J.; Kang, J.; Haam, S.; Huh, Y.M.; Suh, J.; Son, J.H. Nanoparticle contrast agents for Terahertz medical imaging. In Proceedings of the 33rd International Conference on Millimeter and Terahertz Waves, Pasadena, CA, USA, 15–19 September 2008. [Google Scholar]
  19. Oh, S.J.; Kang, J.; Maeng, I.; Suh, J.-S.; Huh, Y.-M.; Haam, S.; Son, J.-H. Nanoparticle-enabled Terahertz Imaging for Cancer Diagnosis. Opt. Express 2009, 17, 3469–3475. [Google Scholar] [CrossRef]
  20. Stylianou, A.; Talias, M.A. Nanotechnology-supported THz medical imaging. F1000Research 2013, 2, 100. [Google Scholar] [CrossRef] [PubMed]
  21. Yousaf, M.Z.; Yu, J.; Hou, Y.L.; Gao, S. Magnetic nanoparticle-based cancer nanodiagnostics. Chin. Phys. B 2013, 22, 058702. [Google Scholar]
  22. Lee, J.; Yang, J.; Ko, H.; Oh, S.; Kang, J.; Son, J.; Lee, K.; Lee, S.W.; Yoon, H.G.; Suh, J.S.; et al. Multifunctional magnetic gold nanocomposites: Human epithelial cancer detection via magnetic resonance imaging and localized synchronous therapy. Adv. Funct. Mater. 2008, 18, 258–264. [Google Scholar] [CrossRef]
  23. Sadeghi, A.; Naghavi, S.M.H.; Mozafari, M.; Afshari, E. Nanoscale biomaterials for terahertz imaging: A non-invasive approach for early cancer detection. Transl. Oncol. 2023, 27, 101565. [Google Scholar] [CrossRef]
  24. Sadeghi, L.; Espanani, H.R. Toxic effects of the Fe2O3 nanoparticles on the liver and lung tissue. Bratisl. Lek. Listy 2015, 116, 373–378. [Google Scholar] [CrossRef] [PubMed]
  25. Tanasa, E.; Zaharia, C.; Hudita, A.; Radu, I.-C.; Costache, M.; Galateanu, B. Impact of the magnetic field on 3T3-E1 preosteoblasts inside SMART silk fibroin-based scaffolds decorated with magnetic nanoparticles. Mater. Sci. Eng. C 2020, 110, 110714. [Google Scholar] [CrossRef] [PubMed]
  26. Wang, C.; Wang, X.; Yu, J.; Liu, Y.; Dai, W.; Li, J.; Tao, J.; Tian, W. Optical tuning of absorption coefficient and dielectric properties of amorphous Cu doped α-Fe2O3 in the THz range. Mater. Res. Express 2019, 6, 105204. [Google Scholar] [CrossRef]
  27. Kandasamy, G.; Maity, D. Recent advances in superparamagnetic iron oxide nanoparticles (SPIONs) for in vitro and in vivo cancer nanotheranostics. Int. J. Pharm. 2015, 496, 191–218. [Google Scholar] [CrossRef] [PubMed]
  28. Gulzar, A.; Ayoub, N.; Mir, J.F.; Alanazi, A.M.; Shah, M.A.; Gulzar, A. In vitro and in vivo MRI imaging and photothermal therapeutic properties of Hematite (α-Fe2O3) Nanorods. J. Mater. Sci. Mater. Med. 2022, 33, 10. [Google Scholar] [CrossRef] [PubMed]
  29. Du, H.; Akakuru, O.U.; Yao, C.; Yang, F.; Wu, A. Transition metal ion-doped ferrites nanoparticles for bioimaging and cancer therapy. Transl. Oncol. 2022, 15, 101264. [Google Scholar] [CrossRef] [PubMed]
  30. Marashdeh, M.W.; Ababneh, B.; Lemine, O.M.; Alsadig, A.; Omri, K.; El Mir, L.; Sulieman, A.; Mattar, E. The significant effect of size and concentrations of iron oxide nanoparticles on magnetic resonance imaging contrast enhancement. Results Phys. 2019, 15, 102651. [Google Scholar] [CrossRef]
  31. Zhang, C.H.; Zhao, G.F.; Jin, B.B.; Hou, Y.Y.; Jia, H.H.; Chen, J.; Wu, P.H. Terahertz Imaging on Subcutaneous Tissues and Liver Inflamed by Liver Cancer Cells. Terahertz Sci. Technol. 2012, 5, 114–123. [Google Scholar]
  32. Fitzgerald, A.J.; Wallace, V.P.; Jimenez-Linan, M.; Bobrow, L.; Pye, R.J.; Purushotham, A.D.; Arnone, D.D. Terahertz pulsed imaging of human breast tumor. Radiology 2006, 2, 3533–3540. [Google Scholar] [CrossRef]
  33. Chen, H.; Chen, T.H.; Tseng, T.F.; Lu, J.T.; Kuo, C.C.; Fu, S.C.; Lee, W.J.; Tsai, Y.F.; Huang, Y.Y.; Chuang, E.Y.; et al. High-sensitivity in vivo THz transmission imaging of early human breast cancer in a subcutaneous xenograft mouse model. Opt. Express 2011, 19, 21552–21562. [Google Scholar] [CrossRef]
  34. Jung, E.A.; Lim, M.H.; Moon, K.W.; Do, Y.W.; Lee, S.S.; Han, H.W.; Choi, H.J.; Cho, K.S.; Kim, K.R. Terahertz Pulse Imaging of Micrometastatic Lymph Nodes in Early-stage Cervical Cancer Patients. J. Opt. Soc. Korea 2011, 15, 155–160. [Google Scholar] [CrossRef]
  35. Lee, D.K.; Kim, H.; Kim, T.; Cho, B.; Lee, K.; Son, J.H. Characteristics of Gadolinium Oxide Nanoparticles as Contrast Agents for Terahertz Imaging. J. Infrared Millim. Terahertz Waves 2011, 32, 506–512. [Google Scholar] [CrossRef]
  36. Habibi, N. Preparation of biocompatible magnetite-carboxymethyl cellulose nanocomposite: Characterization of nanocomposite by FTIR, XRD, FESEM and TEM. Spectrochim. Acta Part A Mol. Biomol. Spectrosc. 2014, 131, 55–58. [Google Scholar] [CrossRef] [PubMed]
  37. Vijayasree, V.P.; Manan, N.S.A. Magnetite carboxymethylcellulose as biological macromolecule-based absorbent for cationic dyes removal from environmental samples. Int. J. Biol. Macromol. 2023, 242, 124723. [Google Scholar] [CrossRef] [PubMed]
  38. Aguilera, G.; Berry, C.C.; West, R.M.; Gonzalez-Monterrubio, E.; Angulo-Molina, A.; Arias-Carrión, Ó.; Méndez-Rojas, M.Á. Carboxymethyl cellulose coated magnetic nanoparticles transport across a human lung microvascular endothelial cell model of the blood–brain barrier. Nanoscale Adv. 2019, 1, 671–685. [Google Scholar] [CrossRef] [PubMed]
  39. Al-Madhagi, H.; Yazbik, V.; Abdelwahed, W.; Alchab, L. Magnetite Nanoparticle Co-precipitation Synthesis, Characterization, and Applications: Mini Review. Bionanoscience 2023, 13, 853–859. [Google Scholar] [CrossRef]
  40. Joint Committee on Powder Diffraction Standards. Available online: https://pubs.acs.org/doi/10.1021/ac60293a779 (accessed on 6 July 2024).
  41. Reddy, L.H.; Arias, J.L.; Nicolas, J.; Couvreur, P. Magnetic nanoparticles: Design and characterization, toxicity and biocompatibility, pharmaceutical and biomedical applications. Chem. Rev. 2012, 112, 5818–5878. [Google Scholar] [CrossRef] [PubMed]
  42. Markides, H.; Rotherham, M.; El Haj, A. Biocompatibility and toxicity of magnetic nanoparticles in regenerative medicine. J. Nanomater. 2012, 2012, 614094. [Google Scholar] [CrossRef]
  43. Souza, D.M.; Andrade, A.L.; Fabris, J.D.; Valério, P.; Góes, A.M.; Leite, M.F.; Domingues, R.Z. Synthesis and in vitro evaluation of toxicity of silica-coated magnetite nanoparticles. J. Non-Cryst. Solids 2008, 354, 4894–4897. [Google Scholar] [CrossRef]
  44. Häfeli, U.O.; Riffle, J.S.; Harris-Shekhawat, L.; Carmichael-Baranauskas, A.; Mark, F.; Dailey, J.P. Cell uptake and in vitro toxicity of magnetic nanoparticles suitable for drug delivery. Mol. Pharm. 2009, 6, 1417–1428. [Google Scholar] [CrossRef]
  45. Schreiner, O.D.; Socotar, D.; Ciobanu, R.C.; Schreiner, T.G.; Tamba, B.I. Statistical Analysis of Gastric Cancer Cells Response to Broadband Terahertz Radiation with and without Contrast Nanoparticles. Cancers 2024, 16, 2454. [Google Scholar] [CrossRef] [PubMed]
  46. Kucheryavenko, A.S.; Zhelnov, V.A.; Melikyants, D.G.; Chernomyrdin, N.V.; Lebedev, S.P.; Bukin, V.V.; Garnov, S.V.; Kurlov, V.N.; Zaytsev, K.I.; Katyba, G.M. Super-resolution THz endoscope based on a hollow-core sapphire waveguide and a solid immersion lens. Opt. Express 2023, 31, 13366–13373. [Google Scholar] [CrossRef] [PubMed]
  47. Zhang, X. Discussion on the Possibility of Using Terahertz Enhanced Endoscope to Detect Early-Stage Cancer. Available online: https://papers.ssrn.com/sol3/papers.cfm?abstract_id=4679748 (accessed on 6 July 2024).
Figure 1. Experimental assembly for the synthesis of magnetite.
Crystals 14 00696 g001
Figure 2. X-ray diffractogram recorded for magnetite/Fe3O4.
Crystals 14 00696 g002
Figure 3. (a) TEM micrograph of magnetite; (b) size distribution of magnetite particles.
Crystals 14 00696 g003
Figure 4. (a) TEM micrograph of magnetite stabilized in citric acid; (b) size distribution of magnetite particles stabilized in citric acid.
Crystals 14 00696 g004
Figure 5. (a) TEM micrograph of magnetite functionalized with carboxymethylcellulose; (b) size distribution of magnetite particles functionalized with carboxymethylcellulose.
Crystals 14 00696 g005
Figure 6. Morphology of cells treated with nanoparticles (diluted 1:5 in DMEM).
Crystals 14 00696 g006
Figure 7. Normal and tumor cells’ survival and viability.
Crystals 14 00696 g007
Figure 8. Dielectric permittivity analysis for magnetite assemblies.
Crystals 14 00696 g008
Figure 9. Dielectric loss factor analysis for magnetite assemblies.
Crystals 14 00696 g009
Figure 10. Operational stages of spectroscopy in the THz field.
Crystals 14 00696 g010
Figure 11. Absorption characteristics of tumor cells and normal cells.
Crystals 14 00696 g011
Figure 12. Absorption characteristics of normal cells and normal cells with nanoparticles.
Crystals 14 00696 g012
Figure 13. Absorption characteristics of tumor cells and tumor cells with nanoparticles.
Crystals 14 00696 g013
Figure 14. Absorption characteristics of normal cells with nanoparticles and tumor cells with nanoparticles.
Crystals 14 00696 g014
Figure 15. Signal difference between tumor cells and normal cells, without nanoparticle addition.
Crystals 14 00696 g015
Figure 16. Signal difference between tumor cells and normal cells, with nanoparticle addition.
Crystals 14 00696 g016
Table 1. Recorded values for body weight and food and water consumption.
Reference LotAdministrated Fe3O4/CMC Lot
Animal Weight
(g)
Food
(g)
Water
(mL)
Animal Weight
(g)
Food
(g)
Water
(mL)
Initial, p0Average41.83110.015034.17105.84139.17
SD2.731.7702.482.943.76
24 h, p24Average40.68105.534033.04102.81133.17
SD2.661.993.172.472.787.36
Difference
p24-p0
Average1.154.4810.001.123.036.00
SD0.501.373.160.681.944.69
Disclaimer/Publisher’s Note: The statements, opinions and data contained in all publications are solely those of the individual author(s) and contributor(s) and not of MDPI and/or the editor(s). MDPI and/or the editor(s) disclaim responsibility for any injury to people or property resulting from any ideas, methods, instructions or products referred to in the content.

