Article

Influence of Graphene Oxide Concentration and Ultrasonication Energy on Fracture Behavior of Nano-Reinforced Cement Pastes

by
José D. Ríos
1,
Carlos Leiva
2,
Antonio Martinez de la Concha
1,
María Pilar Ariza
1 and
Héctor Cifuentes
1,*
1
Department of Continuum Mechanics and Structural Analysis, ETS de Ingeniería, Universidad de Sevilla, Camino de los Descubrimientos, s/n, 41092 Seville, Spain
2
Department of Chemical and Environmental Engineering, ETS de Ingeniería, Universidad de Sevilla, Camino de los Descubrimientos, s/n, 41092 Seville, Spain
*
Author to whom correspondence should be addressed.
Crystals 2024, 14(8), 707; https://doi.org/10.3390/cryst14080707
Submission received: 1 July 2024 / Revised: 29 July 2024 / Accepted: 29 July 2024 / Published: 5 August 2024
(This article belongs to the Special Issue Advanced Technologies in Graphene-Based Materials)

Abstract

:
The aim of this study is twofold. First, to assess the effect of the sonication process on the optimal dispersion of GO sheets for nanostructural reinforcement of cement pastes, as there is currently no clear criterion on this effect in the literature. For this purpose, in the first stage, the GO content in distilled water was fixed at 0.03% by weight, and the sheets were dispersed using different levels of ultrasonic energy, ranging from 0 J/mL to 2582 J/mL. In the second stage, to analyze the modification of pore structure due to the addition of GO sheets in different ratios (0–0.06% by weight) and its relationship with the mechanical and fracture properties of reinforced cement pastes. According to the results, it has been determined that the incorporation of GO sheets into the matrix alters the mechanical and fracture behavior, varying depending on matrix pore size and GO particle size. The addition of GO leads to a reduction in the average size of macropores (greater than 8 µm) of 13% for a dosage of 0.45% in weight and micropores (between 8 and 0.5 µm) in a 64% for the same composition with non-sonicated GO, although the total volume of pores in these ranges only decreased slightly. This reduction is more pronounced when the GO has not been sonicated and has larger particle size. Sonicated GO primarily modifies the range of capillary pores (<0.5 µm). The addition of GO with the highest degree of dispersion (465 nm) did not show significant improvements in compressive strength or Young’s modulus, as the cement used contains a significant volume of macropores that are not substantially reduced in any composition. Adding 0.030% ultrasonicated GO achieved a 7.8% increase in fracture energy, while an addition of 0.045% resulted in a 13.3% decrease in characteristic length, primarily due to the effect of capillary and micropores.

1. Introduction

The fracture behavior of cement-based materials is fundamentally governed by the process of generation, coalescence, and propagation of cracks in the microstructure [1,2]. The amount, dimension, geometry, and distribution of defects in the material matrix have a remarkable influence on the cracking propagation and the subsequent failure mechanism at the macroscopic level [3,4,5]. In fact, the purpose of steel fiber-reinforced concretes, commonly reinforced with fiber lengths around 6 and 60 mm, is to act as barriers that hinder the crack propagation in the matrix and transmit stresses through a bridging effect linking the cracked zones, improving the fracture behavior. However, the effectiveness of steel fibers is limited to crack sizes fundamentally between microns and a few millimeters, depending on the type of fiber used [6,7]. Since cementitious materials are multi-scale flawed materials, which range in flaw size from a few nanometers to tens of millimeters, the steel fibers are not sufficiently effective for nanocracks, and so the reinforcement of the matrix by adding nanoparticles should be conducted for the enhancement of their mechanical properties and fracture behavior.
Improvements in the science of materials have made possible the use of nanoscale reinforcements, such as carbon nano-fibers [8,9], carbon nanotubes (CNTs) [10,11], graphene sheets [12,13,14,15,16], carbon dots [17], graphene oxide sheets (GO) [18,19,20], reduced graphene oxide sheets (rGO) [21,22,23,24], and chemically functionalized graphene oxide [25], with the aim of improving the overall mechanical properties of materials. Nanoparticles are highly effective additives for the modification of cement products, even at low concentrations (≤1%). Nevertheless, there is a great controversy between results of GO reinforced cement products reported by different researchers [16,26,27,28]. Shamsaei et al. [29] and Lu et al. [30] also noticed these high variations in increase of performance. In fact, there are some results that show great improvement and tangible changes with addition of GO [27,28] and others that show indifference or even disadvantages [18,26].
Graphene oxide is an interesting material to improve the mechanical and fracture properties of cement-based materials due to its high tensile strength of 130 GPa and large specific area of 2630 (m2/g) [31]. Additionally, GO can be well dispersed in water solutions due to the presence of oxygen functional groups [19,32]. GO has a high reactivity with cement products (portlandite and C-S-H), influencing chemical reactions and the subsequent macroscopic behavior of cement materials [33]. Thus, the addition of GO modifies the properties in a fresh and hardened state. On the other hand, GO sheets can fill nanopores and provide a higher density cement matrix. GO forms strong covalent bonds to improve structural interfaces and the performance of hydration products [28,34,35]. The addition of graphene oxide can strengthen the material matrix at a nanoscale level where conventional steel fibers are ineffective.
Studies of graphene oxide have been going on for 100 years since GO was described for the first time [36,37]. In the last twenty years, there has been an increase in studies in cementitious materials, pastes [36,38,39], mortars [13,31], and concretes [39,40,41]. Many studies have focused on rheological properties [37,42,43,44], hydration [19,21,35,37,45,46], and strength development [19,21,28,37], whereas other works have focused on the influence of the process of sonicating of nanoparticles [34,46,47]. Others have focused on mechanical properties [14,25,48], but few have focused on detailed studies of the evolution of fracture properties with the influence of sonicate content and energy on the microstructure at the nano- and micro-level.
Most usually studied matters are variations in mechanical strength, porosity, and microstructure when GO is added like reinforcement. It could be thought that discrepancies between results are caused by the existence of significant differences between experimental procedures [46,47,48,49]. Additionally, since GO sheets are micro or nanoscale, it is possible that differences in the manufacturing process apparently irrelevant for researchers might be determinant [50]. All production processes are different from one another, which has created substantial differences that can make the results of the studies incomparable. Some points of discordance or disagreement between different studies are the use of surfactants in the mixture, the revolution level of mixers, the ultrasonication energy transfer to the mixture to optimize the GO sheets dispersion, the control of temperature generated in the mixture during the mixing process, the use of tape or distilled water, and the water to cement ratio [24,35,44,46,49].
The objective of this paper is twofold. First, the assessment of the effect of the sonication process on the suitable dispersion of GO sheets. For this, the content of GO in distilled water was fixed to 0.03 wt% and the sheets were dispersed by ultrasonication. The solutions were submitted to different ultrasonication energy levels from 0 J/mL to 2582 J/mL following the same procedure in all cases. The influence of ultrasonication energy on the GO sheet sizes achieved was directly measured by a particle size analyzer and the subsequent suitable sonication energy was determined. Second, the effect of different contents of GO sheets on the capillarity, micro, and macro pore structure of the cement paste matrices were analyzed by mercury intrusion porosimetry (MIP). An assessment of the porosity ranges that are affected by the addition of GO sheets was discussed. Finally, the mechanical and fracture behavior of the various pastes were experimentally assessed. In this way, the mechanisms by which changes in the matrix’s microstructure caused by the presence of GO sheets affects the mechanical and fracture properties of concrete have been thoroughly investigated.

2. Materials and Methods
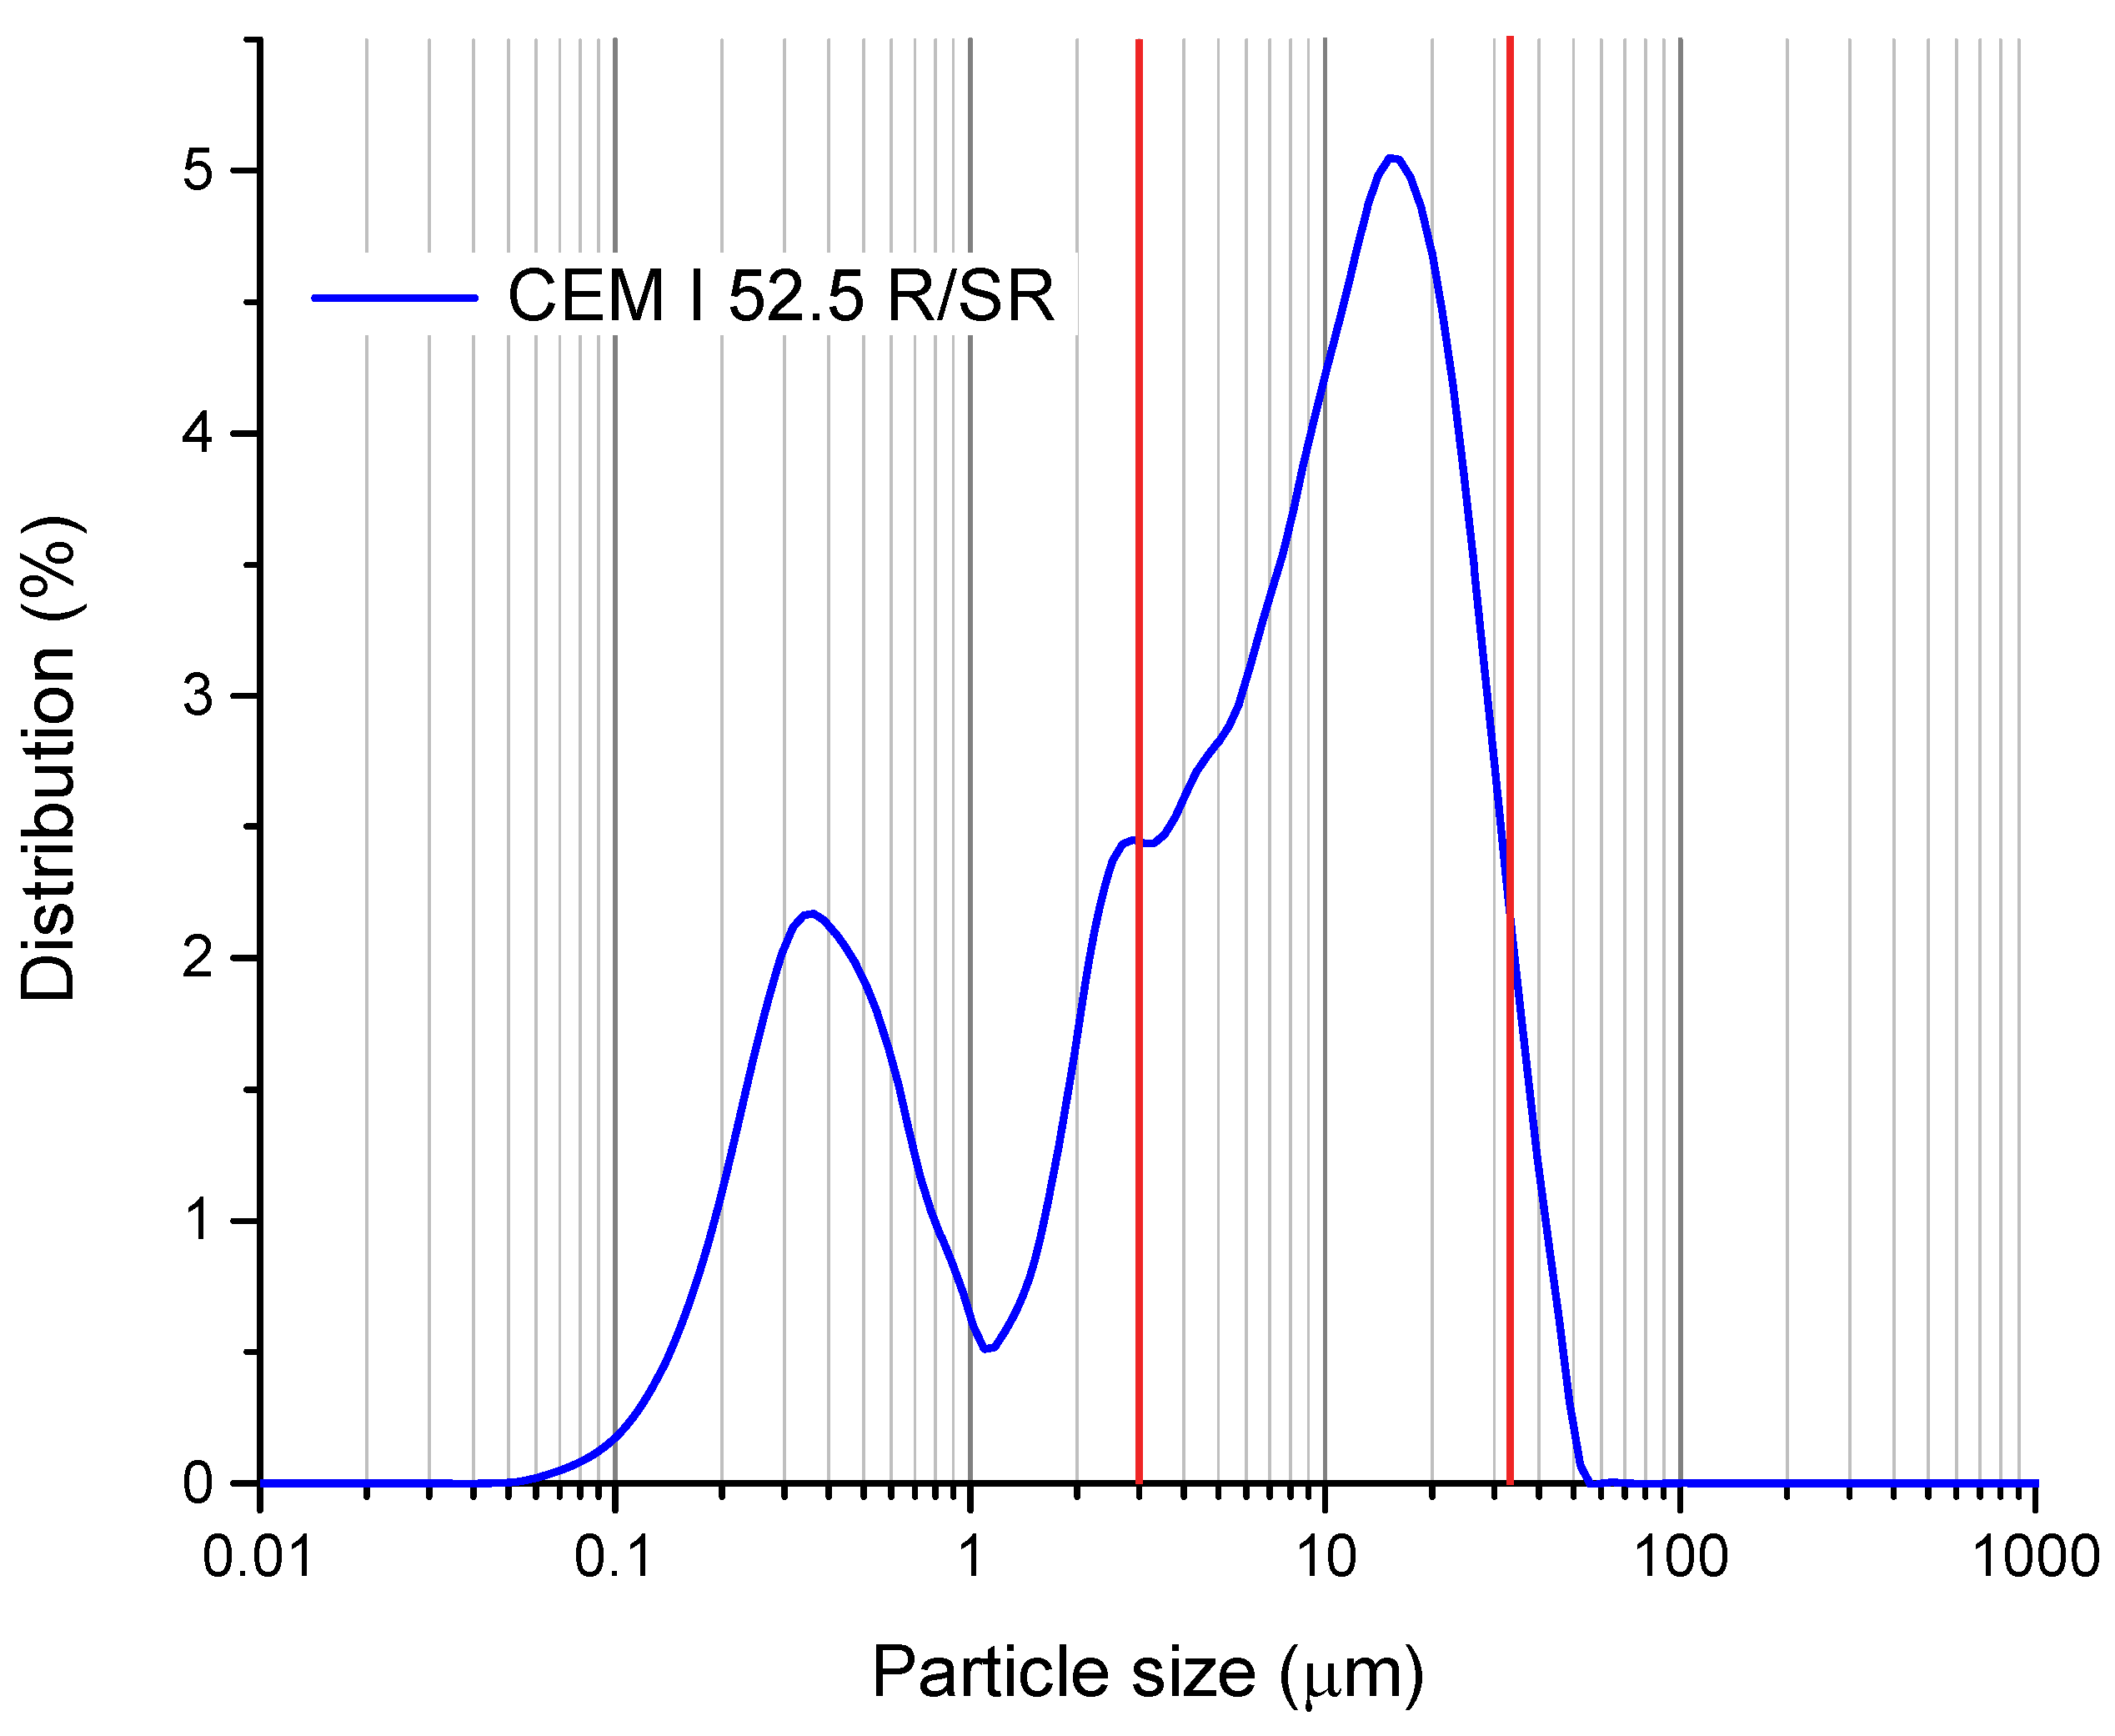
2.1. Materials

Ordinary Portland cement, CEM I 52.5 R/SR, was used in this study. The particle size distribution of cement measured by laser diffraction is shown in Figure 1. As observed, the cement has a particle size distribution between 0.04 and 60 μm [51]. The mean and median particle sizes are 8.09 μm and 5.1 μm, respectively. The range of suitable particle sizes for the hydration process of cement is between 3 and 32 μm (red lines in Figure 1) [52,53]. This cement presents a percentage of 90.61% of particle sizes in the suitable range. Thus, the particle size is significantly suitable to achieve very efficient hydration reactions.
Additionally, the XRF chemical composition of cement is presented in Table 1. The predominant compound is CaO from the cement clinker.
A dispersed GO in water with a concentration of 0.03 wt% was employed in this study from Graphenea. The elemental analysis in weight of GO presented is C (49–56%), H (0–1%), N (0–1%), S (2–4%) and O (41–50%). In Figure 2 the incremental volume percentage of GO sheet sizes in water suspension when it has not been yet sonicated or turned over is shown. As shown, the high variability in the results of the particle size distribution measurements indicate that the GO sheets in solution are randomly attached to each other, showing particle sizes between 0.42 and 10.1 μm. Three particle size measurements were performed on different mixtures with the same concentration to ensure the reliability of the results. It is worth noting the significant deviation of the particle size results when the dilution is not previously sonicated. The random adherence of the particles to each other makes the mixture totally inhomogeneous. This demonstrates how essential it is to properly sonicate the GO and to control the process. In this work, an exhaustive analysis of the ultrasonication process and its influence on the results was performed in Section 2.2.

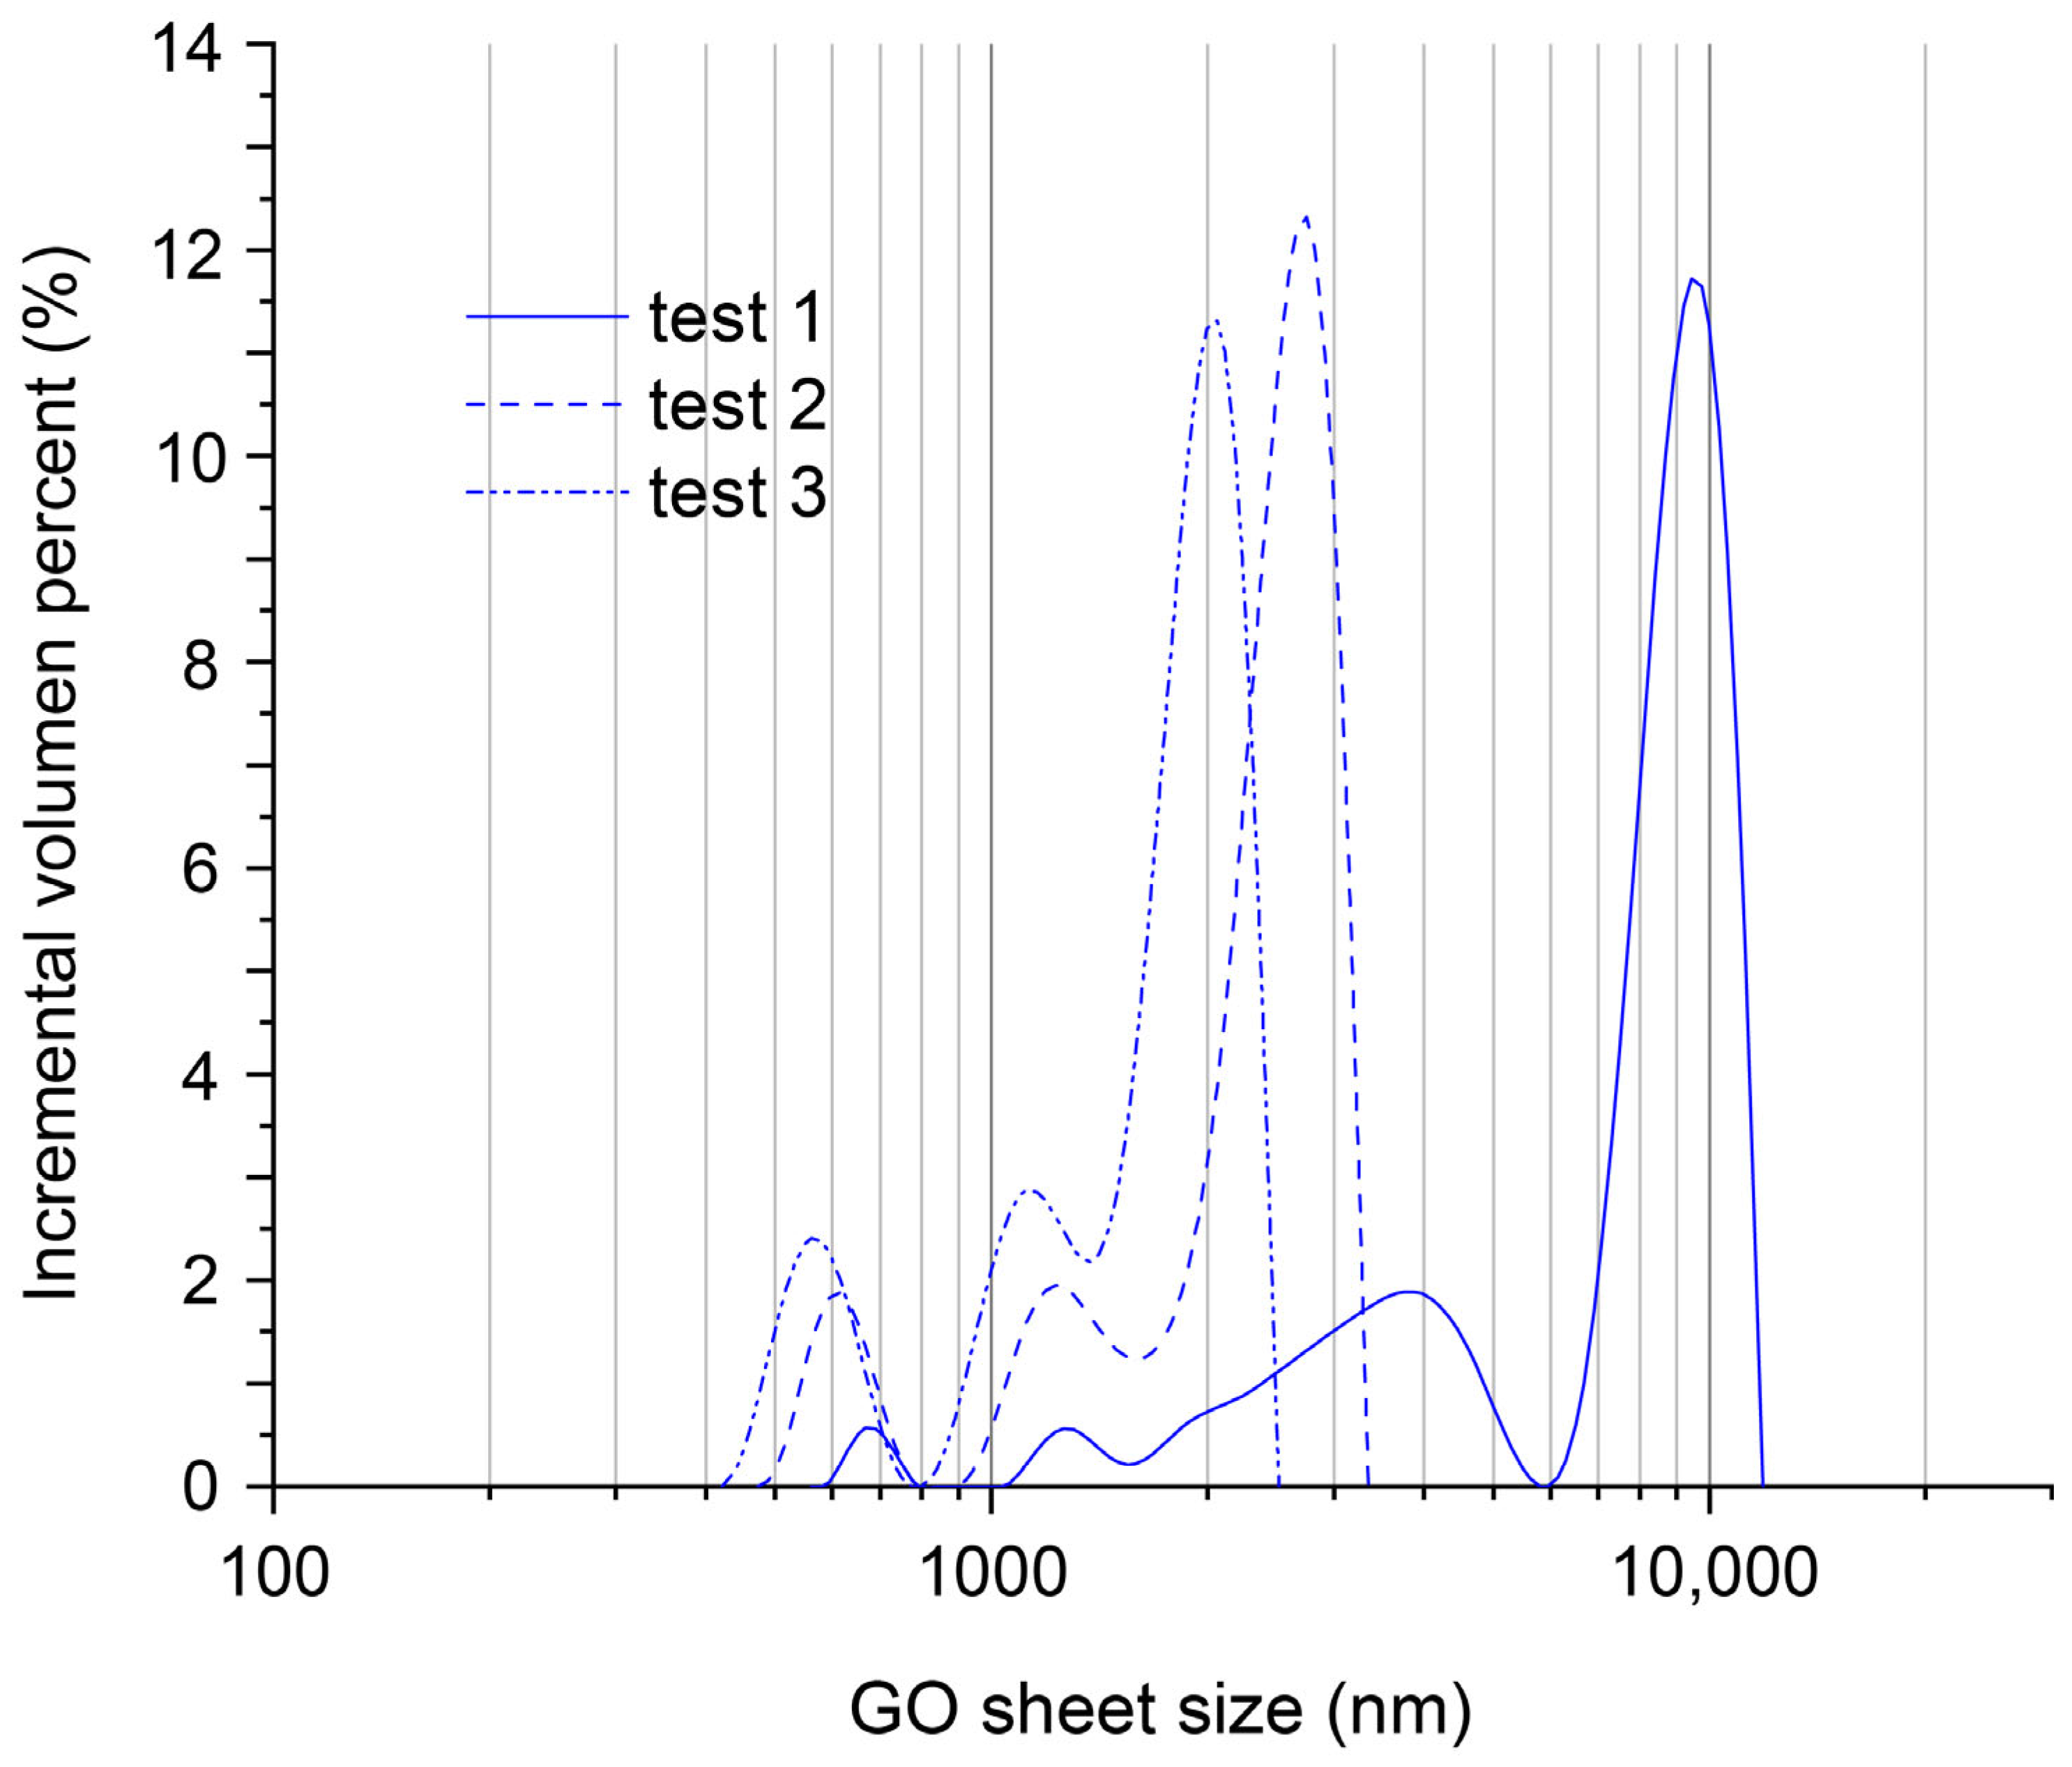
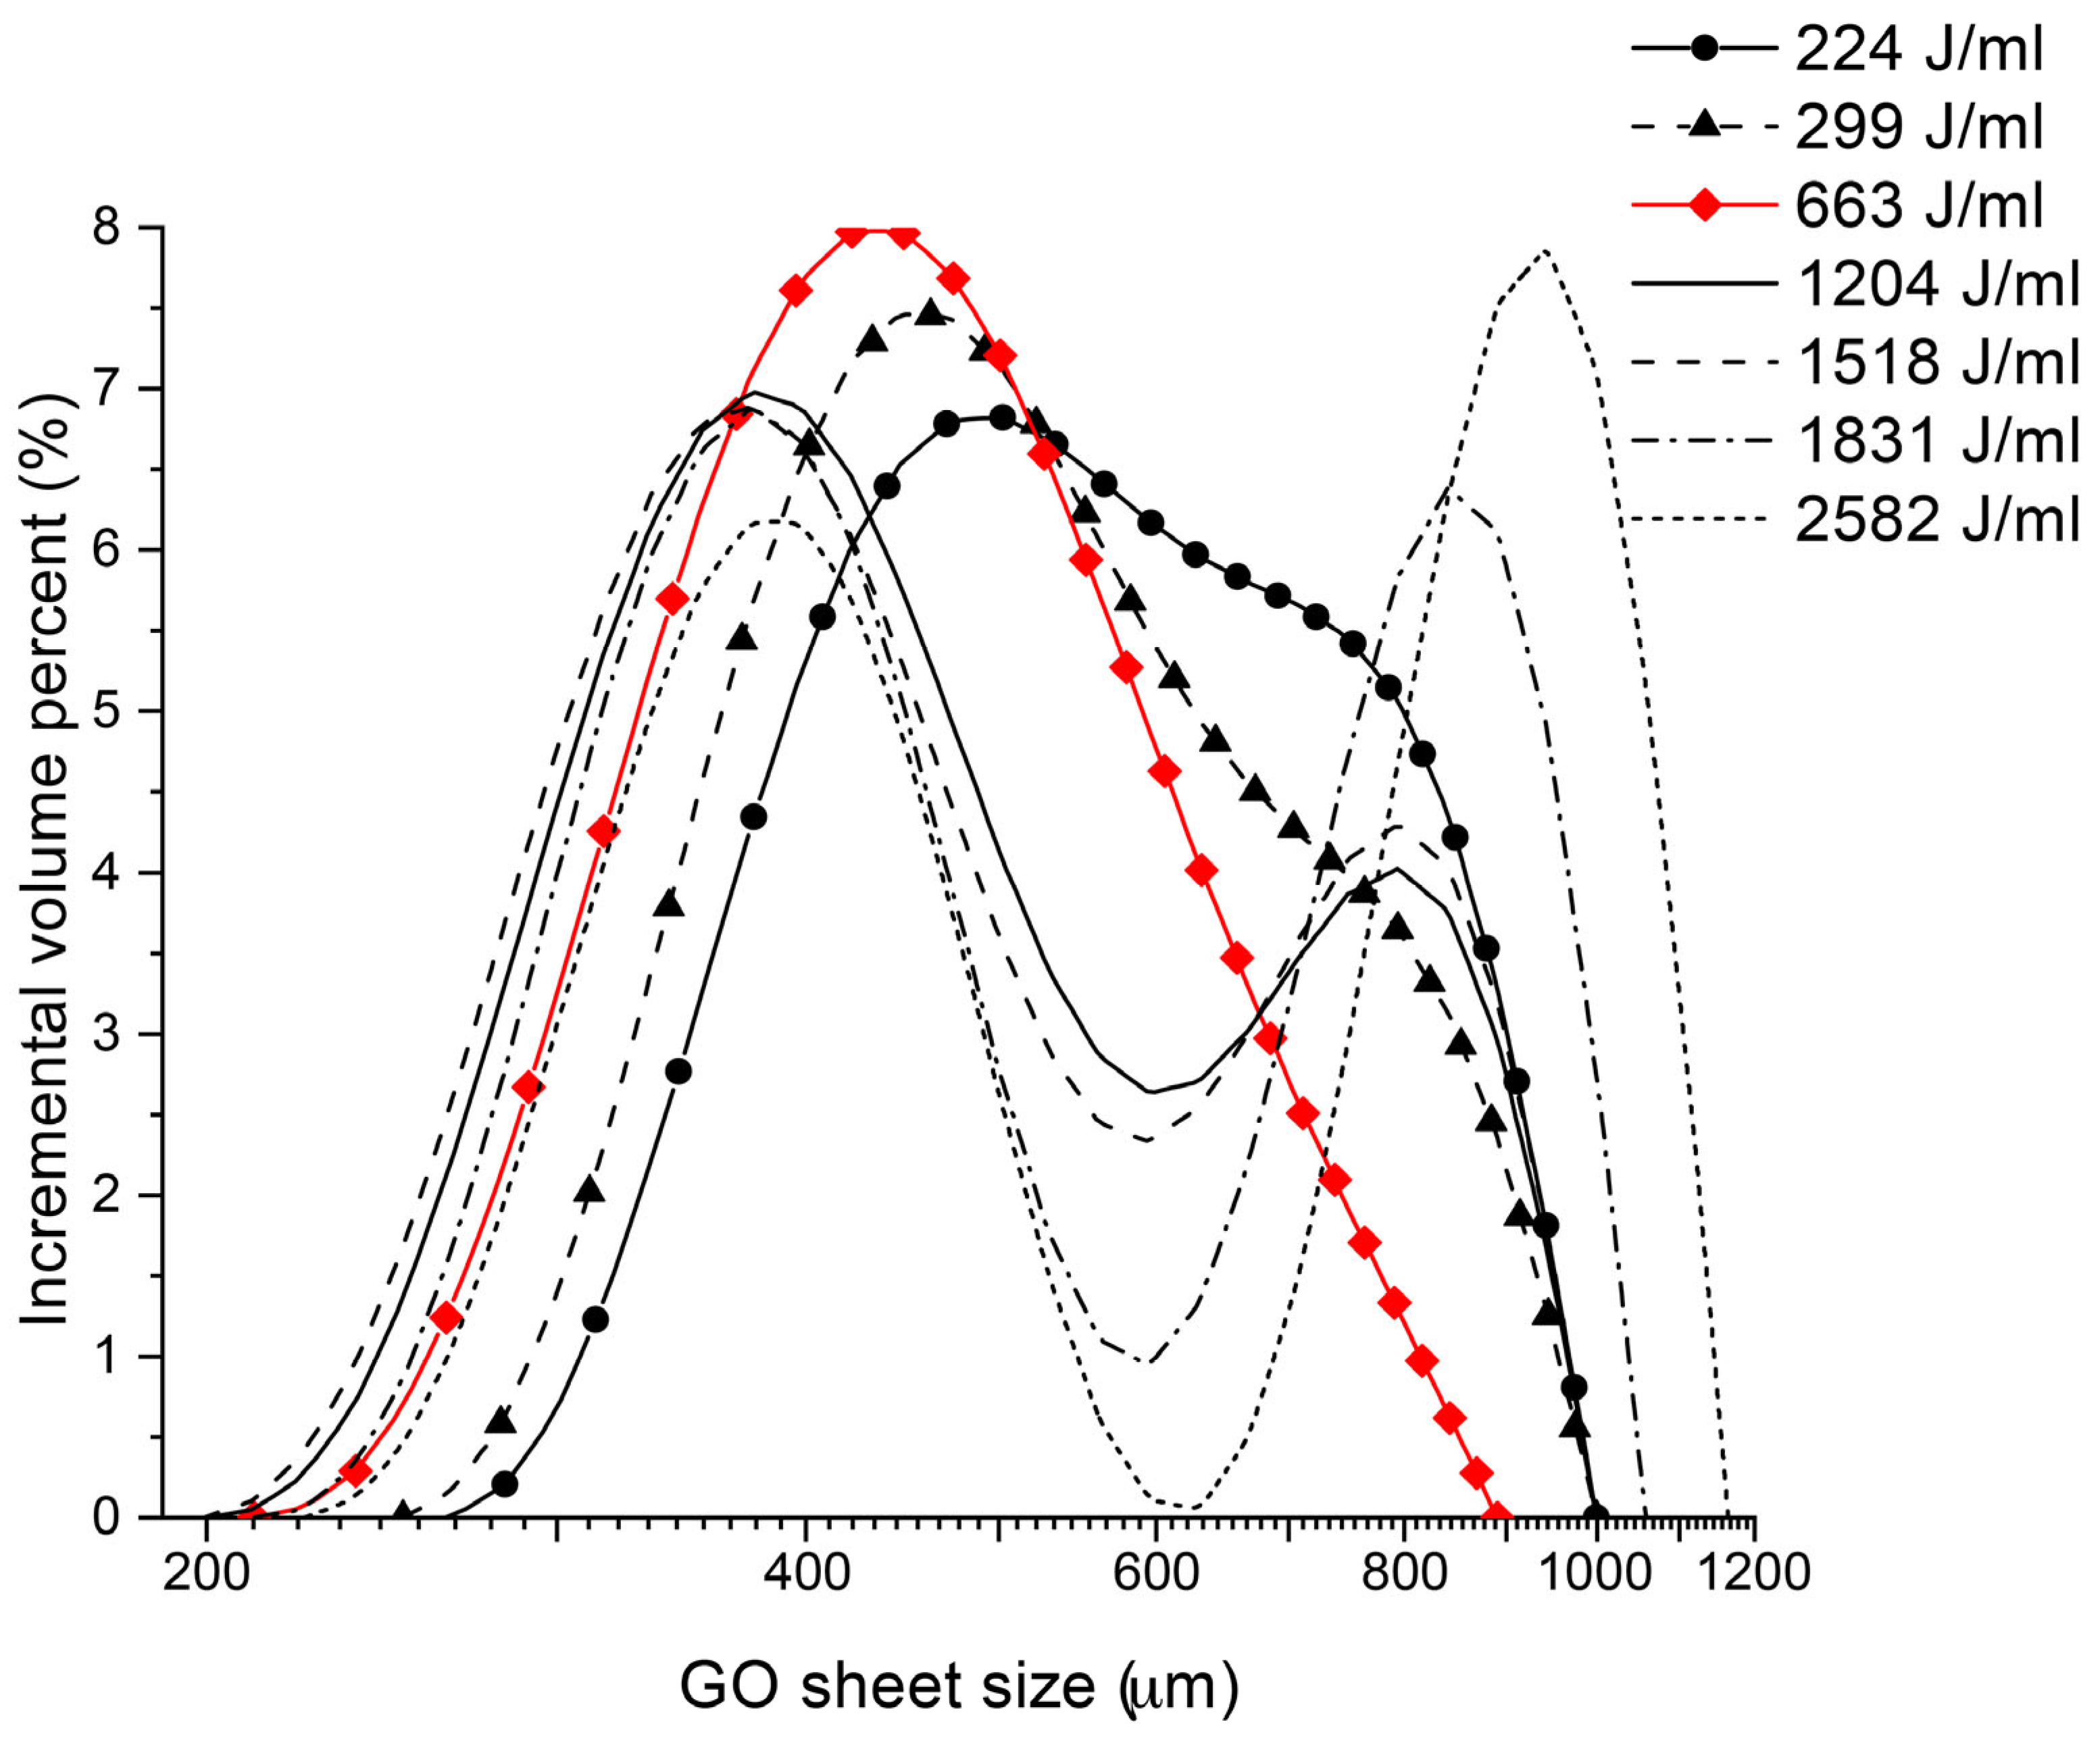
2.2. GO Dispersion Analyses

The GO dispersion analyses were performed for the same aqueous GO dispersion, 0.03 wt%. Although the effectiveness may be slightly affected for other concentrations, the study was carried out for the most common concentration according to other authors [19,54]. An exhaustive analysis of the influence of ultrasonication energy was performed to ensure the optimum dispersion of GO sheets. It should be clarified that the efficiency of the sonication process can vary depending on numerous factors such as the concentration of GO water solution, the sonication energy, the type and depth of the probe in the solution, the total volume of solution to sonicate, and the arrangement of that volume in the vessel [19,22,47]. Having the same volume in vessels of different width–height ratios modifies the conditions of sonication and its outcome. The heating generated during the sonication process must be controlled to avoid or reduce water evaporation that changes the initial GO–water concentration [19,55]. All this implies that the sonication time alone is not relevant data to be able to reproduce a sonication process as observed in some studies. It is much more relevant to talk about the sonication energy transferred to the fluid.
Various samples were prepared in order to determine the optimum ultrasonication energy to be transferred to the sample. The sonication process was carried out using a sonicator model Sonics Vibra-Cell vcx-750 (Llinars del Vallés, Catalonia, Spain) of 20 kHz with a 19 mm diameter probe. The amplitude set was 70% and pulse of intervals of 20″ to avoid overheating. The GO suspension was sonicated in a glass container 8 cm in diameter and 15 cm in height. Cold water at 6 °C was poured around the vessel to mitigate the heating of the sample and subsequent evaporation. The ultrasonication energy transferred to fluid can be seen in Table 2. Before ultrasonication, the solution was mixed by a tumbler for 24 h.
To determine the best GO dispersion according to the different ultrasonication energy levels, a direct measurement of the GO sheet size was measured by a particle size analyzer (Mastersizer 3000, Malvern, UK). Three samples under the same test conditions were carried out to determine the specific GO sheet size distribution. The results of the average GO sheet size distribution can be seen in Figure 2 and the values for mean, minimum and maximum GO sheet sizes and their standard deviations are presented in Table 2.
For the ultrasonication energy of 224 J/mL, the range of GO sheet sizes is 0.255–0.99 μm (Figure 3 and Table 2). This range is much smaller than the interval obtained for the reference sample without sonicating, 0.42–10 μm (Figure 2), so sonication is indispensable. The GO sheet size decreases from a mean value of 3.10 μm to 0.572 μm, a decrease of 81.5% (Table 2). What is even more relevant is that the standard deviation goes from 74.4%, without sonication, to 0.1% with 224 J/mL of ultrasonication energy. This factor is extremely important for the repeatability and reliability of characterization results. For the 299 J/mL ultrasonication energy, a slight shift of the maximum peak of the GO sheet size distribution curve towards the lower particle size zone is observed. This leads to a lower mean particle size, as can be seen in Table 2, from 0.572 to 0.544 μm. It can be seen how the decrease in relative terms of the mean GO sheet size is much smaller (4.9%) and how the deviation of the results, although larger than for 224 J/mL, is still very small (0.5%).
Regarding the ultrasonication energy results of 663 J/mL, this is the case for which the maximum GO sheet size is significantly smaller, 0.890 μm, and where the lower limit is one of the smallest, 0.211 μm. This is reflected in the lowest mean GO sheet size being reached, at 0.465 μm. All this indicates that this amount of energy transferred to solution is, between the values analyzed, the best GO dispersion. In addition, the deviation of results is the most reduced, so the pastes manufactured with this sonication energy should provide the most reliable results.
For sonication energies between 1204 and 2582 J/mL, the trend observed is increasing in mean GO sheet size from 0.492 to 0.639 μm, and the deviation of the results from 0.1 to 8.4%. It is worth noting that providing ultrasonication energy higher than 663 J/mL does not improve GO dispersion. Too-large power sonication results in a scissoring effect that breaks up the nanoparticles. Consequently, the power should be decreased as much as possible to guarantee a more homogeneous dispersion [56]. Based on the GO dispersion analysis performed, the most suitable ultrasonication energy has been set at 663 J/mL.
In Figure 4, the minimum, mean, and maximum values of GO sheet sizes and their deviation versus the ultrasonication energy transferred to suspension of 0.03 wt% (Table 2) is represented. As seen, infra-sonication and supra-sonication generate results of GO sheet sizes with higher deviation; this effect is more significant for the minimum and mean curves of particle size. On the other hand, a peak is clearly observed in the curves for the 663 J/mL energy case, which implies the smallest GO sheet size and the results with the lowest deviation.

2.3. Mix Proportions and Specimen Preparation

In this work, five different types of cement pastes reinforced with GO have been examined. The first paste, without GO addition, was used as the reference mix. The remaining four pastes had GO contents by weight of cement of 0.015%, 0.030%, 0.045%, and 0.060%. For the GO-reinforced pastes, two batches of specimens were produced for each type of mix, with one batch to analyze the fracture behavior without sonication, 0 J/mL, and sonicated with 663 J/mL (suitable value determined in Section 2.2). A total of nine batches of specimens were manufactured. The mix proportions, nomenclature and ultrasonication energy transferred to the sample are shown in Table 3.
Each batch of specimens consists of three beams of 40 mm × 40 mm × 100 mm and three cubes of 40 mm per side. In total, 27 prismatic and 27 cubic specimens were manufactured. The GO–water solutions were properly sonicated just before the manufacturing process. Subsequently, the pastes were manufactured with a 5-liter mixer. First, the cement was added and mixed for 3 min, then the dispersed GO water solution was added and mixed for 5 min more. During this time, a fresh fluid paste was obtained and then poured into the molds. Next, the specimens were left for 24 h air curing, covered with plastic to reduce the loss of hydration. Afterwards, the specimens were demolded and cured in water at 20 °C for 27 days more. After this time, they were removed from the water and left to dry in the open air for 24 h. Finally, the experimental tests were carried out.
As it can be seen in Figure 5, The probe used was 19 mm (3/4″), following the manufacturer’s recommendation based on the volume of mixture to be sonicated. The sonicator was placed in a soundproof box within a climate-controlled room, maintaining a temperature of 24 °C ± 2 °C. Additionally, the sonication container was placed inside another container with water to mitigate any abrupt temperature changes during sonication. Sonication was performed prior to starting the paste fabrication process. Once the aqueous solution with graphene oxide was sonicated, fabrication proceeded.

3. Experimental Program

3.1. Fracture Behavior

Three notched prismatic specimens of 40 × 40 × 100 mm3 were subjected to three-point bending tests to determine fracture energy using the RILEM work-of-fracture method [57]. Each sample was sawn with a notch to a depth ratio of one-sixth. The samples were fitted with a 10 mm-long LVDT to determine mid-span deflection and a clip gauge to determine crack mouth opening displacement (CMOD).
In addition, an inverse analysis using the non-linear hinge model [58,59,60] was carried out to obtain the values of the bilinear tension softening graph (Figure 6). The bilinear graph is defined by the failure stress (ft), the displacement at failure (wu), the slope of the first branch (a1), and the slope of the second branch (a2) [61].

3.2. Compressive Strength and Young’s Modulus

The compressive strength was determined from experimental tests on 40 mm cubic specimens following the guidelines of the standard UNE-EN 12390-3 [62]. Three specimens for each type of paste and ultrasonication level were tested. Nine different paste batches were tested (Table 3); thereby, 27 tests were carried out in total. To determine Young’s modulus, it was obtained indirectly from the load-CMOD results reported from experimental three-point bending tests on 40 × 40 × 100 mm3 prismatic specimens notched at one sixth of the height according to the standard RILEM TCM-85 [57]. The three-point bending tests were carried out to also determine the fracture properties of the pastes and will be described in more detail in the following subsection. The method for determining Young’s modulus was that described by Swartz et al. [63], which relates the initial slope of the experimental load-CMOD curve to the elasticity modulus of the material. Three tests for each type of paste and ultrasonication level were assessed.

3.3. Mercury Instrusion Porosimetry (MIP)

High-pressure mercury intrusion porosimetry (MIP) was used to determine the porosity and pore size distribution in the range between 7 nm and 100 μm. The samples were obtained from the three-point bending specimens. Three samples per composition were carried out.

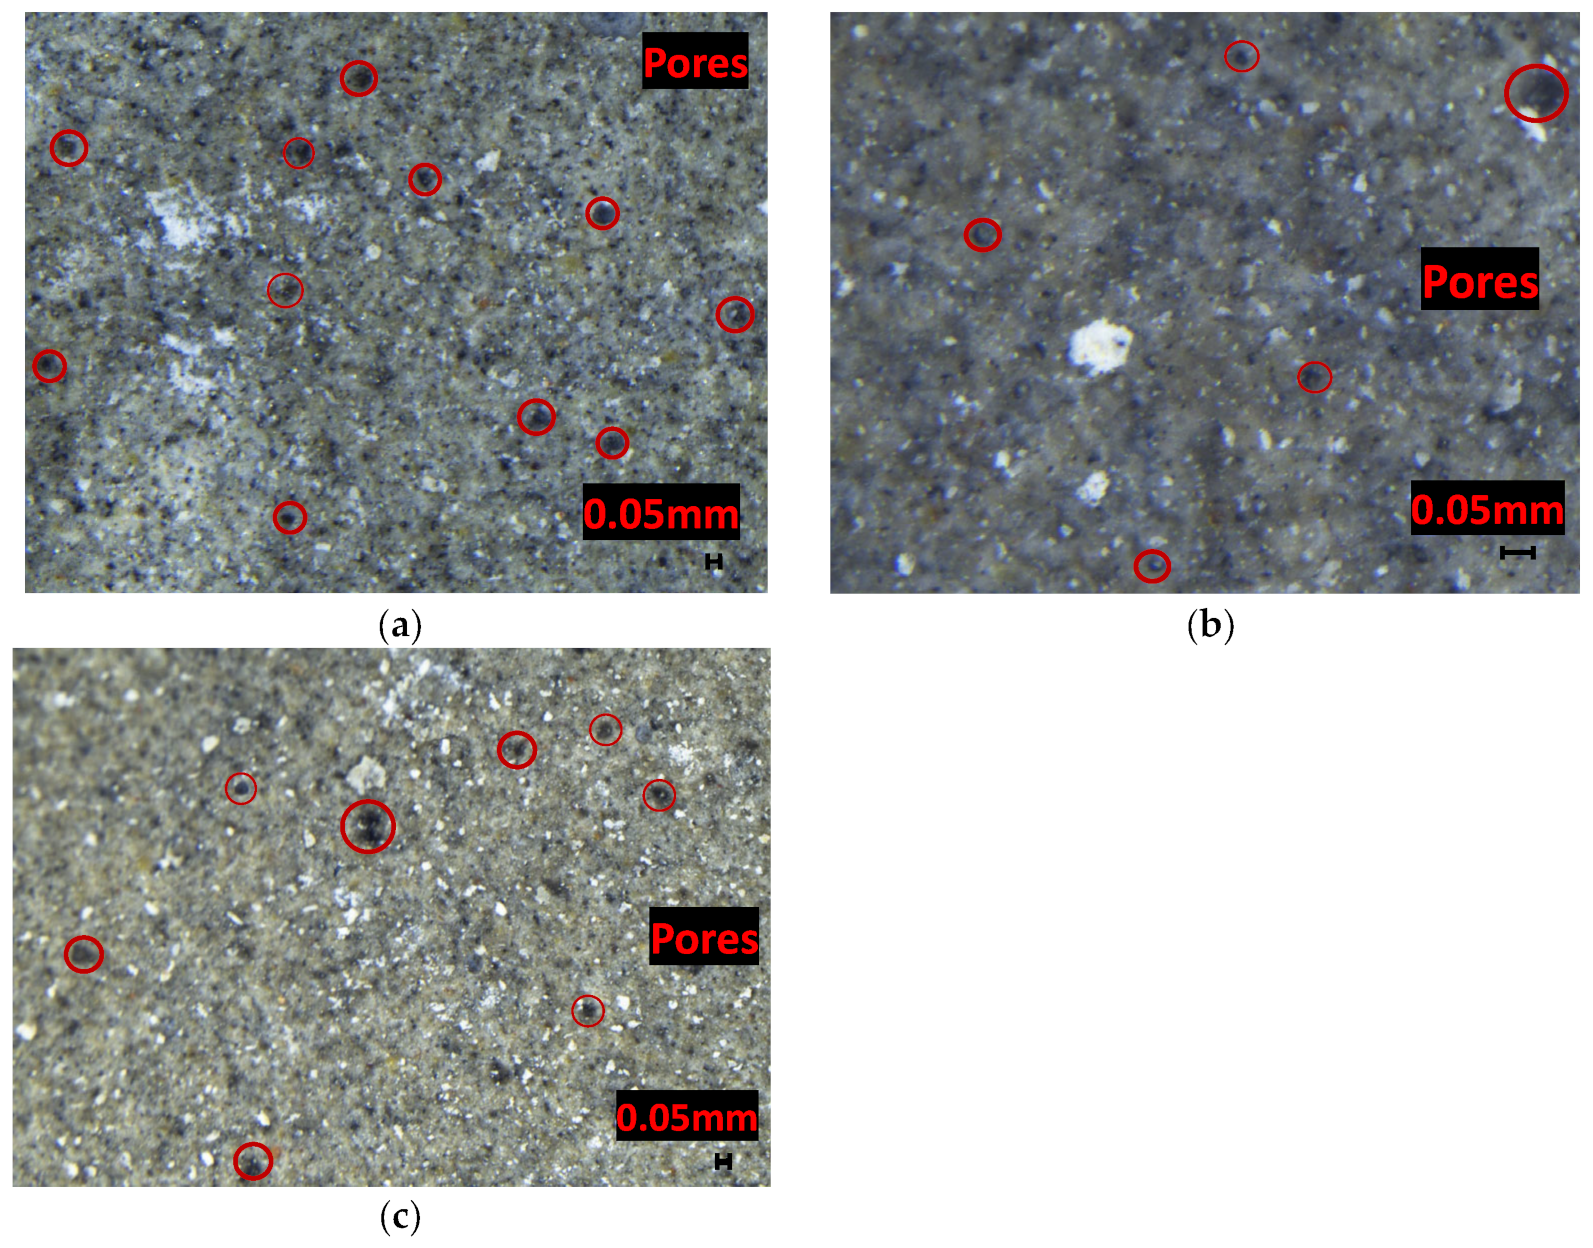
3.4. Stereomicroscope
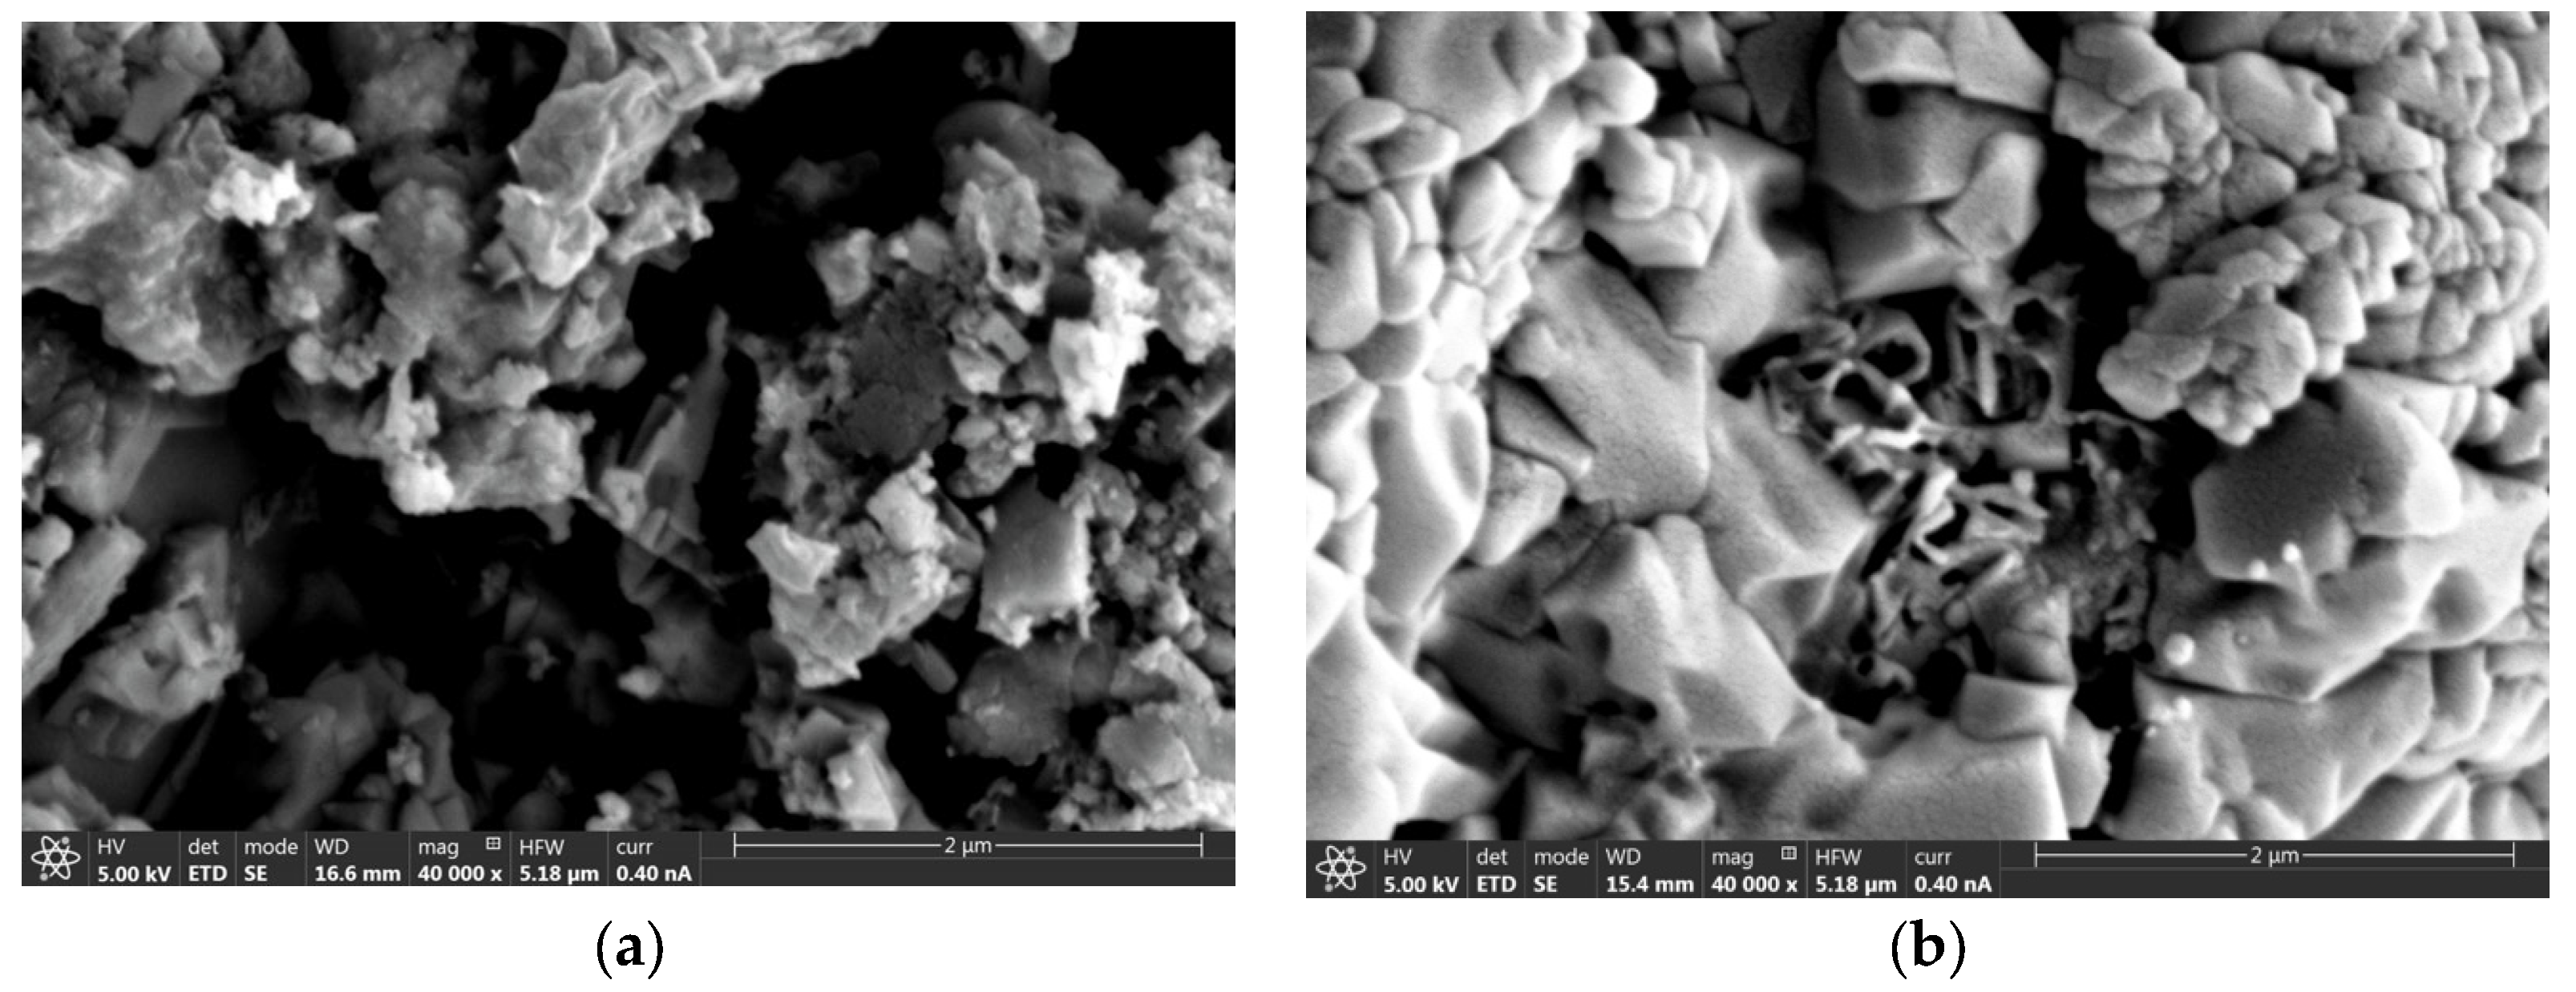
A SMZ25 stereomicroscope (Nikon Instruments Inc, Melville, New York, USA) was used. The instrument is connected to a computer running NIS Elements BR software, which was used to capture the images. Small specimens measuring 20 mm × 40 mm × 40 mm were fabricated for this test.

3.5. SEM

A TENEO equipment (FEI, (Thermo Fisher Scientific, Waltham, MA, USA)) with a field emission scanning electron microscope operated at 5 kV and equipped with an energy-dispersive X-ray spectroscopy system was used.

4. Results

4.1. Porosity of Cement Matrix

The MIP analysis provides useful information on pores between 7 nm and 100 μm. Figure 7 shows the pore size distribution obtained for all pastes with different GO concentrations and ultrasonication levels. Figure 6 is divided into four subfigures corresponding to the four different GO concentrations (0.015%, 0.030%, 0.045%, and 0.060%). In each subfigure, the pore distribution curves of the GO pastes, both sonicated and non-sonicated, as well as that of the reference paste (without GO content) are shown. In this way, the effect of GO concentration and ultrasonication can be compared in each subfigure. The most significant data obtained from the curves are shown in Table 4.
As shown in Figure 7, there are three different pore ranges: capillary pores (less than 0.5 μm in diameter), micropores (0.5–8 μm in diameter), and macropores (greater than 8 μm in diameter). The three main parameters in the pore distribution are as follows: (1) the GO pore size, (2) GO percentage, and (3) pore volume of P–0–0. Figure 5 shows that most of the pores are capillary pores in all dosages, especially in the 0.007–0.1 μm range. P–0–0 has a higher amount of macropores compared to other CEM I 52.5 R/SR cements used in previous studies with GO addition [64].
Regarding macropores, as can be seen in Table 4, the addition of GO can divide large pores into several smaller ones [65], but the total pore volume of macropores (greater than 8 μm) is very similar for additions of 0, 0.15%, and 0.03% of non-sonicated GO. The use of sonicated GO results in a smaller decrease in the total volume of macropores compared with non-sonicated GO (Figure 8a,b). The minimum macropores are reached in P–0.045–0, with 87% of P–0.045–0. The two compositions with 0.06% (with the highest proportion of GO) produce a decrease in the workability of the cement paste, leading to an increase in the macropores present [66,67], as can be seen in Figure 8c.
Regarding micropores, the addition of GO produces a reduction in micropores, and this reduction is greater with higher GO addition because the micropores present in P–0–0 are divided into smaller ones P–0.045–0 (Figure 9a,b), many of which fall into the higher range of capillary pores (0.1–0.5 μm). The addition of sonicated GO results in an even greater reduction in this range of pores than non-sonicated pastes. P–0.045–0 and P–0.045–30 show 36% and 28% of the microporosity of P–0–0, respectively. For the two compositions with 0.06% (with the highest proportion of GO), there is an increase in micropores in the paste, due to the reduced workability of the cement paste.
Regarding capillary pores, the addition of GO, whether sonicated or non-sonicated, reduces the volume of pores present in this range by 0.15%, 0.03%, and 0.045%. Although in the range (0.1–0.5 μm), the pore volume is increased by the division of micropores into smaller pores; the reduction in pore volume smaller than 0.1 μm is especially significant, so much so that even the peak porosity shifts to smaller sizes in all compositions. This is due to the filling effect of small pores by GO, probably producing nanopores smaller than 7 nm. P–0.045–0 and P–0.045–30 present 50% and 55% of the microporosity of P–0–0, respectively. For both 0.06% compositions, the capillary pores are increased due to the reduced workability of the paste. This behavior in the variation of capillary pores is similar to that found in previous works [62].
Considering the results of the MIP test, it is determined that effective sonication involves tailoring the dimensions of the GO sheets to match the pore sizes of the matrix, rather than striving for the smallest possible GO sheet size. When sonication results in a particle size that is excessively small for the pore size of the matrix being reinforced, the impact of GO on mechanical and fracture properties becomes insignificant, as will be discussed in subsequent sections. It explains why numerous studies have demonstrated significant enhancements in mechanical properties following GO addition [14,26,48,65], while others have reported contradictory findings [46,50,66].

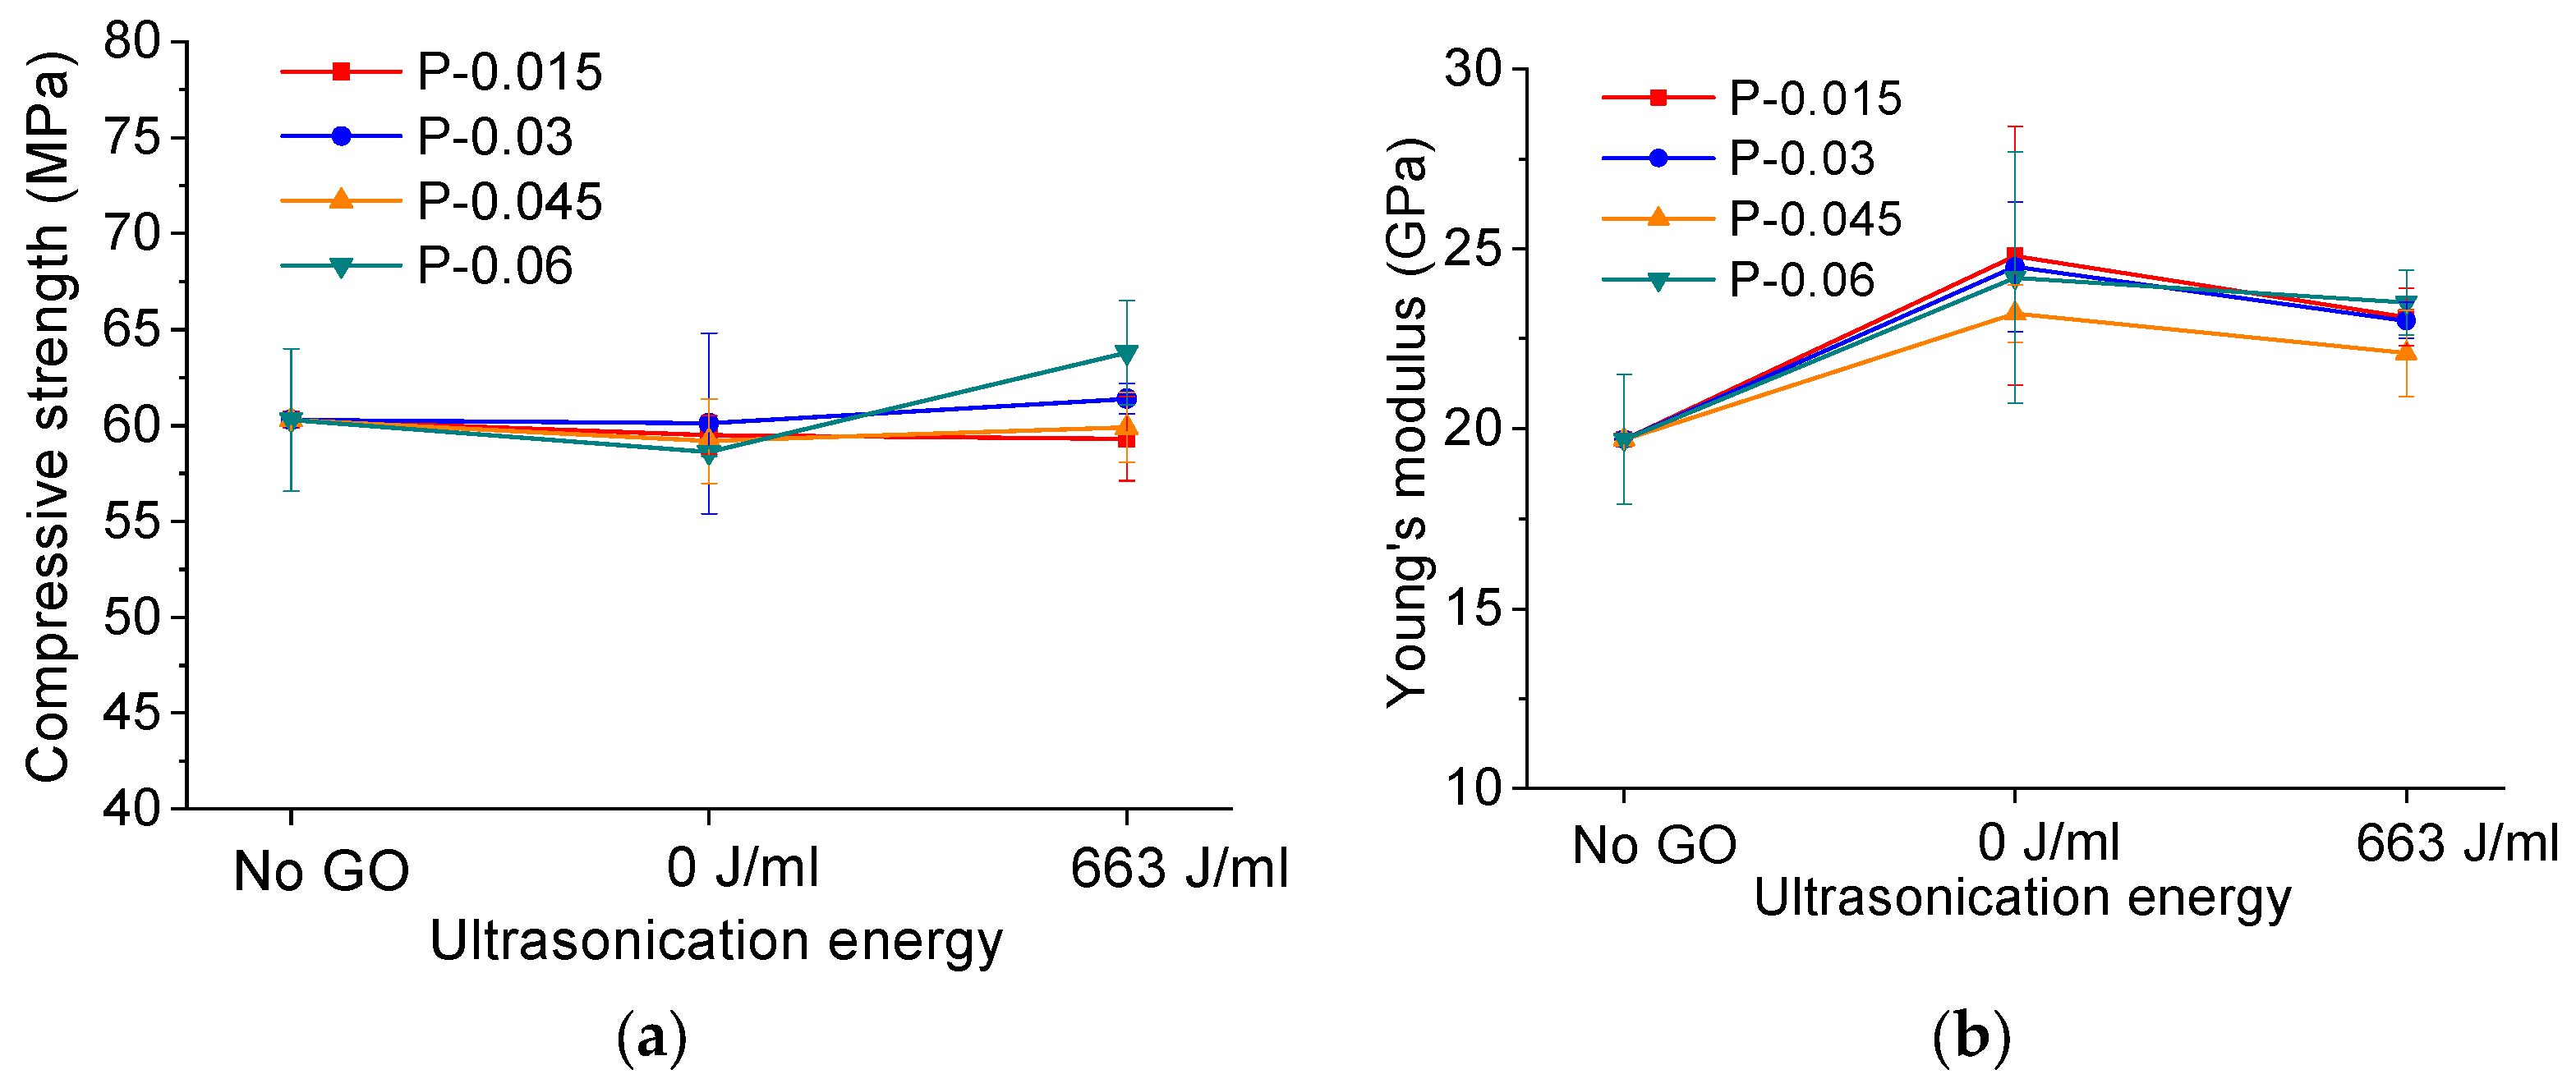
4.2. Compressive Strength and Young’s Modulus

Figure 10 shows the average values of compressive strength, fc, and Young’s modulus, Ec, for each GO content and ultrasonication level assessed. As shown in Figure 10a, the compressive strength of pastes reinforced with non-sonicated GO solution (0 J/mL) achieves mean values similar to the reference paste (no GO) for all evaluated GO contents (0.015%, 0.030%, 0.045%, and 0.060%). For the sonicated pastes, no significant improvement in compressive strength is observed for any analyzed GO concentration. The explanation lies in the fact that the volume of macropores does not change significantly for any of the GO concentrations (see Table 4). During the compressive strength test, macropores determine the preferential fracture path of the matrix, as cracks propagate between macropores. Since the addition of GO, with the sonication performed in this study, affects the size of capillary pores and these do not influence compressive strength [67], no improvements in this property are obtained.
With respect to the Young’s modulus, all the pastes showed an increase in Young’s modulus with an increase between 7.6–25.8% compared to the reference paste. According to Kendall and coauthors, this property is primarily influenced by the existence of a large number of pores with sizes in the nanometer range [68,69], although more research is needed in this area. Table 4 shows an analysis of the pore size distribution below the maximum measured particle size for all samples.
For the reference paste, it is observed that having a significant pore size distribution smaller than 500 nm and between 500–8000 nm (6.3%), in comparison to GO-reinforced pastes, results in lower Young’s modulus values. Focusing on the sonicated and non-sonicated GO-reinforced pastes, no clear trend is observed. We believe that the way pores are distributed and connected in the material plays a more relevant role than a specific size range, which is beyond the scope of this study.

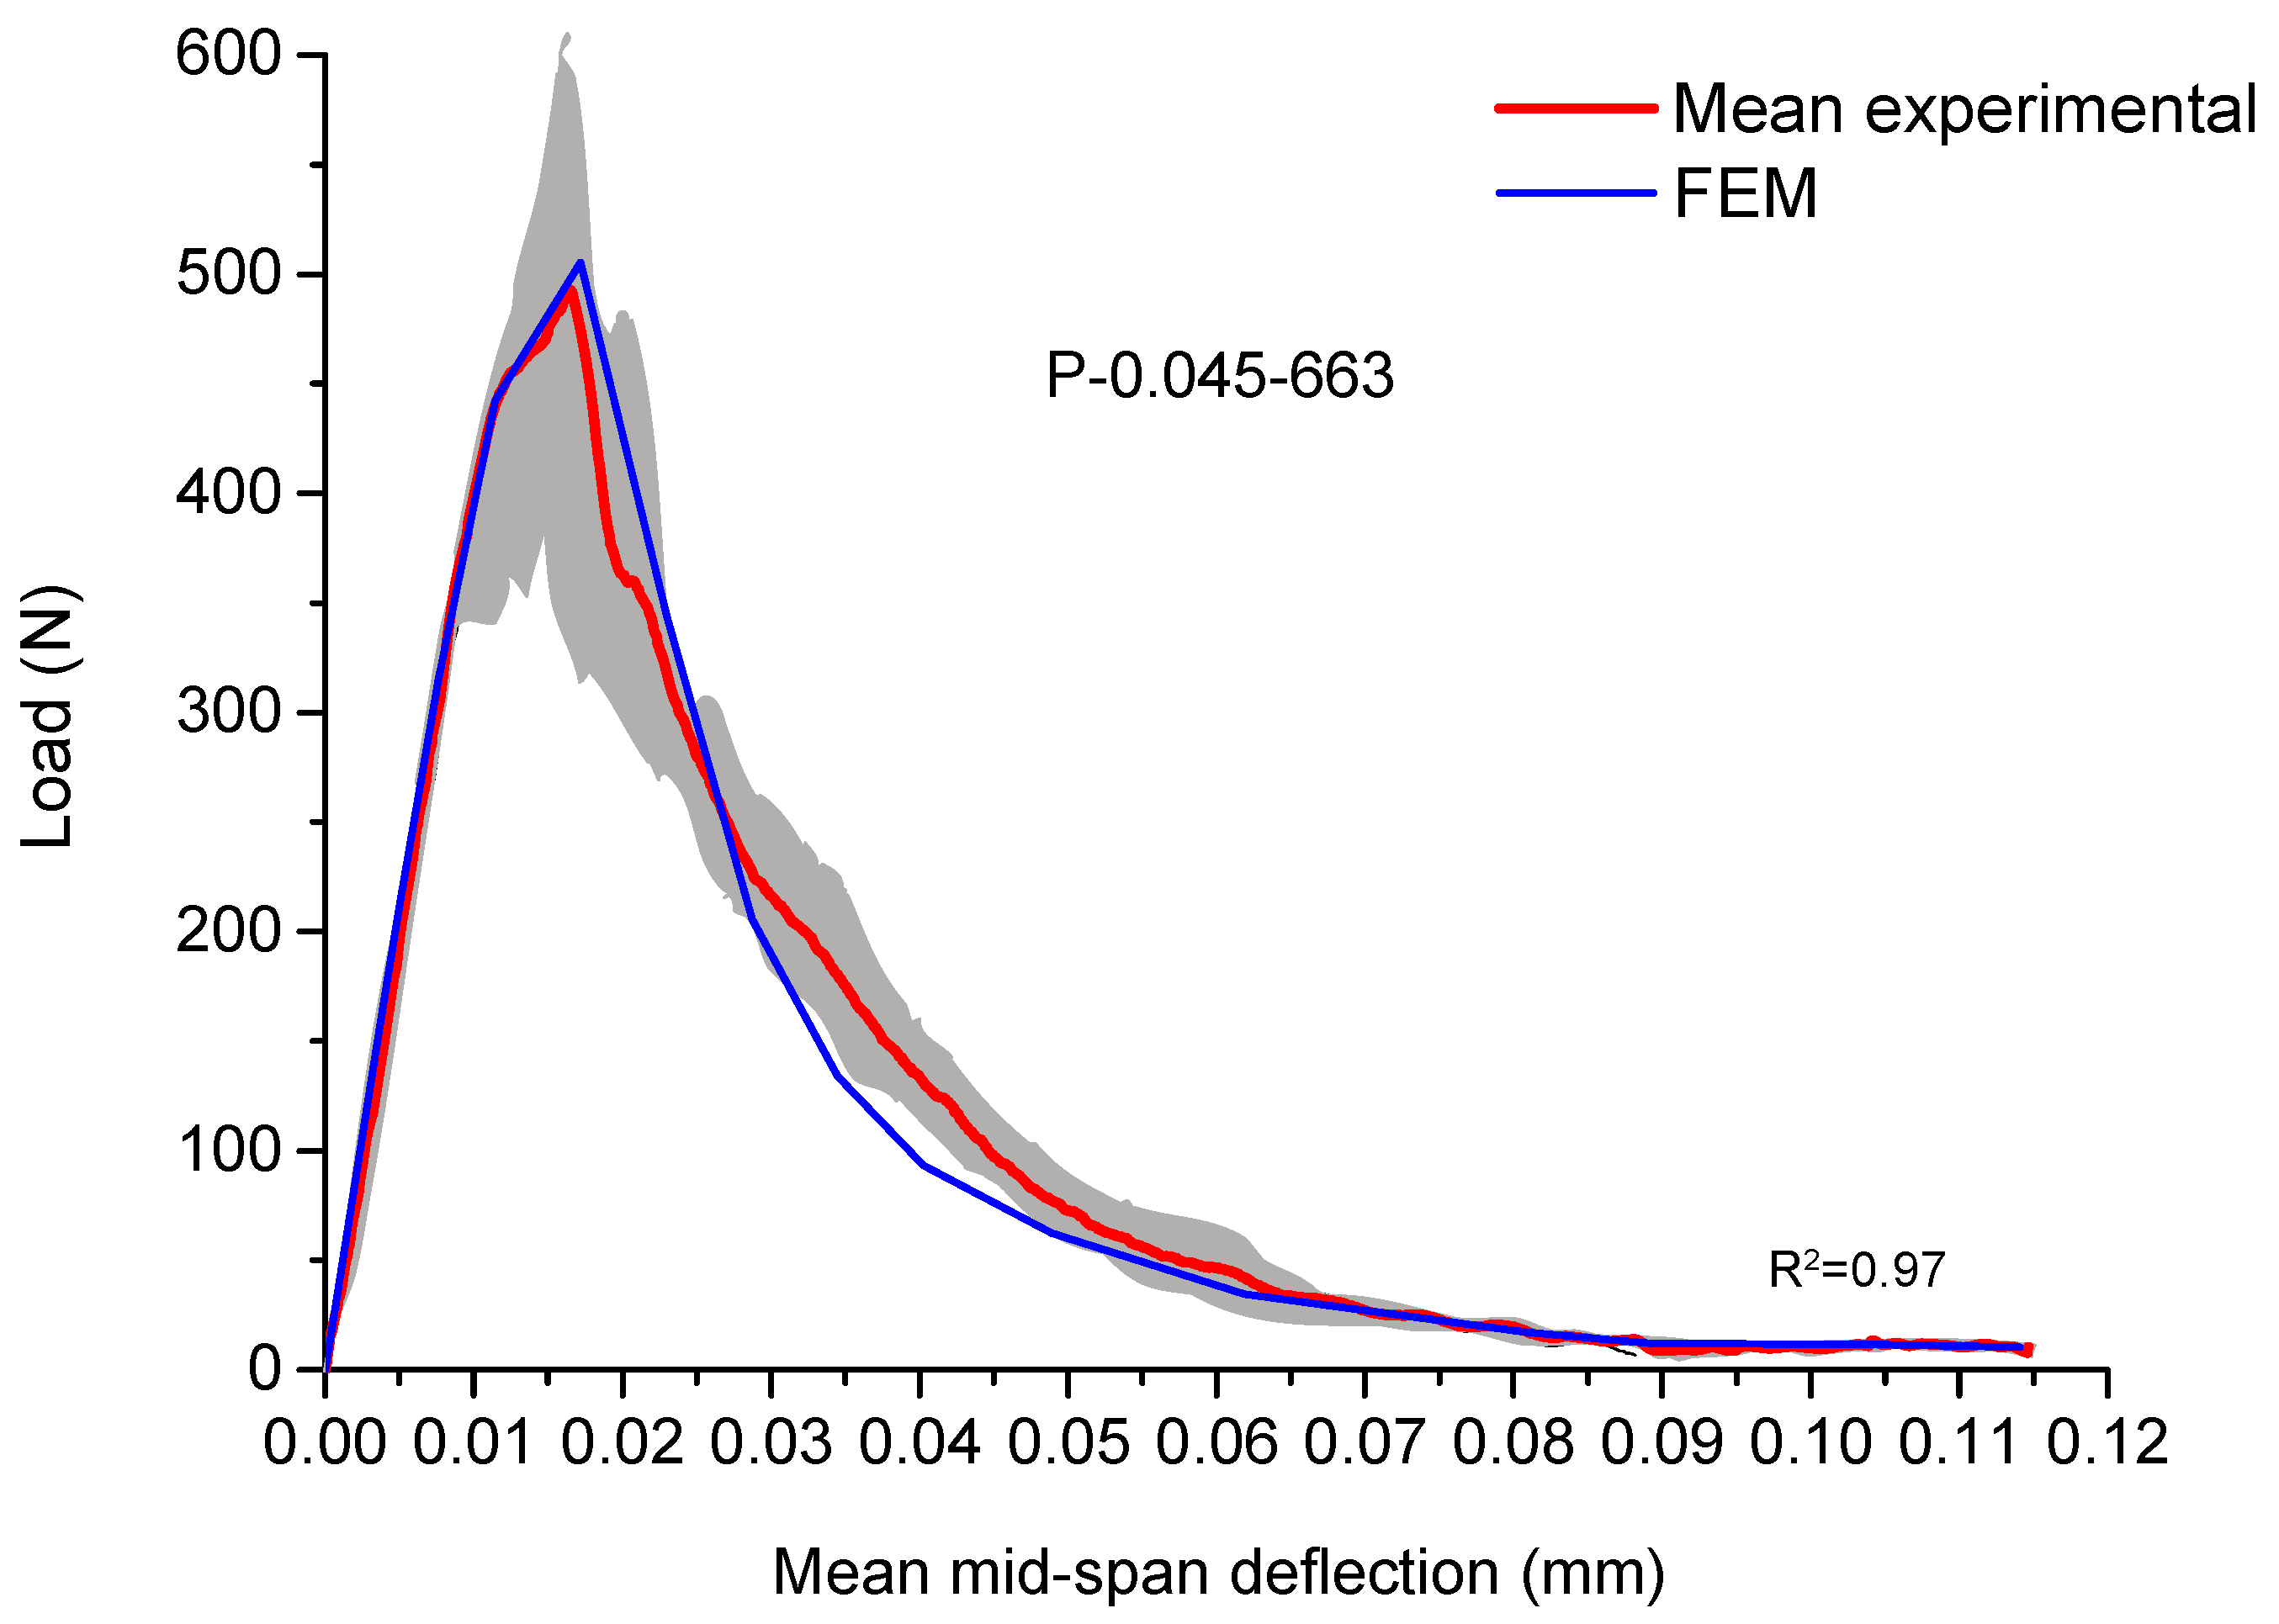
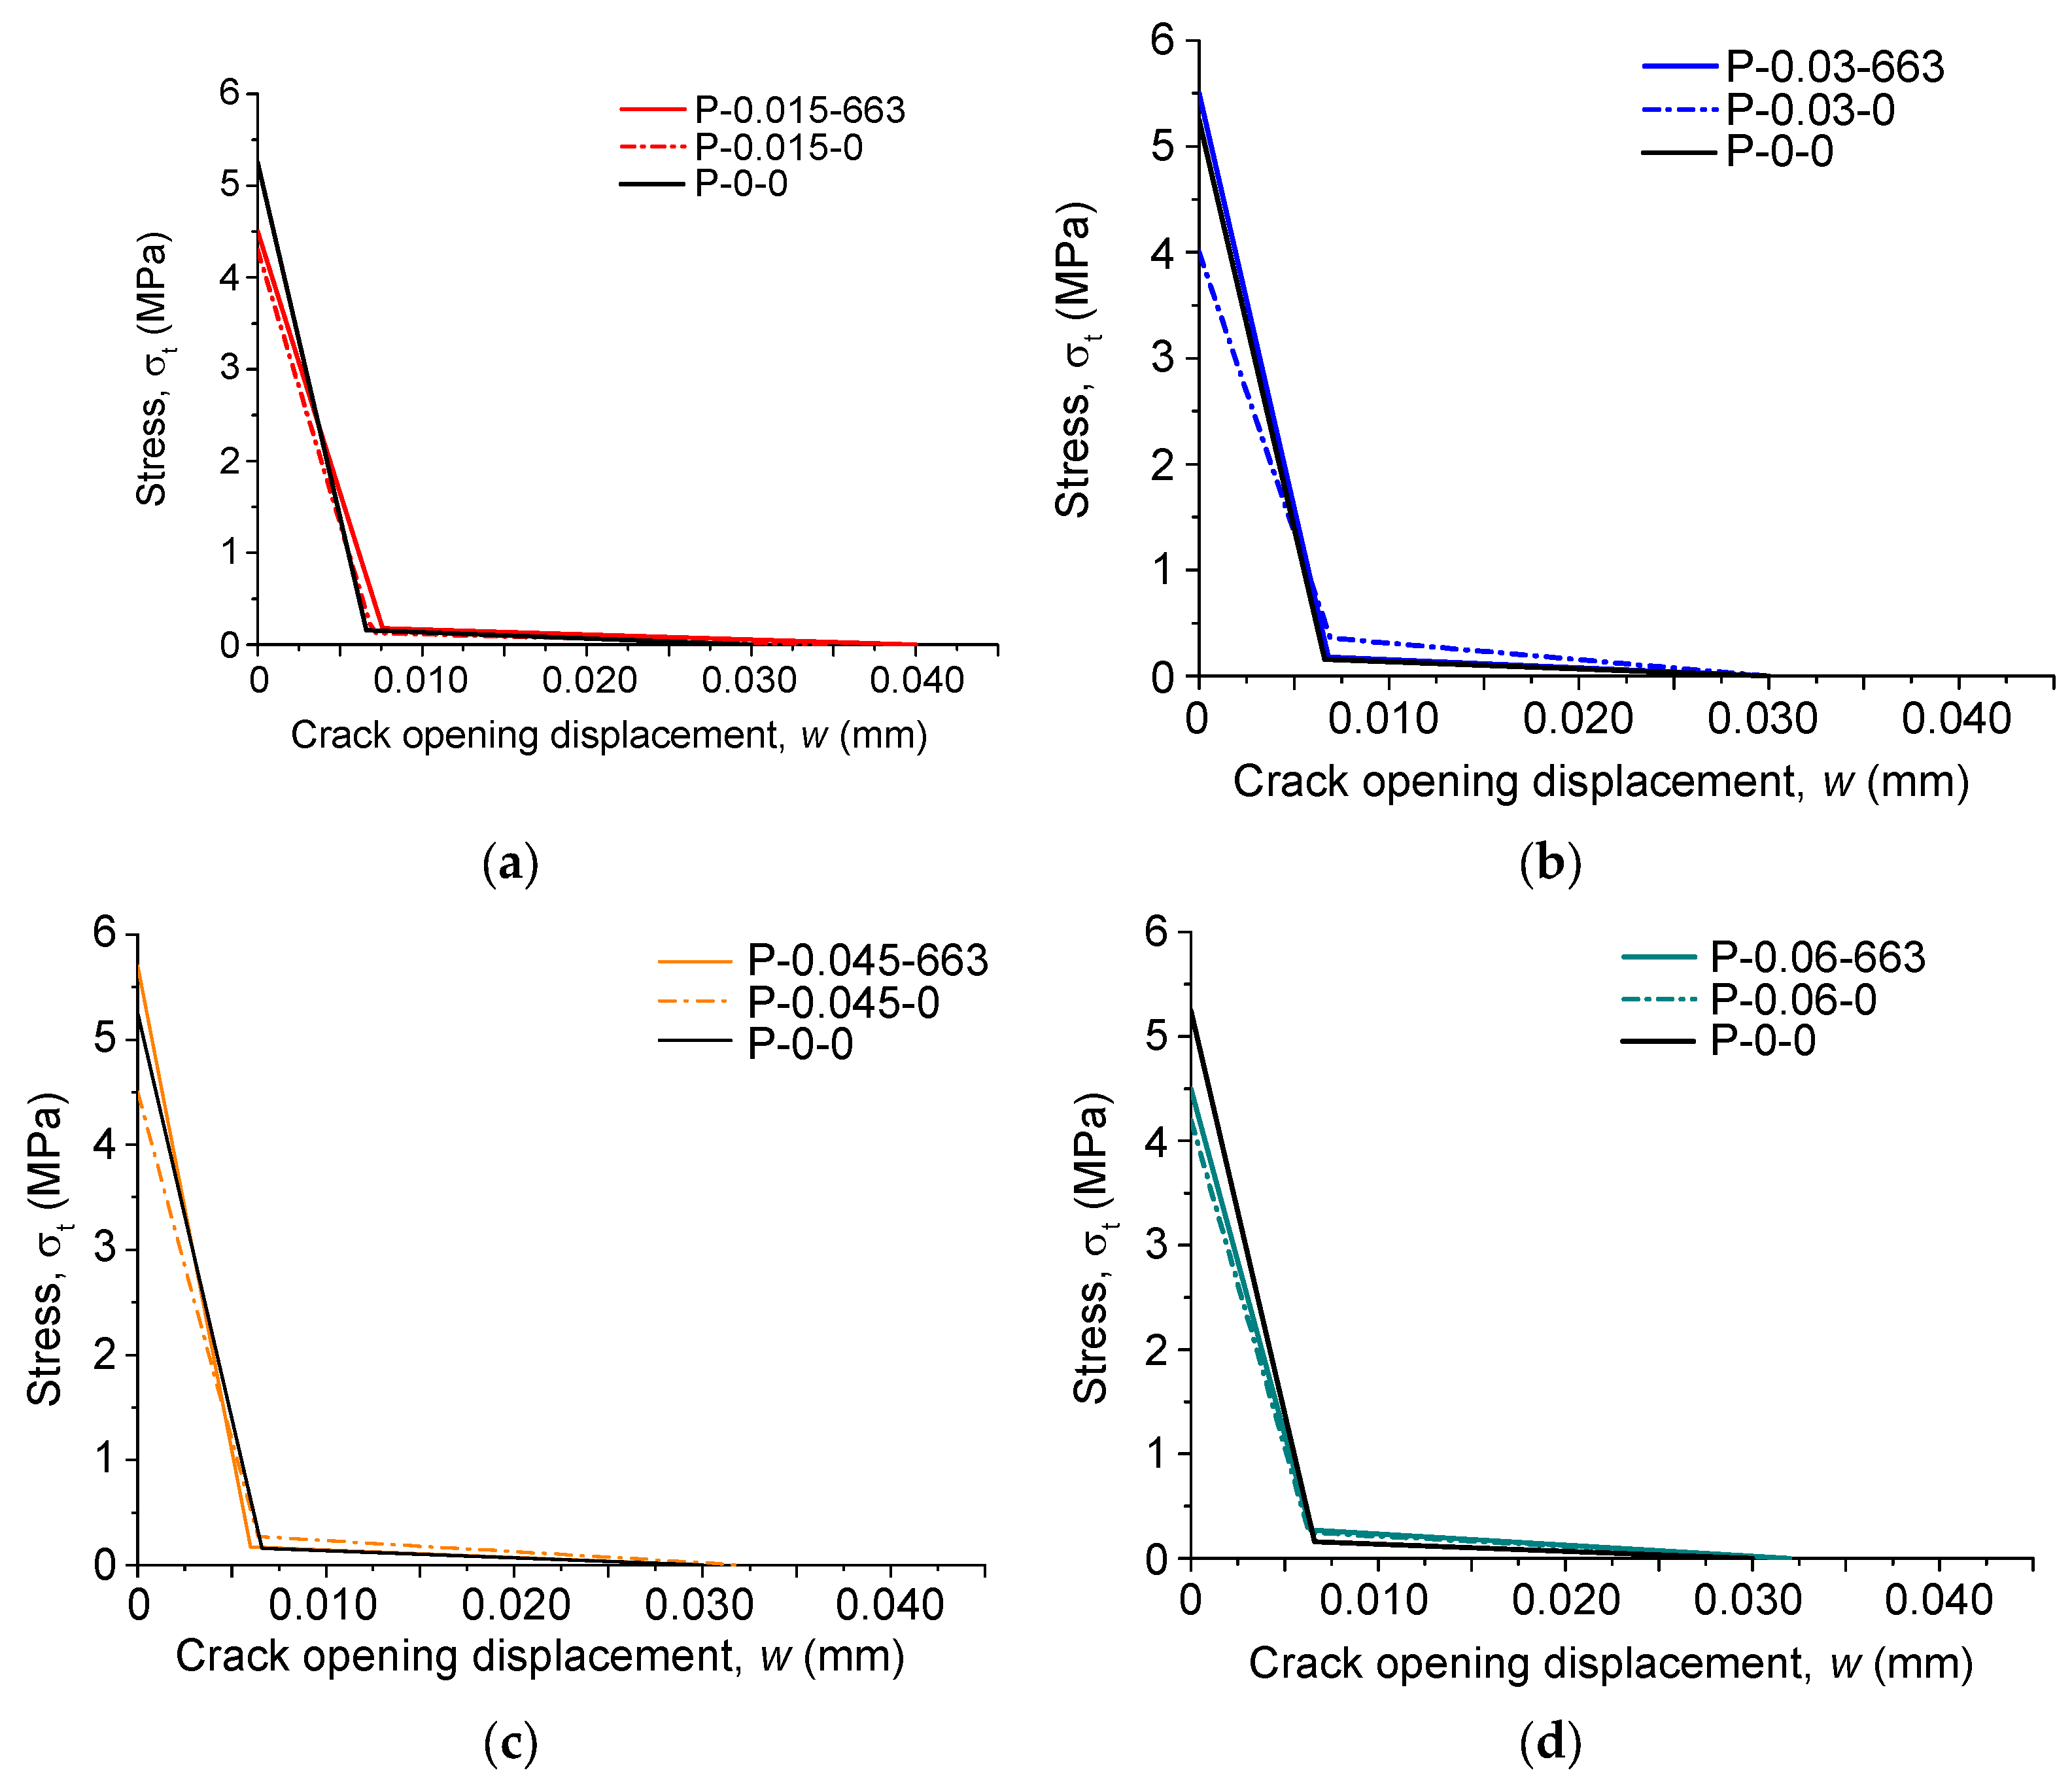
4.3. Fracture Behavior

The size-independent fracture energy was calculated using the RILEM work-of-fracture method and experimental three-point bending tests. Additionally, bilinear tension softening diagrams (σt − w) were obtained using the non-linear hinge model described in [69]. The average values of size-independent fracture energy obtained from three experimental tests by mix are shown in Table 5.
In cement pastes, the crack fracture mechanism is a critical aspect that influences the material’s structural integrity and durability. The process of crack formation and propagation in cementitious materials can be complex, involving several microstructural factors and environmental conditions [70]. Cracks in cement paste typically initiate at points of stress concentration, such as pores, microcracks, or inclusions within the matrix. Once a crack initiates, its propagation is governed by the fracture mechanics of the material.
Based on the fracture energy results, it is observed that the addition of GO sheets does not generate a clear trend towards improving the overall fracture energy. Nonetheless, a trend is observed with the pore distribution of the pastes, which is partially related to the addition of graphene sheets. The lowest fracture energy value is obtained for the P–0.045–0 paste, which had the lowest value for capillary pores and macropores, and the second lowest in the micropore range (Table 4). The lower overall fracture energy is due to the fact that a denser cement paste matrix exhibits more brittle behavior.
On the other hand, the highest total fracture energy value was achieved for P–0.015–0 (21.4%). This paste exhibits the highest number of capillary pores and micropores, except for the reference paste (Table 4). A greater number of capillary pores and micropores can lead to a less brittle matrix [66], as observed in this case. We will proceed with a more detailed analysis of the remaining properties that influence fracture behavior.
On the other hand, a two-dimensional FE model of the three-point bending test was developed and fitted to the experimental results, as described in Section 3.1, to identify the parameters that define the cohesive laws of each paste. Figure 11 shows the experimental and FE mean load-displacement curves for P–0.045–663. The minimum acceptable requirements for numerical fitting of the cohesive law parameters are an R-squared value greater than 0.95 of the FE results in relation to the experimental load-displacement curves. The cohesive laws and their parameters obtained with this procedure are shown in Figure 12 and Table 6, respectively.
Concrete fracture necessitates the formation of the well-known Fracture Process Zone (FPZ) [56], involving micro-cracking, coalescence, crack branching, and frictional interlocking as indicated by the weak interfacial transition zone (ITZ) between aggregates and cement paste [71]. Based on Hillerborg’s fictitious crack model [72], cohesive normal stresses develop within the FPZ prior to a pre-existing crack, with a value equal to the material’s tensile strength at the crack tip, followed by a descending part (softening) until the stresses reach zero at the end of the FPZ. The distribution of these cohesive stresses is typically represented by a bilinear softening diagram [73] in which the normal stress, σ, is a function of the crack opening width, w, in the FPZ (Figure 6). The first linear branch of the softening diagram is primarily related to microcracking, whereas the second linear branch is a result of the frictional aggregate interlock [74,75]. It is worth noting that the fracture energy of the second branch, GF-Gf (Table 6), will not have a significant impact on the total fracture energy, as the cement pastes do not contain aggregates nor fibers [76]. Cohesive models can also be used to investigate the fracture behavior of this type of quasi-brittle material when a crack (or notch) already exists [77].
In the case of tensile strength, the maximum value was obtained for the sample P–0.045–663, with an increase of 7.5% compared to the reference paste (Figure 12). This increase is due to the fact that this sample has the lowest amount of micropores and the second lowest amount of capillary and macropores (Table 4). On the other hand, the sample P–0.030–663 showed the second highest tensile strength, with an increase of 3.7% compared to the reference paste. In this case, the lowest presence of pores is found in the micropores. Therefore, it can be confirmed that micropores have a greater impact on the tensile strength of the paste. Additionally, if this paste has a low amount of capillary and macropores, this property is further enhanced.
Regarding the fracture energy (Gf), it is observed that the highest value was obtained for the sample P–0.030–663. This matrix presents a balanced combination of low capillary pore and micropore values, along with high tensile strength. This combination ensures that once the tensile strength of the material is reached, the fracture is not as abrupt, and a greater amount of energy is required to fracture the paste.
As all specimens were the same size, it is feasible to carry out a ductility analysis primarily centered on the results of the characteristic length [76,77], so that the higher the lch, the higher the ductility of the paste. The characteristic length may be written in terms of three parameters:
l c h = E c G F f t 2
where Ec is Young’s modulus, GF is the fracture energy, and ft is the tensile strength.
The lowest value was obtained for the P–0.045–663 paste, indicating that it has a more brittle fracture process zone. This is because it was the paste with the lowest amount of capillary pores and micropores, combined with the highest tensile strength. It can be observed that, in general, non-sonicated pastes presented a greater characteristic length (P–0.015, P–0.030, and P–0.060), coinciding with lower tensile strength and a higher amount of capillary pores and micropores. Therefore, it can be established that there is a direct relationship between the amount of capillary pores and micropores and the characteristic length of the paste.

5. Conclusions

In this work, the effects of the addition of GO solutions with different concentrations on the microstructure of cement paste and how it affects its mechanical and fracture behavior have been assessed. From the results, the following conclusions can be drawn:
  • Proper ultrasonication should adjust the size of the GO to match the pore sizes of the original paste, rather than making the GO as small as possible. If sonication produces a particle size that is too small for the pore size of the matrix intended for reinforcement, the effect of the GO on porosity will be negligible.
  • The P–0.03–663 exhibits the highest fracture energy at 7.8% compared to non-reinforced paste. This is primarily attributed to the optimal combination of capillary and micropores, resulting in elevated tensile strength and consequently higher fracture energy.
  • The lowest characteristic length was observed for the P–0.045–663 fundamentally influenced by the reduced combination of capillary pores and micropores, which leads to a more brittle matrix.
  • The tensile strength of the material is more influenced by the micropores than by the capillary pores; it is higher when the GO is sonicated, and the maximum value was obtained for the sample P–0.045–663.

Author Contributions

Conceptualization, M.P.A. and C.L.; methodology, J.D.R. and H.C.; validation, A.M.d.l.C. and J.D.R.; formal analysis, J.D.R. and C.L.; investigation, J.D.R. and A.M.d.l.C.; resources, M.P.A. and H.C.; data curation, J.D.R. and C.L.; writing—original draft preparation, C.L. and J.D.R.; writing—review and editing, H.C. and M.P.A.; project administration, M.P.A. and H.C. All authors have read and agreed to the published version of the manuscript.

Funding

This research has been funded by the “Consejería de Economía y Conocimiento” of the Andalusian Government under grant number US-1266248 and by the “Ministerio de Ciencia e Innovación” of the Spanish Government under grant number PID2019-110928RB-C33.

Data Availability Statement

The original contributions presented in the study are included in the article; further inquiries can be directed to the corresponding author.

Conflicts of Interest

The authors declare no conflicts of interest.

References

  1. Jiang, C.; Fan, K.; Wu, F.; Chen, D. Experimental study on the mechanical properties and microstructure of chopped basalt fibre reinforced concrete. Mater. Des. 2014, 58, 187–193. [Google Scholar] [CrossRef]
  2. Van Mier, J.G.M.; Van Vliet, M.R.A. Influence of microstructure of concrete on size/scale effects in tensile fracture. Eng. Fract. Mech. 2003, 70, 2281–2306. [Google Scholar] [CrossRef]
  3. Ren, J.; Lai, Y. Study on the durability and failure mechanism of concrete modified with nanoparticles and polypropylene fiber under freeze-thaw cycles and sulfate attack. Cold Reg. Sci. Technol. 2021, 188, 103301. [Google Scholar] [CrossRef]
  4. Ríos, J.D.; Leiva, C.; Ariza, M.P.; Seitl, S.; Cifuentes, H. Analysis of the tensile fracture properties of ultra-high-strength fiber-reinforced concrete with different types of steel fibers by X-ray tomography. Mater. Des. 2019, 165, 107582. [Google Scholar] [CrossRef]
  5. Ríos, J.D.; Cifuentes, H.; Leiva, C.; Seitl, S. Analysis of the mechanical and fracture behavior of heated ultra-high-performance fiber-reinforced concrete by X-ray computed tomography. Cem. Concr. Res. 2019, 119, 77–88. [Google Scholar] [CrossRef]
  6. Cong, X.; Qiu, T.; Xu, J.; Liu, X.; Wang, L.; Wang, Y.; Chen, C.; Zhao, L.; Xing, C.; Tan, Y. Study on the effectiveness of fibre reinforcement on the engineering performance of foamed concrete. Case Stud. Constr. Mater. 2022, 16, e01015. [Google Scholar] [CrossRef]
  7. Zhang, B.; Feng, Y.; Xie, J.; He, J.; Zhang, Y.; Cai, C.; Huang, D.; Li, L. Effects of fibres on ultra-lightweight high strength concrete: Dynamic behaviour and microstructures. Cem. Concr. Compos. 2022, 128, 104417. [Google Scholar] [CrossRef]
  8. Puentes, J.; Barluenga, G.; Palomar, I. Effects of nano-components on early age cracking of self-compacting concretes. Constr. Build. Mater. 2014, 73, 89–96. [Google Scholar] [CrossRef]
  9. Chen, J.; Zhao, D.; Ge, H.; Wang, J. Graphene oxide-deposited carbon fiber/cement composites for electromagnetic interference shielding application. Constr. Build. Mater. 2015, 84, 66–72. [Google Scholar] [CrossRef]
  10. Hawreen, A.; Bogas, J.A. Creep, shrinkage and mechanical properties of concrete reinforced with different types of carbon nanotubes. Constr. Build. Mater. 2019, 198, 70–81. [Google Scholar] [CrossRef]
  11. Liew, K.M.; Kai, M.F.; Zhang, L.W. Carbon nanotube reinforced cementitious composites: An overview. Compos. Part A Appl. Sci. Manuf. 2016, 91, 301–323. [Google Scholar] [CrossRef]
  12. Wang, B.; Zhao, R. Effect of graphene nano-sheets on the chloride penetration and microstructure of the cement based composite. Constr. Build. Mater. 2018, 161, 715–722. [Google Scholar] [CrossRef]
  13. e Silva, R.A.; de Castro Guetti, P.; da Luz, M.S.; Rouxinol, F.; Gelamo, R.V. Enhanced properties of cement mortars with multilayer graphene nanoparticles. Constr. Build. Mater. 2017, 149, 378–385. [Google Scholar] [CrossRef]
  14. Li, G.; Yuan, J.B.; Zhang, Y.H.; Zhang, N.; Liew, K.M. Microstructure and mechanical performance of graphene reinforced cementitious composites. Compos. Part A Appl. Sci. Manuf. 2018, 114, 188–195. [Google Scholar] [CrossRef]
  15. Xu, J.; Zhang, D. Pressure-sensitive properties of emulsion modified graphene nanoplatelets/cement composites. Cem. Concr. Compos. 2017, 84, 74–82. [Google Scholar] [CrossRef]
  16. Han, B.; Zheng, Q.; Sun, S.; Dong, S.; Zhang, L.; Yu, X.; Ou, J. Enhancing mechanisms of multi-layer graphenes to cementitious composites. Compos. Part A Appl. Sci. Manuf. 2017, 101, 143–150. [Google Scholar] [CrossRef]
  17. He, H.; Shuang, E.; Lu, D.; Hu, Y.; Yan, C.; Shan, H.; He, C. Deciphering size−induced influence of carbon dots on mechanical performance of cement composites. Constr. Build. Mater. 2024, 425, 136030. [Google Scholar] [CrossRef]
  18. Pan, Z.; He, L.; Qiu, L.; Korayem, A.H.; Li, G.; Zhu, J.W.; Collins, F.; Li, D.; Duan, W.H.; Wang, M.C. Mechanical properties and microstructure of a graphene oxide-cement composite. Cem. Concr. Compos. 2015, 58, 140–147. [Google Scholar] [CrossRef]
  19. Li, X.; Habibnejad, A.; Li, C.; Liu, Y.; He, H.; Sanjayan, J.G. Incorporation of graphene oxide and silica fume into cement paste: A study of dispersion and compressive strength. Constr. Build. Mater. 2016, 123, 327–335. [Google Scholar] [CrossRef]
  20. Lv, S.; Ma, Y.; Qiu, C.; Sun, T.; Liu, J.; Zhou, Q. Effect of graphene oxide nanosheets of microstructure and mechanical properties of cement composites. Constr. Build. Mater. 2013, 49, 121–127. [Google Scholar] [CrossRef]
  21. Jing, G.; Wu, J.; Lei, T.; Wang, S.; Strokova, V.; Nelyubova, V.; Wang, M.; Ye, Z. From graphene oxide to reduced graphene oxide: Enhanced hydration and compressive strength of cement composites. Constr. Build. Mater. 2020, 248, 118699. [Google Scholar] [CrossRef]
  22. Chintalapudi, K.; Mohan, R.; Pannem, R. An intense review on the performance of Graphene Oxide and reduced Graphene Oxide in an admixed cement system. Constr. Build. Mater. 2020, 259, 120598. [Google Scholar] [CrossRef]
  23. Yan, S.; He, P.; Jia, D.; Yang, Z.; Duan, X.; Wang, S.; Zhou, Y. Effect of reduced graphene oxide content on the microstructure and mechanical properties of graphene–geopolymer nanocomposites. Ceram. Int. 2016, 42, 752–758. [Google Scholar] [CrossRef]
  24. Jing, G.; Ye, Z.; Wu, J.; Wang, S.; Cheng, X.; Strokova, V. Introducing reduced graphene oxide to enhance the thermal properties of cement composites. Cem. Concr. Compos. 2020, 109, 103559. [Google Scholar] [CrossRef]
  25. Wang, M.; Yao, H.; Wang, R.; Zheng, S. Chemically functionalized graphene oxide as the additive for cement–matrix composite with enhanced fluidity and toughness. Constr. Build. Mater. 2017, 150, 150–156. [Google Scholar] [CrossRef]
  26. Qian, Y.; Abdallah, M.Y.; Kawashima, S. Characterization of Cement-Based Materials Modified with Graphene-Oxide. In Nanotechnology in Construction; Springer: Berlin/Heidelberg, Germany, 2015; pp. 259–264. [Google Scholar] [CrossRef]
  27. Zhao, L.; Guo, X.; Liu, Y.; Ge, C.; Chen, Z.; Guo, L.; Shu, X.; Liu, J. Investigation of dispersion behavior of GO modified by different water reducing agents in cement pore solution. Carbon 2018, 127, 255–269. [Google Scholar] [CrossRef]
  28. Kang, D.; Seo, K.S.; Lee, H.Y.; Chung, W. Experimental study on mechanical strength of GO-cement composites. Constr. Build. Mater. 2017, 131, 303–308. [Google Scholar] [CrossRef]
  29. Shamsaei, E.; de Souza, F.B.; Yao, X.; Benhelal, E.; Akbari, A.; Duan, W. Graphene-based nanosheets for stronger and more durable concrete: A review. Constr. Build. Mater. 2018, 183, 642–660. [Google Scholar] [CrossRef]
  30. Lu, Z.; Chen, B.; Leung, C.K.Y.; Li, Z.; Sun, G. Aggregation size effect of graphene oxide on its reinforcing efficiency to cement-based materials. Cem. Concr. Compos. 2019, 100, 85–91. [Google Scholar] [CrossRef]
  31. Murugan, M.; Santhanam, M.; Sen Gupta, S.; Pradeep, T.; Shah, S.P. Influence of 2D rGO nanosheets on the properties of OPC paste. Cem. Concr. Compos. 2016, 70, 48–59. [Google Scholar] [CrossRef]
  32. Guan, X.; Yu, L.; Li, H. Experimental study on fracture mechanics of cementitious materials reinforced by graphene oxide—Silica nanocomposites. Constr. Build. Mater. 2022, 325, 126758. [Google Scholar] [CrossRef]
  33. Zhao, L.; Guo, X.; Song, L.; Song, Y.; Dai, G.; Liu, J. An intensive review on the role of graphene oxide in cement-based materials. Constr. Build. Mater. 2020, 241, 117939. [Google Scholar] [CrossRef]
  34. Li, X.; Liu, Y.M.; Li, W.G.; Li, C.Y.; Sanjayan, J.G.; Duan, W.H.; Li, Z. Effects of graphene oxide agglomerates on workability, hydration, microstructure and compressive strength of cement paste. Constr. Build. Mater. 2017, 145, 402–410. [Google Scholar] [CrossRef]
  35. Yang, H.; Cui, H.; Tang, W.; Li, Z.; Han, N.; Xing, F. Composites: Part A A critical review on research progress of graphene/cement based composites. Compos. Part A Appl. Sci. Manuf. 2017, 102, 273–296. [Google Scholar] [CrossRef]
  36. Stobinski, L.; Lesiak, B.; Malolepszy, A.; Mazurkiewicz, M.; Mierzwa, B.; Zemek, J.; Jiricek, P.; Bieloshapka, I. Graphene oxide and reduced graphene oxide studied by the XRD, TEM and electron spectroscopy methods. J. Electron. Spectrosc. Relat. Phenom. 2014, 195, 145–154. [Google Scholar] [CrossRef]
  37. Vallurupalli, K.; Meng, W.; Liu, J.; Khayat, K.H. Effect of graphene oxide on rheology, hydration and strength development of cement paste. Constr. Build. Mater. 2020, 265, 120311. [Google Scholar] [CrossRef]
  38. Du, Y.; Yang, J.; Skariah, B.; Li, L.; Li, H. Influence of hybrid graphene oxide/carbon nanotubes on the mechanical properties and microstructure of magnesium potassium phosphate cement paste. Constr. Build. Mater. 2020, 260, 120449. [Google Scholar] [CrossRef]
  39. Akarsh, P.K.; Marathe, S.; Bhat, A.K. Influence of graphene oxide on properties of concrete in the presence of silica fumes and M-sand. Constr. Build. Mater. 2021, 268, 121093. [Google Scholar] [CrossRef]
  40. Akarsh, P.K.; Shrinidhi, D.; Marathe, S.; Bhat, A.K. Graphene oxide as nano-material in developing sustainable concrete—A brief review. Mater. Today Proc. 2022, 60, 234–246. [Google Scholar] [CrossRef]
  41. Rajesh, V.; Narendra Kumar, B. Influence of nano-structured graphene oxide on strength and performance characteristics of high strength fiber reinforced self compacting concrete. Mater. Today Proc. 2022, 60, 694–702. [Google Scholar] [CrossRef]
  42. Shang, Y.; Zhang, D.; Yang, C.; Liu, Y.; Liu, Y. Effect of graphene oxide on the rheological properties of cement pastes. Constr. Build. Mater. 2015, 96, 20–28. [Google Scholar] [CrossRef]
  43. Wang, Q.; Cui, X.; Wang, J.; Li, S.; Lv, C.; Dong, Y. Effect of fly ash on rheological properties of graphene oxide cement paste. Constr. Build. Mater. 2017, 138, 35–44. [Google Scholar] [CrossRef]
  44. Long, W.J.; Li, H.D.; Fang, C.L.; Xing, F. Uniformly dispersed and re-agglomerated graphene oxide-based cement pastes: A comparison of rheological properties, mechanical properties and microstructure. Nanomaterials 2018, 8, 31. [Google Scholar] [CrossRef] [PubMed]
  45. Mowlaei, R.; Lin, J.; Basquiroto, F.; Souza, D.; Fouladi, A.; Habibnejad, A.; Shamsaei, E.; Duan, W. The effects of graphene oxide-silica nanohybrids on the workability, hydration, and mechanical properties of Portland cement paste. Constr. Build. Mater. 2021, 266, 121016. [Google Scholar] [CrossRef]
  46. Jian, S.; Zou, B.; Collins, F.; Ling, X.; Majumber, M.; Hui, W. Predicting the influence of ultrasonication energy on the reinforcing efficiency of carbon nanotubes. Carbon 2014, 77, 1–10. [Google Scholar] [CrossRef]
  47. Gao, Y.; Jing, H.; Zhao, Z.; Shi, X.; Li, L. Influence of ultrasonication energy on reinforcing-roles of CNTs to strengthen ITZ and corresponding anti-permeability properties of concrete. Constr. Build. Mater. 2021, 303, 124451. [Google Scholar] [CrossRef]
  48. Peng, H.; Ge, Y.; Cai, C.S.; Zhang, Y.; Liu, Z. Mechanical properties and microstructure of graphene oxide cement-based composites. Constr. Build. Mater. 2019, 194, 102–109. [Google Scholar] [CrossRef]
  49. Jing, G.; Xu, K.; Feng, H.; Wu, J.; Wang, S.; Li, Q.; Cheng, X.; Ye, Z. The non-uniform spatial dispersion of graphene oxide: A step forward to understand the inconsistent properties of cement composites. Constr. Build. Mater. 2020, 264, 120729. [Google Scholar] [CrossRef]
  50. Lee, A.Y.; Yang, K.; Anh, N.D.; Park, C.; Lee, S.M.; Lee, T.G.; Jeong, M.S. Raman study of D* band in graphene oxide and its correlation with reduction. Appl. Surf. Sci. 2021, 536, 147990. [Google Scholar] [CrossRef]
  51. Suescum-Morales, D.; Ríos, J.D.; Martínez-De La Concha, A.; Cifuentes, H.; Jiménez, J.R.; Fernández, J.M. Cement and Concrete Research Effect of moderate temperatures on compressive strength of ultra-high-performance concrete: A microstructural analysis. Cem. Concr. Res. 2021, 140, 106303. [Google Scholar] [CrossRef]
  52. Esquinas, A.R.; Álvarez, J.I.; Jiménez, J.R.; Fernández, J.M. Durability of selfcompacting concrete made from non-conforming fly ash from coal-fired power plants. Constr. Build. Mater. 2018, 189, 993–1006. [Google Scholar] [CrossRef]
  53. Bentz, D.P.; Haecker, C.J. An argument for using coarse cements in high-performance concretes. Cem. Concr. Res. 1999, 29, 615–618. [Google Scholar] [CrossRef]
  54. Qureshi, T.S.; Panesar, D.K. Nano reinforced cement paste composite with functionalized graphene and pristine graphene nanoplatelets. Compos. Part B 2020, 197, 108063. [Google Scholar] [CrossRef]
  55. Cai, Y.; Hou, P.; Cheng, X.; Du, P.; Ye, Z. The effects of nanoSiO2 on the properties of fresh and hardened cement-based materials through its dispersion with silica fume. Constr. Build. Mater. 2017, 148, 770–780. [Google Scholar] [CrossRef]
  56. Gao, Y.; Jing, H.W.; Chen, S.J.; Du, M.R.; Chen, W.Q.; Duan, W.H. Influence of ultrasonication on the dispersion and enhancing effect of graphene oxide–carbon nanotube hybrid nanoreinforcement in cementitious composite. Compos. Part B Eng. 2019, 164, 45–53. [Google Scholar] [CrossRef]
  57. Recommendation, R.D. Determination of the Fracture Energy of Mortar and Concrete by Means of Three-Point Bend Tests on Notched Beams. Mater. Struct. 1985, 18, 285–290. [Google Scholar] [CrossRef]
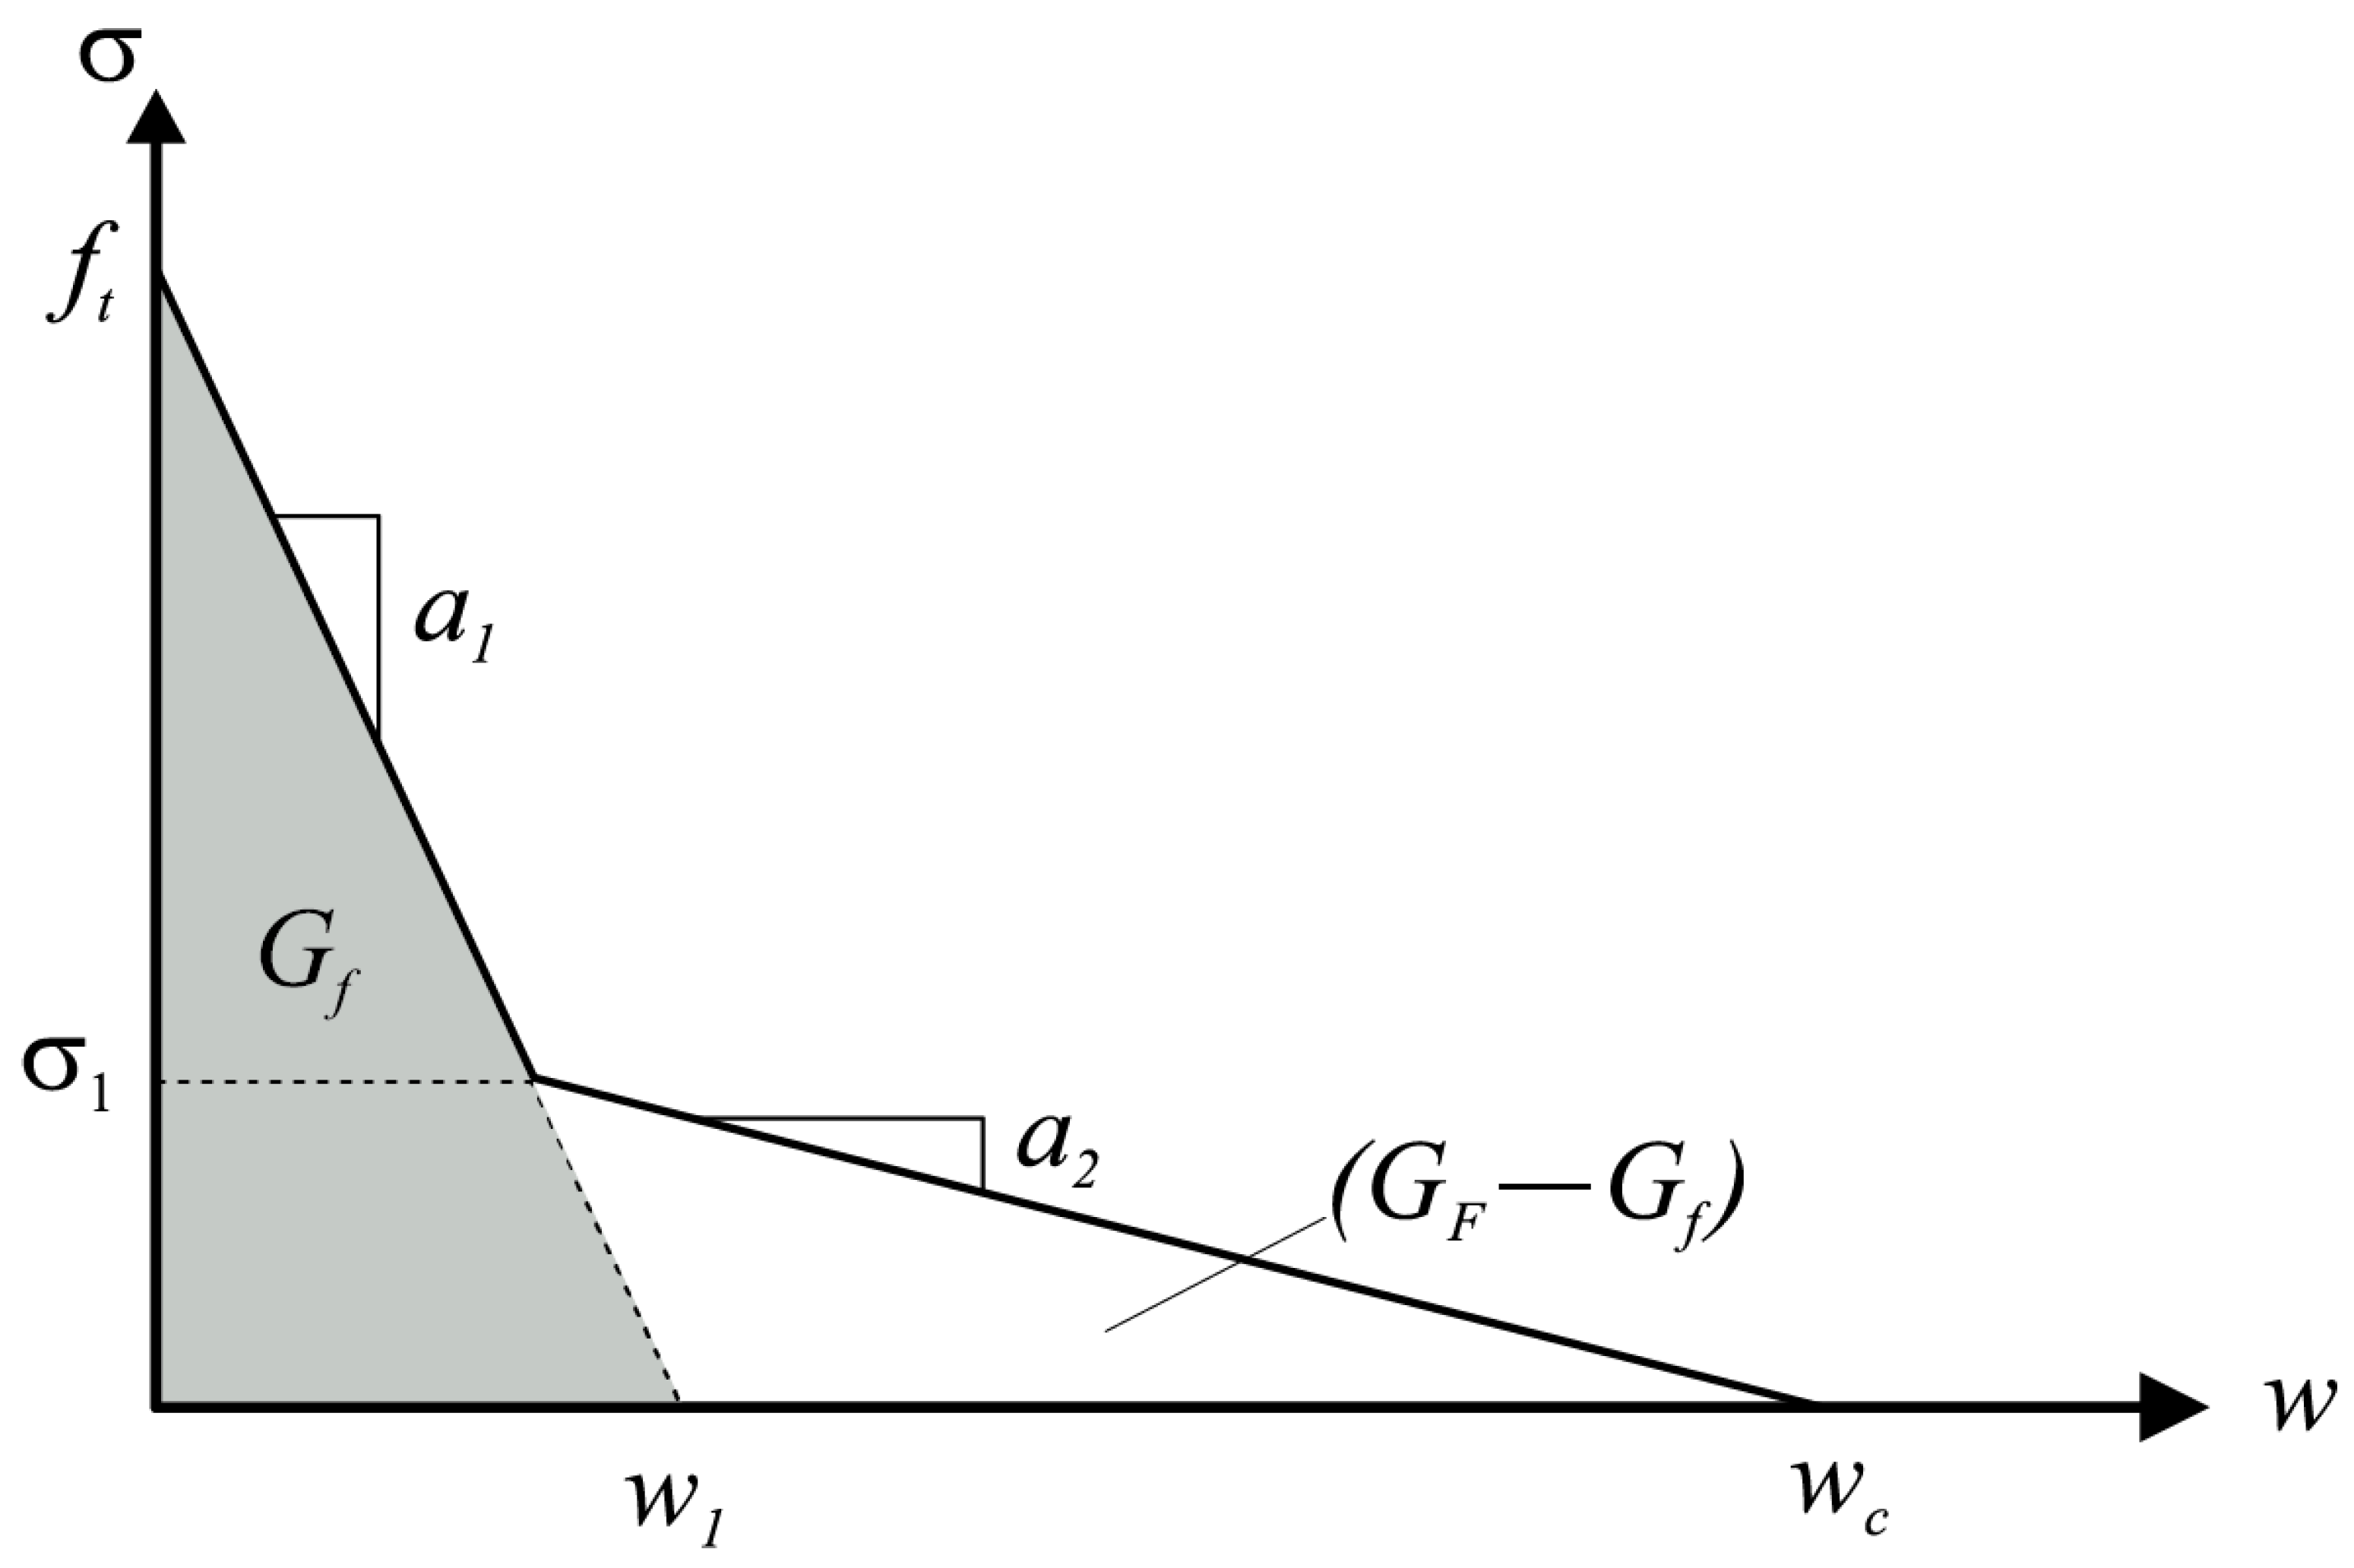
  58. Ramachandra Murthy, A.; Karihaloo, B.L.; Iyer, N.R.; Raghu Prasad, B.K. Bilinear tension softening diagrams of concrete mixes corresponding to their size−independent specific fracture energy. Constr. Build. Mater. 2013, 47, 1160–1166. [Google Scholar] [CrossRef]
  59. Abdalla, H.M.; Karihaloo, B.L. A method for constructing the bilinear tension softening diagram of concrete corresponding to its true fracture energy. Mag. Concr. Res. 2004, 56, 597–604. [Google Scholar] [CrossRef]
  60. Cifuentes, H.; Ríos, J.D.; Martínez-De La Concha, A. Analysis of the behavior of very high strength concrete subjected to thermal shock loading. Hormigón Y Acero 2022, 73, 73–79. [Google Scholar] [CrossRef]
  61. Martínez-de-la-Concha, A.; Ríos, J.D.; Cifuentes, H. Numerical Study of the Shear Behavior of Ultra-High-Performance Concrete Beams. Hormigón Y Acero 2023, 75, 157–162. [Google Scholar] [CrossRef]
  62. EN-12390-3: 2009; Testing Hardened Concrete Part 3: Compressive Strength of Test Specimens, AENOR. European Committee for Standarization (CEN): Brussels, Brussels, 2009.
  63. Swartz, S.E.; Shah, S.P.; Ouyang, C. Fracture Mechanics of Concrete; John Wiley & Sons: Hoboken, NJ, USA, 1995. [Google Scholar]
  64. Xiong, G.; Ren, Y.; Wang, C.; Zhang, Z.; Zhou, S.; Kuang, C.; Zhao, Y.; Guo, B.; Hong, S. Effect of power ultrasound assisted mixing on graphene oxide in cement paste: Dispersion, microstructure and mechanical properties. J. Build. Eng. 2023, 69, 106321. [Google Scholar] [CrossRef]
  65. Chacón Bonet, C.; Cifuentes Bulte, H.; Luna-Galiano, Y.; Rios, J.D.; Ariza, P.; Carlos, C.L. Exploring the impact of graphene oxide on mechanical and durability properties of mortars incorporating demolition waste: Micro and nano-pore structure effects. Mater. Construcción 2023, 73, e327. [Google Scholar] [CrossRef]
  66. Hong, X.; Lee, J.C.; Ng, J.L.; Md Yusof, Z.; He, Q.; Li, Q. Effect of Graphene Oxide on the Mechanical Properties and Durability of High-Strength Lightweight Concrete Containing Shale Ceramsite. Materials 2023, 16, 2756. [Google Scholar] [CrossRef] [PubMed]
  67. Ruiz Martinez, J.D.; Cifuentes, H.; Rios, J.D.; Ariza, P.; Leiva, C. Development of Mortars That Use Recycled Aggregates from a Sodium Silicate Process and the Influence of Graphene Oxide as a Nano-Addition. Materials 2023, 16, 7167. [Google Scholar] [CrossRef] [PubMed]
  68. Kendall, K.; Howard, A.J.; Birchall, J.D.; Pratt, P.L.; Proctor, B.A.; Jefferis, S.A.; Hirsch, P.B.; Birchall, J.D.; Double, D.D.; Kelly, A.; et al. The relation between porosity, microstructure and strength, and the approach to advanced cement-based materials. Philos. Trans. R. Soc. London. Ser. A Math. Phys. Sci. 1983, 310, 139–153. [Google Scholar] [CrossRef]
  69. Chen, X.; Wu, S.; Zhou, J. Influence of porosity on compressive and tensile strength of cement mortar. Constr. Build. Mater. 2013, 40, 869–874. [Google Scholar] [CrossRef]
  70. Fang, B.; Qian, Z.; Song, Y.; Diao, X.; Shi, T.; Cai, X.; Wang, L. Evaluation of early crack resistance performance of concrete mixed with ternary minerals using temperature stress testing machine (TSTM). J. Clean. Prod. 2024, 465, 142780. [Google Scholar] [CrossRef]
  71. Scrivener, K.L.; Crumbie, A.K.; Laugesen, P. The Interfacial Transition Zone (ITZ) Between Cement Paste and Aggregate in Concrete. Interface Sci. 2004, 12, 411–421. [Google Scholar] [CrossRef]
  72. Hillerborg, A.; Modéer, M.; Peterson, P.E. Analysis of crack formation and crack growth by means of fracture mechanics and finite elements. Cem. Concr. Res. 1976, 6, 773–781. [Google Scholar] [CrossRef]
  73. Bazant, Z.P. Concrete fracture models: Testing and practice. Eng. Fract. Mech. 2002, 69, 165–205. [Google Scholar] [CrossRef]
  74. Alyhya, W.S.; Dhaheer, M.S.A.; Karihaloo, B.L. Influence of mix composition and strength on the fracture properties of self−compacting concrete. Constr. Build. Mater. 2016, 110, 312–322. [Google Scholar] [CrossRef]
  75. Qureshi, T.S.; Panesar, D. Impact of graphene oxide and highly reduced graphene oxide on cement based composites. Constr. Build. Mater. 2019, 206, 71–83. [Google Scholar] [CrossRef]
  76. Xiao, J.; Lv, Z.; Duan, Z.; Zhang, C. Pore structure characteristics, modulation and its effect on concrete properties: A review. Constr. Build. Mater. 2023, 397, 132430. [Google Scholar] [CrossRef]
  77. Cifuentes, H.; Karihaloo, B.H. Determination of size−independent specific fracture energy of normal− and high−strength self−compacting concrete from wedge splitting tests. Constr. Build. Mater. 2013, 48, 548–553. [Google Scholar] [CrossRef]
Figure 1. Particle size distribution of cement as measured by laser diffraction.
Crystals 14 00707 g001
Figure 2. Particle size distribution of GO as measured by laser diffraction.
Crystals 14 00707 g002
Figure 3. GO sheet size distribution in the 0.03 wt% suspension at different ultrasonication energy levels.
Crystals 14 00707 g003
Figure 4. Evolution of GO sheet sizes with increasing ultrasonication energy for 0.030 wt%.
Crystals 14 00707 g004
Figure 5. Probe of ultrasonic device.
Crystals 14 00707 g005
Figure 6. Bilinear tension softening graph.
Crystals 14 00707 g006
Figure 7. Differential porosity curves for (a) P–0.015, (b) P–0.030, (c) P–0.045, and (d) P–0.060.
Crystals 14 00707 g007
Figure 8. Images from stereomicroscope for (a) P–0–0, (b) P–0.045–0, (c) P–0.06–0.
Crystals 14 00707 g008
Figure 9. Image from SEM for (a) P–0–0 and (b) P–0.045–0.
Crystals 14 00707 g009
Figure 10. (a) Compressive strength and (b) Young’s modulus for each GO content and ultrasonication.
Crystals 14 00707 g010
Figure 11. Experimental region, mean experimental, and FEM load vs. mid-span deflection curves of P–0.045–663 with squared error of comparison.
Crystals 14 00707 g011
Figure 12. Bilinear stress-crack opening displacement law: (a) 0.015%, (b) 0.030%, (c) 0.045%, and (d) 0.060% GO content.
Crystals 14 00707 g012
Table 1. XRF chemical composition of cement [wt%].
CaOAl2O3SiO2SO3Fe2O3K2OMgONa2OTiO2
45.616.5918.294.022.851.0910.290.41
P2O5Cl2O3BaOMnO2SrOCuOZnOLOITotal
0.130.070.060.050.050.040.0219.43100
Table 2. Ultrasonication analyses parameters and results of dispersion.
Time
(min)
Ultrasonication Energy (J/mL)Min. GO Sheet Size (μm)Max. GO Sheet Size (μm)Mean GO Sheet Size (μm)
000.483 ± 14.7%5.90 ± 87.7%3.10 ± 74.4%
102240.255 ± 3.4%0.99 ± 0.3%0.572 ± 0.1%
152990.250 ± 0.0%0.99 ± 0.3%0.544 ± 0.5%
306630.211 ± 0.0%0.89 ± 0.0%0.465 ± 0.1%
4512040.199 ± 0.0%0.99 ± 0.3%0.492 ± 0.1%
6015180.208 ± 12.1%0.99 ± 0.3%0.491 ± 1.1%
9018310.203 ± 6.5%1.03 ± 3.4%0.536 ± 4.9%
12025820.223 ± 0.0%1.17 ± 6.8%0.639 ± 8.4%
Table 3. Mix proportions, nomenclature, and sonication energy. Note: The generic nomenclature used in this work is P–X1–X2, in which P denotes paste, X1 denotes the GO concentration in percentage by cement weight, and X2 denotes the ultrasonication energy transferred to the solution used for manufacturing each paste.
Cement (kg/m3)w/c RatioGO (%)Ultrasonication Energy (J/mL)
P–0–014000.3500
P–0.015–014000.350.0150
P–0.015–66314000.350.015663
P–0.03–014000.350.030
P–0.03–66314000.350.03663
P–0.045–014000.350.0450
P–0.045–66314000.350.045663
P–0.06–014000.350.060
P–0.06–66314000.350.06663
Table 4. Pore volume for each range of each paste and ultrasonication level.
Pore Volume (mL/g)
<500 nm500–8000 nm>8000 nm
P–0–01.70 ± 0.050.076 ± 0.0040.062 ± 0.004
P–0.015–01.59 ± 0.040.049 ± 0.0030.060 ± 0.005
P–0.015–301.26 ± 0.030.044 ± 0.0030.069 ± 0.004
P–0.03–01.19 ± 0.040.049 ± 0.0060.061 ± 0.005
P–0.03–301.15 ± 0.040.041 ± 0.0030.066 ± 0.005
P–0.045–00.85 ± 0.010.028 ± 0.0020.056 ± 0.004
P–0.045–300.94 ± 0.010.022 ± 0.0020.061 ± 0.004
P–0.06–01.21 ± 0.020.047 ± 0.0030.099 ± 0.006
P–0.06–301.11 ± 0.030.045 ± 0.0050.065 ± 0.005
Table 5. Size independent fracture energy of each GO content and ultrasonication level.
MixFracture Energy, GF (N/m)
P–0–020.5 ± 3.7
P–0.015–024.9 ± 1.5
P–0.015–66321.8 ± 1.5
P–0.030–022.3 ± 2.4
P–0.030–66321.9 ± 1.6
P–0.045–021.6 ± 2.3
P–0.045–66319.6 ± 1.9
P–0.060–021.9 ± 4.4
P–0.060–66322.2 ± 2.7
Table 6. Bilinear cohesive law parameters of each GO content and ultrasonication level.
ft (MPa)σ1 (MPa)a1
(mm−1)
a2
(mm−1)
w1 (mm) wu (mm)Gf (N/m)GF–Gf (N/m)Ec (GPa)lch
(m)
P–0–05.30.16771.66.70.00680.03017.851.819.70.015
P–0.01–04.30.13595.94.60.00720.03515.481.824.80.033
P–0.015–6634.50.18568.45.60.00750.04016.873.823.10.025
P–0.030–04.00.36527.515.60.00760.03015.204.024.50.034
P–0.030–6635.50.18771.66.70.00700.03019.252.223.00.017
P–0.045–04.50.27660.910.50.00680.03215.303.422.10.024
P–0.045–6635.70.17921.57.10.00620.03017.672.021.20.013
P–0.060–04.20.25660.910.50.00670.03214.073.224.20.030
P–0.060–6634.50.27660.910.50.00680.03215.303.423.50.026
Disclaimer/Publisher’s Note: The statements, opinions and data contained in all publications are solely those of the individual author(s) and contributor(s) and not of MDPI and/or the editor(s). MDPI and/or the editor(s) disclaim responsibility for any injury to people or property resulting from any ideas, methods, instructions or products referred to in the content.

