Article

A New Type of Acidic OH-Groups in the LTL Zeolite

by
Alessandro Contini
1,*,
Martin Jendrlin
1 and
Vladimir Zholobenko
1,2,*
1
School of Chemical and Physical Sciences, Keele University, Keele ST5 5BG, UK
2
Department of Chemistry, Moscow State University, Moscow 119991, Russia
*
Authors to whom correspondence should be addressed.
Crystals 2024, 14(8), 745; https://doi.org/10.3390/cryst14080745 (registering DOI)
Submission received: 19 July 2024 / Revised: 12 August 2024 / Accepted: 16 August 2024 / Published: 21 August 2024
(This article belongs to the Section Inorganic Crystalline Materials)

Abstract

:
Acidic properties of ion-exchanged LTL zeolites have been studied using FTIR spectroscopy, complemented by X-ray powder diffraction, SEM-EDX, XRF and N2 physisorption. Infrared spectra of the ion-exchanged zeolites show the presence of two intense bands of the bridging OH-groups: a narrow band at ~3640 cm−1 that is attributed to Si(OH)Al groups freely vibrating in 12 MR and a broad, intense band at ~3250 cm−1 that is assigned to bridging OH groups forming hydrogen bond with neighbouring oxygen atoms, e.g., in six-membered rings. The former can be selectively removed by caesium or rubidium cations with up to 3 Cs+ or Rb+ per unit cell readily ion-exchanged into the LTL zeolite, replacing an equivalent number of acidic OH-groups or K+ cations within the structure. The cation migration of the larger cation, evaluated by the Rietveld refinement method, occurs mostly via the main 12 MR channels. By contrast, less than 1 Li+ or Na+ cation per unit cell can be introduced under similar conditions. Accordingly, the concentration of Si(OH)Al groups in back-exchanged NH4-K-LTL with smaller cations (Li+, Na+) does not differ considerably from the concentration of Brønsted acid sites in the original NH4-K-LTL. Lower concentrations of acid sites have been detected in the samples back-exchanged with Cs+, Rb+ and K+. In addition, the acidic properties of NH4-LTL samples have been compared with a structurally related NH4-MAZ zeolite.

1. Introduction

Zeolites are crystalline microporous aluminosilicate materials that offer a wide variety of properties essential in many industrial processes and applications. Their structures consist of three-dimensional networks of SiO4 and AlO4 (TO4) tetrahedra, representing the primary building units linked together by sharing vertex oxygen atoms [1]. In general, the T-O-T bond angles can vary between 130 and 180 degrees, and the combination of TO4 units leads to the formation of a number of secondary building units (SBUs) and composite building units (CBUs). The combinations of SBU lead to a well-defined structure with channels and cavities generating micropores of different sizes and connectivity. The pore topology of zeolites is represented by 1D, 2D, and 3D channel structures [1,2]. Also, pore dimensions differ, generating three major types: small-pore (e.g., 8-membered rings or 8 MR), medium-pore (e.g., 10 MR) and large-pore zeolites (e.g., 12 MR). This leads to the effects of shape selectivity and size exclusion for molecules that enter zeolite channels [3,4,5,6], making these materials indispensable as selective catalysts and as molecular sieves in separation processes [7,8,9] as well as in ion exchange [10].
Linde-type L zeolite (LTL) is a crystalline aluminosilicate first synthesised in the 1950s [11,12]. The typical framework Si/Al ratio is about 3.0 in this zeolite [13], the unit cell of LTL is hexagonal (space group P6/mmm) with the lattice parameters a = 18.40 Å and c = 7.52 Å [2,14,15]. The LTL framework comprises polyhedral cancrinite (t-can) cages linked by double 6-rings (d6r), giving rise to the formation of t-ste and t-ltl cages and columns in the c-direction, thus leading to the formation of 12 MR channels with a diameter of 7.1 Å allowing access to the internal pore volume (Figure 1) [16,17].
As a large-pore zeolite, LTL is characterised by considerable sorption capacity. For instance, it has been utilised for the encapsulation of luminescent dyes [18] and in the field of optical sensing using lanthanide complexes [19]. More importantly, Pt-containing LTL has been employed in heterogeneous catalysis [14,20,21], e.g., in the aromatisation and dehydrogenation of n-hexane [22,23,24,25]. The distinctive catalytic properties of Pt/K-LTL have been attributed to its particular structural features and the lack of acid sites [26]. In addition, the presence of potassium cations, which neutralise acid sites, increases the electron density of the Pt particles [23]. It has also been reported that Pt/K-LTL catalytic activity is enhanced by Sn, used as a promoter, resulting in an improved catalytic performance of PtSn/K-LTL in n-hexane aromatisation [27]. In contrast, there are very few reports on the application of H-forms of zeolite LTL and its acidic properties [28,29], which are focused on their potential for future bio-refinery processes. For instance, the dehydration of ethanol opens a route to the production of ethylene from an alternative renewable feedstock, such as bioethanol [28], while aldol condensation reaction between furfural and ketones may be a conceivable route to value-added chemicals with a longer carbon chain from biomass-derived molecules utilising basic or acidic catalysts [29].
Zeolites LTL and MAZ have similar structures and look analogous when viewed along the [001] axis [30] (Figure S1). An equivalent relationship is observed with ZSM−10 and LZ−135 zeolites. MAZ was probably first synthesised in 1966 by Flanigen and Kellberg and much later reported as zeolite omega [31]. Its structure was determined by Galli [32,33] and Rinaldi et al. [34]. The unit cell of MAZ is hexagonal (space group P63/mmc) with the lattice parameters a = 18.392 Å and c = 7.646 Å [2]. The framework of mazzite is made of gmelinite cages linked via oxygen bridges, forming 12 MR channels with a diameter of 7.4 Å. There is also a system of 8 MR channels with a diameter of 0.31 Å that runs parallel to the 12 MR channel. The structural and acidic properties make MAZ suitable for applications in catalysis, such as the conversion of hydrocarbons [35,36].
Hence, this work is focused on the investigation of the acidic properties of ion-exchanged LTL samples as compared with MAZ, with a major emphasis on the understanding of the nature of their acid sites. This research has been carried out by employing Fourier transform infrared spectroscopy (FTIR) complemented by X-ray powder diffraction (XRD), scanning electron microscopy (SEM), X-ray fluorescence (XRF) and N2 physisorption. Furthermore, the ion-exchanged LTL zeolites have been evaluated using Rietveld refinement to monitor their modifications and to define the cation location.

2. Experimental

2.1. Materials

Ammonium nitrate (99+%) and caesium chloride (99+%) were purchased from Acros Organic. Sodium nitrate (98+%) and potassium nitrate (99%) were obtained from Alfa Aesar. Rubidium chloride (99%) was supplied by Sigma-Aldrich and lithium nitrate (99%) by Timstar Laboratory Suppliers. NaOH and HNO3 (>65%) were provided by Fisher, NaAlO2 (53% Al2O3), TMA-OH (25% solution) and LUDOX (40% SiO2) by Sigma Aldrich. The parent zeolite K-LTL (Si/Al = 3.1) was supplied by Tosoh.
A sample of mazzite was made according to the procedure described in [37] (see Supplementary Information, SI).
Several series of ion-exchanged samples were prepared from the parent K-LTL zeolite. The ion-exchange experiments were carried out in a stepwise manner in order to understand the cation migration as well as the nature and location of the acidic bridging OH-groups rather than to achieve complete ion exchange (see Table S1 for specific details for each sample).
Five series of M-NH4-K-LTL samples (where M refers to Li, Na, K, Rb and Cs) were prepared. In each preparation, 1 g of NH4-K-LTL was ion-exchanged with an alkali metal salt solution, and the solid/solution ratio was 1:20. The procedure was performed up to four times at increasing concentrations (0.01–0.04 M) of the ion-exchange solution. Masses of alkali salts used to prepare solutions at the concentrations described above were calculated to replace 33%, 66% and 100% of the NH4+ content in NH4-K-LTL. An additional two-fold 100% ion exchange was performed as the fourth step. The mixtures were stirred for 90 min at 40 °C. The recovered solids were washed with deionised water and dried overnight at 90 °C.

2.2. Characterisation

The materials prepared by ion exchange were characterised using X-ray diffraction, Rietveld refinement using Vesta V3.5.7 [38,39], MAUD V2.991 software [40,41] and structural data from databases [42,43] (all images presented in this work were generated using the data from the Database of Zeolite Structures available at [42]), scanning electron microscopy with energy-dispersive X-ray analysis (SEM-EDX, Hitachi TM 4000 II, 15 kV accelerating voltage), X-ray fluorescence (XRF), nitrogen adsorption–desorption and in situ FTIR spectroscopy [44]. Further details are available in the SI file and references [29,45], including the preparation of the samples for the analysis required to dissolve the powder of the material in HNO3 (>65%). Then, 200 mg of each sample was dissolved in 20 mL of HNO3. Each sample was prepared in a separate vessel. Samples were heated for 240 min at 180 °C. After the microwave digestion, solutions were diluted by adding 50 mL of deionised water, and ~10 mL of the solution was transferred from each vessel to a separated analysis tube and scanned at the ICP-OES.

3. Results and Discussion

3.1. SEM-EDX

The elemental analysis of the ion-exchanged zeolites was investigated using SEM-EDX analysis. Table 1 (and Figure S9a–f in SI) summarises chemical composition and textural data for the 4-fold ion-exchanged LTL zeolites. The Si/Al ratio of the parent K-LTL zeolite is 3.2, and the starting K/Al ratio is 1:1. The elemental analysis results suggest that K+ and Cs+ cations are more easily introduced into the LTL structure (up to ~10 at%) compared to Li+ and Na+ (up to ~1–3 at%). This can be rationalised based on the size of hydrated ions and coulombic interactions between the hydrated cations and the framework oxygens. It should be noted that part of the initial percentage of potassium in NH4-K-LTL represents potassium “locked” in the t-can cages that cannot be exchanged with other species. At the same time, all cations can access the LTL structure; most likely, they are introduced through the t-ltl cages in the main channels. However, hydrated Li+ and Na+, because of steric constraints, do not have access to some parts of the structure, such as the t-ste cages, which are only accessible via 8-membered rings with the size of 7.5 Å × 4.7 Å [2]. Since Rb+, Cs+ and K+ in their hydrated form can fit the 8 MR of the t-ste cage, they can reach the inner cages. A slight increase in the Si/Al ratio suggests a loss of Al for the samples exchanged with Rb+ and Cs+, which could be associated with a partial dealumination of the zeolite or by the removal of extra-framework Al species during ion exchange. Indeed, this is in agreement with the XRD data, indicating a marginal decrease in crystallinity observed for these samples as compared to the Li and Na forms. In addition, AlOH groups and Lewis acid sites have been detected in the FTIR spectra (see below).

3.2. N2 Physisorption
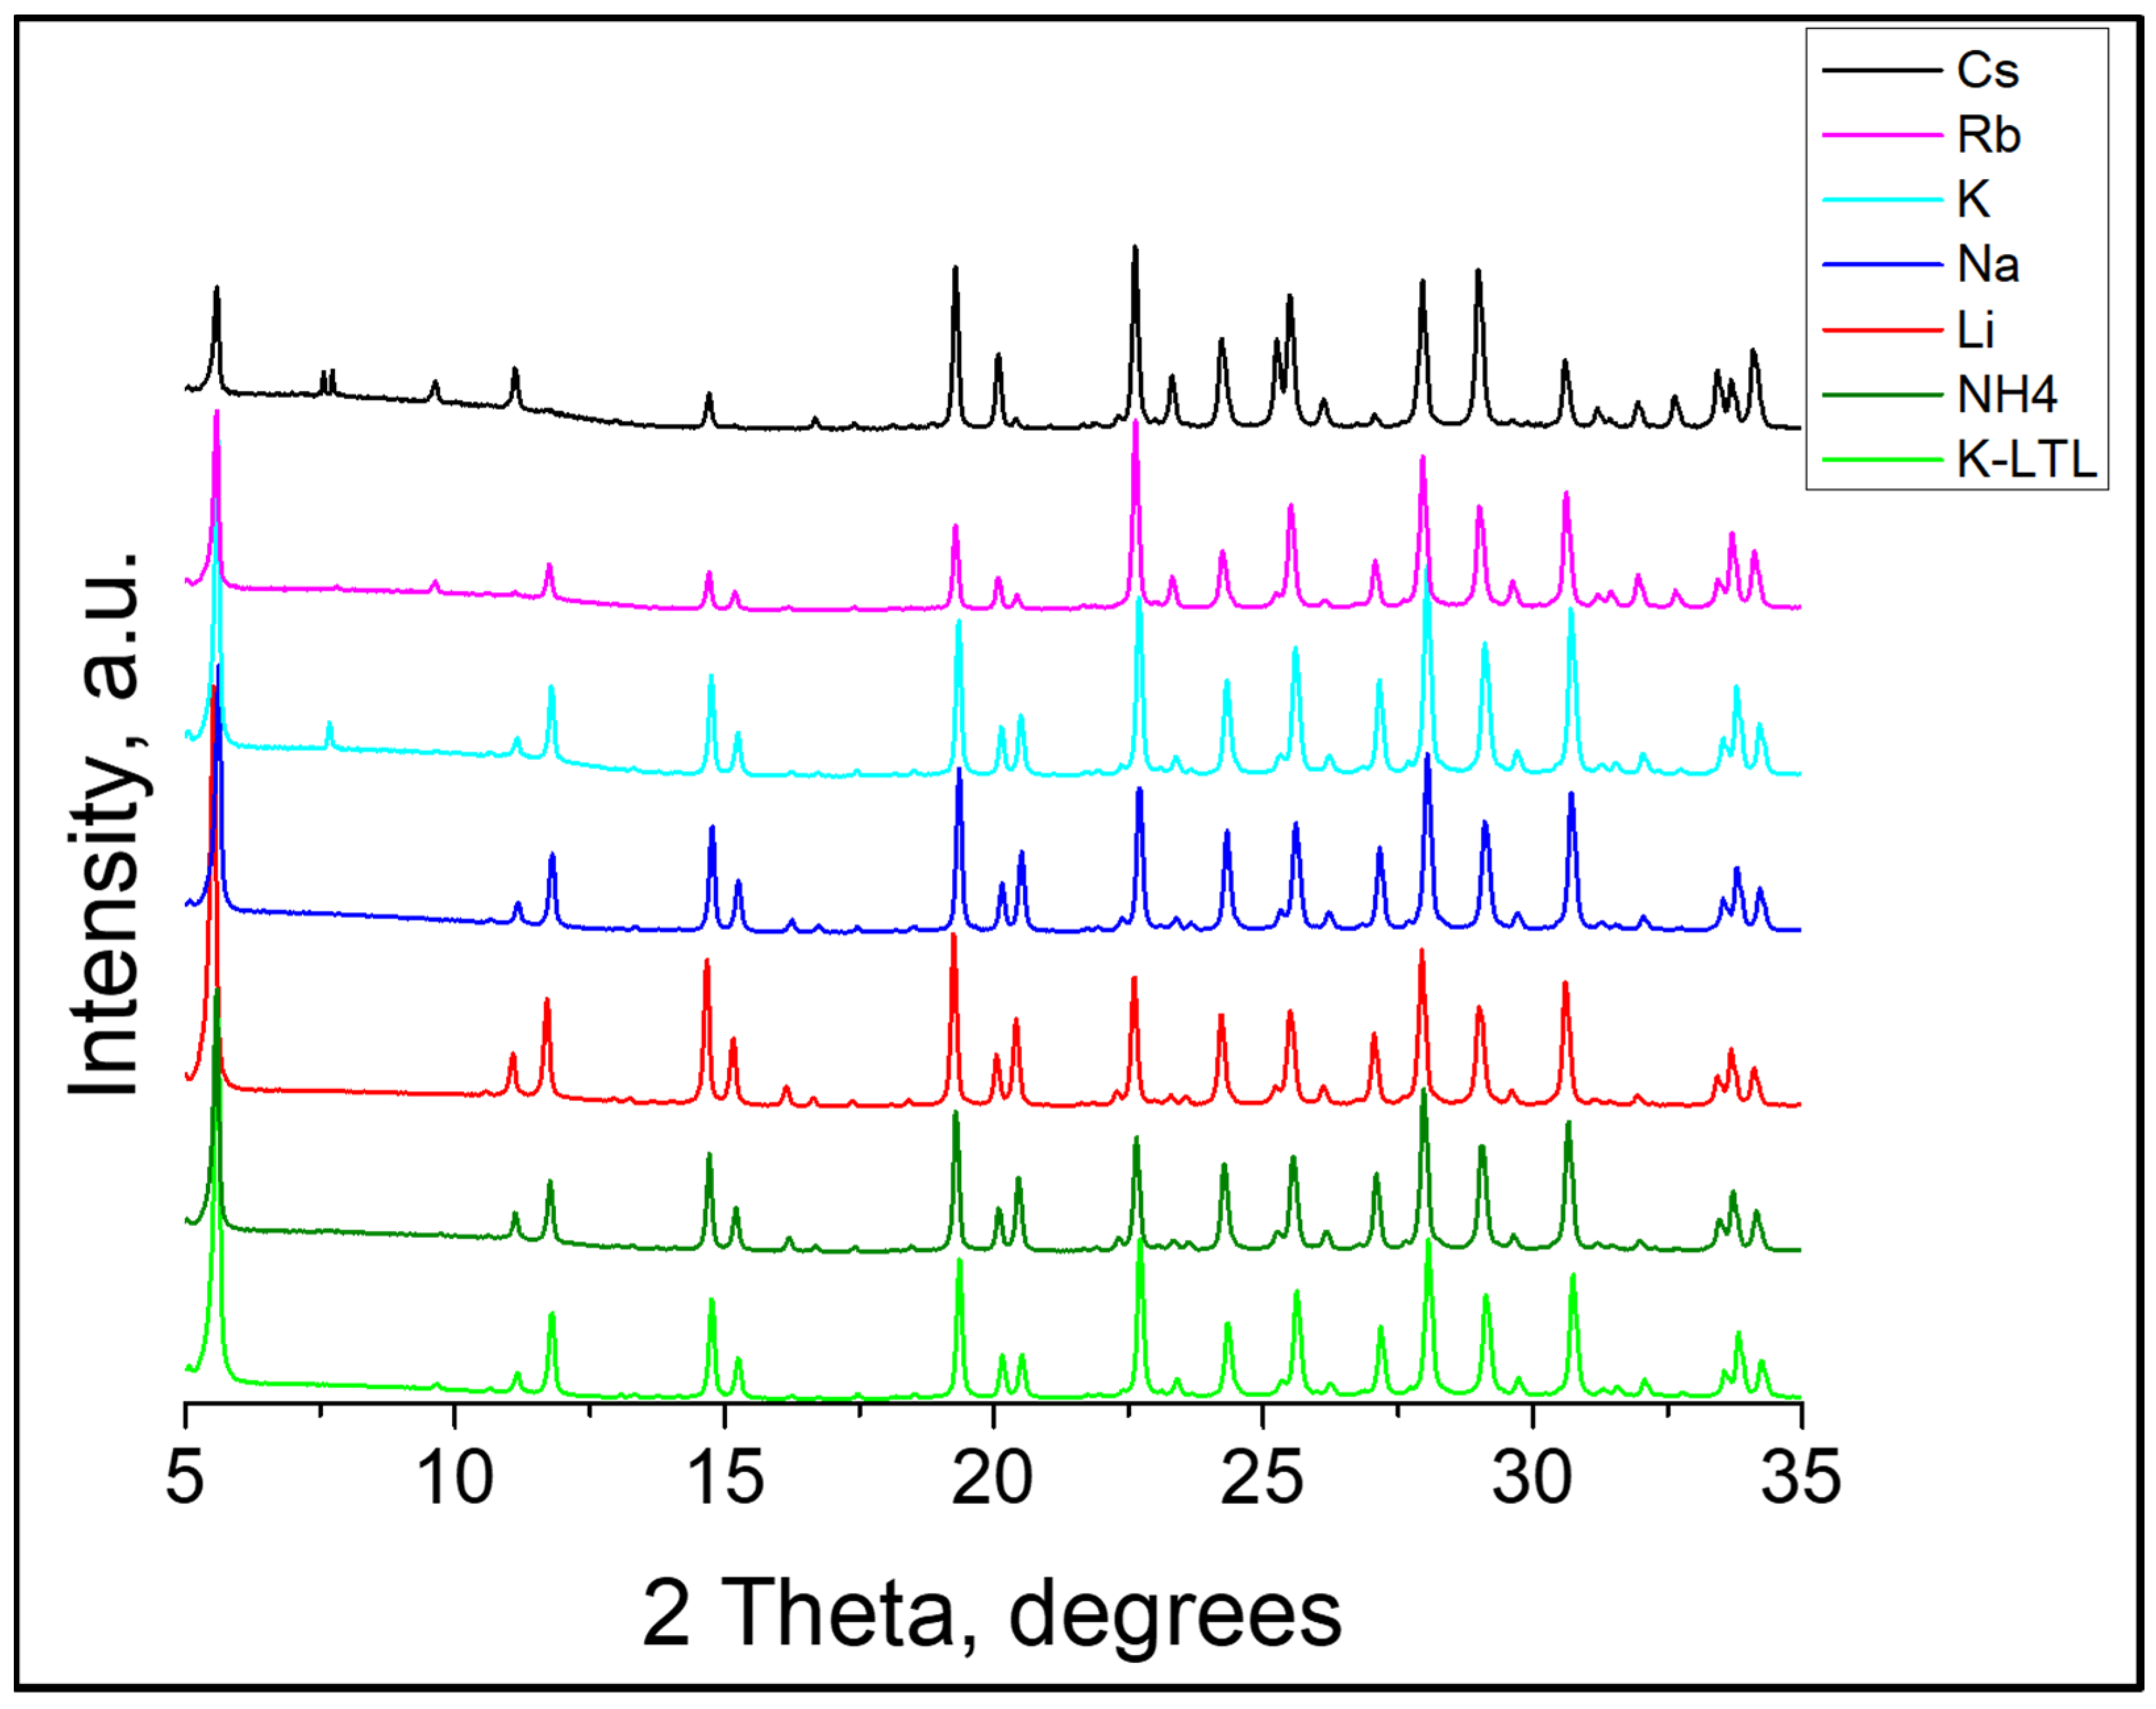
Nitrogen adsorption–desorption isotherms for K-LTL and Cs-NH4-K-LTL samples are shown in Figure 2. The obtained values of the apparent BET area and the pore volume are presented in Table 1 and Figure S2. Our data indicate a ~30% decrease in the surface area and pore volume measurements between Li- and Cs-exchanged zeolites, with Na-, K- and Rb-forms following the trend. This can be explained by the increasing size of the group 1 cations from Li to Cs and the changing density of the zeolites. Indeed, considering that the diameter of Cs cations is ~0.34 nm and their concentration of 10 at%, caesium cations should occupy ~0.02 cm3 per 1 g of the zeolite, which agrees well with the experimental value of 0.03 cm3 g−1. The data for the MAZ sample demonstrate considerably lower values of the surface area and the micropore volume, which is most likely related to the larger particle size of the mazzite and the pore blockage.

3.3. XRD Analysis

XRD has been employed to investigate the structural modification of parent zeolite and ion-exchanged materials. The experimental XRD patterns of the materials obtained through ion exchange show a profile typical of LTL (Figure 3). However, successive ion exchanges have resulted in a gradual decrease in crystallinity from 92% for the parent K-LTL to 84% for the Cs-NH4-K-LTL-4 sample (Table 1). The experimental data show the same peak positions for all LTL patterns. However, the principal difference is in the peak intensities following the ion exchange of these materials. These differences are consistently observed in both experimental and calculated patterns. For instance, the peak at ~9.6 degrees for the parent K-LTL shows a very low intensity, but it is very prominent in the patterns of the Cs-exchanged material, whereas a reversed trend is observed for the peaks at ~15 degrees (Figure S3). A more detailed analysis of the XRD data has been carried out using Rietveld refinement. Firstly, it reveals that the ion exchange affected the unit cell size of the exchanged LTL zeolites. In particular, for Cs-containing samples, the lattice parameters increase slightly during all steps (see Table S3 for more details), which is in agreement with the literature data [46]. Subsequent XRD data processing has been focused on computational modelling in order to understand the cation migration and their locations after each ion exchange step. The results of our analysis are presented in Figure 4 and Figure S4 and in Table S3 using Cs+ introduction into the LTL structure during ion exchange as an example. Based on the site occupancy results, 1.8 Cs cations per unit cell are located in the t-ltl cages, and 1.3 Cs cations are in the t-ste cages of the LTL structure. The data indicate that the preferential route is through the main channel 12 MR of LTL and particularly through the t-ltl cage. As the cation exchange continues, the exchanged species go through the 8 MR t-ste cage. All these steps involve ion exchange between K+, which is already in the parent LTL and Cs+. Since the t-can cage is not accessible to cations, the removal of K+ from that location is not possible. According to the results of this work, Cs+ and Rb+ can enter the location in the centre of the t-ste cage, while cations such as Li+ and Na+, located in the main channel in the t-ltl cage, do not go any further (see Table S3). It should be noted that most Cs cations, 1.8 per unit cell, are located in the main channels of LTL following the 4-fold ion exchange. Similar trends were observed by Price et al. [47,48,49].

3.4. FTIR

FTIR spectra of K-LTL, NH4-K-LTL and Cs-NH4-K-LTL zeolites are presented in Figure 5. FTIR spectra of Na-NH4-K-LTL and K-NH4-K-LTL zeolites are shown in Figure S10a,b in SI. In addition to the SiOH groups vibrating at 3745 cm−1, Na- and K-containing samples show low-intensity bands at ~3720 and 3670 cm−1, which can be attributed to defect sites, namely internal silanols and AlOH groups, respectively. These are weakly acidic hydroxyls originating from a minor degradation of the zeolite structure during ion exchange. An important feature in the FTIR spectra of ion-exchanged zeolites is the presence of two intense bands of the bridging OH-groups: at 3640 cm−1, this is attributed to Si(OH)Al groups freely vibrating in 12 MR, and at ~3250 cm−1, which is very broad and hence is assigned to bridging OH groups forming hydrogen bond with neighbouring oxygen atoms, e.g., in the 4- or 6-membered rings. The OH group position was recently confirmed by neutron powder diffraction [50]. Similar phenomena have been reported for MFI, FAU, MOR and LTL zeolites [28,29,49,50], and some representative examples are shown in Figure S5a. It should be noted that all these samples were activated at 450 °C prior to the IR measurements, and no residual H2O, NH3 or NH4+ species were detected (Figure S5b). Recent modelling of hydrogen bonding in the ZSM-5 zeolite involving Si(OH)Al groups, which are the zeolite Brønsted acid sites, has shown that as the H --- O distance (the length of the hydrogen bond) approaches 1.85 Å (note, the O-H bond length in the bridging OH-group is 0.985 Å), the vibration of the Si(OH)Al group is shifting to ~3250 cm−1, its full width at half-maximum reaches ~175 cm−1 and its intensity increases by almost an order of magnitude [51] (Figure S6). Applying these findings to our experimental spectra, it can be concluded that a considerable number of Si(OH)Al groups in the LTL zeolites form a hydrogen bond with the framework oxygens with the length of the H-bond of ~1.85 Å (LTL zeolite presents a rather extreme manifestation of this spectroscopic effect). The bridging H-groups must be localised in the 6 MR and possibly 4 MR within the LTL structure. For the samples reported in Table S4, the peak intensity ratio of the bands at 3640 and 3250 cm−1 is ~2 for Na-NH4-K-LTL and K-NH4-K-LTL, ~3 for Rb-NH4-K-LTL and ~18 for Cs-NH4-K-LTL samples. The results suggest that Si(OH)Al groups in 12-MR of the main channels can be selectively “poisoned” using ion exchange with Cs+ cations.
The acidic properties of ion-exchanged LTL samples have been examined using pyridine adsorption (Figure 6 and Figure 7). The difference spectra following Py adsorption for both NH4-K-LTL and Cs-NH4-K-LTL show two major negative peaks at 3640 and ~3250 cm−1, corresponding to the free and H-bound bridging OH-groups, confirming their acidic nature. In contrast, only one negative peak attributed to the free (isolated) bridging OH-groups interacting with Py has been detected for NH4-MAZ (Figure S7). These data indicate that there is a preferential distribution of Al and that of the bridging OH-groups in the LTL-based materials, which would explain the high proportion of H-bound bridging OH-groups in the LTL zeolites. Bearing in mind the structural similarity (Figure S1) and the SBUs present in the LTL and MAZ structures, as well as the elemental composition, LTL and MAZ should have a similar number of Brønsted acid sites (BASs). However, FTIR characterisation indicates that there are 80% fewer BASs in MAZ that are accessible to Py. This can be attributed to the transport limitations within the MAZ structure; indeed, no more than 10% of the bridging OH-groups are accessible to Py (Figure S7).
The data on the number of accessible Py BASs and LASs (Lewis acid sites) in the modified LTL zeolites are provided in Table 2 and Figure S8. A clear trend among the ion-exchanged zeolites can be seen as the number of Lewis acid sites decreases with the increased size of the exchanged cation, indicating that alkali metal cations not only neutralise the zeolite acid sites but also facilitate the removal of some of the Lewis acid sites, probably associated with extra-framework Al. Cs-NH4-K-LTL is the only exception, which may be linked to the more basic properties of the ion-exchange solution that could result in some structural degradation. Indeed, this sample shows the lowest crystallinity among the studied materials (Table 1). The number of Brønsted acid sites is also declining following ion exchange, with a particularly significant decrease detected for K-, Rb- and Cs-exchanged zeolites. The relatively low concentration of BAS and LAS in mazzite can be explained [52] by their limited accessibility to Py molecules, which is evident from the FTIR spectra presented in Figure S7. In addition, the effective strength of acid sites, measured using ammonia TPD, in NH4-MAZ is greater than that in NH4-K-LTL [46], which is also associated with the transport limitations owing to the micropore blockage in the MAZ zeolite.

4. Conclusions

A series of ion-exchanged LTL zeolites was prepared, and their structural and acidic properties were studied. For the first time, an alkali cation migration mechanism was described using a combination of FTIR, XRD, SEM-EDX, XRF and N2 physisorption. In addition, the acidic properties of structurally similar LTL and MAZ zeolites were compared. According to the elemental analysis, the larger alkali metal cations, in particular Cs+, can replace almost 40% of the exchangeable species (K+ and NH4+), whereas Li+ and Na+ can be introduced only in small quantities. The X-ray diffraction analysis and the Rietveld method show that all cations can migrate through the LTL structure via the 12 MR t-ltl cage. At higher concentrations of alkali metals, only cations such as Cs+, Rb+ and K+ can access the smaller 8 MR t-ste cage, while the t-can cages are inaccessible at the condition employed, and no cations have been introduced in them except for the original K+ present in the parent zeolite K-LTL. The infrared spectra of the ion-exchanged zeolites show the presence of two bands of the bridging OH-groups: a narrow band at ~3640 cm−1, which is attributed to the isolated SiOHAl groups in the main channels (12 MR) and a broad band at ~3250 cm−1 assigned to bridging OH groups forming hydrogen bond with neighbouring oxygen atoms in the 4- or 6-membered rings. The concentration of Brønsted acid sites has been monitored using pyridine adsorption. Only a slight decrease in the BAS concentration is observed for the Li and Na ion-exchanged samples as compared to the original NH4-K-LTL. The introduction of Cs+, Rb+, and K+ cations decreased the concentration of BAS and LAS up to 50%. Furthermore, ion exchange with the larger cations, in particular Cs+, can be used to selectively remove isolated acidic Si(OH)Al groups in the 12 MR of the main channels. However, in NH4-MAZ zeolite, which shares structural similarity and SBUs with the LTL framework, the number of acid sites accessible to Py is significantly lower. The NH4-MAZ zeolite of similar elemental composition (Si/Al~3.3) as NH4-K-LTL has close to 80% lower amount of accessible Brønsted acid sites.

Supplementary Materials

The following supporting information can be downloaded at: https://www.mdpi.com/article/10.3390/cryst14080745/s1, Figure S1. (a) Structure of zeolite K-LTL and (b) structure of MAZ viewed along the c-axis; Figure S2. (a) Surface area, (b) total pore volume and (c) micropore volume of the ion-exchanged samples; Figure S3a. Experimental XRD patterns of K-LTL (1) and Cs-K-LTL (2). Figure S3b. Simulated (b) XRD patterns of K-LTL (1) and Cs-K-LTL (2). Figure S3c. Experimental XRD pattern of the ion-exchanged NH4-MAZ sample; Figure S4. (a) The results of Rietveld analysis carried out for K-LTL (left) and Cs-K-LTL (right) samples using MAUD software. Figure S4. (b) Rietveld analysis carried out for Cs-K-LTL sample using MAUD software. Figure S4. (c) Rietveld analysis carried out for parent K-LTL sample using MAUD software; Figure S5a. Experimental FTIR spectra of NH4-forms of MFI, MOR, FAU and LTL zeolites activated at 450 °C. The narrow OH peaks at ~3600 cm−1 are indicative of isolated Al(OH)Si groups; broad bands at low frequencies represent H-bonded OH-groups. Figure S5b. Experimental FTIR spectra of NH4-K-LTL zeolite following stepwise ammonia desorption at 150-450 °C; Figure S6. (Left) Possible types of bridging OH-groups in the HZSM-5 zeolite with protons pointing into 10-, 6-, and 5-membered rings. (Right) Possible types of bridging OH groups in LTL zeolite (silicon—yellow, aluminium—grey, oxygen—red and hydrogen—white); Figure S7. FTIR spectra of NH4-MAZ: (1)—the material before Py adsorption, (2)—the material after Py adsorption and (3)—the difference spectrum; Figure S8. Concentration of Brønsted and Lewis acid sites in the ion-exchanged LTL samples; Figure S9. (a–f). Raw data of SEM-EDX Analysis; Figure S10. FTIR spectra of (a) Na-NH4-K-LTL and (b) K-NH4-K-LTL: (1)—the difference spectrum, (2)—the material before Py adsorption and (3)—the material after Py adsorption at 200 °C; Table S1. Preparation of ion-exchanged samples from the parent K-LTL zeolite; Table S2: Occupied volume by ion-exchanged cations in NH4-K-LTL, assuming the following composition: M9Al9Si27O72, where M = Li, Na, K, Rb or Cs; Table S3. XRD analysis: lattice parameters and occupancies. The “Total occupancy per u.c.” is the total number of atoms (cations) per unit cell for a specific crystallographic position. “Site occupancy” is the occupancy of all atoms in a specific crystallographic position. Occupancies are defined in the original cif file. “Total occupancy per u.c.” is obtained by multiplying the “Site occupancy” by the number of specific sites (N.S.) present in a unit cell; Table S4. FTIR data: the I3250/I3640 peak intensity ratios of all ion exchanged samples.

Author Contributions

Conceptualization, V.Z. and A.C.; methodology, V.Z. and A.C.; software, A.C. and M.J.; validation, M.J. and A.C.; formal analysis, A.C., M.J. and V.Z.; investigation, A.C., M.J. and V.Z.; writing—original draft preparation, A.C.; writing—review and editing, A.C., M.J. and V.Z. All authors have read and agreed to the published version of the manuscript.

Funding

This research received no external funding.

Data Availability Statement

The original contributions presented in the study are included in the article and Supplementary Material, further inquiries can be directed to the corresponding authors.

Acknowledgments

A.C. and M.J. express gratitude to the Keele postgraduate fund for financing the attendance fee at the ICDD X-ray diffraction clinic, which supported this research. The authors also thank our colleagues at Keele University for their helpful feedback, in particular, Charlene Greenwood, Richard H. Jones and Chris Hawes for their valuable contributions to our research. M.J. would like to thank the Royal Society (grant IES/R3/203138) and the Newton Fund for part-funding his Ph.D. project. VZ thanks the Russian Science Foundation for the financial support (grant №23-73-0005, https://rscf.ru/project/23-73-0005/).

Conflicts of Interest

The authors declare no competing financial interests.

References

  1. McCusker, L.B.; Baerlocher, C. Zeolite structures. In Introduction to Zeolite Science and Practice, 3rd ed.; Studies in Surface Science and Catalysis; Cejka, J., van Bekkum, H., Corma, A., Schüth, F., Eds.; Elsevier: Amsterdam, The Netherlands, 2007; Volume 168, pp. 13–37. [Google Scholar]
  2. McCusker, L.B.; Olson, D.H.; Baerlocher, C. Atlas of Zeolite Framework Types; Elsevier: Amsterdam, The Netherlands, 2007. [Google Scholar]
  3. Csicsery, S.M. Shape-selective catalysis in zeolites. Zeolites 1984, 4, 202–213. [Google Scholar]
  4. Khouw, C.B.; Davis, M.E. Shape-Selective Catalysis with Zeolites and Molecular Sieves; ACS Publications: Washington, DC, USA, 1993. [Google Scholar]
  5. Uguina, M.; Serrano, D.; Van Grieken, R.; Venes, S. Adsorption, acid and catalytic changes induced in ZSM-5 by coking with different hydrocarbons. Appl. Catal. A-Gen. 1993, 99, 97–113. [Google Scholar]
  6. Kareem, A.; Chand, S.; Mishra, I. Disproportionation of Toluene to Produce Benzene and p-Xylene–A Review; NISCAIR-CSIR: New Delhi, India, 2001. [Google Scholar]
  7. Tan, K.H.; Cham, H.Y.; Awala, H.; Ling, T.C.; Mukti, R.R.; Wong, K.L.; Mintova, S.; Ng, E.P. Effect of Extra Framework Cations of LTL Nanozeolites to Inhibit Oil Oxidation. Nanoscale Res. Lett. 2015, 10, 253. [Google Scholar]
  8. Yang, R.T. Adsorbents: Fundamentals and Applications; Wiley-Interscience: Hoboken, NJ, USA, 2003. [Google Scholar]
  9. Jasra, R.V.; Choudary, N.V.; Bhat, S.G.T. Correlation of sorption behavior of nitrogen, oxygen, and argon with cation locations in zeolite X. Ind. Eng. Chem. Res. 1996, 35, 4221–4229. [Google Scholar]
  10. Barrer, R.M.; Galabova, I.M. Ion-exchanged forms of zeolite L, erionite, and offretite and sorption of inert-gases. Adv. Chem. 1973, 121, 356–373. [Google Scholar]
  11. Breck, D.W.; Flanigen, E.M. Molecular Sieves; Society of Chemical Industry: London, UK, 1968; p. 47. [Google Scholar]
  12. Breck, D.W.; Acara, N.A. Crystalline zeolite L. US Patent 3216789, 9 November 1965. [Google Scholar]
  13. Pichat, P.; Franco-Parra, C.; Barthomeuf, D. Infrared structural study of various type L zeolites. J. Chem. Soc. Faraday Trans. 1 Phys. Chem. Condens. Phases 1975, 71, 991–996. [Google Scholar]
  14. Barrer, R.M.; Villiger, H. The crystal structure of the synthetic zeolite L. Z. Krist.-New Cryst. Struct. 1969, 128, 352–370. [Google Scholar]
  15. Ohsuna, T.; Horikawa, Y.; Hiraga, K.; Terasaki, O. Surface Structure of Zeolite L Studied by High-Resolution Electron Microscopy. Chem. Mater. 1998, 10, 688–691. [Google Scholar]
  16. Hassani, S.S.; Salehirad, F.; Aghabozorg, H.R.; Sobat, Z. Synthesis and morphology of nanosized zeolite L. Cryst. Res. Technol. 2010, 45, 183–187. [Google Scholar]
  17. Newsam, J.M.; Melchior, M.T.; Malone, H. Full profile analysis of the 29Si NMR spectra of LTL-framework zeolites. Solid State Ion. 1988, 26, 125–131. [Google Scholar]
  18. Li, P.; Wang, Y.; Li, H.; Calzaferri, G. Luminescence Enhancement after Adding Stoppers to Europium(III) Nanozeolite L. Angew. Chem. Int. Ed. 2014, 53, 2904–2909. [Google Scholar]
  19. Wang, Y.; Li, H.; Gu, L.; Gan, Q.; Li, Y.; Calzaferri, G. Thermally stable luminescent lanthanide complexes in zeolite L. Microporous Mesoporous Mater. 2009, 121, 1–6. [Google Scholar]
  20. Bhat, S.D.; Niphadkar, P.S.; Gaydhankar, T.R.; Awate, S.V.; Belhekar, A.A.; Joshi, P.N. High temperature hydrothermal crystallization, morphology and yield control of zeolite type K-LTL. Microporous Mesoporous Mater. 2004, 76, 81–89. [Google Scholar]
  21. Garces, L.J.; Makwana, V.D.; Hincapie, B.; Sacco, A.; Suib, S.L. Selective N,N-methylation of aniline over cocrystallized zeolites RHO and zeolite X (FAU) and over Linde type L (Sr,K-LTL). J. Catal. 2003, 217, 107–116. [Google Scholar]
  22. Song, J.; Ma, H.; Tian, Z.; Yan, L.; Xu, Z.; Liu, Q.; Qu, W. The effect of Fe on Pt particle states in Pt/KL catalysts. Appl. Catal. Gen. 2015, 492, 31–37. [Google Scholar]
  23. Derouane, E.G.; Vanderveken, D.J. Structural recognition and preorganization in zeolite catalysis: Direct aromatization of n-hexane on zeolite L-based catalysts. Appl. Catal. 1988, 45, 15–22. [Google Scholar]
  24. Larsen, G.; Haller, G.L. Metal-support effects in Pt/L-zeolite catalysts. Catal. Lett. 1989, 3, 103–110. [Google Scholar]
  25. Bernard, J.R.; Ward, D.W. Hydrocarbons Aromatization on Platinum Alkaline Zeolites. In Proceedings of the 5th Interantional Conference on Zeolites, Naples, Italy, 2–6 June 1980; Philadelphia Heyden & Son Ltd.: London, UK, 1980; pp. 686–695. [Google Scholar]
  26. Besoukhanova, C.; Guidot, J.; Barthomeuf, D.; Breysse, M.; Bernard, J.R. Platinum-zeolite interactions in alkaline L zeolites. Correlations between catalytic activity and platinum state. J. Chem. Soc. Faraday Trans. 1 Phys. Chem. Condens. Phases 1981, 77, 1595–1604. [Google Scholar]
  27. Cho, S.J.; Ryoo, R. Characterization of PtSn narioparticles in KL zeolite and n-hexane aromatization activity. Catal. Lett. 2004, 97, 71–75. [Google Scholar]
  28. Tarach, K.; Tekla, J.; Filek, U.; Szymocha, A.; Tarach, I.; Góra-Marek, K. Alkaline-acid treated zeolite L as catalyst in ethanol dehydration process. Microporous Mesoporous Mater. 2017, 241, 132–144. [Google Scholar]
  29. Al-Ani, A.; Freitas, C.; Zholobenko, V. Nanostructured large-pore zeolite: The enhanced accessibility of active sites and its effect on the catalytic performance. Microporous Mesoporous Mater. 2020, 293, 109805. [Google Scholar]
  30. McCusker, L.B.; Baerlocher, C.; Wilson, S.T.; Broach, R.W. Synthesis and Structural Characterization of the Aluminosilicate LZ-135, a Zeolite Related to ZSM-10. J. Phys. Chem. 2009, 113, 9838–9844. [Google Scholar]
  31. Flanigen, E.M.; Kellberg, E.R. Synthetic Crystalline Zeolite and Process for Preparing Same. US Patent No. 4241036, 23 December 1980. [Google Scholar]
  32. Galli, E. Mazzite, a Zeolite. Cryst. Struct. Commun. 1974, 3, 339–344. [Google Scholar]
  33. Galli, E.; Passaglia, E.; Pongiluppi, D.; Rinaldi, R. Mazzite, a new mineral, the natural counterpart of the synthetic zeolite Ω. Contrib. Mineral. Petrol. 1974, 45, 99–105. [Google Scholar]
  34. Rinaldi, R.; Pluth, J.J.; Smith, J.V. Crystal structure of mazzite dehydrated at 600 °C. Acta Crystallogr. Sect. B Struct. Sci. 1975, 31, 1603–1608. [Google Scholar]
  35. McQueen, D.; Chiche, B.; Fajula, F.; Auroux, A.; Guimon, C.; Fitoussi, F.; Schulz, P. A Multitechnique Characterization of the Acidity of Dealuminated Mazzite. J. Catal. 1996, 161, 587–596. [Google Scholar]
  36. Shigeishi, R.; Chiche, B.; Fajula, F. CO adsorption on superacid sites on dealuminated mazzite. Microporous Mesoporous Mater. 2001, 43, 211–226. [Google Scholar]
  37. Goossens, A.M.; Feijen, E.P.; Verhoeven, G.; Wouters, B.H.; Grobet, P.J.; Jacobs, P.A.; Martens, J.A. Crystallization of MAZ-type zeolites using tetramethylammonium, sodium and n-hexane derivatives as structure- and composition-directing agents. Microporous Mesoporous Mater. 2000, 35–36, 555–572. [Google Scholar]
  38. Momma, K.; Izumi, F. VESTA 3 for three-dimensional visualization of crystal, volumetric and morphology data. J. Appl. Crystallogr. 2011, 44, 1272–1276. [Google Scholar]
  39. Momma, K.; Izumi, F. VESTA: A three-dimensional visualization system for electronic and structural analysis. J. Appl. Crystallogr. 2008, 41, 653–658. [Google Scholar]
  40. Lutterotti, L. Maud: A Rietveld Analysis Program Designed for the Internet and Experiment Integration. Acta Crystallogr. Sect. A Found. Crystallogr 2000, 56, s54. [Google Scholar] [CrossRef]
  41. Lutterotti, L.; Matthies, S.; Wenk, H.-R. MAUD (Material Analysis Using Diffraction): A user friendly java program for Rietveld texture analysis and more. In Proceeding of the Twelfth International Conference on Textures of Materials (ICOTOM-12), Montreal, QC, Canada, 9–13 August 1999; Volume 1, p. 1599. [Google Scholar]
  42. Available online: http://www.iza-structure.org/databases/ (accessed on 1 July 2024).
  43. Available online: https://www.icdd.com (accessed on 1 July 2024).
  44. Zholobenko, V.; Freitas, C.; Jendrlin, M.; Travert, A.; Bazin, P.; Thibault-Starzyk, F. Probing the acid sites of zeolites with pyridine: Quantitative AGIR measurements of the molar absorption coefficients. J. Catal. 2020, 385, 52–60. [Google Scholar]
  45. Contini, A.; Jendrlin, M.; Al-Ani, A.; Zholobenko, V. Structural and Acidic Properties of Ion-Exchanged Mazzite. Pet. Chem. 2024, 64, 235–244. [Google Scholar]
  46. Seoung, D.; Lee, Y.; Kim, S.J.; Lee, H.H.; Ahn, D.; Shin, N.S.; Vogt, T. Pressure-induced hydration and cation migration in a Cs+ exchanged gallosilicate zeolite LTL: Synchrotron X-ray powder diffraction study at ambient and high pressures. Microporous Mesoporous Mater. 2010, 136, 75–82. [Google Scholar]
  47. Price, L.A.; Jones, Z.; Nearchou, A.; Stenning, G.; Nye, D.; Sartbaeva, A. The Effect of Cation Exchange on the Pore Geometry of Zeolite L. Appl. Chem. 2022, 2, 149–159. [Google Scholar]
  48. Martucci, A.; Precisvalle, N.; Fois, E.; Ardit, M.; Beltrami, G.; Pasti, L.; Cescon, M.; Suard, E.; Tabacchi, G. Location of Brønsted sites in deuterated L-zeolite: A combined neutron powder diffraction and computer modeling study. Mater. Chem. Phys. 2023, 308, 128250. [Google Scholar]
  49. Zholobenko, V.L.; Kustov, L.M.; Borovkov, V.Y.; Kazansky, V.B. A new type of acidic hydroxyl groups in ZSM-5 zeolite and in mordenite according to diffuse reflectance IR spectroscopy. Zeolites 1988, 8, 175–178. [Google Scholar]
  50. Zholobenko, V.L.; Makarova, M.A.; Dwyer, J. Inhomogeneity of Broensted acid sites in mordenite. J. Phys. Chem. 1993, 97, 5962–5964. [Google Scholar]
  51. Windeck, H.; Berger, F.; Sauer, J. Spectroscopic Signatures of Internal Hydrogen Bonds of Brønsted-Acid Sites in the Zeolite H-MFI. Angew. Chem. Int. Ed. 2023, 62, e202303204. [Google Scholar]
  52. Freitas, C.; Barrow, N.S.; Zholobenko, V. Accessibility and location of acid sites in zeolites as probed by FTIR and MAS-NMR. Johns. Matthey Technol. Rev. 2018, 62, 279–290. [Google Scholar]
Figure 1. LTL structure: 12 MR channel viewed normal to [001].
Crystals 14 00745 g001
Figure 2. Nitrogen adsorption–desorption isotherms for K-LTL (a) and Cs-NH4-K-LTL (b). The inserts show the pore size distributions for these materials.
Crystals 14 00745 g002
Figure 3. XRD patterns of the ion-exchanged LTL samples.
Crystals 14 00745 g003
Figure 4. The migration pathway of Cs+ cations in K-LTL zeolite during ion exchange.
Crystals 14 00745 g004
Figure 5. The OH region of the FTIR spectra for (1) K-LTL, (2) NH4-K-LTL and (3) Cs-NH4-K-LTL. Spectra are offset for clarity.
Crystals 14 00745 g005
Figure 6. FTIR spectra of NH4-K-LTL: (1) the difference spectrum, (2) the material before Py adsorption at 200 °C and (3) the material after Py adsorption.
Crystals 14 00745 g006
Figure 7. FTIR spectra of Cs-NH4-K-LTL: (1) the difference spectrum, (2) the material before Py adsorption at 200 °C and (3) the material after Py adsorption.
Crystals 14 00745 g007
Table 1. Characterisation data for the ion-exchanged LTL samples and for NH4-MAZ.
SampleComposition aCrystallinity b, %S, m2 g−1Vmicro c, cm3 g−1
K-LTLK8.8Al8.6Si27.4O72923460.12
NH4-K-LTL(NH4)3.6K5.0Al8.6Si27.4O72893760.12
Li-NH4-K-LTLLi0.6(NH4)2.8K5.2Al8.6Si27.4O72903850.13
Na-NH4-K-LTLNa1.0(NH4)2.4K5.2Al8.6Si27.4O72883570.12
K-NH4-K-LTL(NH4)0.8K7.8Al8.6Si27.4O72873320.12
Rb-NH4-K-LTLRb2.2(NH4)0.8K5.6Al8.5Si27.4O72852950.10
Cs-NH4-K-LTLCs3.1(NH4)0.6K4.8Al8.5Si27.4O72842660.09
NH4-Na-MAZ(NH4)4.2Na4.2Al8.4Si27.6O72811050.02
Notes: (a) expected experimental error is ±0.2 atoms per u.c.; (b) assessed by the Diffrac.Eva software v4.0, expected error is ±2%; (c) expected error is ±0.01 cm3 g−1.
Table 2. The concentrations of BAS and LAS determined from the FTIR data for the ion-exchanged LTL samples and for NH4-MAZ.
SampleBAS, µmol g−1LAS, µmol g−1
NH4-MAZ11389
K-LTL08
NH4-K-LTL486204
Li-NH4-K-LTL-4474174
Na-NH4-K-LTL-4469118
K-NH4-K-LTL-431245
Rb-NH4-K-LTL-428934
Cs-NH4-K-LTL-422971
Disclaimer/Publisher’s Note: The statements, opinions and data contained in all publications are solely those of the individual author(s) and contributor(s) and not of MDPI and/or the editor(s). MDPI and/or the editor(s) disclaim responsibility for any injury to people or property resulting from any ideas, methods, instructions or products referred to in the content.

