

Fantastic Photons and Where to Excite Them: Revolutionizing Upconversion with KY3F10-Based Compounds


Abstract
:1. Introduction
2. Crystal Phases of KY3F10
2.1. Cubic α-KY3F10
2.2. Cubic High-Pressure β-KY3F10
2.3. Tetragonal γ-KY3F10
2.4. Cubic δ-KY3F10·xH2O
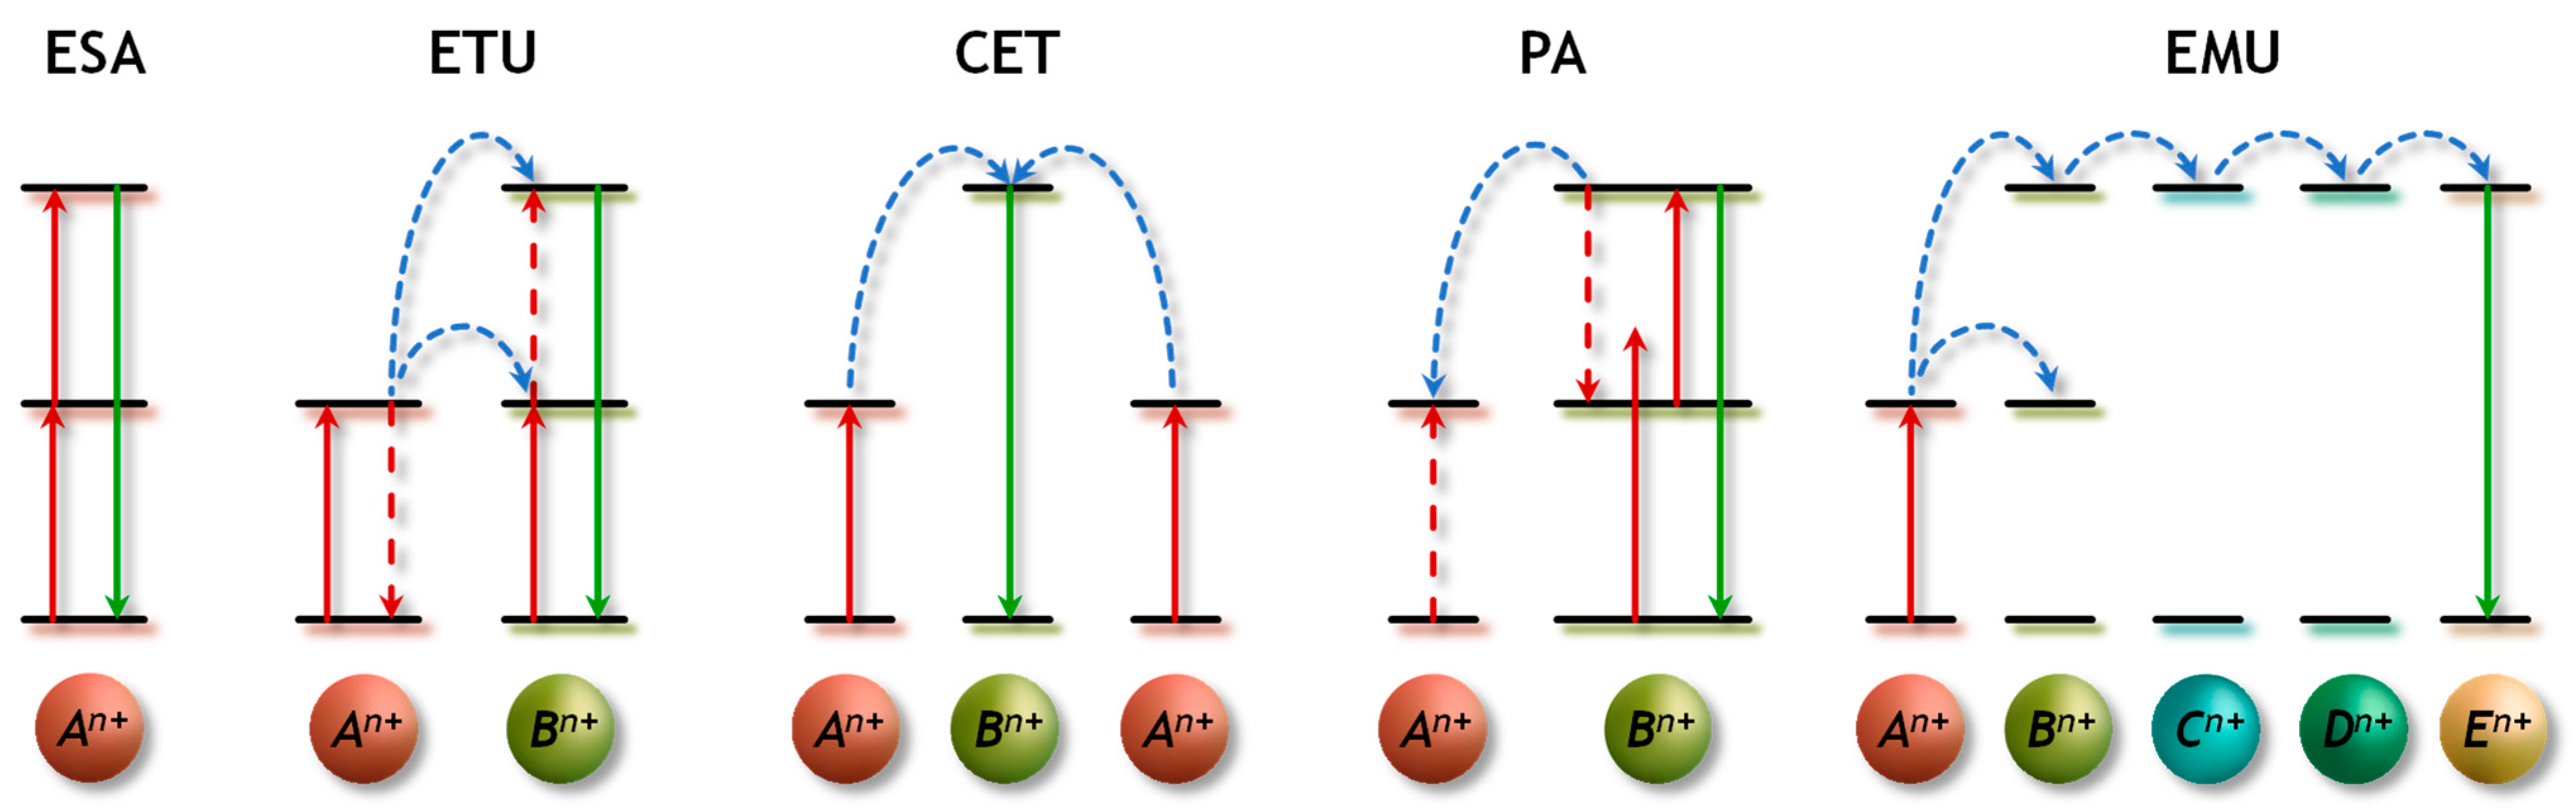
3. Upconversion: Features and Mechanisms
3.1. Excited-State Absorption (ESA)
3.2. Energy Transfer Upconversion (ETU)
3.3. Cooperative Energy Transfer (CET)
3.4. Photon Avalanche (PA)
3.5. Energy-Migration-Mediated Upconversion (EMU)
4. Upconversion in Single-RE3+-Doped KY3F10
4.1. KY3F10:Er3+
4.2. KY3F10:Ho3+
4.3. KY3F10:Nd3+
4.4. KY3F10:Sm3+
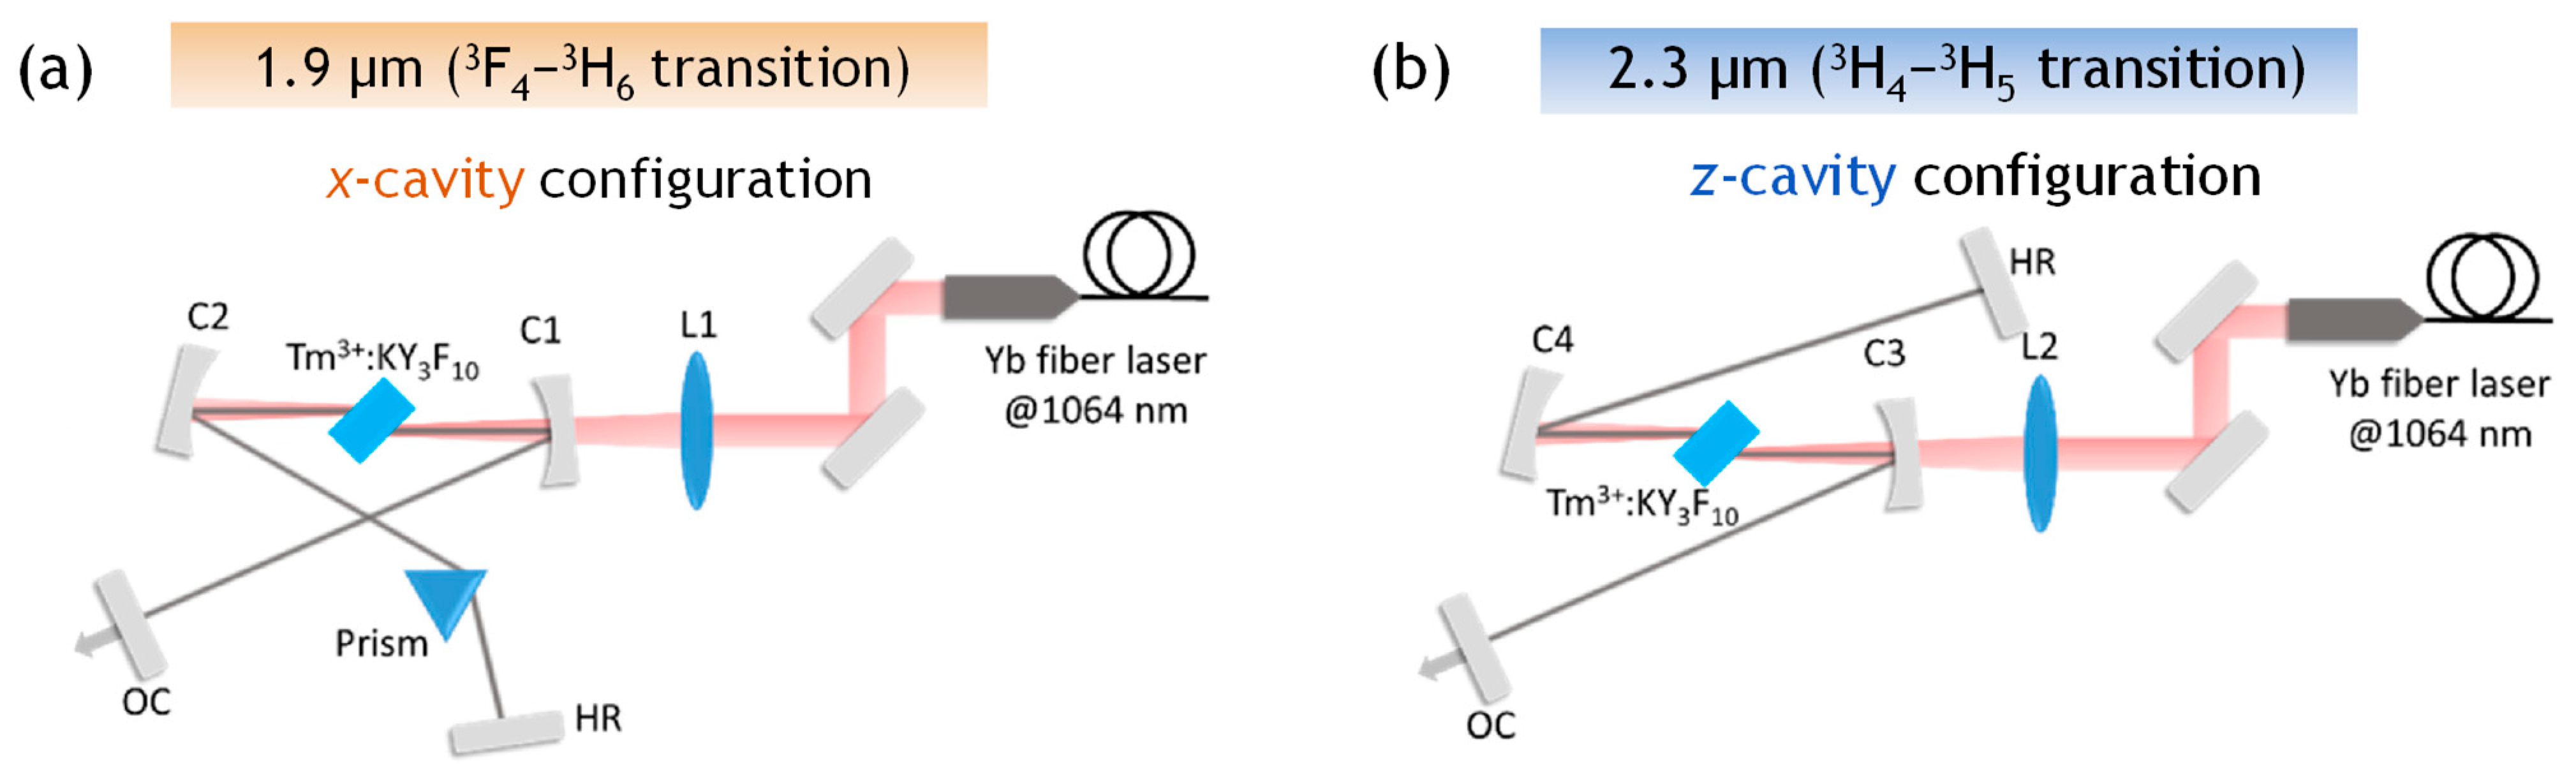
4.5. KY3F10:Tm3+
5. Upconversion in Double-RE3+-Doped KY3F10
5.1. KY3F10:Er3+/Yb3+

| Er3+: Yb3+ (mol%) | Synthesis Method | Experimental Conditions | Particle Size (nm) | (nm) | T (K) | Application | Ref. |
|---|---|---|---|---|---|---|---|
| 2:20 | Thermal decomposition | 300 °C, 1 h | 15 ± 5 | 978 | RT | Fundamental investigation | [73] |
| (0.2–5):5 | Hydrothermal | 180 °C, 12 h | 60 | 976 | RT | Self-written waveguides | [72] |
| 0.5:20 | Coprecipitation + thermal annealing | 140–550 °C, 6 h Ar | 8 (as grown), 85 (annealed) | 972 | RT | Er3+ distribution and thermal influence | [74] |
| 0.2:1 | Melt quenching (glass ceramics) | (1550 °C, 20 min air) + (400 °C, 3 h) + (polished coupons: 750 °C, 5 h) | 60 | 980 | RT | Transparent nano-glass ceramics | [75] |
| 5:20 | Hydrothermal | 180 °C, 12 h, use of EDTA | 38 ± 7 | 980 | RT | Theranostic | [76] |
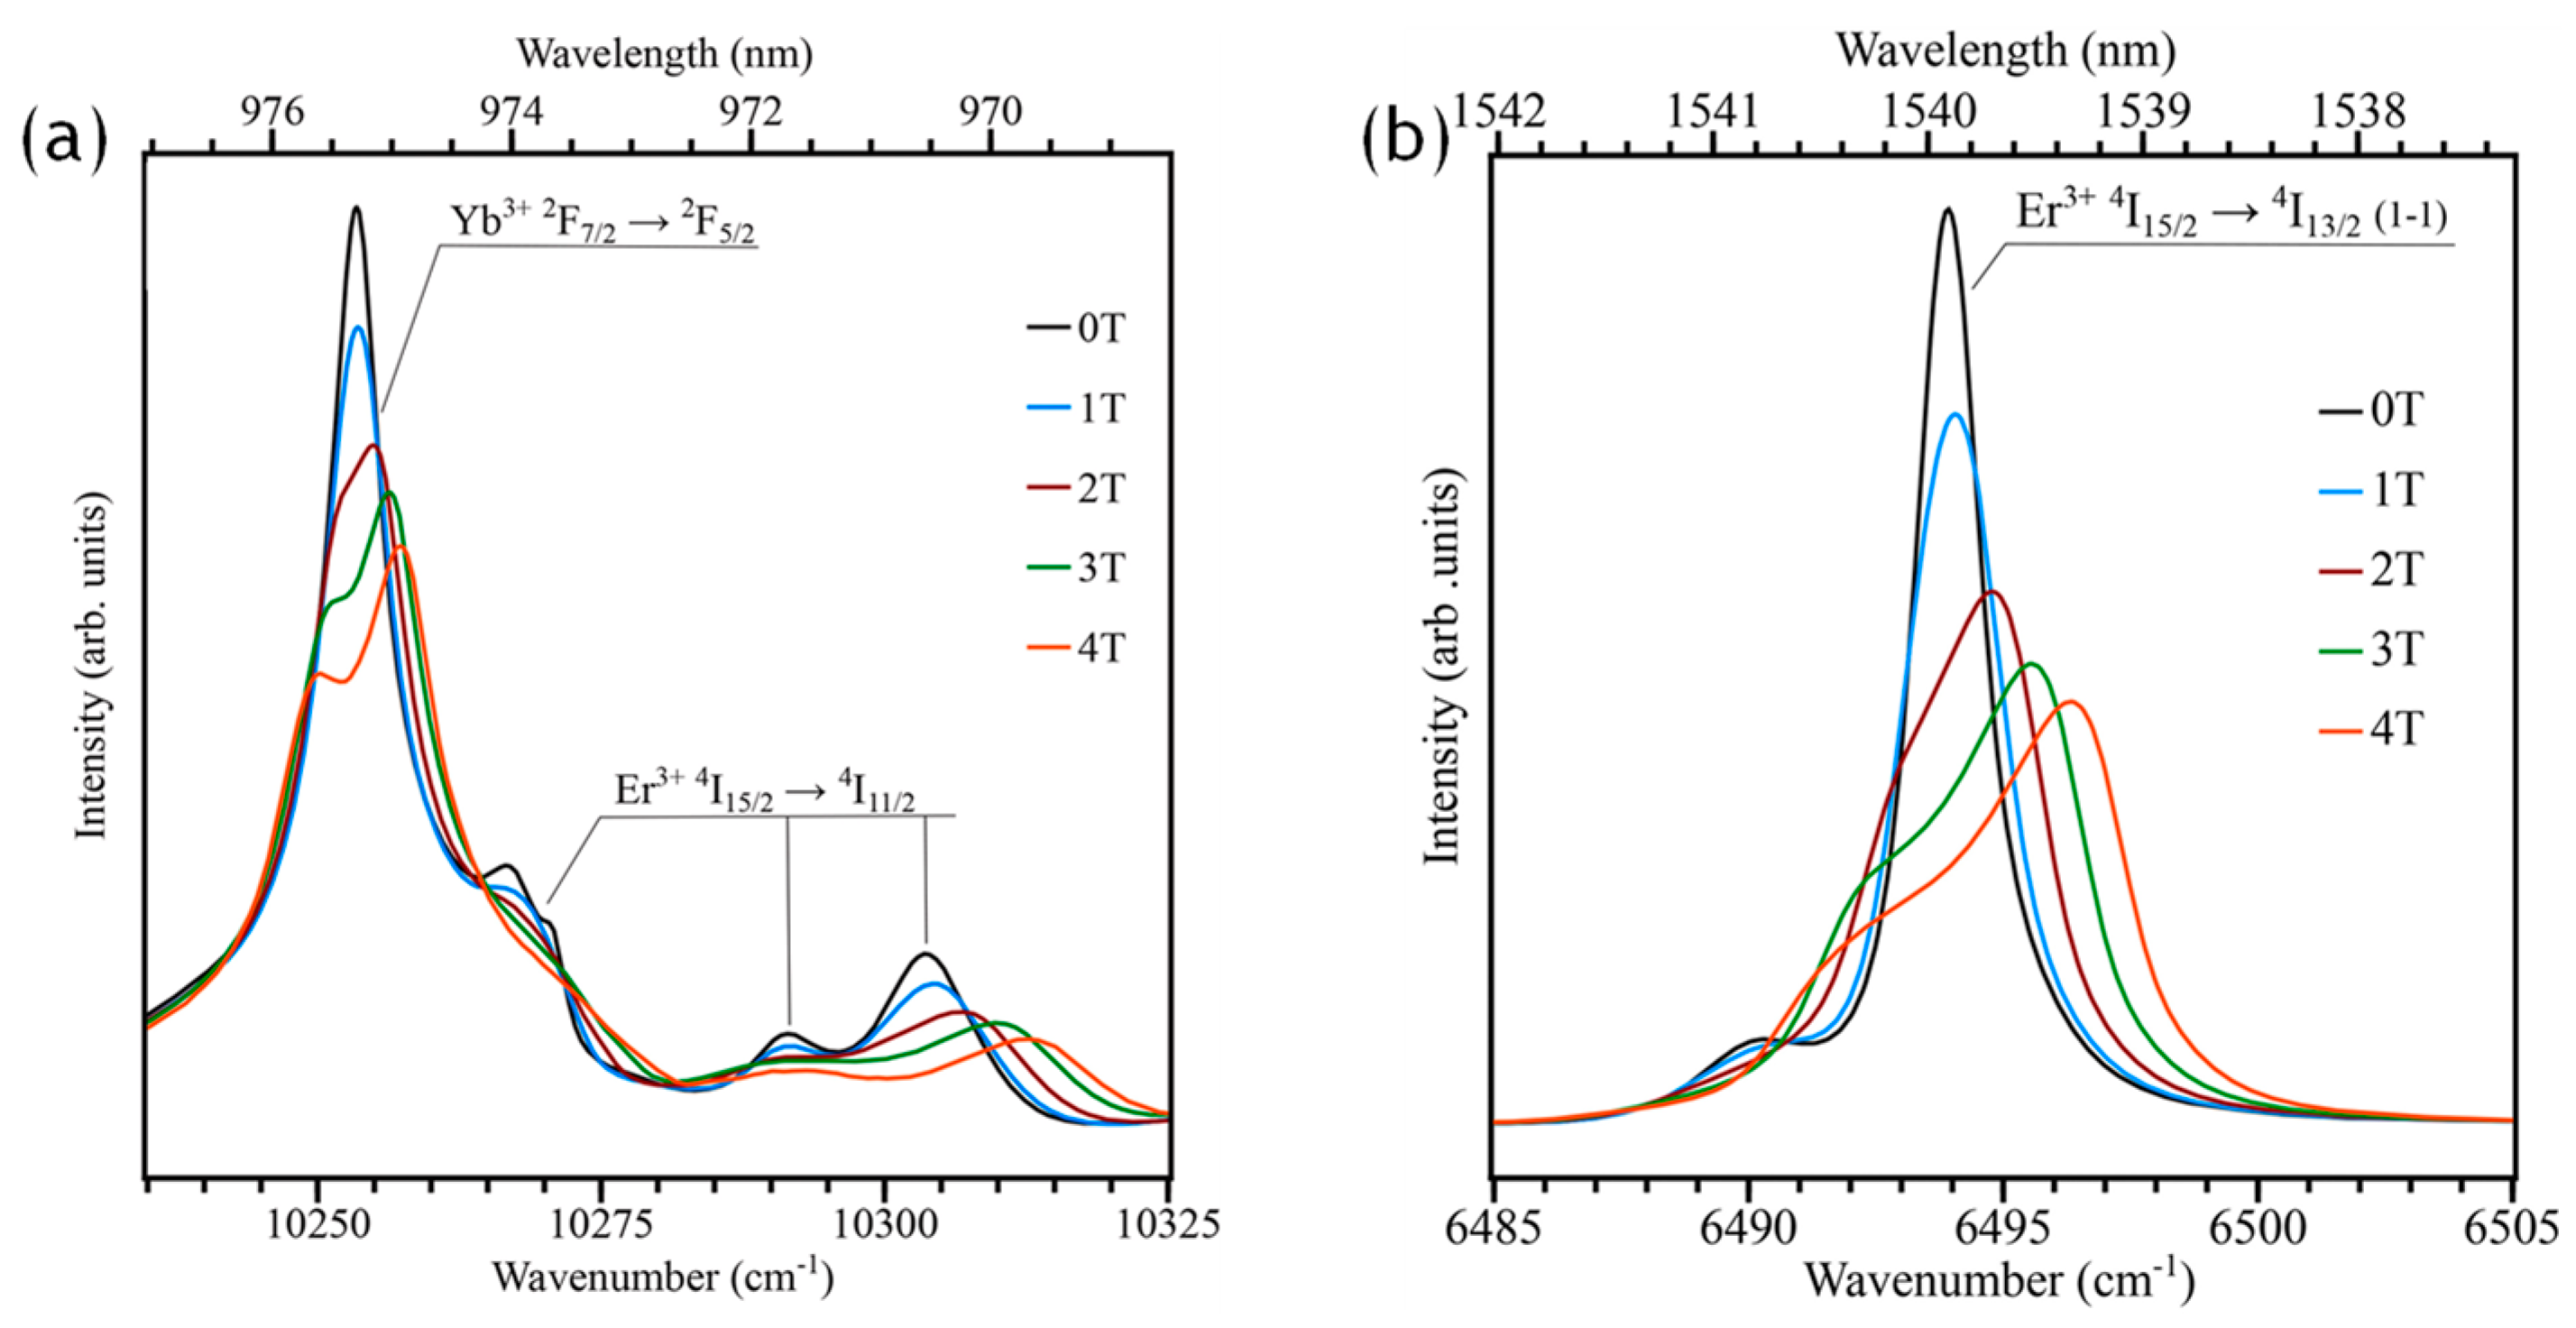
| 2:2 | Hydrothermal | 200 °C, 6 h, use of PVP | 58 ± 17 | 940–980 | 4.2, 10 | Magnetic-field influence | [77] |
| 2:20 | Hydrothermal | 200 °C, 3 h, use of PVP | 57 ± 10 | 975 | 10, (297–366) | Nanothermometry | [53] |
| (0.5–1.5):10 | Hydrothermal + thermal annealing | (180 °C, 12 h) + (500 °C, 12/5 h) | 50–100 (5 h), 200–500 (12 h) | 980 | RT | Color tunability | [78] |
5.2. KY3F10:Ho3+/Yb3+
5.3. KY3F10:Pr3+/Yb3+
5.4. KY3F10:Tb3+/Yb3+
5.5. KY3F10:Tm3+/Yb3+
6. Upconversion in Triple-RE3+-Doped KY3F10
6.1. KY3F10:Er3+/Yb3+/Tm3+
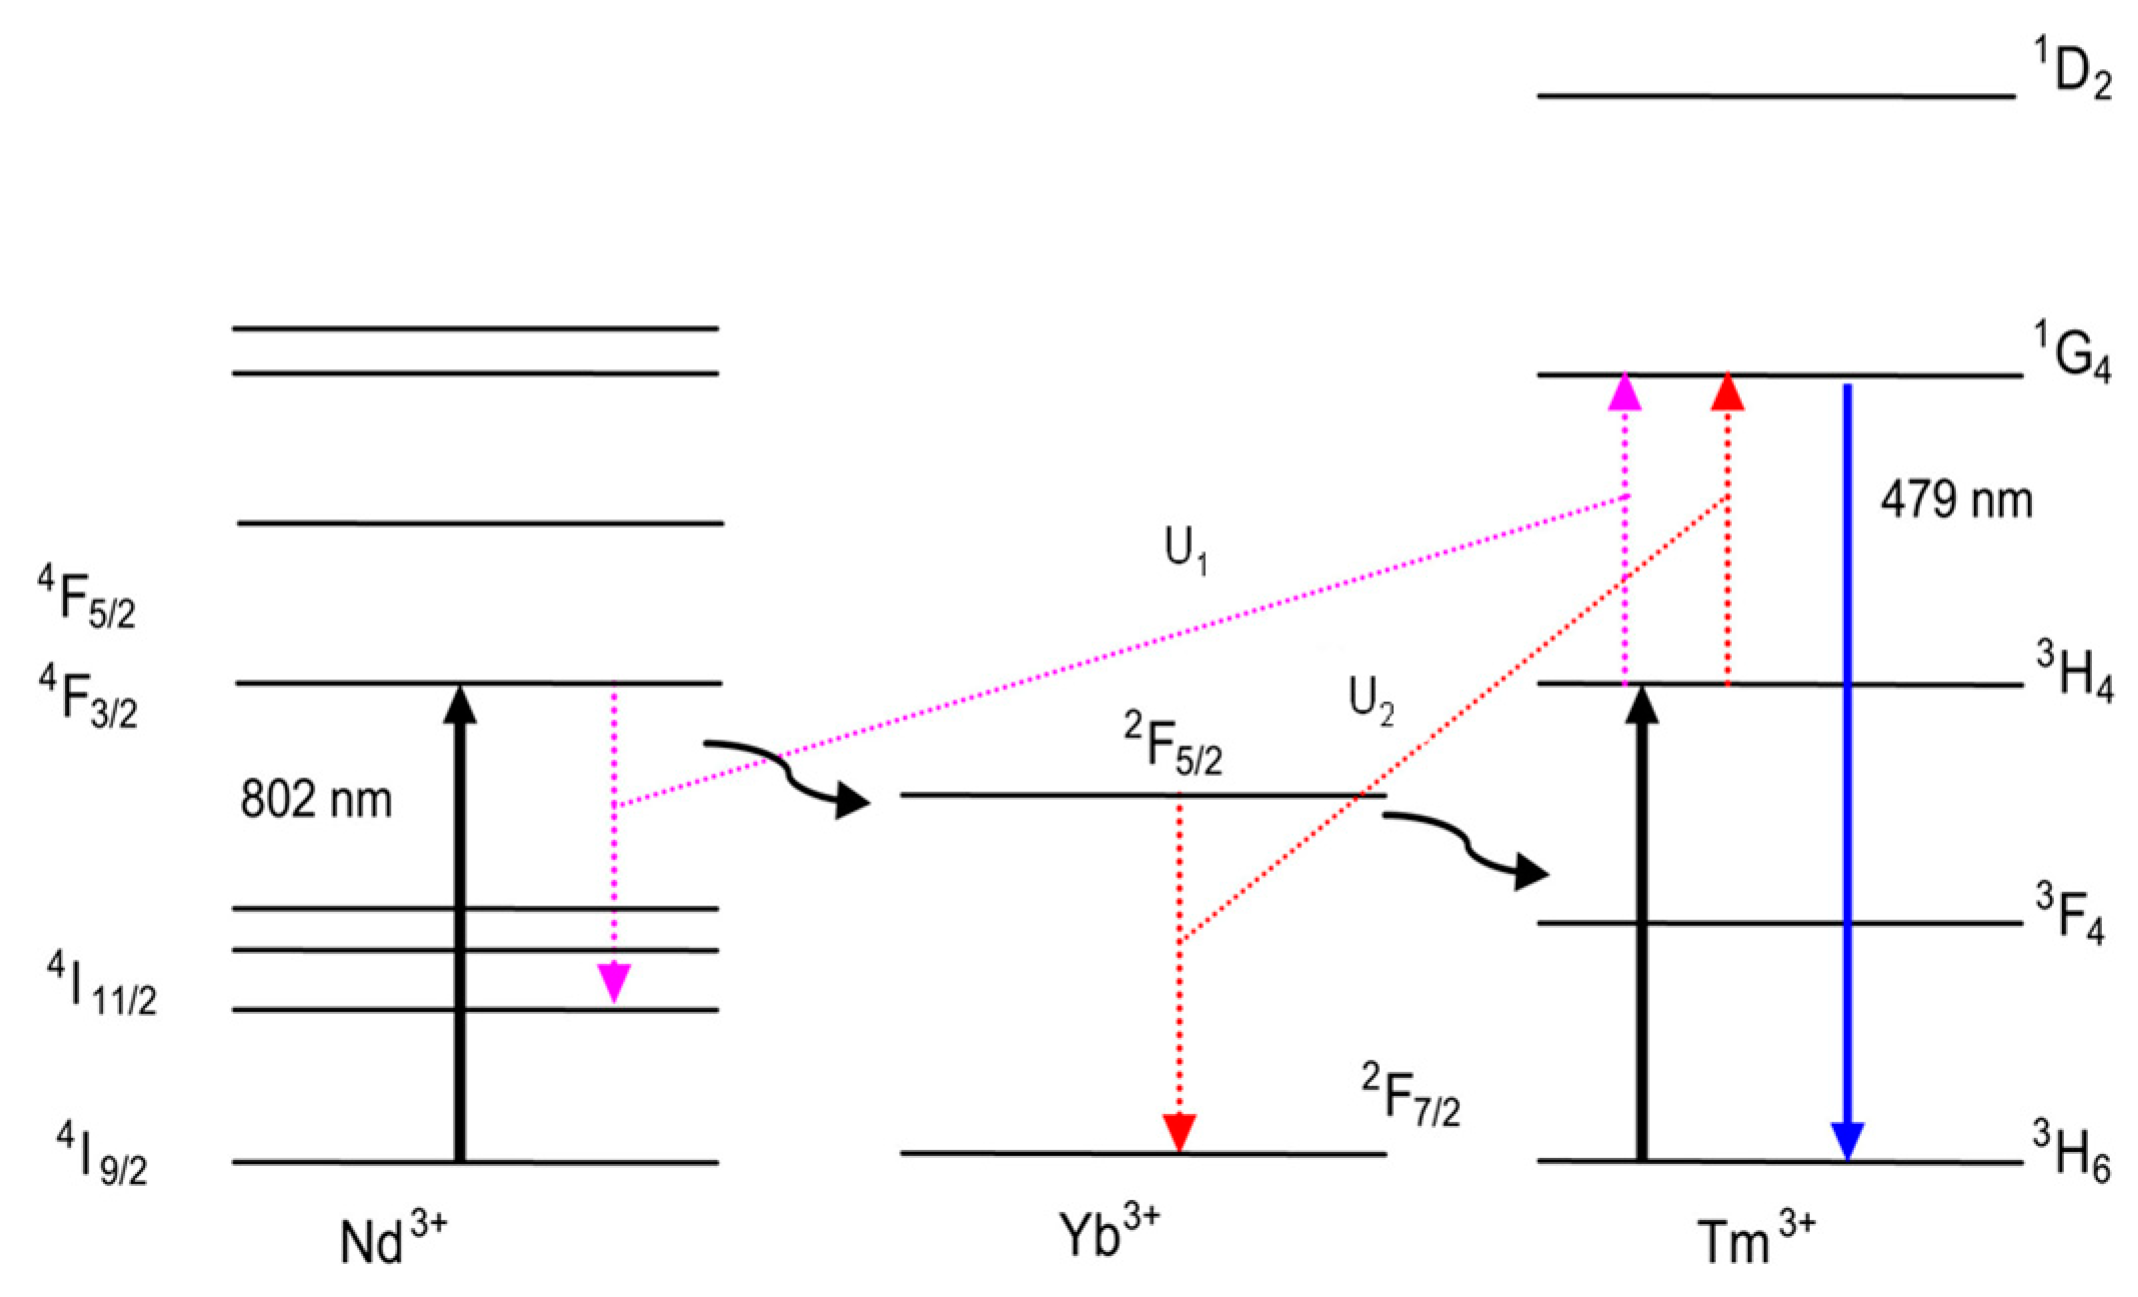
6.2. KY3F10:Nd3+/Yb3+/Tm3+
7. Conclusions and Prominent Prospects
Funding
Acknowledgments
Conflicts of Interest
References
- Auzel, F. Multiphonon-Assisted Anti-Stokes and Stokes Fluorescence of Triply Ionized Rare-Earth Ions. Phys. Rev. B 1976, 13, 2809–2817. [Google Scholar] [CrossRef]
- Auzel, F. History of Upconversion Discovery and Its Evolution. J. Lumin. 2020, 223, 116900. [Google Scholar] [CrossRef]
- Chen, X.; Peng, D.; Ju, Q.; Wang, F. Photon Upconversion in Core–Shell Nanoparticles. Chem. Soc. Rev. 2015, 44, 1318–1330. [Google Scholar] [CrossRef]
- Mettenbrink, E.M.; Yang, W.; Wilhelm, S. Bioimaging with Upconversion Nanoparticles. Adv. Photonics Res. 2022, 3, 2200098. [Google Scholar] [CrossRef] [PubMed]
- Chen, J.; Zhao, J.X. Upconversion Nanomaterials: Synthesis, Mechanism, and Applications in Sensing. Sensors 2012, 12, 2414–2435. [Google Scholar] [CrossRef] [PubMed]
- Zhou, J.; Liu, Z.; Li, F. Upconversion Nanophosphors for Small-Animal Imaging. Chem. Soc. Rev. 2012, 41, 1323–1349. [Google Scholar] [CrossRef]
- Pawade, V.B.; Pawar, N.R.; Dhoble, S.J. Upconversion in Some Fluoride Crystal System—A Review. Infrared Phys. Technol. 2022, 123, 104148. [Google Scholar] [CrossRef]
- Naccache, R.; Yu, Q.; Capobianco, J.A. The Fluoride Host: Nucleation, Growth, and Upconversion of Lanthanide-Doped Nanoparticles. Adv. Opt. Mater. 2015, 3, 482–509. [Google Scholar] [CrossRef]
- Torresan, M.F.; Wolosiuk, A. Critical Aspects on the Chemical Stability of NaYF4-Based Upconverting Nanoparticles for Biomedical Applications. ACS Appl. Bio Mater. 2021, 4, 1191–1210. [Google Scholar] [CrossRef]
- Renero-Lecuna, C.; Martín-Rodríguez, R.; Valiente, R.; González, J.; Rodríguez, F.; Krämer, K.W.; Güdel, H.U. Origin of the High Upconversion Green Luminescence Efficiency in β-NaYF4:2%Er3+,20%Yb3+. Chem. Mater. 2011, 23, 3442–3448. [Google Scholar] [CrossRef]
- Shi, R.; Brites, C.D.S.; Carlos, L.D. Hexagonal-Phase NaREF4 Upconversion Nanocrystals: The Matter of Crystal Structure. Nanoscale 2021, 13, 19771–19782. [Google Scholar] [CrossRef] [PubMed]
- Chen, S.; Weitemier, A.Z.; Zeng, X.; He, L.; Wang, X.; Tao, Y.; Huang, A.J.Y.; Hashimotodani, Y.; Kano, M.; Iwasaki, H.; et al. Near-Infrared Deep Brain Stimulation via Upconversion Nanoparticle–Mediated Optogenetics. Science 2018, 359, 679–684. [Google Scholar] [CrossRef]
- Ma, Y.; Bao, J.; Zhang, Y.; Li, Z.; Zhou, X.; Wan, C.; Huang, L.; Zhao, Y.; Han, G.; Xue, T. Mammalian Near-Infrared Image Vision through Injectable and Self-Powered Retinal Nanoantennae. Cell 2019, 177, 243–255.e15. [Google Scholar] [CrossRef] [PubMed]
- Meng, M.; Zhang, T.; Wang, J.; Cheng, Z.; Li, Z.; Qiao, X.; Wen, J.; Genger, U.R.; Long, W.; Ou, J. Preparation of NaYF4: Yb3+/Tm3+@NaYF4@β-CD Upconversion Nanoparticles and Application of their Fluorescence Temperature Sensing Properties. Opt. Mater. 2023, 136, 113389. [Google Scholar] [CrossRef]
- Kumar, D.; Verma, K.; Verma, S.; Chaudhary, B.; Som, S.; Sharma, V.; Kumar, V.; Swart, H.C. Recent Advances in Enhanced Luminescence Upconversion of Lanthanide-Doped NaYF4 Phosphors. Phys. B Condens. Matter 2018, 535, 278–286. [Google Scholar] [CrossRef]
- Jiao, Y.; Ling, C.; Wang, J.-X.; Amanico, H.; Saczek, J.; Wang, H.; Sridhar, S.; Xu, B.B.; Wang, S.; Wang, D. Controllable Synthesis of Upconversion Nanophosphors toward Scale-Up Productions. Part. Part. Syst. Charact. 2020, 37, 2000129. [Google Scholar] [CrossRef]
- Bogachev, N.A.; Betina, A.A.; Bulatova, T.S.; Nosov, V.G.; Kolesnik, S.S.; Tumkin, I.I.; Ryazantsev, M.N.; Skripkin, M.Y.; Mereshchenko, A.S. Lanthanide-Ion-Doping Effect on the Morphology and the Structure of NaYF4:Ln3+ Nanoparticles. Nanomaterials 2022, 12, 2972. [Google Scholar] [CrossRef]
- Auzel, F.; Pecile, D. Absolute Efficiency for IR to Blue Conversion Materials and Theoretical Prediction for Optimized Matrices. J. Lumin. 1976, 11, 321–330. [Google Scholar] [CrossRef]
- Jiang, X.; Cao, C.; Feng, W.; Li, F. Nd3+-Doped LiYF4 Nanocrystals for Bio-Imaging in the Second Near-Infrared Window. J. Mater. Chem. B 2016, 4, 87–95. [Google Scholar] [CrossRef]
- Wang, H.; Xing, M.; Luo, X.; Zhou, X.; Fu, Y.; Jiang, T.; Peng, Y.; Ma, Y.; Duan, X. Upconversion Emission Colour Modulation of Y2O2S:Yb,Er under 1.55 μm and 980 nm Excitation. J. Alloys Compd. 2014, 587, 344–348. [Google Scholar] [CrossRef]
- Sharma, R.K.; Mudring, A.-V.; Ghosh, P. Recent Trends in Binary and Ternary Rare-Earth Fluoride Nanophosphors: How Structural and Physical Properties Influence Optical Behavior. J. Lumin. 2017, 189, 44–63. [Google Scholar] [CrossRef]
- Tiwari, S.P.; Maurya, S.K.; Yadav, R.S.; Kumar, A.; Kumar, V.; Joubert, M.-F.; Swart, H.C. Future Prospects of Fluoride Based Upconversion Nanoparticles for Emerging Applications in Biomedical and Energy Harvesting. J. Vac. Sci. Technol. B 2018, 36, 060801. [Google Scholar] [CrossRef]
- Cressoni, C.; Vurro, F.; Milan, E.; Muccilli, M.; Mazzer, F.; Gerosa, M.; Boschi, F.; Spinelli, A.E.; Badocco, D.; Pastore, P.; et al. From Nanothermometry to Bioimaging: Lanthanide-Activated KY3F10 Nanostructures as Biocompatible Multifunctional Tools for Nanomedicine. ACS Appl. Mater. Interfaces 2023, 15, 12171–12188. [Google Scholar] [CrossRef]
- Yu, B.; Zheng, B.; Xia, H.; Wang, J.; Song, H.; Chen, B. Tunable Emission and Temperature Sensing Performance in Novel Oxyfluoride Borosilicate Glass Ceramics Containing Eu3+/Tb3+: KY3F10 Nanocrystals. Ceram. Int. 2021, 47, 9668–9678. [Google Scholar] [CrossRef]
- Püschel, S.; Kränkel, C.; Tanaka, H. Ytterbium-Doped KY3F10 as a Promising Material for Optical Cryocoolers. Proc. SPIE 2023, 12437, 1243706. [Google Scholar] [CrossRef]
- Li, Z.; Tian, T.; Yuan, W.; Cui, Q.; Zhang, Y.; Gong, Z.; Mao, C.; Liu, W.; Yang, B.; Xu, W.; et al. Stable Zero-Thermal Quenching Cover Wide Temperature Range Achieves in Cerium Doped KY3F10 Ultraviolet Luminescent Single Crystal. J. Alloys Compd. 2022, 908, 164651. [Google Scholar] [CrossRef]
- Yu, B.; Zhou, X.; Xia, H.; Chen, B.; Song, H. Novel Bi3+/Eu3+ Co-Doped Oxyfluoride Transparent KY3F10 Glass Ceramics with Wide Tunable Emission and High Optical Temperature Sensitivity. J. Lumin. 2021, 239, 118366. [Google Scholar] [CrossRef]
- Grzechnik, A.; Nuss, J.; Friese, K.; Gesland, J.-Y.; Jansen, M. Refinement of the Crystal Structure of Potassium Triyttrium Decafluoride, KY3F10. Z. Krist. NCS 2002, 217, 460. [Google Scholar] [CrossRef]
- Grzechnik, A.; Crichton, W.A.; Gesland, J.Y. Potassium Triyttrium Decafluoride, KY3F10, Synthesized at High Pressures and High Temperatures. Solid State Sci. 2003, 5, 757–764. [Google Scholar] [CrossRef]
- Borzenkova, M.P.; Kuznetsova, G.N.; Novoselova, A. V Reactions of Potassium and Yttrium Fluorides. Inorg. Mater. 1971, 7, 214. [Google Scholar]
- Porcher, P.; Caro, P. Crystal Field Parameters for Eu3+ in KY3F10. J. Chem. Phys. 1976, 65, 89–94. [Google Scholar] [CrossRef]
- Le Berre, F.; Boucher, E.; Allain, M.; Courbion, G. Synthesis, Stability and Zeolitic Behavior of δ-ALn3F10,xH2O and γ-ThLn2F10,H2O Phases (Ln = lanthanide). J. Mater. Chem. 2000, 10, 2578–2586. [Google Scholar] [CrossRef]
- Goderski, S.; Runowski, M.; Lis, S. Synthesis of Luminescent KY3F10 Nanopowder Multi-Doped with Lanthanide Ions by a Co-Precipitation Method. J. Rare Earths 2016, 34, 808–813. [Google Scholar] [CrossRef]
- Karimov, D.N.; Buchinskaya, I.I.; Arkharova, N.A.; Ivanova, A.G.; Savelyev, A.G.; Sorokin, N.I.; Popov, P.A. Growth Peculiarities and Properties of KR3F10 (R = Y, Tb) Single Crystals. Crystals 2021, 11, 285. [Google Scholar] [CrossRef]
- Ichikawa, R.U.; Linhares, H.M.S.M.D.; Peral, I.; Baldochi, S.L.; Ranieri, I.M.; Turrillas, X.; Martinez, L.G. Insights into the Local Structure of Tb-Doped KY3F10 Nanoparticles from Synchrotron X-ray Diffraction. ACS Omega 2017, 2, 5128–5136. [Google Scholar] [CrossRef]
- Serna-Gallén, P.; Beltrán-Mir, H.; Cordoncillo, E. The PH-Dependent Reactions in the Sonochemical Synthesis of Luminescent Fluorides: The Quest for the Formation of KY3F10 Crystal Phases. Ultrason. Sonochem 2022, 87, 106059. [Google Scholar] [CrossRef]
- Serna-Gallén, P.; Beltrán-Mir, H.; Cordoncillo, E. Kinetics or Thermodynamics? Extolling Their Role to Modulate the Crystal Phases and Luminescence of KY3F10:Eu3+ Powders. CrystEngComm 2023, 25, 5918–5931. [Google Scholar] [CrossRef]
- Serna-Gallén, P.; Beltrán-Mir, H.; Cordoncillo, E. The Unexplored δ-Phase of KY3F10: Toward Novel Eu3+-Doped Nanoplates with a ‘Super-Diamond’ Structure for Optical Applications. J. Mater. Res. Technol. 2021, 15, 6940–6946. [Google Scholar] [CrossRef]
- Serna-Gallén, P.; Beltrán-Mir, H.; Cordoncillo, E.; Balda, R.; Fernández, J. A Site-Selective Fluorescence Spectroscopy Study of the Crystal Phases of KY3F10: Leveraging the Optical Response of Eu3+ Ions. J. Alloys Compd. 2023, 953, 170020. [Google Scholar] [CrossRef]
- Scheps, R. Upconversion Laser Processes. Prog. Quantum Electron. 1996, 20, 271–358. [Google Scholar] [CrossRef]
- Lingeshwar Reddy, K.; Balaji, R.; Kumar, A.; Krishnan, V. Lanthanide Doped Near Infrared Active Upconversion Nanophosphors: Fundamental Concepts, Synthesis Strategies, and Technological Applications. Small 2018, 14, 1801304. [Google Scholar] [CrossRef] [PubMed]
- Wang, Y.; Zheng, K.; Song, S.; Fan, D.; Zhang, H.; Liu, X. Remote Manipulation of Upconversion Luminescence. Chem. Soc. Rev. 2018, 47, 6473–6485. [Google Scholar] [CrossRef]
- Auzel, F. Upconversion Processes in Coupled Ion Systems. J. Lumin. 1990, 45, 341–345. [Google Scholar] [CrossRef]
- Auzel, F. Upconversion and Anti-Stokes Processes with f and d Ions in Solids. Chem. Rev. 2004, 104, 139–174. [Google Scholar] [CrossRef]
- Lei, P.; Feng, J.; Zhang, H. Emerging Biomaterials: Taking Full Advantage of the Intrinsic Properties of Rare Earth Elements. Nano Today 2020, 35, 100952. [Google Scholar] [CrossRef]
- Gerelkhuu, Z.; Lee, Y.-I.; Yoon, T.H. Upconversion Nanomaterials in Bioimaging and Biosensor Applications and Their Biological Response. Nanomaterials 2022, 12, 3470. [Google Scholar] [CrossRef]
- Chivian, J.S.; Case, W.E.; Eden, D.D. The Photon Avalanche: A New Phenomenon in Pr3+-based Infrared Quantum Counters. Appl. Phys. Lett. 1979, 35, 124–125. [Google Scholar] [CrossRef]
- Lahoz, F.; Martín, I.R.; Calvilla-Quintero, J.M. Ultraviolet and White Photon Avalanche Upconversion in Ho3+-Doped Nanophase Glass Ceramics. Appl. Phys. Lett. 2005, 86, 051106. [Google Scholar] [CrossRef]
- Wang, F.; Deng, R.; Wang, J.; Wang, Q.; Han, Y.; Zhu, H.; Chen, X.; Liu, X. Tuning Upconversion through Energy Migration in Core–Shell Nanoparticles. Nat. Mater. 2011, 10, 968–973. [Google Scholar] [CrossRef]
- Xu, D.; Li, C.; Li, W.; Lin, B.; Lv, R. Recent Advances in Lanthanide-Doped Up-Conversion Probes for Theranostics. Front. Chem. 2023, 11, 1036715. [Google Scholar] [CrossRef] [PubMed]
- Liu, J.; Fu, T.; Shi, C. Upconversion Model for Directly Determining the Microscopic Energy-Transfer Parameters for β-NaYF4:Er3+. J. Phys. Chem. C 2020, 124, 25509–25520. [Google Scholar] [CrossRef]
- Solanki, P.S.; Balabhadra, S.; Reid, M.F.; Wells, J.P.R. Simulating Excited-State Absorption Spectra in Upconverting Lanthanide Doped Nanoparticles: KY3F10:Er3+. J. Lumin. 2022, 251, 119126. [Google Scholar] [CrossRef]
- Solanki, P.S.; Balabhadra, S.; Reid, M.F.; Golovko, V.B.; Wells, J.P.R. Upconversion Thermometry Using Yb3+/Er3+ Co-Doped KY3F10 Nanoparticles. ACS Appl. Nano Mater. 2021, 4, 5696–5706. [Google Scholar] [CrossRef]
- Mujaji, M.; Wells, J.-P.R. Spectroscopy and Crystal-Field Analysis of KY3F10:Ho3+. J. Phys. Condens. Matter 2009, 21, 255402. [Google Scholar] [CrossRef]
- Wells, J.-P.R.; Jones, G.D.; Reid, M.F.; Popova, M.N.; Chukalina, E.P. Hyperfine Patterns of Infrared Absorption Lines of Ho3+ C4v Centres in CaF2. Mol. Phys. 2004, 102, 1367–1376. [Google Scholar] [CrossRef]
- Wang, X.; Wang, Z.; Cui, J.; Yao, Y.; Zheng, M.; Zhang, M.; Cao, L.; Yang, Z.; Suo, H.; Li, P. Multifunctional Near-Infrared (NIR) Phosphors with NIR I and NIR II Luminescence for Biological Detection. ACS Appl. Electron. Mater. 2022, 4, 432–442. [Google Scholar] [CrossRef]
- Welsher, K.; Sherlock, S.P.; Dai, H. Deep-Tissue Anatomical Imaging of Mice Using Carbon Nanotube Fluorophores in the Second Near-Infrared Window. Proc. Natl. Acad. Sci. USA 2011, 108, 8943–8948. [Google Scholar] [CrossRef] [PubMed]
- Owens, E.A.; Lee, S.; Choi, J.; Henary, M.; Choi, H.S. NIR Fluorescent Small Molecules for Intraoperative Imaging. WIREs Nanomed. Nanobiotechnol. 2015, 7, 828–838. [Google Scholar] [CrossRef] [PubMed]
- Smith, B.R.; Gambhir, S.S. Nanomaterials for In Vivo Imaging. Chem. Rev. 2017, 117, 901–986. [Google Scholar] [CrossRef]
- Fan, Y.; Zhang, F. A New Generation of NIR-II Probes: Lanthanide-Based Nanocrystals for Bioimaging and Biosensing. Adv. Opt. Mater. 2019, 7, 1801417. [Google Scholar] [CrossRef]
- Lucero, M.Y.; East, A.K.; Reinhardt, C.J.; Sedgwick, A.C.; Su, S.; Lee, M.C.; Chan, J. Development of NIR-II Photoacoustic Probes Tailored for Deep-Tissue Sensing of Nitric Oxide. J. Am. Chem. Soc. 2021, 143, 7196–7202. [Google Scholar] [CrossRef]
- Smith, A.M.; Mancini, M.C.; Nie, S. Second Window for In Vivo Imaging. Nat. Nanotechnol. 2009, 4, 710–711. [Google Scholar] [CrossRef] [PubMed]
- Lin, H.; Yu, T.; Tsang, M.-K.; Bai, G.; Zhang, Q.; Hao, J. Near-Infrared-to-near-Infrared Down-Shifting and Upconversion Luminescence of KY3F10 with Single Dopant of Nd3+ Ion. Appl. Phys. Lett. 2016, 108, 041902. [Google Scholar] [CrossRef]
- Morova, Y.; Tonelli, M.; Petrov, V.; Sennaroglu, A. Upconversion Pumping of a 2.3 µm Tm3+:KY3F10 Laser with a 1064 nm Ytterbium Fiber Laser. Opt. Lett. 2020, 45, 931–934. [Google Scholar] [CrossRef]
- Morova, Y.; Kamun, E.N.; Tonelli, M.; Sennaroglu, A. Tunable Laser Operation of Tm3+: KY3F10 near 1.9 µm via Upconversion Pumping at 1064 nm. J. Opt. Soc. Am. B 2021, 38, B21–B25. [Google Scholar] [CrossRef]
- Guillemot, L.; Loiko, P.; Soulard, R.; Braud, A.; Doualan, J.-L.; Hideur, A.; Camy, P. Close Look on Cubic Tm: KY3F10 Crystal for Highly Efficient Lasing on the 3H4→3H5 Transition. Opt. Express 2020, 28, 3451–3463. [Google Scholar] [CrossRef] [PubMed]
- Haase, M.; Schäfer, H. Upconverting Nanoparticles. Angew. Chem. Int. Ed. 2011, 50, 5808–5829. [Google Scholar] [CrossRef] [PubMed]
- Burikov, S.; Filippova, E.; Proydakova, V.; Kuznetsov, S.; Voronov, V.; Tabachkova, N.; Dolenko, T. The Influence of Concentrations of Sensitizers and Activators on Luminescence Kinetics Parameters of Up-Conversion Nanocomplexes NaYF4:Yb3+/Tm3+. Photonics 2024, 11, 228. [Google Scholar] [CrossRef]
- Kar, A.; Kundu, S.; Patra, A. Lanthanide-Doped Nanocrystals: Strategies for Improving the Efficiency of Upconversion Emission and their Physical Understanding. ChemPhysChem 2015, 16, 505–521. [Google Scholar] [CrossRef]
- Heer, S.; Kömpe, K.; Güdel, H.-U.; Haase, M. Highly Efficient Multicolour Upconversion Emission in Transparent Colloids of Lanthanide-Doped NaYF4 Nanocrystals. Adv. Mater. 2004, 16, 2102–2105. [Google Scholar] [CrossRef]
- Grigorjevaite, J.; Katelnikovas, A. Optical Spectroscopy Studies of K2Bi(PO4)(MoO4):20%Yb3+,Er3+ Phosphors for Upconversion Applications. J. Lumin. 2022, 252, 119384. [Google Scholar] [CrossRef]
- Mahalingam, V.; Vetrone, F.; Naccache, R.; Speghini, A.; Capobianco, J.A. Structural and Optical Investigation of Colloidal Ln3+/Yb3+ Co-Doped KY3F10 Nanocrystals. J. Mater. Chem. 2009, 19, 3149–3152. [Google Scholar] [CrossRef]
- Xue, X.; Cheng, T.; Suzuki, T.; Ohishi, Y. KY3F10:Er3+/Yb3+ Nanocrystals Doped Laser-Induced Self-Written Waveguide for Optical Amplification in the C Band. Proc. SPIE 2016, 9744, 97440R. [Google Scholar] [CrossRef]
- Gomes, L.; da Silva, M.D.; Linhares, H.M.; Ichikawa, R.U.; Martinez, L.G.; Baldochi, S.L. Luminescence Properties of Yb:Er: KY3F10 Nanophosphor and Thermal Treatment Effects. Opt. Mater. 2016, 54, 57–66. [Google Scholar] [CrossRef]
- Gao, Z.; Lai, Z.; Lu, K.; Guo, S.; Liu, L.; He, F.; Yang, P.; Ren, J.; Zhang, J.; Yang, J. Efficient Green Upconversion Luminescence in Highly Crystallized Ultratransparent Nano-Glass Ceramics Containing Isotropic KY3F10 Nanocrystals. Opt. Lett. 2019, 44, 4674–4677. [Google Scholar] [CrossRef]
- de Oliveira Lima, K.; dos Santos, L.F.; de Melo, M.T.; Tedesco, A.C.; Gonçalves, R.R.; Gredin, P.; Mortier, M. Highly Colloidal Luminescent Er3+,Yb3+-Codoped KY3F10 Nanoparticles for Theranostic Applications. Mater. Today Commun. 2021, 28, 102553. [Google Scholar] [CrossRef]
- Martin, J.L.B.; Solanki, P.S.; Balabhadra, S.; Alizadeh, Y.; Reid, M.F.; Wells, J.-P.R. Zeeman Infrared Absorption of KY3F10 Nano-Crystals Co-Doped with Yb3+ and Er3+: Experiment and Analysis. J. Lumin. 2021, 233, 117923. [Google Scholar] [CrossRef]
- Xin, M. Color Tunable Upconversion Luminescence of Er3+-Yb3+ Codoped KY3F10 Prepared by a Hydrothermal Treatment. Opt. Laser Technol. 2024, 170, 110271. [Google Scholar] [CrossRef]
- Wietfeldt, J.R.; Moore, D.S.; Tissue, B.M.; Wright, J.C. Mechanism of Nonresonant Energy Transfer between Ions in SrF2:Er3+. Phys. Rev. B 1986, 33, 5788–5794. [Google Scholar] [CrossRef]
- Tissue, B.M.; Wright, J.C. Magnetic Field Induced Enhancements in Energy Transfer within Dimers in SrF2:Er3+. J. Lumin. 1989, 44, 121–128. [Google Scholar] [CrossRef]
- Pang, T.; Jian, R.; Xie, J.; Lu, W. Up-Conversion Luminescence and Photo-Thermal Effect of KY3F10:Yb3+,Ho3+ Nanocrystals. J. Phys. D Appl. Phys. 2018, 51, 355301. [Google Scholar] [CrossRef]
- Kim, K.J.; Jouini, A.; Yoshikawa, A.; Simura, R.; Boulon, G.; Fukuda, T. Growth and Optical Properties of Pr,Yb-Codoped KY3F10 Fluoride Single Crystals for Up-Conversion Visible Luminescence. J. Cryst. Growth 2007, 299, 171–177. [Google Scholar] [CrossRef]
- Xue, X.; Liao, M.; Tiwari, R.N.; Yoshimura, M.; Suzuki, T.; Ohishi, Y. Intense Ultraviolet and Blue Upconverison Emissions in Tb3+/Yb3+ Codoped KY3F10 Nanocrystals. Appl. Phys. Express 2012, 5, 092601. [Google Scholar] [CrossRef]
- Liang, H.; Chen, G.; Li, L.; Liu, Y.; Qin, F.; Zhang, Z. Upconversion Luminescence in Yb3+/Tb3+-Codoped Monodisperse NaYF4 Nanocrystals. Opt. Commun. 2009, 282, 3028–3031. [Google Scholar] [CrossRef]
- Wang, L.; Zhang, D.; Zhao, D.; Qin, G.; Qin, W. Sensitized Upconversion Emissions of Tb3+ by Tm3+ in YF3 and NaYF4 Nanocrystals. J. Nanosci. Nanotechnol. 2011, 11, 9580–9583. [Google Scholar] [CrossRef] [PubMed]
- Braud, A.; Girard, S.; Doualan, J.L.; Thuau, M.; Moncorgé, R.; Tkachuk, A.M. Energy-Transfer Processes in Yb:Tm-Doped KY3F10, LiYF4, and BaY2F8 Single Crystals for Laser Operation at 1.5 and 2.3 μm. Phys. Rev. B 2000, 61, 5280–5292. [Google Scholar] [CrossRef]
- Rapaport, A.; Milliez, J.; Szipőcs, F.; Bass, M.; Cassanho, A.; Jenssen, H. Properties of a New, Efficient, Blue-Emitting Material for Applications in Upconversion Displays: Yb, Tm: KY3F10. Appl. Opt. 2004, 43, 6477–6480. [Google Scholar] [CrossRef]
- Runowski, M. Color-Tunable Up-Conversion Emission of Luminescent-Plasmonic, Core/Shell Nanomaterials–KY3F10:Yb3+,Tm3+/SiO2-NH2/Au. J. Lumin. 2017, 186, 199–204. [Google Scholar] [CrossRef]
- Dong, H.; Sun, L.-D.; Yan, C.-H. Energy Transfer in Lanthanide Upconversion Studies for Extended Optical Applications. Chem. Soc. Rev. 2015, 44, 1608–1634. [Google Scholar] [CrossRef]
- Wu, Q.; Lin, S.; Xie, Z.; Zhang, L.; Qian, Y.; Wang, Y.; Zhang, H. Tunable Upconversion Luminescence of Monodisperse Y2O3: Er3+/Yb3+/Tm3+ Nanoparticles. Appl. Surf. Sci. 2017, 424, 164–169. [Google Scholar] [CrossRef]
- Liang, H.; Lei, W.; Liu, S.; Zhang, P.; Luo, Z.; Lu, A. Color Tunable Up-Conversion Luminescence Characteristics of Yb3+-Er3+-Tm3+ Tri-Doped Fluorosilicate Glass Potentially Used in WLED Field. Opt. Mater. 2021, 119, 111320. [Google Scholar] [CrossRef]
- Pang, T.; Cao, W.; Xing, M.; Luo, X.; Yang, X. Design and Achieving Mechanism of Upconversion White Emission Based on Yb3+/Tm3+/Er3+ Tri-Doped KY3F10 Nanocrystals. Opt. Mater. 2011, 33, 485–489. [Google Scholar] [CrossRef]
- Shi, Y.; Zhang, F.; Xu, J.; Zhou, K.; Chen, C.; Cheng, J.; Li, P. Upconversion Fluorescence Enhancement of NaYF4:Yb/Re Nanoparticles by Coupling with SiO2 Opal Photonic Crystals. J. Mater. Sci. 2019, 54, 8461–8471. [Google Scholar] [CrossRef]
- Marconi da Silva, M.D.; Linhares, H.; Felipe Henriques Librantz, A.; Gomes, L.; Coronato Courrol, L.; Lícia Baldochi, S.; Marcia Ranieri, I. Energy Transfer Rates and Population Inversion Investigation of 1G4 and 1D2 Excited States of Tm3+ in Yb:Tm:Nd:KY3F10 Crystals. J. Appl. Phys. 2011, 109, 083533. [Google Scholar] [CrossRef]
- Gomes, L.; Linhares, H.M.d.S.M.D.; Ichikawa, R.U.; Martinez, L.G.; Ranieri, I.M. Luminescence Properties of Yb:Nd:Tm: KY3F10 Nanophosphor and Thermal Treatment Effects. J. Lumin. 2015, 157, 285–292. [Google Scholar] [CrossRef]
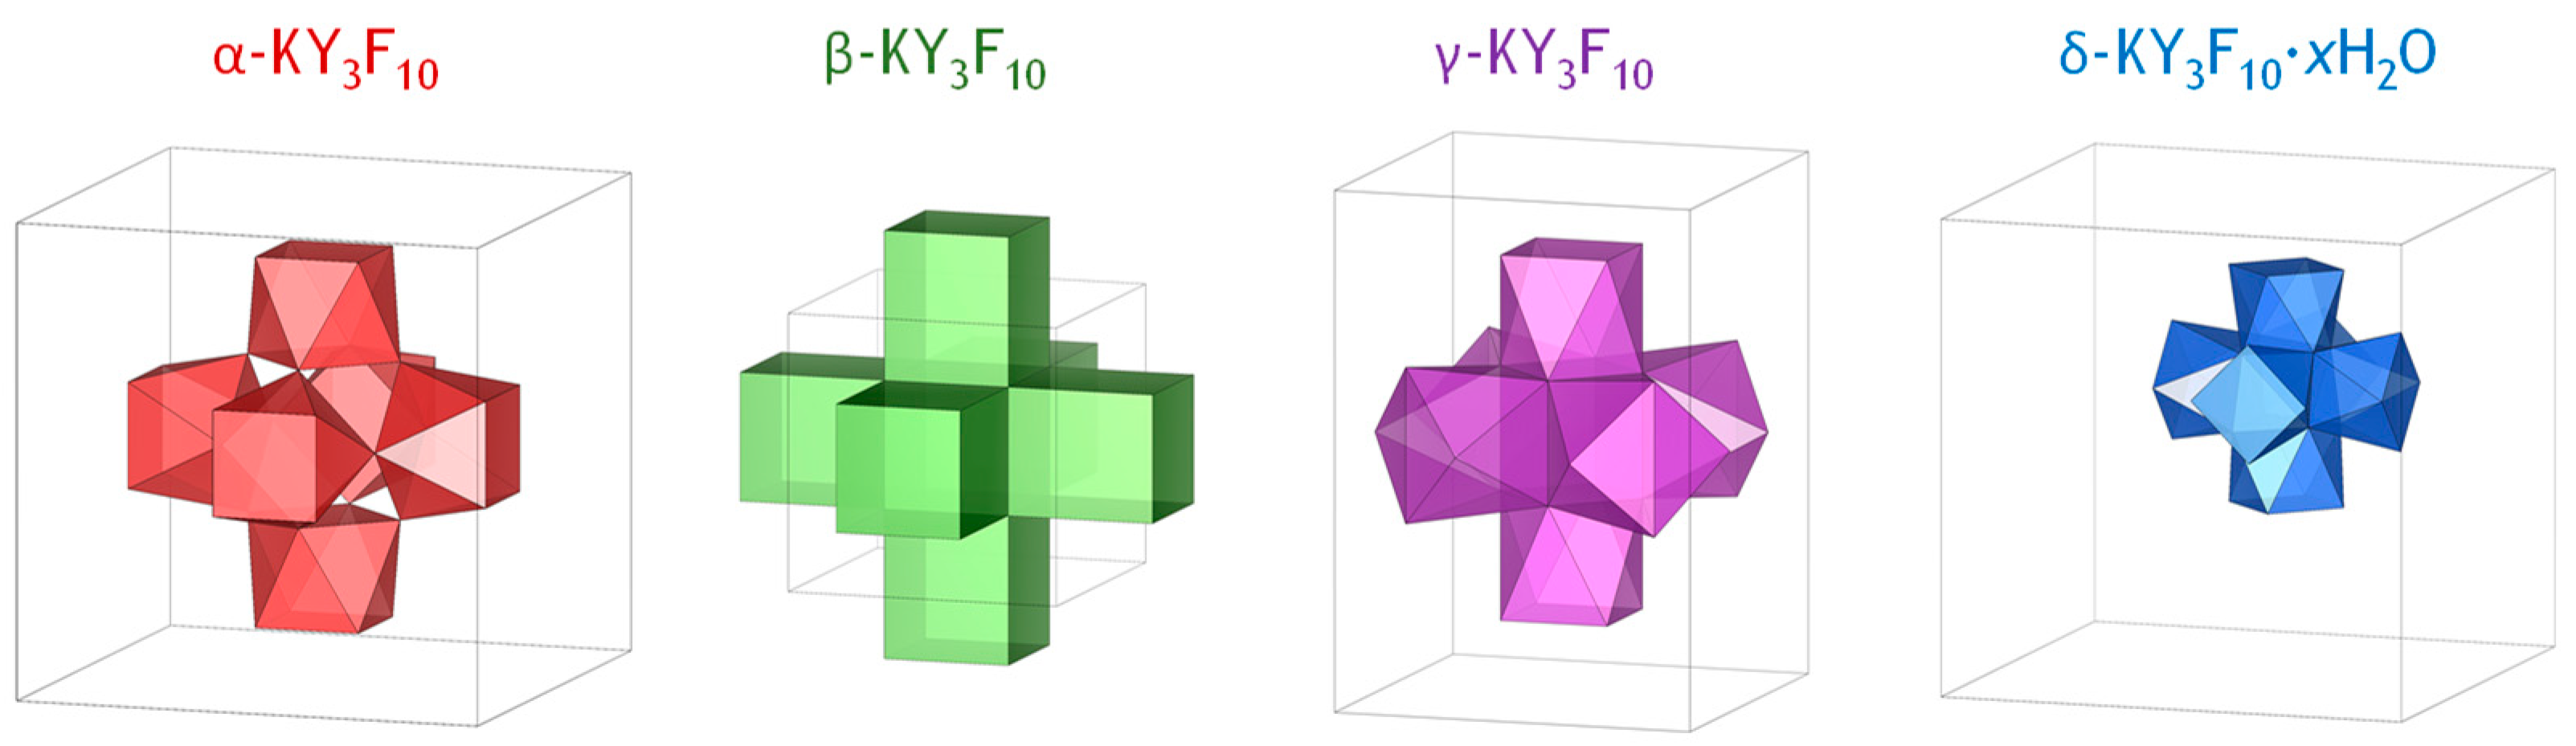


| Compound | Crystal System | SG | Z | a (Å) | V (Å3) | LS (Y3+) | CN (Y3+) |
|---|---|---|---|---|---|---|---|
| α-KY3F10 | Cubic | (No. 225) | 8 | 11.543 | 1538.06 | C4v | 8 |
| β-KY3F10 | Cubic | (No. 221) | 1 | 5.705 | 185.67 | D4h | 8 |
| γ-KY3F10 | Tetragonal | (No. 139) | 4 | 8.161 1 | 768.52 | C4v/C2v | 8 |
| δ-KY3F10·xH2O | Cubic | (No. 227) | 16 | 15.492 | 3717.90 | C2v | 8 |
Disclaimer/Publisher’s Note: The statements, opinions and data contained in all publications are solely those of the individual author(s) and contributor(s) and not of MDPI and/or the editor(s). MDPI and/or the editor(s) disclaim responsibility for any injury to people or property resulting from any ideas, methods, instructions or products referred to in the content. |
© 2024 by the author. Licensee MDPI, Basel, Switzerland. This article is an open access article distributed under the terms and conditions of the Creative Commons Attribution (CC BY) license (https://creativecommons.org/licenses/by/4.0/).
Share and Cite
Serna-Gallén, P. Fantastic Photons and Where to Excite Them: Revolutionizing Upconversion with KY3F10-Based Compounds. Crystals 2024, 14, 762. https://doi.org/10.3390/cryst14090762
Serna-Gallén P. Fantastic Photons and Where to Excite Them: Revolutionizing Upconversion with KY3F10-Based Compounds. Crystals. 2024; 14(9):762. https://doi.org/10.3390/cryst14090762
Chicago/Turabian StyleSerna-Gallén, Pablo. 2024. "Fantastic Photons and Where to Excite Them: Revolutionizing Upconversion with KY3F10-Based Compounds" Crystals 14, no. 9: 762. https://doi.org/10.3390/cryst14090762