Article

Understanding the Mechanistic Pathways of N2 Reduction to Ammonia on (110) Facets of Transition Metal Carbides

1
Science Institute, Faculty of Physical Sciences, University of Iceland, Sæmundargata 2, 102 Reykjavík, Iceland
2
Faculty of Industrial Engineering, Mechanical Engineering and Computer Science, University of Iceland, Sæmundargata 2, 102 Reykjavík, Iceland
*
Author to whom correspondence should be addressed.
Crystals 2024, 14(9), 770; https://doi.org/10.3390/cryst14090770
Submission received: 7 August 2024 / Revised: 25 August 2024 / Accepted: 27 August 2024 / Published: 29 August 2024
(This article belongs to the Special Issue Synthesis and Characterization of Ammonia Synthesis Catalysts)

Abstract

:
The conversion of molecular dinitrogen into ammonia under mild conditions is a significant pursuit in chemistry due to its potential for sustainable and clean ammonia production. The electrochemical reduction of N2 offers a promising route for achieving this goal with reduced energy consumption, utilizing renewable energy sources. However, the exploration of effective electrocatalysts for this process, particularly at room temperature and atmospheric pressure, remains under exploration. This study addresses this gap by conducting a comprehensive investigation of potential catalysts for nitrogen electro-reduction to ammonia under ambient conditions. Using density functional theory calculations, we explore the (110) facets of rock salt structures across 11 transition metal carbides. Catalytic activity is evaluated through the construction of free energy diagrams for associative, dissociative, and Mars–van Krevelen reaction mechanisms. Additionally, we assess material stability against electrochemical poisoning and decomposition of parent metals during operation. Our findings suggest that a few of the candidates are promising for nitrogen reduction reactions, such as TaC and WC, with moderate onset potentials (−0.66 V and −0.82 V vs. RHE) under ambient conditions.

1. Introduction

Ammonia (NH3) is an important part of human life because it is used in a variety of vital compounds. It is necessary for the production of fertilizers, dyes, explosives, and nitric acid, and it is also acknowledged as a clean energy carrier [1,2,3,4,5,6,7,8,9,10,11]. Nitrogen gas (N2), which makes up around 78% of the Earth’s atmosphere by volume, is regarded as an inexhaustible and almost infinite source of ammonia production. Still, very few prokaryotic species in the natural environment are able to fix atmospheric nitrogen [6,12]. Ammonia is most often produced in industries using the Haber–Bosch process (N2 + 3H2 → 2NH3). Its effectiveness makes this method commonly utilized, although it requires a lot of energy. At roughly 940.95 kJ/mol, the nitrogen triple bond (N≡N) is one of the bonds that contributes to the high energy expenditure [1]. Moreover, significant levels of CO2 are released by the Haber–Bosch process, which harms the environment. A crucial manufacturing step, the production of hydrogen (H2), uses a lot of energy and releases additional CO2 [13,14,15]. The Haber–Bosch process is still very inefficient despite its high energy requirements and environmental effect; ammonia outputs range in conversion rate from 10% to 15%. Extensive research into alternative ammonia production methods has been encouraged by this inefficiency. The objective is to create procedures that run under less harmful conditions, reducing energy use and preventing environmental harm [3].
In recent years, numerous experimental [16,17,18,19,20,21,22,23,24,25,26,27,28] and theoretical [29,30,31,32,33,34,35,36,37,38] investigations have addressed ammonia synthesis, providing useful insights into the challenges of producing new catalytic materials for this process. Previous studies have revealed that ammonia production on metal surfaces is very structure-sensitive, with the majority happening on the surface steps of Fe and Ru [39,40,41].
Fuel cells and electrolyzers frequently require large amounts of precious metals like platinum (Pt), palladium (Pd), and iridium (Ir), thus greatly raising the cost of these devices. According to research, early transition metal carbides (TMCs) from groups 4 to 6 have electrical and catalytic properties similar to Pt-group metals [42,43]. These TMCs can be utilized as supports, reducing the overall amount of precious metal required [44]. TMCs’ parent early transition metals are substantially more common in the Earth’s crust and much less expensive than Pt-group metals. As a result, replacing Pt with TMCs can significantly reduce catalyst costs [45,46]. The good qualities of TMCs make them good support for metals of the Pt group. According to earlier work, an ultralow loading of just one monolayer (ML) of Pt can be maintained on different TMC substrates and yet have catalytic activity for the hydrogen evolution process (HER) that is on par with bulk Pt. It has already been explored that Pt-group metals can be effectively supported by TMCs, leading to a good catalytic performance with a much lower precious metal percentage [46,47].
We already showed the catalytic activity of the (100) facets of the TMCs in our previous work [32], and due to the polycrystallinity of these surfaces, we consider the (110) facets of these TMCs in this work for NRR. The thermodynamics of the cathode reaction is studied by means of Density Functional Theory (DFT) calculations. Free energy diagrams are built to clarify the electrochemical protonation of surface carbon or metal atoms, and we obtain the onset potentials needed for ammonia production on these TMC structures. Incorporating the influence of an external bias, we determine the lowest onset potential required for ammonia generation on each carbide by referring to the computational hydrogen electrode [48]. This supports the conclusion that the thermodynamics of adsorbed intermediates is sufficient to predict onset potential [35,49].

2. Materials and Methods

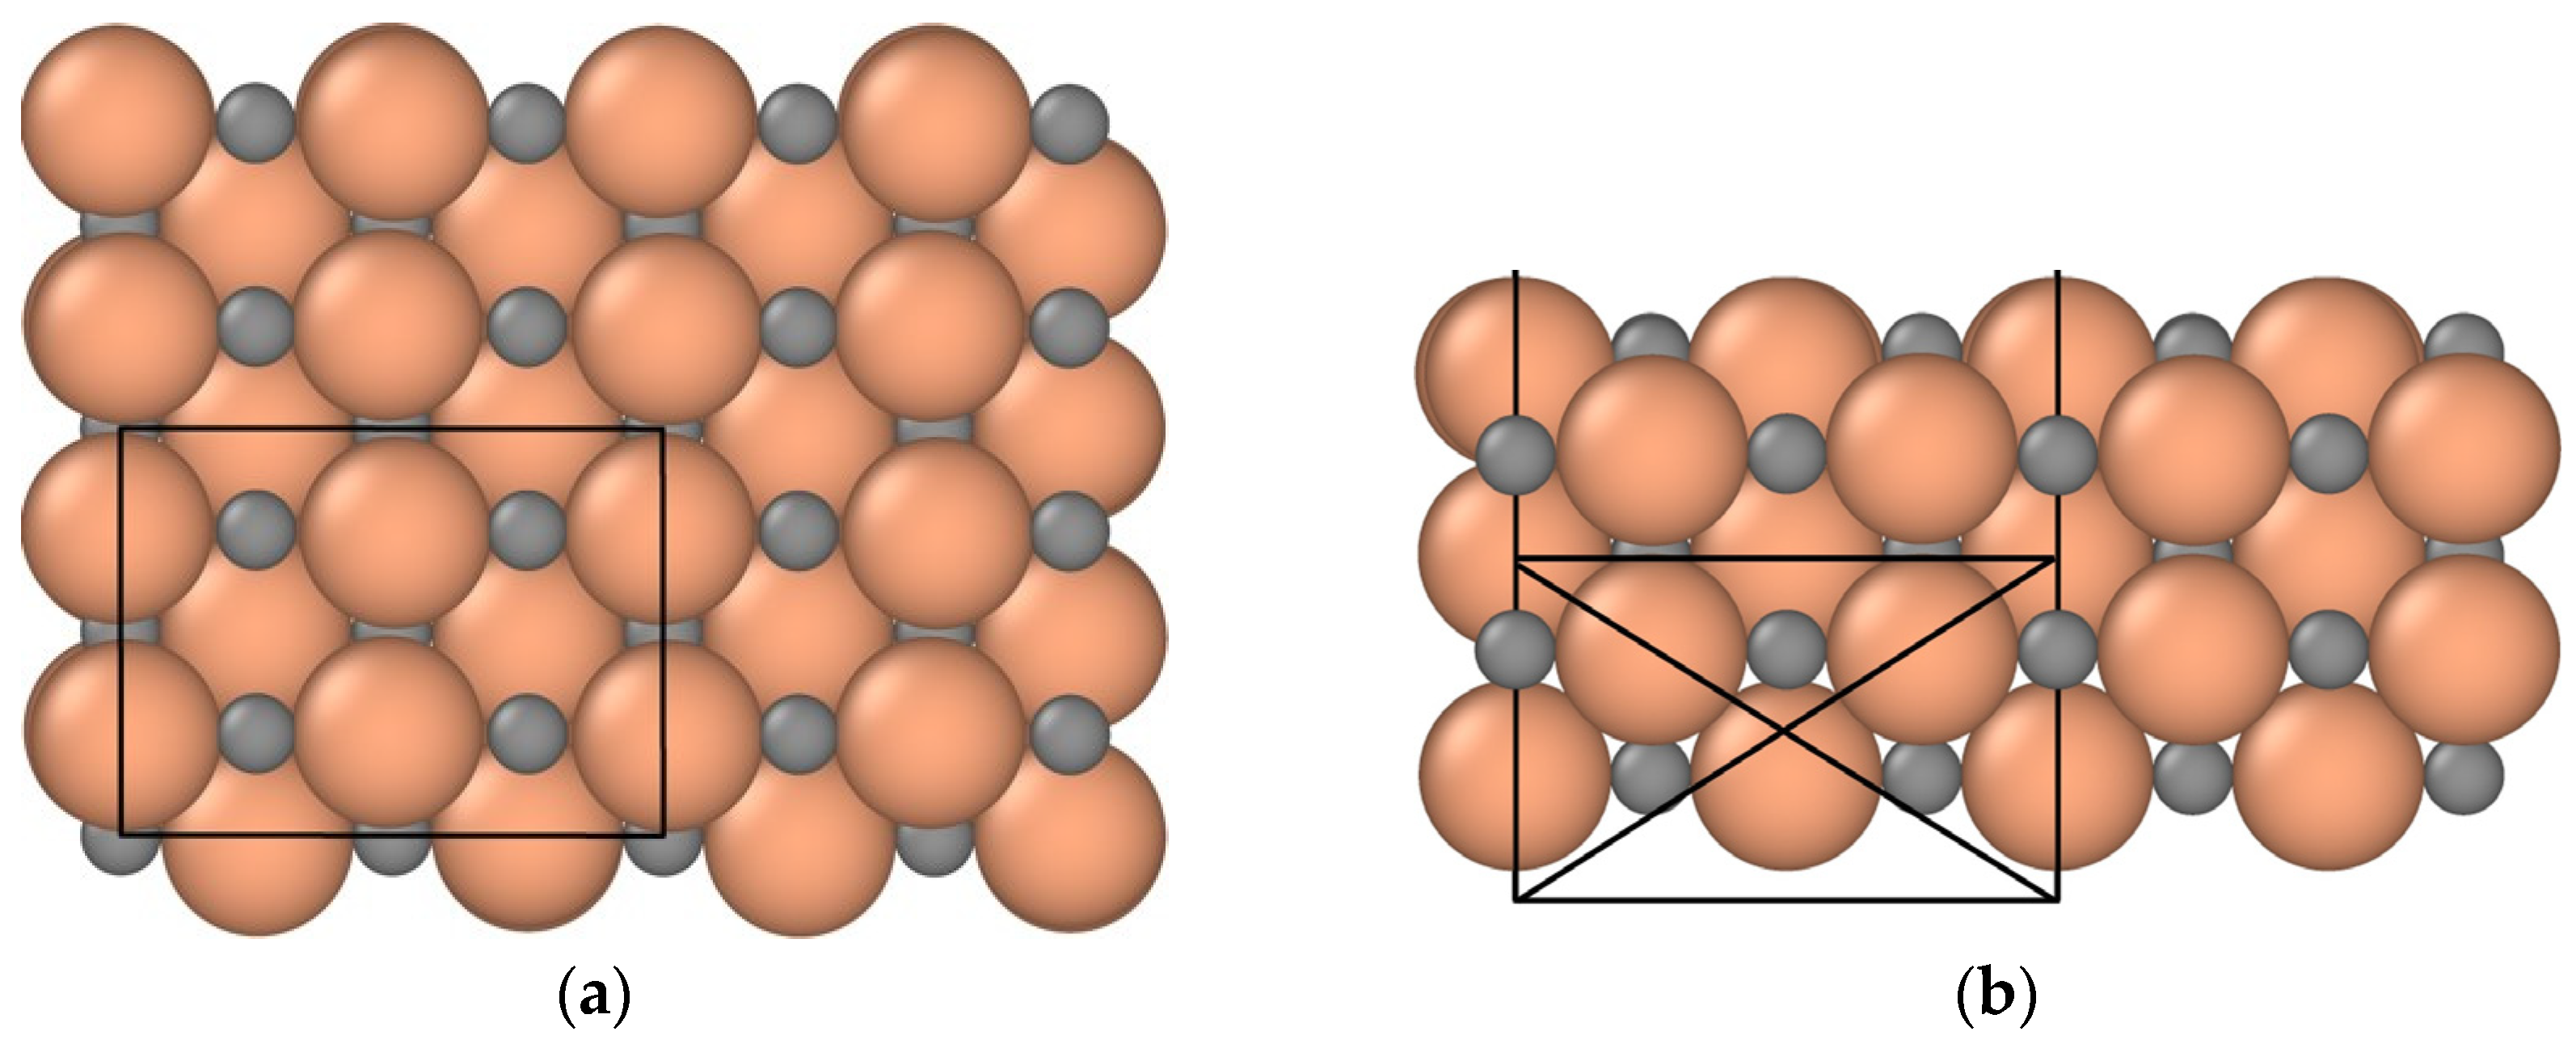
2.1. Modeling Parameters

Within the framework of DFT, we employ the Revised Perdew–Burke–Ernzerhof (RPBE) [50] exchange–correlation functional in our computer simulations. The Vienna ab initio simulation package (VASP) [51] is utilized in these simulations, with a 400 eV energy cutoff for each surface calculation and a Monkhorst-Pack K-point grid of 4 × 4 × 1. VASP integrates the projector augmented wave (PAW) technique [52], which minimizes calculation time by using computationally efficient pseudopotentials [53]. With a smearing value of kBT = 0.1 eV, we apply a Fermi–Dirac distribution to control the electron distribution and guarantee a smooth Kohn–Sham orbital occupancy. With an emphasis on the (110) surface orientation, every surface is examined within the framework of the rock salt (RS) crystallographic structure. As seen in Figure 1, the TMC surfaces are modeled using a 5-layer 2 × 2-unit cell with 20 metal atoms and 20 carbon atoms on the (110) facets.
In our model, the top three layers and any adsorbates are permitted to relax, while the bottom two layers hold onto their equilibrium bulk structure. In the x and y dimensions, we impose periodic boundary conditions, while keeping a minimum distance of 15 Å in the z direction between each surface slab. When the collective forces on all mobile atoms are less than 0.01 eV/Å, structural optimization is said to be optimized. We utilize the climbing image nudged elastic band (CI-NEB) technique to determine the highest point along the minimum energy path (MEP) [54] in order to compute activation energies. In this work, we also use the previously described Bader analysis and charge density difference [55,56]. Supplementary Table S2 lists the optimized lattice constants.

2.2. Electrochemical Modeling and Reaction Pathways

We used the subsequent equations to model the whole chemical pathway responsible for ammonia synthesis:
N2 + 6(H+ + e) ⇌ 2NH3
H2 ⇌ 2(H+ + e)
Nitrogen molecules, protons produced at the anode (Equation (2)), and electrons coming from the applied voltage, are the essential components of the electrochemical cell for ammonia synthesis at the cathode (Equation (1)). We can directly link the applied voltage with either the standard hydrogen electrode (SHE) or the reversible hydrogen electrode (RHE) because the required protons are exclusively created at the anode and our modeling is carried out under zero pH circumstances. Our modeling stays unaffected by the experimental arrangement, whether it is a flow cell, batch cell, or gas diffusion electrode (GDE) cell. The chemical process is simulated utilizing an unconstrained mechanism in which the most thermodynamically favorable adsorption site is investigated for each protonation step and serves as the foundation for succeeding protonation stages that lead to product formation. The preferred way for thoroughly understanding a catalyst’s catalytic efficiency and the resultant products is to use an unrestricted mechanism. The following equation is used to compute the change in free energy for each reaction step.
ΔGi(URHE) = ΔGi (URHE = 0) + neURHE
eURHE = eUSHE + 2.3kBTpH
In this case, USHE symbolizes the applied potential in reference to the standard hydrogen electrode, n the number of electrons, e the elementary charge, kB the Boltzmann constant, and T the temperature. By adding Equation (4) into Equation (3), we obtain the following:
ΔGi(URHE, pH) = ΔGi (URHE = 0) + n(eUSHE + 2.3kBTpH)
Here, the onset potential is pH-independent, as it is reported vs. RHE. Every elementary step has its ΔGi(U = 0), computed as follows:
ΔGi(U = 0) = ΔEDFT + ΔEZPE + ΔH0K→T − TΔS
Whereas ΔEZPE and ΔS stand for zero-point energy corrections and entropy differences, DFT is used to calculate ΔEDFT. These adjustments are determined for the adsorbed intermediates using the harmonic approximation; however, for gas-phase molecules, they are taken from Reference [57].
ΔH0K→T is the temperature-related change in internal energy and is calculated as follows:
Δ H 0 K T = 0 T C P   ( T )   d T
The specific heat capacity at constant pressure is represented by Cp(T′) in Equation (7). The internal energy at ambient temperature is negligibly affected by the integral term in the equation, with a potential contribution of less than 0.1 eV [58].
The electrochemical reaction that results in the most substantial positive change in free energy within a specific reaction pathway is known as the potential determinant step (PDS). The onset potential (OP) is the potential required to neutralize the change in the free energy of the PDS. As a result, the free energy of all subsequent reaction steps decreases, resulting in a downward trajectory, as described in Equation (6). The OP is subsequently expressed as follows:
OP = −ΔG/e
The negative shift in free energy connected with the PDS is measured in volts and is known as the OP.

3. Results

Initially, a computational screening technique is applied to assess a variety of TMC catalysts. These catalysts include elements from groups III to VI and have an RS structure with (110) facets. This extensive investigation analyzes a total of 12 TMC surfaces, including ScC, YC, TiC, VC, CrC, YC, ZrC, NbC, MoC, HfC, TaC, and WC. These catalysts exhibit stability and are thus chosen for further comprehensive study as candidate catalysts for the NRR.
The evaluation method for these TMC candidates, aiming to generate ammonia electrochemically at ambient conditions, consists of a comprehensive analysis of five important variables: (i) The mechanism of the NRR is determined by examining the distinct paths and reactions facilitated by each TMC. (ii) The evaluation of surface poisoning is conducted to determine the vulnerability of each TMC surface to chemicals that may hinder their catalytic activity. (iii) An evaluation is conducted to assess the overall catalytic performance of each TMC to determine its level of efficiency and efficacy in promoting the NRR. (iv) A volcano-plot analysis is performed to show the optimal performance of each TMC based on a reactivity descriptor. (v) A Bader charge analysis and charge distribution analysis are performed, utilizing charge iso-surfaces to visually comprehend the electronic charge transfer on the TMC surfaces.
This study attempts to discover the most promising catalysts among 12 TMC(110) surfaces for sustainable ammonia synthesis using the NRR under ambient conditions by incorporating these five comprehensive variables.

3.1. Mechanism of Nitrogen Reduction Reaction

As discussed in our previous work [29,30,31], we looked into three different mechanisms for the NRR. These mechanisms include the dissociative mechanism (DM), the associative mechanism (AM), and the Mars–van Krevelen mechanism (MvK). The strong triple bond that exists between nitrogen atoms in the DM is broken when N2 binds the surface of the catalyst, which could be an atom of carbon or metal. The ultimate result of this mechanism is that each nitrogen atom independently binds to the catalyst.
In the AM, N2 adsorbs onto the surface of the catalyst and goes through bond cleavage at a certain step of the hydrogenation reaction. This is the opposite to the direct cleavage that occurs in the DM. Within the confines of this framework, we investigated the possibility that adsorbed NNH (*NNH) (In the case of adsorbed species, indicated by *) should play the role of an intermediate in the reaction pathway. Incorporating the adsorption of NNH into our free energy diagrams was necessary in order to acquire a complete comprehension of the mechanism itself. We were able to provide greater insights into the overall reaction paths and the efficiency of the AM in boosting ammonia synthesis as a result of this addition, which enabled us to more precisely define the energy environment and identify steps that were thermodynamically beneficial.
In the MvK mechanism, lattice carbon atoms on the surfaces of TMCs are converted into methane. This conversion is dependent on whether proton adsorption takes place on carbon sites or the metal site, respectively. During this process, surface vacancies are created, which are essential for the continuation of catalytic activity. It is possible for nitrogen molecules to fill these vacancies through either an associative MvK or dissociative MvK process, which will result in the catalyst being efficiently regenerated.

3.2. Surface Poisoning

Before initiating any reaction, it is critical to thoroughly investigate how nitrogen species adhere to the catalyst surface. This is especially relevant when competing species such as H, oxygen (O), and hydroxyl (OH) are present in the aqueous environment. We looked at three types of nitrogen adsorption: associative adsorption of N2 molecules, dissociative adsorption of nitrogen molecules (*2N), and associative adsorption of NNH molecules. These scenarios were compared to the adsorption of H, O, OH, and H2O to determine how they would compete with one another and how likely it is that these species will block the active site. Figure 2 shows more information about the results, helping us to understand how the adsorption works and how the competing forces affect it.
The results showed that most TMCs are better at attracting dissociated nitrogen (*2N) than other species. The only one that did not do this well was VC, which had a different binding pattern. Because of this, it seems that TMCs generally prefer the dissociative adsorption route for nitrogen, which could be good for the NRR. In addition, we looked at how protons attached to the metal surfaces to see how likely it was that the hydrogen evolution reaction (HER) would take place. It is interesting to see that protons always move to the carbon sites instead of staying on the metal sites. This pattern of activity suggests that proton adsorption on metal sites, which would lead to HER, is not likely for all the TMCs that were tested.

3.3. Catalytic Activity

We conducted a thorough examination of the reactions that occur on the RS (110) facets of TMCs, assessing several processes previously described for all TMCs under consideration. However, for the sake of simplicity and clarity, we included free energy diagrams only for the most promising candidates, with comprehensive data for the remaining TMCs accessible in the Supplementary Materials/electronic supplementary information (ESI).
Figure 3 shows that the AM is the best pathway for creating ammonia on TaC and WC. N2 is adsorbed exergonically onto the catalyst surface, and the initial proton preferentially binds to the surface carbon rather than the adsorbed nitrogen. When the surface has reached a half-monolayer coverage of protons, the fifth proton binds with N2 to create NNH, as shown in Supplementary Figure S1. After ten protonation steps, we have two ammonia molecules, with a PDS of 0.69 eV. Furthermore, adsorbing NNH rather N2 on the surface tuned the PDS from 0.69 to 0.66 eV, favoring NH3 generation.
We also investigated the MvK mechanism, which considers carbon vacancies as either CH4 or surface defects and fills them with nitrogen gas in several types of forms: associatively as N2, dissociatively as 2N, and associatively as NNH. Supplementary Figure S2a indicates that the MvK mechanism is ineffective at ambient temperatures due to the high PDS.
In the instance of WC, the adsorption of NNH is endergonic; thus, we begin with the AM pathway. After a half-monolayer of protons, the fifth proton attaches to metal rather than N2. Following the ninth protonation step, the first ammonia molecule is released automatically, resulting in the synthesis of two ammonia molecules after twelve steps with a PDS of 0.82 eV. The MvK mechanism was also tested for WC; however, it was ineffectual due to the high PDS, which prevents ammonia production, as shown in Supplementary Figure S2b. We did not account for solvation in this study because Hoskuldsson et al. [49] recently found that, for a Wolfram catalyst with and without a water bilayer, the solvation effect is minimal in most cases (less than 0.05 eV), except for the NNH species (0.14 eV) and NH3 species (0.13 eV). This minor correction has not been included here, as it falls within the typical uncertainty range of DFT calculations, especially as we are conducting a screening study for several surfaces, and this minor addition will be ruled out.
None of the other materials examined, as shown in Supplementary Figures S3–S11, were active for NRR in ambient circumstances.

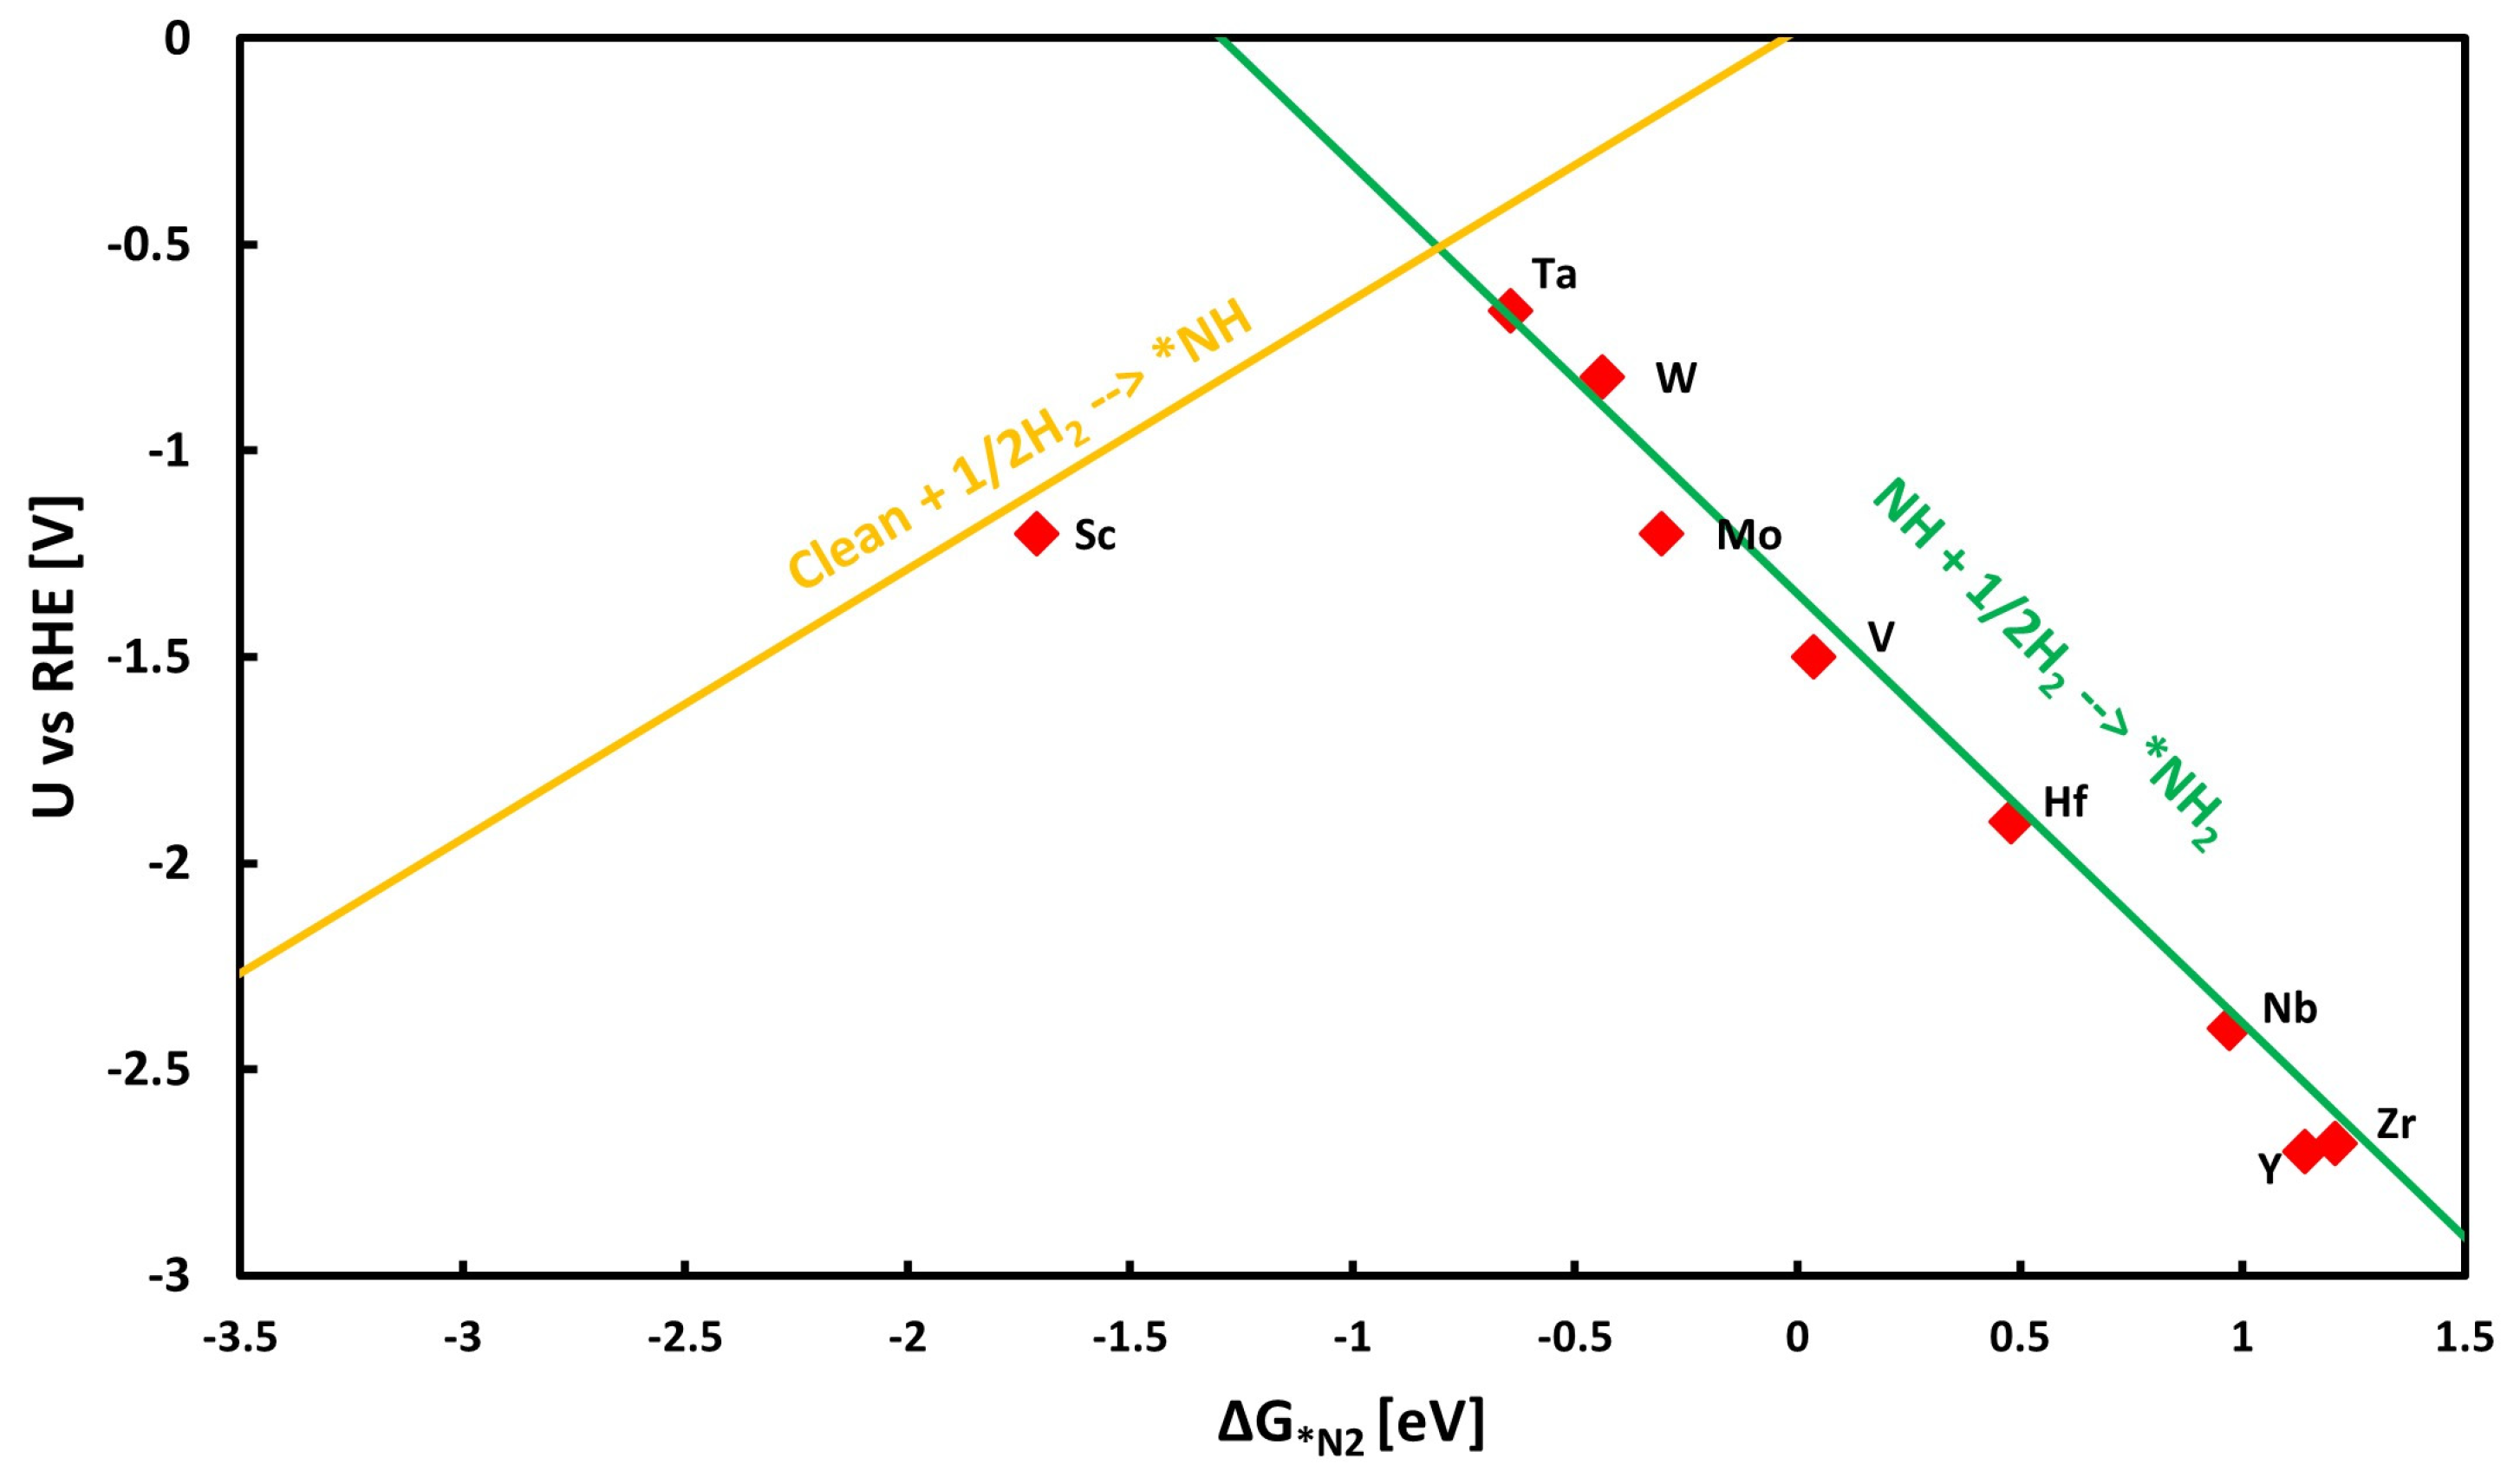
3.4. Exploring the Scaling Relations and Formation of Volcano Plots

A key graphic tool in electrocatalysis, the volcano plot, shows how different catalysts’ binding energy to reaction intermediates relates to their catalytic activity. This plot, so named because of its characteristic “volcano” appearance, shows that catalytic activity peaks at an ideal binding energy and decreases on either side of this peak. The peak of the volcano represents the perfect equilibrium between the energies of adsorption and desorption: the catalyst binds intermediate strongly enough to promote reaction without binding so strongly that it prevents desorption. Reaction rates are lowered by too-strong binding, which is seen in catalysts on the left slope of the volcano plot. On the other hand, too weakly bound intermediates by catalysts on the right slope cause insufficient adsorption to efficiently drive the process.
As it gives researchers a precise target at the top of the volcano, where binding energy is optimized for maximal catalytic activity, the volcano plot is an important tool in catalyst design. We can build a volcano diagram by using linear relations for different reaction steps as a function of the Gibbs free energy change (ΔG) of *N2 (used as a descriptor). This technique, which is described in Reference [59], has already been used to electrolyze water on oxide surfaces. With this method, electrocatalytic activity is directly indicated by the potential connected with the PDS. Every elementary step in the overall reaction has its free energy stated as a function of the applied bias (U) and the ΔG of N2, represented by *N2. Figure 4, however, shows only the two PDSs.
Assuming the AM, we may build the volcano figure, as seen in Figure 4, using the linear scaling relationships from Supplementary Figures S12 and S13. Notably, TaC and WC are shown to have better catalytic performance with low onset potential by being at the top of the volcano plot. A logical design and selection of very effective electrocatalysts is made possible by this thorough knowledge of the relation between binding energy and catalytic activity.

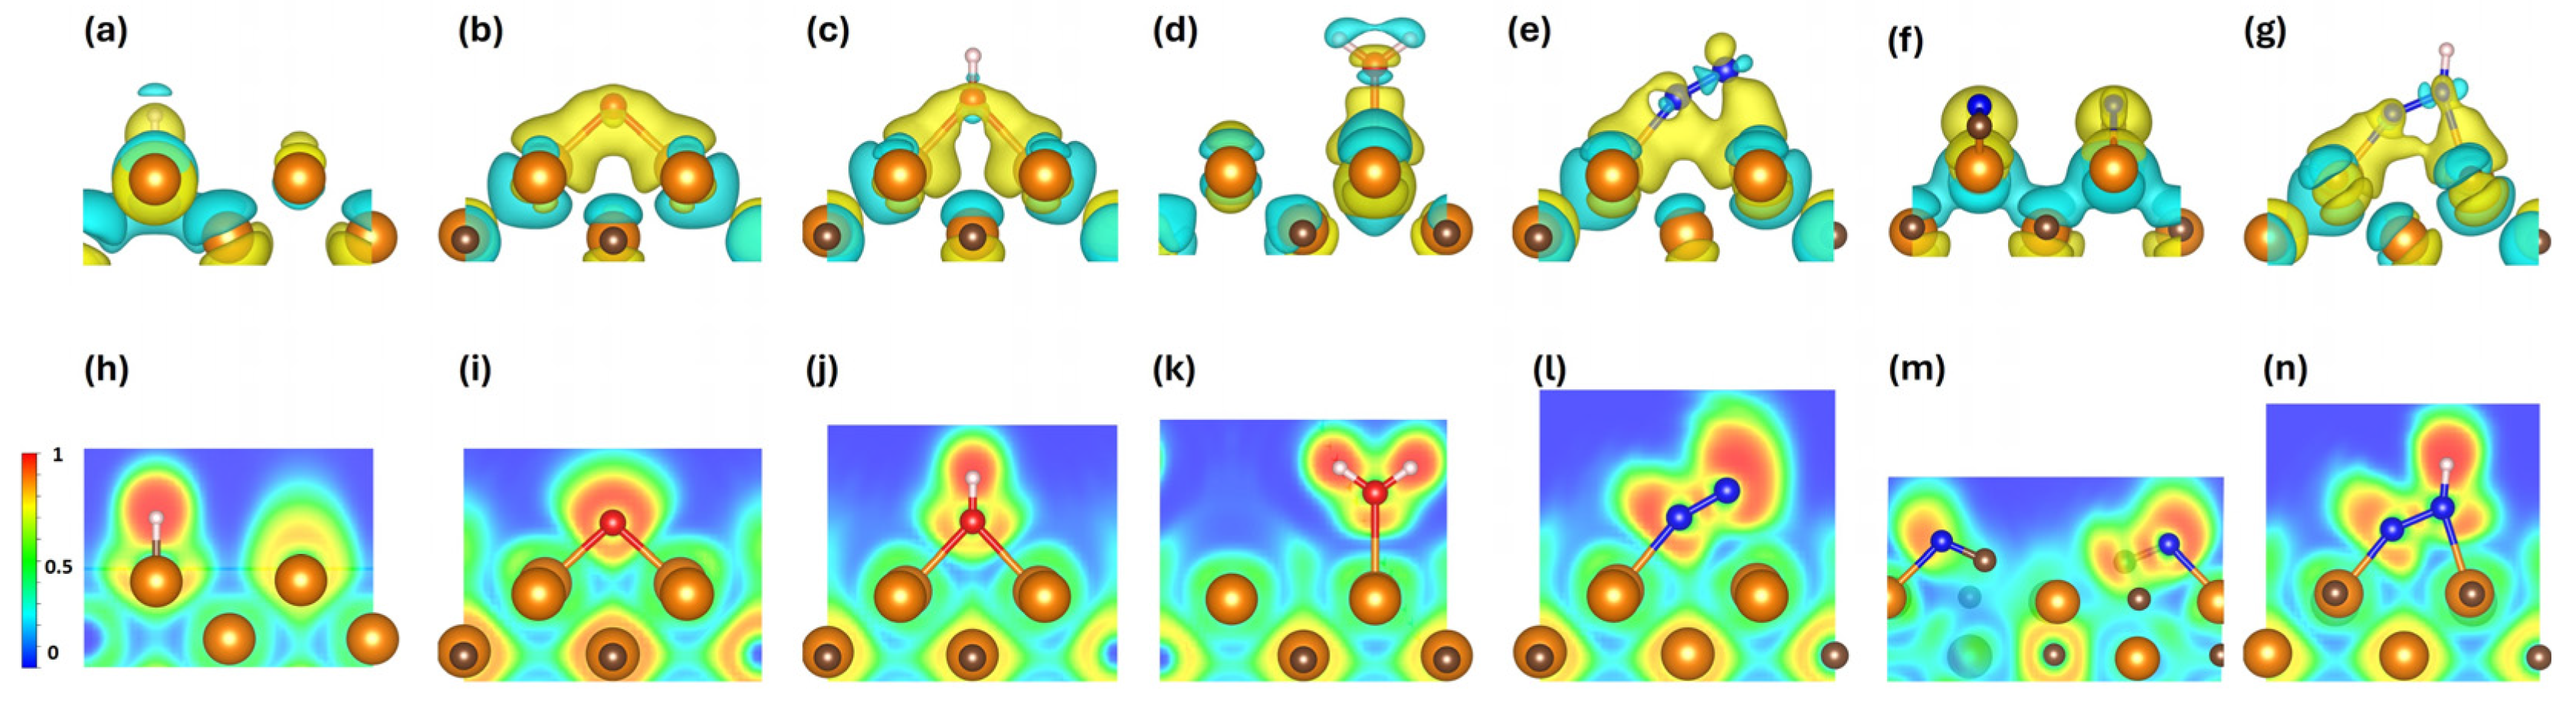
3.5. Bader Charge Analysis and Charge Iso-Surfaces

We determined charge iso-surfaces by calculating charge density differences using the following equation:
ΔP = Ptot − Ppristine − Pgas
In this equation, Ptot, Ppristine, and Pgas represent the charge density for the species adsorbed on the TaC and WC system, and the isolated gas molecules, respectively. The color scheme employed uses yellow to denote regions of charge accumulation and cyan to indicate areas of charge depletion. Figure 5a–g illustrate the charge density difference for various species adsorbed on the TaC surfaces, while the data for WC can be seen in Supplementary Figure S14.
To quantify the extent of charge transfer, we conducted a Bader charge analysis, with the results detailed in Table 1. It is crucial to note that a positive ΔQ value in Table 1 indicates a charge transfer from the TaC and WC layer to the gas molecule, whereas a negative ΔQ value suggests a charge transfer from the gas molecule to the TaC and WC layer. An examination of Table 1 reveals that, in the hydrogen-adsorbed system, there was a net charge transfer of 0.02 and 0.09 electrons from the hydrogen adatom to the TaC and WC substrate. Conversely, in the nitrogen (N2)-adsorbed system, a charge transfer of 0.74 and 0.19 electrons occurred from the TaC and WC substrate to the nitrogen molecule.
Additionally, we employed the ELF to assess electron density behavior, which aids in distinguishing between localized regions (indicative of paired or lone pairs of electrons) and more distributed areas (shared among multiple atoms) [60]. In our study, we examined ELF values for the most favorable adsorption sites of various species on the TaC and WC systems. ELF values range from 0 to 1, representing complete delocalization, as seen in metallic systems, to strong localization, such as in lone pairs or covalent bonds. The expected ELF results for species absorbed on TaC (110) facets are shown in Figure 5h–n, while for WC, such results are shown in Supplementary Figure S14.
Overall, the ELF outcomes underscore the covalent bonding characteristics of all species on TaC and WC, indicating shared-electron interactions. This analysis provides insight into the nature of the chemical bonds formed between the adsorbed species and the TaC and WC substrate, revealing the extent and nature of electron sharing in these systems.

4. Conclusions

Achieving environmentally friendly and sustainable ammonia production can be accomplished by converting N2 to NH3 efficiently. One promising approach to achieve this, using less energy and renewable power, is the electrochemical reduction of N2. This paper addresses this gap by investigating possible catalysts for nitrogen electro-reduction to ammonia at ambient temperature. Using density functional theory calculations, we study the (110) facets of rock salt structures for 12 different transition metal carbides. We evaluate the catalytic activity of these materials using free energy diagrams of the Mars–van Krevelen, associative, and dissociative reaction mechanisms. Additionally, we assess the materials’ resistance to electrochemical poisoning and degradation into their constituent metals during operation. Under ambient conditions, tantalum carbide (TaC) and tungsten carbide (WC) exhibit low onset potentials (−0.66 V and −0.82 V vs. RHE, respectively) following the associative mechanism, indicating that only a few candidates show potential for nitrogen reduction processes. This study enhances our understanding of nitrogen electro-reduction and paves the way for more efficient and environmentally friendly ammonia production methods.

Supplementary Materials

The following supporting information can be downloaded at https://www.mdpi.com/article/10.3390/cryst14090770/s1, Table S1: The zero-point energy (ZPE) and entropy correction parameters have been determined for all the employed adsorbed and gas phase substances. ZPE values for adsorbed substances were computed on the [110] TaC surface, while gas phase values were sourced from reference [1]. In the case of adsorbed species, indicated by *. Table S2: shows the lattice constants of TMC in (110) facets. Figure S1: shows the associative pathway for TaC; Figure S2: The MvK path for (a) TaC and (b) WC at zero potential; Figure S3: The free energy diagram for CrC at zero potential; Figure S4: The free energy diagram for HfC at zero potential; Figure S5: The free energy diagram for MoC at zero potential; Figure S6: The free energy diagram for NbC at zero potential; Figure S7: The free energy diagram for ScC at zero potential; Figure S8: The free energy diagram for TiC at zero potential; Figure S9: The free energy diagram for VC at zero potential; Figure S10: The free energy diagram for YC at zero potential; Figure S11: The free energy diagram for ZrC at zero potential; Figure S12: The scaling relation from which the volcano plot has been made; Figure S13: The theoretical volcano plot; Figure S14: The charge density difference of (a) H adsorbed on the surface (b) O on the surface (c) OH on the surface (d) H2O on the surface (e) N2 associatively on the surface (f) N2 dissociatively on the surface (g) NNH on the surface and (h–n) represent the ELF of these species on WC system; Reference [61] is cited in supplementary materials.

Author Contributions

A.I. conducted the modeling and calculations, extracted the data, constructed the figures, and wrote the first draft of the manuscript; E.S. read the manuscript and commented on it; Y.A. conceptualized the idea, read the manuscript, commented on it, and provided funding for performing the research. All authors have read and agreed to the published version of the manuscript.

Funding

This work was supported by the Icelandic Research Fund [grant number 207056].

Data Availability Statement

The data are provided in the Supplementary Materials.

Acknowledgments

Computational resources were provided by the Icelandic research high-performance computing cluster.

Conflicts of Interest

The authors declare no conflict of interest.

References

  1. Bao, D.; Zhang, Q.; Meng, F.L.; Zhong, H.X.; Shi, M.M.; Zhang, Y.; Yan, J.M.; Jiang, Q.; Zhang, X.B. Electrochemical reduction of N2 under ambient conditions for artificial N2 fixation and renewable energy storage using N2/NH3 cycle. Adv. Mater. 2017, 29, 1604799. [Google Scholar] [CrossRef]
  2. Howalt, J.G.; Vegge, T. Electrochemical ammonia production on molybdenum nitride nanoclusters. Phys. Chem. Chem. Phys. 2013, 15, 20957–20965. [Google Scholar] [CrossRef]
  3. Zhang, L.; Ji, X.; Ren, X.; Ma, Y.; Shi, X.; Tian, Z.; Asiri, A.M.; Chen, L.; Tang, B.; Sun, X. Electrochemical ammonia synthesis via nitrogen reduction reaction on a MoS2 catalyst: Theoretical and experimental studies. Adv. Mater. 2018, 30, 1800191. [Google Scholar] [CrossRef]
  4. Liu, C.; Li, Q.; Zhang, J.; Jin, Y.; MacFarlane, D.R.; Sun, C. Theoretical evaluation of possible 2D boron monolayer in N2 electrochemical conversion into ammonia. J. Phys. Chem. C 2018, 122, 25268–25273. [Google Scholar] [CrossRef]
  5. Zhang, X.; Wu, T.; Wang, H.; Zhao, R.; Chen, H.; Wang, T.; Wei, P.; Luo, Y.; Zhang, Y.; Sun, X. Boron nanosheet: An elemental two-dimensional (2D) material for ambient electrocatalytic N2-to-NH3 fixation in neutral media. ACS Catal. 2019, 9, 4609–4615. [Google Scholar] [CrossRef]
  6. Zhao, J.; Zhang, L.; Xie, X.Y.; Li, X.; Ma, Y.; Liu, Q.; Fang, W.-H.; Shi, X.; Cui, G.; Sun, X. Ti3C2Tx (T = F, OH) MXene nanosheets: Conductive 2D catalysts for ambient electrohydrogenation of N2 to NH3. J. Mater. Chem. A 2018, 6, 24031–24035. [Google Scholar] [CrossRef]
  7. Azofra, L.M.; Li, N.; MacFarlane, D.R.; Sun, C. Promising prospects for 2D d2–d4 M3C2 transition metal carbides (MXenes) in N2 capture and conversion into ammonia. Energy Environ. Sci. 2016, 9, 2545–2549. [Google Scholar] [CrossRef]
  8. Azofra, L.M.; Sun, C.; Cavallo, L.; MacFarlane, D.R. Feasibility of N2 binding and reduction to ammonia on Fe-deposited MoS2 2D sheets: A DFT study. Chem.–A Eur. J. 2017, 23, 8275–8279. [Google Scholar] [CrossRef]
  9. Luo, Y.; Chen, G.F.; Ding, L.; Chen, X.; Ding, L.X.; Wang, H. Efficient electrocatalytic N2 fixation with MXene under ambient conditions. Joule 2019, 3, 279–289. [Google Scholar] [CrossRef]
  10. Schlögl, R. Catalytic synthesis of ammonia—A “never-ending story”? Angew. Chem. Int. Ed. 2003, 42, 2004–2008. [Google Scholar] [CrossRef]
  11. Koebel, M.; Madia, G.; Elsener, M. Selective catalytic reduction of NO and NO2 at low temperatures. Catal. Today 2002, 73, 239–247. [Google Scholar] [CrossRef]
  12. Le, Y.-Q.; Gu, J.; Tian, W.Q. Nitrogen-fixation catalyst based on graphene: Every part counts. Chem. Commun. 2014, 50, 13319–13322. [Google Scholar] [CrossRef]
  13. Chirik, P.J. One electron at a time. Nat. Chem. 2009, 1, 520–522. [Google Scholar] [CrossRef]
  14. Van der Ham, C.J.; Koper, M.T.; Hetterscheid, D.G. Challenges in reduction of dinitrogen by proton and electron transfer. Chem. Soc. Rev. 2014, 43, 5183–5191. [Google Scholar] [CrossRef] [PubMed]
  15. Kadac-Czapska, K.; Knez, E.; Gierszewska, M.; Olewnik-Kruszkowska, E.; Grembecka, M. Microplastics derived from food packaging waste—Their origin and health risks. Materials 2023, 16, 674. [Google Scholar] [CrossRef]
  16. Paal, Z.; Ertl, G.; Lee, S. Interactions of potassium, oxygen and nitrogen with polycrystalline iron surfaces. Appl. Surf. Sci. 1981, 8, 231–249. [Google Scholar] [CrossRef]
  17. Ertl, G.; Weiss, M.; Lee, S. The role of potassium in the catalytic synthesis of ammonia. Chem. Phys. Lett. 1979, 60, 391–394. [Google Scholar] [CrossRef]
  18. Spencer, N.; Schoonnaker, R.; Somorjai, G. Structure Sensitivity in the Iron Single Crystal Catalysed Synthesis of Ammonia; Lawrence Berkeley National Laboratory: Berkeley, CA, USA, 1981.
  19. Ertl, G.; Lee, S.; Weiss, M. Kinetics of nitrogen adsorption on Fe (111). Surf. Sci. 1982, 114, 515–526. [Google Scholar] [CrossRef]
  20. Ertl, G.; Lee, S.; Weiss, M. Adsorption of nitrogen on potassium promoted Fe (111) and (100) surfaces. Surf. Sci. 1982, 114, 527–545. [Google Scholar] [CrossRef]
  21. Bragulla, S.C.H.; von Seggern, A.R.; Lorenz, J.; Harms, C.; Wark, M.; Friedrich, K.A. Improving the Ca-assisted Urea-Glass Method for the Synthesis of Zirconium Nitride as Potential Electrocatalyst for the Nitrogen Reduction Reaction. ChemCatChem 2024, e202400613. [Google Scholar] [CrossRef]
  22. Ješić, D.; Pomeroy, B.; Kamal, K.M.; Kovačič, Ž.; Huš, M.; Likozar, B. Photo-and Photoelectrocatalysis in Nitrogen Reduction Reactions to Ammonia: Interfaces, Mechanisms, and Modeling Simulations. Adv. Energy Sustain. Res. 2024, 2400083. [Google Scholar] [CrossRef]
  23. Guo, P.; Yin, F.; Ni, Z.; Li, G.; Chen, B. MIL-101 (Fe) supported Au-Cu nanoalloy for enhanced electrochemical nitrogen fixation in gas–liquid-solid three-phase reactor. Chem. Eng. J. 2024, 494, 153134. [Google Scholar] [CrossRef]
  24. Macfarlane, D.R.; Skúlason, E.; Hosono, H.; Shao, M. Preface to Special Issue on Sustainable Ammonia Synthesis. ChemSusChem 2024, 17, e20230139. [Google Scholar] [CrossRef] [PubMed]
  25. Hanifpour, F.; Canales, C.P.; Fridriksson, E.G.; Sveinbjörnsson, A.; Tryggvason, T.K.; Yang, J.; Arthur, C.; Jónsdóttir, S.; Garden, A.L.; Ólafsson, S.; et al. Operando quantification of ammonia produced from computationally-derived transition metal nitride electro-catalysts. J. Catal. 2022, 413, 956–967. [Google Scholar] [CrossRef]
  26. Hanifpour, F.; Sveinbjörnsson, A.; Canales, C.P.; Skúlason, E.; Flosadóttir, H.D. Preparation of nafion membranes for reproducible ammonia quantification in nitrogen reduction reaction experiments. Angew. Chem. 2020, 132, 23138–23142. [Google Scholar] [CrossRef]
  27. He, T.; Chen, M.; Sun, H.; Mei, J.; Noufal, M.; Liu, Q.; Santiago, A.R.P. Chemical insights into the interfacial phenomena of low-dimensional heterointerfaces. Chem 2024, 10, 1974–1993. [Google Scholar] [CrossRef]
  28. He, T.; Santiago AR, P.; Kong, Y.; Ahsan, M.A.; Luque, R.; Du, A.; Pan, H. Atomically dispersed heteronuclear dual-atom catalysts: A new rising star in atomic catalysis. Small 2022, 18, 2106091. [Google Scholar] [CrossRef]
  29. Iqbal, A.; Sku, E.; Abghoui, Y. Catalytic Nitrogen Reduction on the Transition Metal Carbonitride (110) Facet: DFT Predictions and Mechanistic Insights. J. Phys. Chem. C 2024, 128, 10300–10307. [Google Scholar] [CrossRef]
  30. Iqbal, A.; Skúlason, E.; Abghoui, Y. Are (100) facets of transition metal carbonitrides suitable as electrocatalysts for nitrogen reduction to ammonia at ambient conditions? Int. J. Hydrogen Energy 2024, 64, 744–753. [Google Scholar] [CrossRef]
  31. Iqbal, A.; Skulason, E.; Abghoui, Y. Electrochemical Nitrogen Reduction to Ammonia at Ambient Condition on the (111) Facets of Transition Metal Carbonitrides. ChemPhysChem 2024, 25, e202300991. [Google Scholar] [CrossRef]
  32. Ellingsson, V.; Iqbal, A.; Skúlason, E.; Abghoui, Y. Nitrogen reduction reaction to ammonia on transition metal carbide catalysts. ChemSusChem 2023, 16, e202300947. [Google Scholar] [CrossRef] [PubMed]
  33. Abghoui, Y.; Iqbal, A.; Skúlason, E. The role of overlayered nitride electro-materials for N2 reduction to ammonia. Front. Catal. 2023, 2, 1096824. [Google Scholar] [CrossRef]
  34. Höskuldsson, Á.B.; Dang, T.; Sakai, Y.; Ishikawa, A.; Skúlason, E. High-throughput computational screening of doped transition metal oxides as catalysts for nitrogen reduction. Cell Rep. Phys. Sci. 2023, 4, 101595. [Google Scholar] [CrossRef]
  35. Tayyebi, E.; Abghoui, Y.; Skulason, E. Elucidating the mechanism of electrochemical N2 reduction at the Ru (0001) electrode. ACS Catal. 2019, 9, 11137–11145. [Google Scholar] [CrossRef]
  36. Abghoui, Y.; Sigtryggsson, S.B.; Skúlason, E. Biomimetic nitrogen fixation catalyzed by transition metal sulfide surfaces in an electrolytic cell. ChemSusChem 2019, 12, 4265–4273. [Google Scholar] [CrossRef]
  37. Abghoui, Y.; Garden, A.L.; Howalt, J.G.; Vegge, T.; Skúlason, E. Electroreduction of N2 to ammonia at ambient conditions on mononitrides of Zr, Nb, Cr, and V: A DFT guide for experiments. ACS Catal. 2016, 6, 635–646. [Google Scholar] [CrossRef]
  38. Abghoui, Y.; Skúlason, E. Electrochemical synthesis of ammonia via Mars-van Krevelen mechanism on the (111) facets of group III–VII transition metal mononitrides. Catal. Today 2017, 286, 78–84. [Google Scholar] [CrossRef]
  39. Dahl, S.; Logadottir, A.; Egeberg, R.C.; Larsen, J.H.; Chorkendorff, I.; Törnqvist, E.; Nørskov, J.K. Role of steps in N2 activation on Ru (0001). Phys. Rev. Lett. 1999, 83, 1814. [Google Scholar] [CrossRef]
  40. Skulason, E.; Bligaard, T.; Gudmundsdóttir, S.; Studt, F.; Rossmeisl, J.; Abild-Pedersen, F.; Vegge, T.; Jónsson, H.; Nørskov, J.K. A theoretical evaluation of possible transition metal electro-catalysts for N2 reduction. Phys. Chem. Chem. Phys. 2012, 14, 1235–1245. [Google Scholar] [CrossRef]
  41. Jacobsen, C.J.; Dahl, S.; Hansen, P.L.; Törnqvist, E.; Jensen, L.; Topsøe, H.; Prip, D.V.; Møenshaug, P.B.; Chorkendorff, I. Structure sensitivity of supported ruthenium catalysts for ammonia synthesis. J. Mol. Catal. A Chem. 2000, 163, 19–26. [Google Scholar] [CrossRef]
  42. Ham, D.J.; Lee, J.S. Transition metal carbides and nitrides as electrode materials for low temperature fuel cells. Energies 2009, 2, 873–899. [Google Scholar] [CrossRef]
  43. Hwu, H.H.; Chen, J.G. Surface chemistry of transition metal carbides. Chem. Rev. 2005, 105, 185–212. [Google Scholar] [CrossRef]
  44. Kelly, T.G.; Chen, J.G. Metal overlayer on metal carbide substrate: Unique bimetallic properties for catalysis and electrocatalysis. Chem. Soc. Rev. 2012, 41, 8021–8034. [Google Scholar] [CrossRef] [PubMed]
  45. Esposito, D.V.; Chen, J.G. Monolayer platinum supported on tungsten carbides as low-cost electrocatalysts: Opportunities and limitations. Energy Environ. Sci. 2011, 4, 3900–3912. [Google Scholar] [CrossRef]
  46. Esposito, D.V.; Hunt, S.T.; Stottlemyer, A.L.; Dobson, K.D.; McCandless, B.E.; Birkmire, R.W.; Chen, J.G. Low-cost hydrogen-evolution catalysts based on monolayer platinum on tungsten monocarbide substrates. Angew. Chem. Int. Ed. 2010, 51, 9859–9862. [Google Scholar] [CrossRef]
  47. Kimmel, Y.C.; Yang, L.; Kelly, T.G.; Rykov, S.A.; Chen, J.G. Theoretical prediction and experimental verification of low loading of platinum on titanium carbide as low-cost and stable electrocatalysts. J. Catal. 2014, 312, 216–220. [Google Scholar] [CrossRef]
  48. Nørskov, J.K.; Rossmeisl, J.; Logadottir, A.; Lindqvist, L.; Kitchin, J.R.; Bligaard, T.; Jónsson, H. Origin of the overpotential for oxygen reduction at a fuel-cell cathode. J. Phys. Chem. B 2004, 108, 17886–17892. [Google Scholar] [CrossRef]
  49. Höskuldsson, Á.B.; Tayyebi, E.; Skúlason, E. Computational examination of the kinetics of electrochemical nitrogen reduction and hydrogen evolution on a tungsten electrode. J. Catal. 2021, 404, 362–370. [Google Scholar] [CrossRef]
  50. Hammer, B.; Hansen, L.B.; Nørskov, J.K. Improved adsorption energetics within density-functional theory using revised Perdew-Burke-Ernzerhof functionals. Phys. Rev. B 1999, 59, 7413. [Google Scholar] [CrossRef]
  51. Kresse, G.; Furthmüller, J. Efficient iterative schemes for ab initio total-energy calculations using a plane-wave basis set. Phys. Rev. B 1996, 54, 11169. [Google Scholar] [CrossRef]
  52. Kresse, G.; Joubert, D. From ultrasoft pseudopotentials to the projector augmented-wave method. Phys. Rev. B 1999, 59, 1758. [Google Scholar] [CrossRef]
  53. Blöchl, P.E. Projector augmented-wave method. Phys. Rev. B 1994, 50, 17953. [Google Scholar] [CrossRef] [PubMed]
  54. Henkelman, G.; Uberuaga, B.P.; Jónsson, H. A climbing image nudged elastic band method for finding saddle points and minimum energy paths. J. Chem. Phys. 2000, 113, 9901–9904. [Google Scholar] [CrossRef]
  55. Henkelman, G.; Arnaldsson, A.; Jónsson, H. A fast and robust algorithm for Bader decomposition of charge density. Comput. Mater. Sci. 2006, 36, 354–360. [Google Scholar] [CrossRef]
  56. Gudmundsdóttir, S.; Tang, W.; Henkelman, G.; Jónsson, H.; Skúlason, E. Local density of states analysis using Bader decomposition for N2 and CO2 adsorbed on Pt (110)-(1 × 2) electrodes. J. Chem. Phys. 2012, 137, 164705. [Google Scholar] [CrossRef]
  57. Bagger, A.; Arán-Ais, R.M.; Halldin Stenlid, J.; Campos dos Santos, E.; Arnarson, L.; Degn Jensen, K.; Escudero-Escribano, M.; Cuenya, B.R.; Rossmeisl, J. Ab initio cyclic voltammetry on Cu (111), Cu (100) and Cu (110) in acidic, neutral and alkaline solutions. ChemPhysChem 2019, 20, 3096–3105. [Google Scholar] [CrossRef]
  58. Nørskov, J.K.; Studt, F.; Abild-Pedersen, F.; Bligaard, T. Fundamental Concepts in Heterogeneous Catalysis; John Wiley & Sons: Hoboken, NJ, USA, 2014. [Google Scholar]
  59. Rossmeisl, J.; Qu, Z.-W.; Zhu, H.; Kroes, G.-J.; Nørskov, J. Electrolysis of water on oxide surfaces. J. Electroanal. Chem. 2007, 607, 83–89. [Google Scholar] [CrossRef]
  60. Fan, K.; Ying, Y.; Li, X.; Luo, X.; Huang, H. Theoretical investigation of V3C2 MXene as prospective high-capacity anode material for metal-ion (Li, Na, K, and Ca) batteries. J. Phys. Chem. C 2019, 123, 18207–18214. [Google Scholar] [CrossRef]
  61. Che, M.; Védrine, J.C. Characterization of Solid Materials and Heterogeneous Catalysts: From Structure to Surface Reactivity; John Wiley & Sons: Hoboken, NJ, USA, 2012. [Google Scholar]
Figure 1. The (a) top view and the (b) side view of a model diagram of the TMC used in this simulation. The orange and gray circles show the metal and carbon atoms, respectively.
Crystals 14 00770 g001
Figure 2. Adsorption of different intermediates on the pristine structures of TMCs at zero potential.
Crystals 14 00770 g002
Figure 3. Free energy diagrams for (a) TaC and (b) WC at zero potential.
Crystals 14 00770 g003
Figure 4. Volcano plot illustrates the relationship between the free energy change of nitrogen adsorption (ΔG*N2) and the applied voltage (U vs. RHE) for various TMCs.
Crystals 14 00770 g004
Figure 5. The charge density difference of (a) H adsorbed on the surface, (b) O on the surface, (c) OH on the surface, (d) H2O on the surface, (e) N2 associatively on the surface, (f) N2 dissociatively on the surface, (g) NNH on the surface, and (hn) represent the Electron Localization Function (ELF) of these species on TaC system. The yellow color shows charge accumulation and cyan represents charge depletion. The red (1) is associated with high values of electron localization function (ELF), indicating regions where electrons are more localized or confined, such as around lone pairs or in localized bonds. On the other hand, blue (0) is associated with low ELF values, representing regions where electrons are more delocalized or spread out.
Crystals 14 00770 g005
Table 1. Bader charges (ΔQ) in the unit of e for electron charge for TaC and WC.
ΔQ(e)HOOHH2ON22NNNH
TaC0.02−1.0−0.380.02−0.74−2.77−0.87
WC0.09−0.84−0.490.06−0.19−2.62−0.44
Disclaimer/Publisher’s Note: The statements, opinions and data contained in all publications are solely those of the individual author(s) and contributor(s) and not of MDPI and/or the editor(s). MDPI and/or the editor(s) disclaim responsibility for any injury to people or property resulting from any ideas, methods, instructions or products referred to in the content.

