Article

The Effects of Laser Parameters on the Wear Resistance of a Cu/BN Remelted Layer

1
School of Mechanical and Electronic Engineering, Suzhou University, Suzhou 234000, China
2
School of Chemistry and Materials Science, University of Science and Technology of China, Hefei 230026, China
*
Authors to whom correspondence should be addressed.
Crystals 2024, 14(9), 809; https://doi.org/10.3390/cryst14090809
Submission received: 31 July 2024 / Revised: 6 September 2024 / Accepted: 11 September 2024 / Published: 13 September 2024
(This article belongs to the Special Issue Microstructural Characterization and Property Analysis of Alloys)

Abstract

:
In order to improve the wear resistance of copper and enhance the surface properties of copper parts, this article uses BN nanoparticles as a reinforcing phase and the laser remelting method to prepare a Cu/BN remelted layer on the copper surface. The surface morphology, crystal structure, microhardness, and wear resistance of the samples were tested and characterized using scanning electron microscopy (SEM), X-ray diffraction (XRD), a microhardness tester, and a friction and wear tester. The effects of laser frequency, pulse width, and energy density on the surface morphology and wear resistance of the samples were analyzed and studied, and the effects of the laser parameters on the properties of the Cu/BN remelted layer were discussed. The research results indicate that laser frequency, pulse width, and energy density have a direct impact on the surface morphology and properties of the Cu/BN remelted layer, but the impact mechanism by the above parameters on the remelted layer is different. The effects of laser frequency on the remelted layer are caused by changes in the overlap mode of the remelting points, while laser pulse width and energy density are achieved through changes in remelting intensity. When the laser frequency is 10 Hz, the pulse width is 10 ms, and the energy density is 165.8 J/mm2, the Cu/BN remelted layer has better surface properties.

1. Introduction

The surface wear of parts is one of the main factors leading to their failure [1,2,3]. Improving the wear resistance of materials can effectively extend the service life of parts, reduce equipment failure rates, and improve production efficiency [4,5,6]. Copper has good thermal conductivity, electrical conductivity, and processability, and is a crucial functional material in the mechanical field [7,8,9]. However, copper has obvious shortcomings in its surface hardness and wear resistance, which greatly limits its application scenarios and service life [10,11]. Therefore, improving the wear resistance of copper parts is of great significance for extending their service life and expanding their application range.
Laser surface treatment is a newly emerging method for material surface modification in recent years. Its basic principle is that the surface structure of the material undergoes a phase transition under the action of a high-energy laser beam, achieving the effect of surface strengthening. Compared with traditional heat treatment methods, laser surface treatment can achieve rapid heating and cooling, and has the characteristics of a small heat-affected zone and deformation. For example, to improve the surface wear resistance of Ti-6Al-4V (TC4), Cao et al. [12] synthesized a Ti-S self-lubricating wear-resistant cladding layer on the surface of TC4 by laser cladding and investigated the effect of WC addition on the coating structure and tribological properties. To improve the wear resistance of 40Cr steel, Zhang et al. [13] used an Fe49.7Cr17.7Mn1.9Mo7.4W1.6B15.2C3.8Si2.4 (SAM2X5) amorphous alloy powder as a raw material and prepared a crack-free Fe-based amorphous composite coating by the laser cladding method. The analysis shows that the wear resistance of the coating is much higher than that of the substrate, and its wear resistance is improved by four times. To investigate the effect of laser shock peening on the microstructure and oxidation properties of a nickel-based single-crystal high-temperature alloy (DD6), Li et al. [14] conducted high-temperature oxidation experiments on samples after laser shock peening, and analyzed and studied the microstructure and oxidation resistance of different high-temperature alloys. Jin et al. [15] used the laser shock peening method to surface treat the blades in order to improve their service life. Related tests have shown that after laser shock strengthening, the surface hardness of the sample increased by nearly half, and the fatigue life reached 1.3 times the original. Li et al. [16] used a laser shock pending and ultrasonic rolling composite strengthening method to improve the fatigue performance of ultra-high-strength steel (45CrNiMoVA). Research has shown that compared to single ultrasonic rolling strengthening, composite strengthening results in significant plastic deformation and grain refinement in the surface material.
Laser remelting technology, as an important component of laser surface strengthening, is a way for a laser to rapidly melt and cool material’s surface, improve its grain structure, and enhance its surface hardness, wear resistance, and corrosion resistance. For example, Li et al. [17] performed surface remelting on TC4 prepared by selective laser melting and analyzed the effects of laser remelting on the forming quality and mechanical properties of titanium alloy samples. The experimental results show that laser remelting can significantly improve the surface quality, tensile properties, and density level of the TC4 samples, and the improvement effect becomes greater with an increase in the remelting time. To improve the hardness of cast iron, Xiong et al. [18] used laser remelting to strengthen the surface of HT250 gray cast iron and analyzed and studied the temperature distribution and its variation. The experimental results indicate that after laser treatment, the presence of a remelted layer significantly increases its surface hardness. Zhao et al. [19] researched the microstructure evolution, microhardness, and wear resistance mechanism of laser remelted high-manganese steel. The test results show that compared with the high manganese steel substrate, the microhardness and wear resistance of laser remelted high-manganese steel are significantly improved. Song et al. [20] conducted laser remelting on iron-based amorphous coatings produced by high-speed arc spraying. The experimental results show that after laser remelting, the structural defects in the iron-based amorphous coating samples are significantly reduced, the distribution of structural components is more uniform, and the corrosion resistance of the samples is obviously improved. Tang et al. [21] prepared TC4 titanium alloy coatings on the surfaces of an AA1060 aluminum substrate and a Q235 steel substrate using the laser remelting method, and compared the phase composition, microstructure, corrosion resistance, and wear resistance of the coatings.
Dispersion strengthening is an effective method to improve material properties. Its principle is to add a second phase that is insoluble in the substrate to a uniform material, expand the phase interface, and enhance the material’s ability to resist dislocation slip, thereby achieving the effect of enhanced material properties. BN nanoparticles have excellent thermal conductivity, chemical stability, and self-lubricating properties, and are one of the most common materials for surface modification [22,23,24]. For example, in order to improve the cutting quality of stainless steel, Fu et al. [25] studied the effect of the concentration and particle size of BN nanoparticles in nanofluids on the turning of 304 austenitic stainless steel. The test results indicate that adding BN nanoparticles at an appropriate concentration can reduce the friction coefficient, decrease the cutting force, and improve the surface quality of the machined surface. Gao et al. [26] prepared composite coatings by adding BN nanoparticles to improve the wear resistance and corrosion resistance of micro arc oxidation (MAO) coatings. The research has shown that the addition of BN nanoparticles reduces internal defects in the coatings, and significantly improves the wear resistance, corrosion resistance, surface hardness, and adhesion of the sample. Uzay’s study investigated the effect of adding BN nanoparticles to carbon-fiber-reinforced polymer (CFRP) composites on their wear performance. Relevant tests showed that the addition of BN nanoparticles significantly improved the surface microhardness and friction coefficient of the matrix [27]. Kandeva et al. [28] added BN nanoparticles as a reinforcing phase to the electroless nickel-plating process and studied the surface-wear resistance. The research tests show that adding BN nanoparticles can effectively improve the wear resistance and erosion resistance of the nickel coating.
In order to improve wear resistance in copper, this article uses BN nanoparticles as a reinforcing phase and uses the laser remelting method to prepare a Cu/BN composite remelted layer on the surface of the copper. The surface morphology, crystal structure, microhardness, and wear resistance of the samples are tested using SEM, an XRD, a microhardness tester, and a friction and wear tester, respectively. The effects of laser frequency, laser pulse width, and laser energy density on the surface morphology and properties of the samples were analyzed and studied, and the effects of laser parameters on the wear resistance of the samples were explored. The relevant research in this article has a positive significance in improving the service life of copper parts and in expanding the scope of their application.

2. Experiment

2.1. Experimental Materials and Pretreatment

The experiment used purple copper plate (T2) as the substrate material, with an overall size of 50 × 30 × 2 mm. The main components of T2 are shown in Table 1. The BN nanoparticles used in the experiment (Guangzhou Metal Metallurgy (Group) Co., Ltd., Guangzhou, China) had a size of 100 nm and a purity level of analytical purity.
Before the experiment, a detergent was used to remove the oil stains on the surface of the sample. Then, 800 grit, 1200 grit, 1500 grit, and 2000 grit sandpaper was used to polish and remove the fatigue layer and oxide layer on the surface of the sample. After polishing and grinding the sample, it was cleaned in an ultrasonic bath for two minutes, and then blow-dried for later use. Before processing, the BN nanoparticles were covered on the surface of the copper using a preset method. After processing, the sample was cleaned in an ultrasonic bath for 5 min to remove any loosely bonded BN nanoparticles from the surface.

2.2. Experimenl and Characterization

The surface of the sample was remelted using laser melting equipment (TY-LFS-500 model, Tianzhiyi Co., Ltd., Wuhan, China). During processing, the laser frequencies were set to 5 Hz, 10 Hz, and 15 Hz, respectively. The laser pulse width parameters were set to 7.5 ms, 10 ms, 12.5 ms, and 15 ms. The laser energy densities were set to 99.52 J/mm2, 132.69 J/mm2, 165.87 J/mm2, and 199.04 J/mm2. The schematic diagram of laser remelting processing is shown in Figure 1 [4]. The surface morphology was obtained by a scanning electron microscope (SEM, S4800, Hitachi, Tokyo Metropolitan, Japan). The crystal phase structure of the Cu/BN remelted layer was analyzed using an X-ray diffractometer (XRD, SmartLab 9000, Rigaku Corporation, Tokyo Metropolitan, Japan). The X-ray emission voltage was 40 kV and the emission current was 30 mA. The scanning angle was between 10° and 90°, with a scanning speed of 20 °/min. The microhardness of the sample was measured using a microhardness tester (HVS-1000Z type, Shanghai Optical Instrument Fifth Factory Co., Ltd., Shanghai, China). The test load was 9.8 N and the loading time was 15 s. Five points were randomly selected on the surface of the sample and the average of the test results was recorded as the microhardness value. A friction and wear tester (HSR-2M, Lanzhou Zhongke Kaihua Technology Development Co., Ltd., Lanzhou, China) was used to test the wear resistance of the remelted surface. The test load was 100 g, the test stroke was 5 mm, the work frequency was 500 times per minute, and the test duration was 5 min.

3. Discussion and Analysis

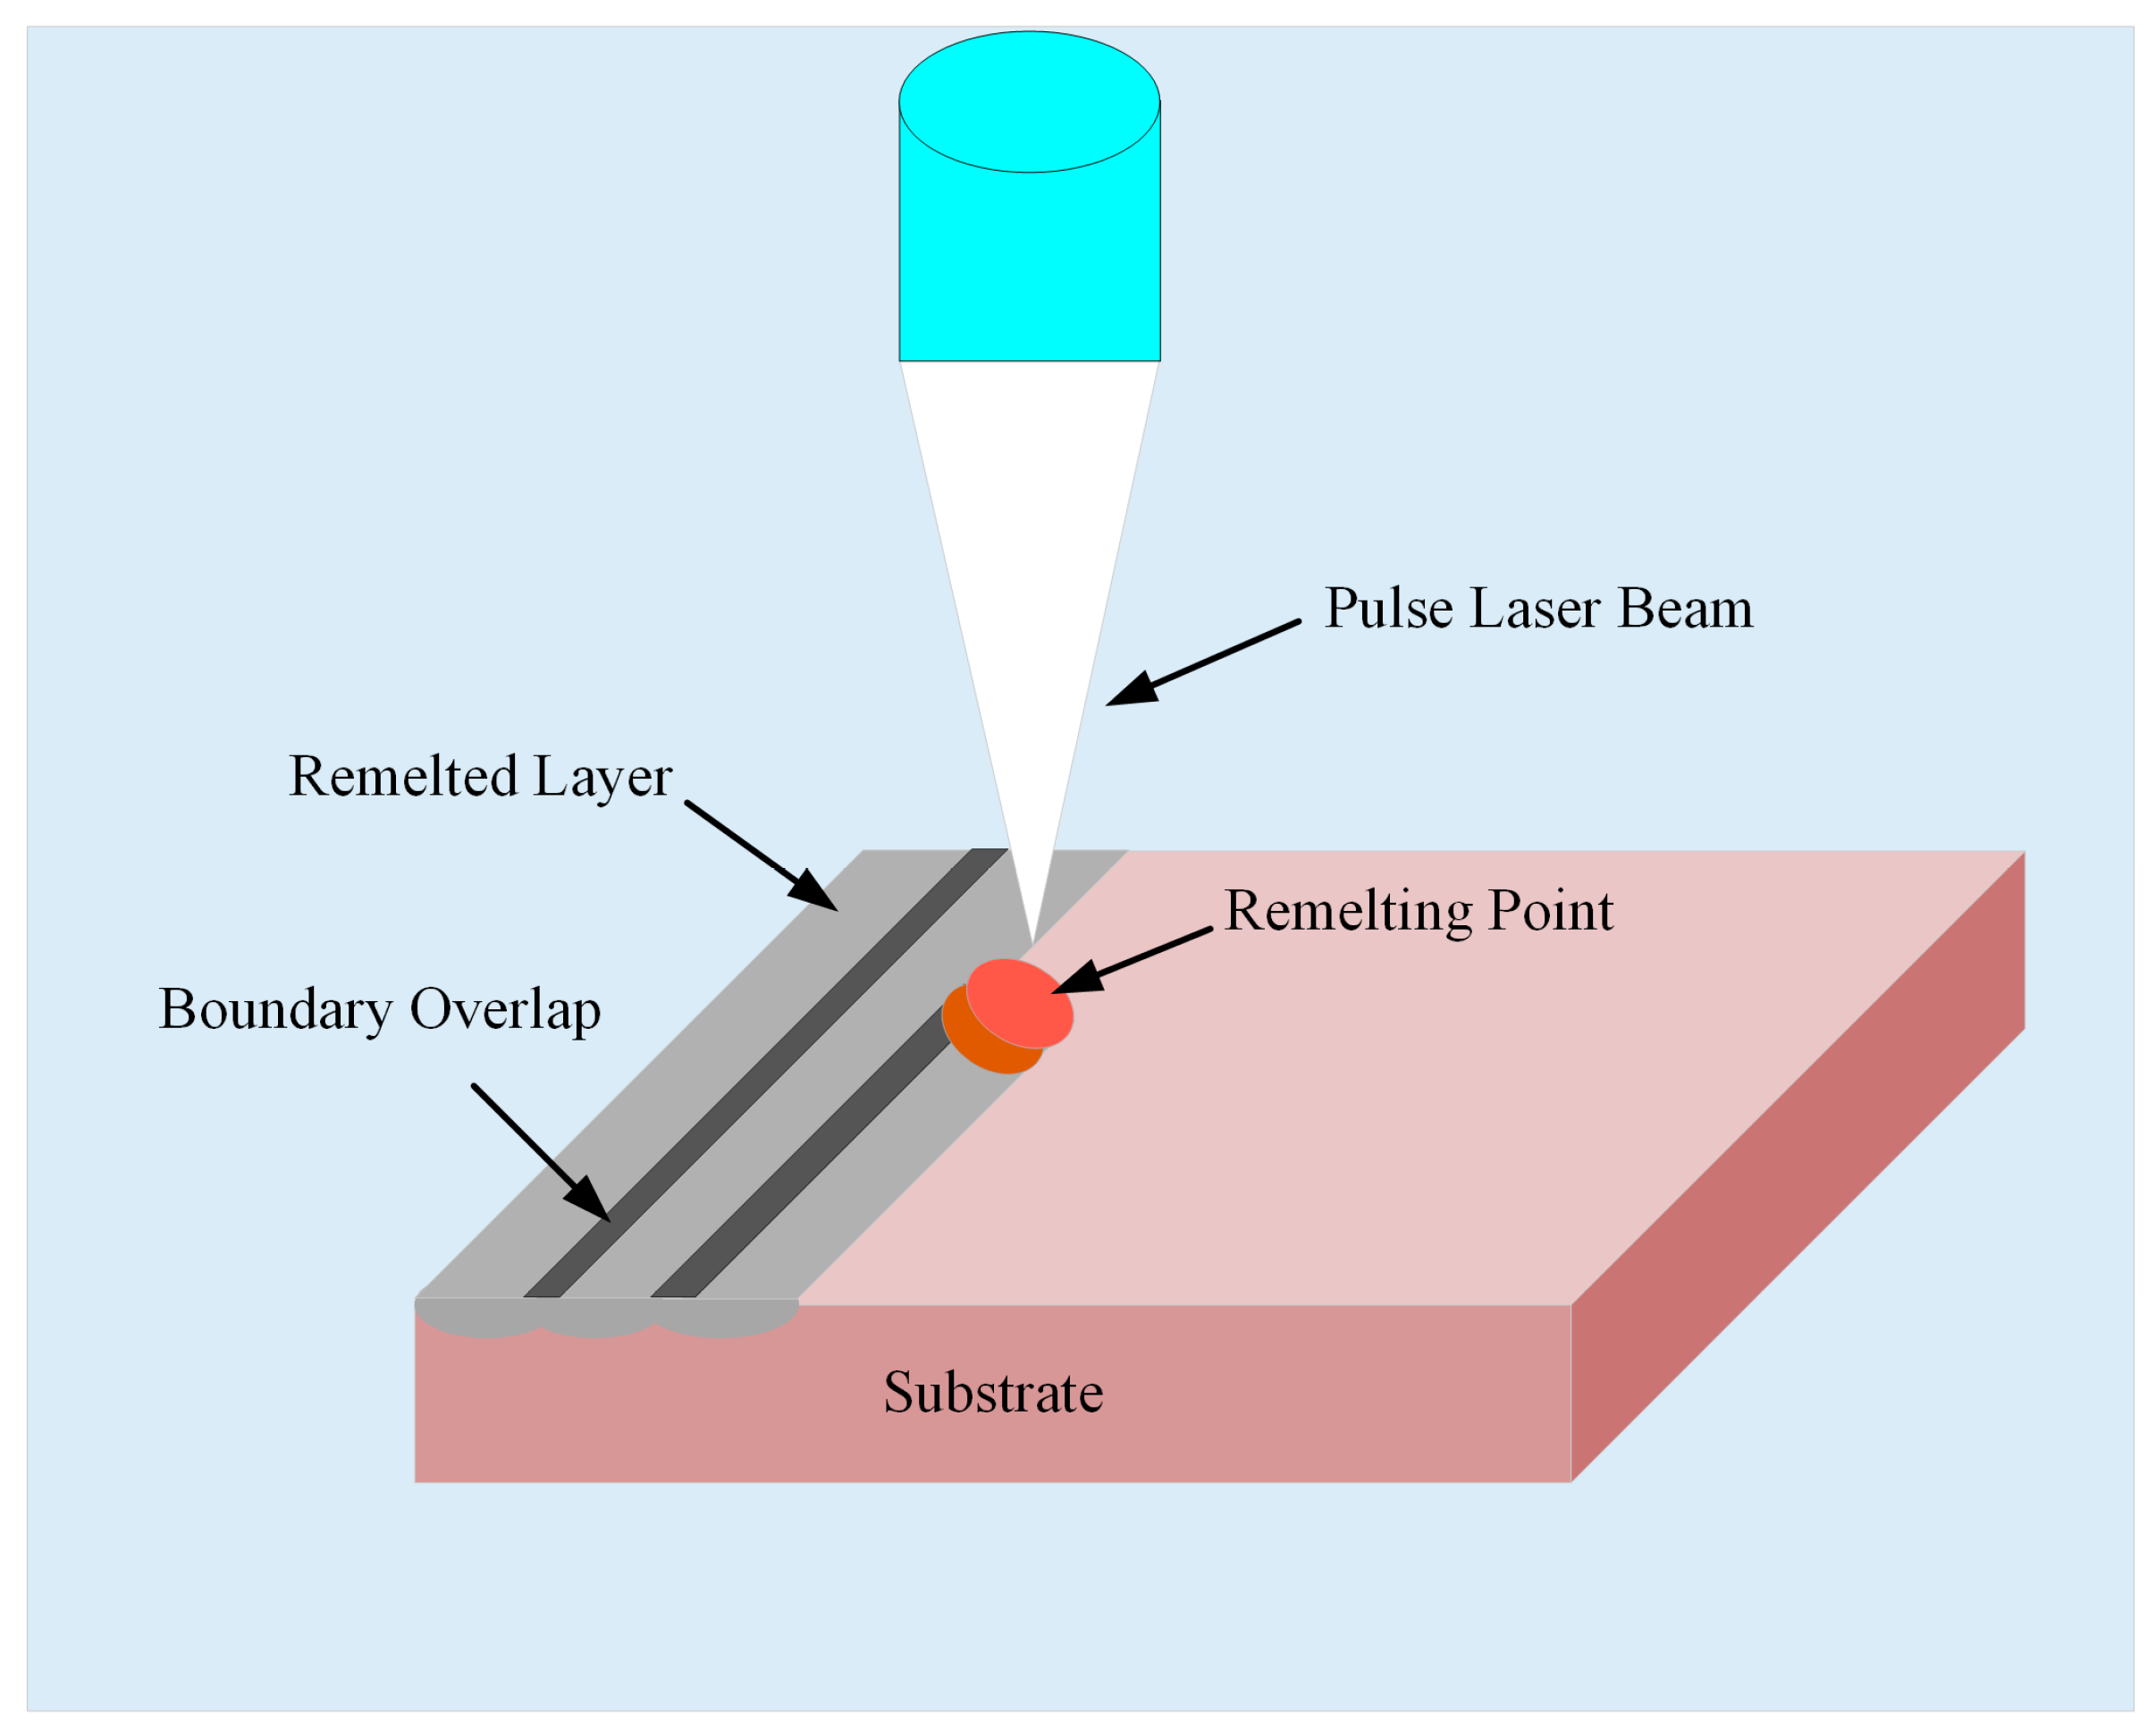
3.1. The Effects of Laser Parameters on Morphology of Samples

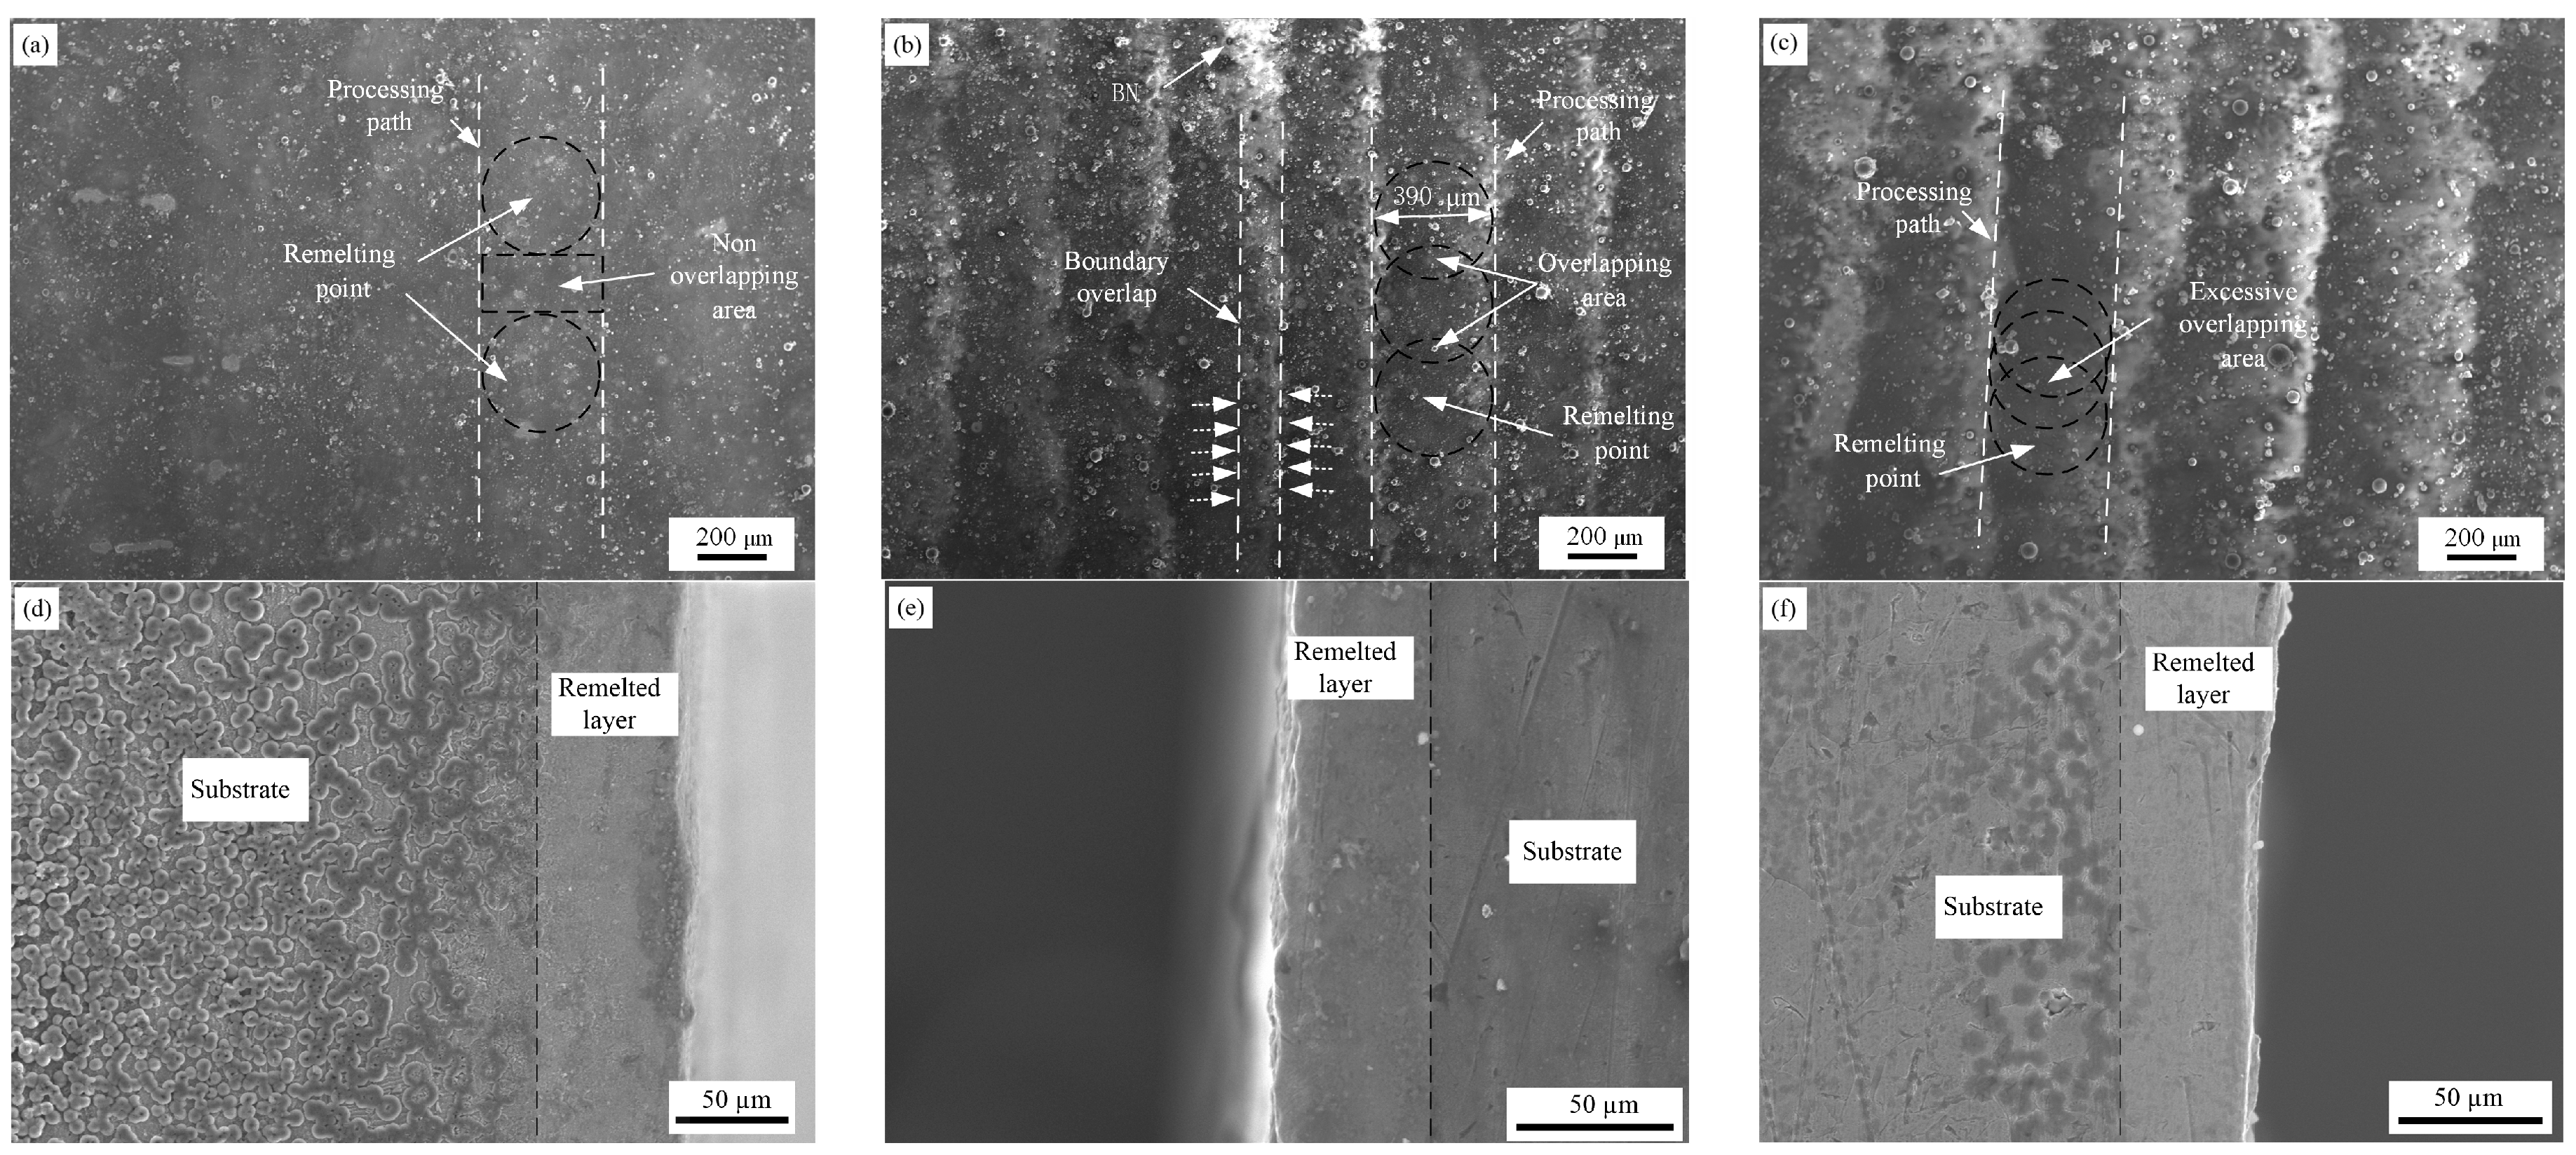
3.1.1. The Effects of Laser Frequency on Morphology

The laser energy density was set to 165.87 J/mm2 and the pulse width to 10 ms, and the laser frequency changed separately. Figure 2 shows surface and cross-section SEM images at different laser frequencies. As shown in Figure 2a, when the laser frequency is 5 Hz, the overall surface of the sample is relatively flat and there are slight strip processing marks. The distribution of BN nanoparticles on the surface is relatively uniform and there is no obvious agglomeration phenomenon. As the laser frequency increases (Figure 2b,c), a clear furrow-like structure appears on the surface. The composite amount of BN nanoparticles significantly increased and a slight agglomeration phenomenon occurred. The main reason for this phenomenon is that when the pulse frequency is 5 Hz, the density of the remelting points is small and the distribution is sparse, and adjacent points cannot be overlapped, resulting in a large blank area on the surface. Increasing the laser frequency can increase the density of the remelting points. The overlap between remelting points resulted in the appearance of furrow-like structures. As shown in the Figure 2d,f, there are slight pits on the cross-section of the sample, which are caused by material flow at the remelted point. Due to the effects of material thermal conductivity, there is no clear boundary between the remelted layer and the sample substrate.

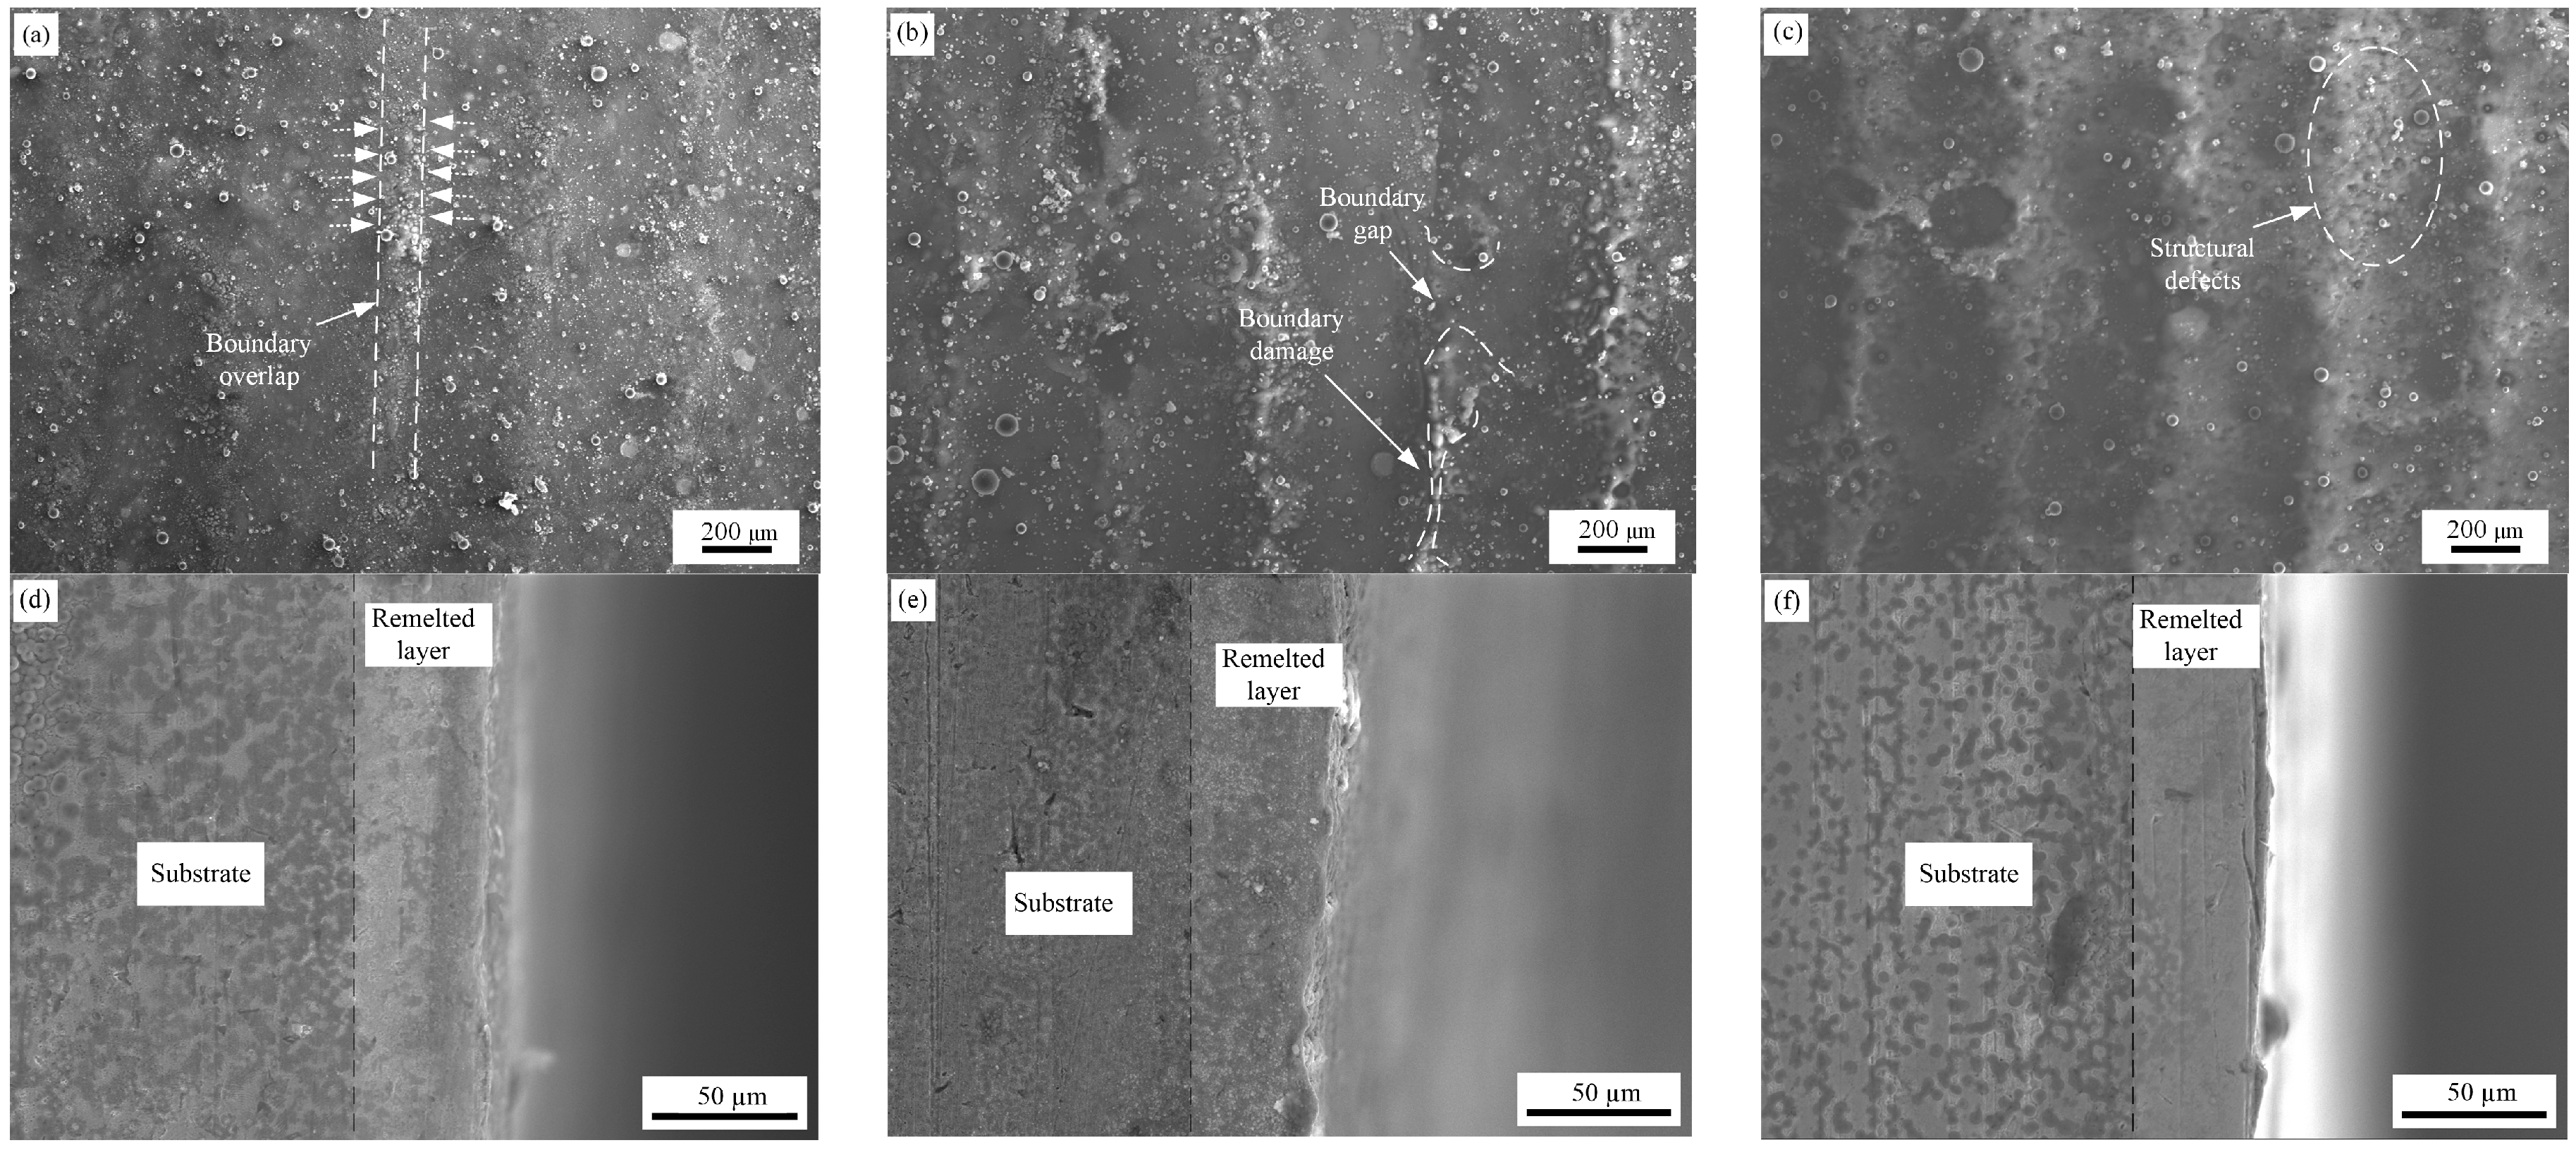
3.1.2. The Effects of Laser Pulse Width on Morphology

Figure 3 shows the SEM images of surface and cross-sectional with different laser pulse widths at a laser energy density of 165.87 J/mm2 and a laser frequency of 10 Hz. As shown in Figure 3a, when the pulse width is 7.5 ms, there are slight furrow-like machining marks on the sample surface, and a small amount of BN nanoparticles are distributed. When the pulse width is 10 ms (Figure 3b), a clear furrow-like structure appears on the surface. As the pulse width further increases (Figure 3c), the width of the furrow-like structure significantly increases, and the boundaries of the furrow-like structure gradually become blurred. Except in Figure 3b, there was no obvious accumulation of BN nanoparticles in the other samples.
The main reason for this phenomenon may be that as the laser pulse width increases, the duration of laser action on the remelting point also gradually increases. When the laser pulse width is small, a shorter laser action time will lead to a smaller amount of material melting, resulting in a smoother surface and less BN nanoparticle composite. As the laser pulse width increases, excessive energy input can cause severe material gasification and splashing on the sample surface, increasing the appearance of furrow-like processing marks. During processing, material splashes will take the nanoparticles away from the surface, so there is no obvious agglomeration of BN nanoparticles on the sample surface.

3.1.3. The Effects of Laser Energy Density on Morphology

Keep the laser pulse width at 10 ms and the frequency at 10 Hz, and change the laser energy density separately. Figure 4 shows the SEM images of surface and cross-sectional with different laser energy densities. When the laser energy density is 99.52 J/mm2 (Figure 4a), a small amount of BN nanoparticles is remelted on the surface of the sample and the surface is relatively flat, without obvious furrow-like structures. As the laser energy density gradually increases (Figure 4b,c), the furrow-like structure on the surface gradually becomes apparent, and the plow width gradually increases. The BN nanoparticles on the surface exhibit the agglomeration phenomenon, which gradually deteriorates with the increase in energy density.
This phenomenon is caused by the effects of laser intensity on the molten pool. When the energy density is low, the laser energy density is not sufficient to produce a large amount of molten copper, so the surface is relatively flat, and BN nanoparticles are mostly doped in the outermost layer. As the laser energy density increases, the size and depth of the molten pool also gradually increase, resulting in a more pronounced furrow-like structure.
Under the impact of the laser, the molten material in the melt pool will flow outwards, and some BN nanoparticles will also flow towards the edge of the remelting point, along with the molten material. When the remelting points overlap along the direction of the laser feed, the BN nanoparticles in that direction will be doped into the remelting points again. Meanwhile, the BN nanoparticles in other positions will stack on both sides of the feed direction, resulting in an aggregation of BN nanoparticles at the edge of the furrow-like structures.

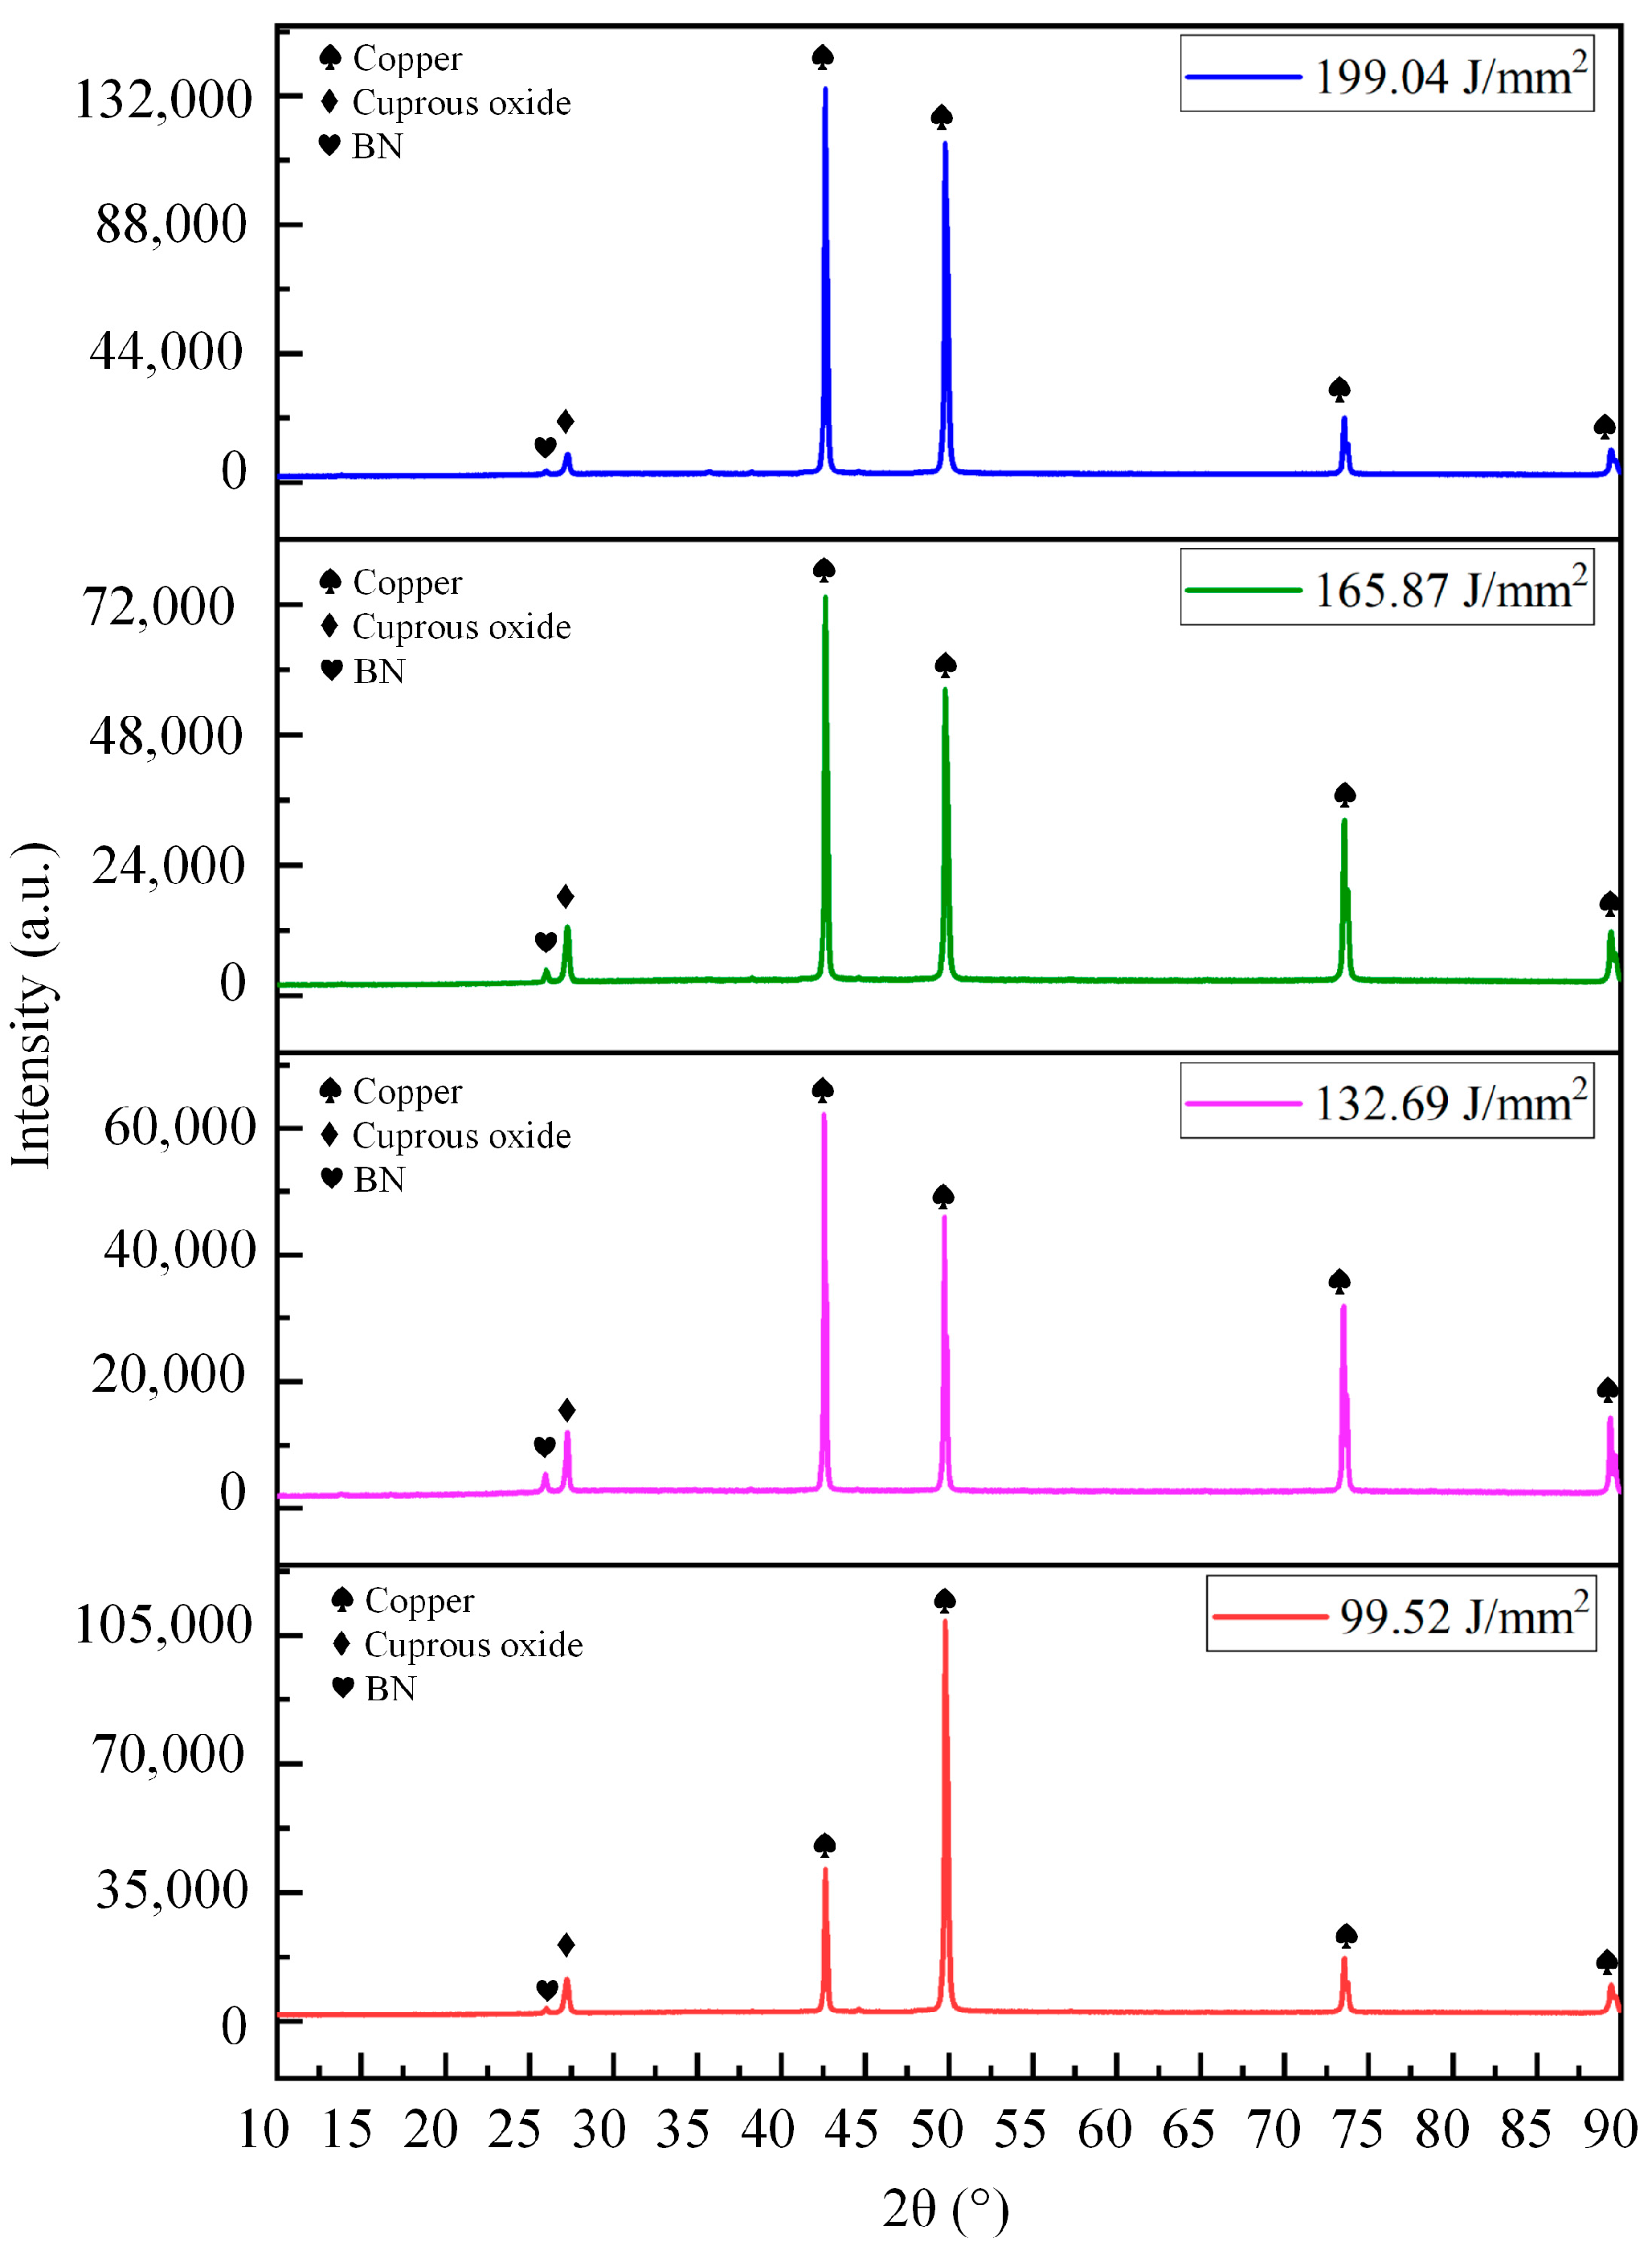
3.2. The Effects of Laser Parameters on Crystal Phase Structure of Samples

3.2.1. The Effects of Laser Frequency on Crystal Phase Structure

Figure 5 shows the XRDpatterns of the samples with different laser frequencies. From the figure, it can be seen that there are four main diffraction peaks in the samples before laser treatment, corresponding to the crystal planes (111), (200), (220), and (311), respectively. The sample in the figure exhibits different levels of preferred orientation in the (111) and (200) planes. This may be due to the effects of rolling and other processes during production, as the tested sample is a block material. After laser treatment, the sample exhibited a smaller intensity diffraction peak near the diffraction angle of 27°, and the intensity of the diffraction peak increased with the increase in pulse frequency. After comparing the XRD standard diffraction data, the diffraction peak matches well with the spectral characteristics of cuprous oxide, indicating that the sample surface after laser processing has generated cuprous oxide. This is due to the reaction between the sample surface and the oxygen in the air under the action of the laser. The diffraction intensity of cuprous oxide in the Figure increases with the increase in laser frequency. This is because as the frequency increases, the number of reactions between the sample surface and the oxygen in the air also increases, resulting in an increase in the amount of cuprous oxide produced.
From the figure, it can also be seen that the samples with laser frequencies of 10 Hz and 15 Hz have a smaller diffraction peak near the diffraction angle of 26°. After comparison, the diffraction peak is the main diffraction peak of BN nanoparticles, corresponding to the crystal plane of (003). This result indicates that BN nanoparticles are well incorporated into the surface of the sample. However, the sample with a laser frequency of 5 Hz did not show a significant BN nanoparticle diffraction peak. Combined with its surface morphology analysis, it can be concluded that this is due to the relatively low amount of composite on the sample surface.

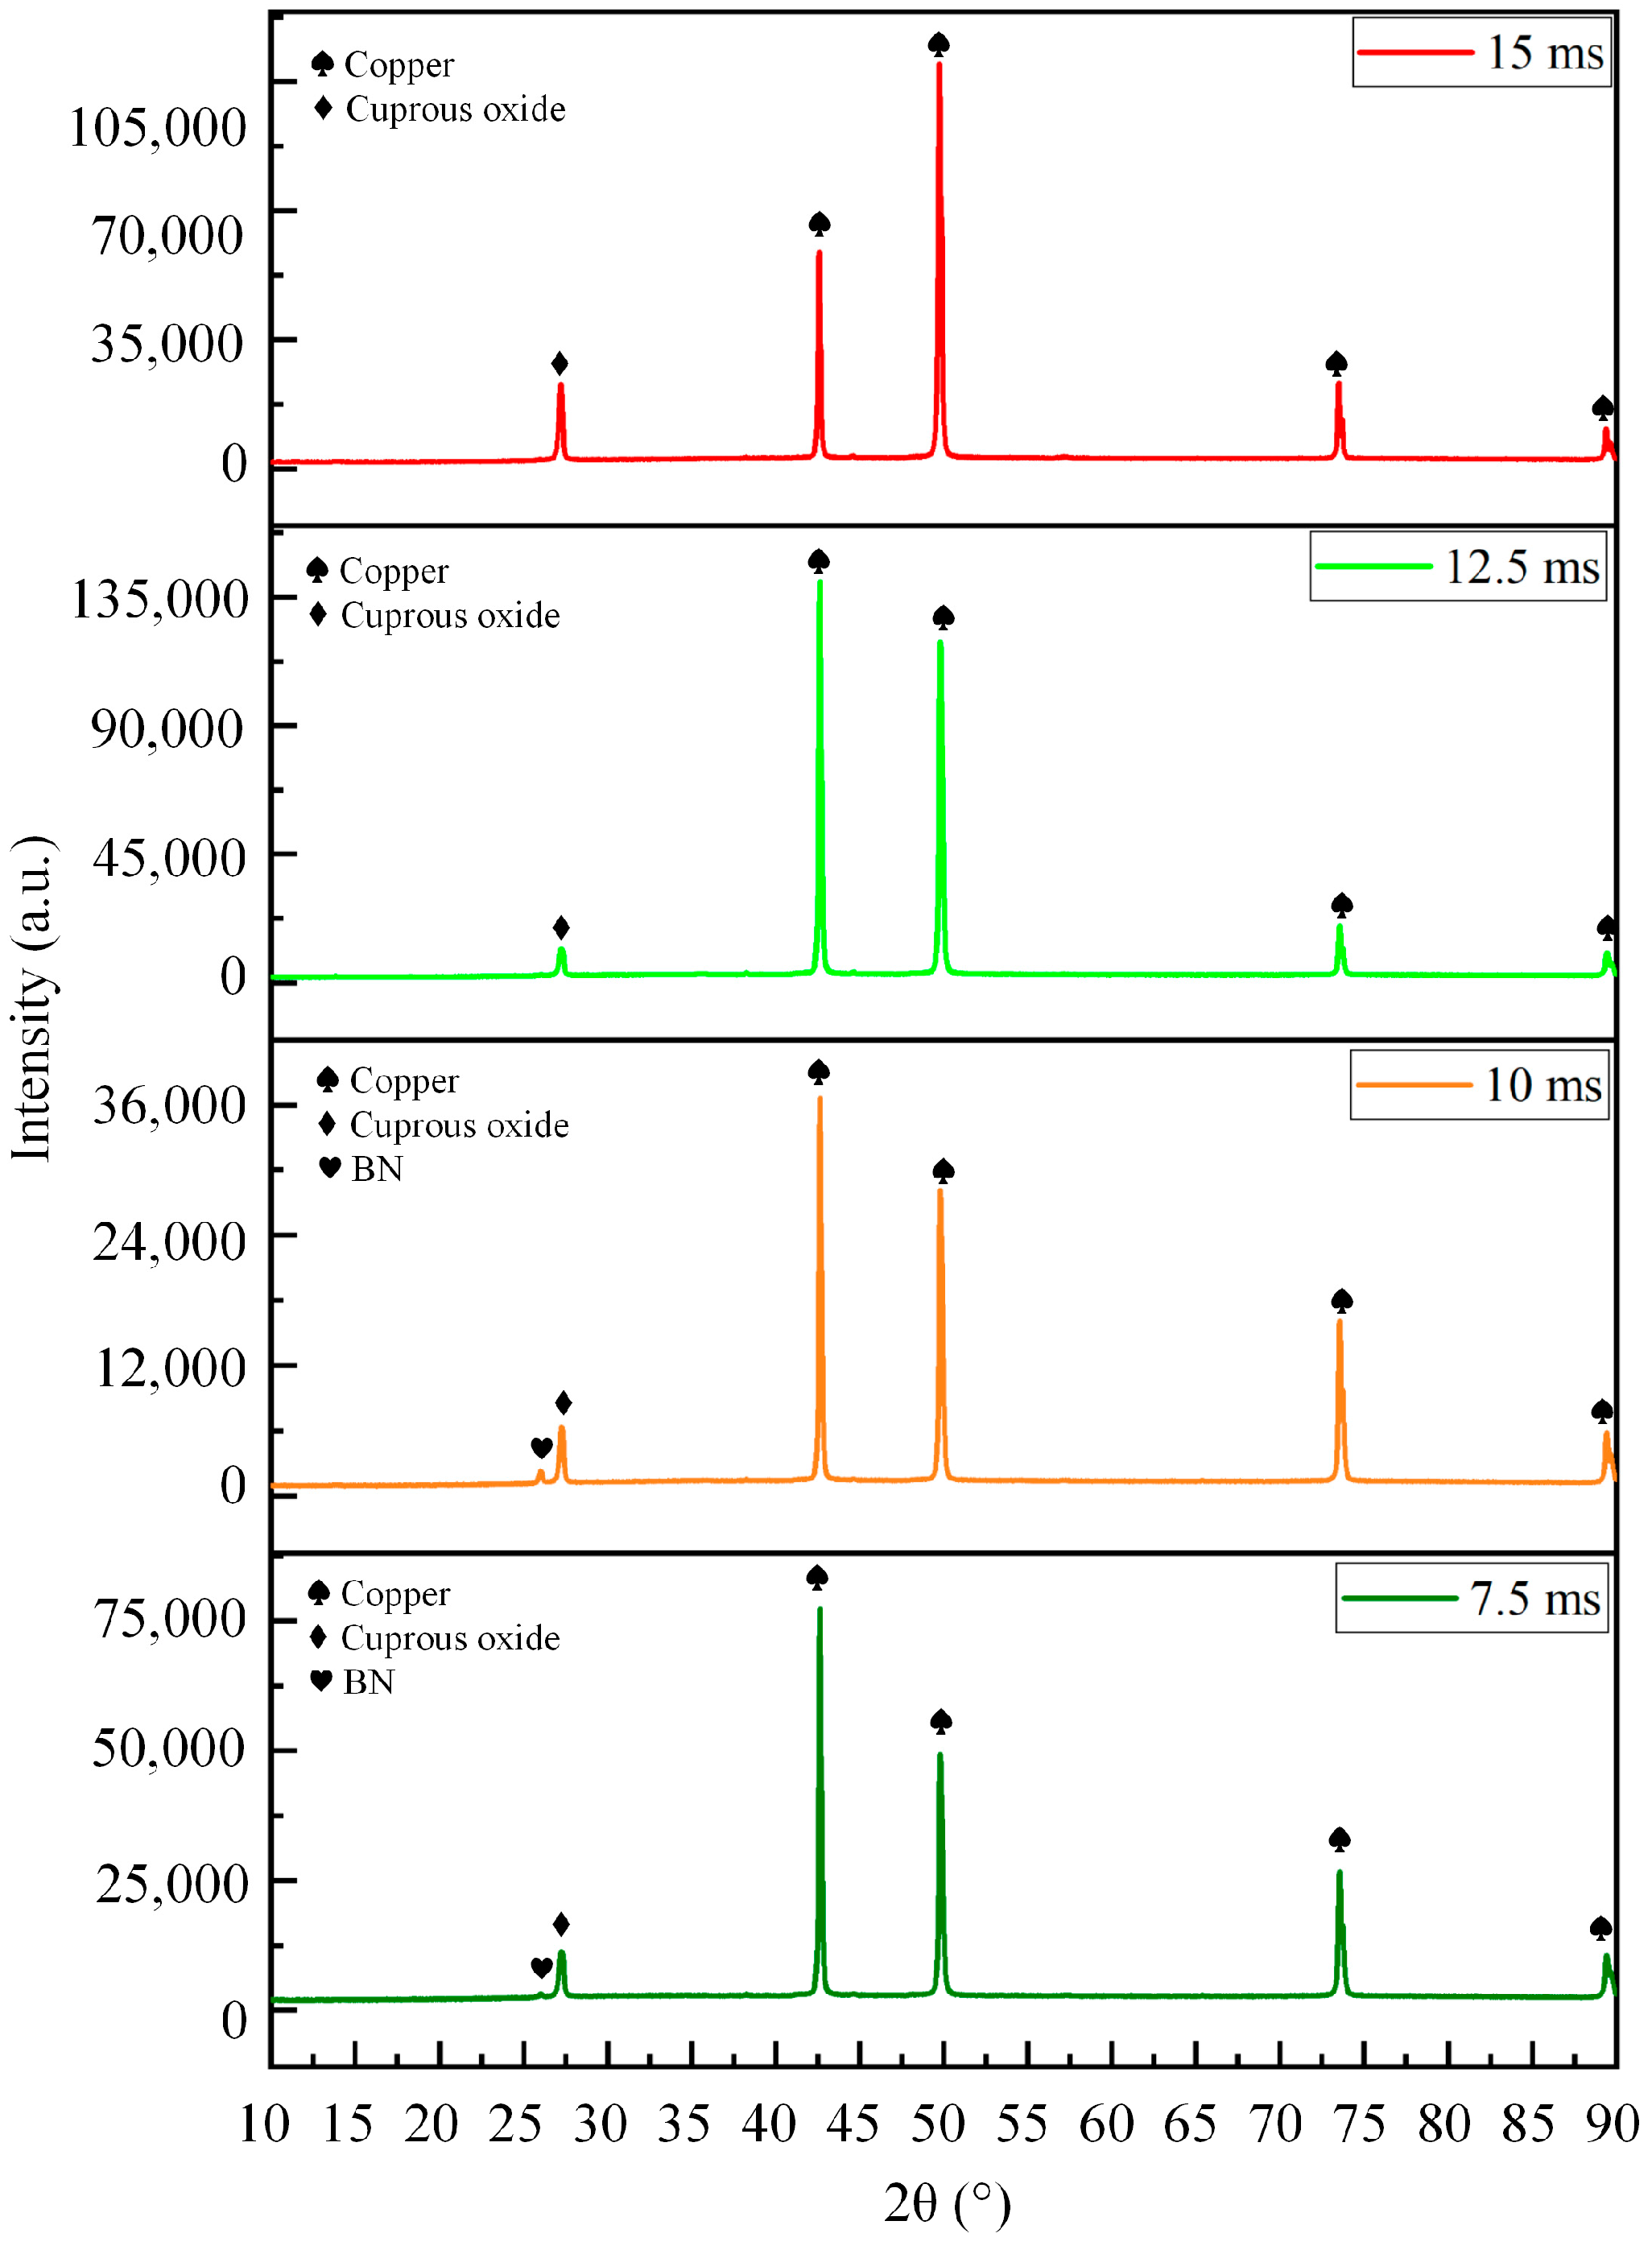
3.2.2. The Effects of Laser Pulse Width on Crystal Phase Structure

Figure 6 shows the XRD patterns in the samples at different laser pulse widths. Different samples in the Figure exhibit different levels of preferred orientation in both (111) and (200). All samples exhibited smaller diffraction peaks in cuprous oxide near the diffraction angle of 27°, which increased with the increase in pulse width. Its maximum diffraction intensity value is close to 34,000. The reason for the change in diffraction intensity in the cuprous oxide is that increasing the laser pulse width can prolong the reaction time between the sample surface and the oxygen in the air. The amount of cuprous oxide generated on the surface of the sample increases, resulting in an increase in diffraction intensity.
The samples with laser pulse widths of 7.5 ms and 10 ms in the figure generated smaller BN nanoparticle diffraction peaks near 26°, indicating that the BN nanoparticle composite with the sample surface is better under those parameters. However, there was no obvious BN nanoparticle diffraction peak in the diffraction patterns of the samples with pulse widths of 12.5 ms and 15 ms. Based on their surface morphology, it can be inferred that this is due to the relatively low amount of BN nanoparticle composite on the sample surfaces.

3.2.3. The Effects of Laser Energy Density on Crystal Phase Structure

Figure 7 shows the XRD patterns in the samples with different energy densities. Similar to Figure 5 and Figure 6, the samples have different levels of preferred orientation in the (111) and (200) under different energy densities. All samples in the figure exhibit diffraction peaks of cuprous oxide, and their diffraction intensity shows a trend of parabolic variation with the increase in laser energy density. This may be because as the laser energy density increases, a larger laser threshold can accelerate the chemical reaction between the sample and oxygen in the air. When the laser energy density is too high, some cuprous oxide may peel off with the splashing of material on the surface, resulting in a slight decrease in its diffraction intensity.
Unlike Figure 5 and Figure 6, all samples exhibit diffraction peaks of BN nanoparticles, and their intensity shows a trend of increasing first and then decreasing. When the laser energy densities are 132.69 J/mm2 and 165.87 J/mm2, the diffraction peaks of BN nanoparticles in the sample are stronger. This test result indicates that when other parameters remain unchanged, BN nanoparticles can effectively composite with the surface of the sample within this laser energy density range. The variation in diffraction intensity of nanoparticles in the sample may be due to the lower laser energy density and poor material flow in the melt when the energy density is 99.52, resulting in a lower amount of BN nanoparticles composite. When the laser energy density is 199.04, excessive laser energy density can cause serious material splashing in the melting pool. On one hand, the splashed material contains BN nanoparticles that have already been composite, and on the other hand, the splashed material will have an impact on the nanoparticles near the remelting point, leading to a decrease in the number of BN nanoparticles participating in the subsequent composite. Therefore, under this parameter, the diffraction intensity of BN nanoparticles decreased.

3.3. The Effects of Laser Parameters on Microhardness

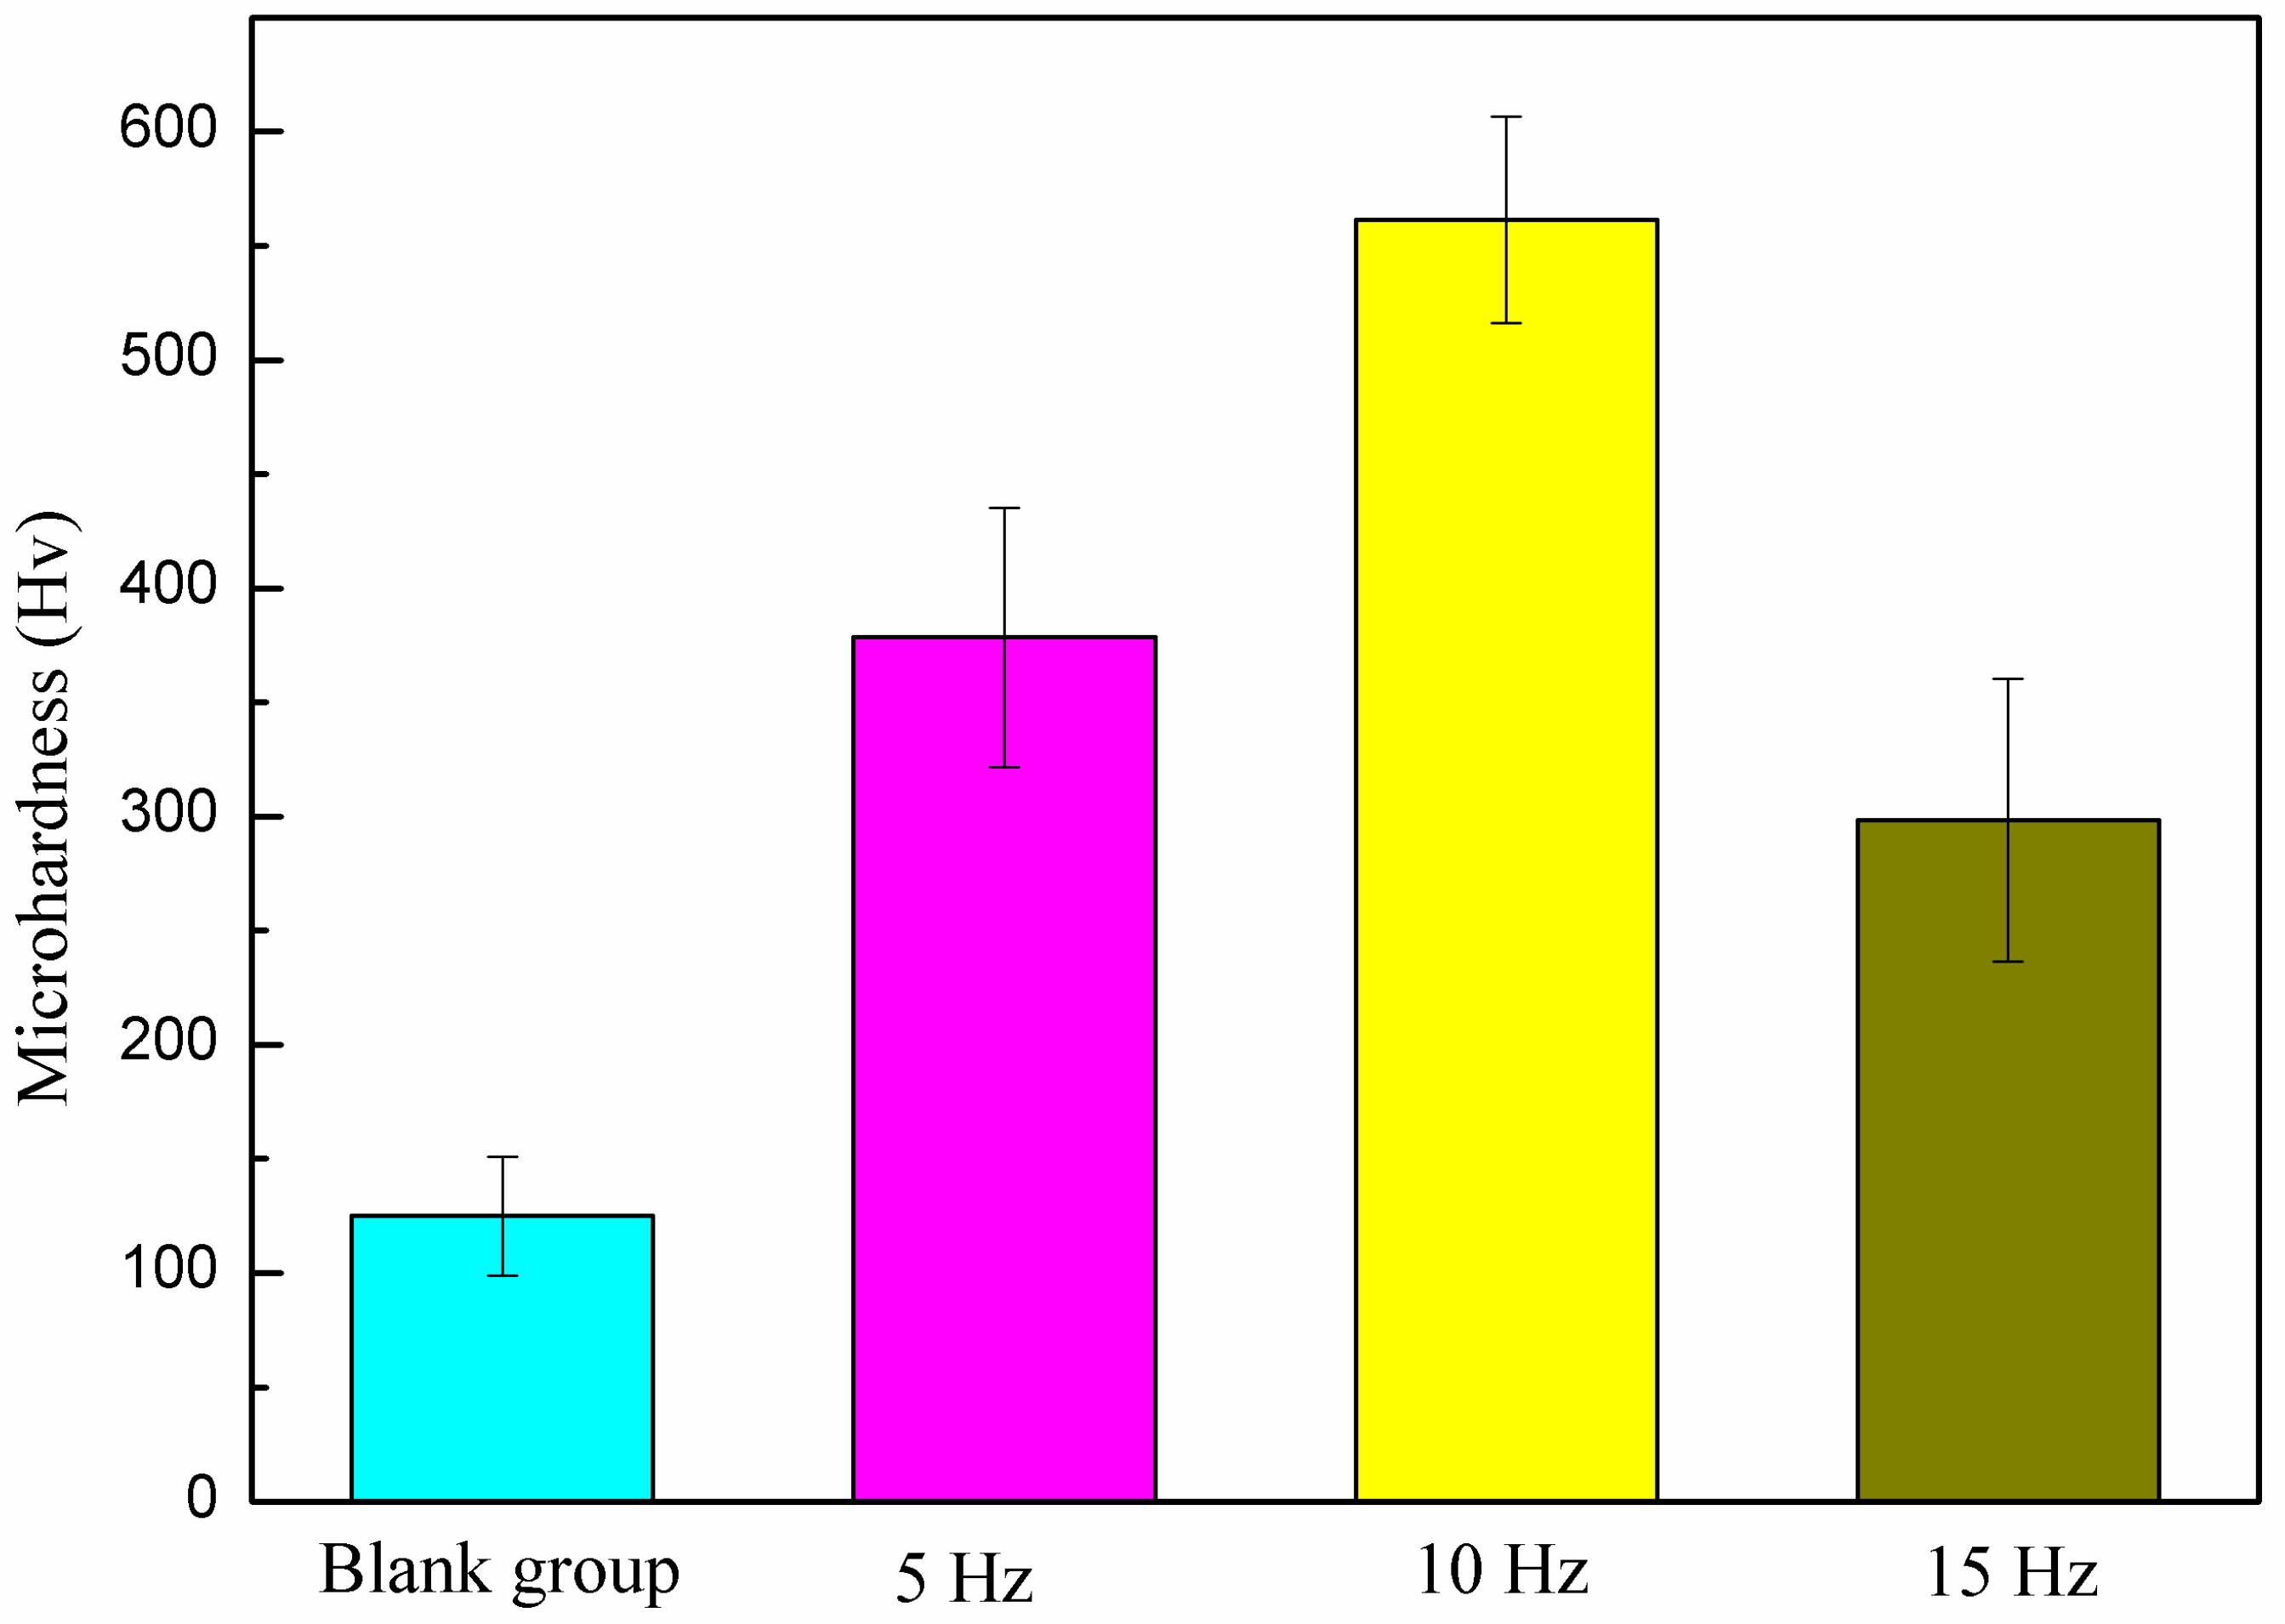
3.3.1. The Effects of Laser Frequency on Microhardness

Figure 8 shows the relationship between laser frequency and microhardness. The microhardness bar chart shows that the microhardness value of the blank sample is about 124.92 Hv. When the laser frequency is 5 Hz, 10 Hz, and 15 Hz, the corresponding microhardness value of the sample is 378.36 Hv, 561.38 Hv, and 298.34 Hv, respectively. After laser treatment, the microhardness of the sample increased significantly and showed a trend of parabolic variation. The above changes in the microhardness of the sample are mainly caused by changes in the integrity of the remelted layer and the composite amount of BN nanocomposite on the sample surface.
When the laser frequency is 5 Hz, although the microhardness of the sample has significantly improved at this time, the number of remelting points on the sample surface is small, and their distribution is sparse. At this point, the remelting points cannot be overlapped, and the remelted layer cannot completely cover the surface of the sample. On the other hand, sparse remelting points can lead to a decrease in the number of BN nanoparticles participating in the composite. Therefore, the microhardness of the sample under this parameter is relatively low. When the laser frequency increases to 10 Hz, the number of remelting points increases significantly, and the remelting points can be well overlapped, and the surface of the sample obtains a complete remelted layer. The complete coverage of the remelted layer can also increase the composite amount of BN nanoparticles, resulting in a significant improvement in microhardness. When the laser frequency is 15 Hz, a higher laser frequency can cause excessive overlap of the remelting points [29]. At this point, the unsealed molten pool will experience severe material splashing after multiple laser impacts. On the one hand, this increases the number of structural defects such as pores and slag inclusions in the remelted layer. On the other hand, material splashing can remove the already-composite BN nanoparticles and those that have not participated in remelting from the surface of the sample, resulting in a decrease in the composite amount of BN nanoparticles. Therefore, there is an obvious decrease in the microhardness value.

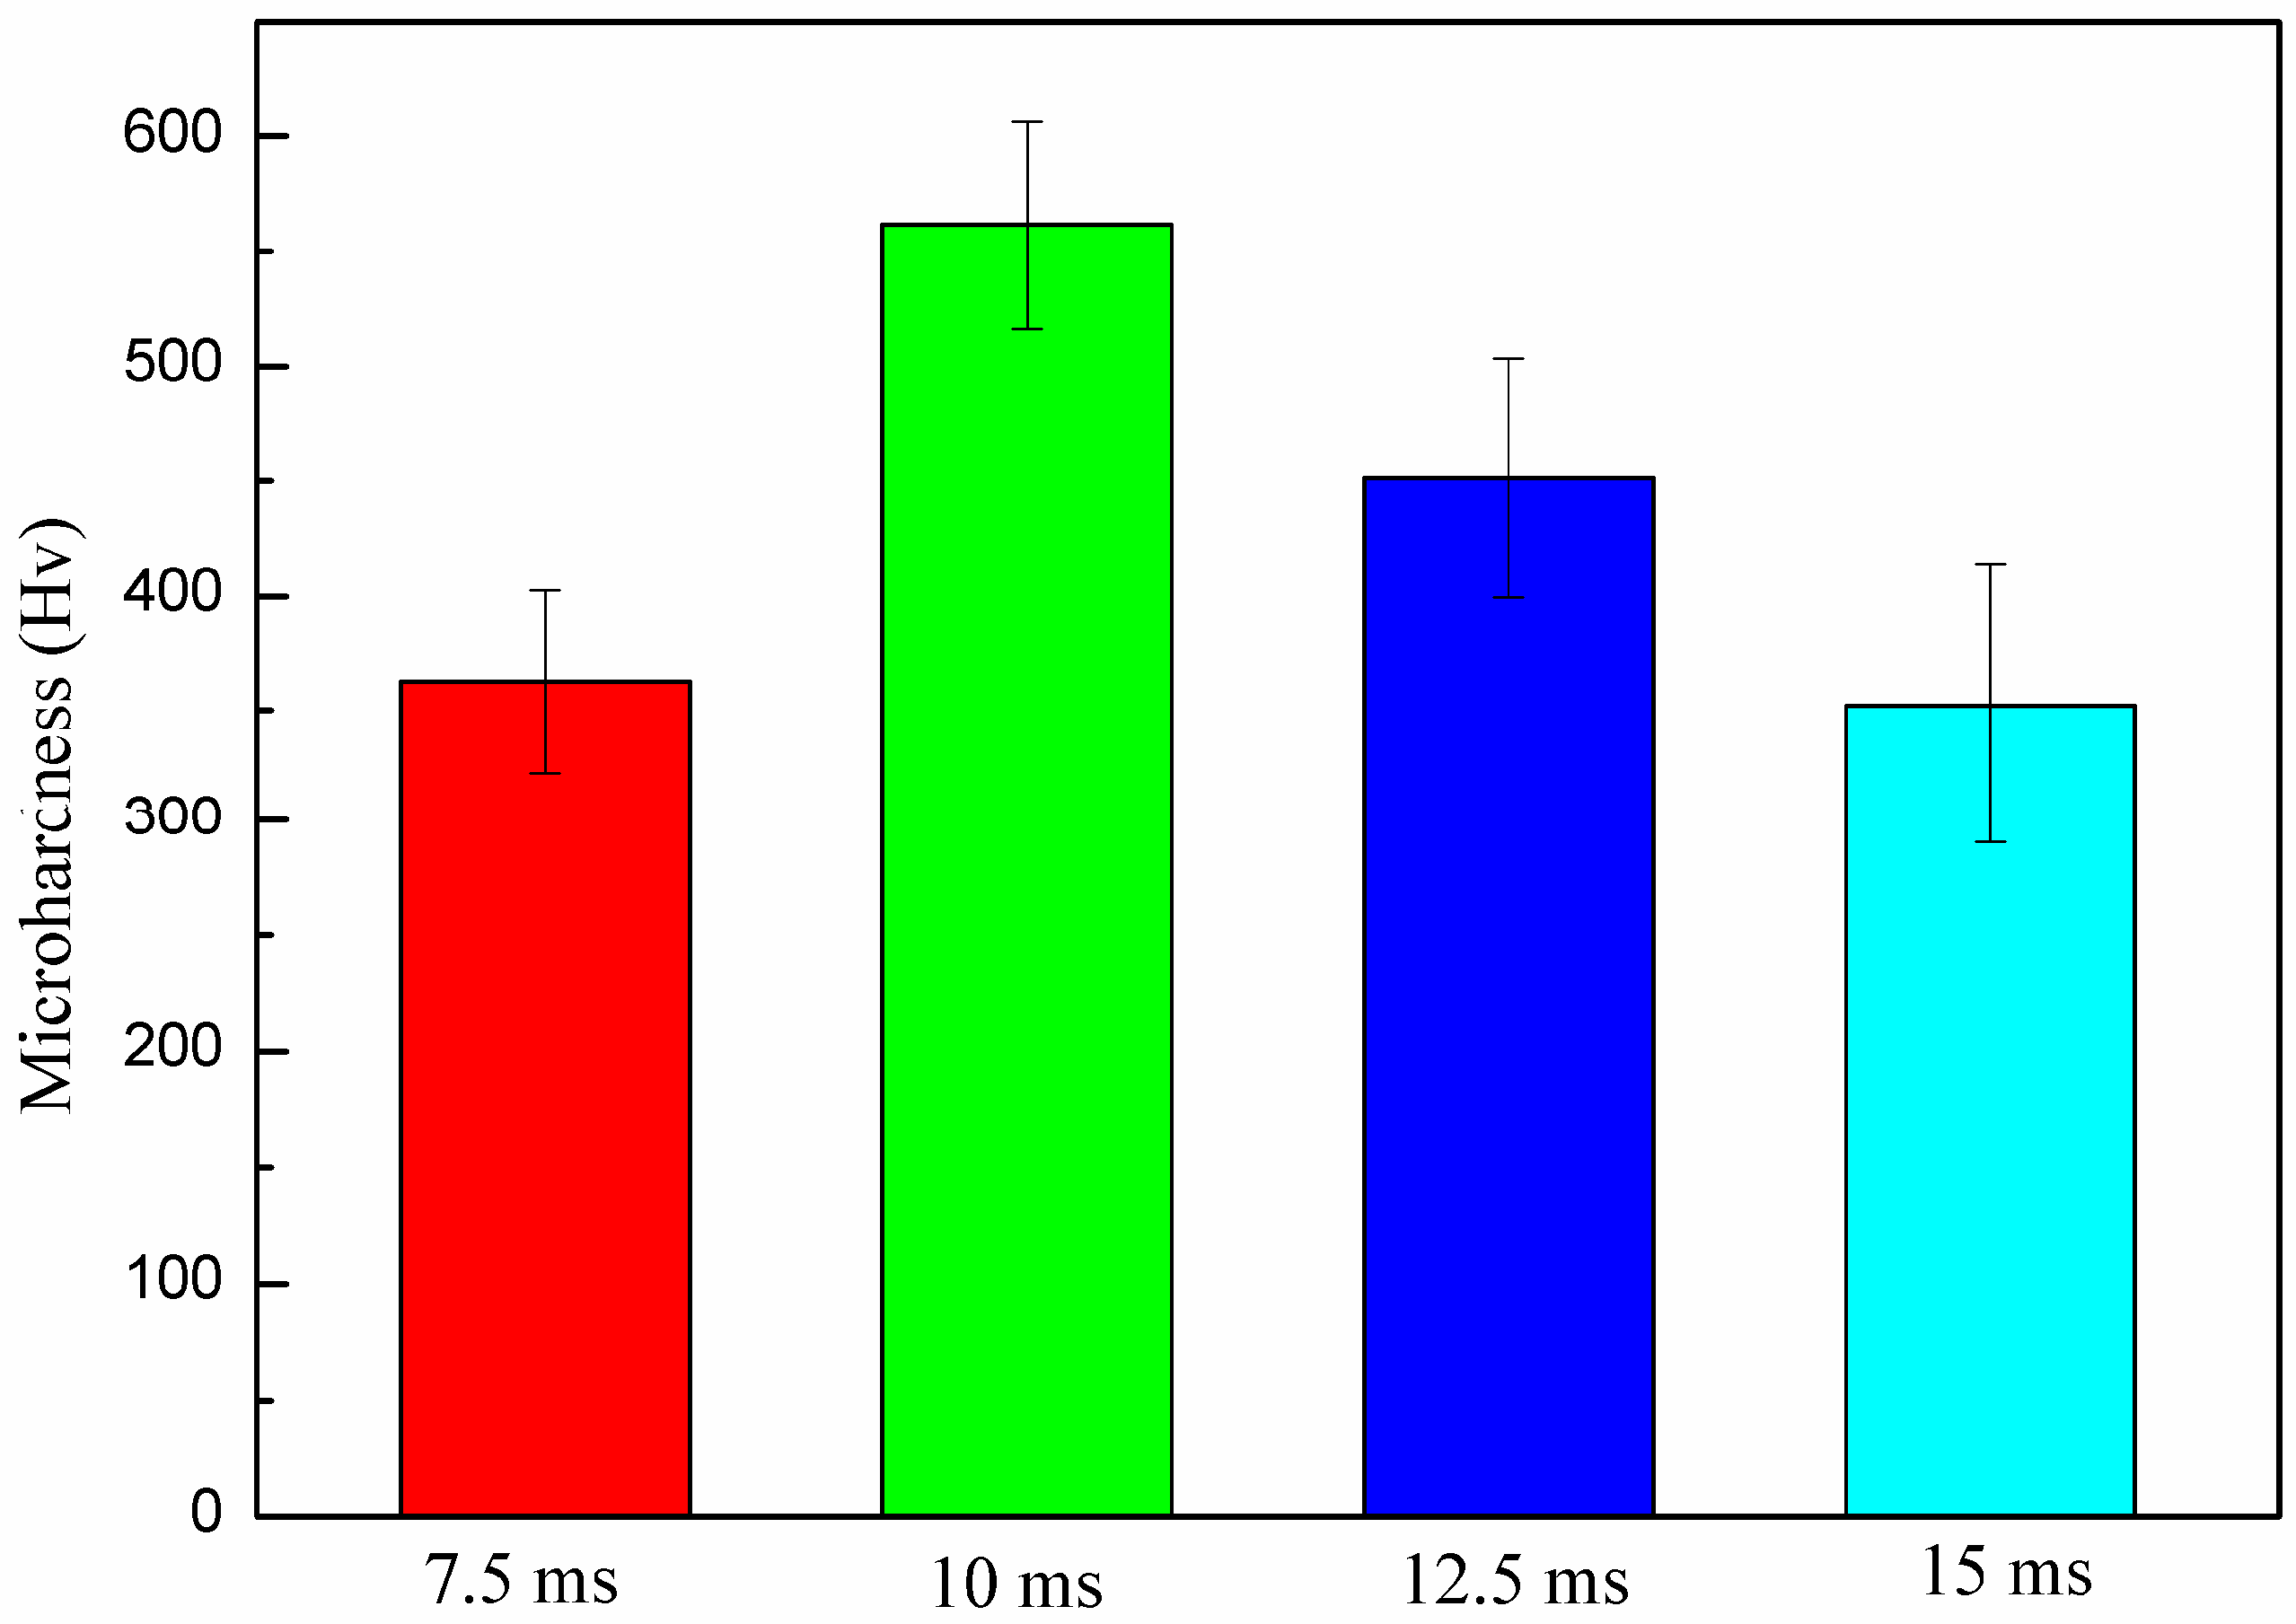
3.3.2. The Effects of Laser Pulse Width on Microhardness

Figure 9 shows the relationship between laser pulse width and microhardness. The Figure indicates that as the laser pulse width increases, the value of microhardness shows a trend of parabolic variation. When the laser pulse width is 7.5 ms, 10 ms, 12.5 ms, and 15 ms, the microhardness value of the sample is 362.6 Hv, 561.38 Hv, 451.28 Hv, and 352.04 Hv, respectively. When the pulse width increased from 7.5 ms to 10 ms, the average microhardness value of the sample increased from 362.6 Hv to 561.38 Hv, and the microhardness of the sample quickly reached its maximum value. As the laser pulse width continues to increase, its microhardness value gradually decreases.
This phenomenon is mainly caused by the effects of the laser on the microstructure of the sample. The larger the laser pulse width, the longer the laser irradiation time, and the more energy accumulates at the remelting point. A reasonable laser pulse width can improve the fluidity of molten material in the melt pool. The improvement of material flowability is beneficial for the full composite of BN nanoparticles, resulting in a rapid increase in the microhardness of the sample. When the laser energy accumulates too much, the material will boil due to excessive melting, and serious vaporization and splashing phenomena will occur. On the one hand, this reduces the number of BN nanoparticles participating in the composite, and on the other hand, it increases the number of structural defects such as pores and slag inclusions in the remelted layer. Therefore, the microhardness of the sample decreased.

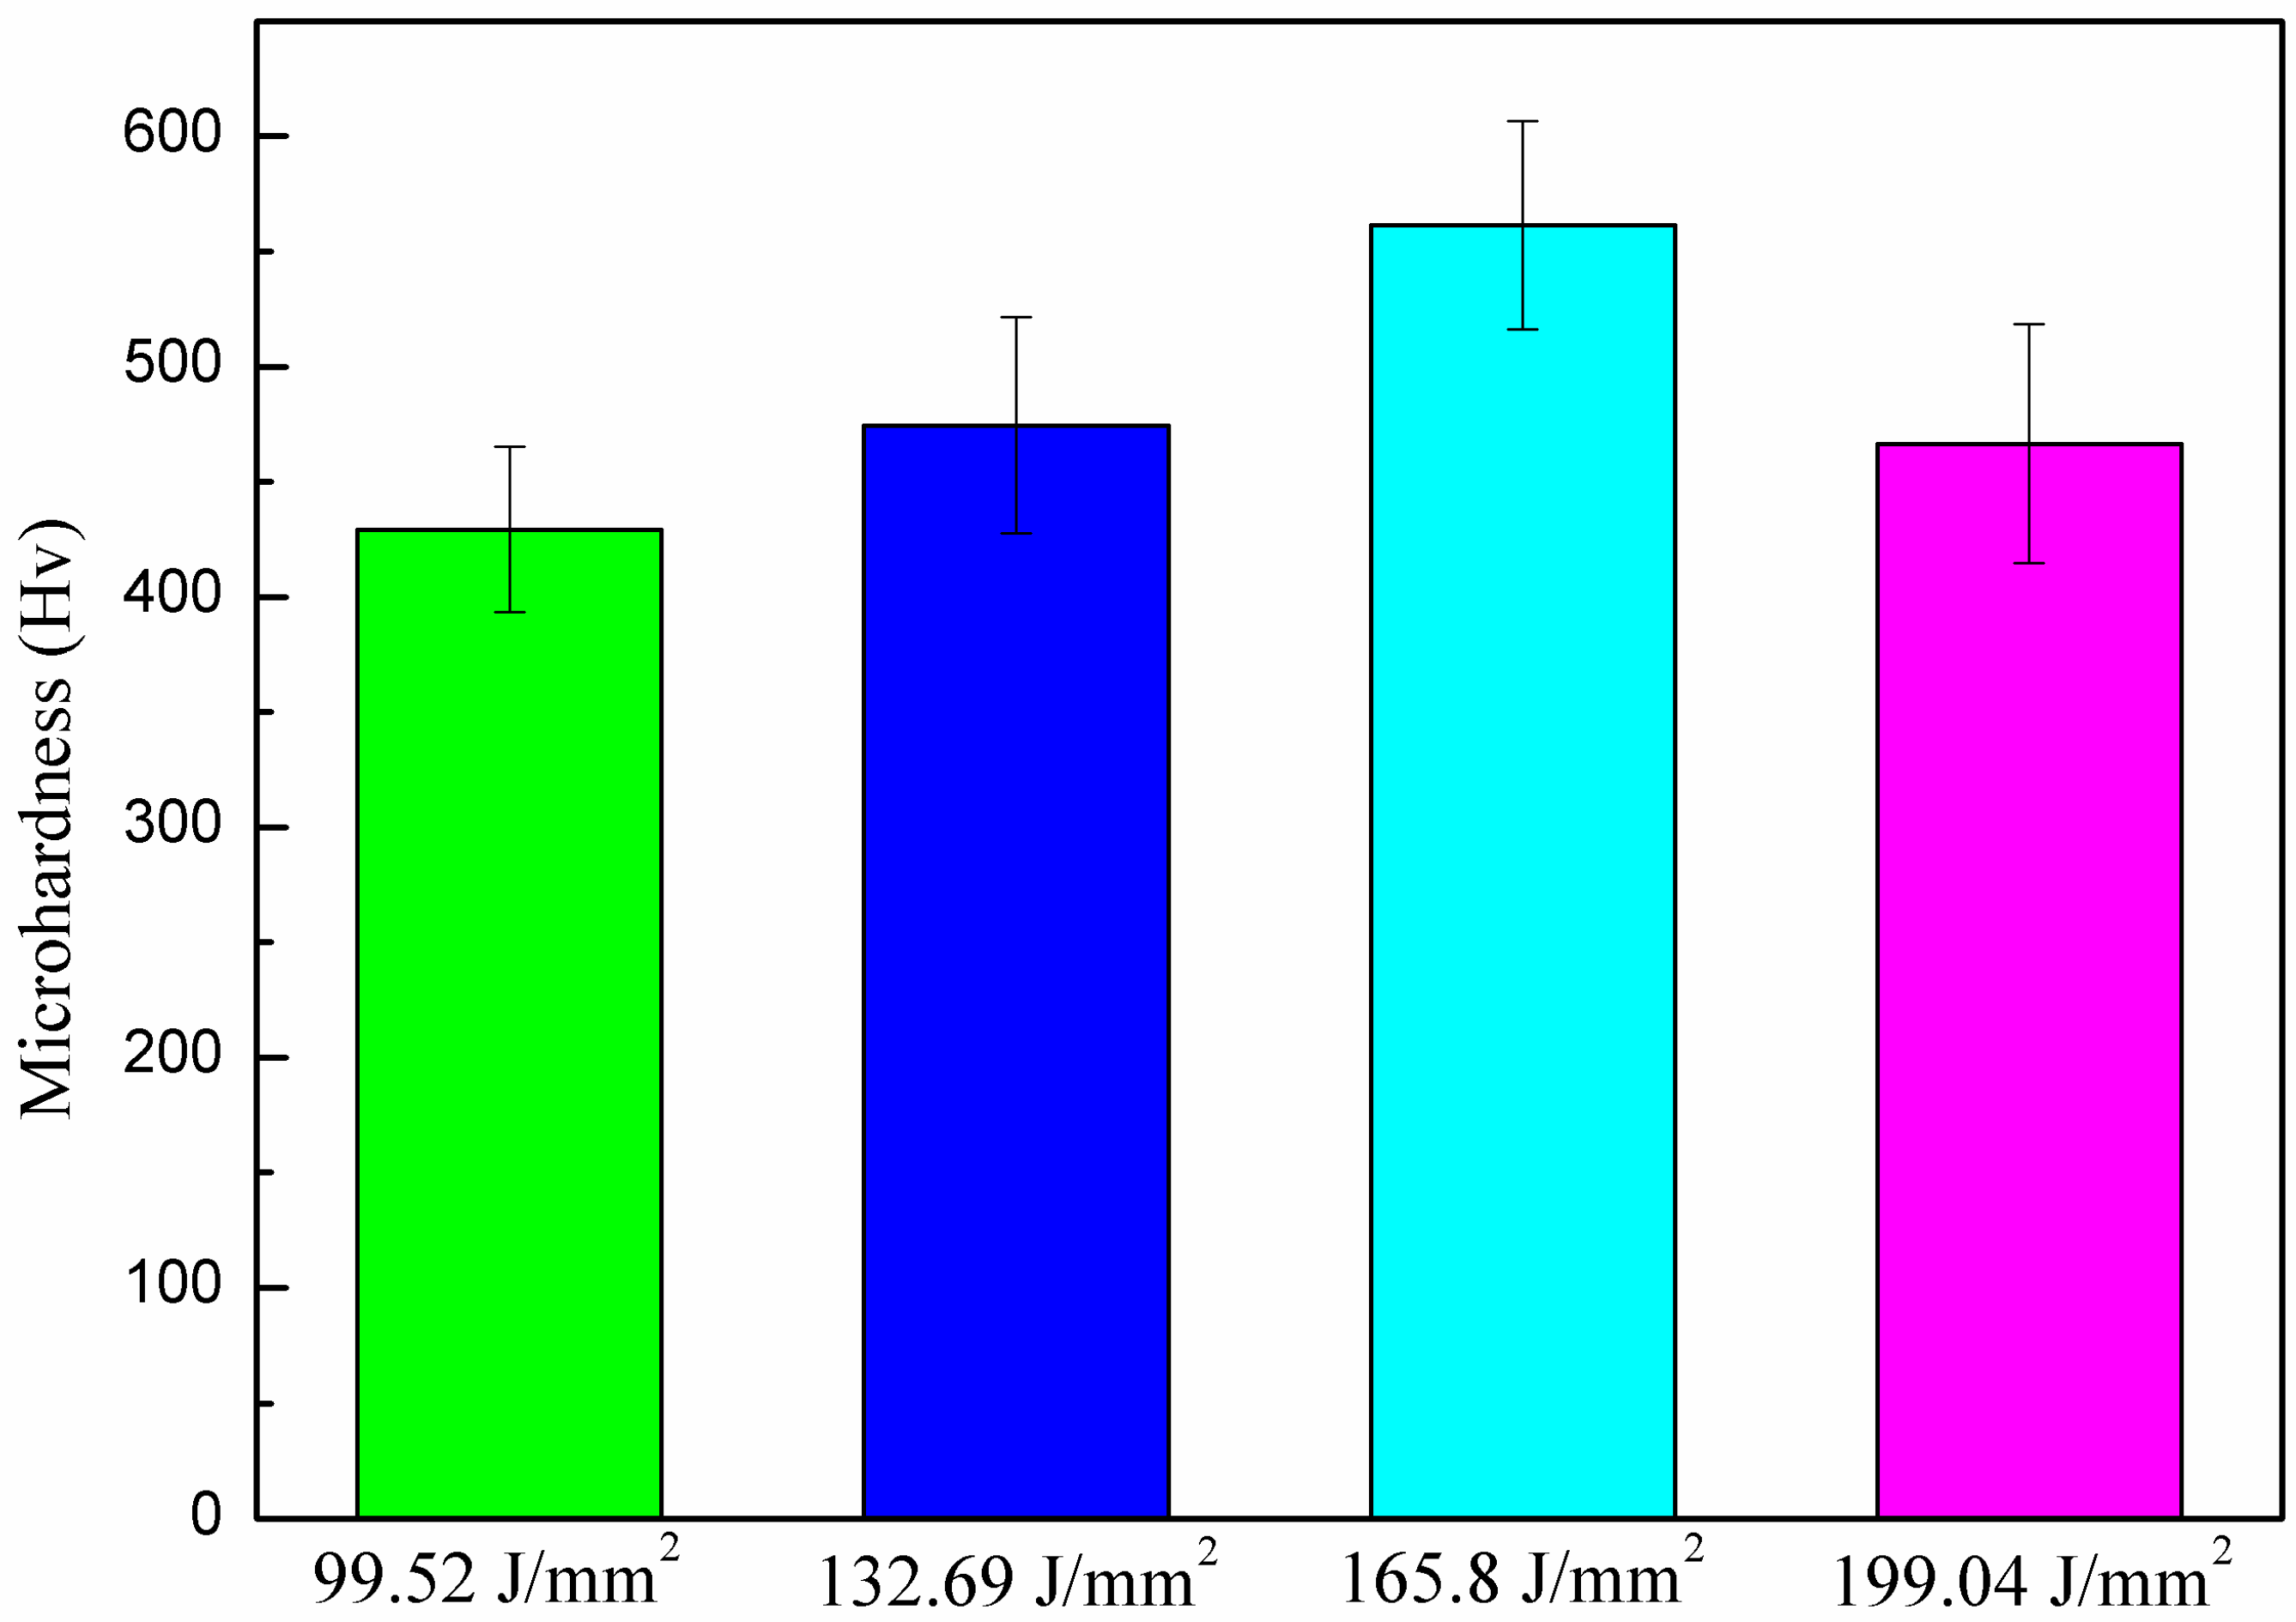
3.3.3. The Effects of Laser Energy Density on Microhardness

Figure 10 shows the relationship between laser energy density and microhardness. When the laser energy density is 99.52 J/mm2, 132.69 J/mm2, 165.8 J/mm2, and 199.04 J/mm2, the corresponding microhardness values of the sample are 429.24 Hv, 474.48 Hv, 561.38 Hv, and 466.48 Hv, respectively. With the increase in laser energy density, the microhardness value of the sample shows a trend of first increasing and then decreasing. When the laser energy density increases from 99.52 J/mm2 to 165.87 J/mm2, the microhardness value of the sample gradually increases. When the energy density increased to 199.04, the microhardness value of the sample decreased.
It is worth noting that compared to the effects of laser frequency and laser pulse width on microhardness, the effects of the laser energy density on sample microhardness are relatively small. The main reason for this phenomenon is that when the laser energy density exceeds the laser damage threshold, the higher the laser energy density, the deeper the molten pool. A better depth of the molten pool makes the bottom structure of the remelted layer almost unaffected by material gasification and splashing. Therefore, before the laser energy density increases to 165.8 J/mm2, the positive effect generated by the depth of the molten pool is greater than the side effect generated by the structural defects, resulting in a gradual increase in the microhardness of the sample. As the laser energy density continues to increase, the gasification and splashing phenomena on the surface of the sample gradually deteriorate, and the number of pores and slag inclusions in the remelted layer significantly increases. At this point, the side effects caused by structural defects are greater than the positive effects caused by changes in the depth of the molten pool, resulting in a decrease in the microhardness of the sample.

3.4. The Effects of Laser Parameters on Wear Resistance

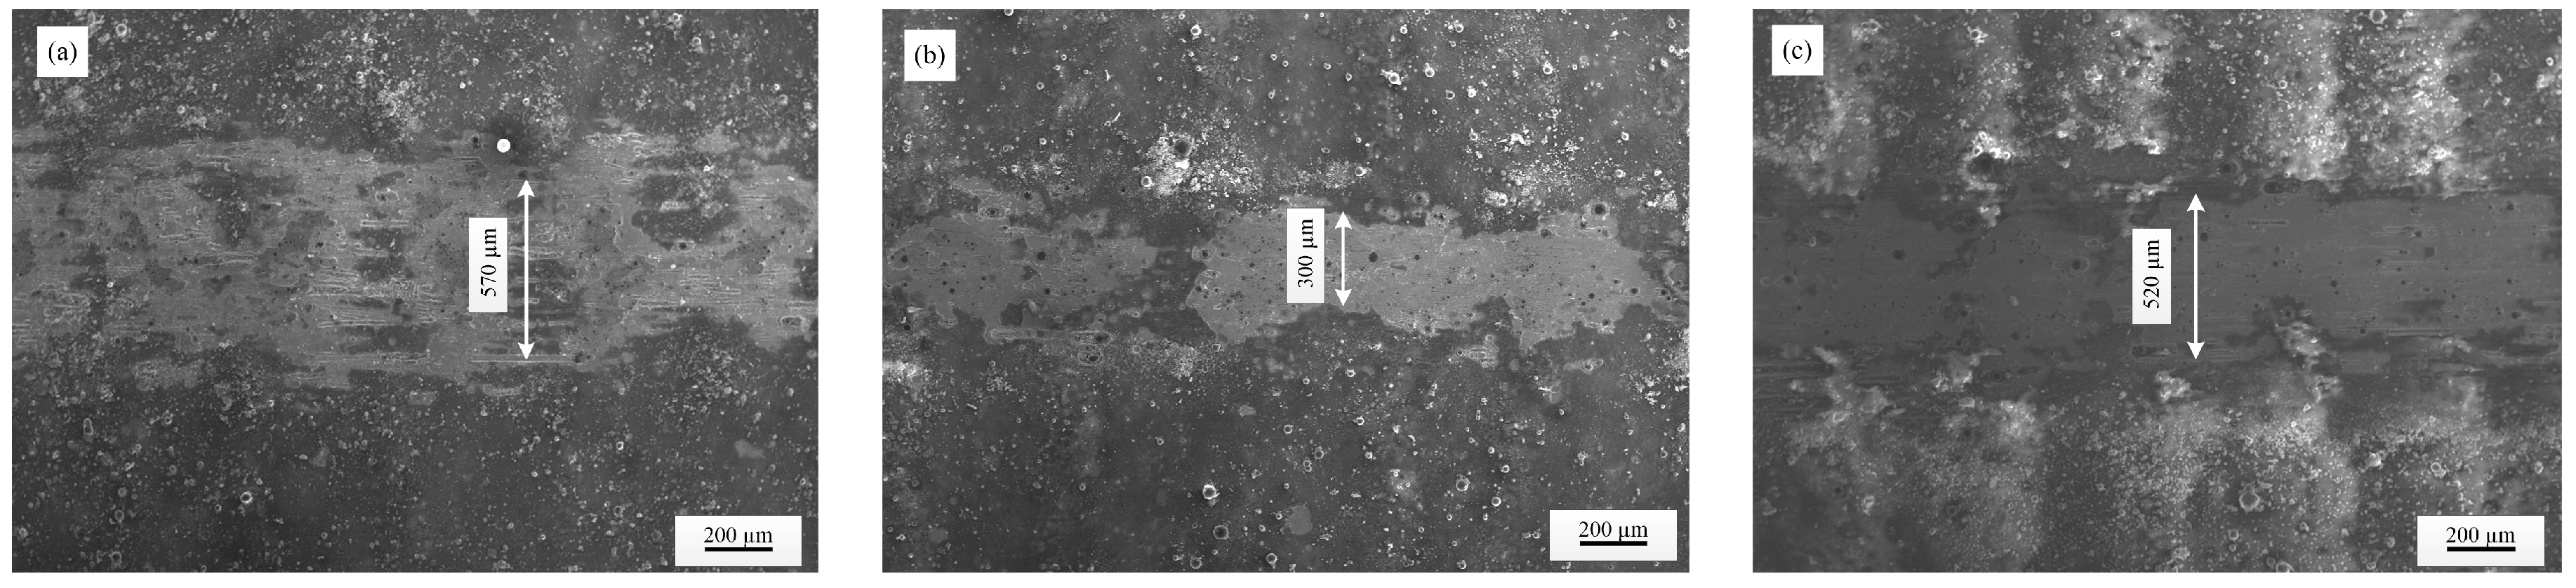
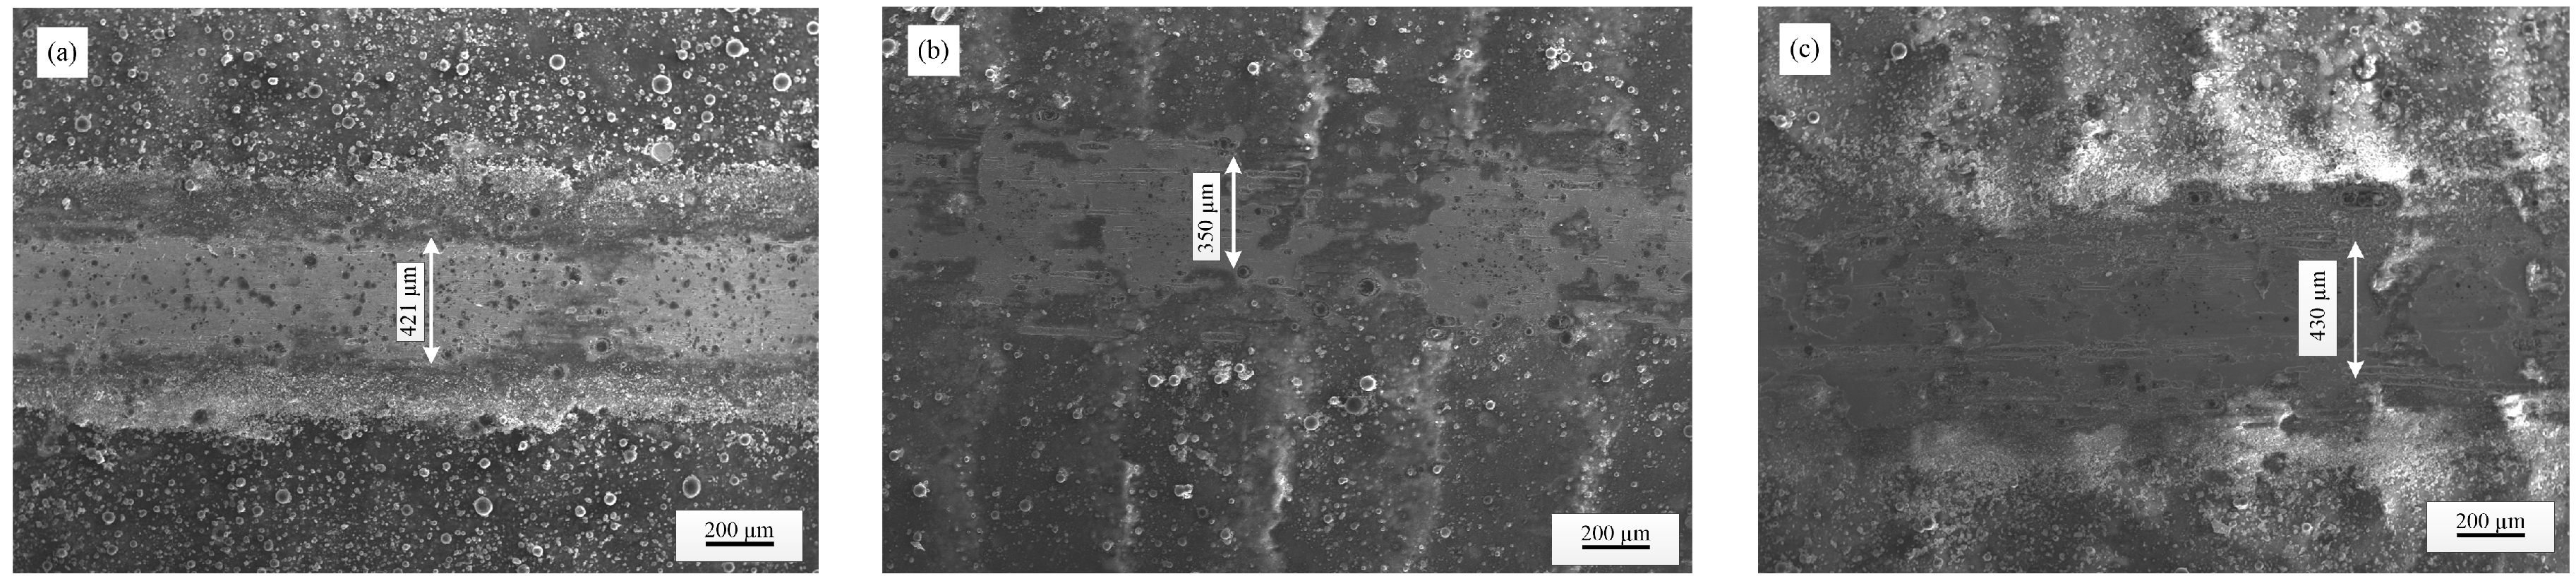
3.4.1. The Effects of Laser Frequency on Wear Resistance

Figure 11 shows the SEM images of the worn samples with different laser frequencies. From the figure, it can be seen that the worn samples show varying degrees of wear. There is a small amount of furrow-like damage at the wear marks, indicating that the wear characteristics of the sample are mainly adhesive wear, accompanied by slight abrasive wear. When the laser frequency is 5 Hz, the width of the wear mark on the sample reaches about 570 μm, accompanied by obvious abrasive wear characteristics. This is due to the overall low hardness of the sample surface, resulting in scratches caused by the detachment of the hardened layer on the sample surface. When the laser frequency is 10 Hz, the width of the wear mark on the sample is small, with an average wear width of about 300 μm. When the laser frequency is 15 Hz, the average width of the wear mark on the sample is about 520 μm, and the width of the wear mark is significantly greater compared to 10 Hz. Further comparison of the wear marks reveals that when the laser parameters are 5 Hz and 10 Hz, the depth of the sample wear marks is shallow, and some of the remelted layers are not completely destroyed. When the laser parameter is 15 Hz, the wear marks on the sample are basically continuous and the depth of the wear marks is relatively large. This situation is mainly caused by changes in the quality of surface remelting. When the laser frequency is 5 Hz, although the remelting points cannot be continuously overlapped, resulting in a lower microhardness value in the sample, it still has good surface strength for a single remelting point. Therefore, when the wear mark passes through the remelting point, the remelting point still exhibits good wear resistance. When the laser frequency is 15 Hz, the excessive overlap of remelting points produces a large number of defects such as pores and slag inclusions, resulting in poor wear resistance.

3.4.2. The Effects of Laser Pulse Width on Wear Resistance

Figure 12 shows the SEM images of the worn samples with different laser pulse widths. From the figure, it can be seen that the surface of the sample shows wear marks of different widths after wear. Among them, when the laser pulse width is 10 ms and 15 ms, the average width of the wear marks in the sample is about 300 μm and 440 μm, respectively, corresponding to the minimum and maximum values. Further analysis reveals that when the pulse width parameter is less than 10 ms (as shown in Figure 11b and Figure 12a), there is slight furrow-like damage present in the sample. There are no obvious abrasive wear characteristics at the wear positions of other samples. Based on this, it can be concluded that the wear mode of the above-mentioned samples is still mainly adhesive wear. Comparing Figure 12b,c, it can be seen that as the pulse width parameter gradually increases, the adhesive wear on the surface of the sample also deteriorates. The above phenomenon is mainly caused by the microhardness and structural defects of the sample, which have been analyzed in detail in the previous text.

3.4.3. The Effects of Laser Energy Densities on Wear Resistance

Figure 13 shows the SEM images of the worn samples with different energy densities. From the figure, it can be seen that when the laser energy density is 99.52 J/mm2 (Figure 13a), the average width of the wear mark on the sample is about 420 μm, and there are a large number of pockmarks on the mark surface. This phenomenon is mainly caused by the low energy density of the laser. When the laser energy density is low, the temperature rise of the copper substrate is low, resulting in poor material melting and flowability, and uneven doping of nanoparticles. When the laser energy density increased from 132.69 J/mm2 to 165.87 J/mm2, the surface wear of the sample gradually improved, and the pockmarks on the wear marks gradually disappeared. The corresponding average wear widths of the sample were about 350 μm and 300 μm, respectively. As the laser energy density continues to increase, the wear amount on the surface of the sample significantly increases, and the average wear width reaches 430 μm. There are obvious furrow-like damages in the wear marks, which may be caused by the peeling of the hardened layer at the edge of the abrasion marks.

4. Conclusions

Improving the wear resistance of copper is of great practical significance for its industrial application. This paper uses laser remelting to prepare Cu/BN remelted layers on purple copper (T2), and studies the effects of energy density, pulse width, and frequency parameters on the surface morphology, crystal structure, microhardness, and wear resistance of the Cu/BN remelted layer. The research results indicate that an integrated remelted layer is crucial for improving the surface properties of the specimen. Improving the melting state and flowability of remelted points can facilitate the doping of nano-materials and enhance their wear resistance. During the laser remelting process, a small amount of cuprous oxide was generated on the surface of the sample. Different laser parameters have varying degrees of effect on the properties of the Cu/BN remelted layer. Excessive laser parameters can cause severe gasification and material splashing on the surface of the sample, which is not conducive to the improvement of the surface properties. Compared with laser energy density, laser frequency and laser pulse width parameters have a greater impact on the Cu/BN remelted layer. When the pulse frequency is 10 Hz, the pulse width is 10 ms, and the energy density is 165.8 J/mm2, the Cu/BN remelted layer has good surface morphology, microhardness, and wear resistance.

Author Contributions

Conceptualization, H.L. and C.L.; methodology, H.L.; software, Y.C., S.C., Z.T. and Y.Q.; validation, Y.C., S.C., Z.T. and Y.Q.; formal analysis, Y.C., S.C., Z.T. and Y.Q.; investigation, H.L.; resources, C.L.; data curation, H.L. and C.L.; writing—original draft preparation, Y.C. and Y.L.; writing—review and editing, Y.C. and S.C.; visualization, C.L.; supervision, H.L.; project administration, H.L.; funding acquisition, H.L. and Y.L. All authors have read and agreed to the published version of the manuscript.

Funding

This research was funded by the Scientific Research Foundation for Doctoral of Suzhou University (Suzhou University: 2020BS009), the Open Project of Suzhou University Research Platform (Suzhou University: 2022ykf10), the Teaching and Research Project of Suzhou University (Suzhou University: szxy2024jyjf55), the Natural Science Research Project in the Universities of Anhui Province in China (Anhui Provincial Department of Education: 2022AH051386, 2023AH010055), and the Anhui Higher Education Quality Engineering Project (Anhui Provincial Department of Education: 2022jyxm1595, 2021jyxm1502, 2020mooc566).

Data Availability Statement

Data is contained within the article.

Acknowledgments

This work was supported by the Education Department of Anhui Province and the University of Science and Technology of China.

Conflicts of Interest

The authors declare no conflicts of interest.

References

  1. Copoglu, N.; Karaahmet, O.; Cengiz, T.; Gokdemir, H.; Cicek, B. TiB2 embedded borosilicate coatings with improved wear resistance. Surf. Eng. 2021, 37, 1449–1456. [Google Scholar] [CrossRef]
  2. Liu, J.C.; Zou, X.P.; Meng, X.S.; Kong, X.Y.; Pu, X.P. Wear resistance of Sm2O3-doped high alumina-based grinding medium. Tribol. Int. 2022, 178, 108037. [Google Scholar] [CrossRef]
  3. Liu, Z.H.; Zhang, J.H.; Zhang, Z.J.; Song, S.W. Improving the wear resistance of 440C bearing steel balls by adding ZrO2 in mechanical alloying. Wear 2024, 550–551, 205416. [Google Scholar] [CrossRef]
  4. Li, H.; Chen, Y.; Chen, S.; Liu, Y.; Liu, C. The Influence of Laser Remelting Parameters on the Surface Quality of Copper. Micromachines 2024, 15, 927. [Google Scholar] [CrossRef] [PubMed]
  5. Fan, D.; Zhang, H.; Huang, J.K.; Li, Y.; Xie, Y.H. Ultrasonic assisted SiO2 nanoparticles strengthened Al/Cu plasma arc welding process. J. Mater. Eng. 2024. Available online: https://link.cnki.net/urlid/11.1800.TB.20240829.1005.004 (accessed on 31 July 2024).
  6. Gao, H.Y.; Zheng, Y.H.; Niu, J.N.; Zhu, M.; La, P.Q.; Zhu, S.J. Formation Mechanism of Micro/nanostructure of Reverse-treated Copper Foil and Its Effect on Mechanical Properties. Surf. Technol. 2024, 53, 219–225. [Google Scholar]
  7. Fu, G.; Li, S.Y.; Li, H.L.; Ren, Z.H.; Peng, Q.G.; Xiao, H.Q.; Li, S.B. Melt Pool Behaviour and Defect Mechanism in Multi-track Formation of Selective Laser Melting Copper Alloys. Surf. Technol. 2024, 53, 118–128. [Google Scholar]
  8. Sun, L.; Yang, P.P.; Gao, W.; Liu, X.; Ding, J.X.; Yang, Y.; Yang, K.; Xiang, T.F.; Zhang, S.H. In-Situ Preparation and Structural Properties of MAX Phase Composite Coatings on Copper Alloys. Chin. J. Rare Met. 2024, 48, 1132–1143. [Google Scholar]
  9. Liu, C.; Yin, Y.G.; Zhang, G.T.; Ma, S.B.; Zhang, C.Z.; Ye, T. The Synergistic Lubrication Mechanism of FeS and Bi Phases in Lead-free Copper Based Self-lubricating Materials. Surf. Technol. 2024. Available online: https://link.cnki.net/urlid/50.1083.TG.20240902.0952.008 (accessed on 31 July 2024).
  10. Hou, C.; Cao, L.J.; Li, Y.R.; Tang, F.W.; Song, X.Y. Hierarchical nanostructured W-Cu composite with outstanding hardness and wear resistance. Nanotechnology 2020, 31, 084003. [Google Scholar] [CrossRef]
  11. Nan, R.; Fu, H.G.; Yang, P.H.; Lin, J.; Guo, X.Y. Microstructure Evolution and Wear Resistance of Cu-Bearing Carbidic Austempered Ductile Iron after Austempering. J. Mater. Eng. Perform. 2020, 29, 2440–2459. [Google Scholar] [CrossRef]
  12. Cao, H.J.; Li, W.C.; Zhang, T.G.; Zhang, H.W.; Zhang, Z.Q. Organization and tribological properties of WC/Ni-MoS2 titanium-based composite coating on TC4 surface. Mater. Rep. 2024, 38, 24020099. [Google Scholar]
  13. Zhang, X.Y.; Lv, W.Y.; Qiu, K.Q.; Qu, Y.D. Highly Wear-resistant and Crack-free Double-layer Fe-based Amorphous Composite Coatings by Laser Cladding. Spec. Cast. Nonferrous Alloys 2024, 44, 692–698. [Google Scholar]
  14. Li, J.H.; Qian, W.; Zhu, J.J.; Cai, J.; Hua, Y.Q. Effects of Laser Shock Peening on Microstructure and Oxidation Performance of Nickel-based Single Crystal Superalloy DD6. J. Chin. Soc. Corros. Prot. 2024. Available online: https://link.cnki.net/urlid/21.1474.TG.20240416.1007.014 (accessed on 31 July 2024).
  15. Jin, D.; Liu, Z.; Guo, C.U.; Li, Z.Q.; Sun, M.Y. Effect of Laser Shock Peening on Fatigue Life for FV520B Steel. China Surf. Eng. 2024, 37, 280–286. [Google Scholar]
  16. Li, Z.K.; Liang, Z.Q.; Cai, Z.H.; Li, X.Z.; Luan, X.S.; Zou, S.K.; Li, H.W.; Liu, X.L.; Li, J.; Wang, F. Experimental Study on Laser Shock Peening and Ultrasonic Surface Rolling Composite Strengthening of Ultra-high Strength Steel. J. Mech. Eng. 2024, 60, 1–9. [Google Scholar]
  17. Li, J.Y.; Liu, Y.D.; Zhou, Y.S.; Shi, W.T.; Zhang, M. Effect of laser remelting on quality and mechanical properties of selective laser melting of TC4. Laser Optoelectron. Prog. 2022, 59, 0514006. [Google Scholar]
  18. Xiong, A.H.; Liu, Y.H.; Li, K.; Zhang, H.Y.; Fu, J.Y. Numerical simulation and experiments of gray cast iron by laser surface remelting. Laser Optoelectron. Prog. 2022, 59, 0316007. [Google Scholar]
  19. Zhao, E.L.; Yang, H.F.; Peng, Y.X.; Wang, L.; Song, B.; Zhu, C.C.; Liu, H. Microstructure and wear behavior of laser-remelted high-manganese steel. J. Mater. Eng. Perform. 2023, 32, 11422–11431. [Google Scholar] [CrossRef]
  20. Song, J.L.; Lin, J.R.; Zhang, Z.W.; Fu, X.Q.; Kang, M.; Cheng, J.B.; Hong, S. Laser remelting of high-velocity arc-sprayed Fe-based amorphous coating for improving corrosion resistance in 3.5% NaCl solution with varying Na2S concentrations. Surf. Coat. Technol. 2024, 485, 130853. [Google Scholar] [CrossRef]
  21. Tang, J.H.; Duan, J.; Ji, X.L. Corrosion Resistance and Wear Resistance of Coating by Different Processes with TC4 Titanium Alloy Coarse Powder Rare Materials. Mater. Mech. Eng. 2024, 48, 74–83. [Google Scholar]
  22. Wen, G.; Wen, X.L.; Bai, P.P.; Meng, Y.G.; Ma, L.R.; Tian, Y. Effect of mixing procedure of oleic acid and BN nanoparticles as additives on lubricant performance of PAO8. Tribol. Int. 2022, 175, 107842. [Google Scholar] [CrossRef]
  23. Oh, J.H.; Kim, M.; Lee, Y.H.; Hong, S.H.; Park, S.S.; Kim, T.H.; Choi, S. Synthesis of cobalt boride nanoparticles and h-BN nanocage encapsulation by thermal plasma. Ceram. Int. 2020, 46, 28792–28799. [Google Scholar] [CrossRef]
  24. Shi, N.Q.; Li, Z.K.; Li, X.; Luo, H.X.; Dong, S.Z.; Li, H.Y. Bionic modified h-BN loaded CeO2 nanoparticles to improve the anti-corrosion properties of composited epoxy coatings. Colloids Surf. 2024, 694, 134111. [Google Scholar] [CrossRef]
  25. Fu, M.; Xiao, G.C.; Chen, H.; Zhang, J.J.; Yi, M.D.; Chen, Z.Q.; Xu, C.H. Investigation of Surface Integrity of 304 Stainless Steel in Turning Process with Nanofluid Minimum-Quantity Lubrication Using h-BN Nanoparticles. Metals 2024, 14, 583. [Google Scholar] [CrossRef]
  26. Gao, Y.X.; Xiao, S.; Wu, H.; Wu, C.M.; Chen, G.H.; Yin, Y.S.; Chu, P.K. Effect of h-BN nanoparticles incorporation on the anti-corrosion and anti-wear properties of micro-arc oxidation coatings on aluminum alloy. Ceram. Int. 2024, 49, 37475–37485. [Google Scholar] [CrossRef]
  27. Uzay, C. Effects of cubic boron nitride (c-BN) nanoparticle addition on the wear properties of carbon FRP composites. Mater. Test. 2023, 65, 43–51. [Google Scholar] [CrossRef]
  28. Kandeva, M.; Zagorski, M.; Nikolic, R.; Stojanovic, B.; But, A.; Botko, F.; Pitel, J.; Vencl, A. Friction Properties of the Heat-Treated Electroless Ni Coatings Embedded with c-BN Nanoparticles. Coatings 2022, 12, 1008. [Google Scholar] [CrossRef]
  29. Li, H.Z.; Chen, S.; Chen, Y.; Tao, Z.C.; Liu, C.H. The Effect of Laser Surface Remelting on the Surface Properties of Copper. Coatings 2024, 14, 60. [Google Scholar] [CrossRef]
Figure 1. Schematic diagram of laser surface remelting process [4].
Crystals 14 00809 g001
Figure 2. Surface and cross-sectional SEM images at different laser frequencies: (a,d) 5 Hz, (b,e) 10 Hz, and (c,f) 15 Hz.
Crystals 14 00809 g002
Figure 3. Surface and cross-sectional SEM images of surface and cross-sectional with different laser pulse widths: (a,d) 7.5 ms, (b,e) 12.5 ms, and (c,f) 15 ms.
Crystals 14 00809 g003
Figure 4. Surface and cross-sectional SEM images with different laser energy densities: (a,d) 99.52 J/mm2, (b,e) 132.69 J/mm2, and (c,f) 199.04 J/mm2.
Crystals 14 00809 g004
Figure 5. The XRD patterns of the samples at different frequencies.
Crystals 14 00809 g005
Figure 6. XRD patterns with different pulse widths.
Crystals 14 00809 g006
Figure 7. The XRD patterns of the samples with different energy densities.
Crystals 14 00809 g007
Figure 8. Relationship between laser frequency and microhardness.
Crystals 14 00809 g008
Figure 9. Relationship between laser pulse width and microhardness.
Crystals 14 00809 g009
Figure 10. Relationship between laser energy density and microhardness.
Crystals 14 00809 g010
Figure 11. SEM images of the worn samples with different laser frequencies: (a) 5 Hz, (b) 10 Hz, and (c) 15 Hz.
Crystals 14 00809 g011
Figure 12. SEM images of the worn samples with different laser pulse widths: (a) 7.5 ms, (b) 12.5 ms, and (c) 15 ms.
Crystals 14 00809 g012
Figure 13. SEM images of the worn samples with different energy densities: (a) 99.52 J/mm2, (b) 132.69 J/mm2, and (c) 199.04 J/mm2.
Crystals 14 00809 g013
Table 1. The main components of the purple copper plate (T2).
ElementCuAgPbPFeZn
Mass ratio (%)≥99.9≤0.015≤0.005≤0.005≤0.005≤0.005
Disclaimer/Publisher’s Note: The statements, opinions and data contained in all publications are solely those of the individual author(s) and contributor(s) and not of MDPI and/or the editor(s). MDPI and/or the editor(s) disclaim responsibility for any injury to people or property resulting from any ideas, methods, instructions or products referred to in the content.

