Article

Crystal Structure, Microstructure, and Dielectric and Electrical Properties of Ceramic Material Prepared Using Volcanic Ash

by
Shoroog Alraddadi
Department of Physics, University College in AlJumum, Umm Al-Qura University, P.O. Box 715, Makkah 21955, Saudi Arabia
Crystals 2024, 14(9), 817; https://doi.org/10.3390/cryst14090817
Submission received: 21 August 2024 / Revised: 10 September 2024 / Accepted: 15 September 2024 / Published: 18 September 2024
(This article belongs to the Section Polycrystalline Ceramics)

Abstract

:
In the present work, the electrical and dielectric properties of ceramic samples prepared from volcanic ash were investigated. For this purpose, ceramic samples were prepared using milled volcanic ash with a binder material at a sintering temperature of 950 °C for 2 h. The chemical content of the milled volcanic ash was investigated using XRF. Differential thermal analysis and thermogravimetry were performed to determine the firing conditions. The crystalline phases and microstructures of the ceramic samples were investigated using XRD and SEM, respectively. Finally, the electrical and dielectric properties of the obtained samples were evaluated at a frequency ranging from 1 × 10² to 4 × 10⁶ Hz and temperatures ranging from room temperature to 800 °C. The XRD results revealed that the ceramic samples contained three main phases: albite, hematite, and augite. Moreover, the microstructures of the samples exhibited a large crystal size with a dense surface. The conductivities and dielectric constants of the samples remained stable up to 500 °C. The real and imaginary parts of the dielectric constant decreased with an increase in frequency and increased with an increase in temperature. The results indicated that ceramics based on volcanic ash are promising for use in technological applications such as high-voltage power insulators.

1. Introduction

In recent years, ceramic materials have garnered significant attention because of their excellent properties and potential applications in numerous fields [1,2,3,4]. They are used in the fabrication of refractories and filters and in high-tech applications such as solid oxide fuel cell components. In the building sector, they are utilized in clay bricks and blocks, sanitary ware, wall and floor tiles, and so on. Currently, there is considerable focus on producing ceramics from low-cost, ecofriendly materials and improving their properties. Volcanic ash is a naturally abundant material that can be utilized in a wide range of applications [5,6,7,8,9,10,11]. Owing to its physical properties, such as its good chemical and thermal stability, high-temperature strength, high melting point, low density, and low expansion coefficient, it is a cost-effective source. Volcanic ash has been used as a ceramic material owing to its high contents of aluminosilicates, cement, concrete, and geopolymer materials [9,12,13,14,15]. In a previous study, researchers examined the thermal, structural, and mechanical characteristics of different ceramic samples that use volcanic ash paste as a substitute for ceramic products [16]. X-ray diffraction (XRD) analysis revealed large quantities of amorphous phases with varying chemical contents, such as plagioclase, olivine, and pyroxene, as the main minerals. Thus, the thermal and mechanical properties of these volcanic ash samples were affected by their crystalline phases and chemical compositions. In other studies, volcanic ash was used to replace feldspar in clay-based ceramic products as a flux fraction. The resulting ceramics had appropriate mechanical and textural characteristics similar to those of ceramics made from feldspar—a conventional raw material. The use of these ceramics can reduce the energy consumption related to feldspar production [17]. Additionally, ceramic samples with photoluminescent characteristics of construction applications have been produced. Mixtures containing different percentages of volcanic ash were sintered at 950 °C for 14 h to create materials for photoluminescent pottery. Strong photoluminescent surfaces were achieved that met the requirements for second-class bricks appropriate for regular weathering and absorption [18]. A ceramic building was created via die pressing and sintering at 1000 °C using clay, volcanic ash, and seawater. The sample with the highest density and compressive strength comprised 50% volcanic ash and 50% saltwater and was characterized by the formation of a SiO2 phase [19]. In another study, an ideal mixture of clay and volcanic ash was prepared for the formulation of a ceramic paste. Four samples were prepared using 30, 20, 10, and 0 wt% volcanic ash; 60 wt% ball clay; and 10, 20, 30, and 40 wt% kaolin [20]. It was discovered that the clay samples’ ceramic performance increased with the addition of additional volcanic ashes. Thus, the addition of volcanic ash as a flux improves the ceramic properties of clay. Recently, the possibility of using volcanic ash—a low-cost, naturally produced ceramic material—for thermal energy storage (TES) was investigated [21]. The results indicated enhanced solar absorption, excellent thermal and chemical stability even in the presence of molten salts, slight mass gain that was consistent over time, and high-temperature stability up to 750 °C. However, few studies have been performed to evaluate the electrical properties of volcanic ash. In particular, investigations of crystal phases, electrical conductivity, and dielectric constant of ceramics prepared from volcanic ash are rare. Most research has focused on the production of ceramics and the characterization of their structures, microstructures, and mechanical properties. Therefore, in the present work, the electrical conductivity, dielectric constant, and dielectric loss of ceramic samples prepared with volcanic ash were examined. Mineralogical characterization was performed using X-ray fluorescence (XRF) spectroscopy. Additionally, the thermal characteristics of volcanic ash were investigated by performing thermogravimetric analysis as well as differential scanning calorimetry analysis (TGA-DSC) in order to establish the firing conditions of the prepared ceramic samples. The mineral phases and morphological characteristics of the samples were examined via XRD and scanning electron microscopy (SEM), respectively. The electrical and dielectric properties of the samples were examined at temperatures up to 800 °C in the frequency range of 100 Hz to 4 × 10⁶ Hz. This work contributes to the growing understanding of the electrical properties of ceramic samples prepared using volcanic ash and similar materials, along with the effects of the thermal treatment of ceramic raw materials on their physical characteristics. The results of this study may be applicable to materials from similar sources and with similar properties.

2. Materials and Methods

2.1. Materials and Ceramic Sample Preparation

Volcanic ash was collected from western Saudi Arabia and ground to a fine powder via ball milling. The ceramic samples were shaped into disks with diameters and thicknesses of 15 and 2 mm, respectively. The volcanic ash powder was mixed with polyvinyl alcohol (PVA) as a binder and compressed using a manual hydraulic press, followed by sintering at 950 °C for 2 h in air. The ceramic preparation process is illustrated in Figure 1.

2.2. Chemical Composition and Differential Thermal Analysis (DTA)

XRF spectroscopy was performed using a SPECTRO XEPOS (AMETEK Inc., Cassatt Rd Berwyn, PA, USA) to identify the oxide minerals (wt%) in volcanic ash. For the XRF analysis, 8 g of lithium borate and 1 g of volcanic ash were mixed thoroughly in a platinum crucible which most oxides dissolve the best in lithium borate salts. The mixture was then placed in a fusion system for 20 min to form a glass disk. To determine the firing temperatures of the ceramic samples, thermal measurement was carried out using TGA-DSC (NETZSCH-Gebrüder-Netzsch-Straße, Selb, Germany) at a heating rate of 5 °C/min over a temperature range of room temperature (RT) to 1300 °C.

2.3. XRD Analysis and SEM

The mineral phases of the ceramic samples were identified using an X-ray diffractometer (D8 Advance, Bruker, Billerica, MA, USA) and Cu Kα Ni-filtered radiation with a wavelength of 1.54 Å. The XRD patterns of the samples were scanned over the 2θ range of 5–80°. The morphologies of the volcanic ash and ceramics were examined using a scanning electron microscope (JEOL, Tokyo, Japan).

2.4. Electrical and Dielectric Measurements

The ceramic samples were polished on both faces to ensure perfect electrical contact for electrical and dielectric measurements. A high-performance silver paste was used to create the electrodes. The samples were then dried for 1 h at 150 °C. Alternating-current (AC) electrical and dielectric measurements were performed using a Hioki 3532-50 LCR Hi-Tester (Hioki, Nagano, Japan) impedance analyzer at various frequencies and temperatures up to 800 °C.

3. Results and Discussion

3.1. Chemical Composition and Thermal Analyses of Volcanic Ash

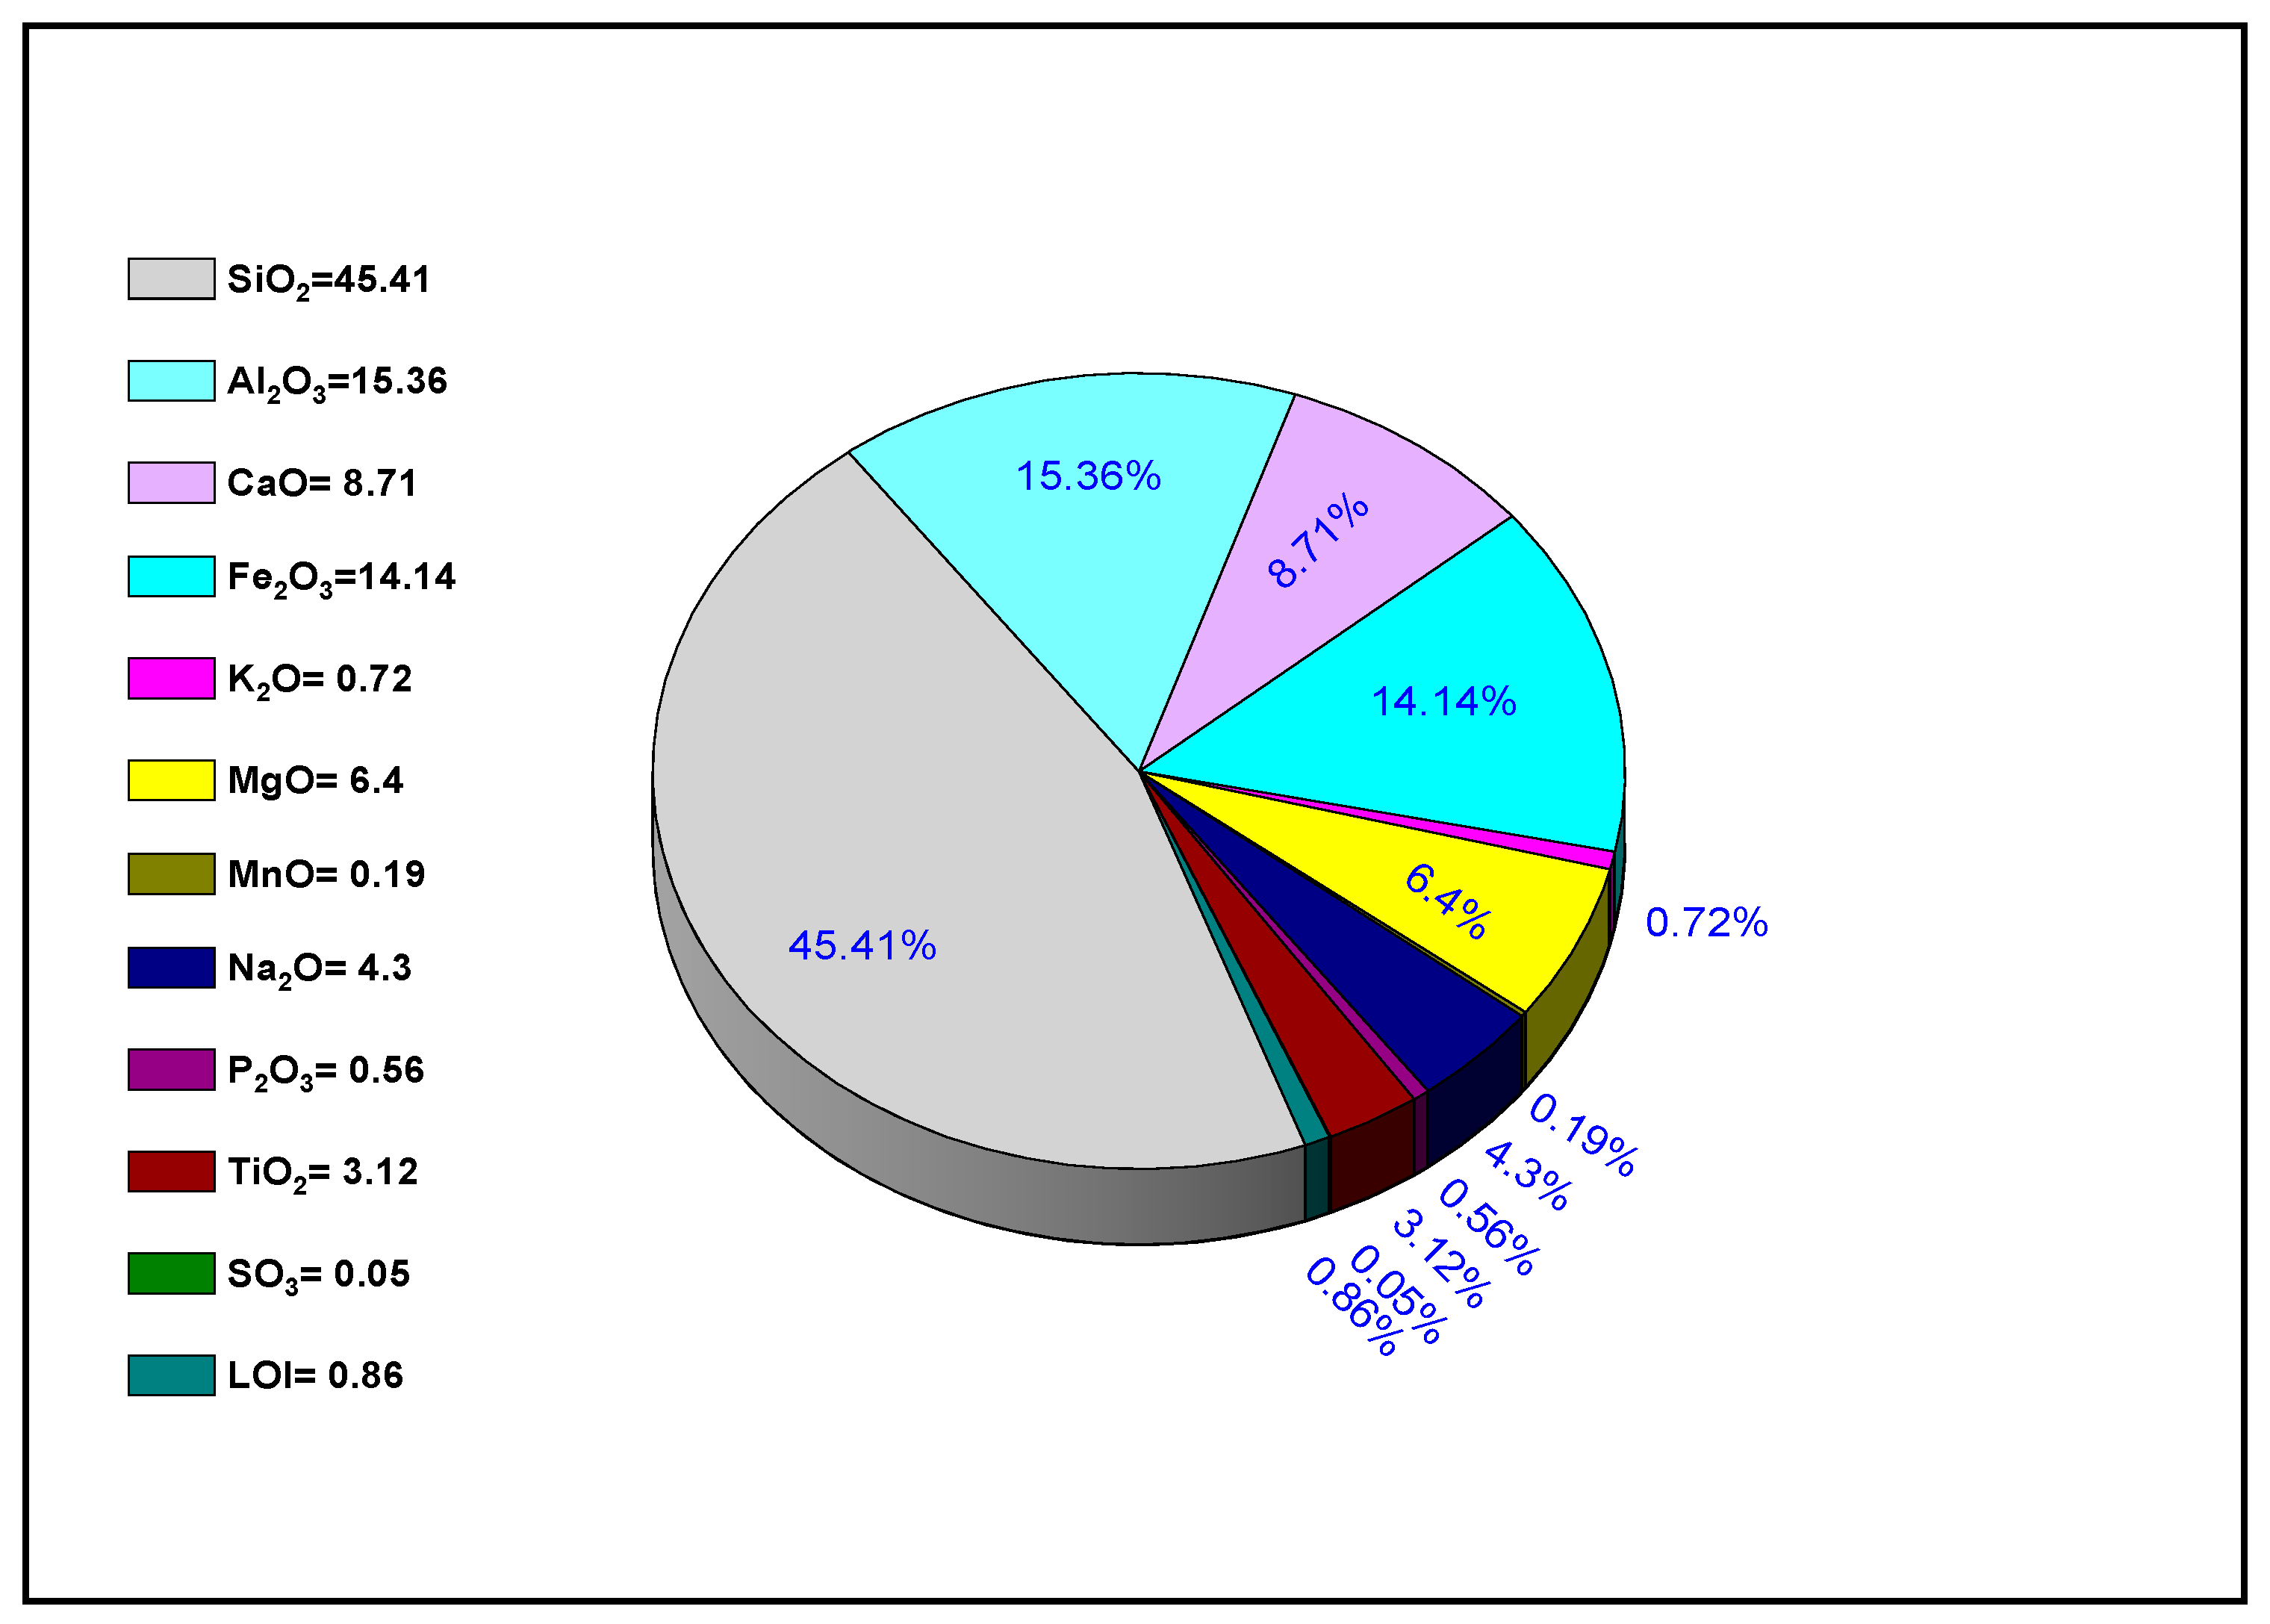
XRF was used to determine the major and minor oxides in volcanic ash, which were expressed as percentages. SiO2, Al2O3, CaO, and Fe2O3 were the major oxides found in volcanic ash, and the minor oxides included K2O, MgO, MnO, Na2O, P2O5, TiO2, and SO3 (Figure 2). These results agree with those in a previous report [22]. Owing to its high silica and alumina concentrations, volcanic ash oxide is ideal for producing ceramics.
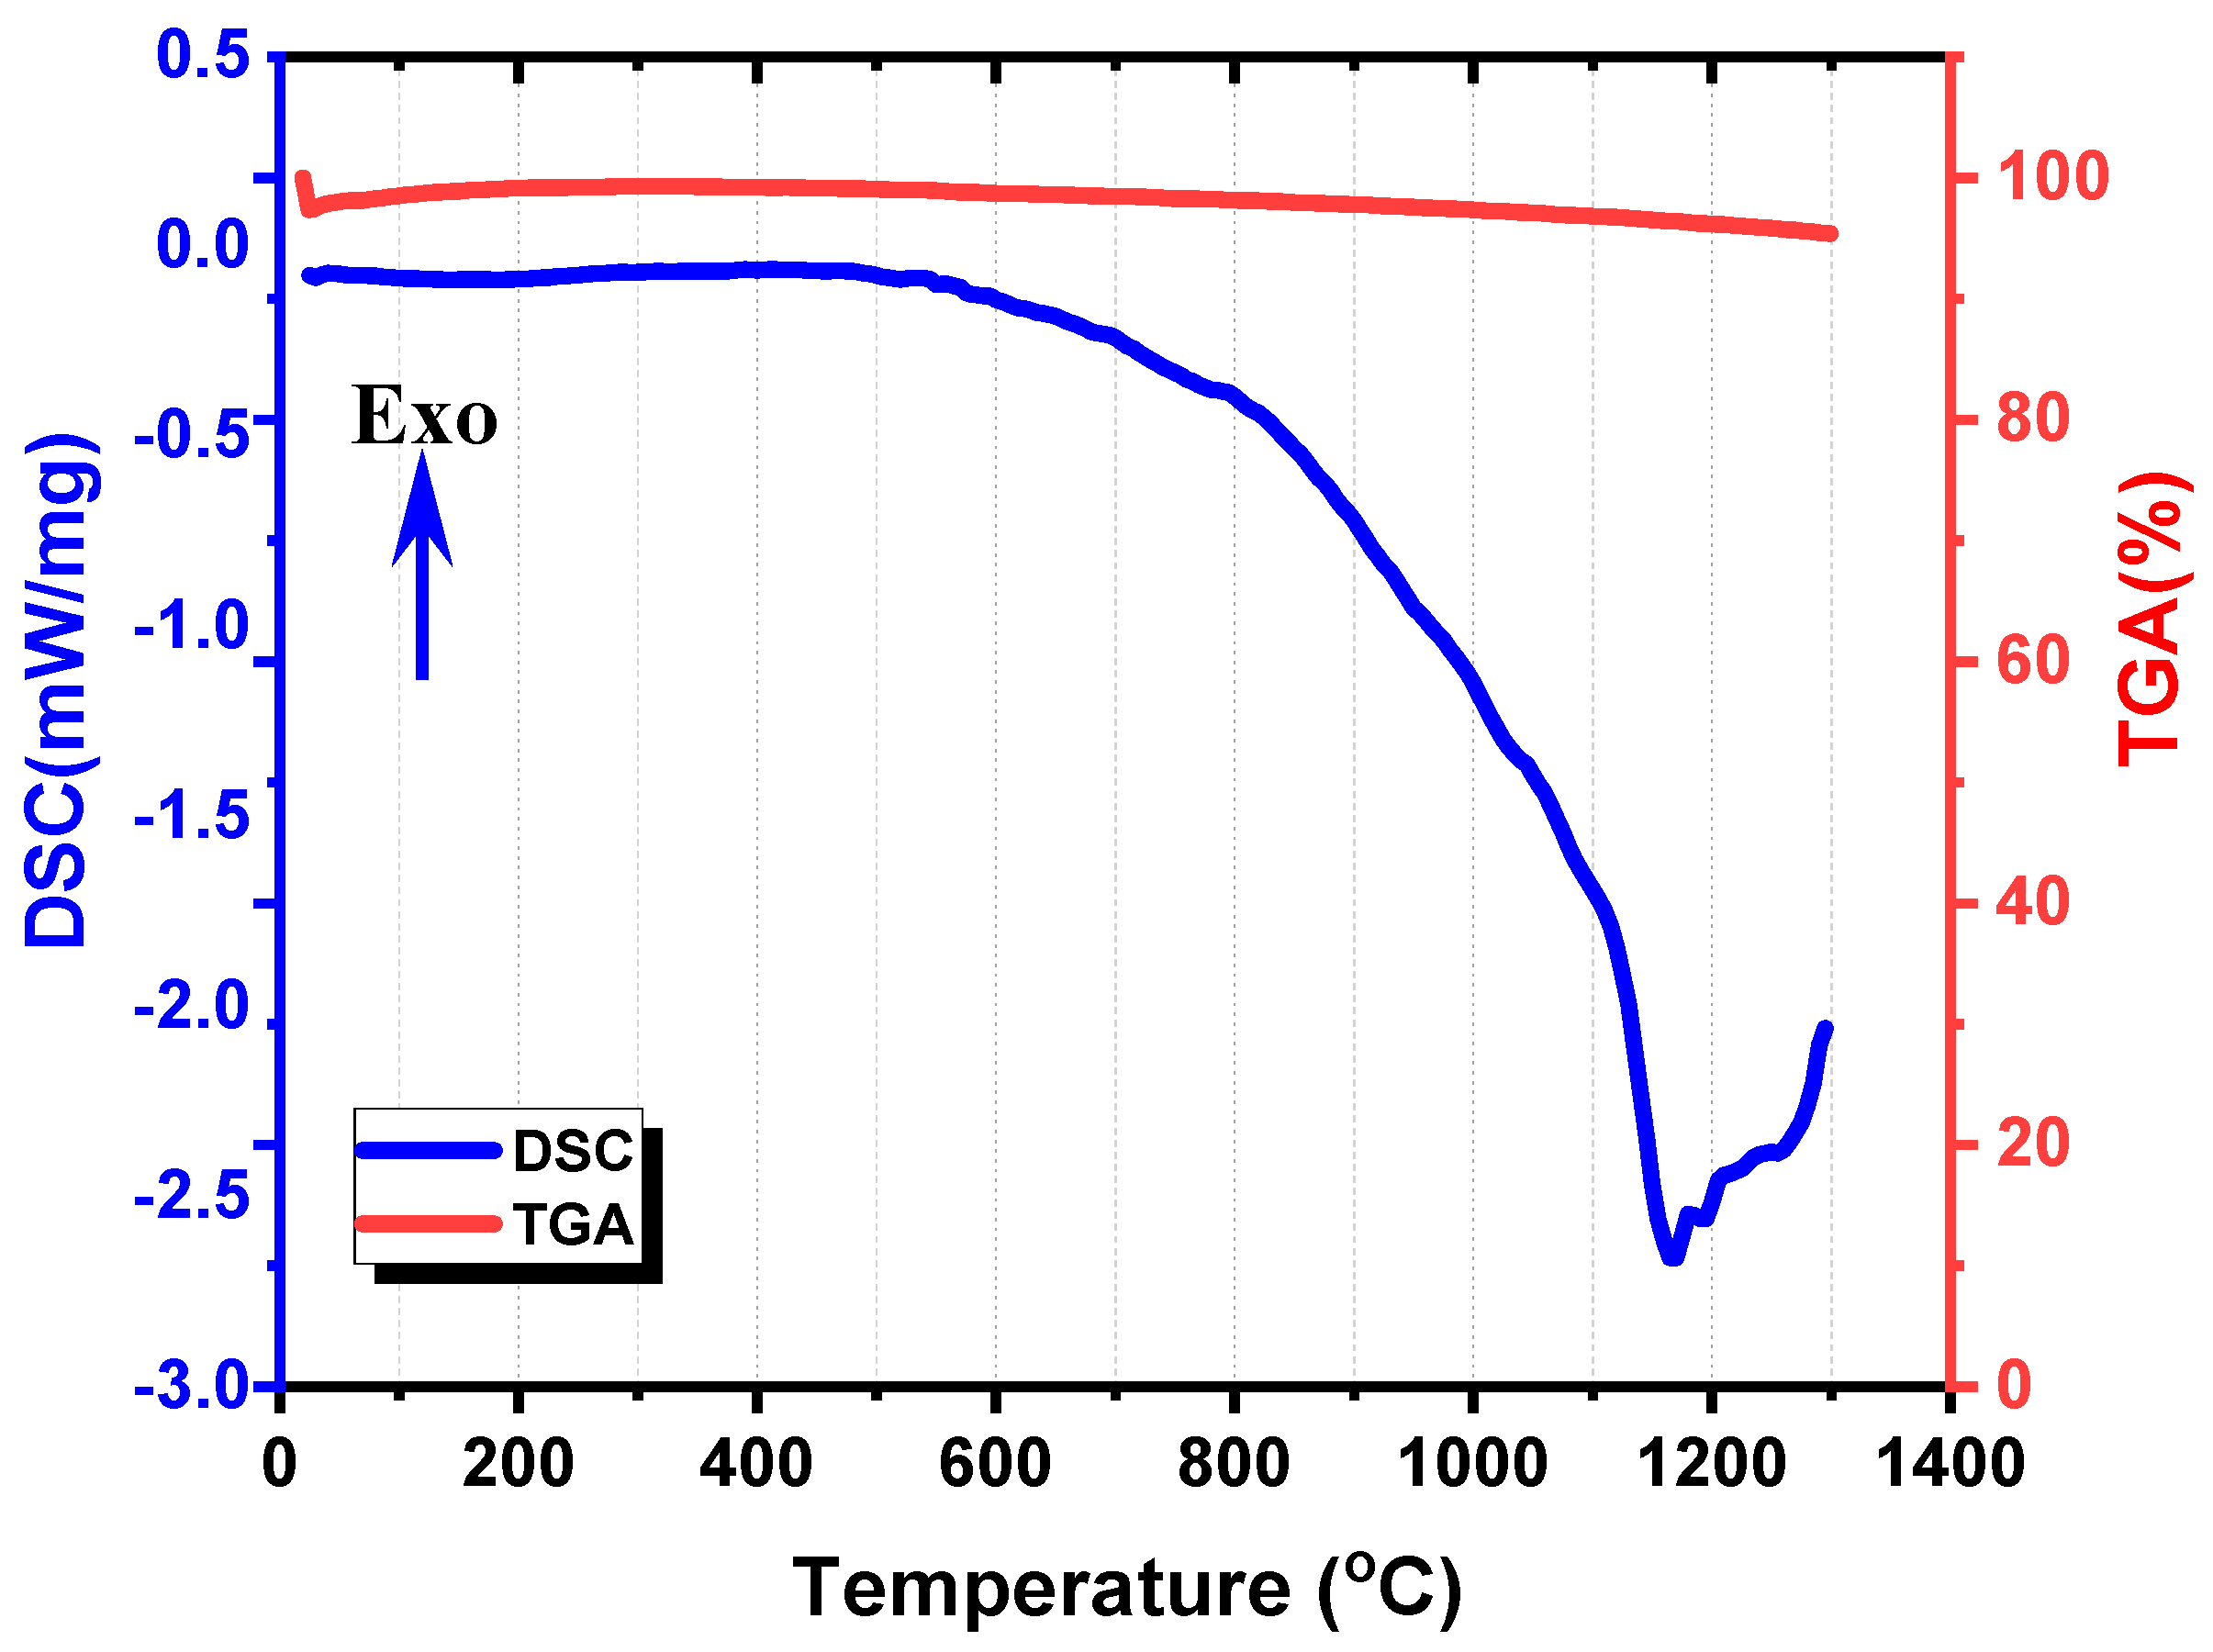
From DSC analysis, volcanic ash was thermally stable up to 820 °C, as illustrated in Figure 3. The reason for the low heat absorption (endothermic peak) at approximately 820 °C may be that after crystallization, atoms start to organize themselves into a basic structural element. Additionally, a significant endothermal peak is observed in the DSC thermogram at 1200 °C, which may be explained by the fusion and structural disintegration of volcanic ash mineral components during densification–vitrification [23,24]. According to the findings of the thermal analysis, ceramic samples of volcanic ash were produced at 950 °C.

3.2. XRD and SEM Analysis

The mineral phases of the ceramic samples were detected using XRD (Figure 4). The samples exhibit distinct peaks in the 2θ range of 5°–80°, indicating the presence of different minerals and a high degree of crystallinity. Based on ICCD card Nos. 00-020-0548, 00-024-0072, and 01-073-8546, the main mineral phases are albite (d = 4.0458, 3.757, 3.215, and 3.1882) and hematite (d = 3.688, 2.702, 2.522, 2.210, 1.843, 1.697, and 1.488), and the minor mineral is augite (d = 2.1995). The structural phases and mineral proportions of the ceramic sample were analyzed using the Rietveld refinement technique.
Figure 5a–f provide the images of the microstructures of the volcanic ash and ceramic samples at different magnifications. The volcanic ash microstructure comprises a variety of particles with large and small aggregates and a mixture of nano- and microsized particles, none of which exhibit a clear shape. Meanwhile, the ceramic sample prepared at 950 °C shows a dense matrix devoid of distinct particle boundaries (Figure 5d–f). This phenomenon is due to the formation of a solid solution that can fuse particles of the mineral composition. These results are consistent with those of a previous study [25].

3.3. Dielectric and Electrical Properties

3.3.1. Dielectric Constants and Dielectric Losses

Numerous parameters, including the crystal phases, porosity, grain boundaries, chemical components, water content, and the melting temperature, affect the electrical and dielectric characteristics of ceramic materials. The study of dielectric behavior and parameters, including the dielectric constant and loss, in ceramics has attracted considerable interest in recent years because of its potential utility in energy storage. The complex dielectric permittivity (ε*) can be used to comprehend the polarization of materials. It is expressed as follows [26,27,28]:
ε * = ε     j ε
where the real (ε’) and imaginary ( j ε ) parts of the complex dielectric permittivity are the dielectric constant and dielectric loss, respectively. The sample’s dielectric constant (ε’), which represents the capacity of the materials to polarize or store electrical energy, was measured. Equation (2) expresses the relationship between the electrical capacitance (C) and the real component of the dielectric constant (ε’) [29]:
ε = Cd ε o A ,
where εo = 8.85 × 10⁻¹² F/m represents the free-space permittivity, d represents the thickness, and A represents the electrode area. The dielectric loss tangent D = tan δ = ε″/ε′ is the ratio between the dielectric constant ε′ and dielectric loss ε″. The dielectric constant and dielectric loss can be determined using the following formula [28,30,31]:
ε = ε   D
(i).
Frequency-dependent dielectric analysis
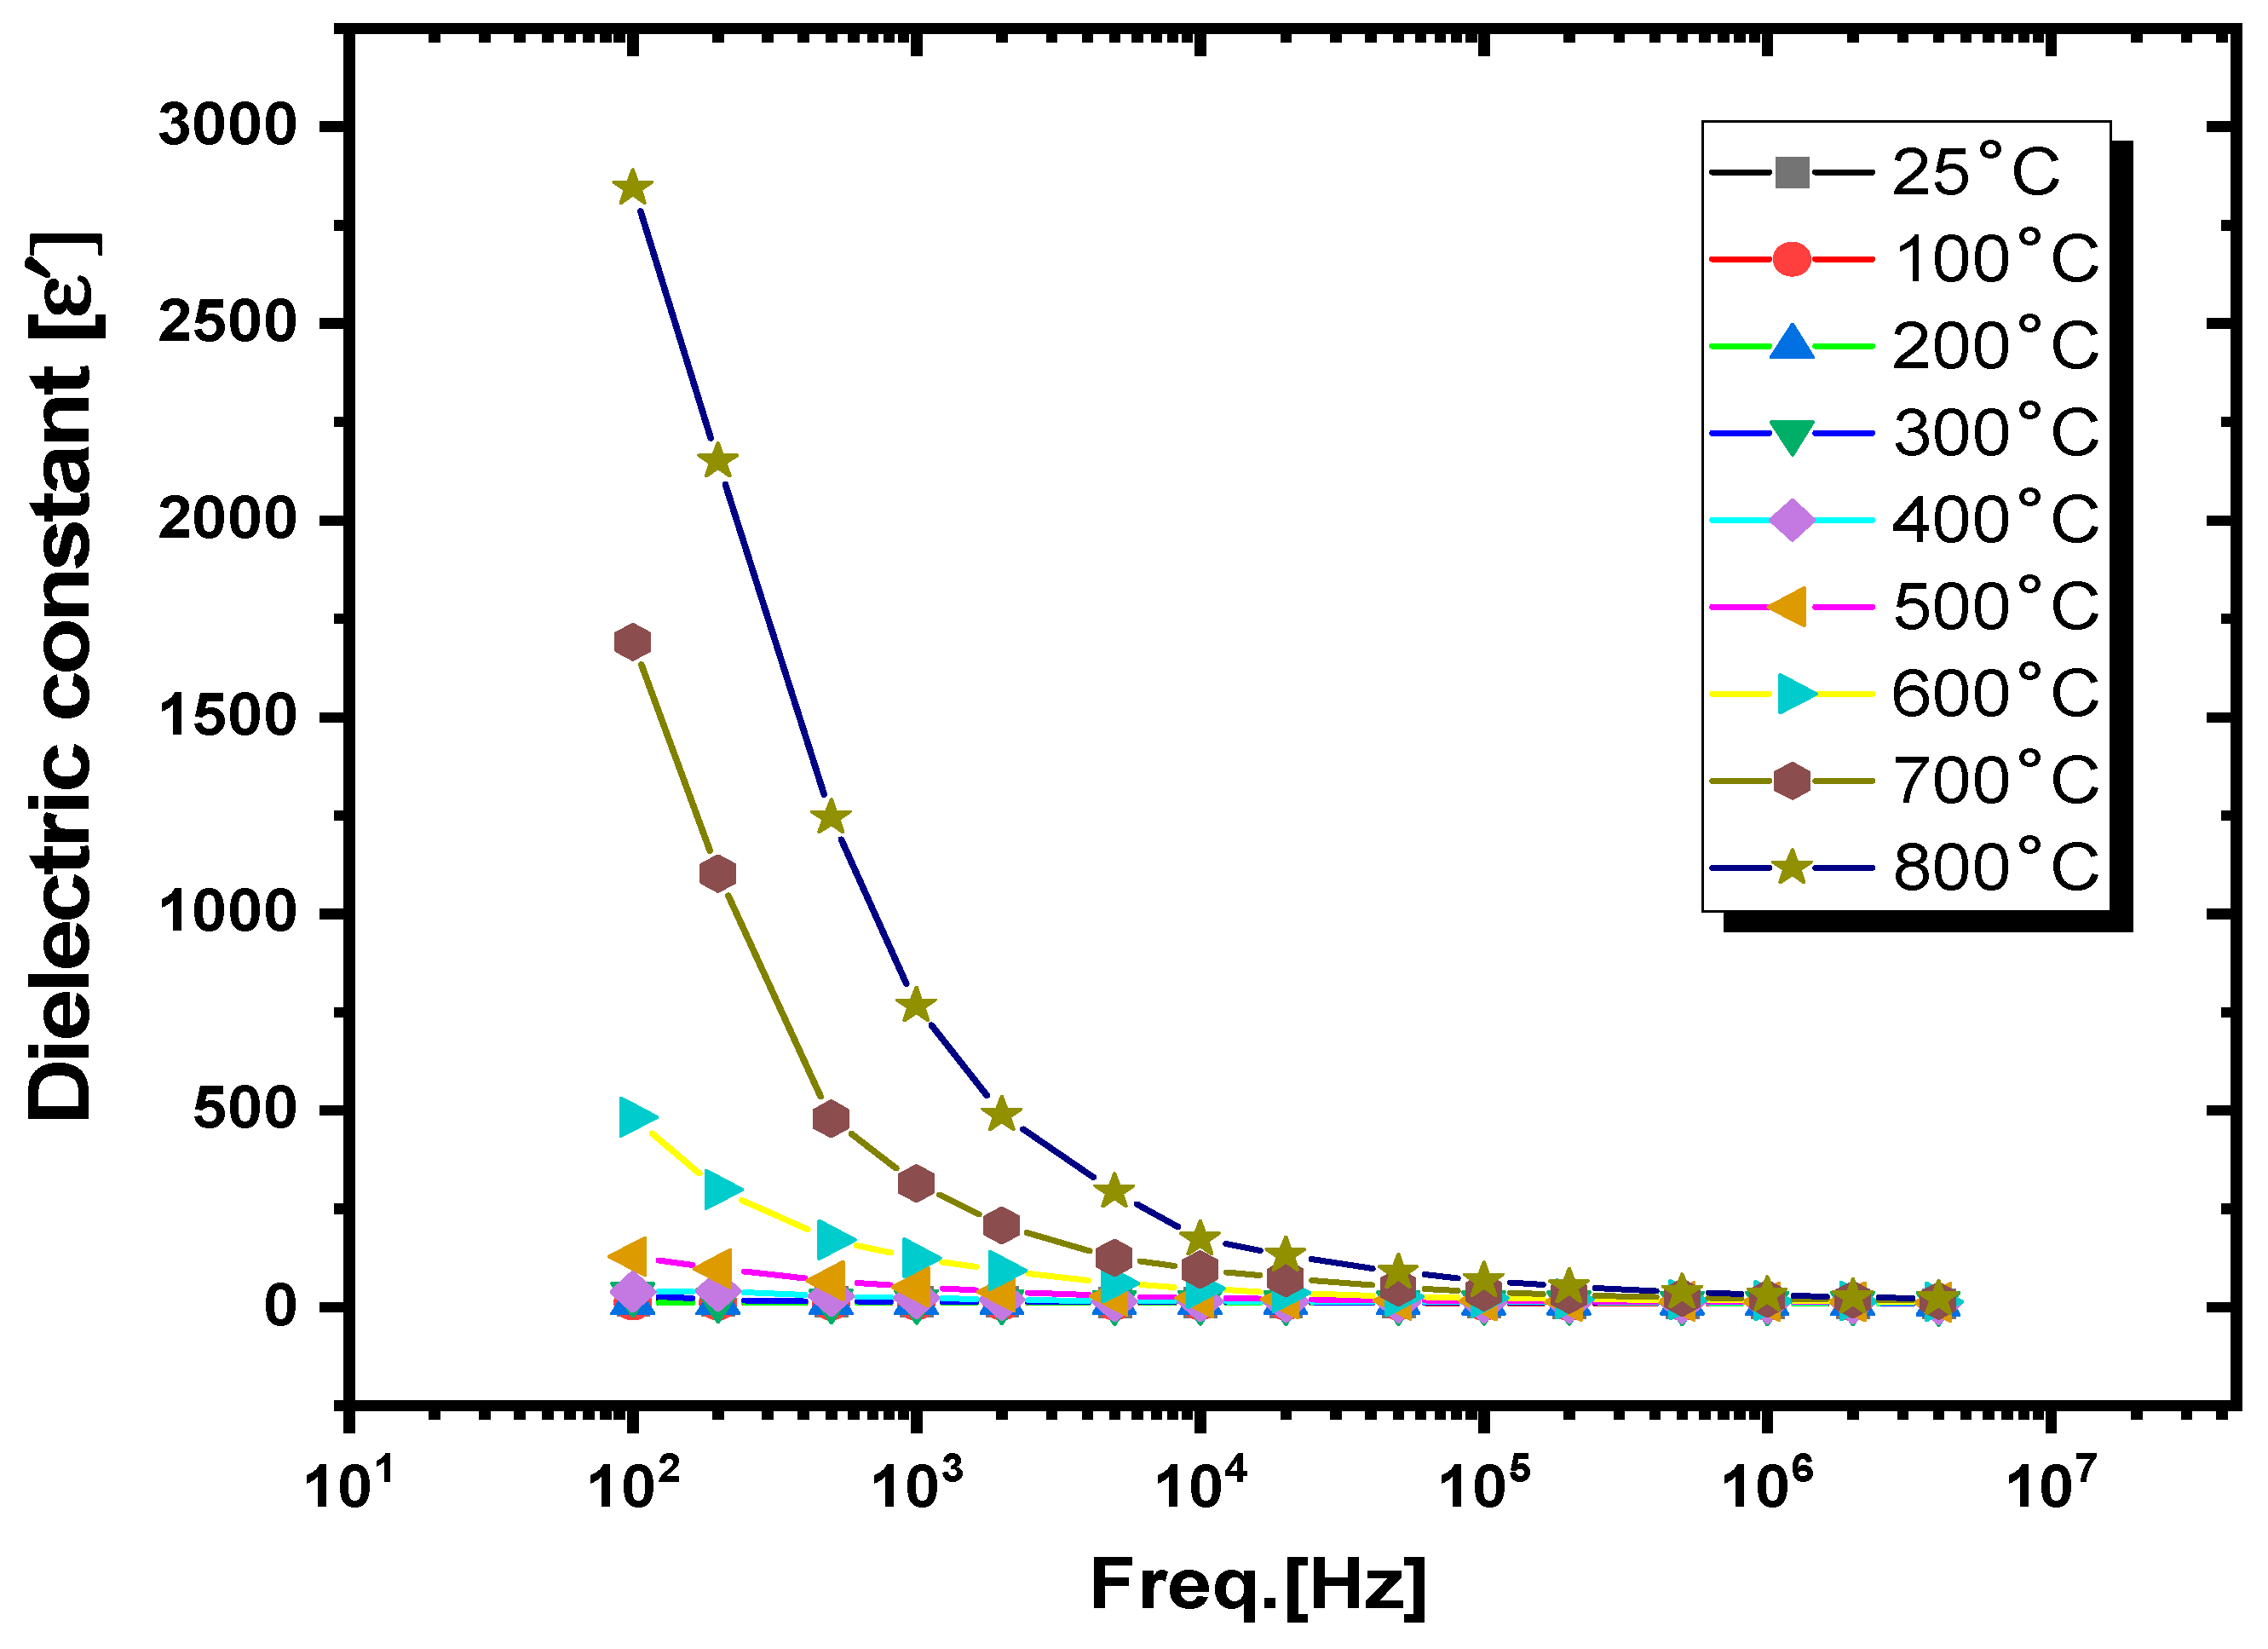
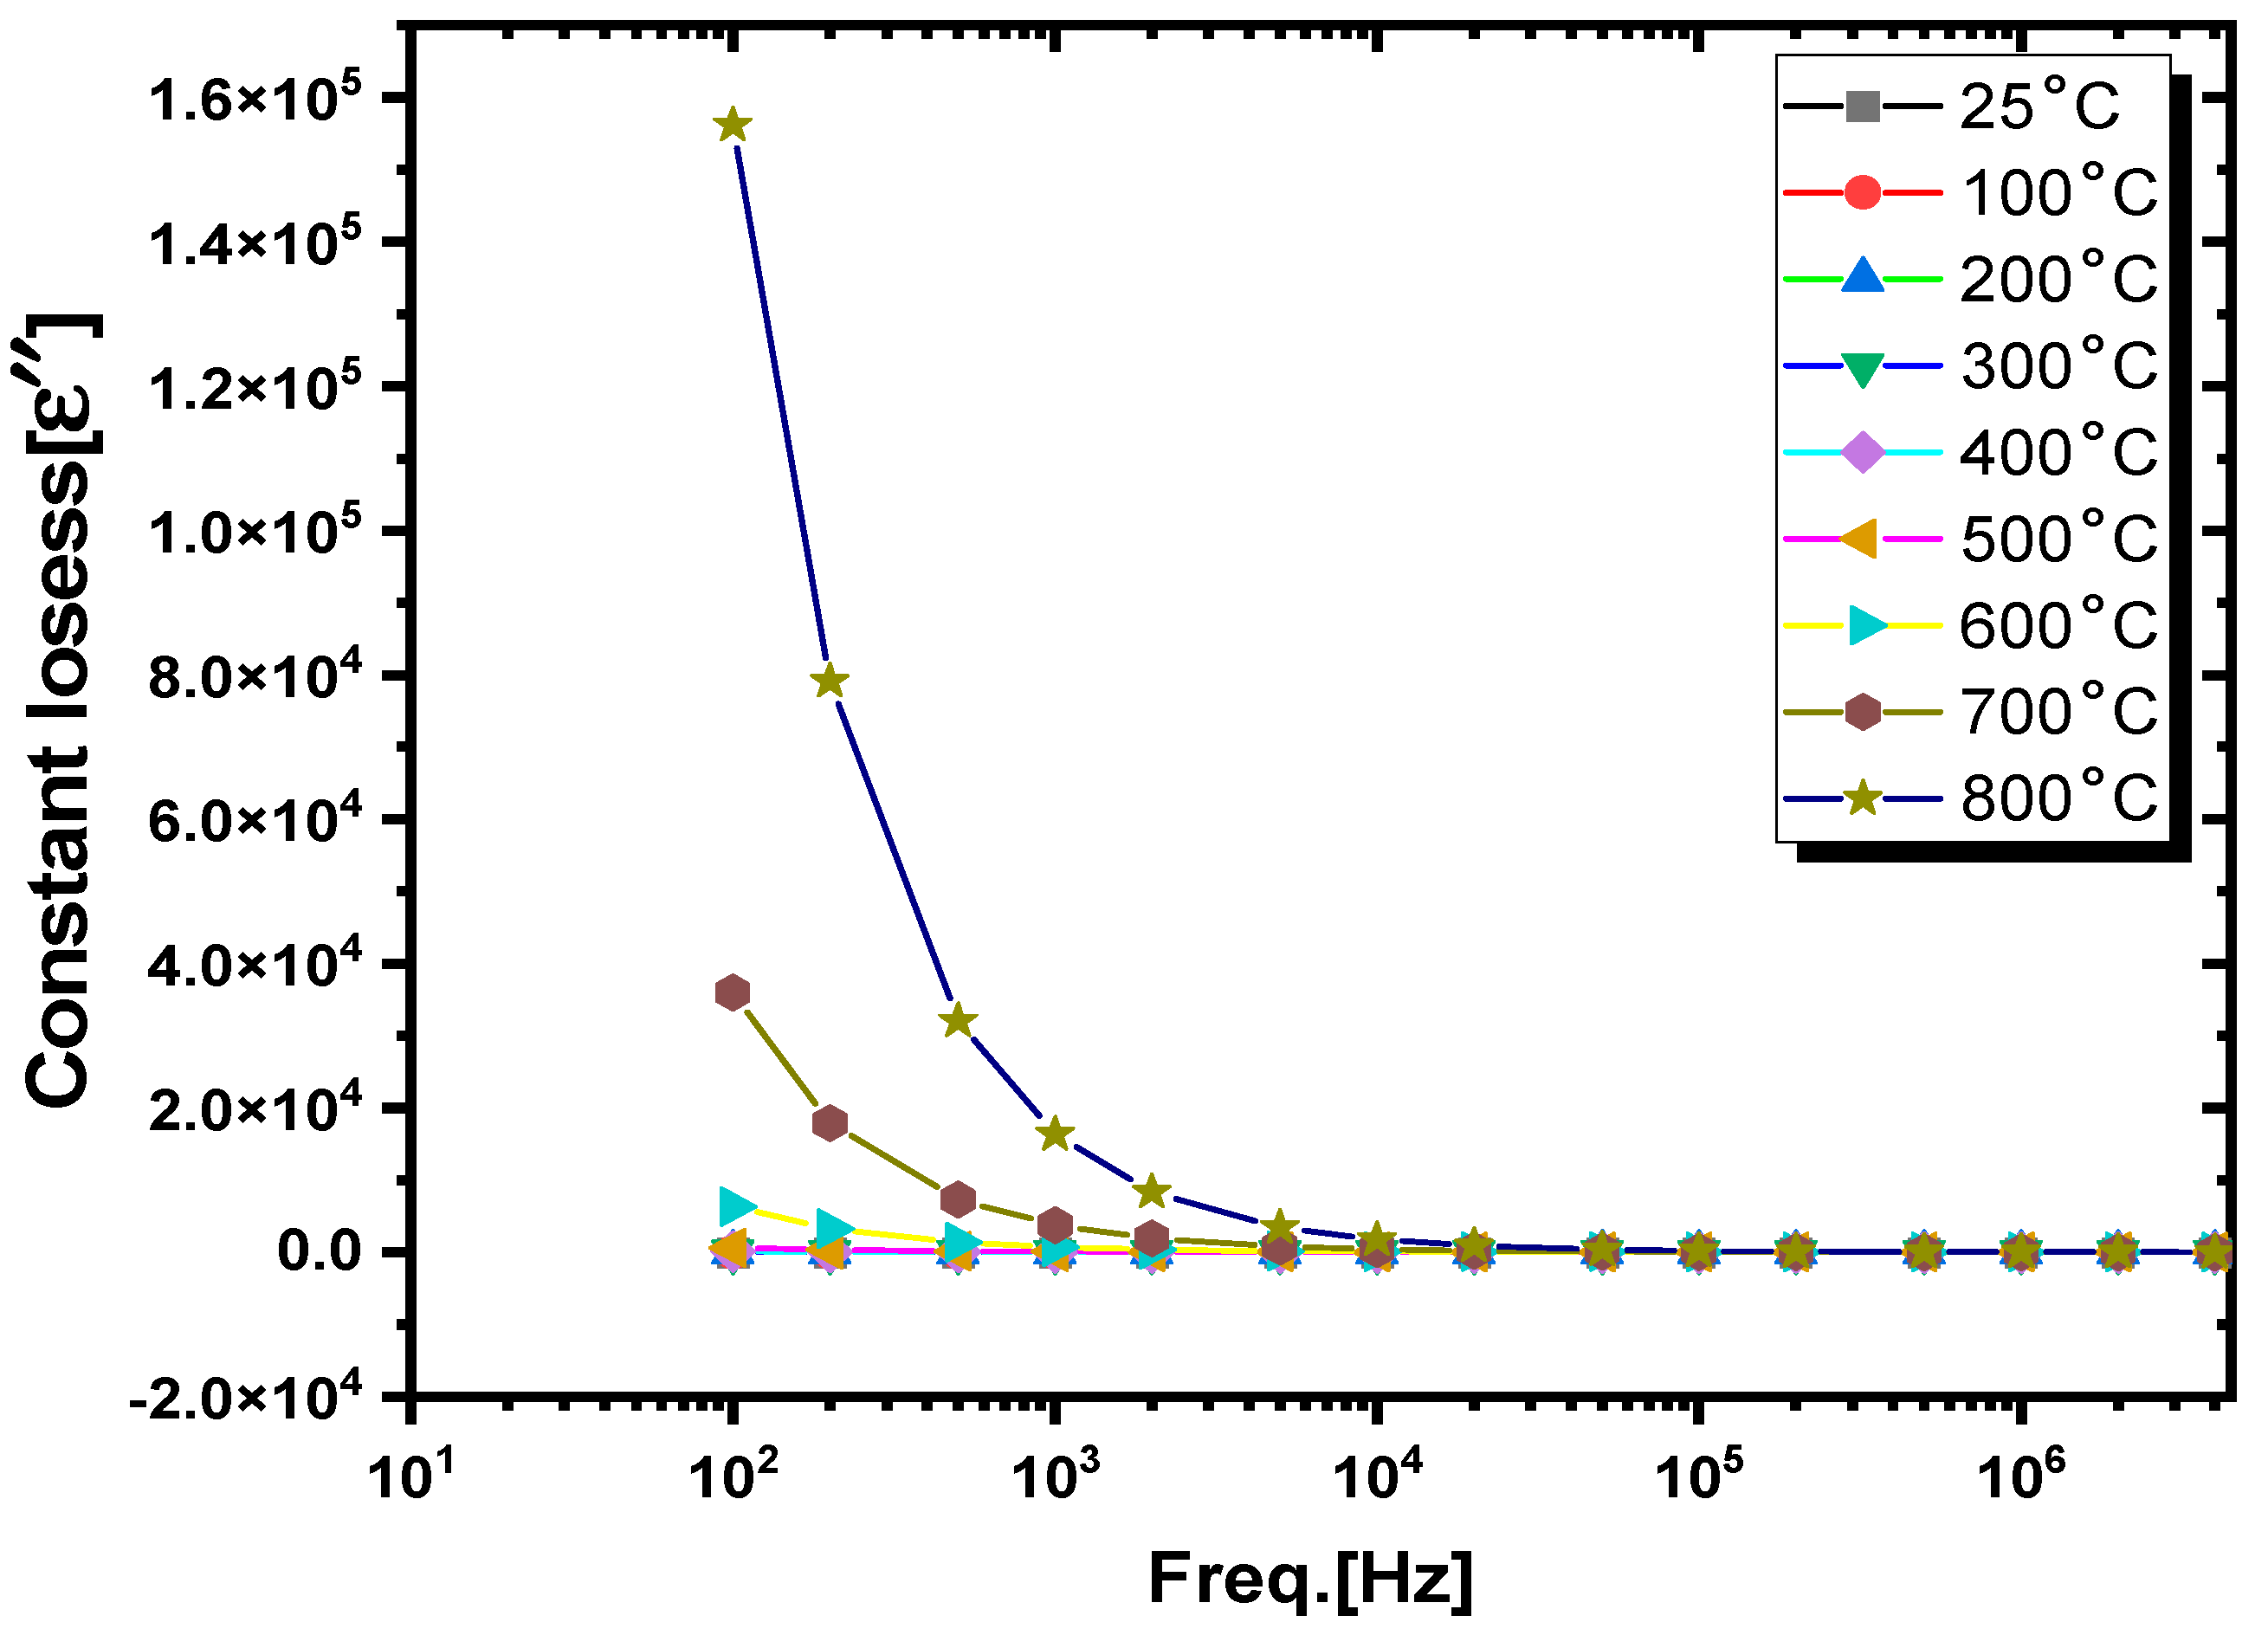
Figure 6 and Figure 7 show how the dielectric constants and dielectric losses of the samples vary with frequency at different temperatures. The dielectric constant shows a high value at low frequencies and a progressive reduction with increasing frequency until it approaches a plateau at high frequencies. This result is explained by the fact that all polarization processes take place mostly in the low-frequency range, which results in full polarization when an electric field is applied. Moreover, the high dielectric constant values in the low-frequency region are maintained by the buildup of charges at the interface and the amplification of polarization. As the frequency is increased to over 10 kHz, the space charge polarization decreases and becomes insignificant due to the inertia of the rapidly moving ions (dipoles) and the small value of the dielectric constant [32]. This finding is consistent with Koops’ theory, which states that the presence of several polarization processes is the reason why a composite system’s dielectric constant has a large value at low frequencies. In the presence of an electric field, these processes help induce full polarization, which results in the buildup of charges at the interface and intensified polarization. The dielectric constant, however, decreases as the frequency increases because the dipoles of the composite system are unable to react rapidly enough to the electric field. This phenomenon is explained by the heterogeneous conduction mechanism of the composite system, which results in space charge polarization [32]. A frequency-independent dielectric constant results from a decrease in space charge polarization when the frequency increases to over 10 kHz. Free dipoles oscillating in a comparable field are associated with the modified Debye law. At lower frequencies, the measurements and dipole relaxation time follow the field; at higher frequencies, the dipoles do not follow the oscillatory field. Strongly conducting grains with weakly conducting grain borders are required for a medium to be a dielectric. However, the grains seem to be more effective at higher frequencies, and the grain boundaries often have a significant impact in the low-frequency range. It takes more energy to move charge carriers at low frequencies. Due to the high resistance of the material, the charge carriers cluster close to the grain boundary, which raises the dielectric constant in this area. In the high-frequency region, the energy needed to move the charge carriers is lower because of the low resistance supplied by the grains. Consequently, the dielectric constant is quite low at high frequencies [32].
(ii).
Temperature-dependent dielectric analysis
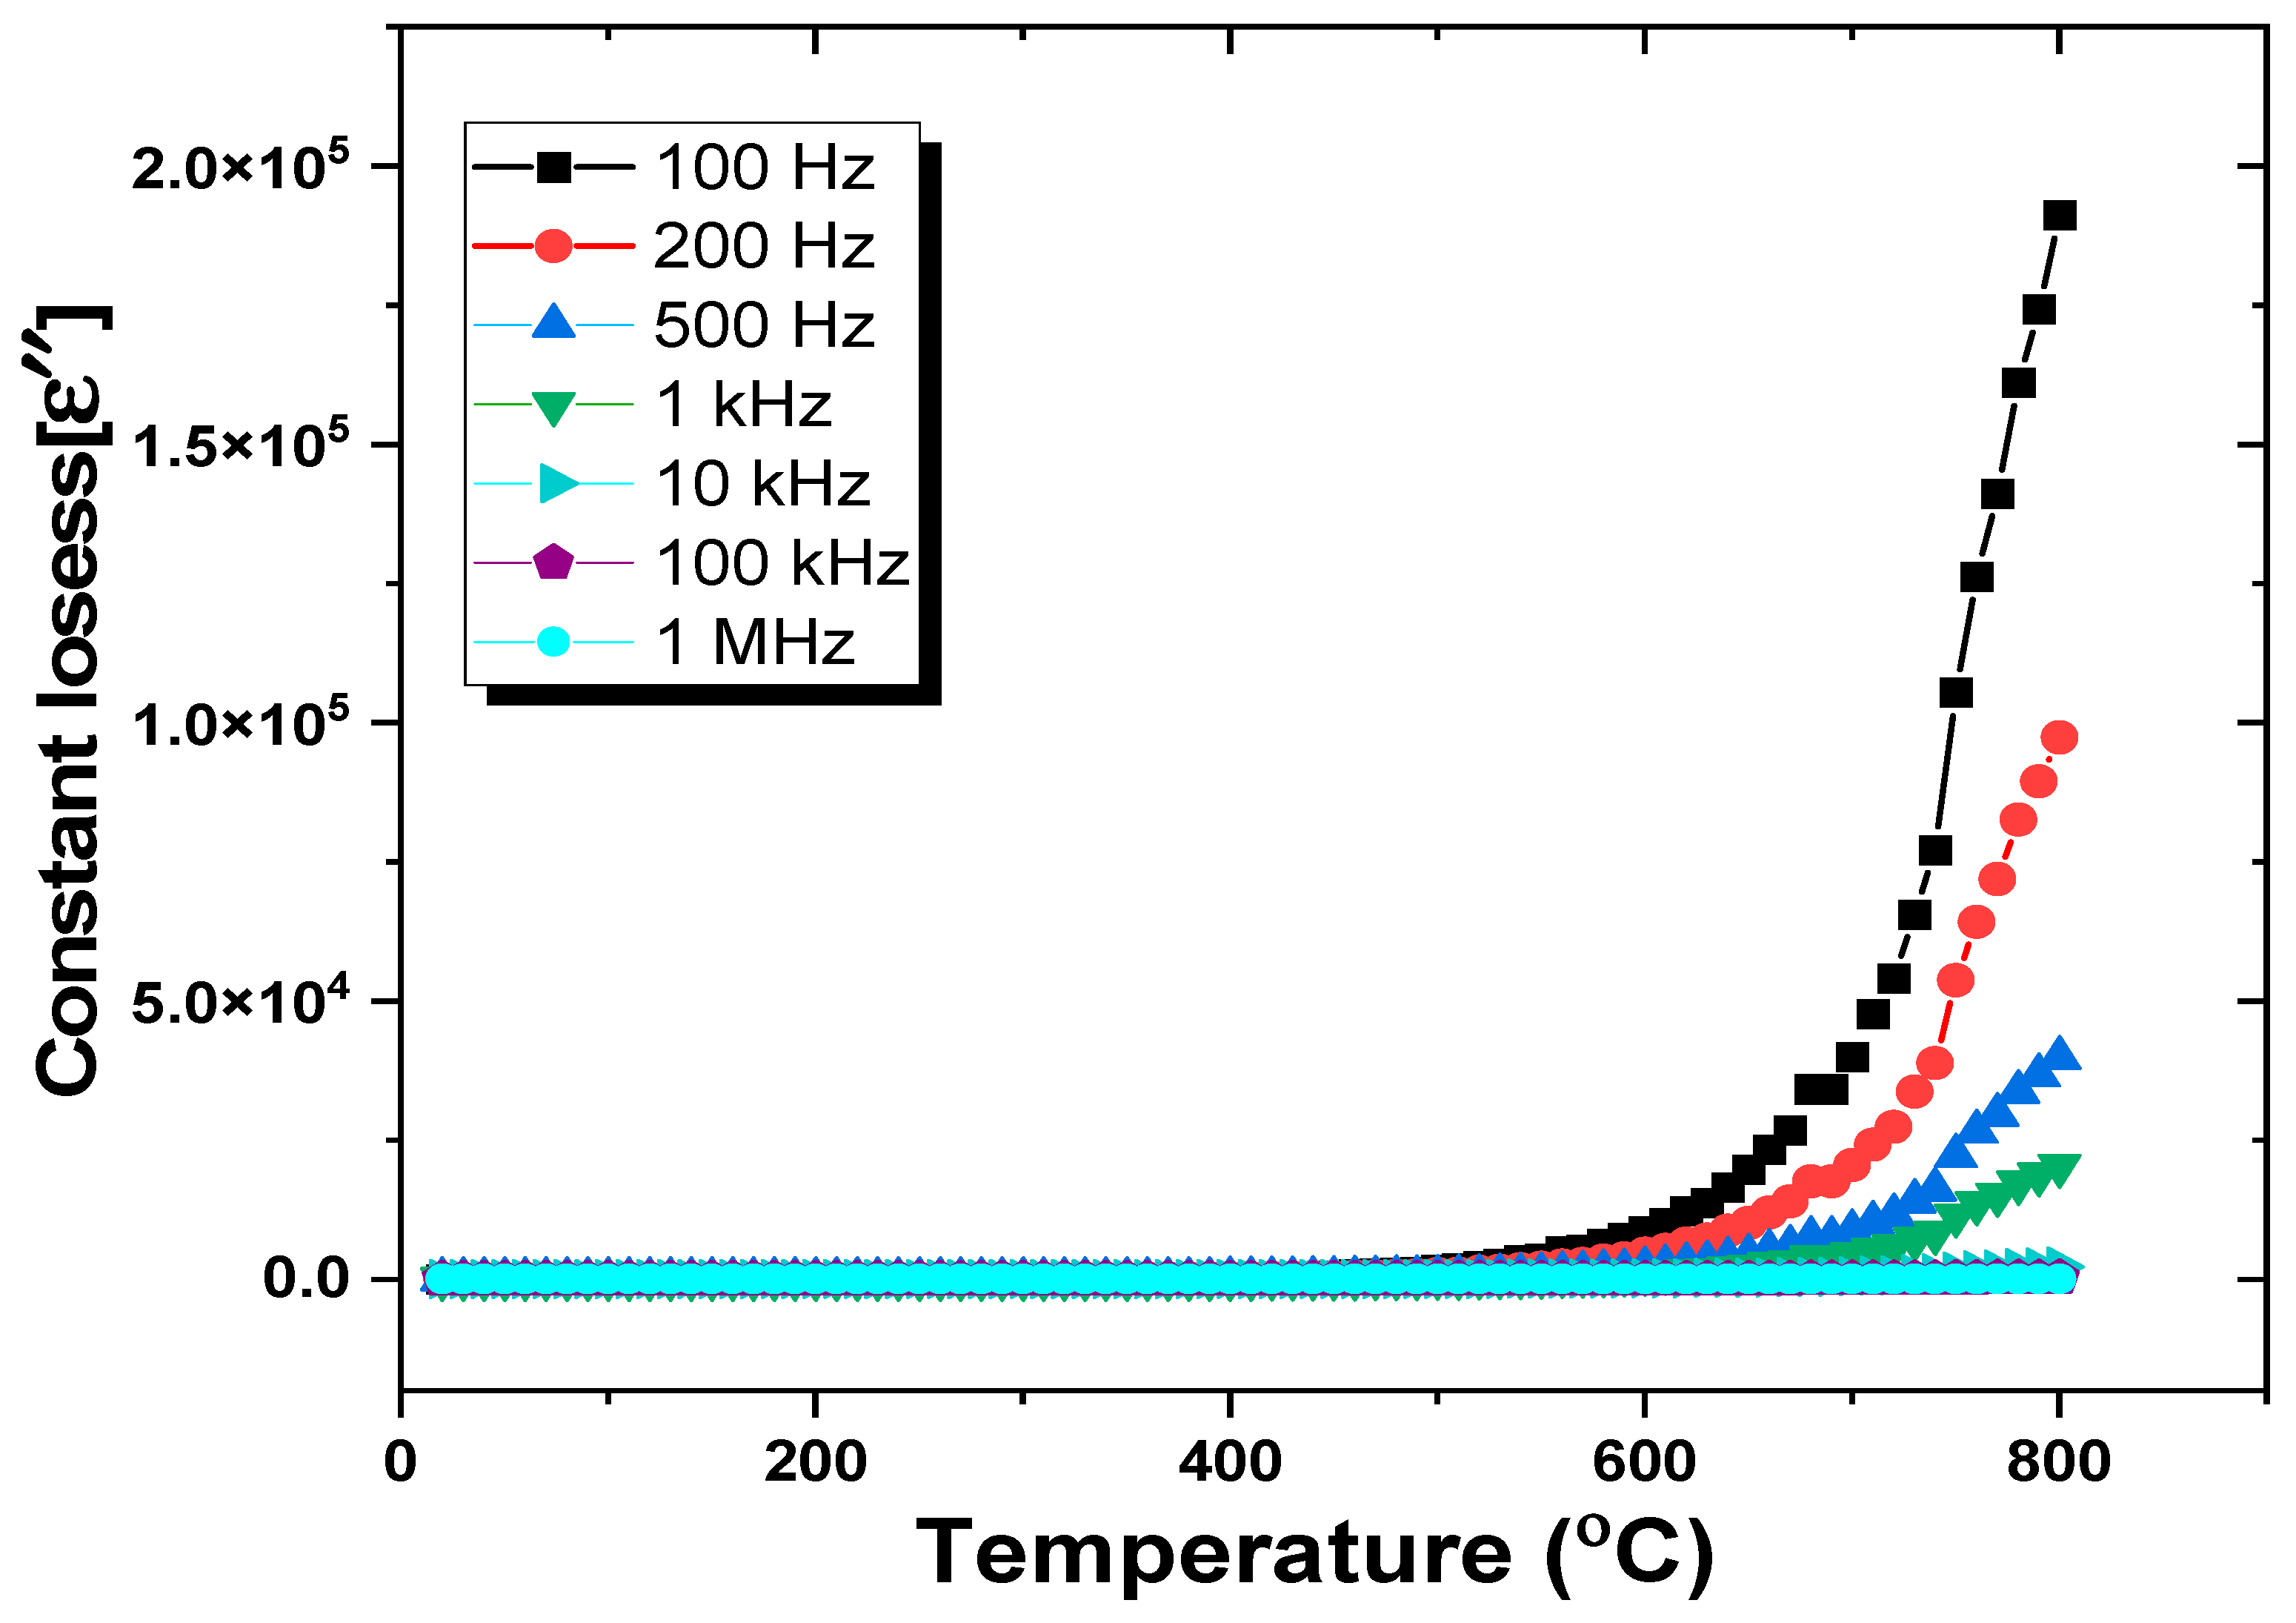
Figure 8 and Figure 9 show how the dielectric constants and dielectric losses of the ceramic samples vary with temperature at different frequencies. The behaviors of the dielectric constant and dielectric loss curves remain unchanged as the temperature increases from RT to 500 °C at all applied frequencies. The dielectric loss and dielectric constant seemed to be frequency- and temperature-independent within this temperature range. This finding indicates that the dielectric characteristics of the samples exhibit outstanding thermal stability within these temperature and frequency ranges. However, the dielectric constant and dielectric loss curves begin at approximately 500 °C and continue until 800 °C, especially at low frequencies. The dielectric loss and dielectric constant in this area appear to be temperature-dependent, although they decrease as the frequency increases. The dielectric constant has a large value at low frequencies due to the contributions of the dipolar and interfacial polarization, but at higher frequencies, only electronic polarization contributes to the dielectric constants [32]. At lower temperatures, the dielectric constants and dielectric losses seem to be lower, indicating that the contributions of the ionic and electronic components to all polarizabilities could be minimal and constant [33]. However, an increase in the dielectric constant, which indicates the alignment of dipoles, may become easier at lower frequencies and higher temperatures [25,33]. Furthermore, an increase in temperature appears to act as a pumping force, releasing trapped charge carriers and increasing the charge carrier mobility, thereby enhancing the polarization, conductivity, and dielectric constant of the sample [25]. However, the dielectric constants eventually decrease at higher temperatures due to an increase in the thermal oscillation of the molecules and an increase in the degree of disorder of dipoles. The dipoles cannot rapidly realign themselves in response to a fast-applied field (higher frequency) [34,35]. This result has been reported by numerous authors [25,34,35]. Table 1 displays the values of the dielectric constant for selected frequencies measured at different temperatures. The results indicate that the dielectric constant decreases as the frequency increases and almost becomes frequency-independent at 103 Hz.

3.3.2. Tangent Dielectric Loss Study

(i).
Frequency-dependent dielectric analysis
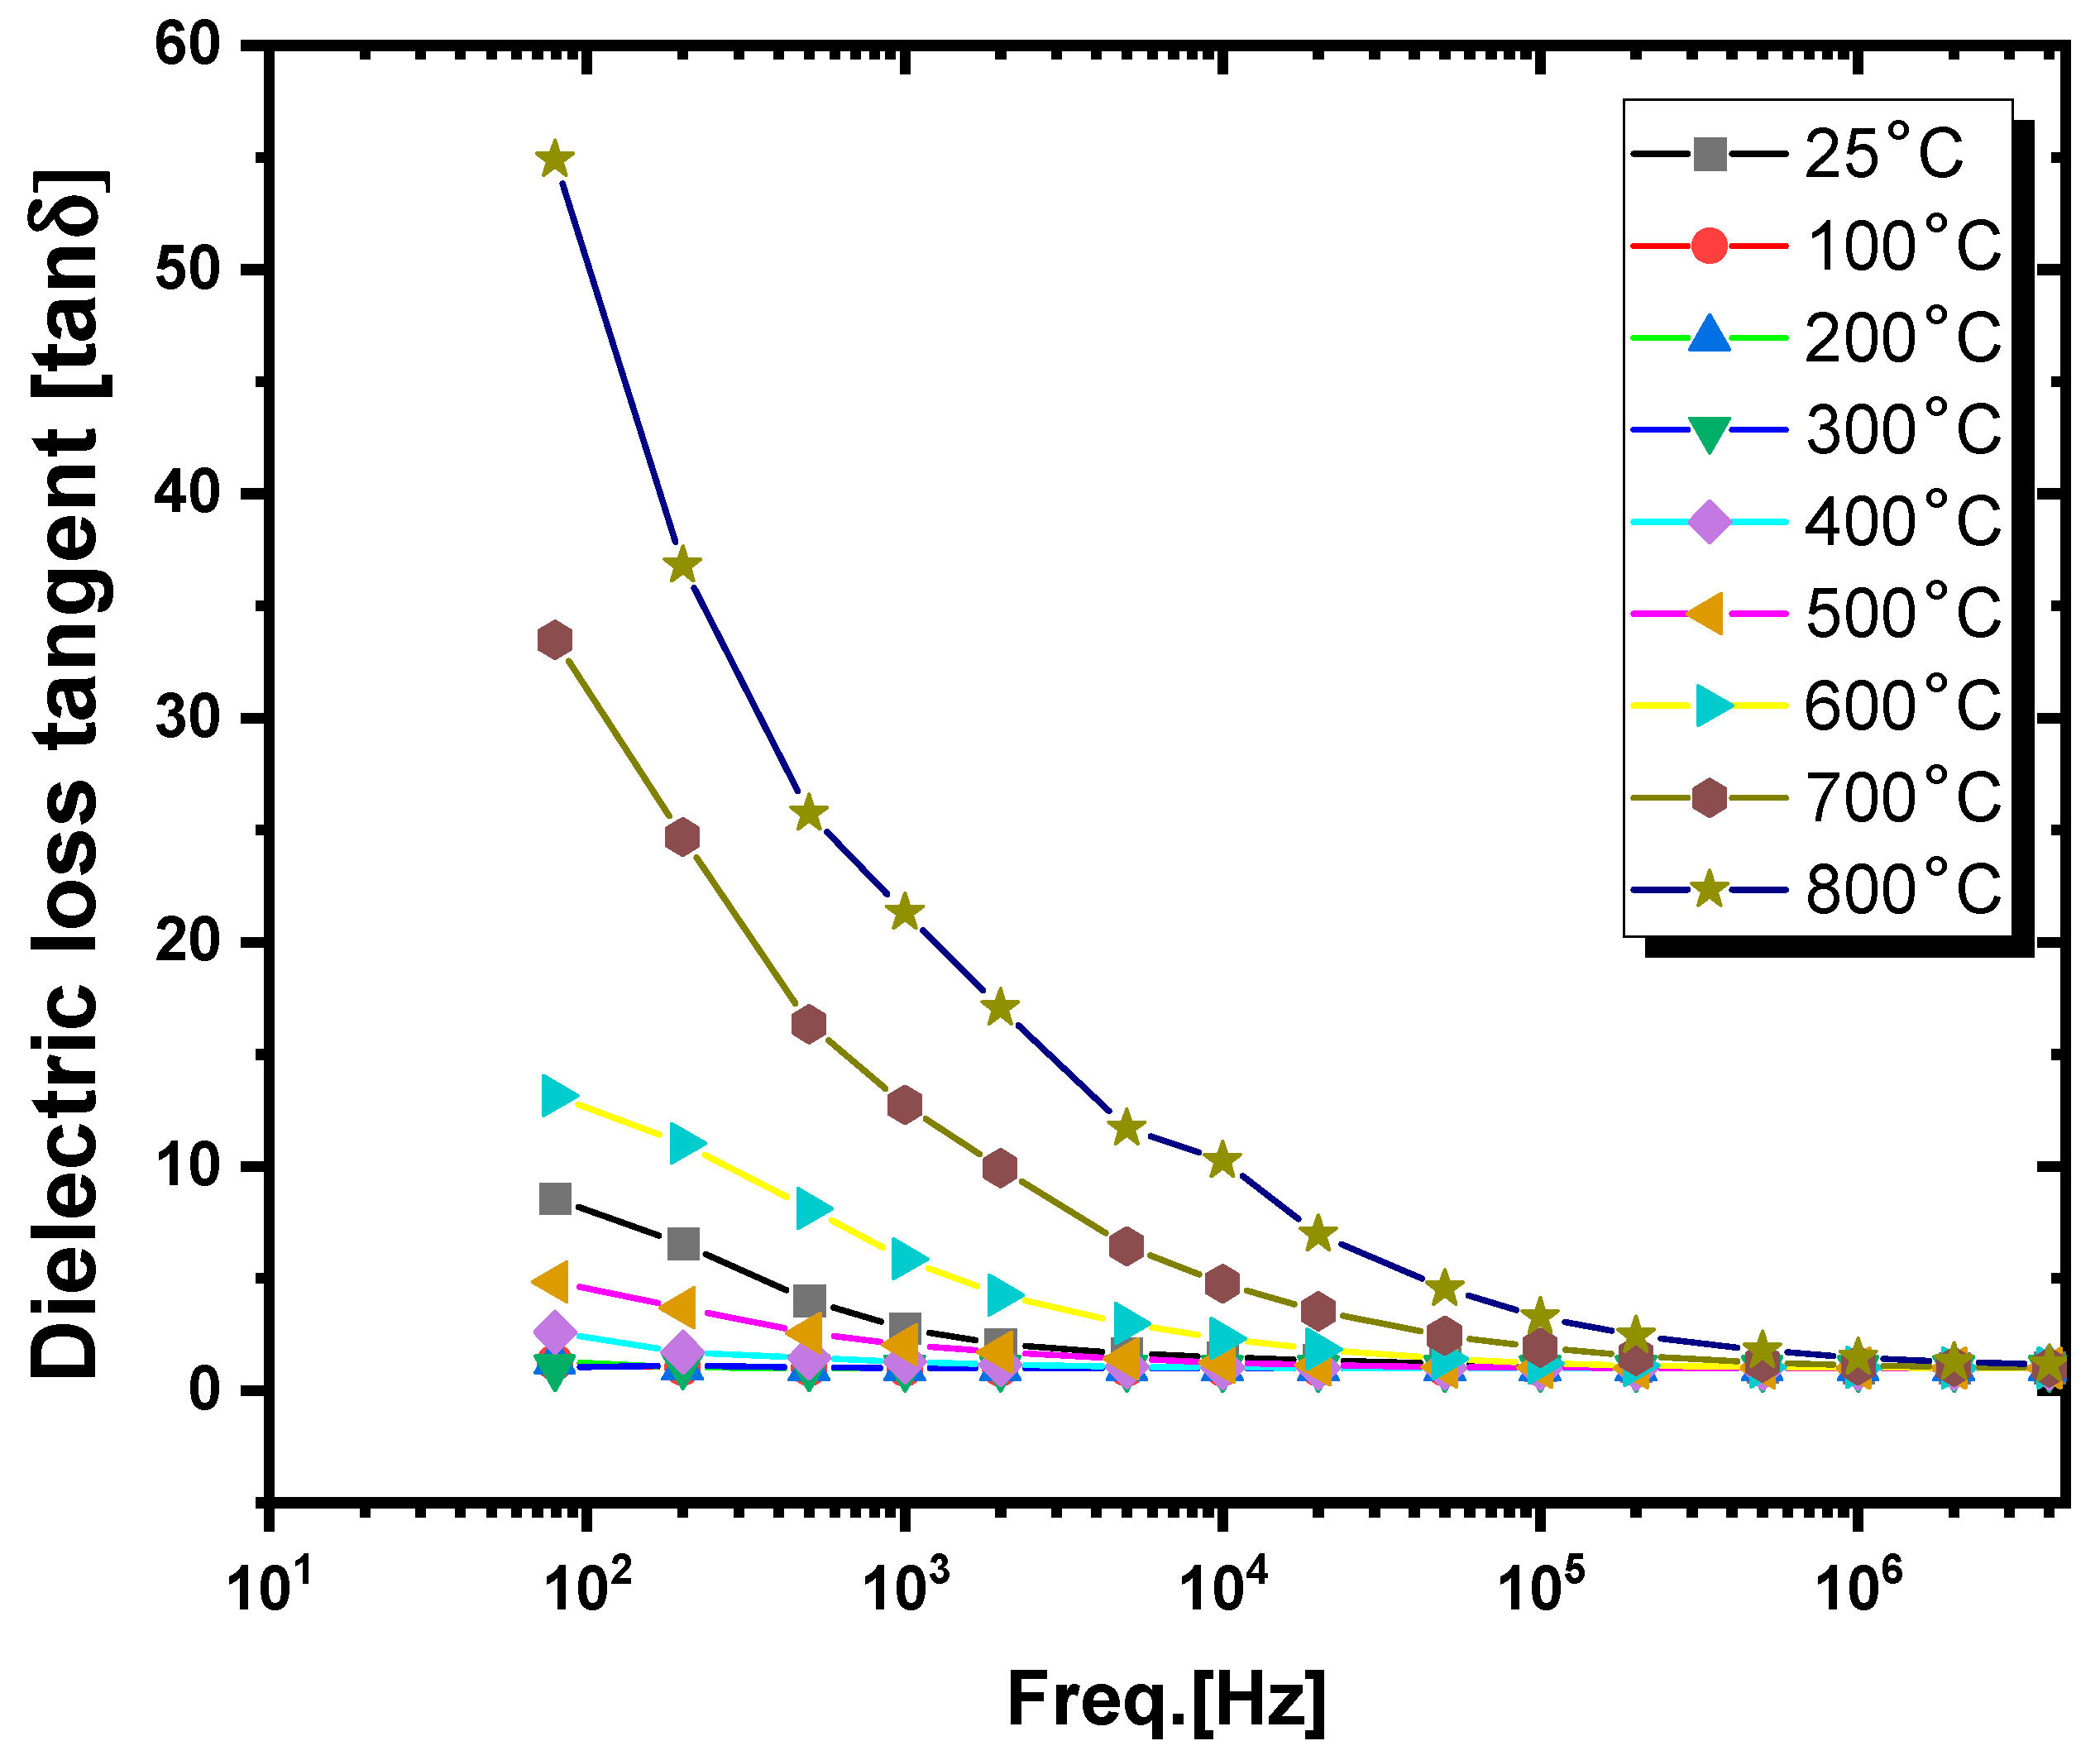
The tangent curves for the dielectric loss versus the applied frequency at various temperatures are shown in Figure 10. The tan δ values decrease in the presence of an AC electric field, and they exhibit frequency-independent behavior at higher frequencies. This trend may be explained by the theory that higher energy is needed for electron hopping between ions in the low-frequency region, where weakly conducting grain boundaries are much more effective, resulting in higher losses. Nonetheless, a small amount of energy dissipation is caused by electron interaction between ions in the high-frequency region, which is associated with strongly conducting grains [32]. Moreover, the value of the loss tangent increases with temperature. The rate of rise in tan δ is slow at low temperatures, but it increases noticeably faster at high ones. Tan δ has a high value in this region because charge carriers crossing the grain boundary at low frequencies lose a lot of energy, but the resistance is low in the high-frequency range. Conversely, the tangent loss indicates the energy required by the applied field to align the dipole. The tangent loss is influenced by the grain size, DC conductivity, and oxygen vacancies [32].
(ii).
Temperature-dependent dielectric analysis
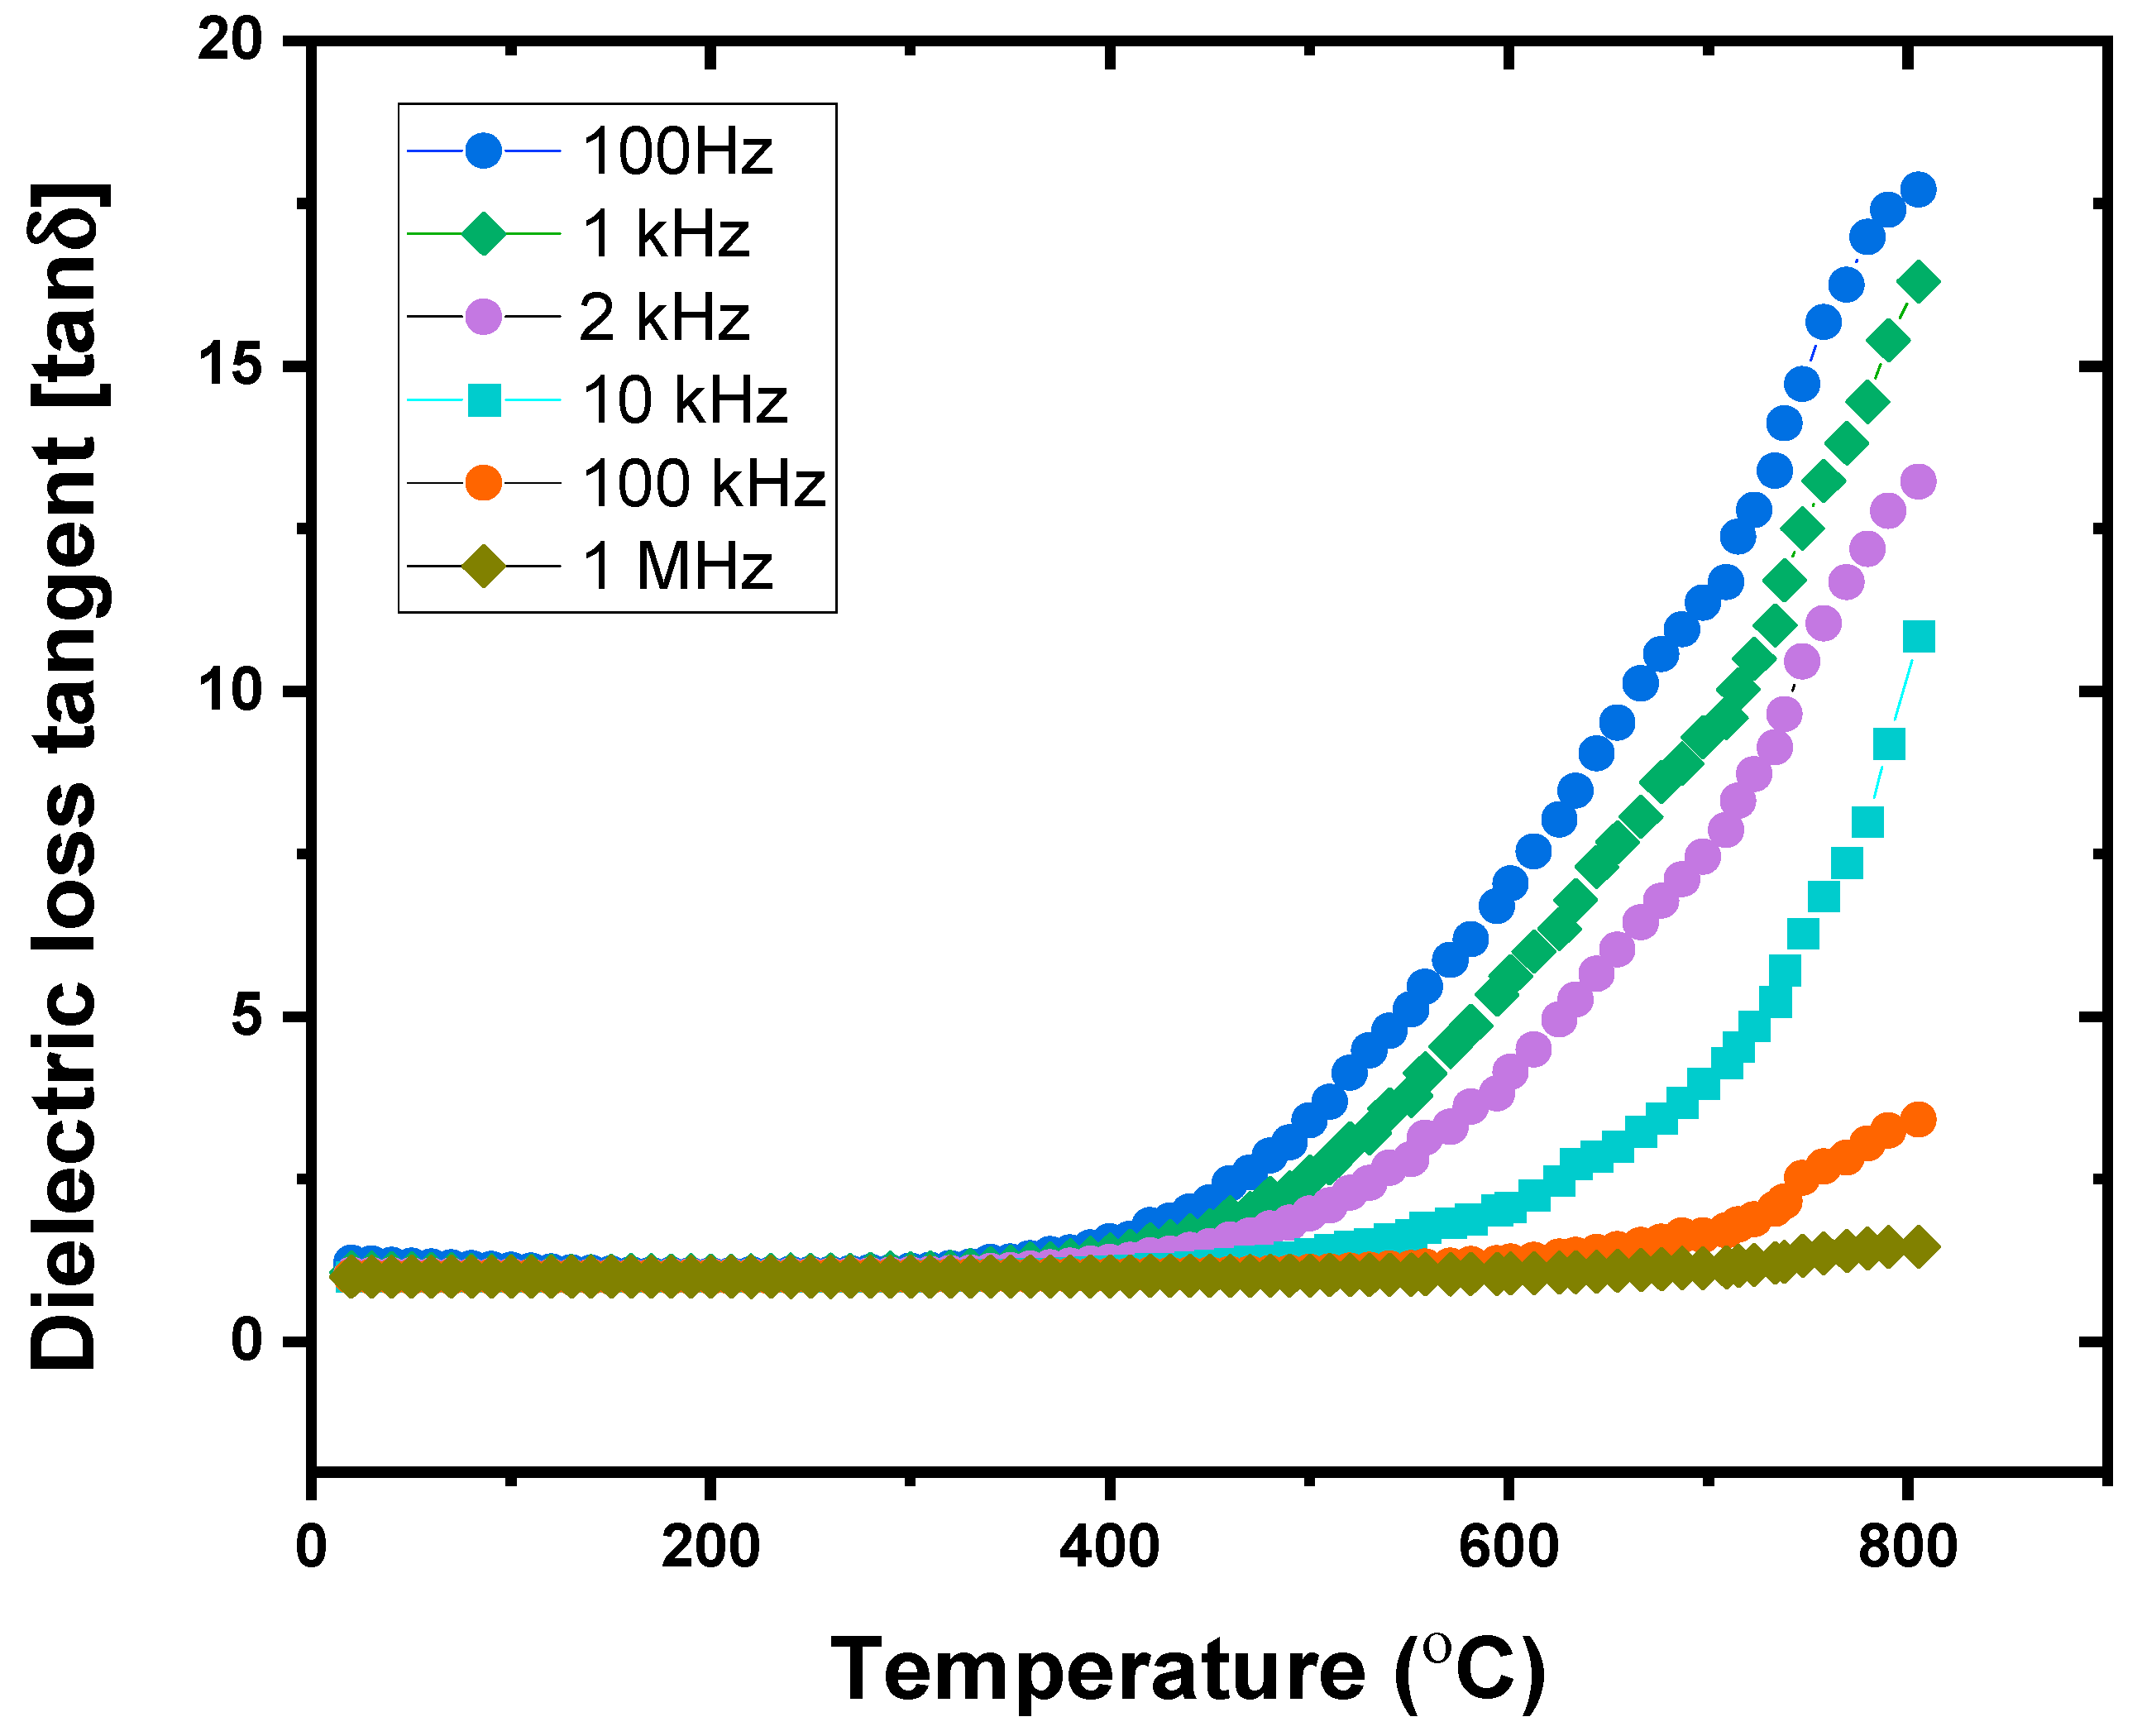
The tangent curves for the dielectric loss versus temperature at different applied frequencies are shown in Figure 11. Up to 500 °C, the curves exhibit stable behavior, above which the dielectric loss tangent increases with the temperature. Nevertheless, at high temperatures, the dielectric loss tangent decreases as the frequency increases. This finding is reasonable considering that the dielectric constant exhibits similar characteristics. The authors noted in a previous study [30] that as the dielectric constant increases (indicating an increase in energy storage capacity), so does the dielectric loss (indicating an increase in energy dissipation). This increase in tan δ is the most pronounced at high temperatures and low frequencies due to the high electrical conductivity. As a result, at these temperatures, the electric dipole motion is at its greatest, and the primary mechanism underlying ionic conductivity in this system is charge carrier mobility [32]. The tangent δ is slower in the low-temperature region and faster in the high-temperature region, suggesting the presence of unknown imperfections, e.g., oxygen vacancies, as well as the distribution of charge carriers in the sample [32]. The relaxation temperature of the sample was observed to be approximately 680 °C at all the applied frequencies, according to the dielectric loss tangent curves. Hematite undergoes a phase transition from a canted antiferromagnet to a paramagnetic phase at this relaxation temperature, which is also known as the hematite Néel temperature [36,37].

3.3.3. AC Conductivity Study

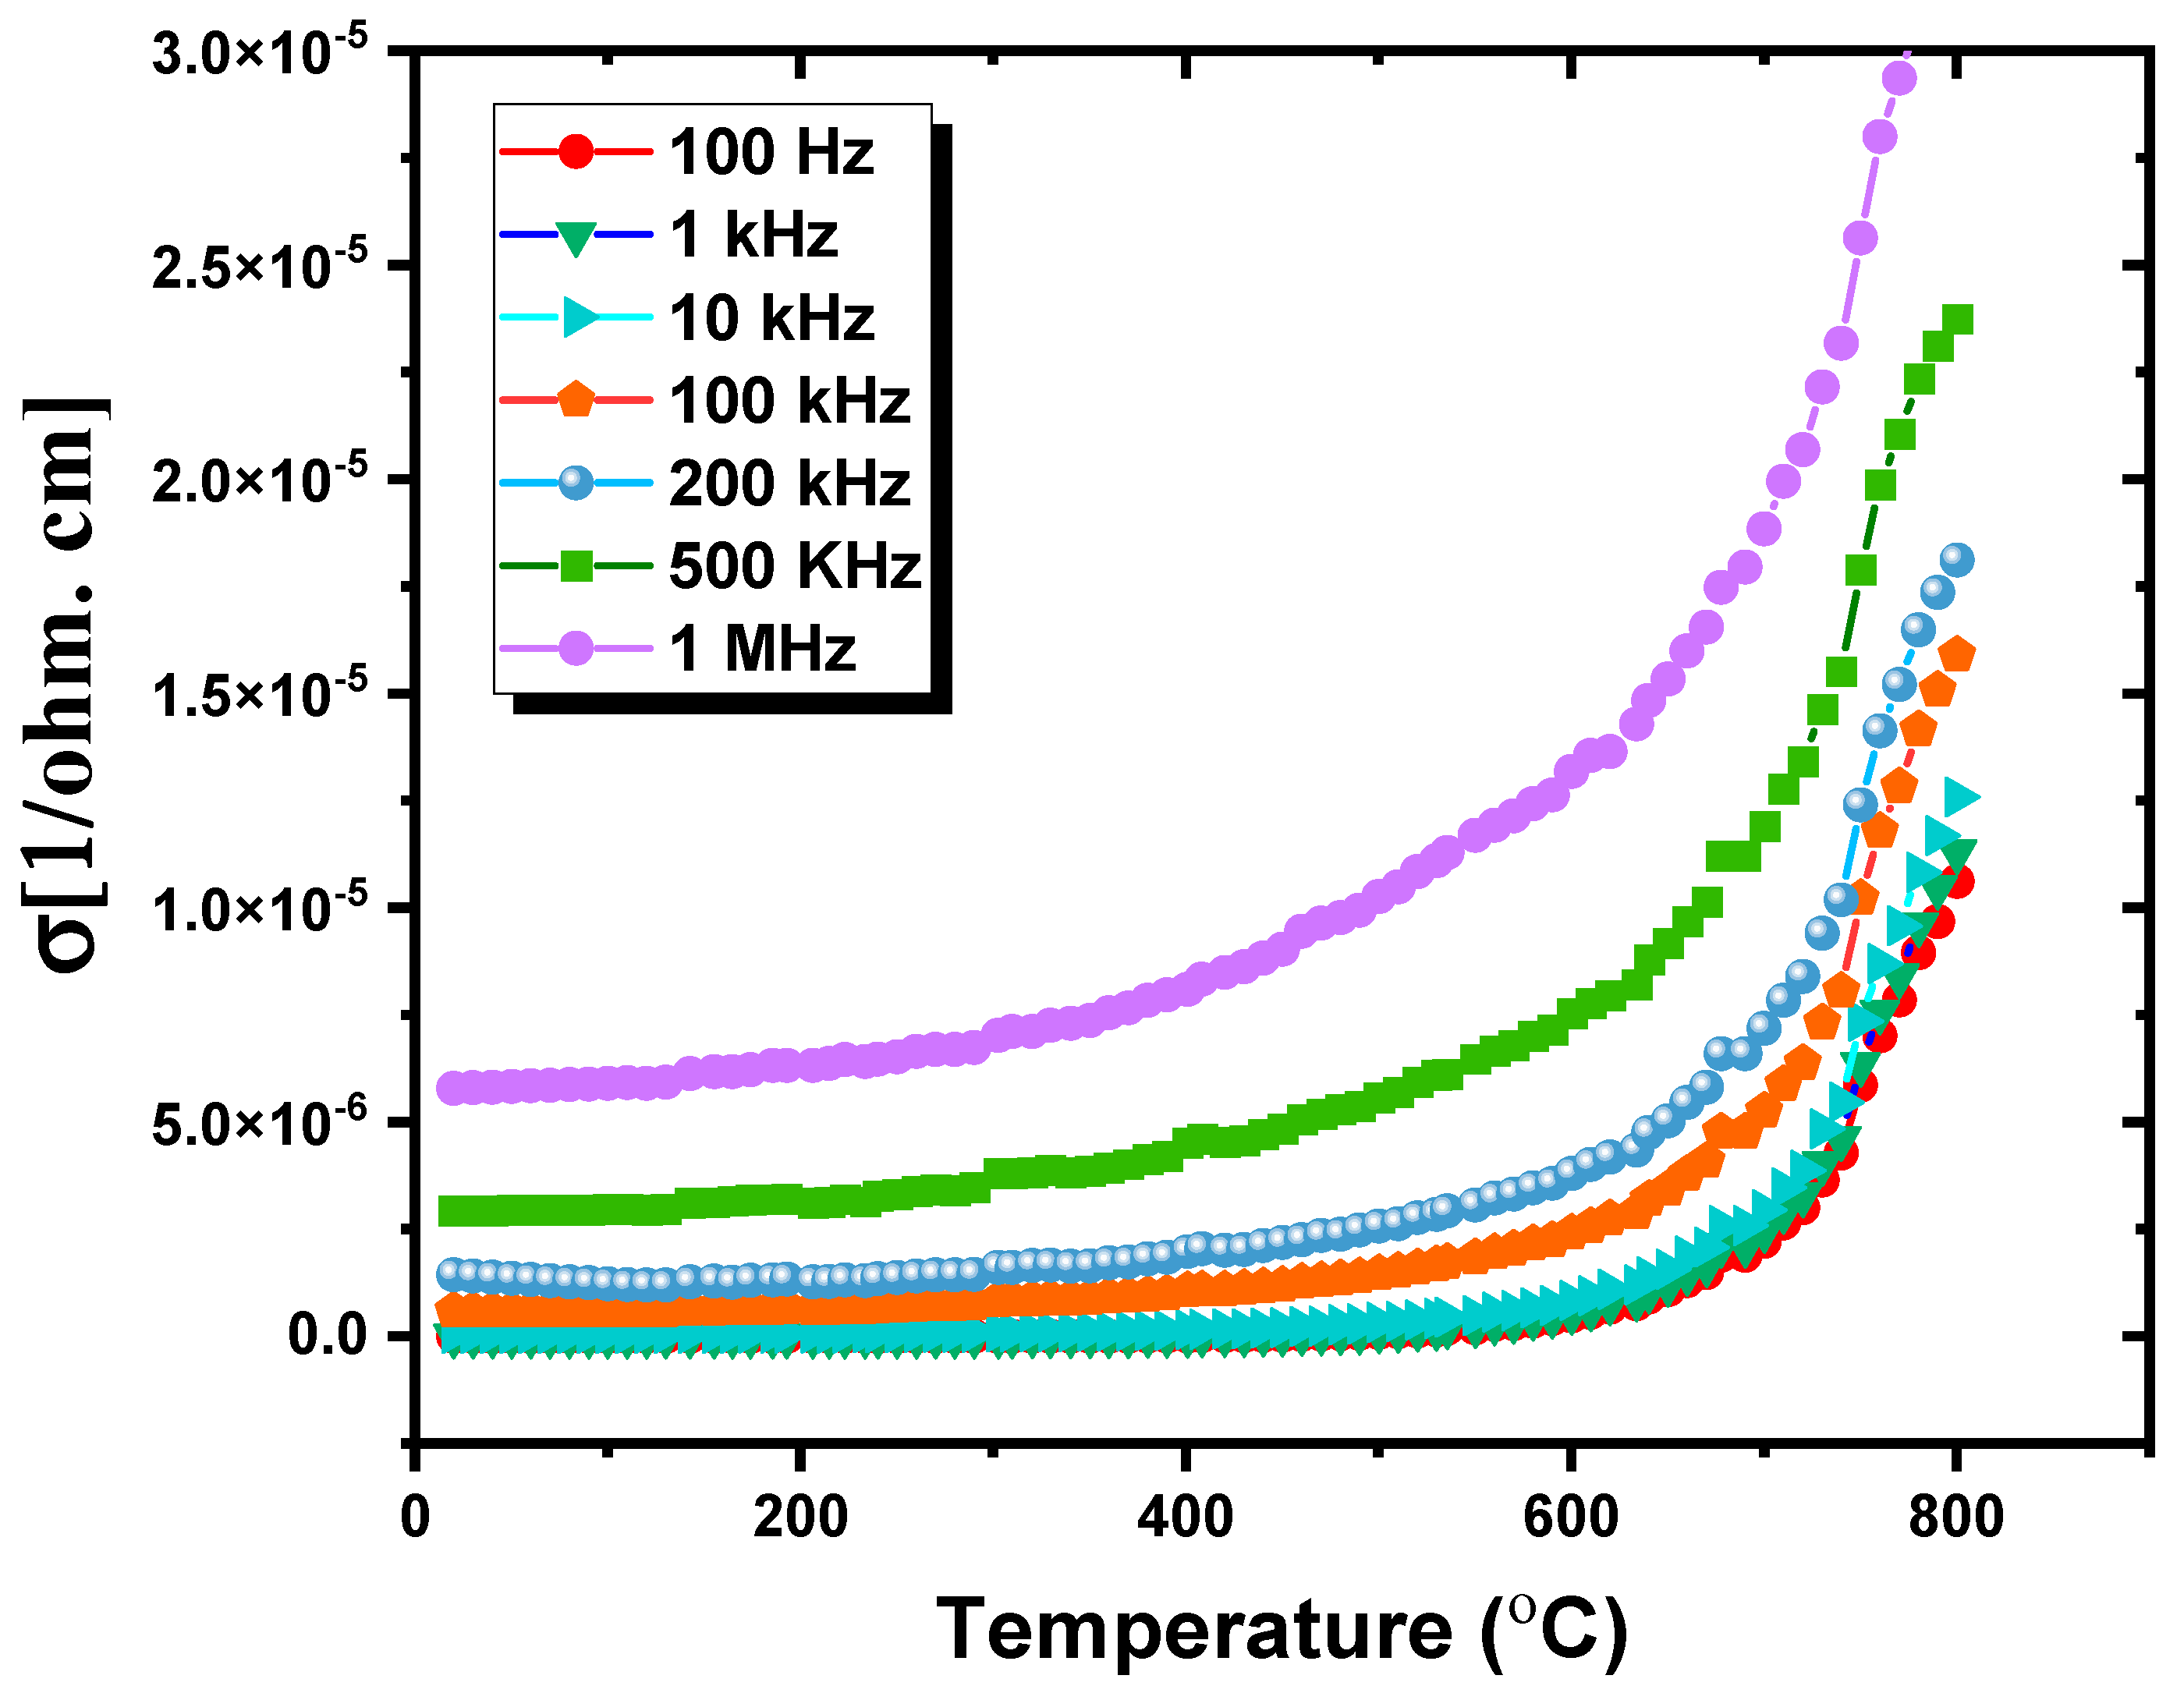
The AC conductivities of the ceramic samples were measured at frequencies ranging from 500 Hz to 4 MHz and temperatures ranging from RT to 800 °C. The AC conductivity significantly affects the electrical performance of the sample and typically increases with the concentration density and/or free-charge carrier mobility. Equation (4) describes the relationship between the dielectric loss ε″ and the conductivity σac [38]:
σac = εoωε″
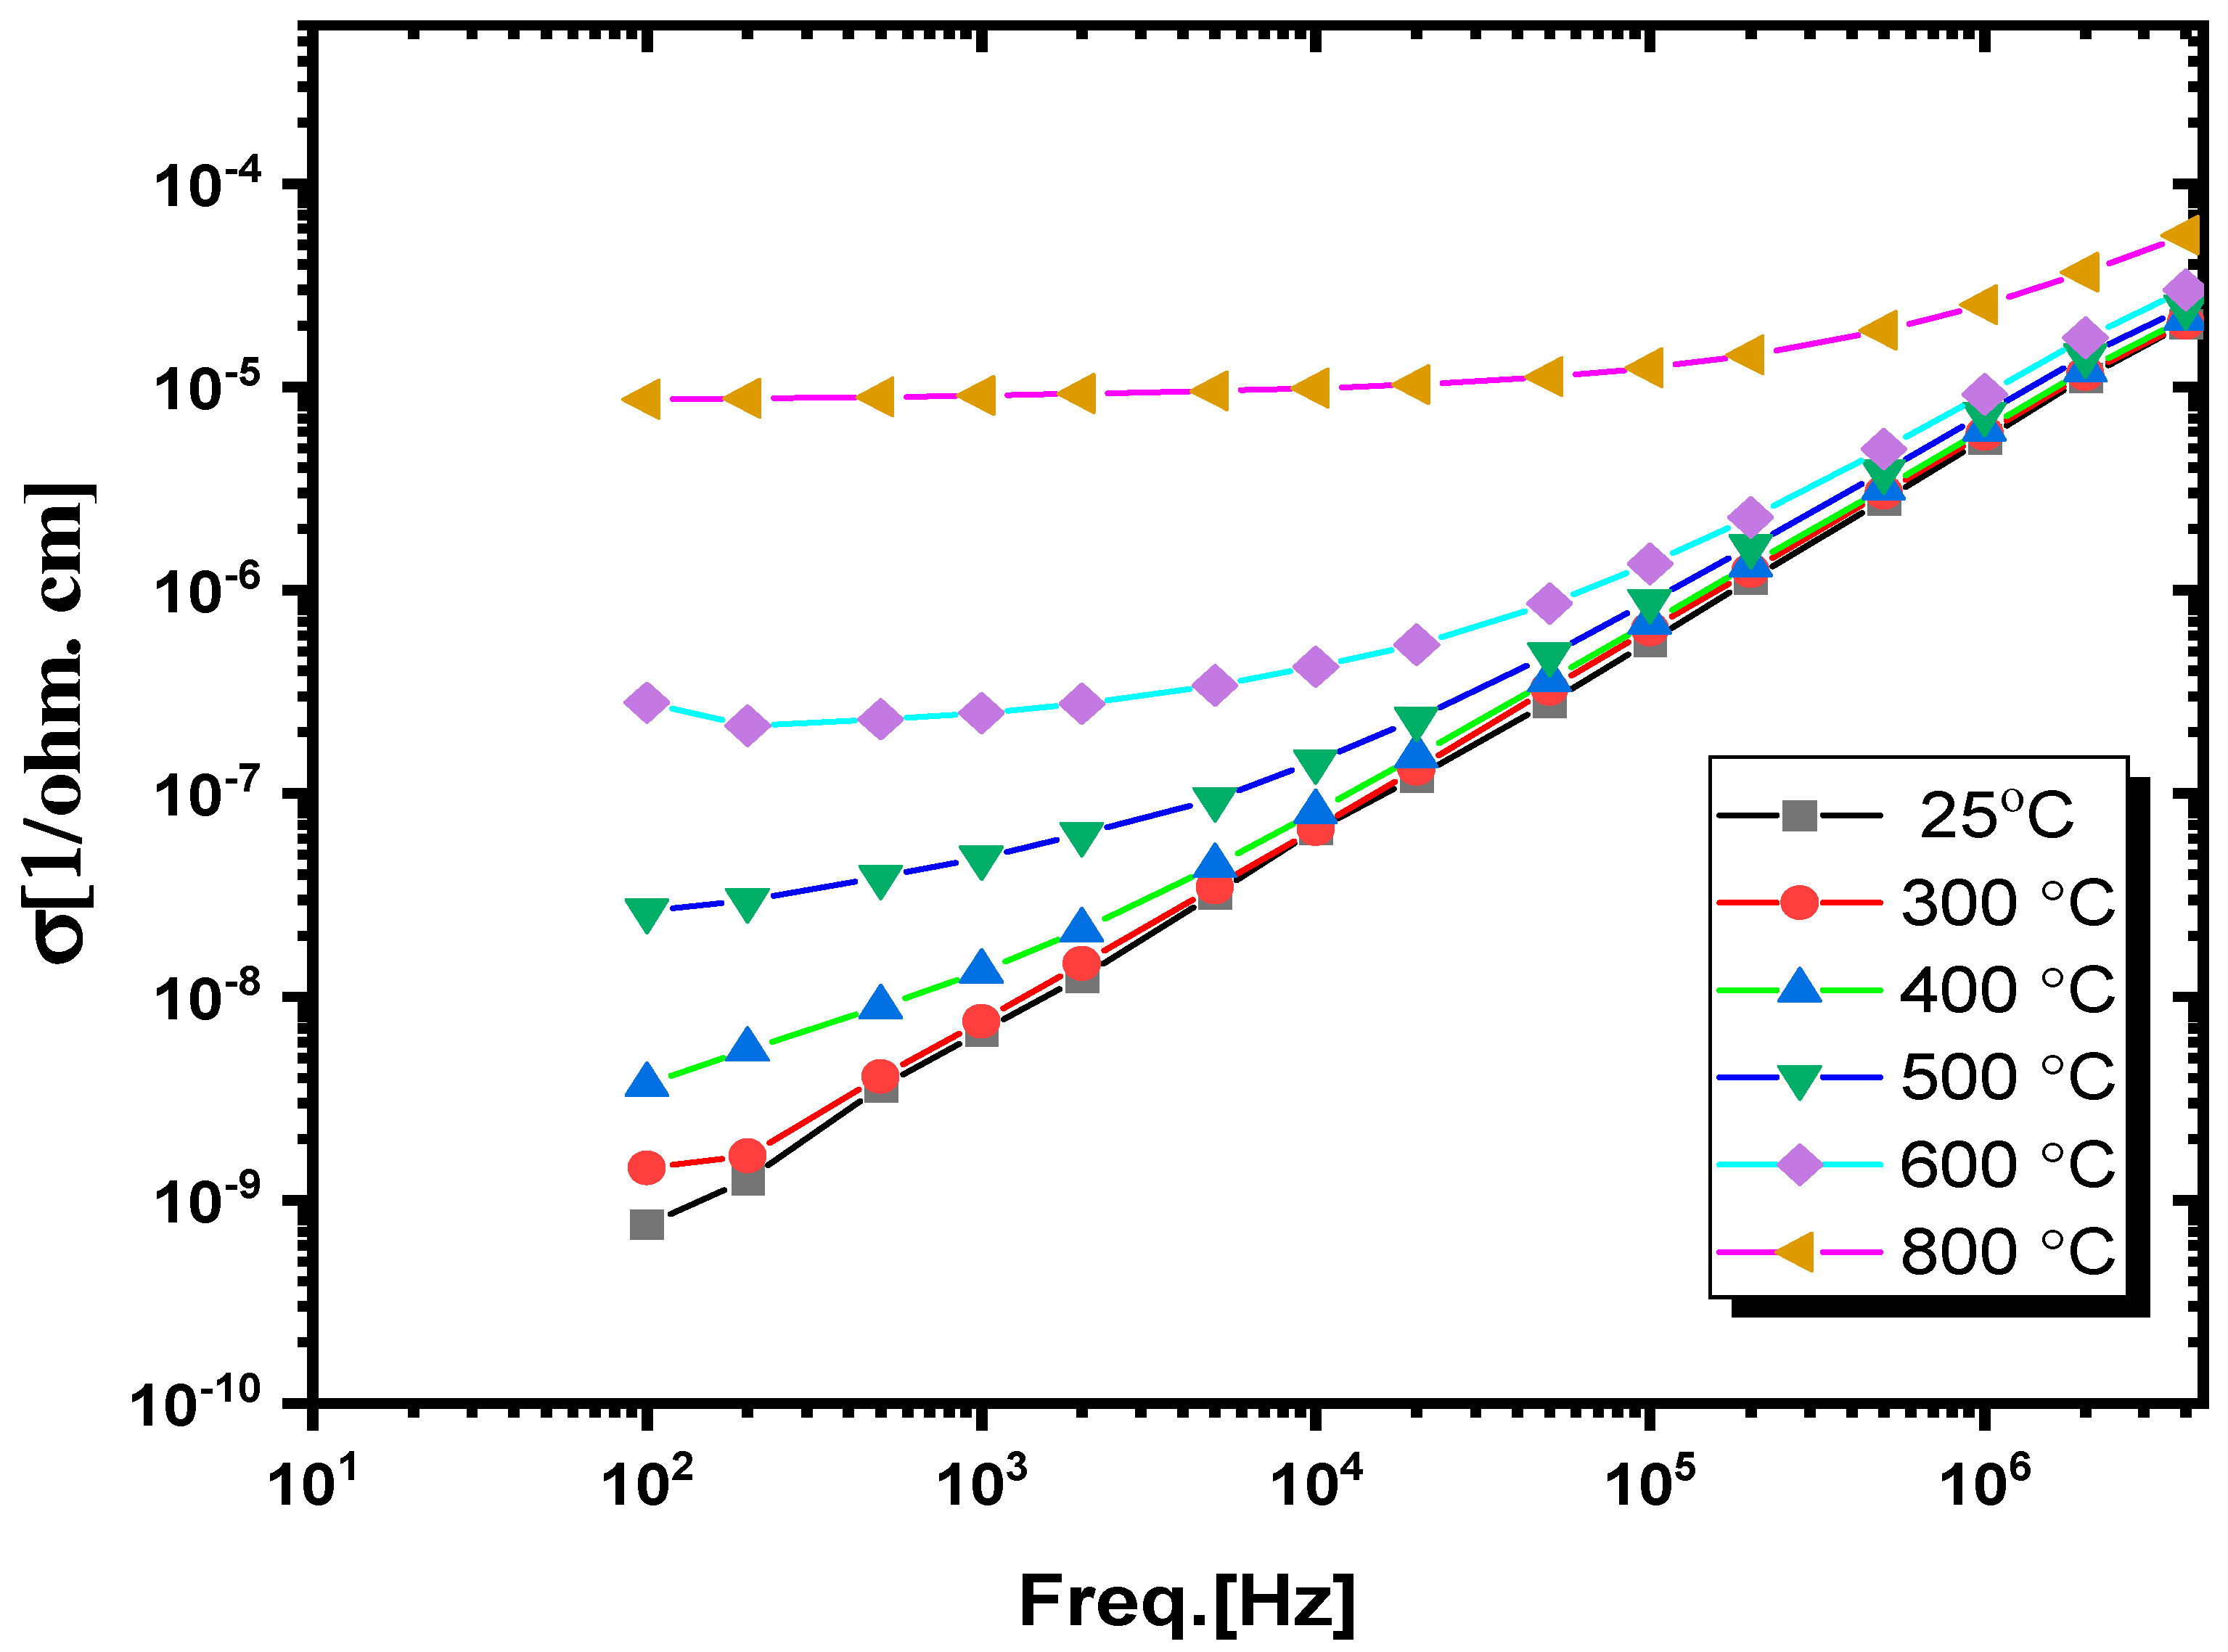
where ω represents the angular frequency, and ε″ is the imaginary part of the permittivity, which is called the dielectric loss. The lnσac curves for the ceramic samples determined as a function of the temperature at various applied frequencies are illustrated in Figure 12. The conductivities of the samples are divided into two distinct regions. The conductivity is nearly constant in the first region and appears to be stable. The sample can be considered an electrical insulator because it exhibits a stable, low conductivity even at temperatures up to approximately 500 °C. Most of the samples were composed of silicate minerals, which functioned as insulators. Consequently, the electrical conductivities of the samples were low. This can occur when the thermal energy is insufficient for initiating the hopping of carriers and ions [25,35]. The second region spans a wider temperature range, from 500 °C to 800 °C. The electrical conductivity in this range increases in a temperature-dependent manner. Generally, the semiconducting properties of a material are indicated by an increase in electrical conductivity with temperature [25]. Accordingly, the sample exhibited semiconducting behavior at higher temperatures because the thermal energy at high temperatures is sufficient for causing more oxygen vacancy defects [39,40], which increases electrical conductivity. The thermal activation process dominates conductivity [26,41]. The conductivity σac of a sample showing a gradual increase with frequency at low temperatures is plotted in Figure 13 against the applied frequency at various temperatures. At low temperatures, charge carrier hopping may be the conduction mechanism because the conductivities of the samples appeared to be frequency-dependent [34,42]. This result is consistent with those of previous studies [25,34,35]. Here, the frequency functions as a force to release the trapped charges from their trapping centers and to help the charge carriers move between different localized states [25]. On the other hand, the lnσac curves are linear at higher temperatures. Consequently, the conductivities of the samples appear to be frequency-independent, and this effect can be eliminated by large lattice vibrations, which can scatter charge carriers [25]. At high temperatures, the obvious frequency independence indicated that polaron conduction was the conduction mechanism [25].

4. Conclusions

In this work, the electrical and dielectric properties of a ceramic sample prepared from volcanic ash were evaluated at a frequency ranging from 1 × 10² to 4 × 10⁶ Hz and temperatures ranging from RT to 800 °C. The XRD results revealed that the ceramic samples contained three main phases: albite, hematite, and augite. Moreover, their microstructures exhibited a large crystal size with a dense surface. Investigations of the dielectric and electric properties of the samples showed that the conductivities and dielectric constants of the samples remained stable up to 500 °C. In particular, frequency-dependent dielectric and dielectric loss analysis demonstrated that the dielectric constants and dielectric losses decreased with an increase in frequency and increased with an increase in temperature due to increased charge carrier mobility, leading to enhanced space charge polarization and conductivity. Temperature-dependent dielectric and dielectric loss analysis revealed that the dielectric constant and dielectric loss remained stable as the temperature increased from RT to 500 °C at all applied frequencies. Over 500 °C, the dielectric constant and dielectric loss started to increase, especially at low frequencies. However, the dielectric constants decreased at higher temperatures and high frequencies due to increases in the thermal oscillation of the molecules and in the degree of disorder of dipoles, as the dipoles could not rapidly realign themselves in response to a fast-applied field. Thus, volcanic ash ceramic is appropriate for applications involving electrical insulation and energy storage.

Funding

This research received no external funding.

Data Availability Statement

The original contributions presented in the study are included in the article, further inquiries can be directed to the corresponding author.

Acknowledgments

The author would like to acknowledge the technical support they received from the Center of Excellence in Nanotechnology at King Fahd University of Petroleum & Minerals.

Conflicts of Interest

The author declares no conflicts of interest.

References

  1. Otitoju, T.A.; Okoye, P.U.; Chen, G.; Li, Y.; Okoye, M.O.; Li, S. Advanced ceramic components: Materials, fabrication, and applications. J. Ind. Eng. Chem. 2020, 85, 34–65. [Google Scholar] [CrossRef]
  2. Khater, G.A.; Nabawy, B.S.; El-Kheshen, A.A.; Abdel-Baki, M.; Farag, M.M.; Abd Elsatar, A.G. Preparation and characterization of low-cost wollastonite and gehlenite ceramics based on industrial wastes. Constr. Build. Mater. 2021, 310, 125214. [Google Scholar] [CrossRef]
  3. Quesada, D.E.; Villarejo, L.P.; Soto, P.S. (Eds.) Ceramic Materials: Synthesis, Characterization, Applications and Recycling; BoD–Books on Demand: Norderstedt, Germany, 2019. [Google Scholar]
  4. Khater, G.A.; Nabawy, B.S.; El-Kheshen, A.A.; Abdel-Baki, M.; Farag, M.M. Utilizing of solid waste materials for producing porous and lightweight ceramics. Mater. Chem. Phys. 2022, 280, 125784. [Google Scholar] [CrossRef]
  5. Tchadjie, L.N.; Ekolu, S.O. Enhancing the reactivity of aluminosilicate materials toward geopolymer synthesis. J. Mater. Sci. 2018, 53, 4709–4733. [Google Scholar] [CrossRef]
  6. Alraddadi, S.; Assaedi, H. Thermal and mechanical properties of glass–ceramics based on slate and natural raw materials. Silicon 2023, 15, 1871–1882. [Google Scholar] [CrossRef]
  7. Siddique, R. Effect of volcanic ash on the properties of cement paste and mortar. Resour. Conserv. Recycl. 2011, 56, 66–70. [Google Scholar] [CrossRef]
  8. Zheng, Y.; Wang, S.; Ouyang, Z.; Zou, Y.; Liu, J.; Li, C.; Li, X.; Feng, J. CAS-1 lunar soil simulant. Adv. Space Res. 2009, 43, 448–454. [Google Scholar] [CrossRef]
  9. Takeda, H.; Hashimoto, S.; Kanie, H.; Honda, S.; Iwamoto, Y. Fabrication and characterization of hardened bodies from Japanese volcanic ash using geopolymerization. Ceram. Int. 2014, 40, 4071–4076. [Google Scholar] [CrossRef]
  10. Ndjock, B.I.D.L.; Elimbi, A.; Cyr, M. Rational utilization of volcanic ashes based on factors affecting their alkaline activation. J. Non-Cryst. Solids 2017, 463, 31–39. [Google Scholar] [CrossRef]
  11. Lemougna, P.N.; Wang, K.-T.; Tang, Q.; Nzeukou, A.N.; Billong, N.; Melo, U.C.; Cui, X.-M. Review on the use of volcanic ashes for engineering applications. Resour. Conserv. Recycl. 2018, 137, 177–190. [Google Scholar] [CrossRef]
  12. Kamseu, E.; Boccaccini, D.N.; Sola, A.; Rizzuti, A.; Leonelli, C.; Melo, C.U.; Billong, N. Sintering behaviour, microstructure and mechanical properties of low quartz content vitrified ceramics using volcanic ash. Adv. Appl. Ceram. 2008, 107, 19–26. [Google Scholar] [CrossRef]
  13. Husain, A.; Kupwade-Patil, K.; Al-Aibani, A.F.; Abdulsalam, M.F. In situ electrochemical impedance characterization of cement paste with volcanic ash to examine early stage of hydration. Constr. Build. Mater. 2017, 133, 107–117. [Google Scholar] [CrossRef]
  14. Kupwade-Patil, K.; Chin, S.; Ilavsky, J.; Andrews, R.N.; Bumajdad, A.; Büyüköztürk, O. Hydration kinetics and morphology of cement pastes with pozzolanic volcanic ash studied via synchrotron-based techniques. J. Mater. Sci. 2018, 53, 1743–1757. [Google Scholar] [CrossRef]
  15. Bondar, D.; Lynsdale, C.; Milestone, N.; Hassani, N. Sulfate resistance of alkali activated pozzolans. Int. J. Concr. Struct. Mater. 2015, 9, 145–158. [Google Scholar] [CrossRef]
  16. Manfredini, T.; Hanuskova, M. Natural raw materials in ”traditional” ceramic manufacturing. J. Univ. Chem. Technol. Metall. 2012, 47, 465–470. [Google Scholar]
  17. Serra, M.F.; Conconi, M.S.; Suarez, G.; Aglietti, E.F.; Rendtorff, N.M. Volcanic ash as flux in clay based triaxial ceramic materials, effect of the firing temperature in phases and mechanical properties. Ceram. Int. 2015, 41, 6169–6177. [Google Scholar] [CrossRef]
  18. Candamano, S.; De Luca, P.; Garofalo, P.; Crea, F. Ceramic Materials Containing Volcanic Ash and Characterized by Photoluminescent Activity. Environments 2023, 10, 172. [Google Scholar] [CrossRef]
  19. Nasution, N.J.F.; Sembiring, K.; Sitorus, Z. Analysis of the Structure of Ceramic Materials of Clay, Mount Kelud Volcanic Ash and Sea Water. J. Phys. Conf. Ser. 2021, 2019, 012103. [Google Scholar] [CrossRef]
  20. Tassongwa, B.; Njoya, A.; Pouepene, R.A.M.; Mbog, M.B.; Kenfack, J.V.; Dongmo, A.K.; Wouatong, A.S.L. Effect of volcanic ashes addition on ceramic properties of clayey materials from Koutaba (Western Cameroon). Arab. J. Geosci. 2022, 15, 541. [Google Scholar] [CrossRef]
  21. Majó, M.; Svobodova-Sedlackova, A.; Fernández, A.I.; Calderón, A.; Barreneche, C. Evaluation of volcanic ash as a low-cost high-temperature thermal energy storage material for concentrated solar power. J. Energy Storage 2024, 89, 111729. [Google Scholar] [CrossRef]
  22. Alraddadi, S.; Assaedi, H. Characterization and potential applications of different powder volcanic ash. J. King Saud Univ. Sci. 2020, 32, 2969–2975. [Google Scholar] [CrossRef]
  23. Leonelli, C.; Kamseu, E.; Boccaccini, D.N.; Melo, U.C.; Rizzuti, A.; Billong, N.; Miselli, P. Volcanic ash as alternative raw materials for traditional vitrified ceramic products. Adv. Appl. Ceram. 2007, 106, 135–141. [Google Scholar] [CrossRef]
  24. Bloise, A. Thermal behaviour of actinolite asbestos. J. Mater. Sci. 2019, 54, 11784–11795. [Google Scholar] [CrossRef]
  25. Alraddadi, S.; Saeed, A.; Assaedi, H. Effect of thermal treatment on the structural, electrical, and dielectric properties of volcanic scoria. J. Mater. Sci. Mater. Electron. 2020, 31, 11688–11699. [Google Scholar] [CrossRef]
  26. Pritam; Arya, A.; Sharma, A.L. Dielectric relaxations and transport properties parameter analysis of novel blended solid polymer electrolyte for sodium-ion rechargeable batteries. J. Mater. Sci. 2019, 54, 7131–7155. [Google Scholar] [CrossRef]
  27. Sun, J.; Ahmed, R.; Wang, G.J.; Wang, S.T.; Wang, J.; Suhaib, S.A.; Xie, Y.M.; Bi, H.; Wang, C.C. Colossal dielectric behavior and dielectric anomalies in Sr2TiCrO6 ceramics. J. Mater. Sci. 2019, 54, 6323–6331. [Google Scholar] [CrossRef]
  28. Vyas, M.K.; Chandra, A. Synergistic effect of conducting and insulating fillers in polymer nanocomposite films for attenuation of X-band. J. Mater. Sci. 2019, 54, 1304–1325. [Google Scholar] [CrossRef]
  29. Barsoum, M. Fundamentals of Ceramics; CRC Press: Boca Raton, FL, USA, 2019. [Google Scholar]
  30. Verma, R.; Tiwari, S.P.; Kumari, R.; Srivastava, R. Study of enhancement in the dielectric and electrical properties of WO3-doped LiF nano-composite. J. Mater. Sci. 2018, 53, 4199–4208. [Google Scholar] [CrossRef]
  31. Oliveira, F.; Dencheva, N.; Martins, P.; Lanceros-Méndez, S.; Denchev, Z. A new approach for preparation of metal-containing polyamide/carbon textile laminate composites with tunable electrical conductivity. J. Mater. Sci. 2018, 53, 11444–11459. [Google Scholar] [CrossRef]
  32. Singh, S.; Kaur, A.; Kaur, P.; Singh, L. High-temperature dielectric relaxation and electric conduction mechanisms in a LaCoO3-modified Na0.5Bi0.5TiO3 system. ACS Omega 2023, 8, 25623–25638. [Google Scholar] [CrossRef]
  33. Salem, S.M.; Antar, E.M.; Mostafa, A.G.; Salem, S.M.; El-badry, S.A. Compositional dependence of the structural and dielectric properties of Li2O–GeO2–ZnO–Bi2O3–Fe2O3 glasses. J. Mater. Sci. 2011, 46, 1295–1304. [Google Scholar] [CrossRef]
  34. Khater, G.A.; Nabawy, B.S.; El-Kheshen, A.A.; Abdel Latif, M.A.B.; Farag, M.M. Use of arc furnace slag and ceramic sludge for the production of lightweight and highly porous ceramic materials. Materials 2022, 15, 1112. [Google Scholar] [CrossRef]
  35. Khater, G.A.; Nabawy, B.; Kang, J.; Yue, Y.; Mahmoud, M.A. Magnetic and Electrical Properties of Glass and Glass-Ceramics Based on Weathered Basalt. Silicon 2020, 12, 2921–2940. [Google Scholar] [CrossRef]
  36. Shanker, J.; Buchi Suresh, M.; Narsinga Rao, G.; Suresh Babu, D. Colossal dielectric, relaxor ferroelectric, diamagnetic and weak ferromagnetic properties of NdCrO3 perovskite nanoparticles. J. Mater. Sci. 2019, 54, 5595–5604. [Google Scholar] [CrossRef]
  37. Lin, J.-F.; Sturhahn, W.; Zhao, J.; Shen, G.; Mao, H.-k.; Hemley, R.J. Chapter 19—Nuclear resonant inelastic X-ray scattering and synchrotron Mössbauer spectroscopy with laser-heated diamond anvil cells. In Advances in High-Pressure Technology for Geophysical Applications; Chen, J., Wang, Y., Duffy, T.S., Shen, G., Dobrzhinetskaya, L.F., Eds.; Elsevier: Amsterdam, The Netherlands, 2005; pp. 397–411. [Google Scholar]
  38. Kremer, F.; Schönhals, A. (Eds.) Broadband Dielectric Spectroscopy; Springer Science & Business Media: Berlin/Heidelberg, Germany, 2002. [Google Scholar]
  39. Park, C.O.; Akbar, S.A. Ceramics for chemical sensing. J. Mater. Sci. 2003, 38, 4611–4637. [Google Scholar] [CrossRef]
  40. Pan, W.; Cao, M.; Diao, C.; Tao, C.; Hao, H.; Yao, Z.; Yu, Z.; Liu, H. Structures and dielectric properties of (Nb, Zn) co-doped SrTiO3 ceramics at various sintering temperatures. J. Mater. Sci. 2019, 54, 12401–12410. [Google Scholar] [CrossRef]
  41. Exner, J.; Kita, J.; Moos, R. In- and through-plane conductivity of 8YSZ films produced at room temperature by aerosol deposition. J. Mater. Sci. 2019, 54, 13619–13634. [Google Scholar] [CrossRef]
  42. Brok, E.; Frandsen, C.; Lefmann, K.; McEnroe, S.; Robinson, P.; Burton, B.P.; Hansen, T.C.; Harrison, R. Spin orientation in solid solution hematite-ilmenite. Am. Mineral. 2017, 102, 1234–1243. [Google Scholar] [CrossRef]
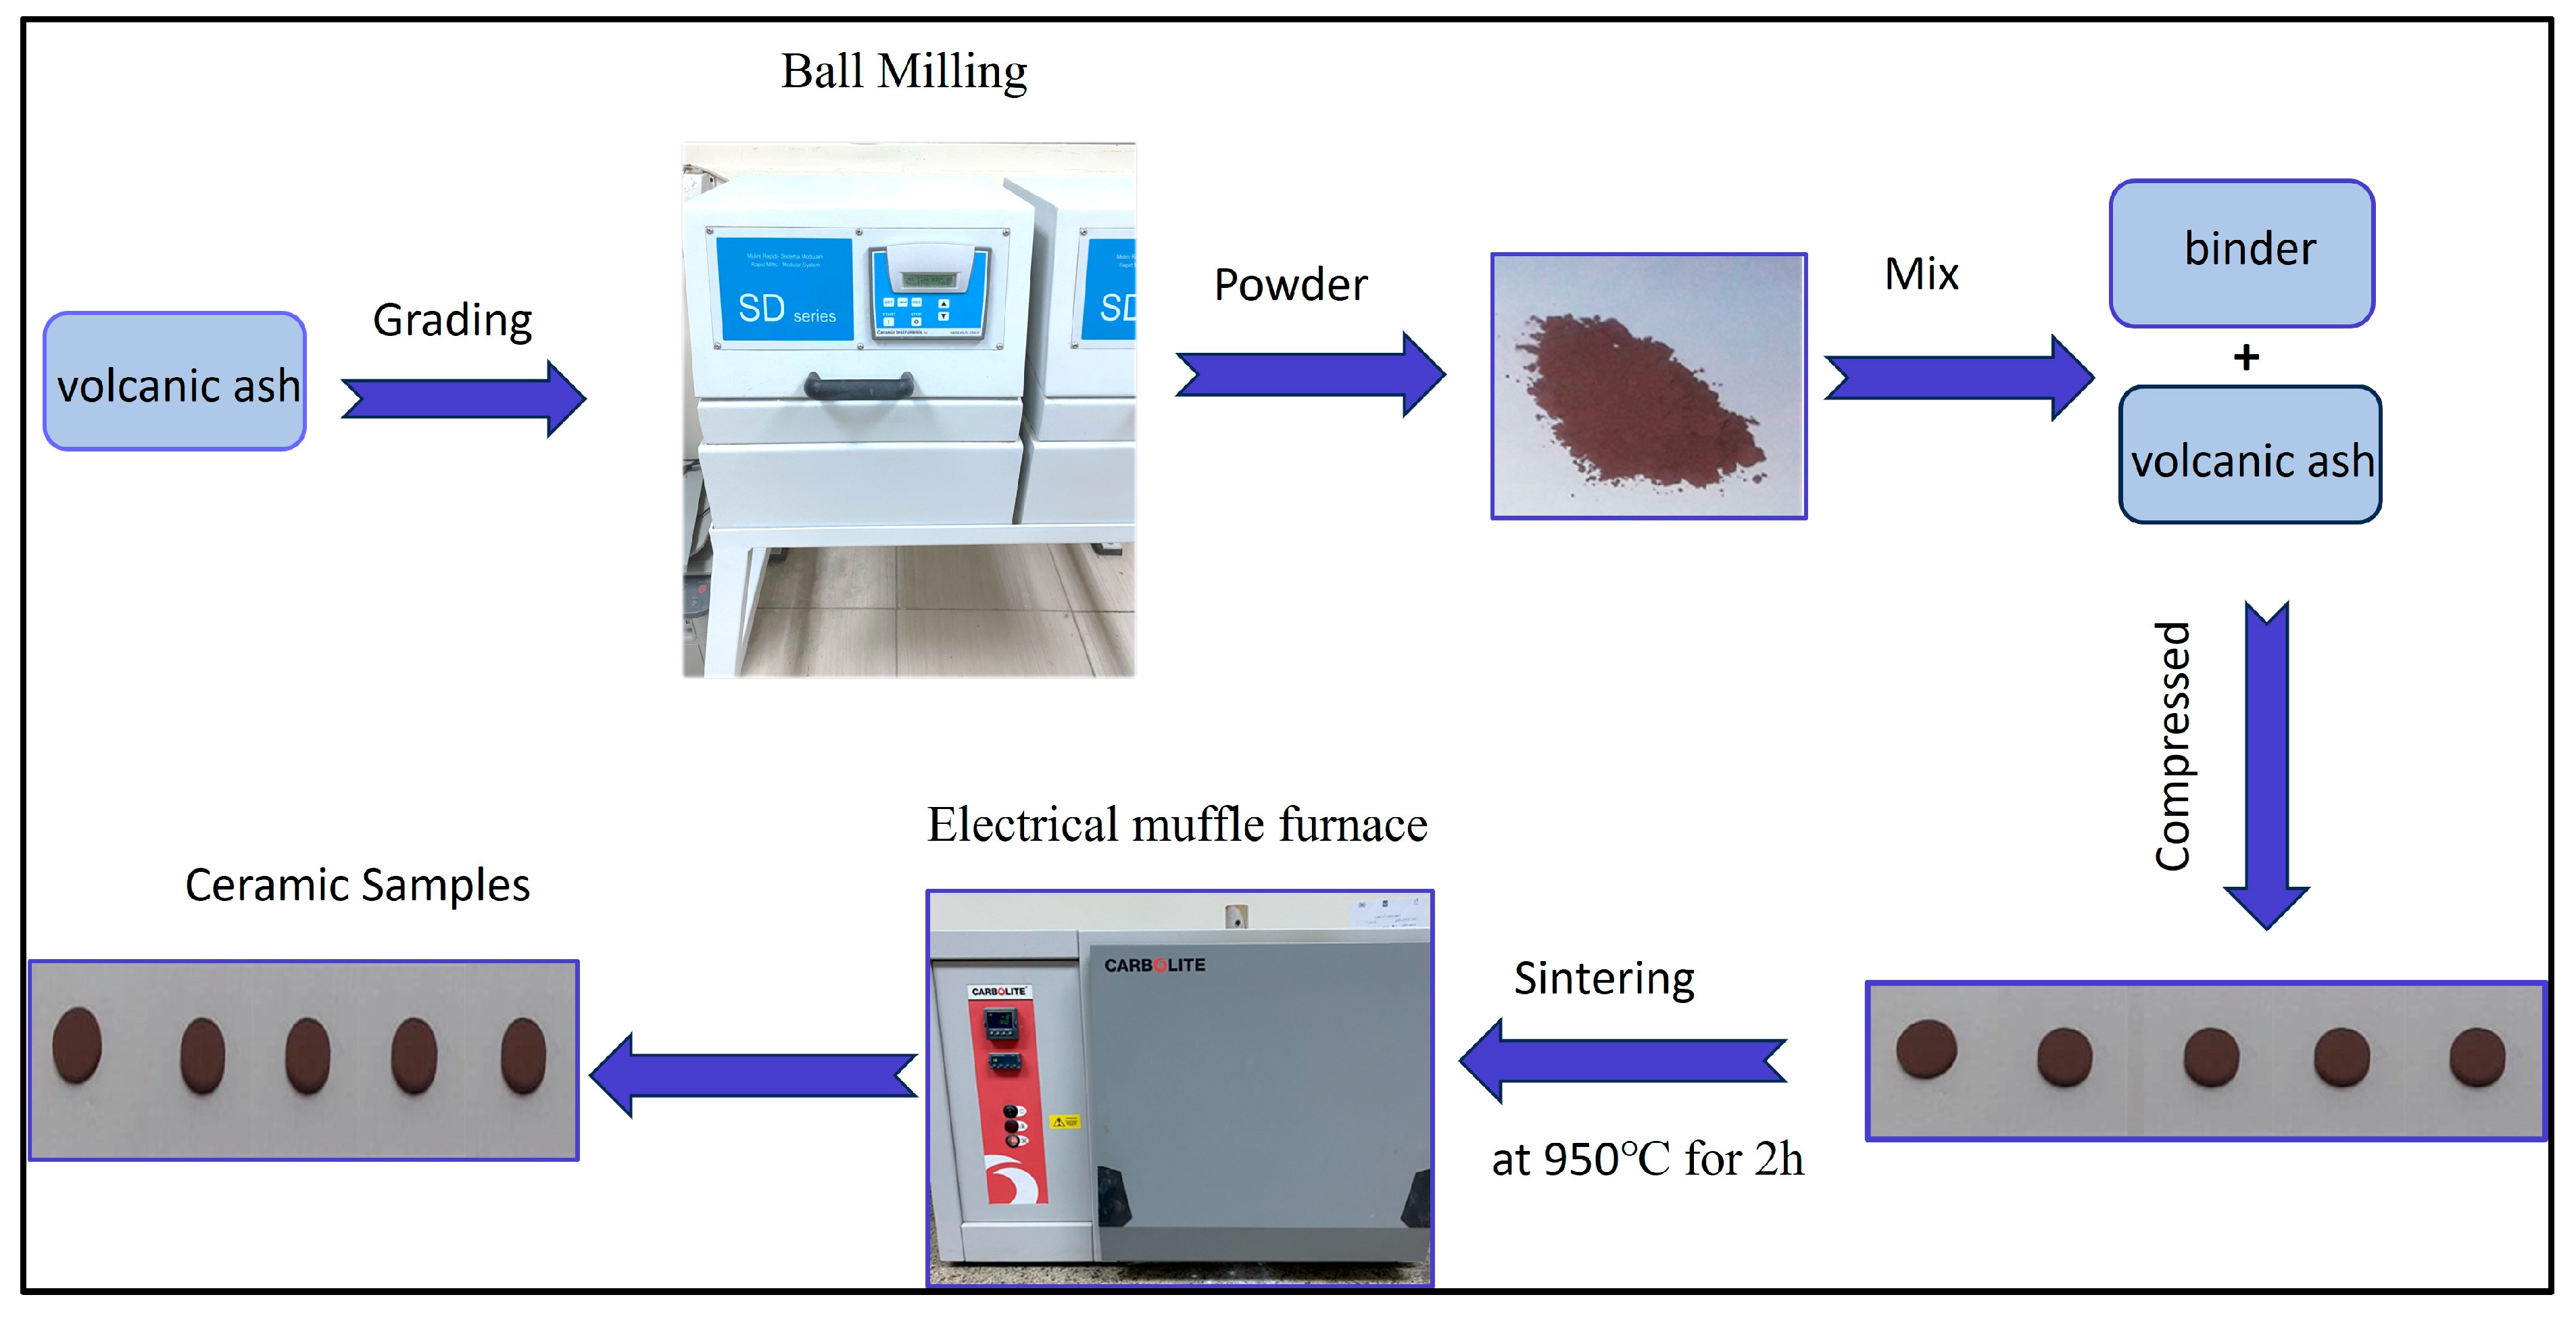
Figure 1. A schematic of the preparation process of ceramic specimens.
Crystals 14 00817 g001
Figure 2. The chemical compositions (wt.%) of the collected volcanic ash.
Crystals 14 00817 g002
Figure 3. Thermal analysis of volcanic ash powder DSC curve and TGA.
Crystals 14 00817 g003
Figure 4. XRD patterns of ceramic sample prepared using volcanic ash at 950 °C for 2 h.
Crystals 14 00817 g004
Figure 5. SEM images (af) at different magnifications of microstructures of volcanic ash and ceramic sample prepared at 950 °C for 2 h.
Crystals 14 00817 g005
Figure 6. Dielectric constant (ε′) versus frequency for ceramic sample at different temperatures.
Crystals 14 00817 g006
Figure 7. Dielectric loss (ε″) versus frequency for ceramic sample at different temperatures.
Crystals 14 00817 g007
Figure 8. Dielectric constant (ε’) versus temperatures for ceramic sample at different frequency.
Crystals 14 00817 g008
Figure 9. Dielectric loss (ε″) versus temperatures for ceramic sample at different frequency.
Crystals 14 00817 g009
Figure 10. Dielectric loss tangent (tan δ) versus frequency for ceramic sample at different temperatures.
Crystals 14 00817 g010
Figure 11. Loss tangent (tan δ) versus temperatures for ceramic sample at different frequencies.
Crystals 14 00817 g011
Figure 12. The electric conductivity of ceramic samples (σac) versus temperature at different applied frequencies.
Crystals 14 00817 g012
Figure 13. The electric conductivity (σac) as a function of applied frequency at different temperatures for the ceramic sample.
Crystals 14 00817 g013
Table 1. Dielectric constant (ε′) and conductivity (σ′) of ceramic samples for selected frequency at different temperatures.
Freq. (Hz)RT300 °C400 °C500 °C600 °C800 °C
ε′σ′ε′σ′ε′σ′ε′σ′ε′σ′ε′σ′
10017.07.60 × 10−1032.271.44 × 10−939.063.71 × 10−9128.222.65 × 10−8482.742.80 × 10−72845.178.68 × 10−6
100015.186.75 × 10−914.467.59 × 10−922.941.33 × 10−850.934.84 × 10−8124.802.48 × 10−7766.179.08 × 10−6
10,00013.356.63 × 10−812.456.73 × 10−815.188.12 × 10−823.311.44 × 10−747.104.20 × 10−7173.429.88 × 10−6
100,00011.535.61 × 10−711.726.44 × 10−712.916.97 × 10−716.058.82 × 10−723.191.35 × 10−668.071.24 × 10−5
1,000,0009.515.55 × 10−610.735.90 × 10−611.466.21 × 10−613.517.36 × 10−616.889.20 × 10−631.092.54 × 10−5
Disclaimer/Publisher’s Note: The statements, opinions and data contained in all publications are solely those of the individual author(s) and contributor(s) and not of MDPI and/or the editor(s). MDPI and/or the editor(s) disclaim responsibility for any injury to people or property resulting from any ideas, methods, instructions or products referred to in the content.