Article

Impact of Molecular and Crystal Structure on the Melting Points in Halo-Substituted Phenyl-Quinazolinones

1
Department of Chemistry, Faculty of Science, University of Zagreb, Horvatovac 102a, 10000 Zagreb, Croatia
2
Faculty of Food Technology Osijek, Josip Juraj Strossmayer University of Osijek, Franje Kuhača 18, 31000 Osijek, Croatia
3
Faculty of Chemistry and Chemical Technology, University of Ljubljana, Večna Pot 113, 1000 Ljubljana, Slovenia
4
Department of Chemistry, Josip Juraj Strossmayer University of Osijek, Cara Hadrijana 8/A, 31000 Osijek, Croatia
*
Author to whom correspondence should be addressed.
Crystals 2025, 15(1), 39; https://doi.org/10.3390/cryst15010039
Submission received: 13 December 2024 / Revised: 24 December 2024 / Accepted: 27 December 2024 / Published: 30 December 2024
(This article belongs to the Special Issue Young Crystallographers Across Europe)

Abstract

:
Three halo-substituted phenyl-quinazolinone derivatives were prepared and structurally characterized [1 = 3-(4-chlorophenyl)-6-iodo-2-methylquinazolin-4(3H)-one, 2 = 6-iodo-3-(4-methoxyphenyl)-2-methylquinazolin-4(3H)-one, and 3 = 7-chloro-2-methyl-3-[4-(trifluoromethoxy)phenyl]quinazolin-4(3H)-one)] in order to explore the relationship between structure and melting point in this group of compounds. Depending on the compound, molecules are interconnected by weak π∙∙∙π interactions, have I···Cl or Cl···Cl halogen bonding, or primarily form C–H∙∙∙N, C–H∙∙∙O, and π∙∙∙π interactions (no halogen bonding). The presence of the OCF3 group leads to interactions between fluorine atoms that are shorter than the sum of the van der Waals radius for fluorine, suggesting that these interactions contribute to the overall lattice energy. The sequence of melting points cannot be fully explained by intermolecular interactions present in the solid state (enthalpy factor). To address this, a concept related to entropy called the functional group rotation influence, which relates to a decrease in fusion entropy caused by the rotational freedom of polyatomic groups, was introduced. Analysis of previously synthesized 3-phenylquinazolinones showed that the compounds with the highest melting point are the quinazoline-substituted and phenyl-nitro-substituted ones. Among halo-phenyl-substituted compounds, the melting point follows the sequence ortho < meta < para. Regarding the halogen atom type, the order of melting points is Cl ≈ Br > F > I for enantiopure and Br > I ≈ Cl > F for racemic compounds. Also, the melting point order correlates to halogen bond energy (I > Br > Cl > F) only when the geometry and energy of these interactions are favorable.

1. Introduction

The melting point is a fundamental thermodynamic parameter that is routinely reported for most newly synthesized compounds. It can be used to determine the purity of a compound, identify chemical substances, or predict physicochemical properties such as solubility [1,2,3]. The correlation with some structural aspects in the crystalline state is quite intriguing, mainly if some anomalies occur in well-established trends in a series of similar compounds (e.g., isomers [4] and odd–even effect in aliphatic compounds [5,6]). From the thermodynamic point of view, the melting point can be related to enthalpic and entropic factors [7]. Enthalpic factors are associated with the intermolecular interactions in the crystal, while entropic factors are associated with the symmetry of a molecule. Generally, the higher the molecular symmetry and the stronger the intermolecular interactions, the higher the melting points. These two parameters are intertwined, and it is desirable to know both the molecular structure (and thus its symmetry) and the crystal structure to determine the correlation to the melting point. Some recent investigations of tribromobenzene [4] and tetrachlorobenzene [8] isomers have indicated that halogen–halogen interactions can be significant when considering melting points. The authors also introduced the extension of Carnelly’s rule (the relationship between molecular symmetry and melting point) with the term “accessibility of atoms for the formation of intermolecular interactions”, which nicely relates molecular symmetry and intermolecular interactions (i.e., entropic and enthalpic factors).
Halogen···halogen interactions (HHIs) are a form of weak intermolecular interactions expected to be repulsive in a crystal structure due to the high electronegativity of these elements. Consequently, close contact between highly electronegative halogen atoms should result in the destabilization of the crystal structure and a substantial decrease in the melting point of halo-substituted compounds compared to unsubstituted compounds. On the other hand, solid Cl2 [9], Br2 [10], and I2 [11] (and other hetero-halogen compounds) indicate that some form of attractive interactions between halogen atoms must be present in the crystalline state. As the Cl···Cl distance in the crystal structure of Cl2 is shorter than the sum of van der Waals radii, several reasonable models explaining this phenomenon have been developed [12]. If halogen atoms are adequately oriented in the crystal structure, attractive interaction between halogen atoms can occur. As proposed by Ibrahim et al. [13], there are four distinct geometries of HHIs: parallel displaced geometry (Type I), L-geometry (Type II), linear geometry (Type III), and Z-shaped geometry (Type IV). This categorization is based on differences in angles (θ angles) formed between four atoms participating in the HHI. For example, if HHI is formed between two halogens bonded to carbon atoms (C1–X1···X2–C2), then θ angles are θ1 = ∠C1–X1···X2 and θ2 = ∠C2–X2···X1. The energy of these interactions ranges from −2 to −9 kJ mol−1 and depends on the halogen atom type and geometry of interaction [13,14]. Quinazolinones are a group of heterocyclic compounds that are interesting primarily due to their excellent biological properties [15,16]. Depending on the starting materials, many differently substituted quinazolinones can be prepared [17]. Phenyl-quinazolinone derivatives can be easily synthesized from anthranilic acid, acetic anhydride, and benzylic amines. Halo-substituted benzylic amines are used to synthesize pharmaceutically active compounds like mebroqualone and mecloqualone [18]. As recently reported [19], Br-substituted compounds crystallize as a racemic mixture with C=O···Br–Ar halogen interactions between molecules, while in enantiopure compounds, there are no halogen bond interactions. Consequently, enantiopure compounds have a melting point 40 °C lower than the racemic mixture. The authors also reported that the retention time in the column chromatography experiment of the enantiopure fraction is shorter (especially in ethyl acetate) because of C=O···Br–Ar interactions (they discussed it in terms of equilibrium between monomers of excess enantiomers and heterochiral halogen-bonded high-order species).
The above example shows an apparent relationship between molecular and crystal features and physical properties in halo-substituted quinazolinones. Therefore, we investigated the molecular and crystal structure of three previously synthesized halo-substituted 3-phenyl-quinazolinones (1, 2, and 3) [20]. The compounds were characterized by single-crystal X-ray diffraction and TG/DSC analysis. Intermolecular interactions were further studied by Hirshfeld surface analysis and correlated to the thermal behavior of compounds. The structural and thermal aspects of previously reported crystal structures of 3-phenyl-quinazolinones were investigated and compared to compounds reported herein to gain a deeper understanding of the relationship between structure and thermal property.

2. Experimental

2.1. Reagents and Techniques
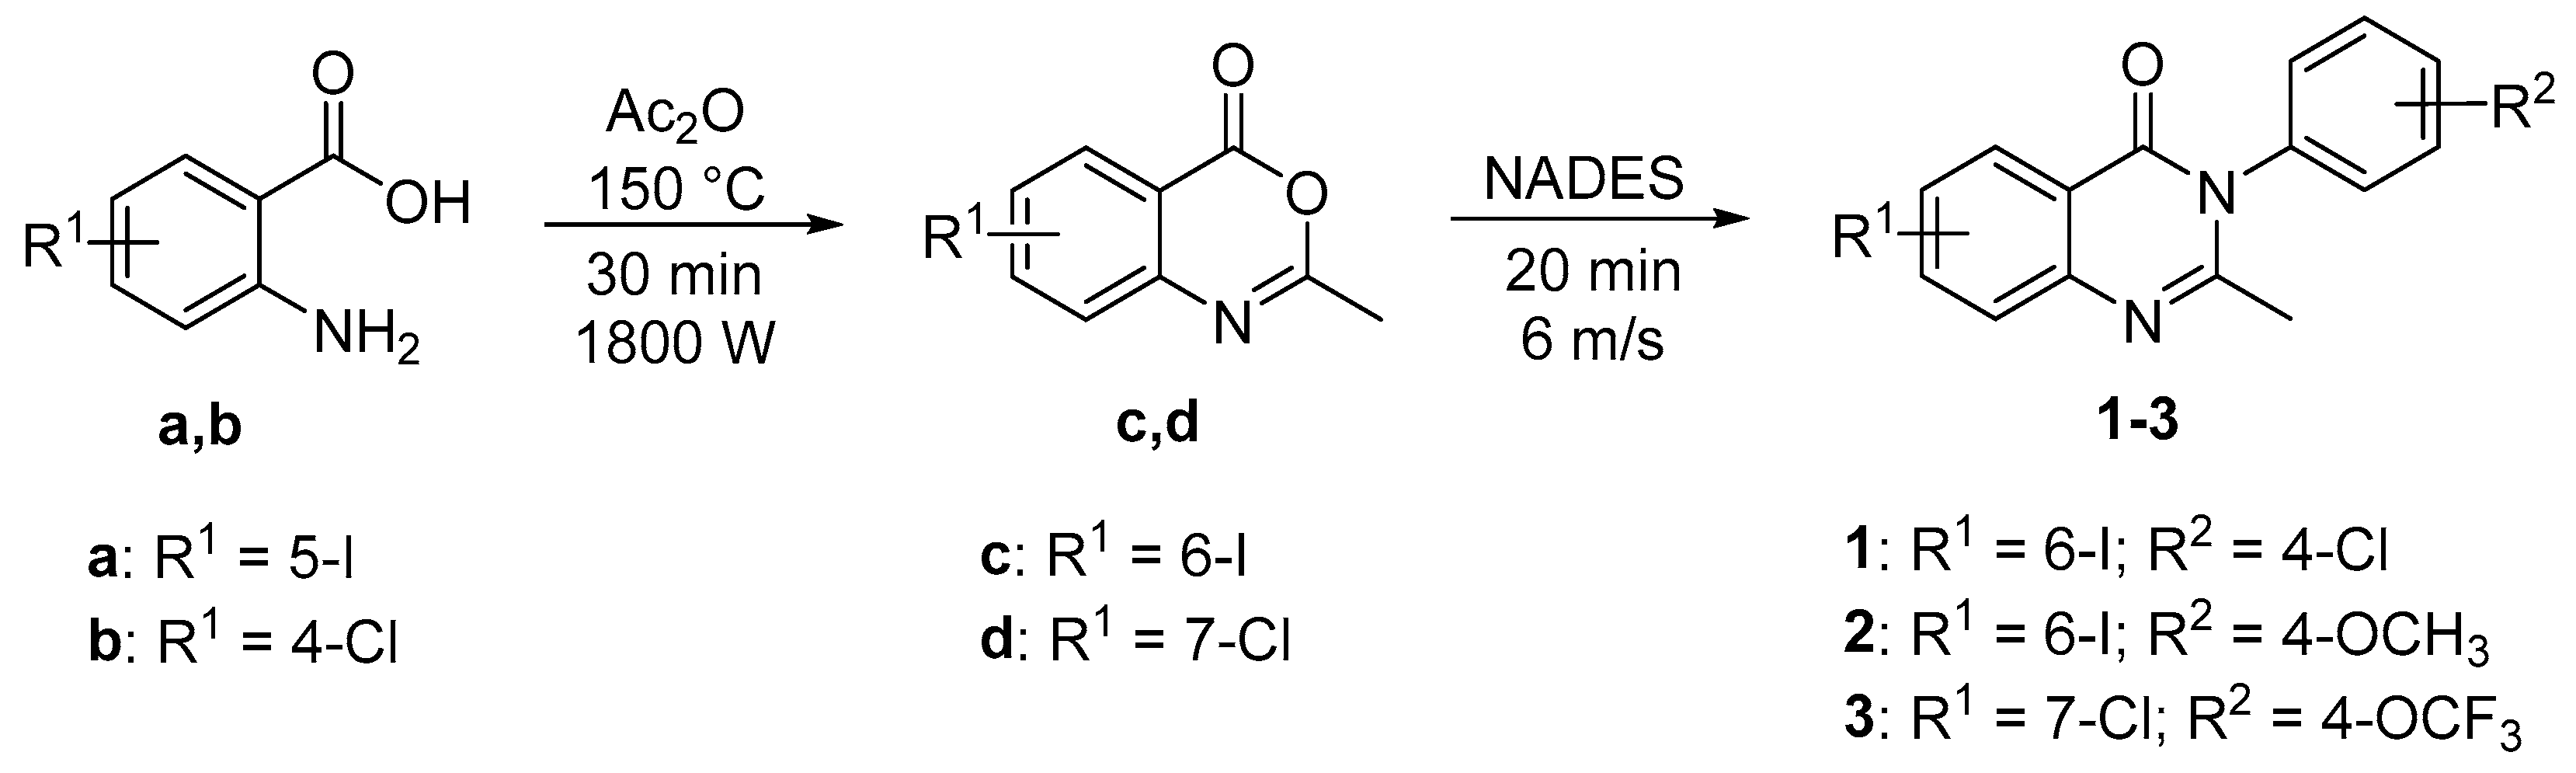
All commercially available chemicals were of reagent grade. IR spectra were recorded on a Shimadzu FTIR 8400S spectrophotometer (Shimadzu, Kyoto, Japan) using a DRS 8000 attachment in the 4000–400 cm−1 region. Thermogravimetric analyses were performed using a simultaneous TGA–DSC analyzer (Mettler-Toledo TGA/DSC 1) (Mettler-Toledo, Columbus, USA). The samples (approx. 20 to 30 mg) were placed in aluminum pans (100 μL) and heated in a nitrogen atmosphere (200 mL min−1) up to 400 °C at a rate of 5 °C min−1. Before measurements, a blank curve measurement under the same experimental conditions was run, and the blank curve was subtracted. The data collection and analysis were performed using the program package STARe Software 10.0 [21].

2.2. Synthesis

All the compounds were synthesized following the synthetic procedures described in a previously published paper according to Scheme 1 [20]. Microwave-assisted synthesis of compounds c and d was performed in a microwave reactor (flexiWAVE, Milestones Srl, Milan, Italy). Mechanochemical synthesis was performed in a bead mill homogenizer (Bead Ruptor 12, Omni International, Kennesaw, GA, USA) using 1.4 mm ceramic beads and PP vessels.

2.2.1. General Procedure for the Synthesis of 2-Methyl-3,1-benzoxazin-4-ones c and d in Solution

A solution of substituted anthranilic acid (10 g; a = 38 mmol; b = 58.3 mmol) in acetic anhydride (20 mL) was heated and stirred under microwave irradiation for 30 min at 1800 W and 150 °C. After cooling, the excess solvent was evaporated under reduced pressure. The residue was filtered off, washed with petroleum ether, dried, and instantly used to synthesize quinazolin-4(3H)-ones 13, as described in the next section.

2.2.2. General Liquid-Assisted Mechanochemical Procedure for the Synthesis of Quinazolin-4(3H)-ones 13

The reaction mixture of 2-methyl-1,3-benzoxazin-4-one (1 mmol; c = 287.05 mg; d = 195.60 mg) and aromatic amines (1.2 mmol) in ChCl/urea NADES (1 mL) was milled for 20 min at 6 m/s. The cooled mixture was poured into 50 mL of water, and the resulting product was filtered off, dried, and recrystallized from ethanol.

2.3. X-Ray Crystallography

Powder X-ray diffraction (PXRD) patterns were collected on a Malvern PANalytical Empyrean diffractometer (Malvern PANalytical, Malvern, UK) in reflection mode in 2θ range from 3 to 40° (step size: 0.0066°; exposition: 9.5 s) using a PIXcel3D-MEdipix3 detector and Cu Kα source. The sample was lightly homogenized and mounted on a zero-background holder inside the Anton Paar TTK 600 chamber. The data were collected in the air from 30 to 180 °C. After single temperature data collection, the temperature was increased by 10 °C increments and kept constant for 10 min before subsequent measurement. After collecting the highest temperature diffraction data, the sample was cooled at 30 °C, and data were recollected. HighScore Plus and Data Viewer were used for data analysis and visualization.
The diffracted intensities were collected on a Rigaku Synergy diffractometer equipped with a four-circle kappa geometry goniometer, an HyPIX-6000 detector, and a microfocus Cu Kα source (λ = 1.54184 Å) at 170 K. The collected data were reduced using the CrysAlisPro software package (ver. 1.171.43.91a) [22]. The initial structural model was found using SHELXT (ver. 2018/2) (intrinsic phasing method) [23]. The refinement procedure by full-matrix least-squares methods based on F2 values against all reflections included anisotropic displacement parameters for all non-H atoms. H-atoms attached to carbons were put in geometrically idealized positions and refined using the riding model. All models were refined using SHELXL [24]. Both SHELX programs operated within the Olex2 v1.5. For geometrical calculations and graphics, PLATON (ver. 2023.1) [25] and Mercury 2024.2.0 [26] were used. Details of crystallographic data and refinements are given in Table 1. More details can be found in the Supplementary Materials. Supplementary crystallographic data sets for the structures are available through the Cambridge Structural Database with deposition numbers 2410138-2410140. A copy of this information may be obtained free of charge from the directory (CCDC, 12 Union Road, Cambridge, CB2 1EZ, UK; fax: +44 1223 336 033; email: deposit@ccdc.cam.ac.uk or http://www.ccdc.cam.ac.uk).

2.4. Hirshfeld Surface Analysis

For a detailed study of intermolecular interactions in 1, 2, and 3, the Crystal Explorer software (ver. 17.5) was used to perform Hirshfeld surface (HS) analyses based on the results of previous X-ray single crystal structure determinations [27]. The Hirshfeld surfaces were plotted over dnorm in the standard red-white-blue color code to represent shorter/close to the sum of van der Waals radii/longer contacts between the adjacent molecules in the range of −0.25 to 2.20 a.u. Additionally, complete and resolved 2D fingerprint plots that show distances from each point on the Hirshfeld surface to the nearest atom inside (di) and outside (de) of it were calculated. As all three structures contain two symmetry-independent molecules in the asymmetric unit (Z’ = 2), the HSs were calculated for the whole asymmetric unit, and individual molecules were labeled A and B following the protocols given by Tan and co-workers [28]. As one of the molecules in 3 is disordered, its HS was calculated for both positions. However, the results did not differ significantly; consequently, only those for the prevailing position of the disordered OCF3 group are presented.

3. Results and Discussion

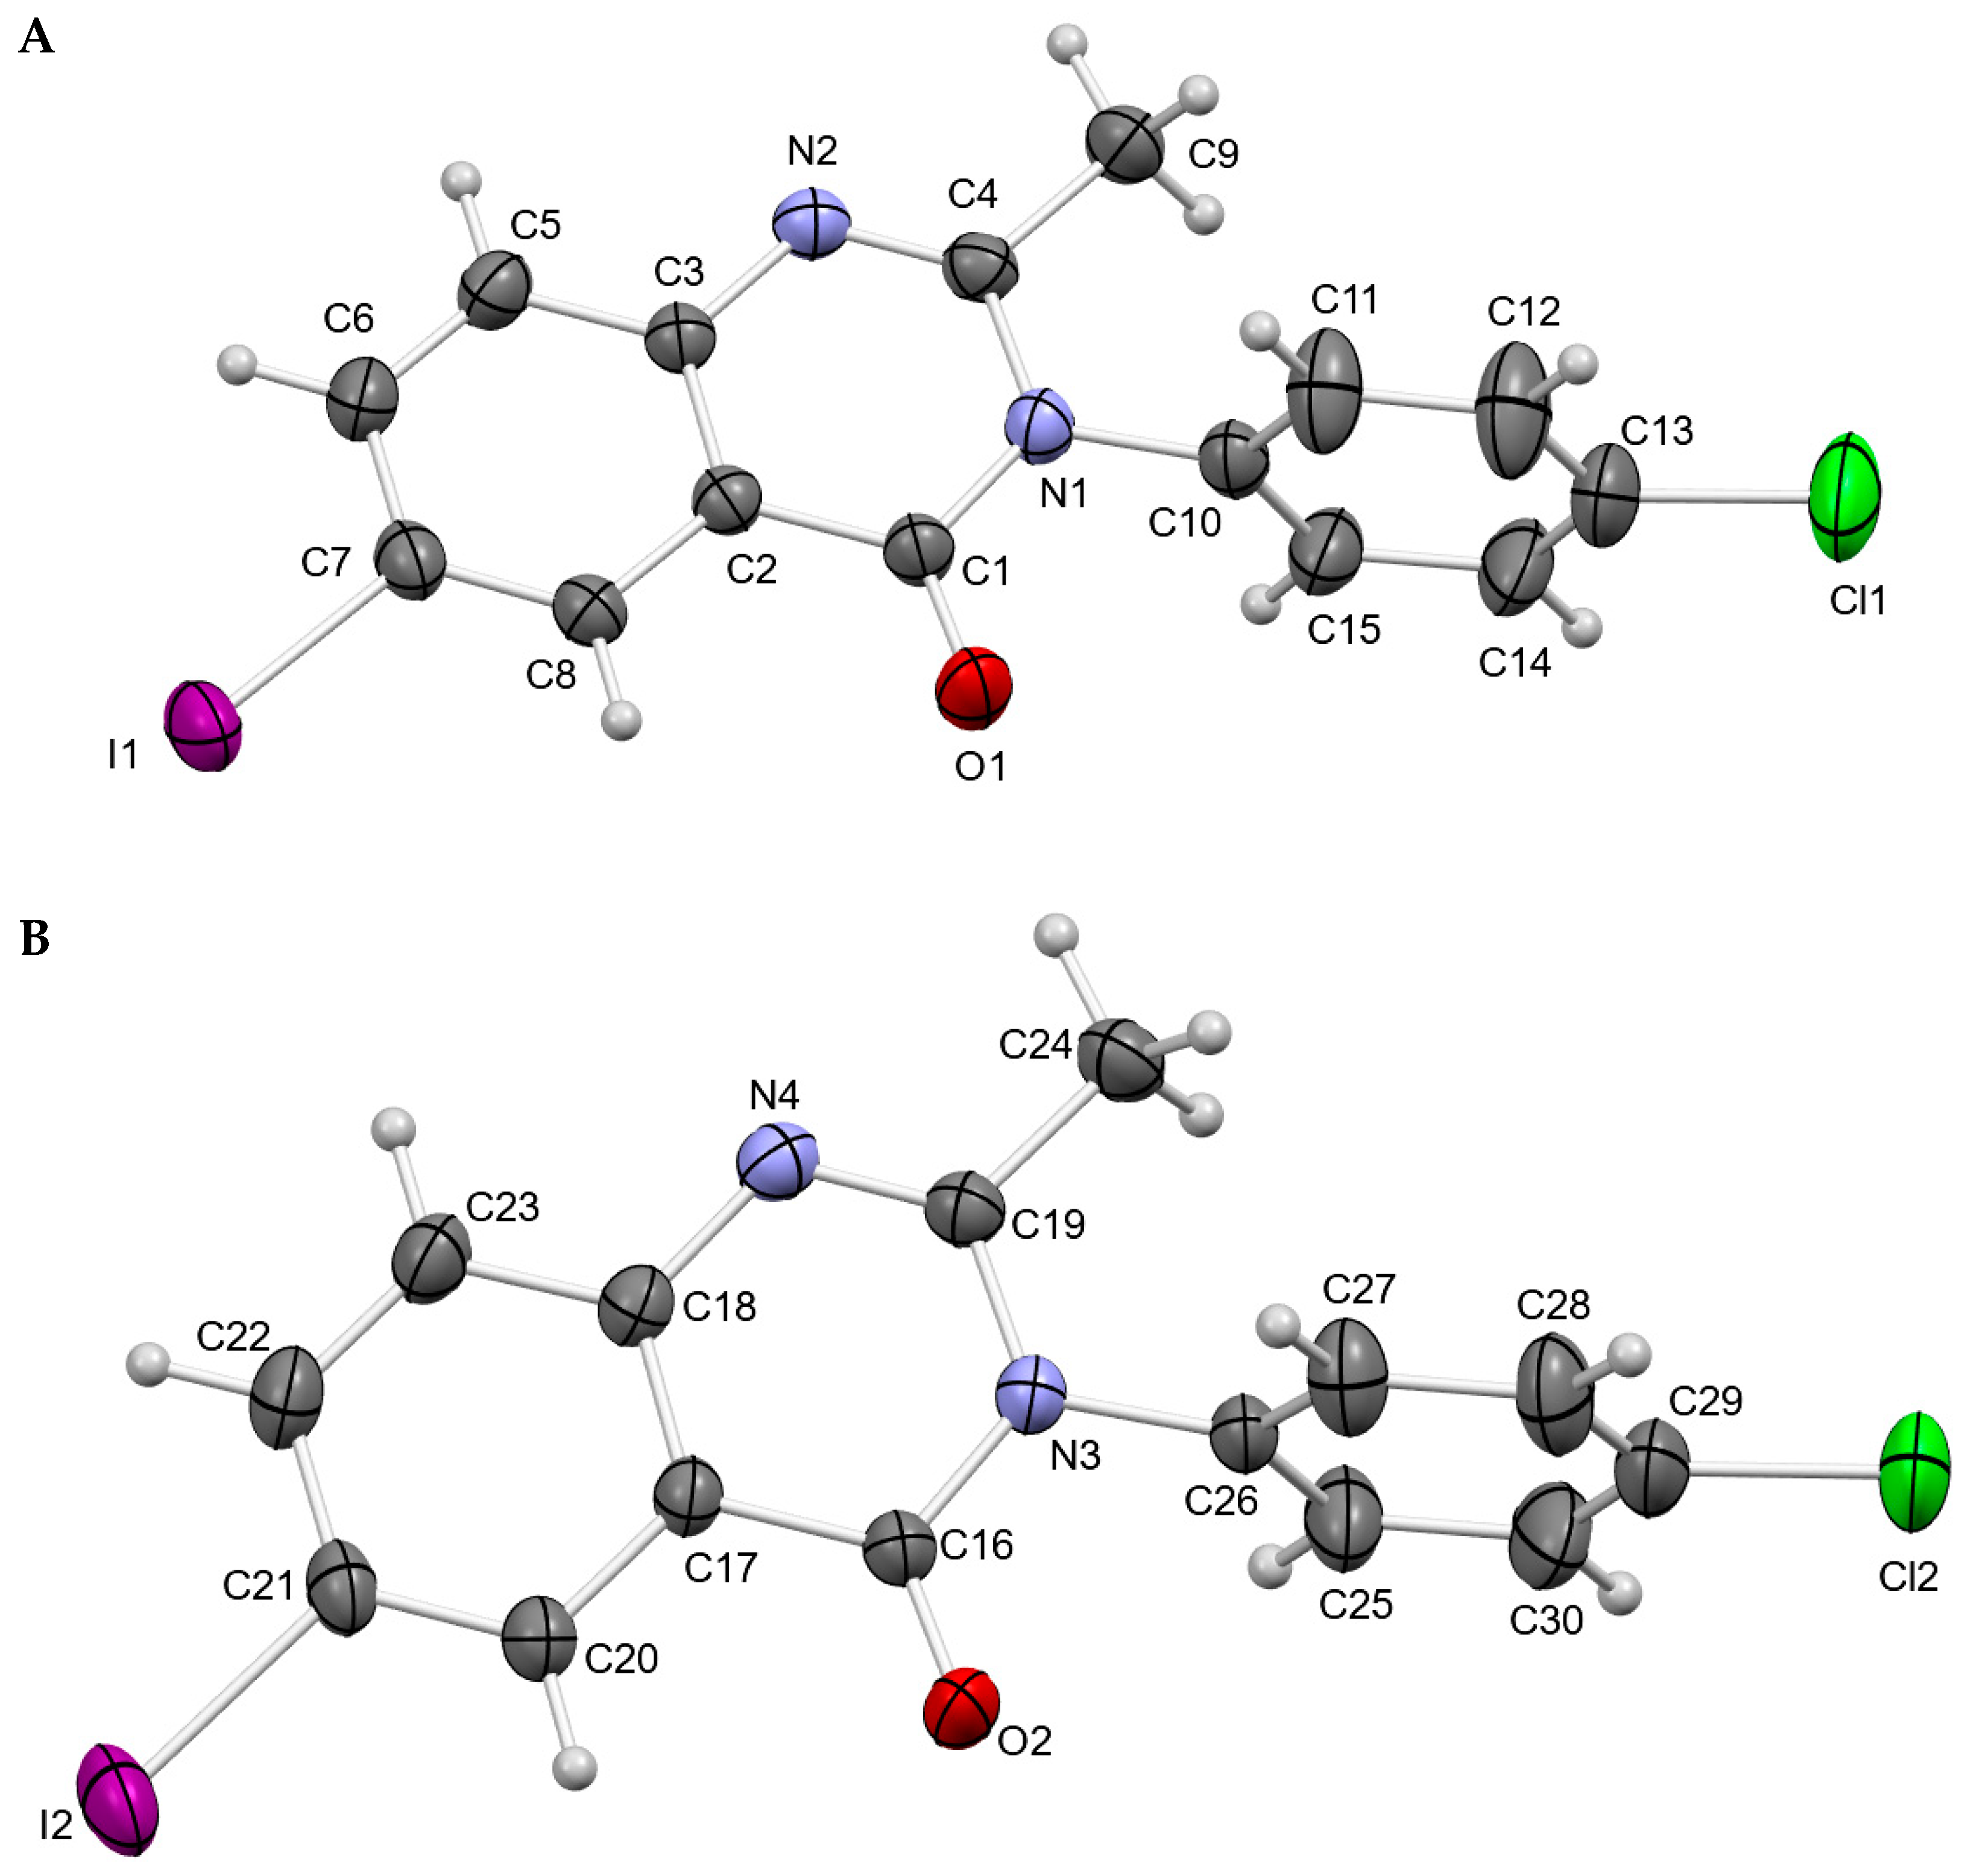
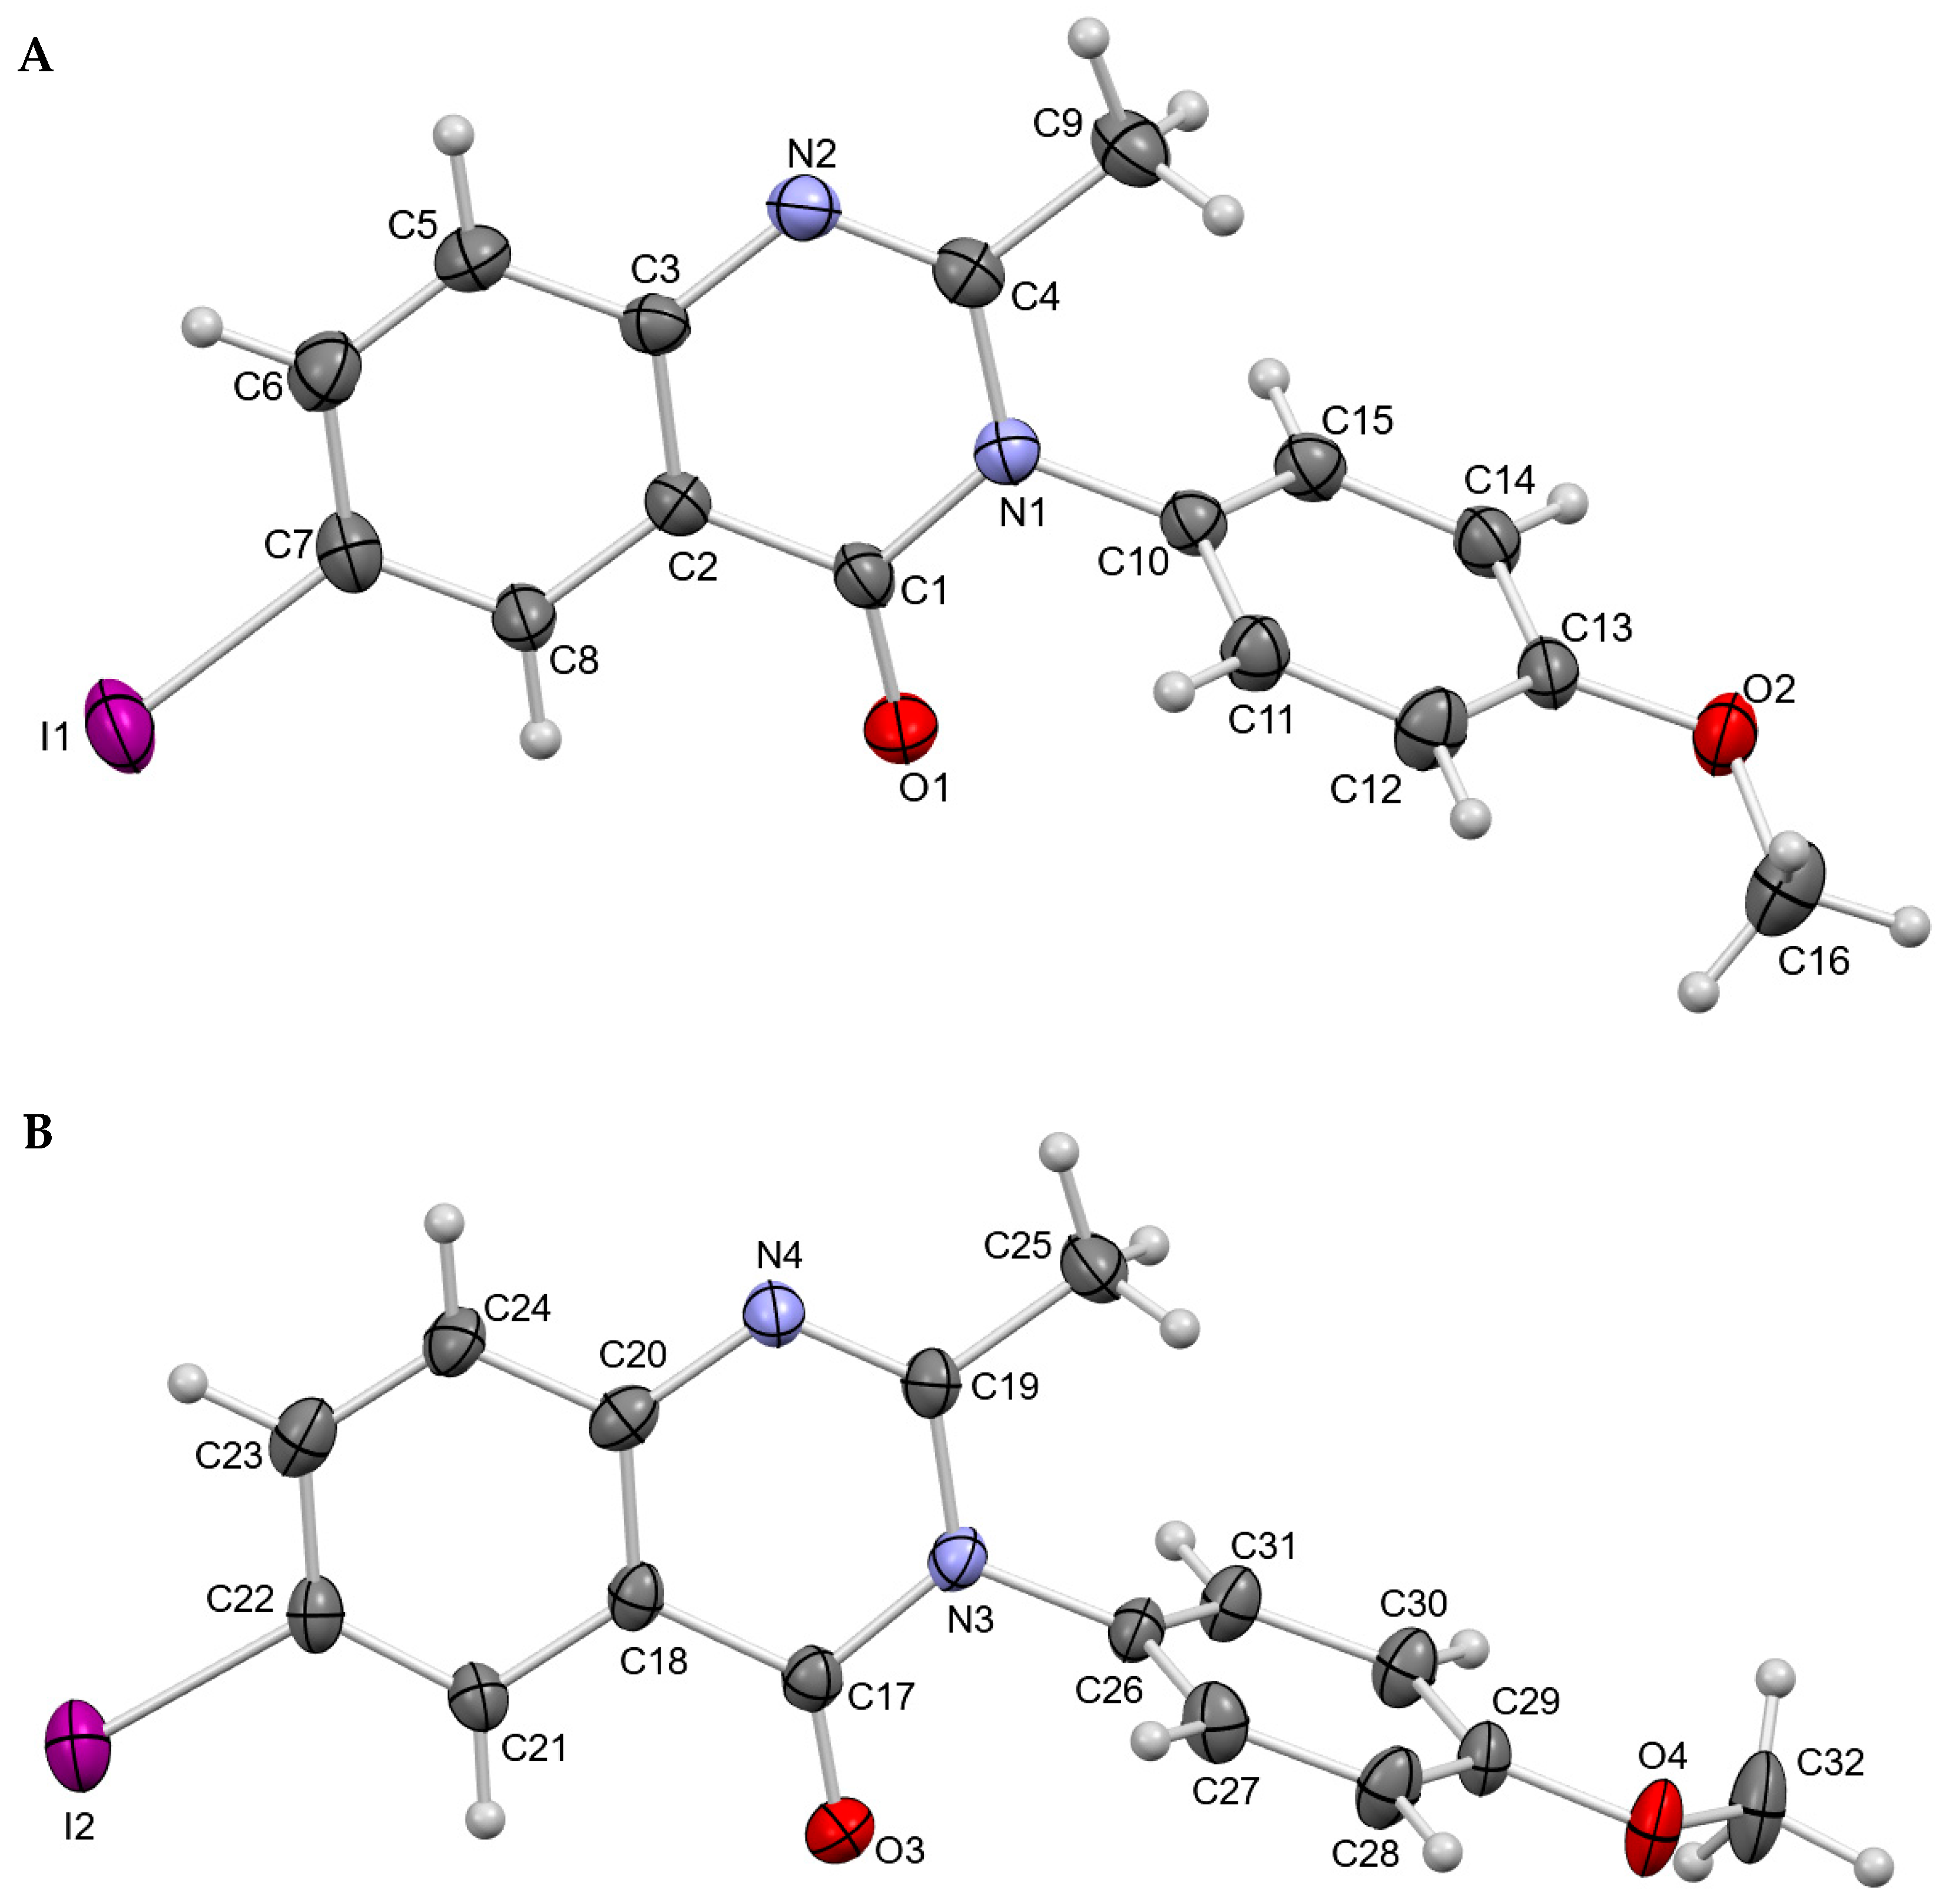
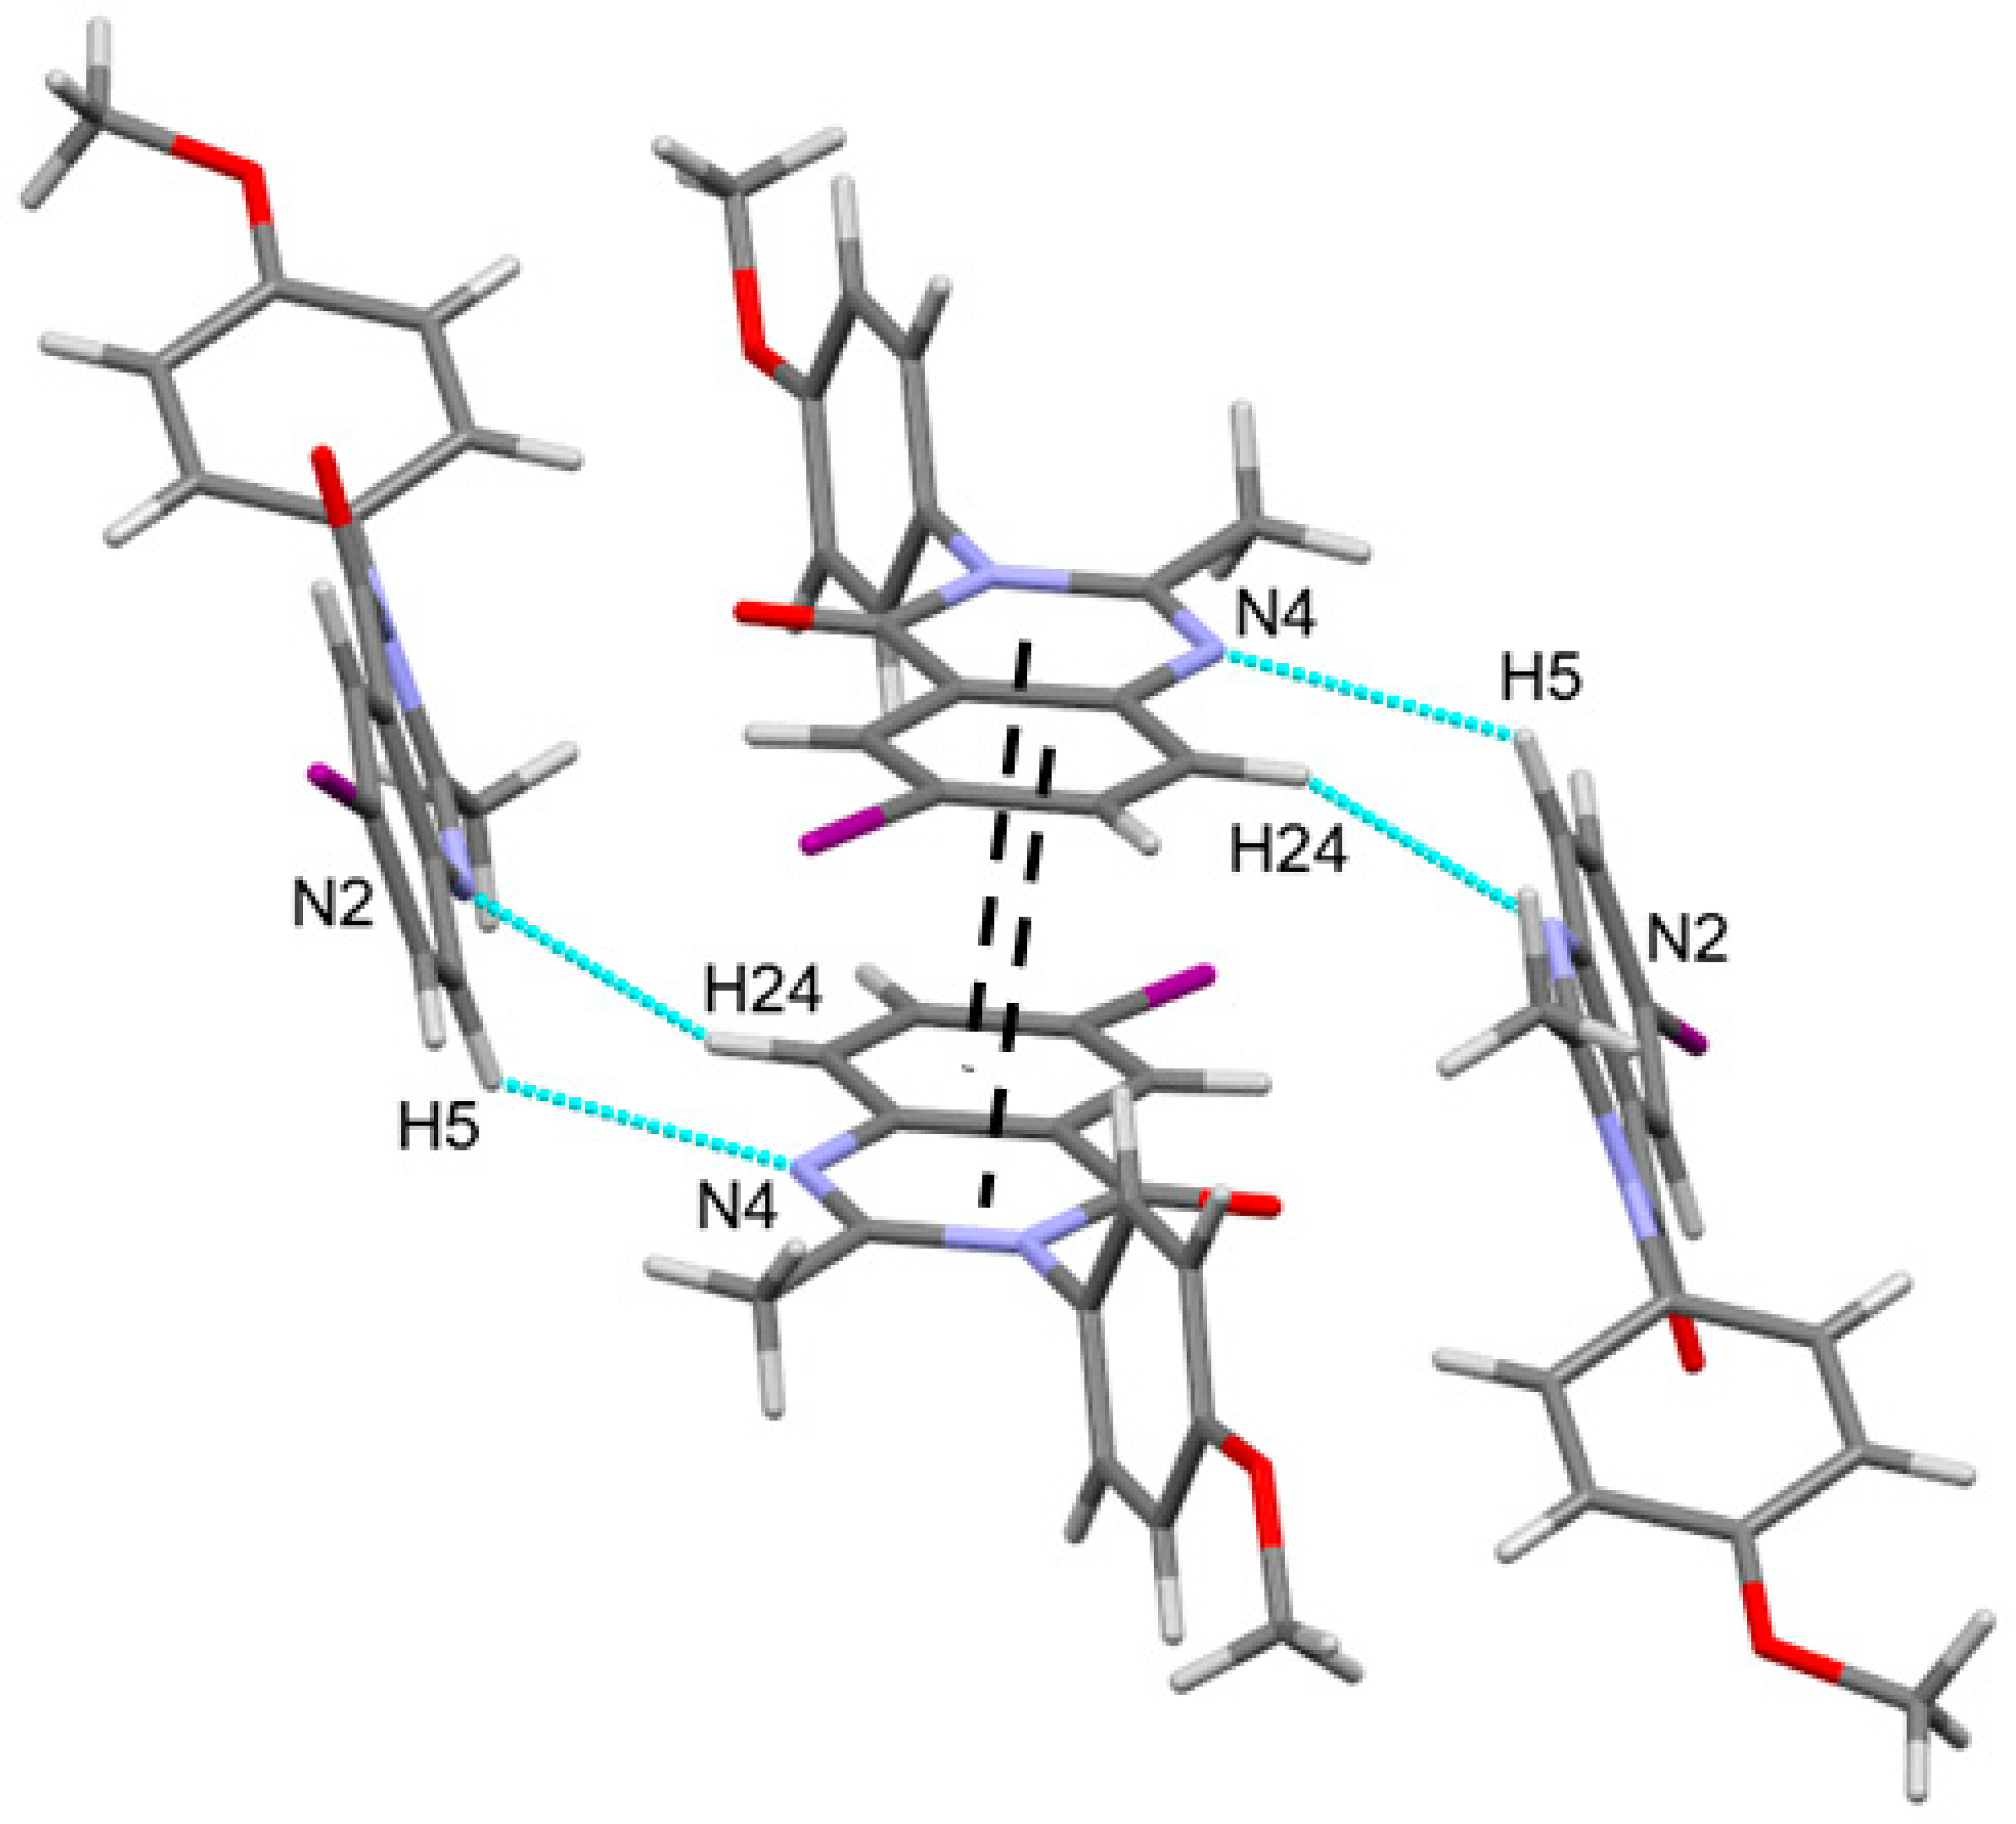
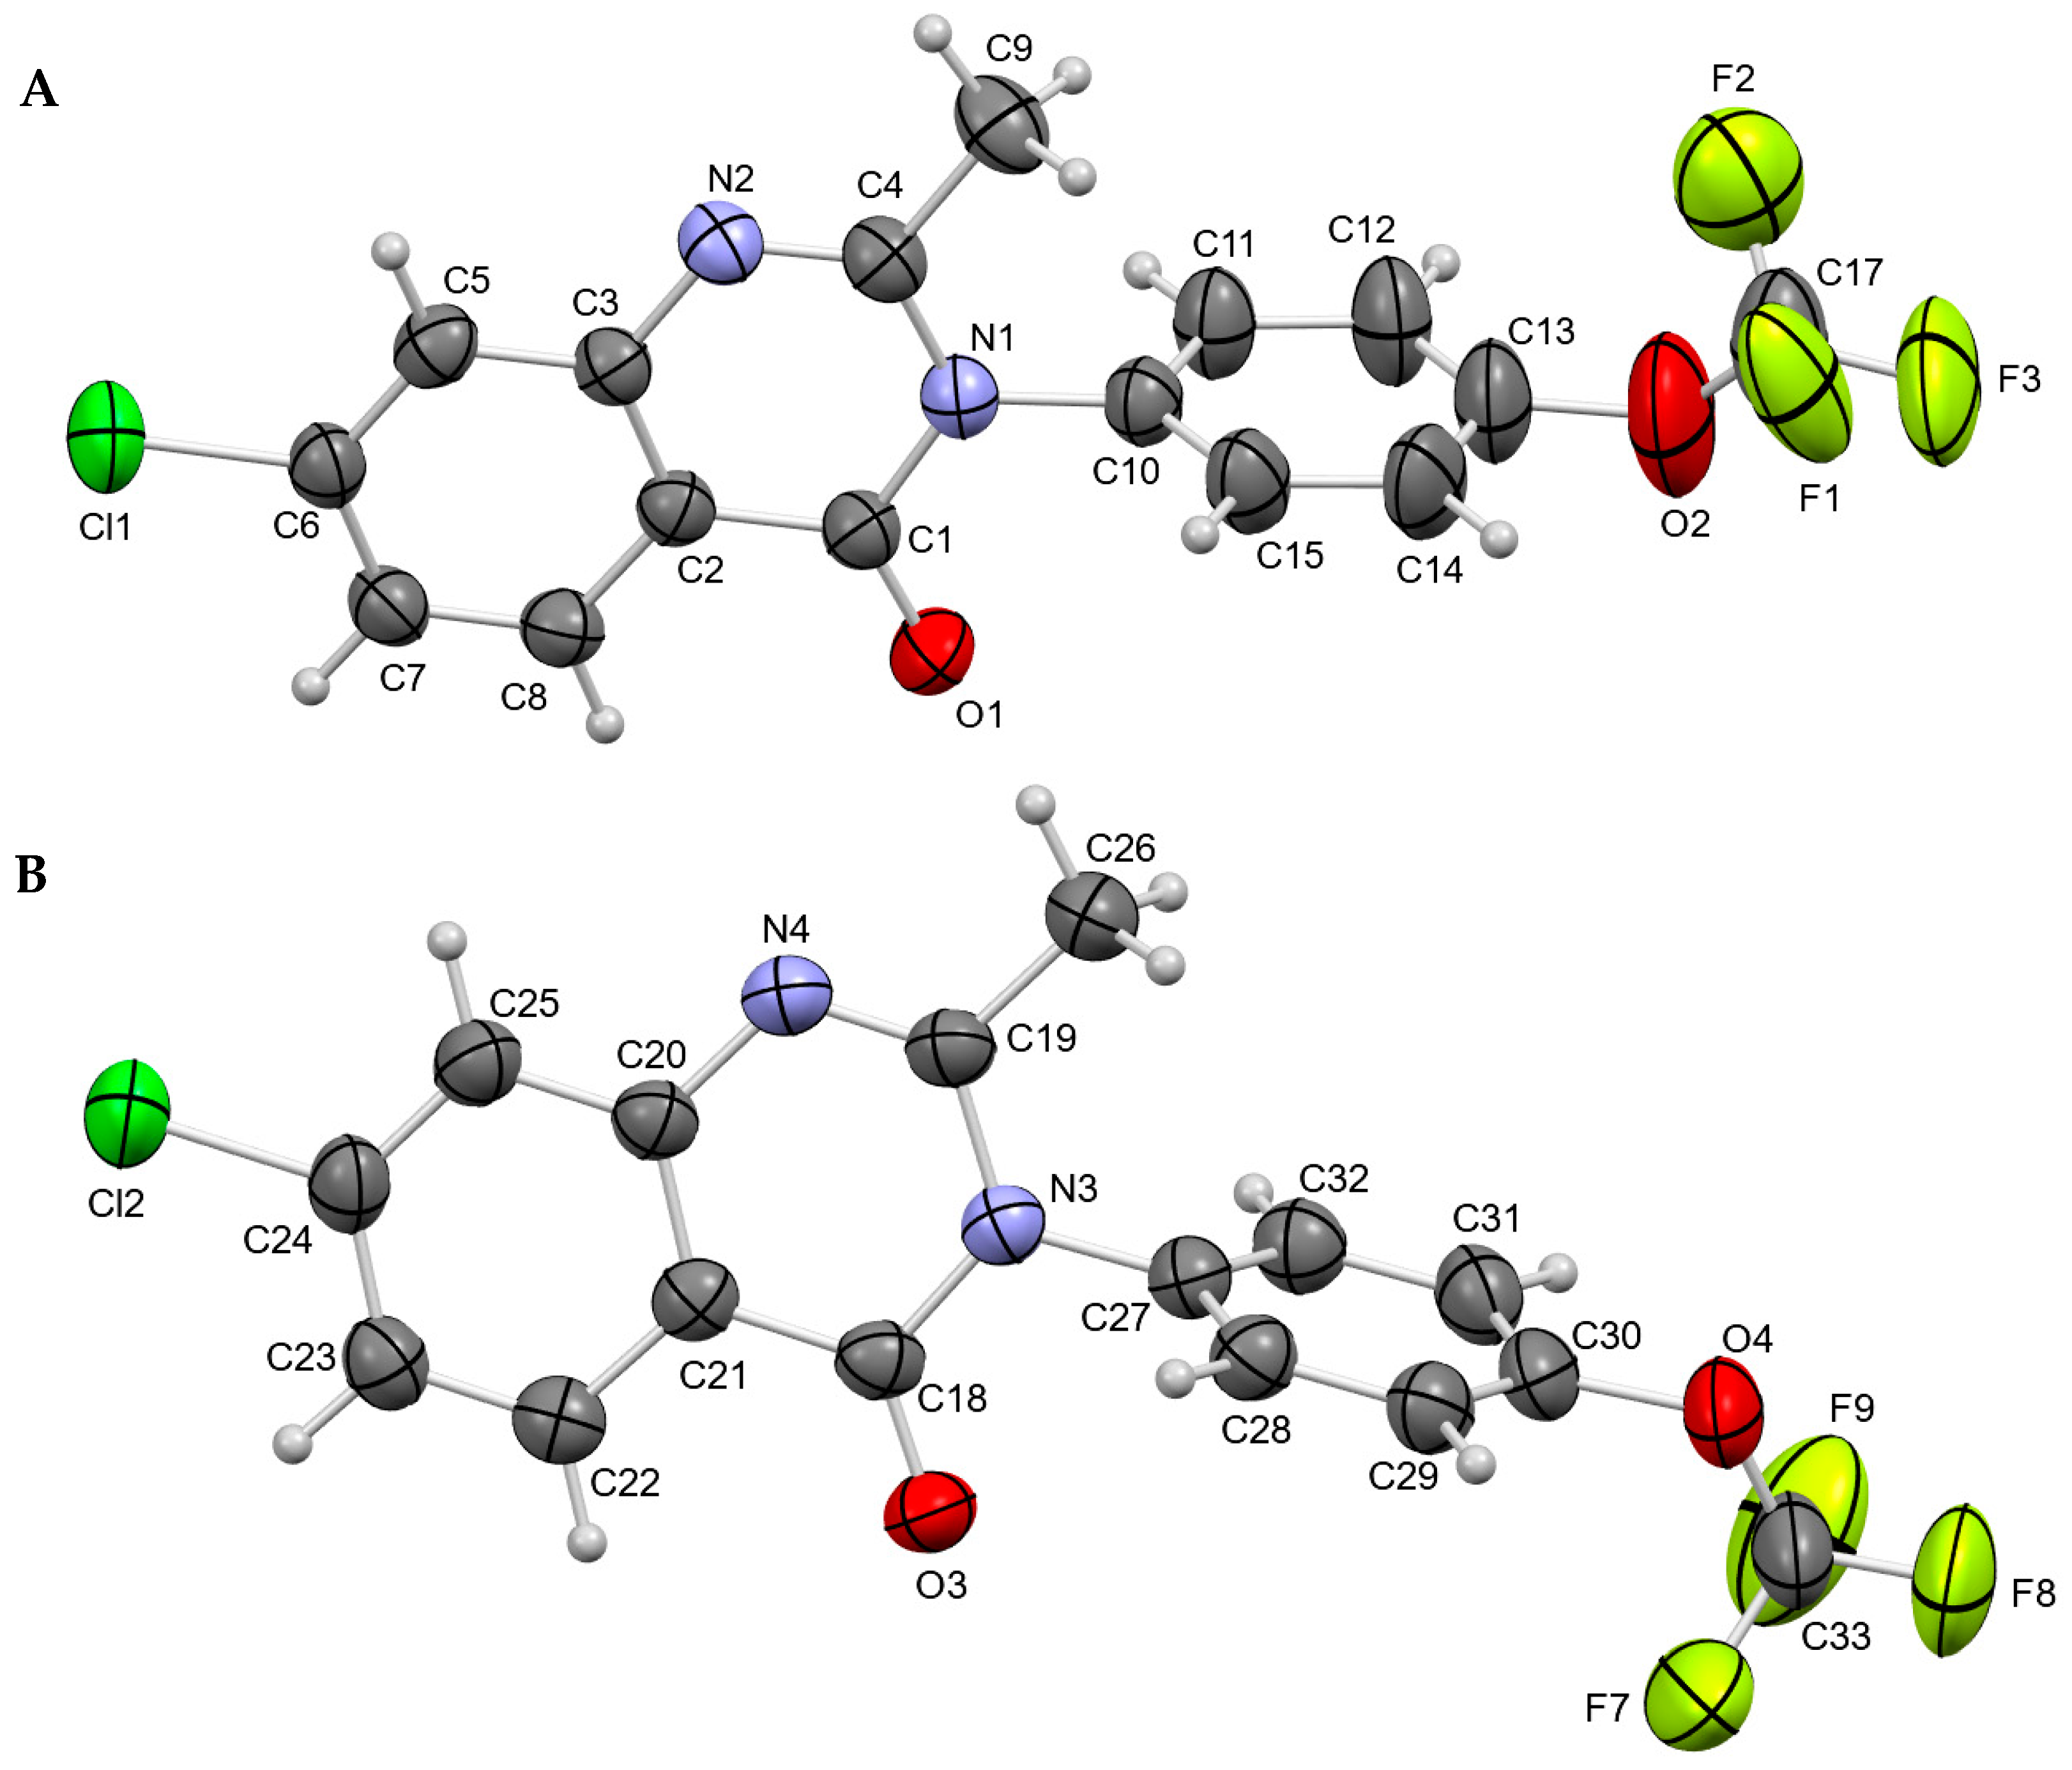
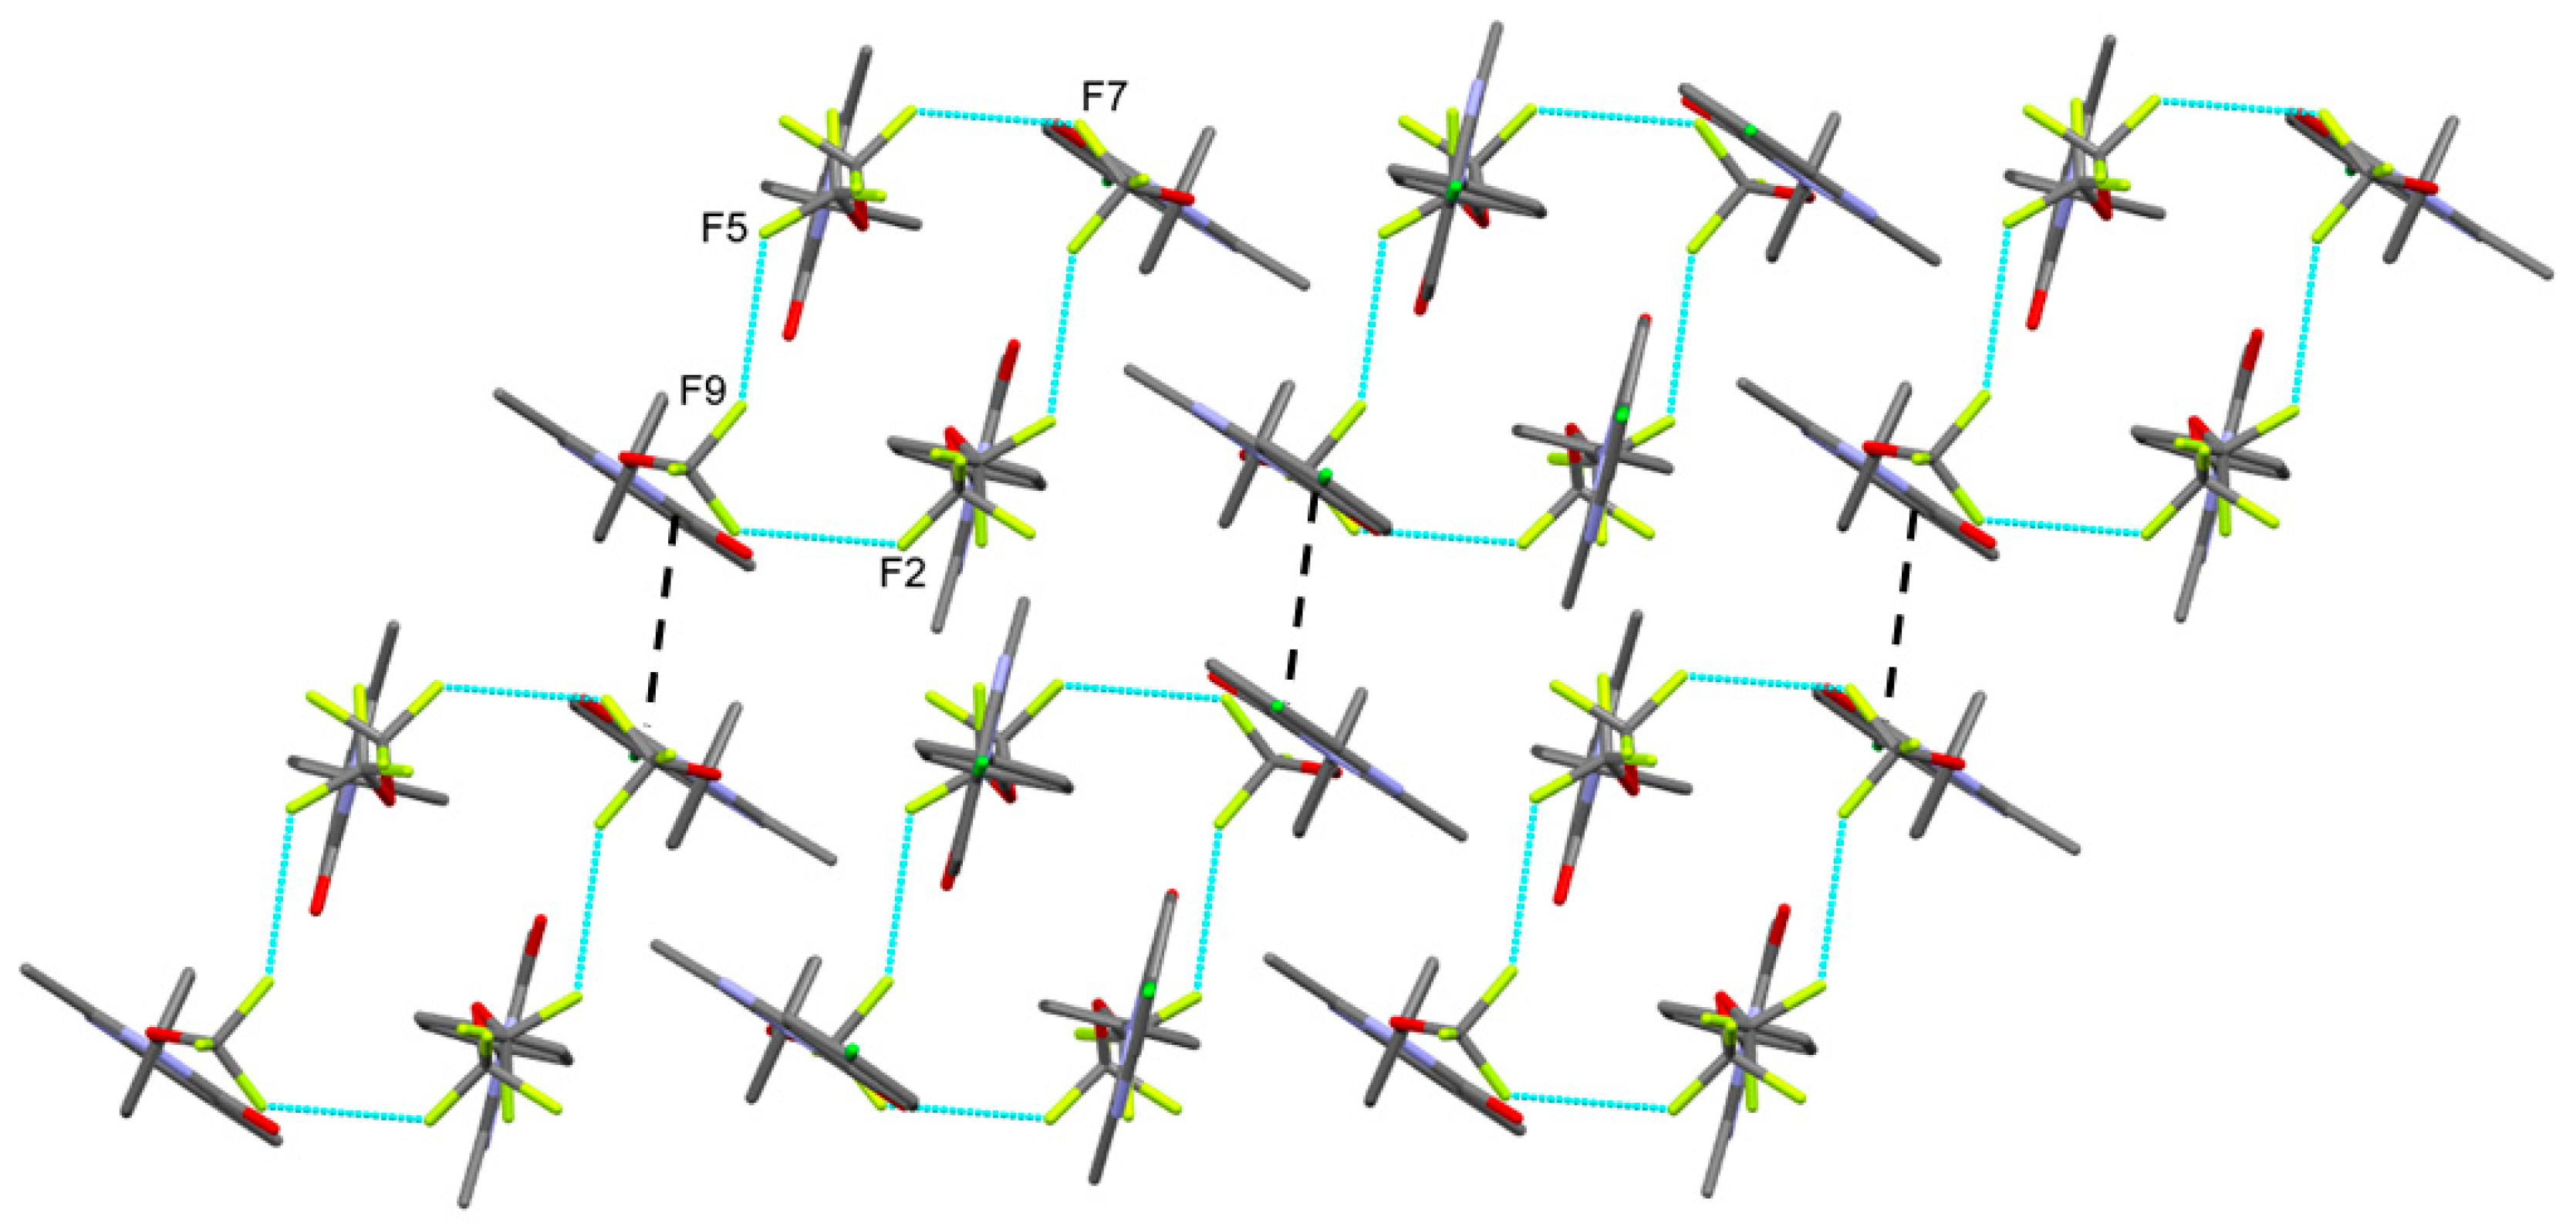
3.1. Crystal Structures

All three compounds are 3-phenylquinazolinones bearing different substituents on phenyl and quinazolinone moieties. Compounds 1 and 2 are iodo-substituted (position 6) on the quinazolinone moiety, while 3 is chloro-substituted (position 7). The phenyl part of molecules in 1, 2, and 3 is substituted by a chlorine atom, methoxy, and trifluoromethoxy group, respectively. In all three crystal structures, molecules are non-planar (the dihedral angles between the phenyl and quinazolinone moieties range from 72 to 89°). The compound 1 crystallizes in a monoclinic crystal system, space group P 21/n, with the two symmetrically independent molecules (A and B in Figure 1) in the asymmetric unit. The difference between the dihedral angles of phenyl and quinazolinone moieties is subtle, with 88.2(3)° and 86.1(3)° in A and B, respectively. The distance between I···Cl and Cl···Cl atoms in two pairs of symmetrically independent molecules is 3.720(2) Å (θ1 = 164.43, θ2 = 79.06°) and 3.394(3) Å (θ1 = θ2 = 83.99°). These distances are shorter than the sum of the van der Waals radii for Cl and I by 3% and 1%, indicating the presence of very weak contacts. Such considered tetramers are linked by weak π∙∙∙π interactions (Cg2···Cg6, 3.768(3) Å) along axis b (Figure 2). The presence of weak C–H∙∙∙N and C–H∙∙∙O interactions also contributes to the overall crystal stability (Table 2).
The molecular structure of 2 is shown in Figure 3. Like the previous structure, the asymmetric unit comprises two symmetry-independent molecules (A and B). The major difference between A and B molecules is in the OCH3 group twist, although there are no intermolecular interactions that could explain such a twist. The dihedral angles between phenyl and quinazolinone moieties are 72.7(1)° and 87.1(3)° in A and B, respectively. In the crystal, molecules A and B are connected by weak C–H∙∙∙N and C–H∙∙∙O interactions. Adjacent B molecules also form π∙∙∙π interactions (Cg5···Cg6, 3.778(4) Å, and (Cg6···Cg6, 3.781(5) Å) approximately along the crystallographic a-axis (Figure 4 and Table 2).
In the asymmetric unit of 3, there are also two symmetry-independent molecules (A and B in Figure 5). The OCF3 group in molecule A is disordered over two sites with a site occupancy ratio of 60:40. As in previous structures, the dihedral angles between phenyl and quinazolinone moieties (81.8(5)5° and 89.1(3)° in A and B, respectively) indicate that the molecule is non-planar. Several F···F interactions (d (F2···F7) = 2.732(12) Å (θ1 = 128.1, θ2 = 131.2) and d (F5···F9) = 2.818(16) Å (θ1 = 134.6, θ2 = 147.3)) between OCF3 groups in the crystal form a tubular tetrameric motif (Figure 6). These interactions are shorter than the sum of the van der Waals radius for the F atom by 7% and 4.1%, indicating the possibility of an attractive interaction. The presence of weak C–H∙∙∙N and C–H∙∙∙O interactions supports the stability of the tetrameric motif. The adjacent tetramers are connected along the crystallographic a-axis by π∙∙∙π interactions (Cg5···Cg5, 3.638(2) Å—Figure 6) and the c-axis by a series of weak C–H∙∙∙O and C–F∙∙∙π interactions (Table 2).

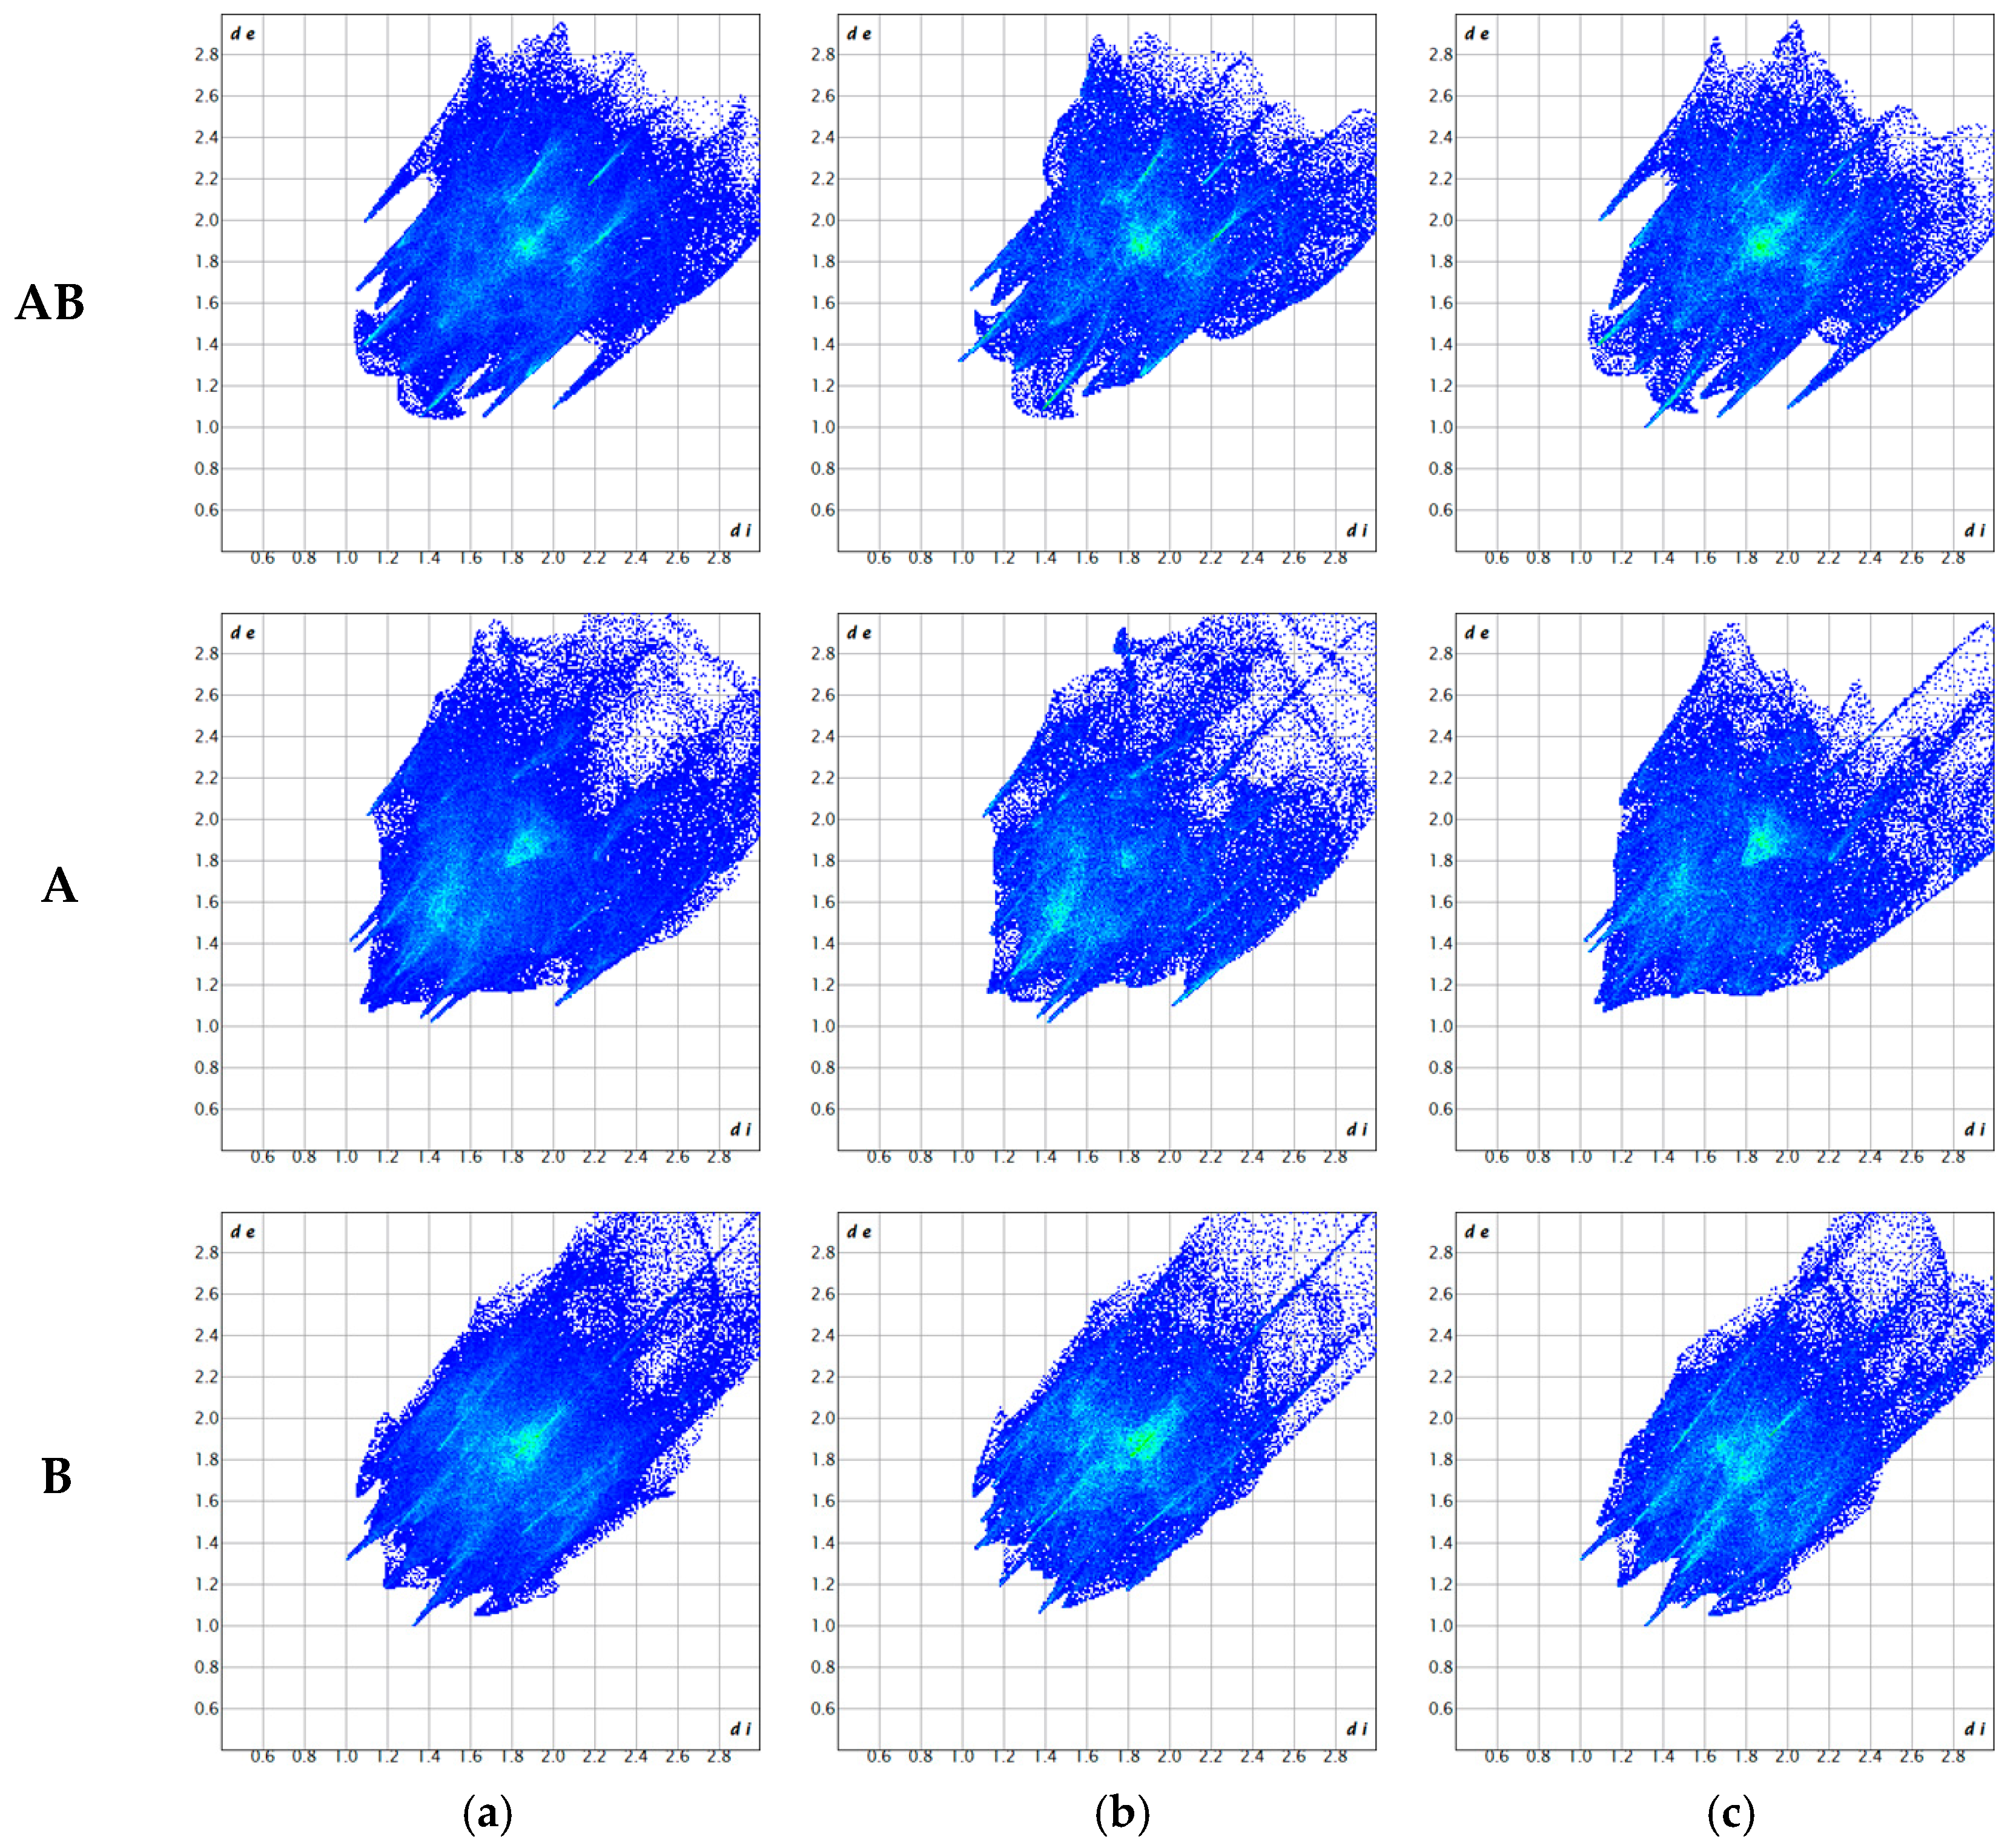
3.2. Hirshfeld Surface Analysis

Hirshfeld surfaces (HS) over dnorm for the title compounds are shown in Figure 7. The appearance of red spots on the dnorm surfaces indicates close contact between the neighboring molecules. These originate from close O···H/H···O interactions in all three structures. Additionally, red spots represent Cl···Cl and H···Cl/Cl···H interactions in 1, N···H/H···N interactions in 2, and N···H/H···N and F···F interactions in 3.
However, the aforementioned closest contacts are not the most significant contributors to the total HS; this holds for all three studied structures. The most prominent intermolecular interactions (by surface) in 1 are H…H (35.3%), I…H/H…I (12.1%), Cl…H/H…Cl (11.6%), C…H/H…C (11.0%), N…H/H…N (7.4%), O…H/H…O (5.8%), and C…C (4.0%, a consequence of π…π stacking); their contributions to the total HS vary when comparing the asymmetric unit (these are given in brackets) and individual molecules as might be expected from the differences in full 2D fingerprint plots (Figure 8a). Although there are differences between both symmetry-independent molecules (see structure description), the percentage contributions of the intermolecular contacts do not differ significantly and are about 85% of the total HS. From other minor contributions to the total HS, the most important are I…C/C…I contacts and I…Cl/Cl…I halogen bond interactions between A and B molecules, with each of them contributing an additional ≈ 4% to the total HS. The selected resolved 2D fingerprint plots and the percentage contributions to the total HS are given in ESI (Figures S1–S3).
With the exchange of the chlorine atom in 1 with the methoxy group in 2, the changes in the HS are as expected. Here, the red dots result from O…H/H…O and N…H/H…N close contacts. However, the intermolecular interactions contributing the most to the total HS are H…H (42.5%), I…H/H…I (15.9%), C…H/H…C (11.3%), O…H/H…O (12.6%), and N…H/H…N (4.6%; the values given are for the asymmetric unit); their contributions exceed 86% of total HS. Due to the absence of chlorine, the percentages of the first four contacts increase, while the percentages of N…H/H…N decrease. Again, their contributions to the total HS vary when comparing the asymmetric unit and individual molecules, as is evident from the differences in full 2D fingerprint plots (Figure 8b). The contribution of various other intermolecular interactions is expectedly small. The selected resolved 2D fingerprint plots and the percentage contributions to the total HS are presented in ESI (Figures S4–S6).
The substitution of the OCF3 group in 3 instead of OCH3 in 2 and the presence of the chloride substituent on a quinazolinone ring on position 7 instead of iodide on position 6 again reflects differences in the HS of 3. Here, the closest contacts are O…H/H…O, N…H/H…N, and F…F; all three are represented by red dots in Figure 7. With the introduction of fluorine, the most contributing interactions become H…F/F…H (19.2%), followed by H…H (15.6%), C…H/H…C (14.9%), H…Cl/Cl…H (12.3%), O…H/H…O (9.3%), Cl…F/F…Cl (5.5%), N…H/H…N (5.4%), and F…F interactions (5.0%; the values in brackets are for the whole asymmetric unit). The differences in 2D full fingerprint plots amongst the asymmetric unit and the individual molecules are represented in Figure 8c, while the resolved 2D fingerprint plots for all three cases are given in ESI (Figures S7–S9).

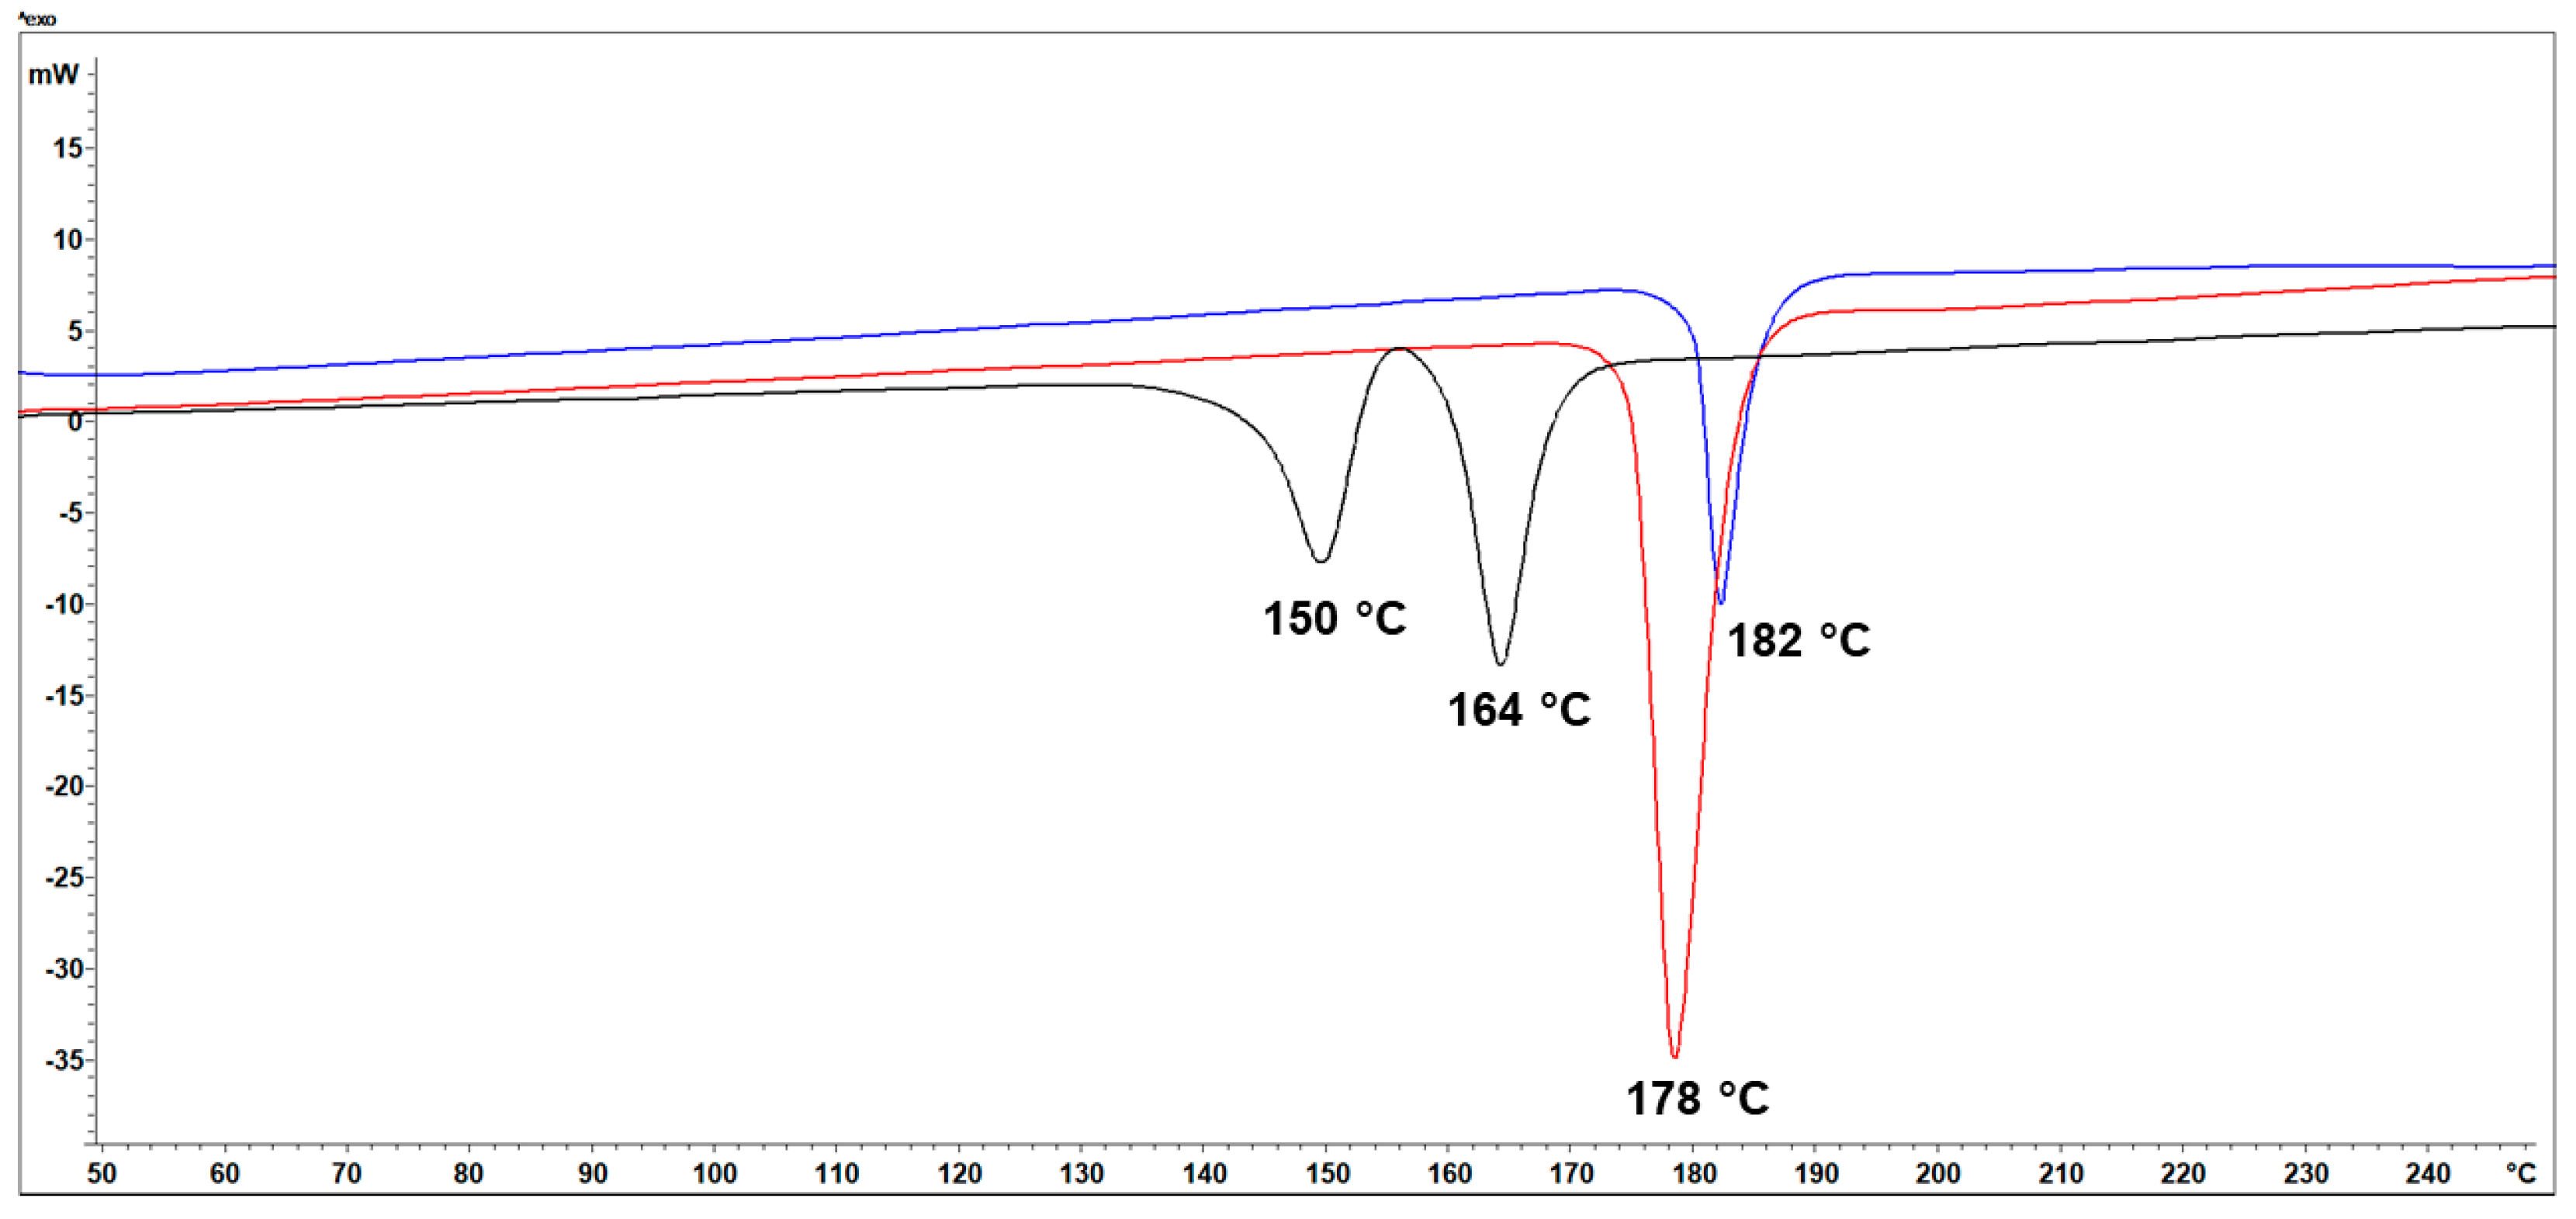
3.3. Thermal Analysis (TG/DSC)

The thermal decomposition in all three compounds occurs as a single step above 200 °C (Figures S10–S12). Before the decomposition, distinct endothermic events can be observed on DSC curves and interpreted as melting points. The compound with the highest melting point is 3 (182 °C), followed by 2 (178 °C) and 1 (150–164 °C) (Figure 9).
Interestingly, there are two endothermal events in 1, which can be interpreted as the melting points of two polymorphic forms (forms I and II). Form I is designated as the low melting point form (150 °C), and form II is the high melting point form (164 °C). The XRD diffractograms at 120 °C (Figure 10) show that the structural pattern of form I still prevails, but a new one appears, characterized by diffraction maxima at 2θ 10.5°, 11.5°, 16°, and 8°, belonging to the second structural pattern (form II) rather than the first. At 130 °C, the structure that produces the first pattern, if it exists, is mainly amorphous. At 150 °C, only the high-temperature form II is present. At 160 °C, there are no distinct diffraction maxima, so it can be concluded that everything is amorphous (probably liquid as observed on DSC curves). Upon cooling to the initial temperature, the sample remains dominantly amorphous. If the sample is heated (in the DSC) from 25 to 170 °C and cooled down repeatedly, the described changes are observed in the first measurement (melting of two distinct forms). Upon cooling, there are no visible phase transformations that could be assigned to the crystallization of the compound (either form I or II). With repeated heating sequences, the glass transition occurs close to 60 °C during heating. According to the obtained DSC and PXRD results, the melting of the low-temperature form I occurs first, after which the high-temperature form II crystallizes and melts close to 160 °C. The results indicate that this process is irreversible and that the final product is the amorphous phase of compound 1. The constructed Gibbs free-energy diagram (Figure S13), the heat of fusion, and the entropy of fusion rules [29] (Table S1) indicate that the relationship between these two forms is monotropic.
As discussed in the introduction, the value of the melting point (Tmp) of a compound is related to the value of entropy (ΔSf) and enthalpy (ΔHf) of the fusion process (Equation (1)). In the most straightforward cases of rigid molecules, the entropy can be related to molecular symmetry using the rotational symmetry number σ (i.e., by the number of indistinguishable possible rotational orientations). Equation (2) can be used to determine the fusion entropy of simple rigid molecules [30]:
T m p = H f S f
S f = C R l n σ
Equation (2) (C = 56.5 kJ mol−1) shows that a higher rotational number decreases the fusion entropy, increasing the compound’s melting point. When the sample is heated (or melted), molecules use extra energy for translational or rotational movement, disrupting the crystal structure’s order (and intermolecular interactions). From the structural point of view, a higher rotational number means that molecules can rotate in the solid but still be adequately oriented to preserve the existing (or slightly modified) intermolecular interactions, lowering the entropy and increasing the melting point. Some examples that confirm these assumptions were found among halo-substituted benzene isomers (i.e., σ = 1 for low-melting 1,2-dichlorobenzene and σ = 2 for high-melting 1,4-dichlorobenzene) [8]. The enthalpy factors are relatively straightforward: a more significant number of strong intermolecular interactions implies a higher melting point.
Interestingly, some thermodynamic investigations of rigid isomers [30] have shown that the higher rotational number is more related to the increase in enthalpy than the decrease in entropy, thus implying that enthalpic factors are more important for the increase in melting point. In the series presented herein, compound 1 is the lowest-melting compound, displaying only weak π∙∙∙π, C–H∙∙∙N and C–H∙∙∙O interactions. In this compound, HHIs are of minor importance due to the weak contact of atoms (3% and 1% shorter than the sum of vdW radii). However, the HSA analysis indicates that Cl and I atoms participate in the formation of other interactions ((I…H/H…I (12.1%) and Cl…H/H…Cl (11.6%)), therefore contributing to the overall crystal stability. Additional confirmation of the positive influence of halogen atoms in this compound is the slight increase in melting point compared to unsubstituted 3-phenylquinazolinone (145–146 °C), with some exceptions in ortho-substituted enantiopure compounds (vide infra). Compounds 2 and 3 are examples of compounds with polyatomic substituents on the phenyl ring (OCH3 and OCF3), with higher melting points than 1.
In the OCH3-substituted compound, no strong intermolecular interactions could explain the increase in the melting point. Regarding molecular symmetry, all three (pairs of) molecules are low in symmetry (C1 group). Therefore, rotational number related to symmetry cannot be the reason for the melting point increase. The significant difference between these compounds is the presence of polyatomic substituents on the phenyl ring (OCH3 and OCF3 in 2 and 3). Some important rotations in these molecules are around Nquinazoline–Cphenyl bond (related to the previously mentioned dihedral angle) and Cphenyl–X or AB3 substituent. Regarding the entropy factor, these rotations can be considered as potential stabilization factors; i.e., the rotation of AB3 group creates more favorable orientations of molecules during the melting process, resulting in a decrease in entropy and an increase in the melting point. This influence can be named functional group rotation influence and might be the reason for the melting point increase. In compound 3, the F···F halogen interactions are important as an additional enthalpic factor in the overall crystal stability. As previously discussed, the energy of these interactions is small and cannot be the sole reason for the melting point increase in 3.
To further investigate HHIs’ influence on thermal properties, a CSD database [31] search for 3-phenylquinazolinones was conducted, resulting in 14 relevant hits (Table S2). Among the data found, three structures (KELGOB [32], SOHCIE [33], and TUXLIJ [34]) were reported without the experimental melting point value and were therefore not considered. The melting point of unsubstituted 3-phenylquinazolinone was reported to be 145–146 °C [35], and this value can be used as a reference point for further discussion. The compounds with the highest melting point are nitro-substituted, either on the phenyl ring (WULKOF (171–173 °C) and WULMIB (220–222 °C)) [36] or quinazoline ring (LAQHES (281 °C) [37]). Interestingly, the compound with the highest melting point is nitro-substituted on the quinazoline ring, and the melting point is lowered when the nitro-substituent is located on the phenyl ring (Figure 11). In the LAQHES structure, no classical hydrogen bonds involve the nitro group. The molecules are primarily connected by strong aromatic interactions (offset π···π, Cg···Cg distance 3.496 Å) of the quinazoline rings. According to the Hunter–Sanders model [38], strong aromatic interactions occur due to the nitro group’s electron-withdrawing effect, which can be the reason for such a high melting point value. Substituents can sterically hinder these strong aromatic interactions on the same aromatic system. For example, in the crystal structures of WULKOF (OCH3-substituted) and WULMIB (Cl-substituted), there are no aromatic interactions. Interestingly, the melting point of WULMIB is about 50 °C higher than WULKOF. This can be explained to some extent by the presence of the Cl···O halogen bond (3.141 Å; Figure S14). Melting point values of DUJSIN (173–175 °C) [39] and ZIYYUE (120 °C) [40] additionally confirm that compounds with a higher melting point are those substituted on the quinazoline ring, while compounds with a lower melting point are those substituted on the phenyl ring. Although an additional aromatic system is present in DUJSIN, it does not participate in the aromatic interactions. As in 2 and 3, the free rotation of phenyl moieties in DUJSIN might be the reason for the decrease in entropy and the increase in melting point.
Several recent investigations of ortho-halo-phenyl-substituted 3-phenylquinazolinones [16,38], have indicated that the melting point of these compounds is somewhat lower than that of the unsubstituted compound (Figure 12). It was also found that the melting point depends on the optical purity of compounds. For example, the racemic mixture of ortho-bromo-substituted compound (rac-NEPNOO) [16] has a melting point of 149–151 °C, while the pure form (ent-EZUHUE) [41] has a melting point of 104–105 °C. The authors explained this difference by the presence of C=O···Br interaction in the racemic mixture (Figure S15), which is absent in the structure of the enantiomer. Similar observations have been made for ortho-iodo-substituted compounds (rac-SOKQOB and ent-SOKQUH) [42], except that C=O···I interactions are found in both rac and ent compounds. The melting point difference of almost 80 °C can be explained by geometrical and energy differences in these halogen bond interactions; namely, in the enantiopure form, the orientation of the iodine lone pair is unfavorable for strong lone pair–σ-hole interactions [42]. Interestingly, the melting points of rac and ent ortho-chloro-substituted compounds (rac-SOQKIV and ent-SOQKER) are almost the same, although there are some differences in the halogen bonding patterns. The order of halogen bond energies (I > Br > Cl >> F) provides a plausible explanation for this. Lower halogen bond energy means less influence of these interactions on the melting point, and some other interactions (C–H∙∙∙N, C–H∙∙∙O, and aromatic) are the reason for the increase in the melting point value. The crystal structure of the ortho-fluoro-substituted compound (rac-SOKRAO) is without any halogen interactions, emphasizing the importance of halogen bond interactions in iodo- and bromo-substituted compounds and the halogen bond energy order.
Although crystal structures of meta- and para-halo-phenyl-substituted 3-phenylquinazolinones are yet to be resolved, most of these compounds were synthesized, and the melting points were determined (Figure 13, Table S2 [43,44,45,46,47]. The melting points of these compounds quite nicely correlate to the molecular structure. Firstly, there is an increase in melting point in correlation to the position of the substituent: para > meta > ortho. Such behavior might be related to the availability of halogen atoms for halogen bonds. In meta and para compounds, halogen atoms are not sterically hindered by substituents on the quinazolinone, therefore enabling better contact of halogen atoms with atoms of adjacent molecules. On the other hand, because of less hindrance, meta and para compounds might be planar molecules (dihedral angle of phenyl and quinazoline), with closer intermolecular contacts increasing the possibility for the formation of strong aromatic interactions. Regarding halogen atom type, the order of melting points is Cl ≈ Br > F > I for all three substitution positions and enantiopure crystal structures. For racemic crystals, melting points follow the order Br > I ≈ Cl > F. This order does not correlate with halogen bond interaction energy (I > Br > Cl >> F); therefore, it is only reasonable to presume that the melting point depends on halogen interactions, other weak interactions, and entropic factors. Interestingly, the melting point order correlates to the halogen bond energy in racemic crystal structures, emphasizing that halogen bonds can improve crystal stability but only in situations where the geometry and energy of these interactions are favorable (i.e., proper orientation of CD and CC regions). The size (radii) of the substituent might also be an important factor for the thermal stability of these compounds. For example, an iodine atom can form rather strong halogen interactions that can improve thermal stability but also cause the distancing of molecules in a crystal and reduce favorable attractive interactions.
There are only two examples of phenyl-disubstituted compounds [41,48], both para-substituted (2,4-Cl and 2-Br-4-Cl). The 2-Br-4-Cl is a compound with a high melting point, which might be related to the halogen bond strength order (Figure 13). As mentioned, quinazoline-substituted compounds are compounds with a high melting point (for example, the 3-Cl-6-Cl compound has a melting point 38 °C higher than 3-Cl). A series of ortho, meta, and para-chlorophenyl-7-Cl-quinazoline compounds (3-Cl-7-Cl, 4-Cl-7-Cl, and 2-Cl-7-Cl) were prepared, and melting point values were reported [21,49] (Figure 13). Contrary to phenyl-substituted compounds, the order of melting points was ortho > para > meta within this group. Unfortunately, without knowledge of crystal structures, it is not possible to explain such an order. Finally, several phenyl-6-quinazolinone-substituted compounds were prepared, and the melting points were reported [50,51]. A detailed analysis of the relationship between structure and melting point for these compounds is not possible due to the lack of crystal structure information, but it is interesting to note that these compounds display lower melting points in comparison to the 7-quinazoline-substituted ones (e.g., melting points of 2-Cl-7-Cl and 2-Cl-6-Cl).

4. Conclusions

The crystal structures of three halo-substituted phenyl-quinazolinones were determined and compared to explore the potential relationship between intermolecular interactions and thermal properties. Special emphasis was placed on halogen atoms, which involve interactions and a potential increase in entropy related to conformational freedom functional groups. In a molecular sense, all three compounds are rather similar and can be described as 3-phenylquinazolinones with different substituents on phenyl and quinazolinone moieties (1 = 3-(4-chlorophenyl)-6-iodo-2-methylquinazolin-4(3H)-one, 2 = 6-iodo-3-(4-methoxyphenyl)-2-methylquinazolin-4(3H)-one, and 3 = 7-chloro-2-methyl-3-[4-(trifluoromethoxy)phenyl]quinazolin-4(3H)-one). Due to the presence of different halogen atoms, these compounds form diverse intermolecular interactions: weak π∙∙∙π interactions and I···Cl and Cl···Cl halogen bonds in 1; C–H∙∙∙N, C–H∙∙∙O, and π∙∙∙π interactions in 2; and F···F, C–H∙∙∙N, C–H∙∙∙O, and π∙∙∙π interactions in 3. The thermal analysis of compounds shows that the compound with the highest melting point is 3 (182 °C), followed by 2 (178 °C) and 1 (150–164 °C). Although intermolecular interactions, as an enthalpy factor, are usually the reason for an increase in melting point, it was found that this cannot be the sole reason for such a melting point order. Therefore, we presume that the entropy process related to the rotation of polyatomic groups (functional group rotation influence) during melting could play a significant role in the melting point value. The structure and melting point analysis of previously reported 3-phenylquinazolinones indicate that the compounds with the highest melting point are quinazoline-substituted. Among halo-phenyl-substituted compounds, melting points follow the sequence ortho < meta < para. The type of halogen atom is important only in situations where the geometry of halogen interactions is favorable for the formation of strong interactions (i.e., proper orientation of CD and CC regions). The results reported herein could provide very useful information for the supramolecular design of organic compounds with a high melting point and the design of thermostable halo-substituted pharmaceuticals.

Supplementary Materials

CCDC 2410138-2410140 contains the supplementary crystallographic data for this paper. These data can be obtained free of charge via http://www.ccdc.cam.ac.uk/conts/retrieving.html or from the Cambridge Crystallographic Data Centre, 12 Union Road, Cambridge CB2 1EZ, UK; fax: (+44) 1223-336-033; or e-mail: deposit@ccdc.cam.ac.uk. The following supporting information can be downloaded at https://www.mdpi.com/article/10.3390/cryst15010039/s1: Figure S1. The 2D resolved fingerprint plots for the whole asymmetric unit of 1; Figure S2. The 2D resolved fingerprint plots for molecule A of 1; Figure S3. The 2D resolved fingerprint plots for molecule B of 1; Figure S4. The 2D resolved fingerprint plots for the whole asymmetric unit of 2; Figure S5. The 2D resolved fingerprint plots for molecule A of 2; Figure S6. The 2D resolved fingerprint plots for molecule B of 2; Figure S7. The 2D resolved fingerprint plots for the whole asymmetric unit of 3; Figure S8. The 2D resolved fingerprint plots for molecule A (occupancy 60%) of 3; Figure S9. The 2D resolved fingerprint plots for molecule B of 3; Figure S10. TG (black) and DSC (red) curves of 1; Figure S11. TG (black) and DSC (red) curves of 2; Figure S12. TG (black) and DSC (red) curves of 3; Table S1. Thermodynamic data of the DSC measurements for all compounds; Table S2. Results of CSD database search; Figure S13. Linear Gibbs free-energy functions for forms I and II; Figure S14. Representation of Cl···O halogen bond in WULMIB; Figure S15. Representation of C–Br···O halogen bond in rac-NEPNOO.

Author Contributions

Writing—original draft preparation, writing—review and editing, formal analysis, investigation, and funding acquisition: I.Đ.; formal analysis, writing—original draft preparation, investigation, and writing—review and editing: N.J.; formal analysis, funding acquisition, writing—original draft preparation, and investigation: M.K., M.M., and M.P.; conceptualization, funding acquisition, supervision, writing—original draft preparation, writing—review and editing, and investigation: T.B. All authors have read and agreed to the published version of the manuscript.

Funding

This work was supported in part by the Croatian Science Foundation under the project “Green Technologies in Synthesis of Heterocyclic Compounds” (UIP-2017-05-6593),the Slovenian Research and Innovation Agency (program grant P1-0175) and CIuK co-financed by the Croatian Government and the European Union through the European Regional Development Fund—Competitiveness and Cohesion Operational Programme (Grants KK.01.1.1.02.0016).

Data Availability Statement

The data used in this study are available upon request.

Conflicts of Interest

The authors declare no conflicts of interest.

References

  1. Chu, K.A.; Yalkowsky, S.H. An interesting relationship between drug absorption and melting point. Int. J. Pharm. 2009, 373, 24–40. [Google Scholar] [CrossRef] [PubMed]
  2. Batisai, E.; Ayamine, A.; Kilinkissa, O.E.Y.; Báthori, N.B. Melting point–solubility–structure correlations in multicomponent crystals containing fumaric or adipic acid. CrystEngComm 2014, 16, 9992–9998. [Google Scholar] [CrossRef]
  3. Cysewski, P.; Przybyłek, M.; Jeliński, T. Intermolecular interactions as a measure of dapsone solubility in neat solvents and binary solvent mixtures. Materials 2023, 16, 6336. [Google Scholar] [CrossRef] [PubMed]
  4. Bujak, M.; Podsiadło, M.; Katrusiak, A. Properties and interactions–melting point of tribromobenzene isomers. Acta Crystallogr. Sect. B Struct. Sci. Cryst. Eng. Mater. 2021, B77, 632–637. [Google Scholar] [CrossRef]
  5. Balić, T.; Paurević, M.; Počkaj, M.; Medvidović-Kosanović, M.; Goman, D.; Széchenyi, A.; Preisz, Z.; Kunsági-Máté, S. Influence of Aliphatic Chain Length on Structural, Thermal and Electrochemical Properties of n-alkylene Benzyl Alcohols: A Study of the Odd–Even Effect. Molecules 2022, 27, 3781. [Google Scholar] [CrossRef]
  6. Pradeilles, J.A.; Zhong, S.; Baglyas, M.; Tarczay, G.; Butts, C.P.; Myers, E.L.; Aggarwal, V.K. Odd–even alternations in helical propensity of a homologous series of hydrocarbons. Nat. Chem. 2020, 12, 475–480. [Google Scholar] [CrossRef]
  7. Yalkowsky, S.H.; Alantary, D. Estimation of melting points of organics. J. Pharm. Sci. 2018, 107, 1211–1227. [Google Scholar] [CrossRef] [PubMed]
  8. Bujak, M. Melting point, molecular symmetry and aggregation of tetrachlorobenzene isomers: The role of halogen bonding. Acta Crystallogr. Sect. B Struct. Sci. Cryst. Eng. Mater. 2018, B74, 458–466. [Google Scholar] [CrossRef]
  9. Keesom, W.H.; Taconis, K.W. On the crystal structure of chlorine. Physica 1936, 3, 237–242. [Google Scholar] [CrossRef]
  10. Vonnegut, B.; Warren, B.E. The structure of crystalline bromine. J. Am. Chem. Soc. 1936, 58, 2459–2461. [Google Scholar] [CrossRef]
  11. Harris, P.M.; Mack, E., Jr.; Blake, F.C. The atomic arrangement in the crystal of orthorhombic iodine. J. Am. Chem. Soc. 1928, 50, 1583–1600. [Google Scholar] [CrossRef]
  12. Saha, B.K.; Veluthaparambath, R.V.P.; Krishna, G.V. Halogen⋯Halogen Interactions: Nature, Directionality and Applications. Chem. Asian J. 2023, 18, e202300067. [Google Scholar] [CrossRef] [PubMed]
  13. Ibrahim, M.A.A.; Saeed, R.R.A.; Shehata, M.N.I.; Ahmed, M.N.; Shawky, A.M.; Khowdiary, M.M.; Elkaeed, E.B.; Soliman, M.E.S.; Moussa, N.A.M. Type I–IV halogen⋯halogen interactions: A comparative theoretical study in halobenzene⋯halobenzene homodimers. Int. J. Mol. Sci. 2022, 23, 3114. [Google Scholar] [CrossRef] [PubMed]
  14. Silva, A.L.; da Silva Filho, D.A.; Moberg, M.E.; Pappenfus, T.M.; Janzen, D.E. Halogen interactions in halogenated oxindoles: Crystallographic and computational investigations of intermolecular interactions. Molecules 2021, 26, 5487. [Google Scholar] [CrossRef]
  15. Asif, M. The study of pyridazine compounds on prostanoids: Inhibitors of COX, cAMP Phosphodiesterase, and TXA2 Synthase. Int. J. Med. Chem. 2014, 2014, 703238. [Google Scholar]
  16. Alsibaee, A.M.; Al-Yousef, H.M.; Al-Salem, H.S. Quinazolinones, the winning horse in drug discovery. Molecules 2023, 28, 978. [Google Scholar] [CrossRef] [PubMed]
  17. Akbari, A.; Zahedifar, M. Synthesis of Quinazolin-4(3H)-ones via a novel approach. J. Saudi Chem. Soc. 2023, 27, 101597. [Google Scholar] [CrossRef]
  18. Peña-Solórzano, D.; Guilombo, C.E.G.; Ochoa-Puentes, C. Rapid and eco-friendly high yield synthesis of dihydroquinazolinones mediated by urea/zinc chloride eutectic mixture. Sustain. Chem. Pharm. 2019, 14, 100167. [Google Scholar] [CrossRef]
  19. Terada, S.; Hirai, M.; Honzawa, A.; Kitagawa, O.; Kamizela, A.; Wzorek, A.; Soloshonok, V.A. Possible Case of Halogen Bond-Driven Self-Disproportionation of Enantiomers (SDE) via Achiral Chromatography. Chem.-Eur. J. 2017, 23, 14631–14638. [Google Scholar] [CrossRef] [PubMed]
  20. Komar, M.; Rastija, V.; Bešlo, D.; Molnar, M. Synthesis of quinazolin-4(3H)-ones in natural deep eutectic solvents: Comparison of various synthetic methods and calculation of ADME properties. J. Mol. Struct. 2024, 1304, 137725. [Google Scholar] [CrossRef]
  21. STARe Software 10.0; Mettler-Toledo GmbH: Giesen, Germany, 2009.
  22. Agilent. CrysAlis PRO; Agilent Technologies Ltd.: Yarnton, UK, 2014. [Google Scholar]
  23. Sheldrick, G.M. SHELXT—Integrated space-group and crystal-structure determination. Acta Crystallogr. Sect. A Found. Adv. 2015, A71, 3–8. [Google Scholar] [CrossRef] [PubMed]
  24. Sheldrick, G.M. Crystal structure refinement with SHELXL. Acta Crystallogr. Sect. C Struct. Chem. 2015, C71, 3–8. [Google Scholar] [CrossRef] [PubMed]
  25. Spek, A.L. Structure validation in chemical crystallography. Acta Cryst. 2009, D65, 148–155. [Google Scholar] [CrossRef] [PubMed]
  26. Macrae, C.F.; Edgington, P.R.; McCabe, P.; Pidcock, E.; Shields, G.P.; Taylor, R.; Towler, M.; van de Streek, J. Mercury: Visualization and analysis of crystal structures. Appl. Cryst. 2006, 39, 453–457. [Google Scholar] [CrossRef]
  27. Spackman, P.R.; Turner, M.J.; McKinnon, J.J.; Wolff, S.K.; Grimwood, D.J.; Jayatilaka, D.; Spackman, M.A. CrystalExplorer: A program for Hirshfeld surface analysis, visualization and quantitative analysis of molecular crystals. J. Appl. Crystallogr. 2021, 54, 1006–1011. [Google Scholar] [CrossRef]
  28. Tan, S.L.; Jotani, M.M.; Tiekink, E.R.T. Utilizing Hirshfeld surface calculations, non-covalent interaction (NCI) plots and the calculation of interaction energies in the analysis of molecular packing. Acta Crystallogr. Sect. E Cryst. Commun. 2019, E75, 308–318. [Google Scholar] [CrossRef] [PubMed]
  29. Balić, T.; Perdih, F.; Počkaj, M.; Molnar, M.; Komar, M.; Balić, I. Polymorphism of coumarin thione-triazole-4-methyl-7-[(4-phenyl-5-thioxo-4,5-dihydro-1H-1,2,4-triazol-3-yl) methoxy]-2H-chromen-2-one. J. Mol. Struct. 2021, 1231, 129957. [Google Scholar] [CrossRef]
  30. Gilbert, A.S. Molecular symmetry depresses the entropy of fusion of organic molecules with regard to their expected values when comparing structural isomers. Thermochim. Acta 2007, 452, 135–139. [Google Scholar] [CrossRef]
  31. Groom, C.R.; Bruno, I.J.; Lightfoot, M.P.; Ward, S.C. The Cambridge structural database. Acta Crystallogr. Sect. B Struct. Sci. Cryst. Eng. Mater. 2016, B72, 171–179. [Google Scholar] [CrossRef] [PubMed]
  32. Snodgrass, H.M.; Mondal, D.; Lewis, J.C. Directed evolution of flavin-dependent halogenases for site-and atroposelective halogenation of 3-aryl-4(3H)-quinazolinones via kinetic or dynamic kinetic resolution. J. Am. Chem. Soc. 2022, 144, 16676–16682. [Google Scholar] [CrossRef] [PubMed]
  33. Bolte, M. CSD Communications; Cambridge Crystallographic Data Centre: Cambridge, UK, 2019. [Google Scholar]
  34. Diener, M.E.; Metrano, A.J.; Kusano, S.; Miller, S.J. Enantioselective synthesis of 3-arylquinazolin-4(3H)-ones via peptide-catalyzed atroposelective bromination. J. Am. Chem. Soc. 2015, 137, 12369–12377. [Google Scholar] [CrossRef]
  35. Xu, L.; Jiang, Y.; Ma, D. Synthesis of 3-substituted and 2,3-disubstituted quinazolinones via Cu-catalyzed aryl amidation. Org. Lett. 2012, 14, 1150–1153. [Google Scholar] [CrossRef]
  36. Pérez-Ferhmann, M.; Kesternich, V.; Fernández, R.; Verdugo, F.; Brito, I.; Cárdenas, A.; Bolte, M. Crystal structure of 3-(4-methoxy-2-nitrophenyl)-2-methylquinazolin-4(3H)-one, C16H13N3O4. Z. Krist.-New Cryst. Struct. 2014, 229, 415–416. [Google Scholar] [CrossRef]
  37. El-Azab, A.S.; Abdel-Aziz, A.A.-M.; Ng, S.W.; Tiekink, E.R.T. 2-Methyl-3-(2-methylphenyl)-7-nitroquinazolin-4(3H)-one. Acta Crystallogr. Sect. E Struct. Rep. Online 2012, E68, o863. [Google Scholar] [CrossRef]
  38. Riwar, L.; Trapp, N.; Kuhn, B.; Diederich, F. Substituent Effects in Parallel-Displaced π–π Stacking Interactions: Distance Matters. Angew. Chem. Int. Ed. 2017, 56, 11252–11257. [Google Scholar] [CrossRef] [PubMed]
  39. Kudale, V.S.; Wang, J.-J. Metal-free C–H methylation and acetylation of heteroarenes with PEG-400. Green Chem. 2020, 22, 3506–3511. [Google Scholar] [CrossRef]
  40. Ramanathan, M.; Hsu, M.-T.; Liu, S.-T. Preparation of 4(3H)-quinazolinones from aryldiazonium salt, nitriles and 2-aminobenzoate via a cascade annulation. Tetrahedron 2019, 75, 791–796. [Google Scholar] [CrossRef]
  41. Hirai, M.; Terada, S.; Yoshida, H.; Ebine, K.; Hirata, T.; Kitagawa, O. Catalytic enantioselective synthesis of N–C axially chiral mebroqualone and its derivatives through reductive asymmetric desymmetrization. Org. Lett. 2016, 18, 5700–5703. [Google Scholar] [CrossRef] [PubMed]
  42. Imai, T.; Niijima, E.; Terada, S.; Wzorek, A.; Soloshonok, V.A.; Hori, A.; Kitagawa, O. Chirality-dependent halogen bonds in axially chiral quinazolin-4-one derivatives bearing ortho-halophenyl groups. CrystEngComm 2019, 21, 3385–3389. [Google Scholar] [CrossRef]
  43. Komar, M.; Molnar, M.; Konjarević, A. Screening of Natural Deep Eutectic Solvents for Green Synthesis of 2-methyl-3-substituted Quinazolinones and Microwave-Assisted Synthesis of 3-aryl Quinazolinones in Ethanol. Croat. Chem. Acta 2020, 92, 511–517. [Google Scholar] [CrossRef]
  44. Bouley, R.; Ding, D.; Peng, Z.; Bastian, M.; Lastochkin, E.; Song, W.; Suckow, M.A.; Schroeder, V.A.; Wolter, W.R.; Mobashery, S.; et al. Structure–activity relationship for the 4(3H)-Quinazolinone antibacterials. J. Med. Chem. 2016, 59, 5011–5021. [Google Scholar] [CrossRef] [PubMed]
  45. Peyressatre, M.; Arama, D.P.; Laure, A.; González-Vera, J.A.; Pellerano, M.; Masurier, N.; Lisowski, V.; Morris, M.C. Identification of quinazolinone analogs targeting CDK5 kinase activity and glioblastoma cell proliferation. Front. Chem. 2020, 8, 691. [Google Scholar] [CrossRef] [PubMed]
  46. Kumar, D.; Jadhavar, P.S.; Nautiyal, M.; Sharma, H.; Meena, P.K.; Adane, L.; Pancholia, S.; Chakraborti, A.K. Convenient synthesis of 2,3-disubstituted quinazolin-4(3H)-ones and 2-styryl-3-substituted quinazolin-4(3H)-ones: Applications towards the synthesis of drugs. RSC Adv. 2015, 5, 30819–30825. [Google Scholar] [CrossRef]
  47. Wolfe, J.F.; Rathman, T.L.; Sleevi, M.C.; Campbell, J.A.; Greenwood, T.D. Synthesis and anticonvulsant activity of some new 2-substituted 3-aryl-4 (3H)-quinazolinones. J. Med. Chem. 1990, 33, 161–166. [Google Scholar] [CrossRef] [PubMed]
  48. Kumar, P.; Singh, P.; Mishra, A.; Singh, J.; Kumar, A. Synthesis and Biological Activities of Some Indolyl Substituted Pyrazolines. Asian J. Chem. 2010, 20, 6056–6066. [Google Scholar]
  49. Sharma, P.; Sharma, M.; Rangaswami, S.; Sharma, P.; Sharma, M.; Rangaswami, S.; Sharma, B. Indian Journal of Chemistry, Section B: Organic Chemistry Including Medicinal Chemistry; Council of Scientific & Industrial Research: New Delhi, India, 1979; Volume 17, pp. 443–448. [Google Scholar]
  50. Rajput, C.S.; Kumar, A.; Bhati, S.K.; Singh, J. Synthesis and Antiinflammatory Activity of 2-[5′-(4-Pyridinyl)-1′,2′,3′-oxadiazol-2-ylthiomethyl]-3-substituted-aryl-6-substituted-quinazolin-4-ones. Asian J. Chem. 2010, 20, 6246–6252. [Google Scholar]
  51. Ammar, Y.A. Some Reactions with 6-Chloro-2-Methyl 3,1-Benzoxazin-4-One. Orient. J. Chem. 1990, 6, 3. [Google Scholar]
Scheme 1. Synthesis of substituted quinazolin-4(3H)-ones 13.
Crystals 15 00039 sch001
Figure 1. ORTEP plot of 1 with displacement ellipsoids of non-hydrogen atoms drawn at the 30% probability level. Two symmetry-independent molecules are marked with (A) and (B).
Crystals 15 00039 g001
Figure 2. Representation of π∙∙∙π interactions (black dashed lines) and halogen bond interactions (blue dashed lines) in 1 (hydrogen atoms have been omitted for clarity; halogen atoms are represented as spheres of arbitrary radii). Two symmetrically independent molecules, A and B, are red and blue colored, respectively.
Crystals 15 00039 g002
Figure 3. ORTEP plot of 2 with displacement ellipsoids of non-hydrogen atoms drawn at the 30% probability level. Two symmetry-independent molecules are marked with (A) and (B).
Crystals 15 00039 g003
Figure 4. Representation of π∙∙∙π interactions (black dashed lines) and hydrogen bond interactions (blue dashed lines) in 2.
Crystals 15 00039 g004
Figure 5. ORTEP plot of 3 with displacement ellipsoids of non-hydrogen atoms drawn at the 30% probability level. Two symmetry-independent molecules are marked with (A) and (B). Only atoms of major disorder components are represented in molecule (A).
Crystals 15 00039 g005
Figure 6. Representation of F···F interactions (blue dashed lines) in the tetramer motif and π∙∙∙π interactions of adjacent tetramers in 3 (black dashed lines).
Crystals 15 00039 g006
Figure 7. Hirshfeld surfaces for title crystal structures mapped over dnorm for the whole asymmetric unit (AB) and the symmetry-independent molecules A and B.
Crystals 15 00039 g007
Figure 8. The full 2D fingerprint plots of the (a) 1, (b) 2, and (c) 3. The whole asymmetric unit (AB) and the symmetry-independent molecules (A) and (B).
Crystals 15 00039 g008
Figure 9. DSC curves of 1 (black), 2 (red), and 3 (blue).
Crystals 15 00039 g009
Figure 10. Variable-temperature PXRD study of 1. The diffractograms were collected from 30 to 120 °C in intervals of 30 degrees and from 120 to 180 °C in intervals of 10 degrees. The last one (top) was collected after cooling to 30 °C. The calculated pattern was extracted from the single-crystal model (170 K).
Crystals 15 00039 g010
Figure 11. Molecular structures of some 3-phenylquinazolinones.
Crystals 15 00039 g011
Figure 12. Molecular structures of some halo-substituted 3-phenylquinazolinones.
Crystals 15 00039 g012
Figure 13. Molecular structures of some halo-phenyl-substituted, phenyl-disubstituted and phenyl-quinazoline substituted 3-phenylquinazolinones.
Crystals 15 00039 g013
Table 1. Crystallographic data and structure refinement details for all compounds.
Compound123
CCDC No.241013824101392410140
Empirical formulaC15H10ClIN2OC16H13IN2O2C16H10ClF3N2O2
Formula weight396.60392.198354.71
Temperature/K170170170
Crystal systemmonoclinictriclinicmonoclinic
Space groupP21/nP − 1C2/c
a16.08889(17)11.3798(4)12.0167(4)
b7.11883(9)11.7894(5)34.6361(9)
c26.3180(3)12.9902(4)15.4003(6)
α90106.081(3)90
β96.4521(10)98.102(3)93.146(4)
γ90110.848(4)90
Volume/Å32995.21(6)1508.25(12)6400.1(4)
Z8416
ρcalc/g cm−31.7591.7271.472
μ/mm−118.41516.7382.533
F(000)1536.0771.02880.0
Crystal size/mm30.3 × 0.1 × 0.050.2 × 0.1 × 0.040.4 × 0.2 × 0.08
Radiation CuKα (λ = 1.54184)Cu Kα (λ = 1.54184)Cu Kα (λ = 1.54184)
2θ range for data collection/°6.148 to 159.6728.58 to 161.067.688 to 131.982
Data ranges −20 ≤ h ≤ 19, −9 ≤ k ≤ 8, −32 ≤ l ≤ 33−13 ≤ h ≤ 14, −15 ≤ k ≤ 14, −16 ≤ l ≤ 12−12 ≤ h ≤ 14, −37 ≤ k ≤ 40, −18 ≤ l ≤ 18
Reflections collected 258941777122148
Independent reflections 6385 [Rint = 0.0439, Rsigma = 0.0356]6186 [Rint = 0.0701, Rsigma = 0.0575]5496 [Rint = 0.0654, Rsigma = 0.0567]
Dana/restraints/parameters 6385/0/3646186/0/3845496/535/472
Goodness-of-fit on F21.0390.9611.039
Final R indexes [I ≥ 2σ (I)] R1 = 0.0516, wR2 = 0.1516R1 = 0.0517, wR2 = 0.1156R1 = 0.0705, wR2 = 0.2012
Final R indexes [all data] R1 = 0.0566, wR2 = 0.1563R1 = 0.0761, wR2 = 0.1490R1 = 0.1066, wR2 = 0.2309
Largest diff. peak/hole/e Å−3 1.25/−0.851.28/−1.320.45/−0.28
Table 2. Hydrogen bond geometry (Å, °), Y–X···π, π∙∙∙π and X···X interactions for all compounds.
1
D–H∙∙∙Ad(D–H)/Åd(H···A)/Åd(D···A)/Å∠ (D–H···A)/°Symmetry code
C11–H11···O20.932.443.327(7)156x, −1 + y, z
C15–H15···O20.932.533.371(7)148x, −1 + y, z
C24–H24B···O10.932.573.455(6)1501/2 − x, 1/2 + y, 1/2 − z
X···X contactsd(D–X)d(X–X)θ1θ2
C29–Cl2···Cl2–C291.746(5)3.394(3)83.9983.991 − x, 2 − y, 1 − z
C7–I1···Cl2–C292.098(5)
1.746(5)
3.720(2)164.4379.063/2 − x, −1/2 + y, 1/2 − z
π···π contactsCg···Cg/Å αβCg···plane/Å
Cg2(C10C15) ··Cg6(C25C30)3.768(3)3.6(2)17.43.5202(18)x, −1 + y, z
2
D–H∙∙∙Ad(D–H)/Åd(H···A)/Åd(D···A)/Å∠(D–H···A)/°Symmetry code
C24–H24···N20.950(11)2.552(10)3.432(10)154.2(9)1 − x, −y, 1 − z
C25–H25B···O10.98(4)2.51(3)3.449(10)161(3)1 − x, 1 − y, 1 − z
π···π contactsCg···Cg/ÅαβCg···plane/Å
Cg5(C18C21) ··Cg6(C18C30)3.778(4)2.8(4)20.33.602(3)1 − x, −y, 1 − z
Cg6(C26C31) ··Cg6(C26C31)3.781(5)0.0(4)20.43.545(3)1 − x, −y, 1 − z
3
D–H∙∙∙Ad(D–H)/Åd(H···A)/Åd(D···A)/Å∠(D–H···A)/°Symmetry code
C9–H9C···O30.982.563.290(5)1311 − x, y, 3/2 − z
C11–H11···O10.952.553.361(5)1441 − x, y, 3/2 − z
C28–H28···O30.952.443.320(4) 1542 − x, y, 3/2 − z
Y–X···π contactsX···Cg/ÅY···Cg/Åγ∠(Y–X···Cg)/°
C16–F5···Cg6(C27C32)3.424(14)4.511(16)19.09139.5(10)−1/2 + x, 1/2 − y, 1/2 + z
X···X contactsd(D–X)/Åd(X–X)/Åθ1θ2
C17–F2···F7–C331.305(17)
1.289(8)
2.732(12)128.1(8)131.2(6)x, y, z
C16–F5···F9–C331.32(2)
1.330(11)
2.818(16)134.6(7)147.3(7)1−x, y, 3/2−z
π···π contactsCg···Cg/ÅαβCg···plane/Å
Cg5(C20C25) ··Cg5(C20C25)3.638(2)1.73(17)21.03.3956(15)2 − x, y, 3/2 − z
Disclaimer/Publisher’s Note: The statements, opinions and data contained in all publications are solely those of the individual author(s) and contributor(s) and not of MDPI and/or the editor(s). MDPI and/or the editor(s) disclaim responsibility for any injury to people or property resulting from any ideas, methods, instructions or products referred to in the content.

