Article

Using a Combined FE-CA Approach to Investigate Abnormally Large Grains Formed by the Limited Recrystallization Mechanism in a Powder Metallurgy Nickel-Based Superalloy

1
School of Materials Science and Engineering, Northwestern Polytechnical University, Xi’an 710072, China
2
Shanghai Kingfa Technology Development Company Ltd., Shanghai 201713, China
3
Xi’an Aerospace Power Machinery Company Ltd., Xi’an 710038, China
*
Author to whom correspondence should be addressed.
Crystals 2025, 15(1), 91; https://doi.org/10.3390/cryst15010091
Submission received: 16 December 2024 / Revised: 16 January 2025 / Accepted: 16 January 2025 / Published: 19 January 2025
(This article belongs to the Section Crystalline Metals and Alloys)

Abstract

:
Powder nickel-based superalloy is the key material for hot-end components such as turbine disks and gas engine disks in aeroengines, and its microstructure uniformity has an important influence on the disks’ service performance. However, thermomechanical treatments make it easy to produce abnormally large grains (ALGs) in powder superalloy disks. In order to investigate the relationship between the hot deformation conditions and ALGs of powder superalloys, isothermal compression experiments under various deformation conditions were carried out and a FE-CA method was constructed to investigate the ALGs formed by the limited recrystallization mechanism. The results indicate a close relationship between the ALGs formed after the supersolvus treatment of this alloy and the equivalent stress after thermal deformation, and the local dissolution of the γ′ phase in supersolvus heat treatment does not produce ALGs.

1. Introduction

Aero-engine turbine disks often use powdered nickel-based superalloys due to their excellent mechanical properties [1,2,3]. Compared with wrought superalloys, powder nickel-based superalloys have better microstructure uniformity and better properties [4]. Currently, the manufacturing process for advanced powder nickel-based superalloy disks primarily involves hot isostatic pressing, hot extrusion, isothermal forging, and heat treatment. The hot extrusion process, with its three-dimensional stress state, breaks the original particle boundary and non-metallic inclusions, fully refining the grains under significant extrusion deformation. This process promotes superplastic deformation during the subsequent isothermal forging process, thereby lowering the alloy’s resistance to deformation [5,6,7]. However, due to the pinning of the γ′ phase [8], the hot extruded alloy’s grains remain extremely fine after isothermal forging, failing to meet the requirements for creep strength and damage tolerance in high-temperature applications. Therefore, after isothermal forging, it is necessary to conduct a supersolvus heat treatment on the forgings to appropriately increase their grain size, further improve their uniformity of grain, and thereby regulate their creep resistance and fatigue crack growth resistance [9,10,11]. The gradual harsh service environment of the superalloy turbine disk continuously enhances the alloying degree of the alloy to fulfill the service requirements. However, this process narrows the alloy’s plastic processing window [12]. The microstructure of the alloy exhibits significant historical sensitivity, and defects like abnormally large grains (ALGs) are likely to surface during over-solution treatment [13,14,15,16], significantly impacting the turbine disks’ service performance [9,17].
ALGs refer to grains in an alloy’s microstructure whose size is significantly higher than the average grain size. ASTM 930 describes an abnormally large grain structure as a microstructure with a maximum grain size of more than three grain sizes higher than the average grain size. In the study of ALGs of nickel-based powder superalloys, some scholars [18] described the abnormally large grain structure as a microstructure with grains larger than 500 μm in diameter. At present, the theories describing the formation mechanism of ALGs mainly include the abnormally large grain growth theory [19,20] and the critically deformed coarse grains theory [21]. The abnormal grain growth theory describes a few local grains with favorable growth conditions that develop into ALGs when normal grain growth is inhibited by second-phase particles [22,23], texture [24], or certain special interfaces [25]. The driving force of this process is the reduction in interface energy, which is similar to normal grain growth. Different from the abnormal grain growth theory, the critical grain growth theory explains alloy grain growth leading to the formation of ALGs if the alloy undergoes prior deformation in the critical strain or critical deformation rate region. There is an essential difference between the critically deformed coarse grains theory and abnormally large grain growth theory. The critically deformed coarse grains theory’s initial driving force is primarily the reduction in alloy storage energy. Therefore, the critical grain growth theory more effectively explains the phenomenon of ALGs after pre-deformation [26].
At present, relevant scholars have conducted much research to determine the hot deformation window of ALGs and the formation mechanism of ALGs in powdered Ni-based superalloys. Blankenship et al. [27] conducted a hot die forging test on René 88DT alloy, and the results showed that when the hot deformation temperature increased, the probability of critical grain growth after over-solution treatment increased, but long sub-solution annealing (1050 °C/8 h) before standard over-solution treatment could reduce the tendency to form ALGs. Huron et al. [18] obtained a similar conclusion by performing hot compression and over-solution treatment on extruded René 88DT alloy double-cone specimens. He et al. [28] studied the formation mechanism of ALGs after the hot compression and over-solution treatment of a P/M alloy, and the results showed that ALGs always occurred in the recrystallization region with nucleation confinement. Qiao et al. [14] studied the annealed FGH96 alloy and used the Z parameter [29] to describe the hot working conditions under which ALGs appear. The results show that under the conditions of high Z parameters and medium Z parameters, obvious abnormal grain growth occurs at different positions of the cross section of the heat treated FGH96 alloy samples. Wang et al. [15] conducted a room-temperature spherical indentation test and an over-solution treatment on a nickel-based powder superalloy. They found that ALGs only appeared in the region where the residual plastic strain level of the over-solution treatment sample was 2–10%. They attributed this formation mechanism to the limited nucleation sites available for recrystallisation and the uneven distribution of stored energy.
In summary, the distribution of energy storage after the hot deformation of nickel-based powder superalloys is the main reason for the ALGs. However, under different thermal deformation conditions, the mechanism of ALG formation differs. In this paper, we further investigated the relationship between the formation mechanism of ALGs and thermal deformation conditions. The hot compression test introduced different energy storage gradients into the specimens, and the combination of the finite element (FE) method revealed the correlation between macroscopic equivalent stress and the mechanism of abnormally large grain formation.

2. Materials and Methods
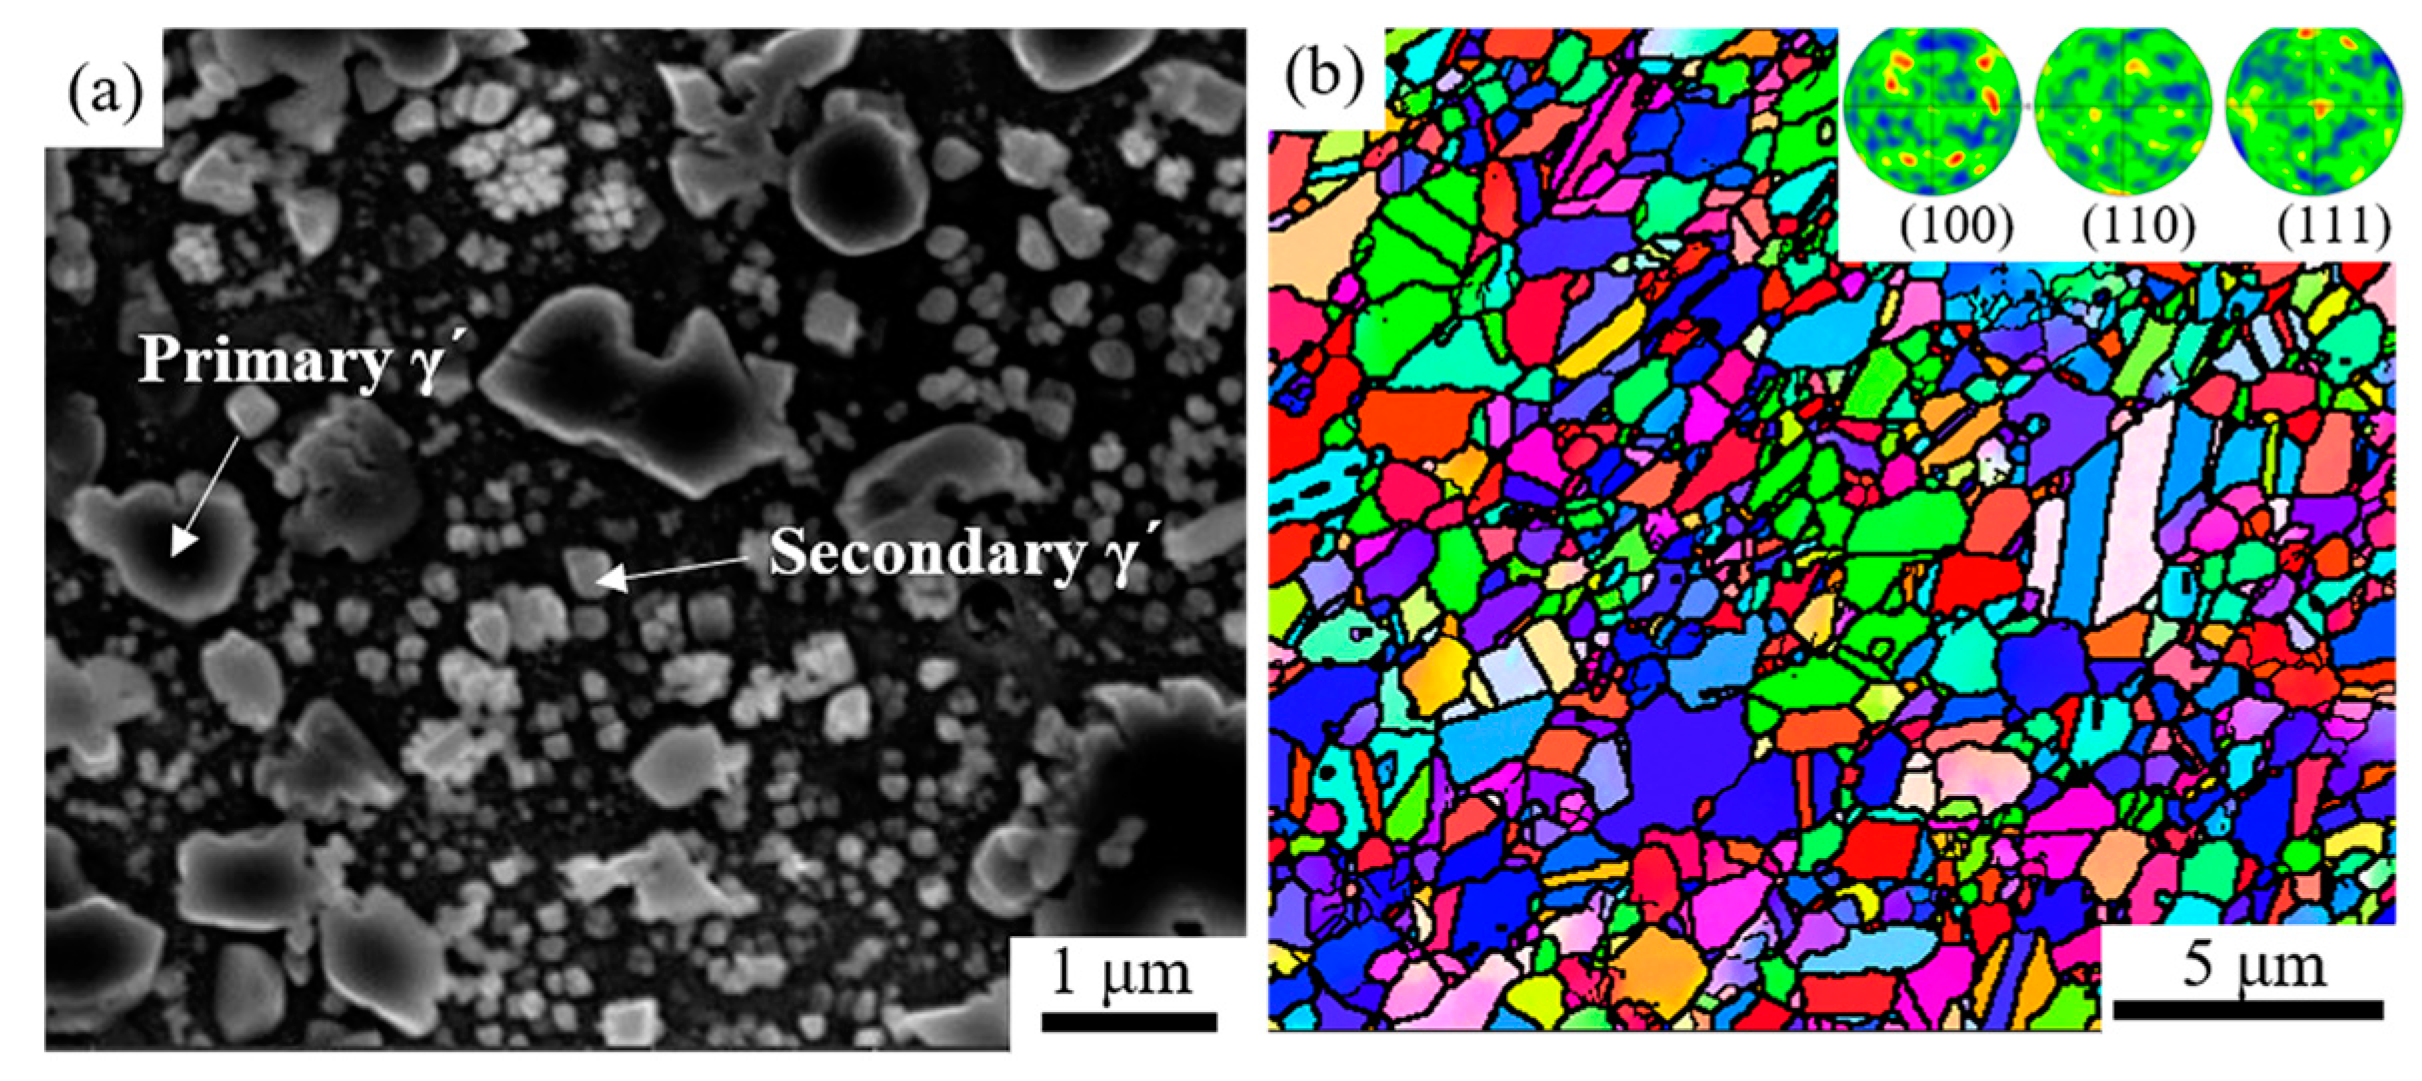
2.1. Materials

The extruded P/M nickel-based superalloy bar with a diameter of φ280 mm in this study had a nominal chemical composition of Ni-13Co-16Cr-4Mo-4W-2.2Al-3.7Ti-0.8Nb-0.03C and was manufactured by the AECC Beijing Institute of Aeronautical Materials in China. The experimental bar was fabricated through the powder metallurgy process, which comprised vacuum induction melting (VIM), argon atomization (AA), hot isostatic pressing (HIP), and hot extrusion (HEX). The microstructure and inverse polar figure maps (IFP) near the edge of the rod are shown in Figure 1, and the observation plane of Figure 1a is perpendicular to the extrusion direction of the rod, while the observation plane of Figure 1b is parallel to the extrusion direction of the rod. After hot extrusion, the grains at the edge of the rod were very fine, with an average grain size of only 1.16 μm. The size of the primary strengthening phase’s γ′ is about 0.5–1 μm, and finer secondary γ′ phases are embedded within the grains.

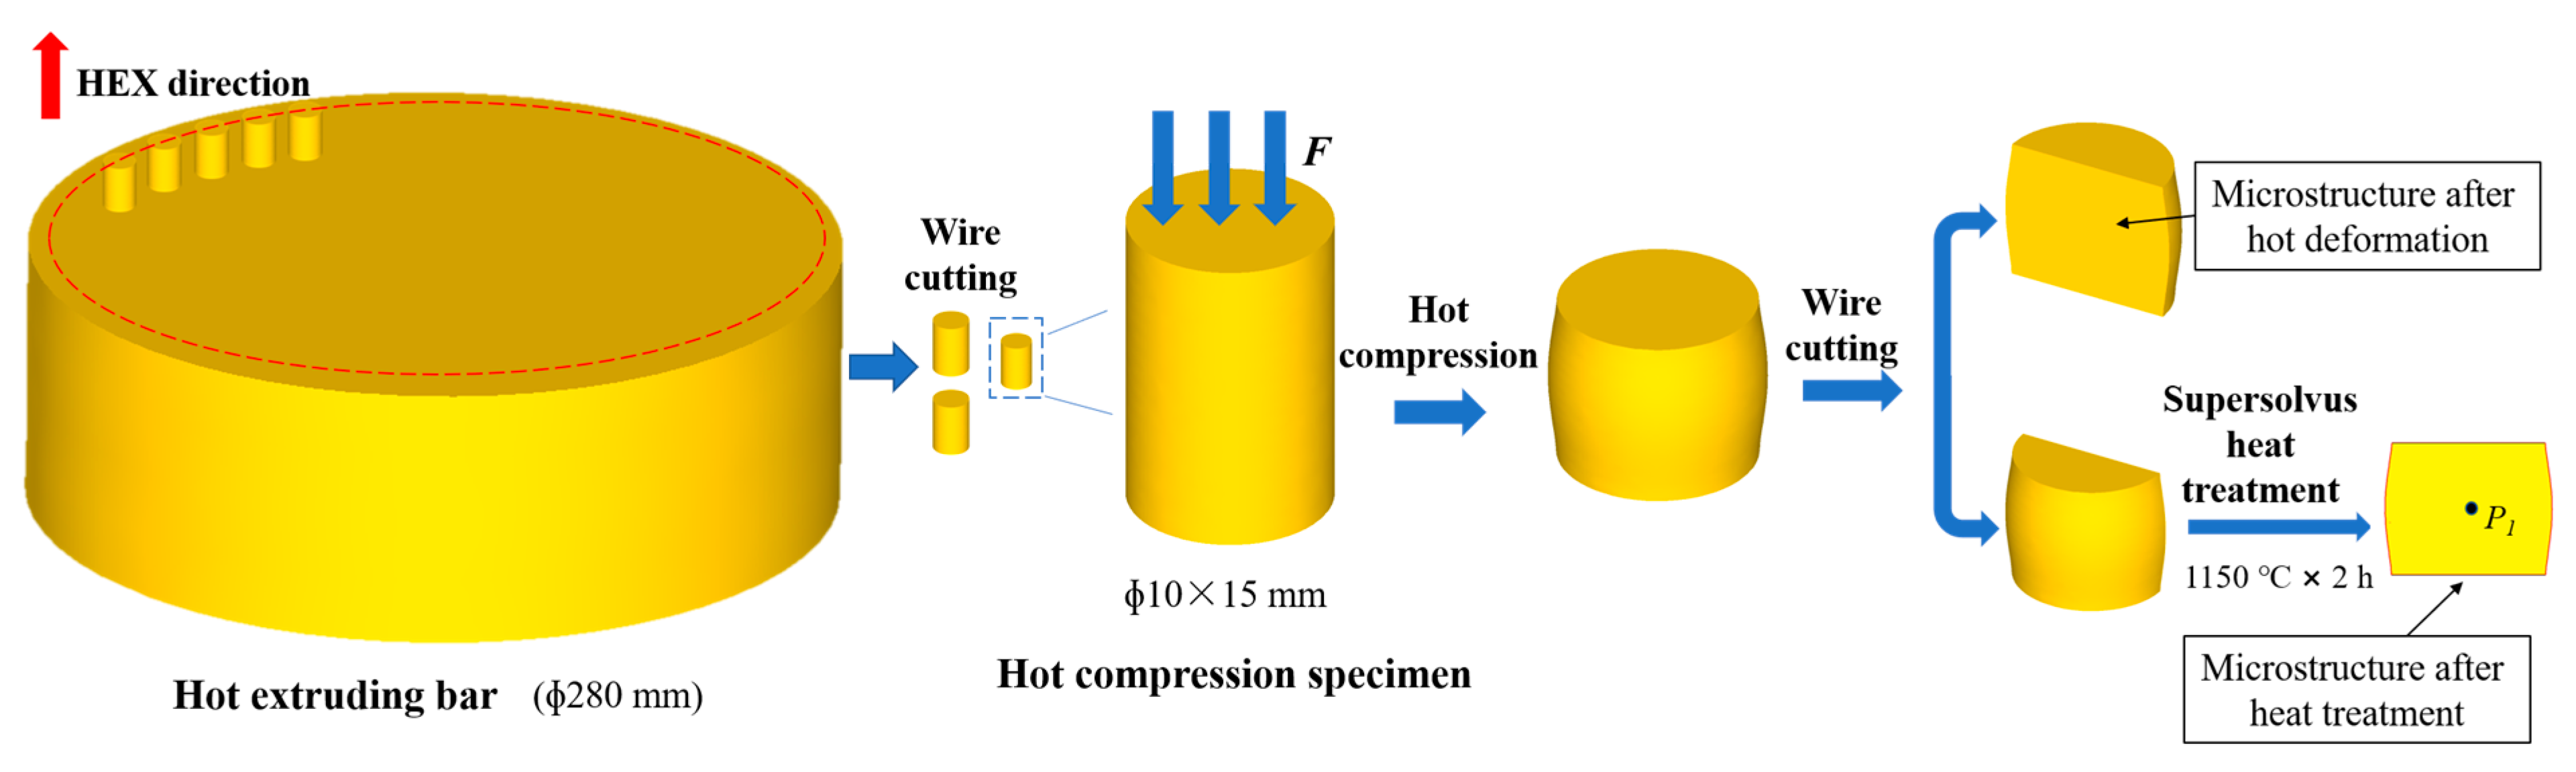
2.2. Isothermal Hot Compression Experiment

The isothermal hot compression tests were performed using the Gleeble 3180 test system. A cylindrical specimen with 10 mm in diameter and 15 mm in height (axis parallel to the original extruded bar) was machined from the edge position of the hot extruded rod. The isothermal hot compression experiment parameters are shown in Table 1, and the sizes of reductions corresponding to 10%, 30%, and 60% reduction amounts were 1.5 mm, 4.5 mm, and 9 mm, respectively. After the compression test was completed, the sample was quenched immediately to room temperature.

2.3. Supersolvus Heat Treatment

After the isothermal hot compression test, the samples were divided into two parts along the axial direction by electrical discharge machining (EDM), and some of them were then heat treated. The heat treatment regime was 1150 °C for 2 h and then air-cooling to room temperature. According to our previous studies [30], 1150 °C is the over-solution temperature of the alloy and the prime γ′ phases will dissolve quickly during supersolvus heat treatment. Figure 2 shows the sampling locations of the hot compression specimens and the subsequent experimental procedures.

2.4. Microstructure Characterization

An optical microscope (OM, OLYMPUS-2009 is made by Olympus Corporation in Tokyo, Japan), a field emission scanning electron microscope (SEM, TESCAN-2012 is made by TESCAN Orsay Holding, a.s. in Brno, Czech Republic.), electron backscattered diffraction (EBSD) system, and a transmission electron microscope (TEM, FEI Talos F200X-2016 is manufactured by Thermo Fisher Scientific in Waltham, MA, USA) were used to analyze the microstructures of the samples after isothermal hot compression and heat treatment. For the optical microscope observation, the method of corroding grain boundaries is as follows: The polished sample should be immersed in a boiled 20% H2SO4 (volume fraction). Meanwhile, solid KMnO4 particles need to be added to the solution at intervals. Eventually, the sample is to be cleaned with a saturated oxalic acid solution. The average size of the grains could be measured by Image Pro Plus 6.0 (IPP) software. The specific procedure is elaborated as follows: Firstly, the area of each grain is calculated with the assistance of IPP software. Subsequently, the average grain size is determined in accordance with the GB/T 6394-2017 standard [31]. The sample for EBSD analysis needed to be electrolytically polished. The electrolytic polishing method involved placing the manually polished sample in a 20 mL H2SO4 + 80 mL CH3OH mixed solution for electrolysis for 23 s with a voltage of 28 V. The treatment methods of SEM samples were electrolytic polishing and electrochemical corrosion. The electrolytic polishing was consistent with the EBSD sample preparation, and the electrochemical corrosion reagent was 170 mL H3PO4 + 10 mL H2SO4 + 15 g CrO3 (voltage 10 V, time 2 s). The sample used for TEM observation needed to be further thinned by ion double spraying after mechanical thinning to 30–40 μm to meet the observation requirements. The double spraying reagent (volume fraction) was 60% CH3OH + 34% C4H10O + 6% HClO.

2.5. Finite Element Simulation

The finite element simulation software DEFORM v11.0 was used to obtain the stress and strain distribution of the sample under different thermal deformation conditions. The constitutive relationship used in the simulation was based on the flow stress–strain curve obtained from the isothermal hot compression experiment. Since the specimen was axisymmetric, in order to improve the computational efficiency, a two-dimensional axisymmetric model was used to simulate the stress, strain, and strain rate of the specimen after hot compression.

2.6. Cellular Automata Model

This cellular automaton model used a 400 × 400 grid, with each cell having a side length of 2 μm and a total simulation area of 0.8 mm × 0.8 mm. Each cell in the model had six state variables:
(1)
Color variable: Different colors were used to distinguish different grains.
(2)
Orientation variable: To distinguish different grain orientations, we used integers between 1 and 180.
(3)
Dislocation density variable: We used the dislocation density variable to represent the storage energy size of grains.
(4)
Recrystallization variables: Cells that underwent recrystallization are represented by 1, while cells that did not undergo recrystallization are represented by 0.
(5)
Grain boundary variables: Adjacent grains were distinguished by grain boundary variables, where 1 represents the grain boundary and 0 represents the interior of the grain.
(6)
Distance variable: We used distance variables to represent the distance at which grain boundaries migrated during the growth process.

3. Results

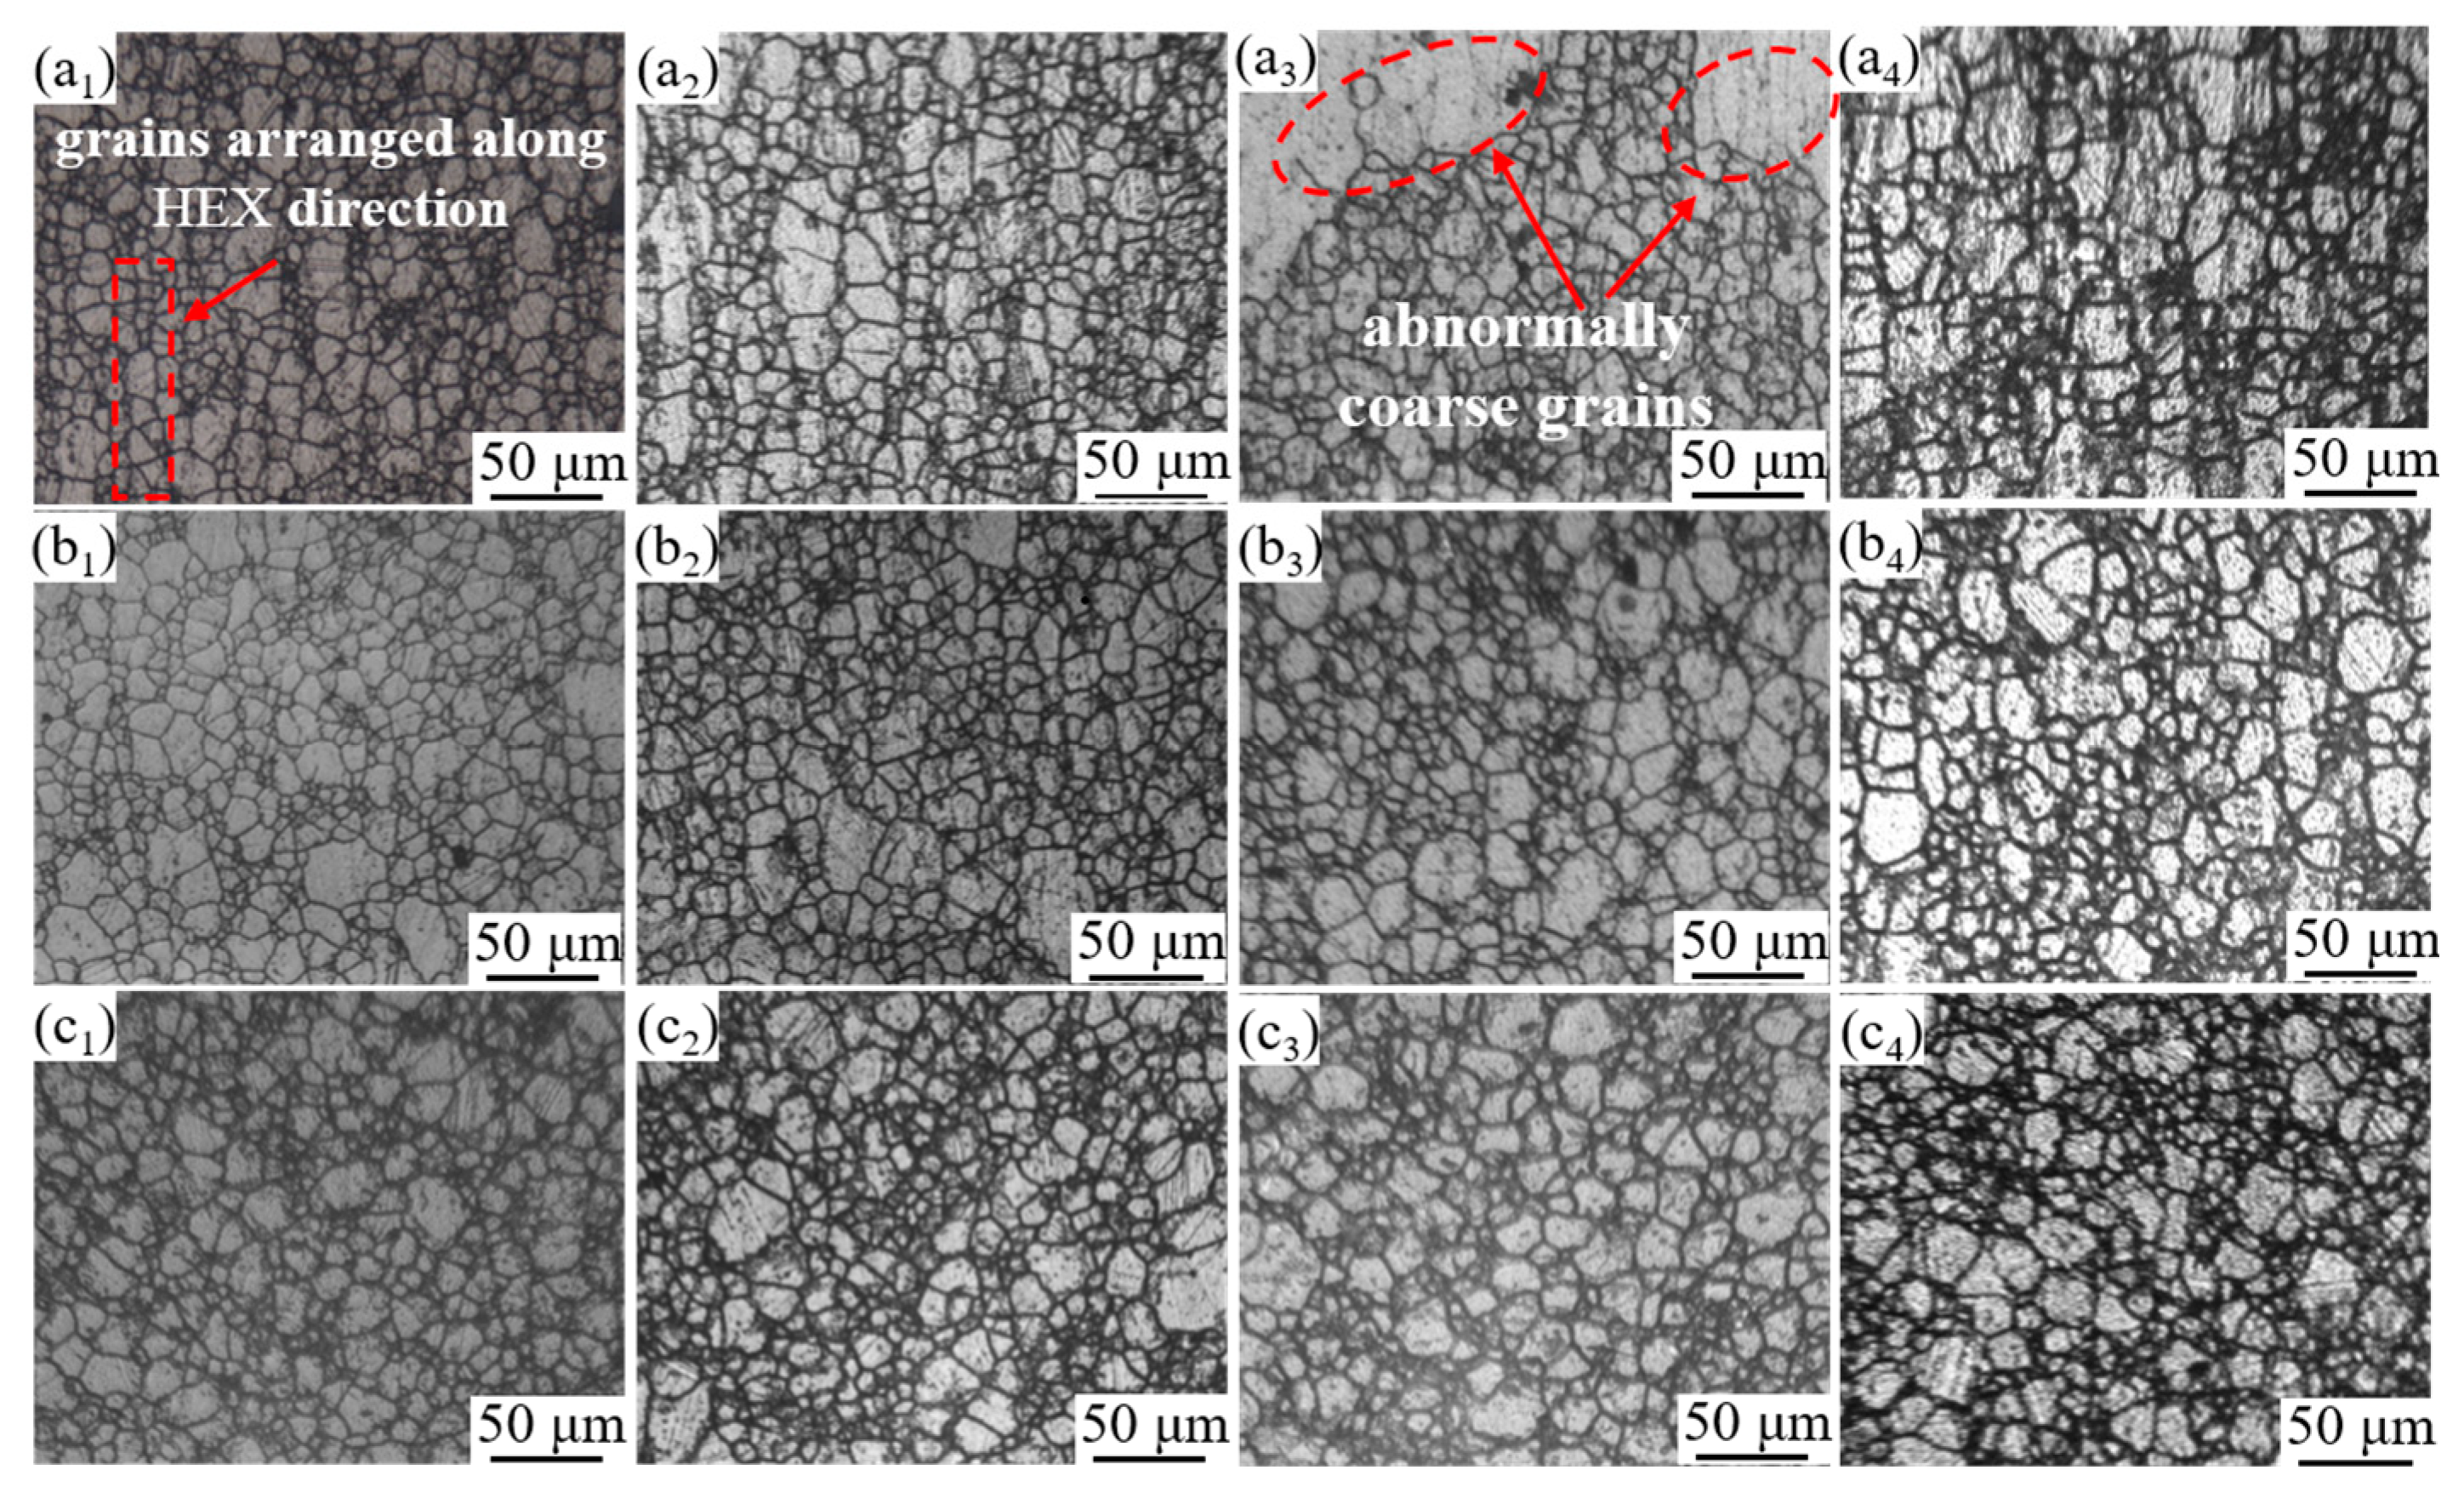
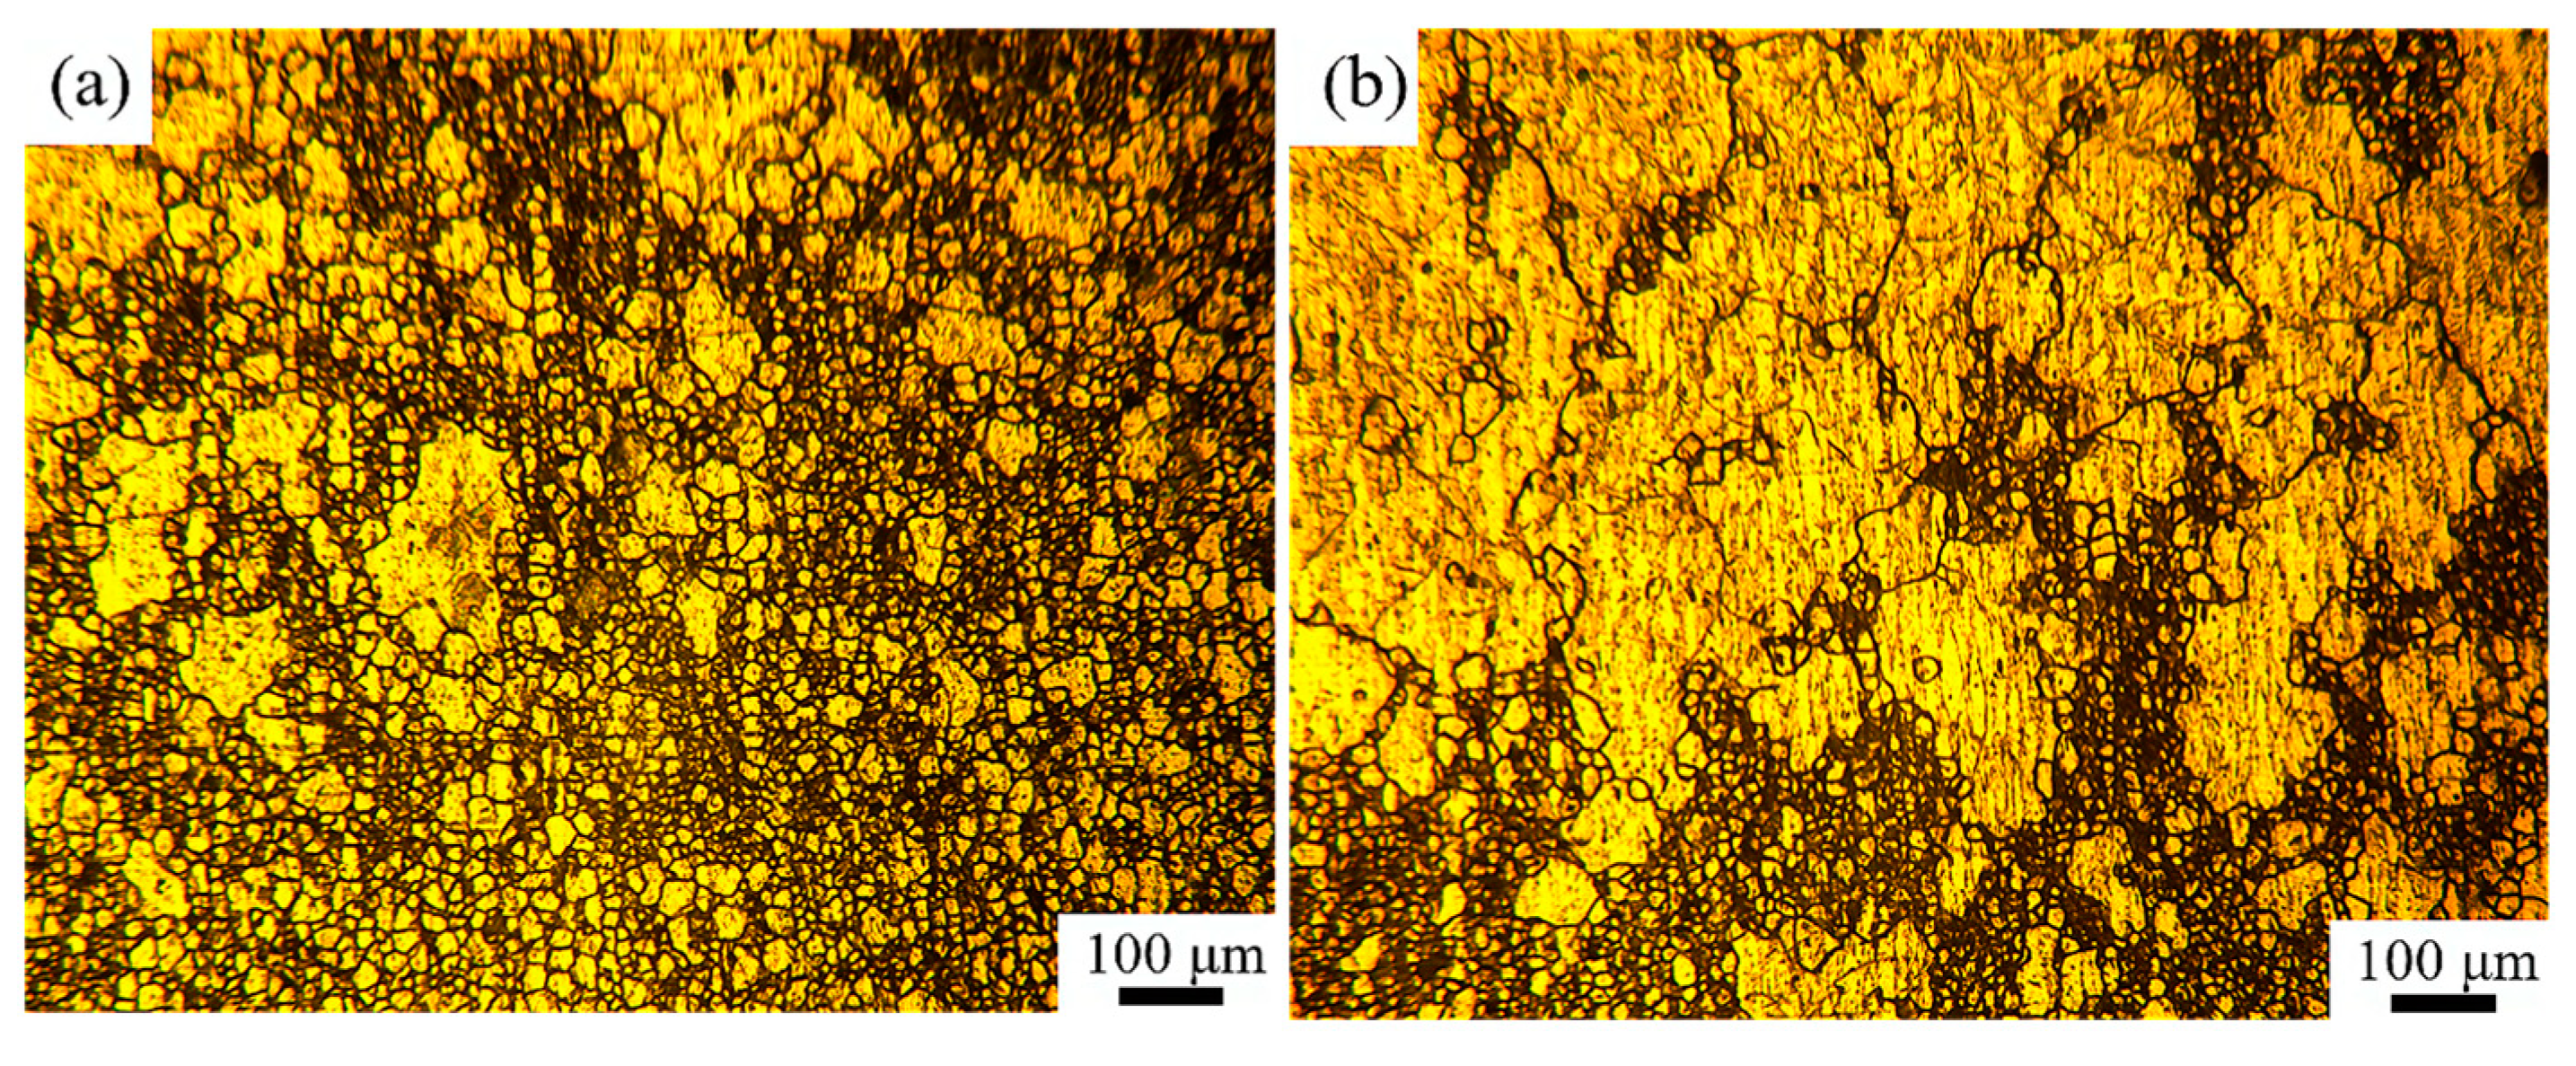
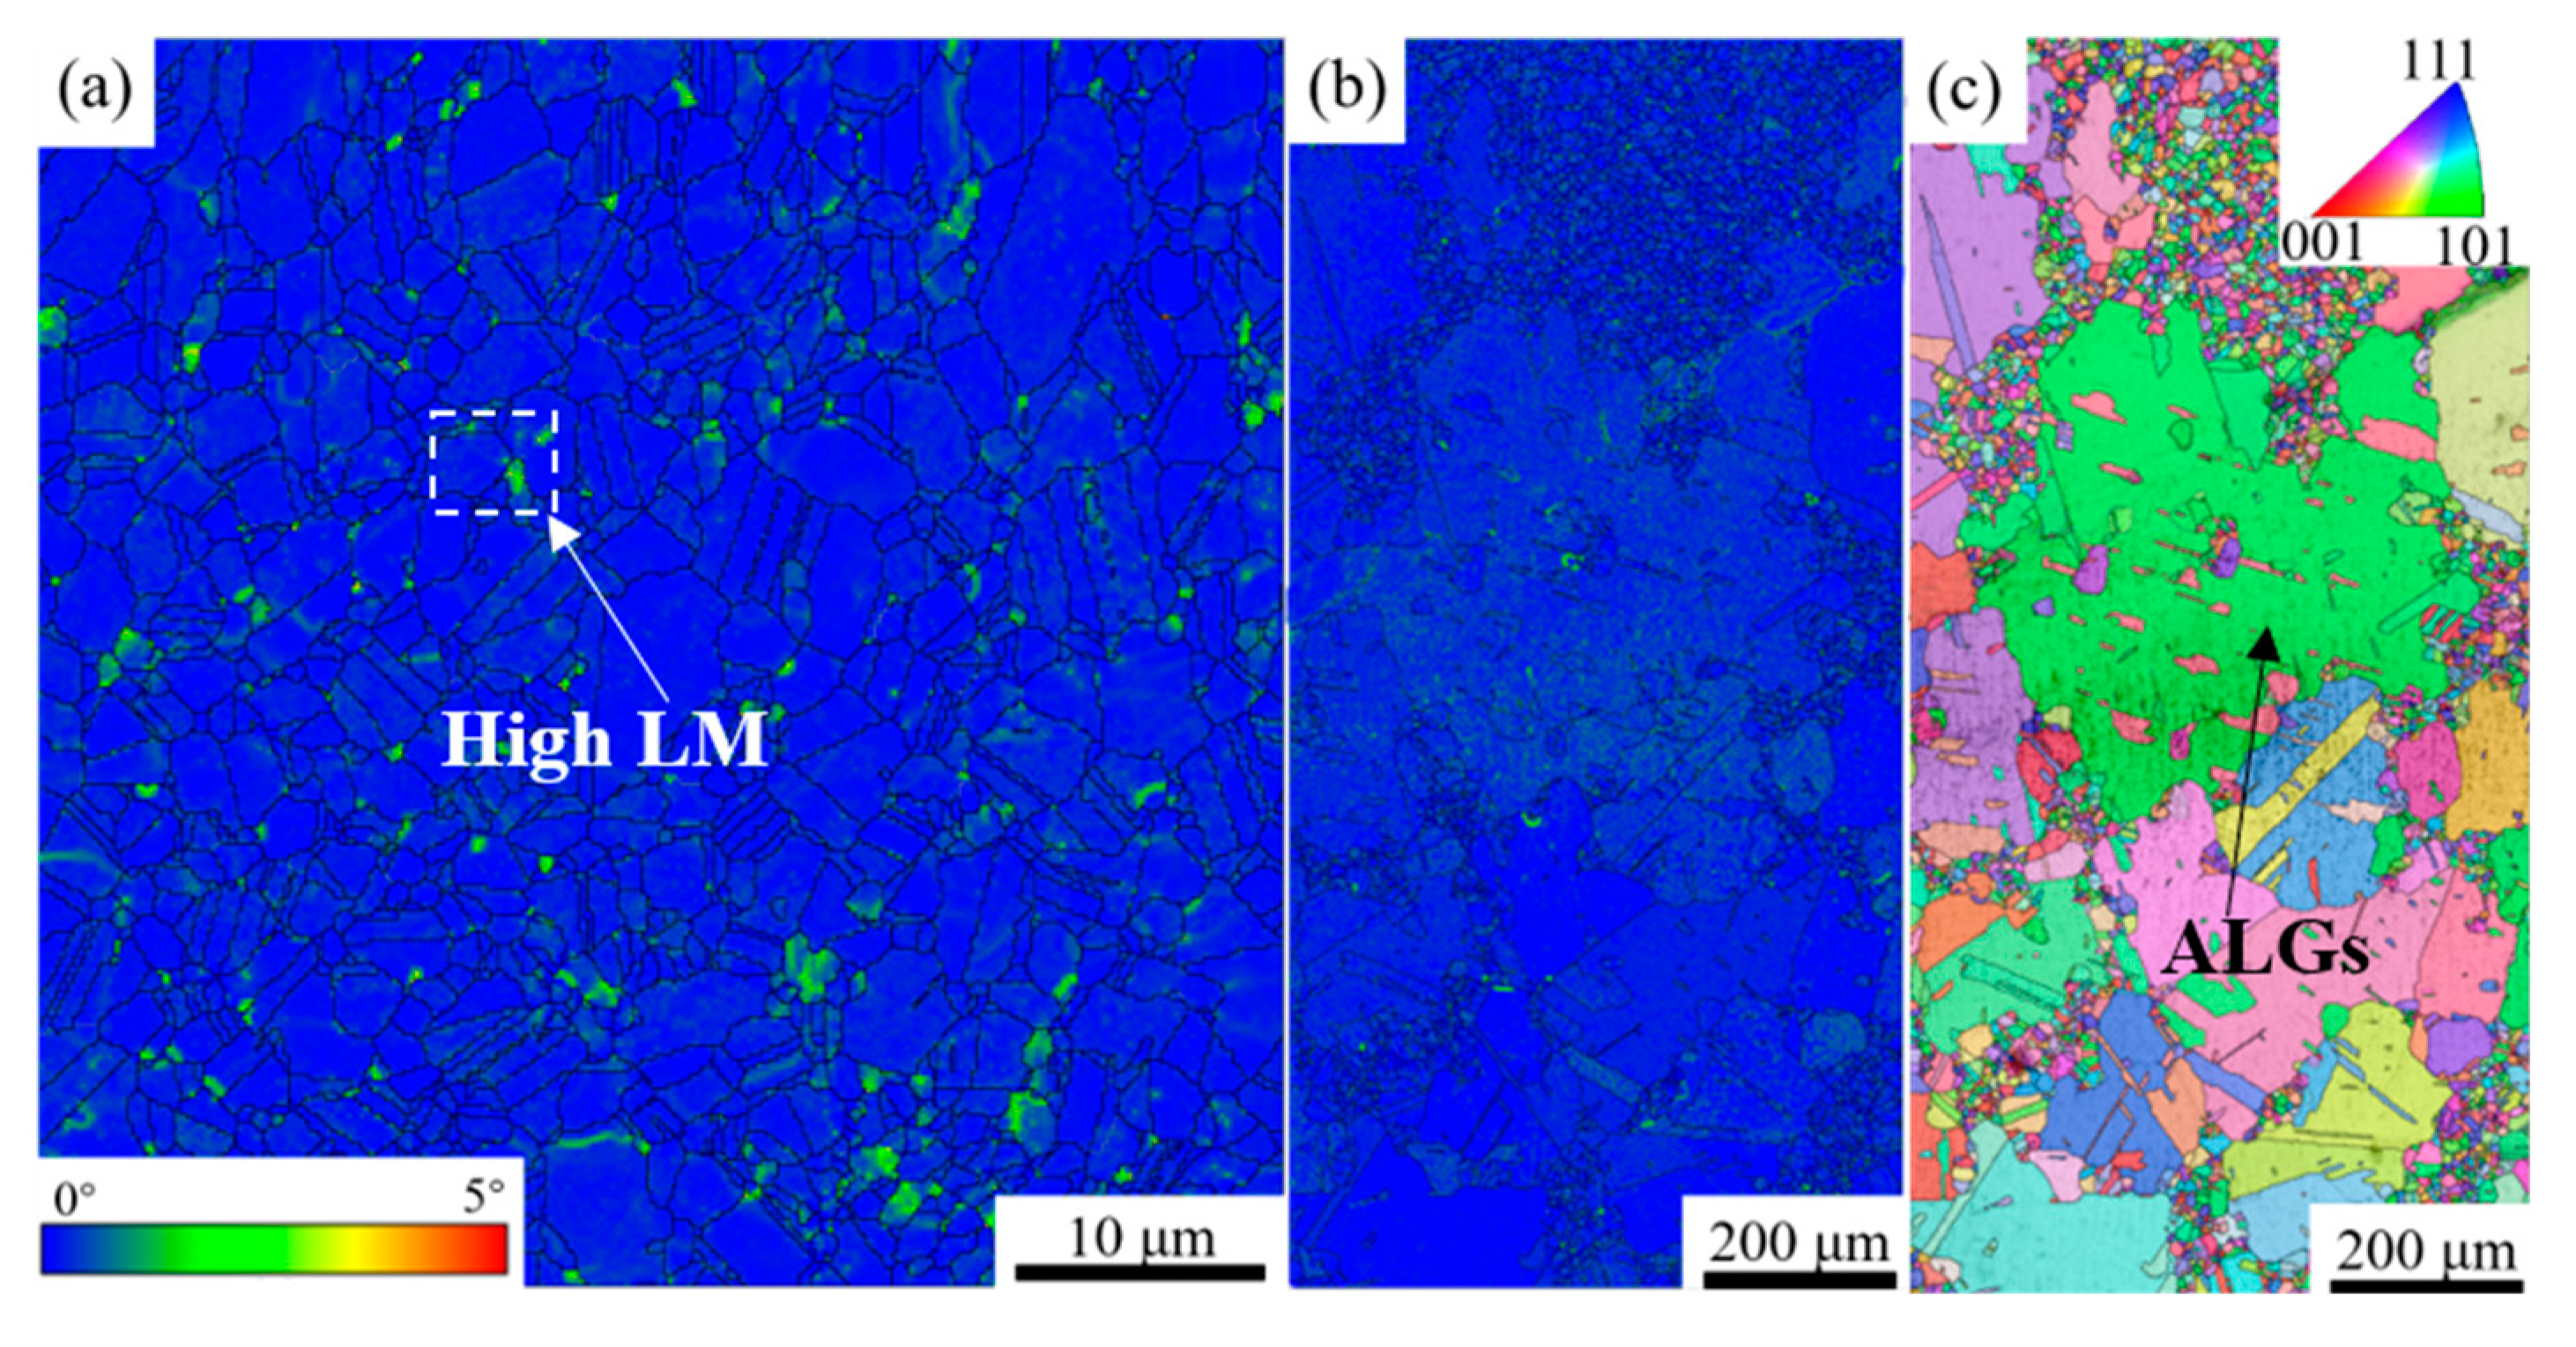
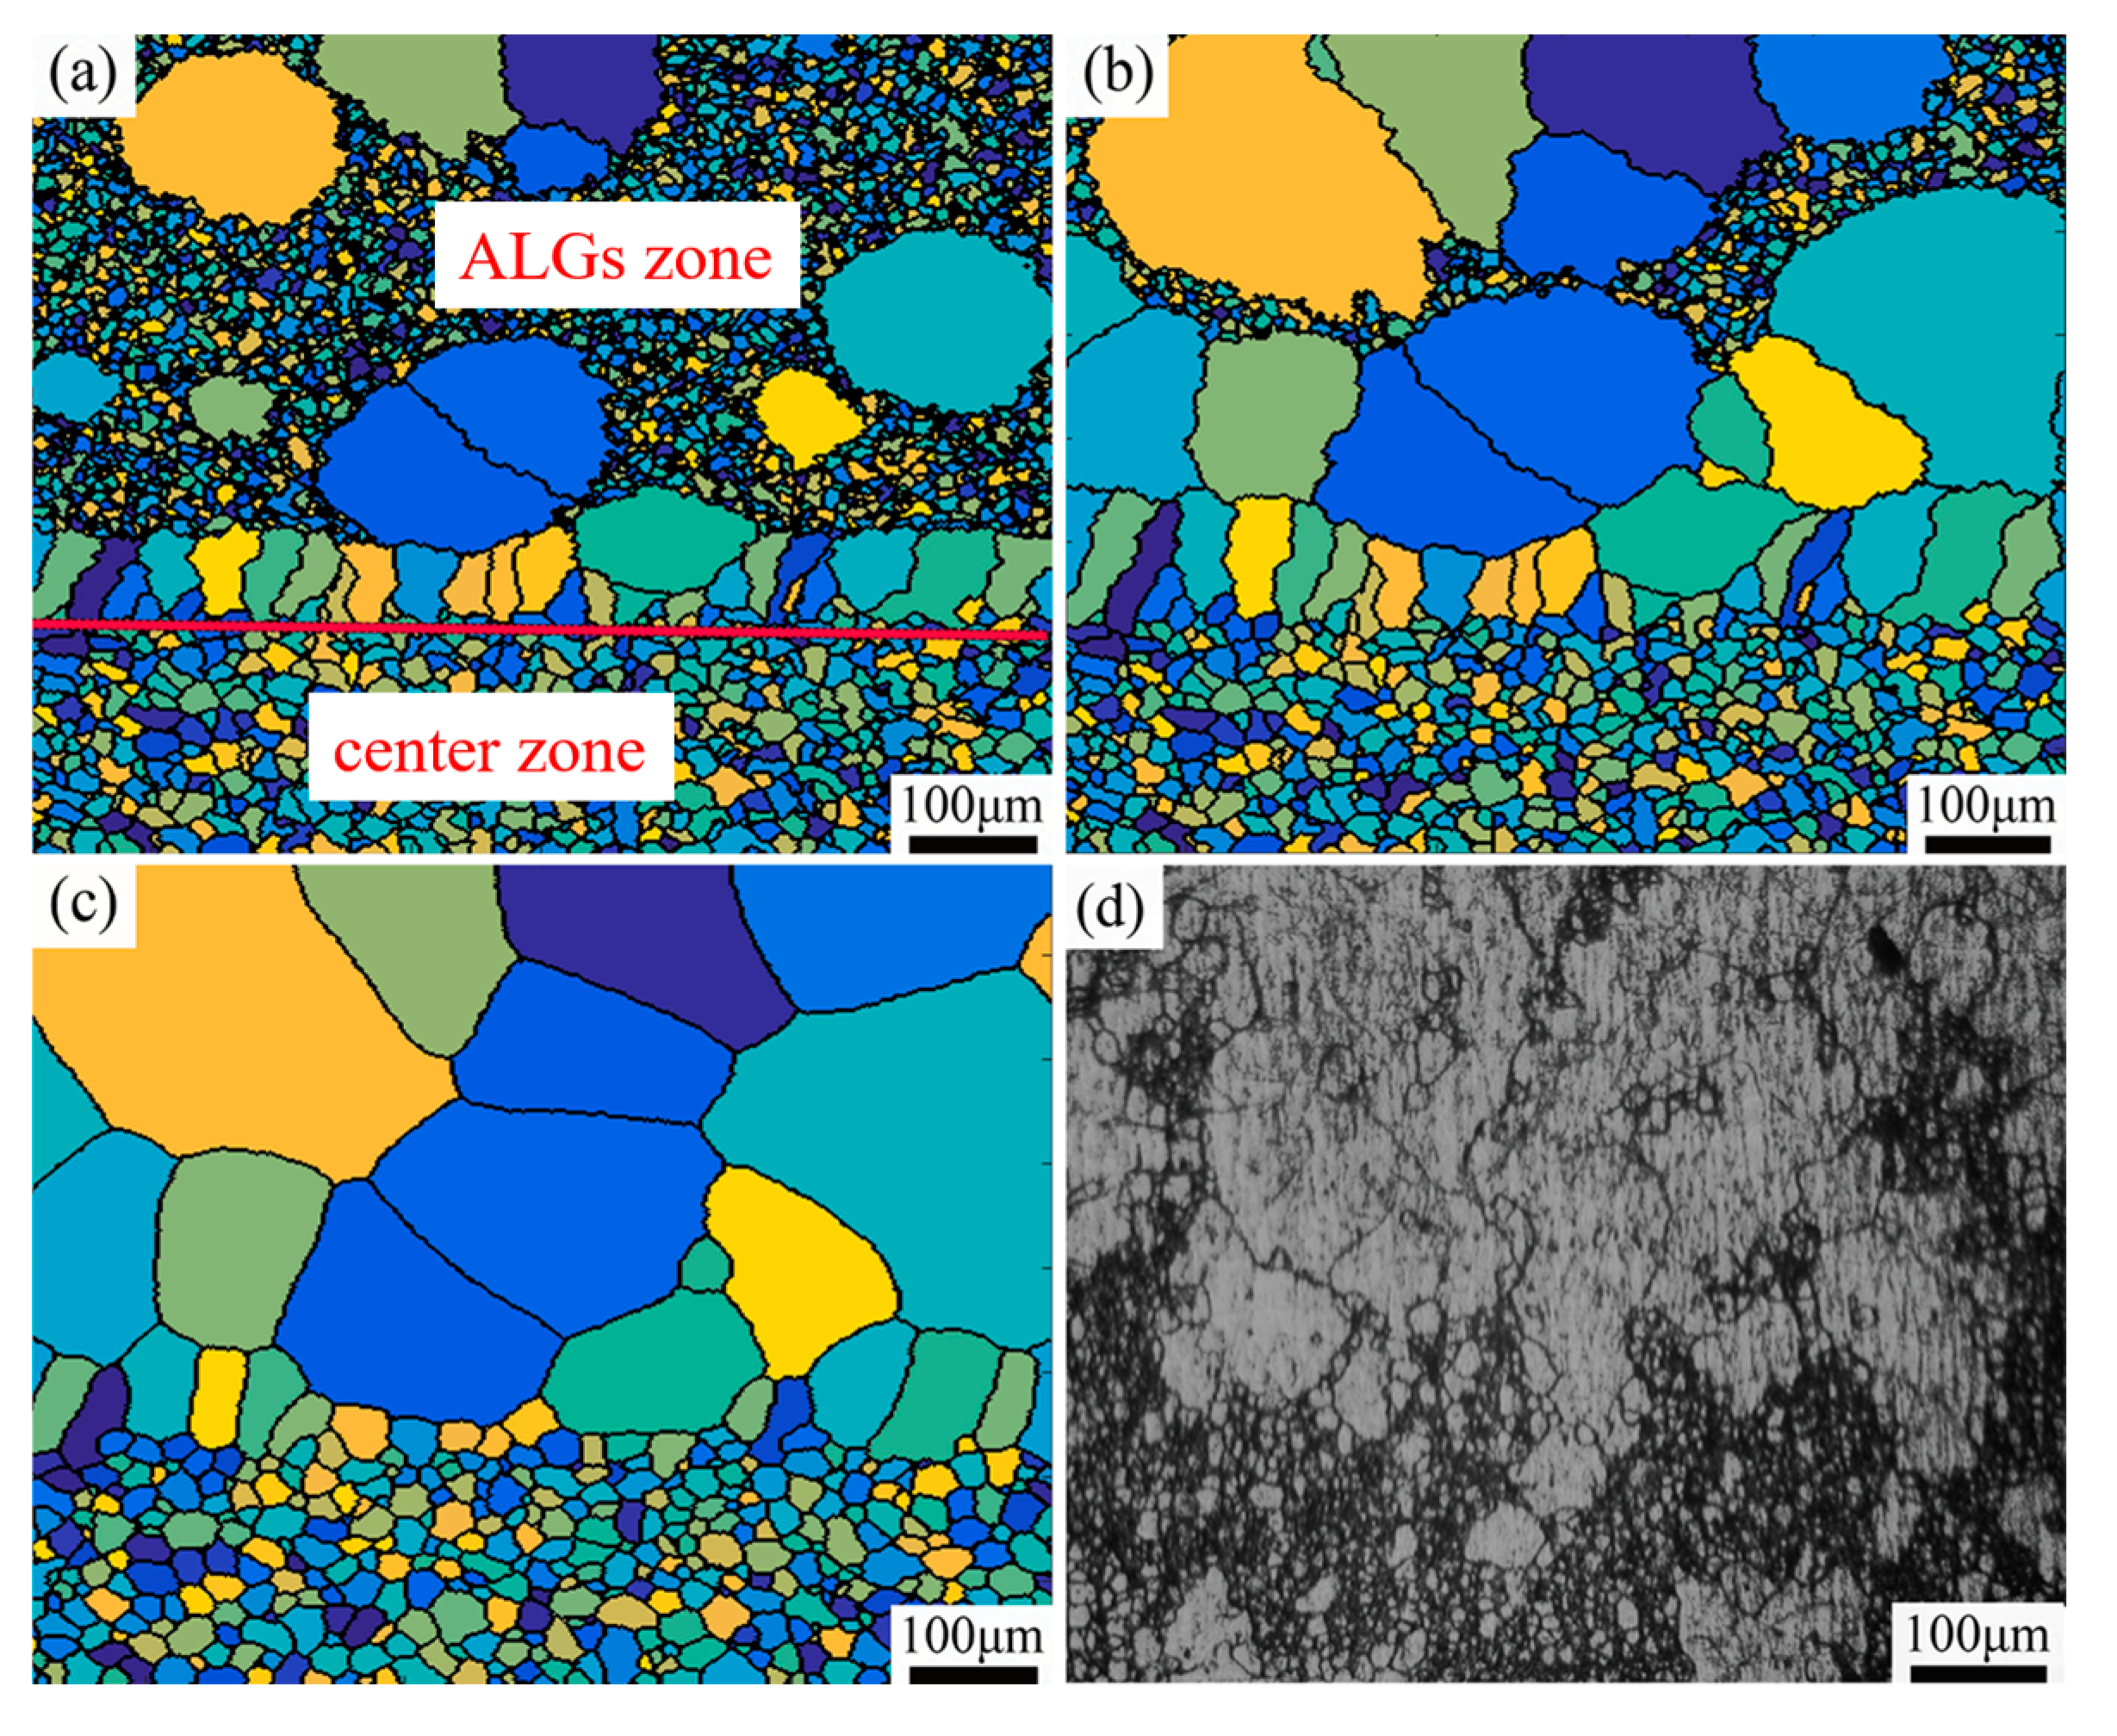
3.1. Microstructure of Over-Solution Treatment

Figure 3 shows the microstructure picture at P1 of the alloy after hot deformation at 1020 °C and over-solution treatment (1150 °C for 2 h). The figure shows a uniform distribution of grain size after over-solution treatment, but when the reduction amount is 10% and the reduction rate is 0.1 s−1, the alloy exhibits abnormally coarse grains. In addition, when the deformation amount from the hot deformation is low, some grains exhibit a basal plane parallel to the extrusion direction.
Figure 4 is the microstructure picture at P1 of the alloy after hot deformation at 1090 °C and over-solution treatment (1150 °C for 2 h). The increased temperature during thermal deformation causes a significant amount of γ′ to re-dissolve in the matrix [30], thereby reducing the resistance to grain boundary migration. Therefore, under this condition, it is easier for the grains to break the law of being arranged along the extrusion direction and form equiaxed grains. However, when the reduction amount is 10% and the reduction rate is 0.01 s−1, the alloy also has abnormal coarse grains. It is evident that the hot deformation parameters have a significant influence on the microstructure after over-solution treatment.

3.2. Thermal Deformation Conditions for Producing Abnormal Large Grains

Four main forms of microstructure were observed in the alloy following thermal deformations and over-solid solution treatments, as shown in Figure 5: Figure 5a,b show homogeneous equiaxed grain formations of varied sizes, while Figure 5c,d show bimodal structures with both large and tiny grains coexisting. The corresponding grain size distributions for Figure 5a–d are shown in Figure 5e–h. The grain size distribution of the alloys shown in Figure 5e,f approximately follows a Gauss distribution, and the maximum grain size is less than 40 μm. However, the grain size distribution of the alloy shown in Figure 5g,h no longer exhibits the characteristics of an approximate Gauss distribution, and large grains with sizes greater than 150 μm have appeared. Among them, the alloy, subjected to a deformation temperature of 1090 °C, a reduction rate of 0.005 s−1, and a 30% reduction, shows an average grain size of 43 μm and a maximum grain size of 153 μm after solid solution treatment, as shown in Figure 5g. And the alloy, deformed at 1070 °C with a reduction rate of 0.3 s−1 and a 30% reduction, has an average grain size of 50.4 μm and a maximum grain size of 400 μm, exhibiting a more uneven grain size distribution, as shown in Figure 5h.
Generally, the abnormal growth of grains requires both a size advantage [32] and a topological advantage [33]. In order to judge the conditions for the occurrence of ALGs, the method proposed by Novikov [34] is adopted in this paper; that is, when D m a x / D ¯ > 5 ( D m a x is the size of large grains and D ¯ is the average grain size), larger grains will obtain size advantages and topological advantages, thus forming ALGs.
Therefore, even though the large grain size in Figure 5c reaches 153 μm, it is not classified as an ALG. The reason for the double peaks could be incomplete recrystallization [35]. Since D m a x / D ¯ ≈ 6.8 in the microstructure shown in Figure 5d, the large grains are judged as ALGs. Table 2 shows the thermal deformation conditions corresponding to the generation of ALGs. It can be seen that no ALGs are produced at the deformation temperatures of 1050 °C and 1090 °C, and no ALGs are produced under the large deformation condition with a reduction of 60%.

3.3. Finite Element Simulation Results

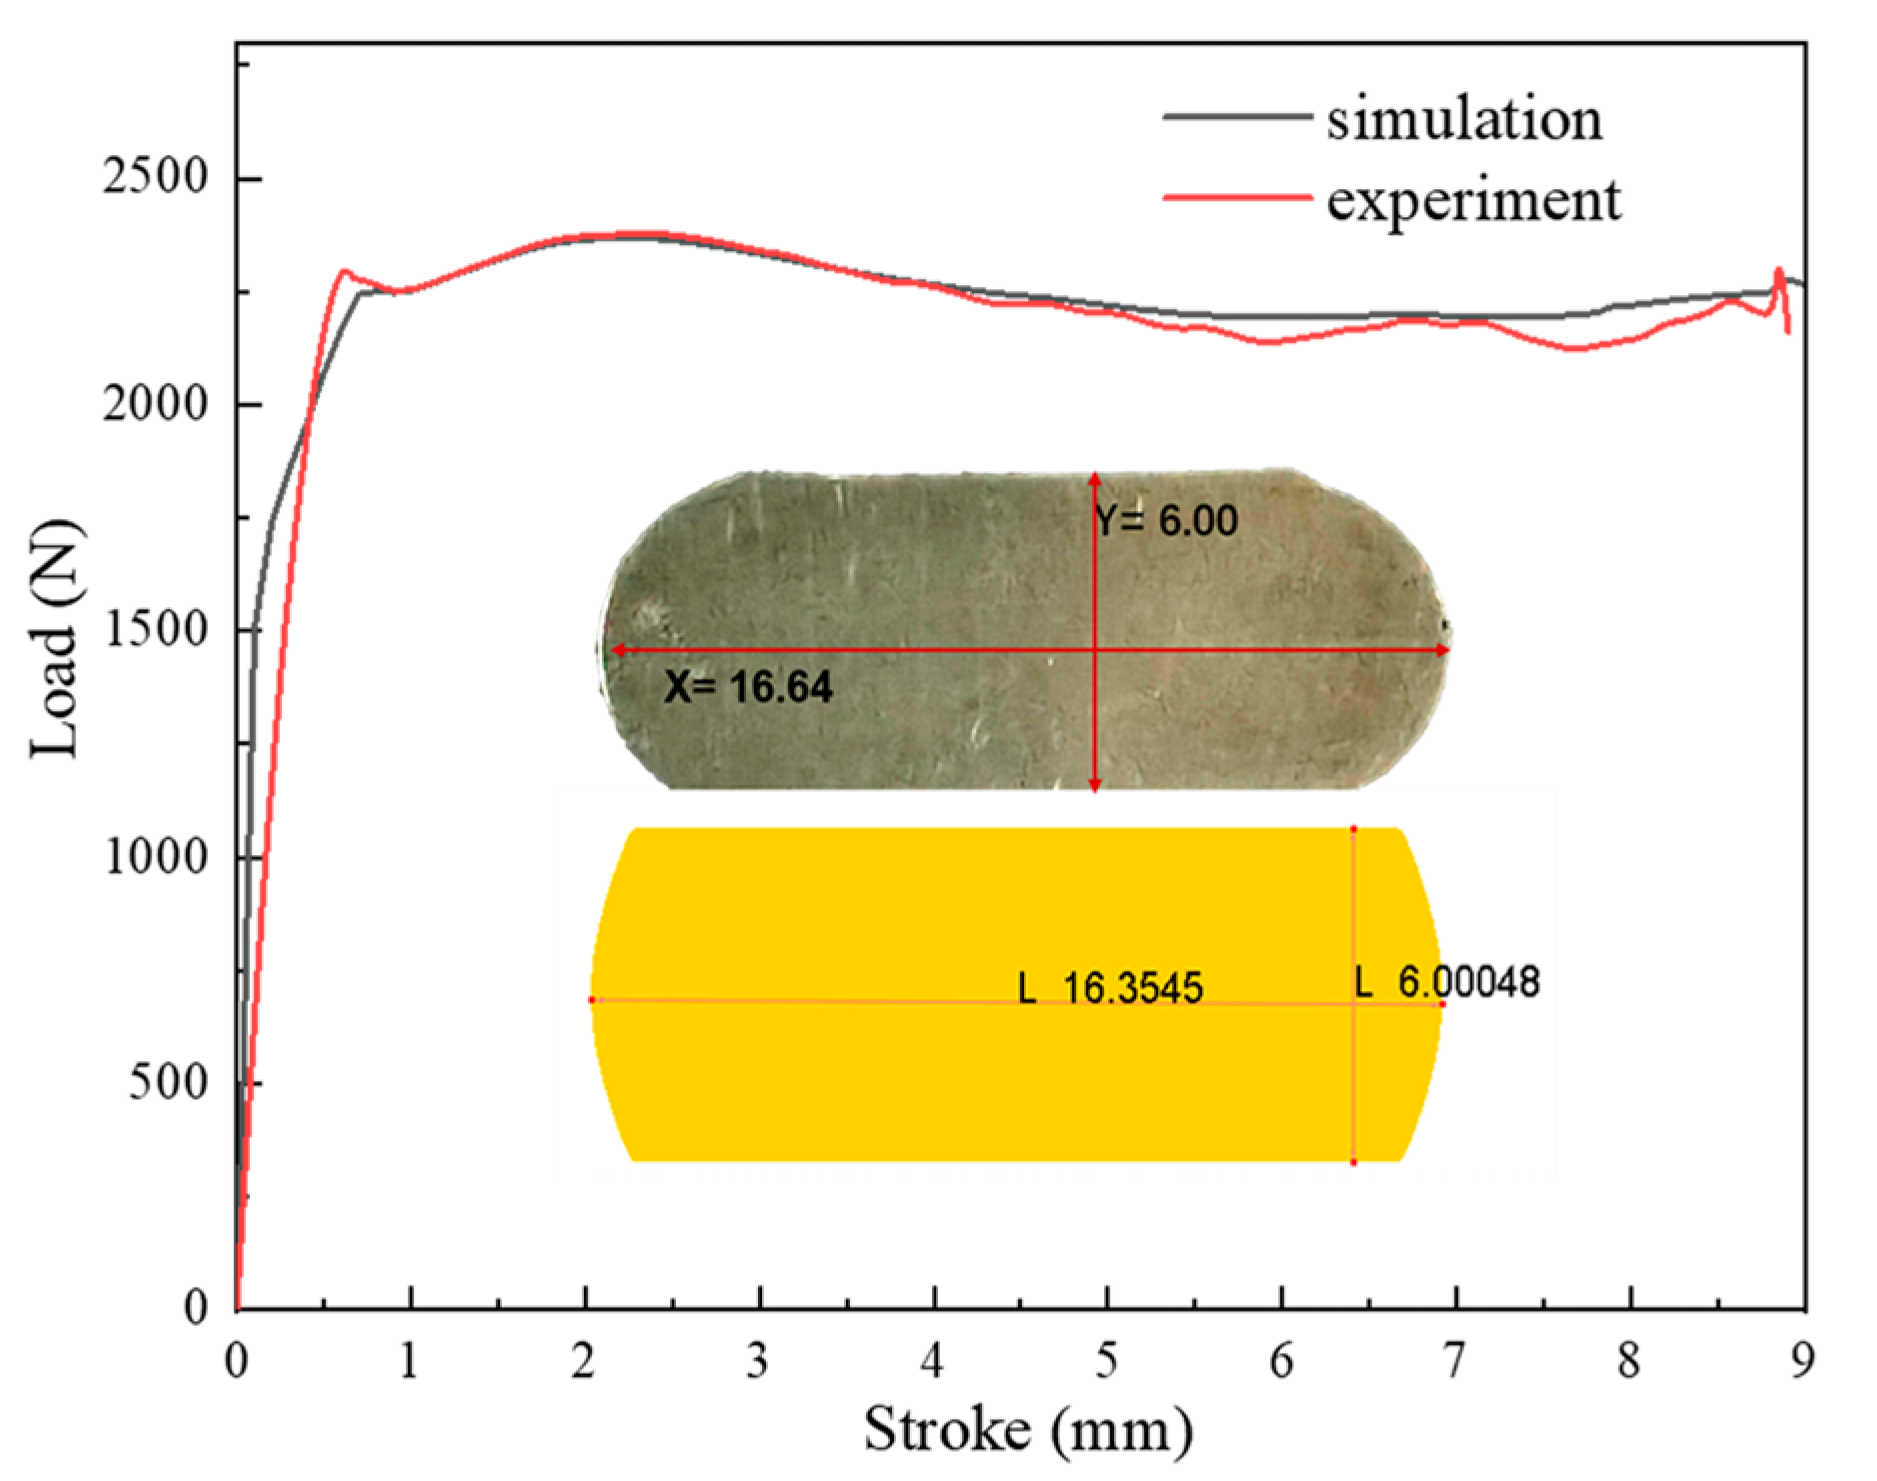
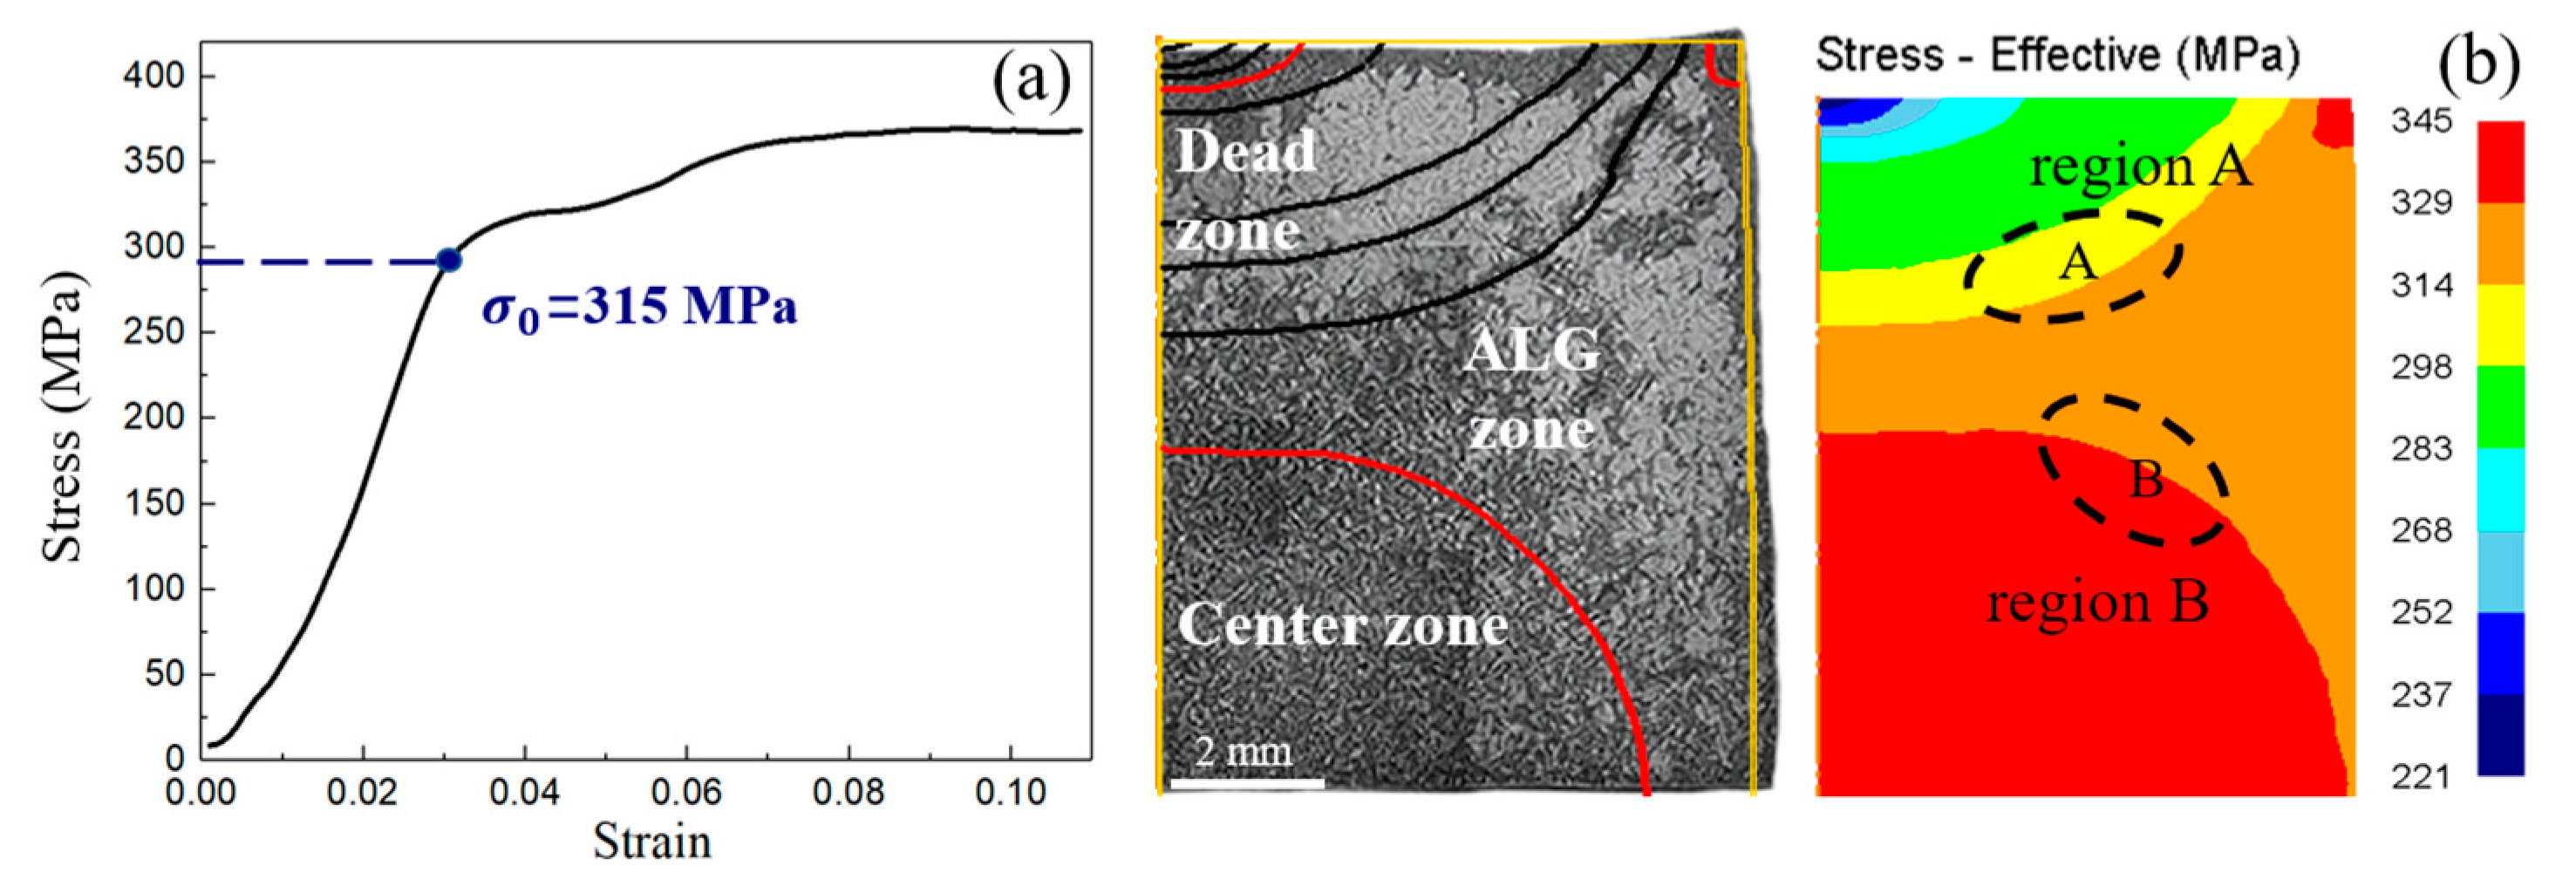
3.3.1. Finite Element Model Validation

The thermal deformation process under different conditions was simulated by DEFORM v11.0 software. Figure 6 shows the simulated and tested load–displacement curves and the final size of the specimen under the thermal deformation conditions of 1020 °C, a reduction rate of 0.1 s−1, and a reduction of 60%. It can be seen from the figure that the simulated displacement–load curve highly coincides with the curve obtained by the test, and only a small error occurs due to equipment fluctuations at the beginning and end of the test. The figure displays the height of the sample and the diameter of the bulging belly, both measured by a vernier caliper after the test. The results show that the size of the simulated sample is in good agreement with the test value and the diameter of the bulging belly is 0.3 mm smaller than the actual value. The results of the finite element simulation are of reference significance.

3.3.2. The Distribution of ALGs Under Different Thermal Deformation Conditions

The distribution nephograms of stress, strain, and strain rate of the samples after two different thermal deformation conditions and the microstructure photos after over-solution treatment are shown in Figure 7 (deformation temperature 1020 °C, reduction rate 1 s−1, reduction 10%) and Figure 8 (deformation temperature 1070 °C, reduction rate 0.3 s−1, reduction 30%). It can be seen from the figure that ALGs of different ranges and sizes appear at the local positions of the two samples, and the distribution of the two kinds of ALGs is highly correlated with the distribution and strain distribution, mainly appearing in the transition area between the deformation dead zone and the central large deformation zone of the sample. However, the distribution characteristics of abnormally large grains under these two hot deformation conditions are different. The size of ALGs in Figure 7f is larger, and there are no fine grains between ALGs, while the size of ALGs in Figure 8f is smaller, and there are fine grains included in them. Counting the grain size of the microstructure in Figure 7e, the maximum grain size D m a x in the ALG region is 245.2 μm, the average grain size D ¯ is 32.05 μm, and D m a x / D ¯ = 7.65. According to the simulation results of stress, strain, and strain rate shown in Figure 7a–c, the specific deformation condition range of ALGs can be further determined: strain 0.056~0.107, strain rate 0.341~1.16 s−1, and stress 276~329 MPa. According to the results shown in Figure 8, the specific deformation condition range of the ALG phenomenon at 1070 °C, reduction rate 0.3 s−1 and reduction amount 30% can be determined: strain 0.125~0.351, strain rate 0.028~0.315 s−1, stress 132~185 MPa, corresponding D m a x = 225 μm, average grain size D ¯ = 35 μm, and D m a x / D ¯ = 6.42. Table 2 similarly counts the stress, strain, and strain rate of the area where ALGs occur under different thermal deformation conditions.
Combined with the location of ALGs in this alloy and the finite element results after hot deformation, it is found that the temperature, stress, and strain of hot deformation have an important influence on the formation of ALGs. Figure 9 shows the microstructure of ALGs after solution treatment under thermal deformation conditions #1020-0.5-30 and #1020-1-10 in Table 2. The D m a x / D ¯ values of the microstructures shown in Figure 9a and Figure 9b are 6.46 and 7.12, respectively. Although the thermal deformation temperatures of both were 1020 °C, the distribution law of ALGs is obviously different. Fine homogeneous grains are mixed between the ALGs under thermal deformation conditions #1020-0.5-30, and the size of the abnormally large grains is relatively small, while there is almost no range of fine grains among the ALGs under thermal deformation conditions #1020-1-10, and the size of the abnormally large grains is continuously elongated. It can be seen from Table 2 that the stress and strain of the ALGs after thermal deformation at #1020-0.5-30 and #1020-1-10 are quite different, and the stress distribution of the ALGs has no overlapping range, which implies that the formation of ALGs has different formation mechanisms and is related to the stress and strain after thermal deformation.

4. Discussion

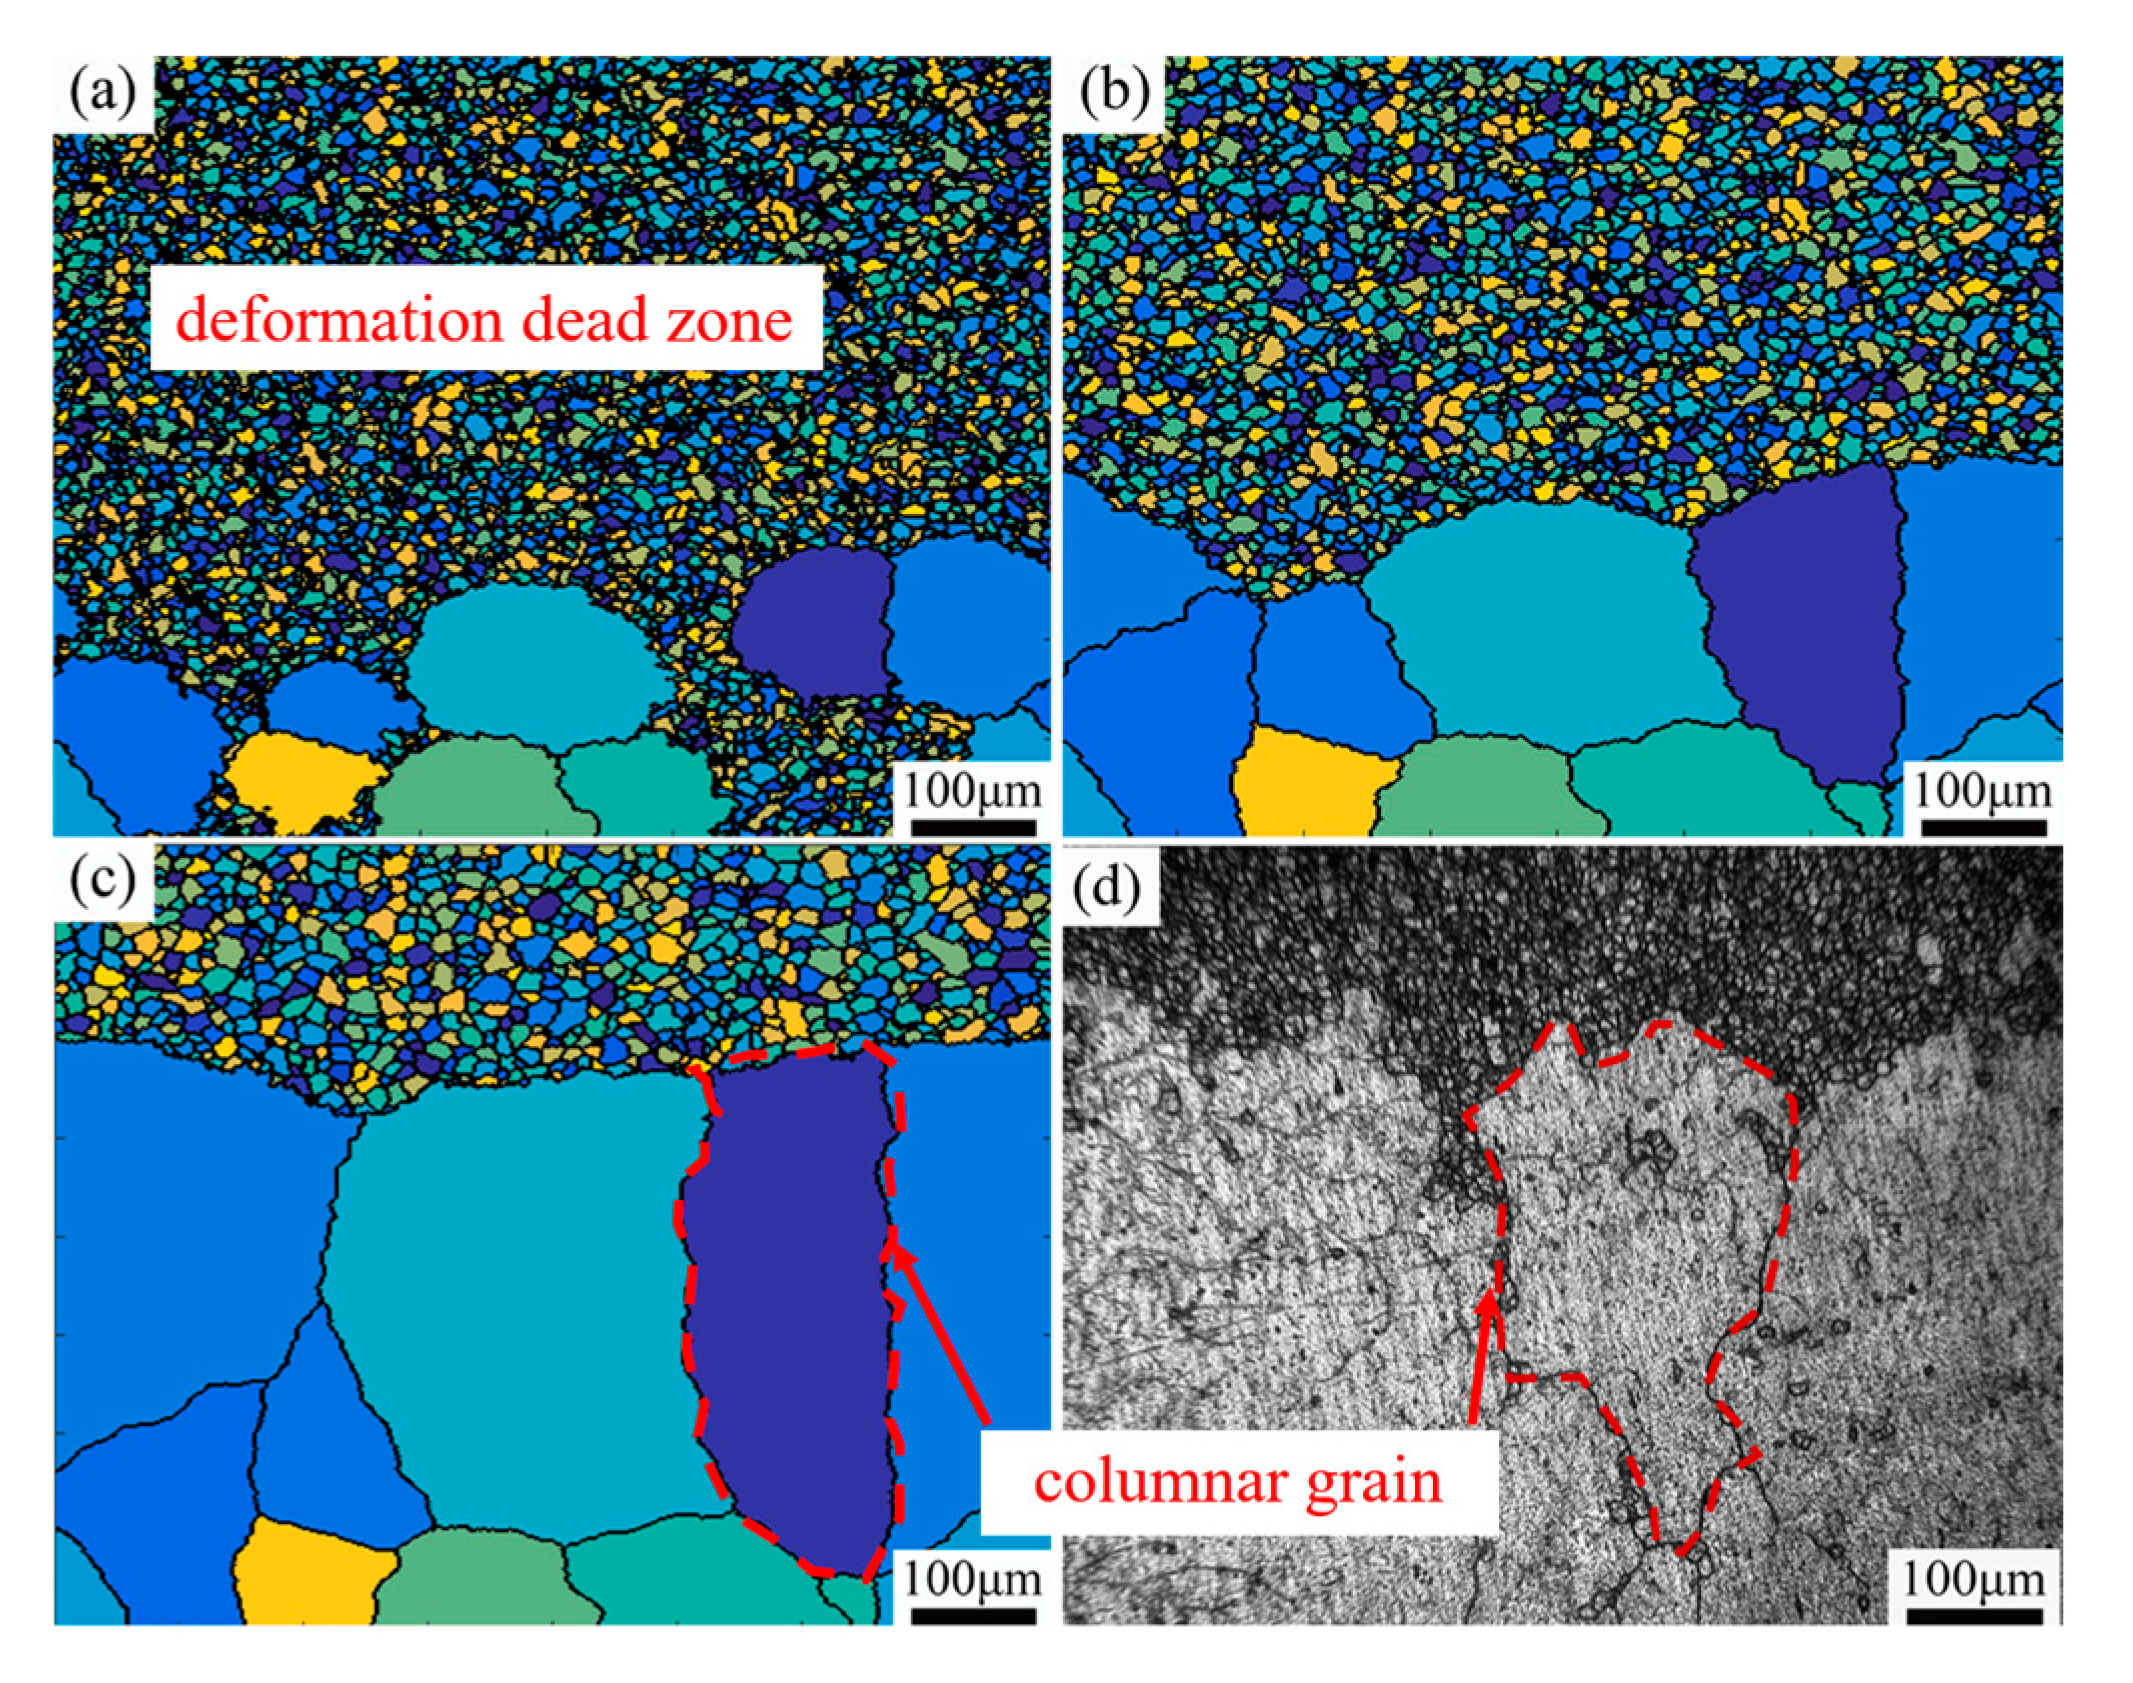
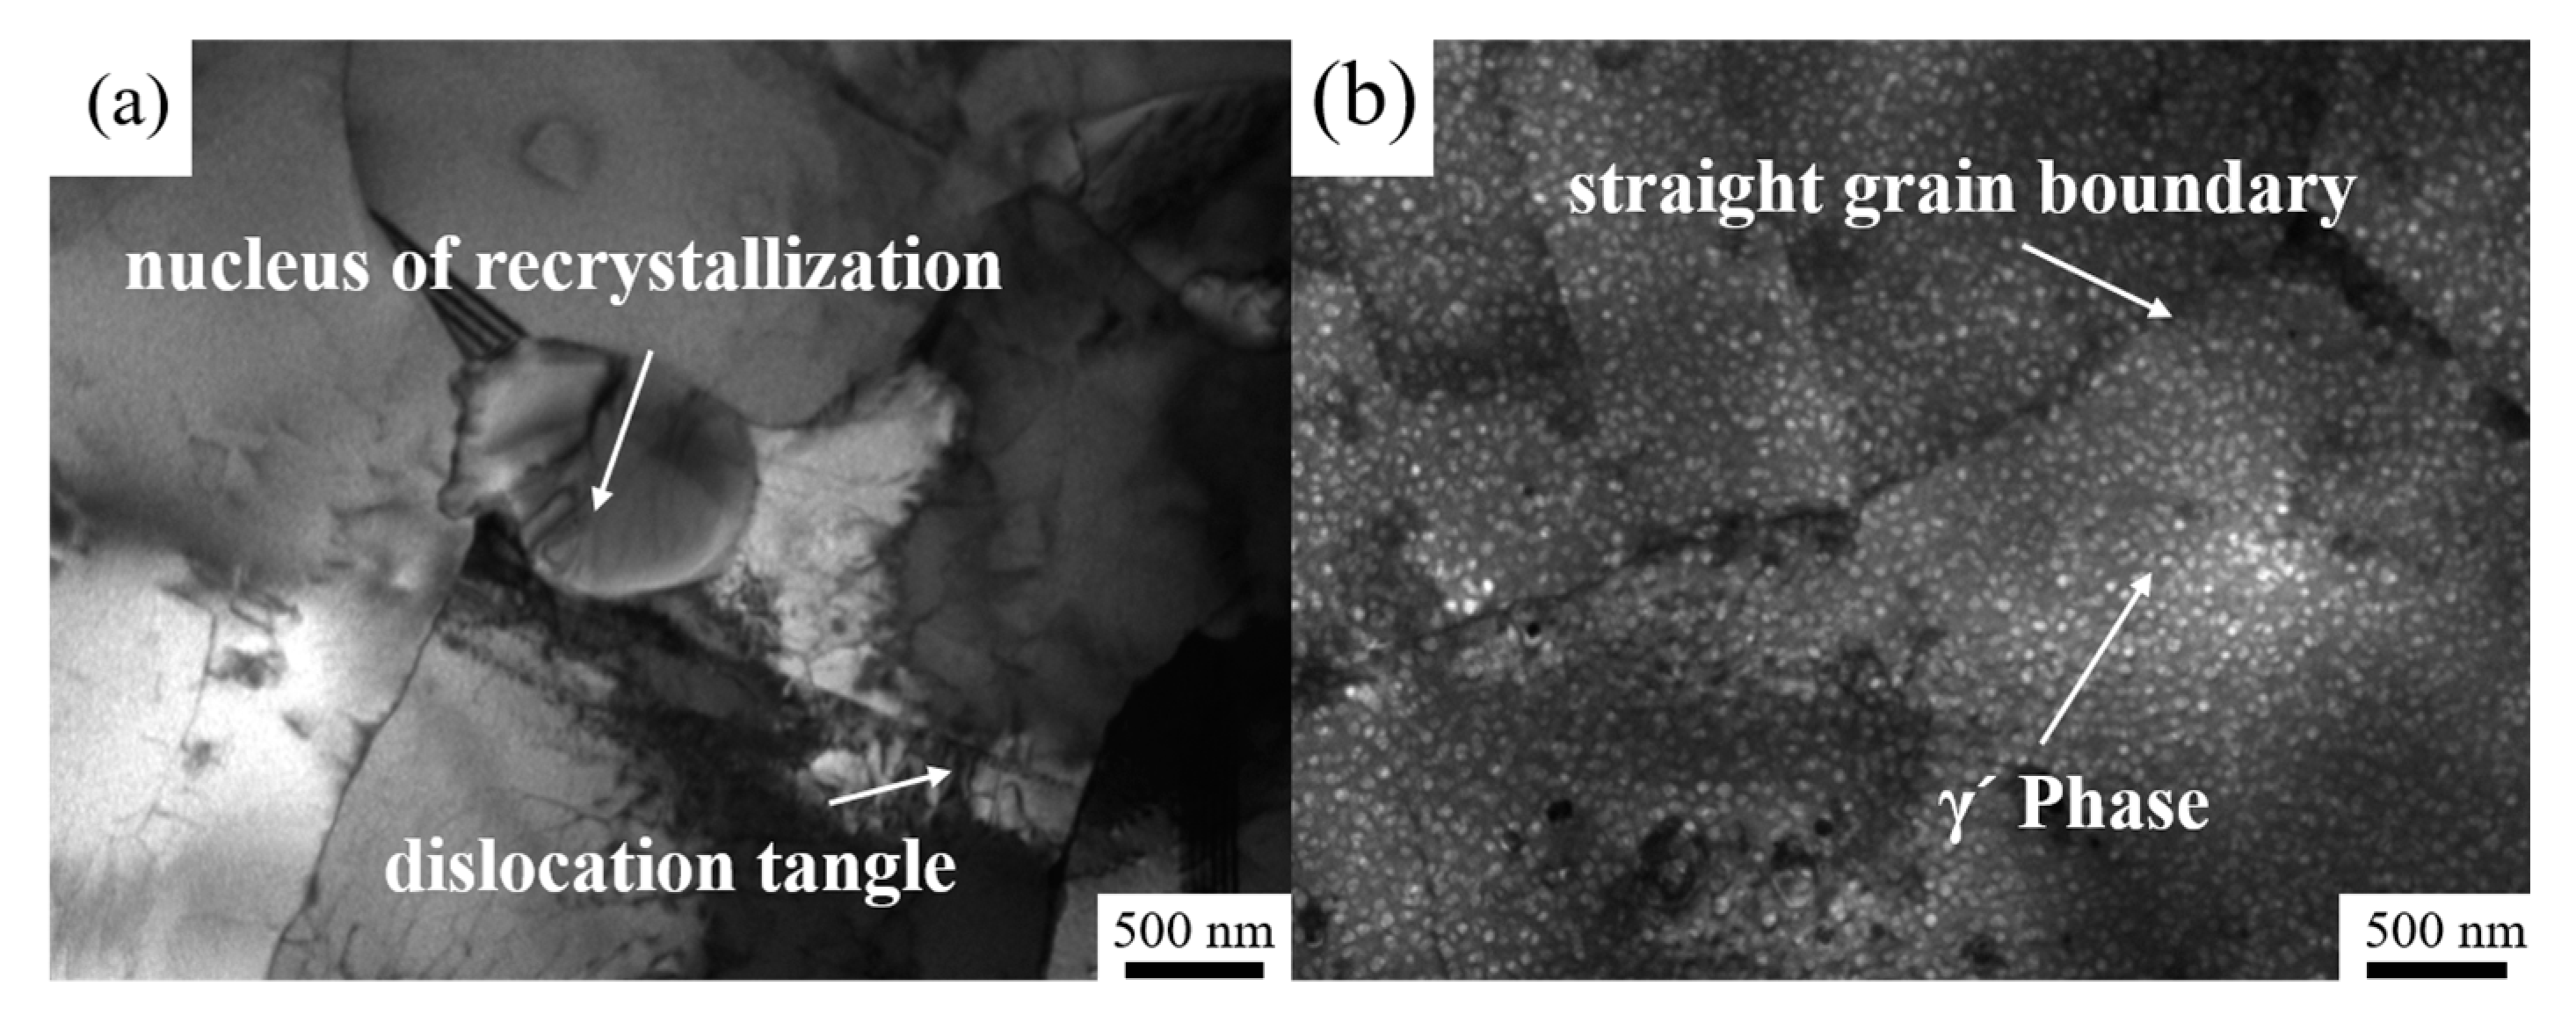
4.1. Formation Mechanism of ALGs with Different Distribution Characteristics

After hot deformation, the alloy undergoes supersolvus heat treatment. Due to temperature, stress, and other non-uniformity, the γ′ phase will dissolve locally before fully dissolving. In some alloy studies, ALGs may be generated due to the preferential growth of a few grains caused by the local dissolution of the γ′ phase [36]. In order to investigate the effect of the local dissolution of the γ′ phase during supersolvus heat treatment on the grain size of the superalloy, a CA model was constructed. The developed CA model was consistent with reference [30], where the initial average grain size of the alloy grains was 2 μm and the radius of the γ′ phase was 0.8 μm. The simulation set a situation where ALG formation is easy: the γ′ phase around the grains with size and topological advantages in the initial microstructure (the D m a x / D ¯ value of the microstructure is 5) was locally dissolved, while the grains in other regions were still pinned by the γ′ phase; the volume fraction of the γ′ phase was set to 10%, which was much higher than the volume fraction of a γ′ phase stable at 1150 °C; the time for the complete dissolution of the γ′ phase was set at a holding time of 10 min, which was greater than the time required for the dissolution of the γ′ phase at 1150 °C [30]. The purpose of this setting was to make the depinned grains grow as much as possible to study whether the local dissolution of the γ′ phase could produce ALGs alone during the supersolvus heat treatment process.
Figure 10 shows the simulation results; Figure 10a1–a4 show the microstructure evolution after the local dissolution of the γ′ phase, and Figure 10b1–b4 show the microstructure’s evolution after the complete dissolution of the γ′ phase. The simulation results reveal that the local dissolution of the γ′ phase causes the grain depinning to grow rapidly, while the growth rate of grains pinned by the γ′ phase in other regions is slower. But when all the γ′ phase is dissolved, the other alloy grains also grow rapidly, which is driven by the interfacial energy, and the difference in grain size between the abnormally grown grains and the other grains decreases. After 30 min, the D m a x / D ¯ value of the microstructure is 3.7, which is not determined as ALGs. Therefore, the abnormal grain growth generated by the local dissolution of the γ′ phase during supersolvus heat treatment alone will not develop into ALGs, which is consistent with the research conclusion in reference [15]. In addition, the correlation between the regions where ALGs appear and the stress and strain after thermal deformation also implies that the growth of ALGs is caused by critical grain growth instead of abnormal grain growth.
Figure 11 shows the distribution of local misorientation (LM) and twin boundaries before and after over-solution treatment in the area where ALGs appear under thermal deformation conditions #1020-0.5-30. The D m a x / D ¯ value of the microstructure shown in Figure 11b after solid solution treatment is 8.2. Figure 11a is the LM figure of the ALGs before over-solution treatment, from which it can be seen that the LM difference distribution inside the specimen after thermal deformation is uneven, which indicates that the stored energy distribution in the specimen after thermal deformation is uneven. Figure 11b is the LM figure of the specimen after over-solution treatment. The ALGs formed after over-solution treatment exhibit a low level of internal orientation difference, and the formation of ALGs partially releases the unevenly distributed stored energy in the specimen after heat deformation. Figure 11c is the IPF of the ALGs, from which it can be found that the formation of ALGs is not accompanied by preferential orientation, which indicates that ALGs are not caused by texture. In addition, during the growth of ALGs, there are high-density twins, as shown in Figure 11d, which may be due to the fact that the twin boundary is a special low-storage energy grain boundary. When low-energy grains absorb high-energy grains to form ALGs, the migration of large-angle grain boundaries releases storage energy, leading to the formation of twin boundaries [37].
Figure 12 shows the LM and IPF maps of the ALG occurrence area before and after over-solution treatment under the thermal deformation conditions #1020-1-10. The D m a x / D ¯ value of the microstructure shown in Figure 12b after solid solution treatment is 7.9. It can be seen that after thermal deformation, there is also a high orientation difference in the ALGs’ area locally, but, compared with the high LM distribution under the thermal conditions #1020-0.5-30, the distribution of LM under this condition is more dispersed. However, over-solution treatment significantly reduces the low local orientation difference (Figure 12b), indicating that over-solution treatment consumes most of the stored energy in the formation of ALGs. Under these conditions, the formation of ALGs should be more appropriately regarded as a limited recrystallization process, and the recrystallized nuclei are likely to originate from the high stored-energy location before over-solution treatment.

4.2. CA Simulation of Finite Recrystallization Formation Mechanism of ALGs

The classical nucleation theory holds that recrystallization nucleation is a thermal activation process, and the deformation storage energy is the driving force of nucleation. As a result, the thermal deformation parameters can have a significant impact on the nucleation rate of recrystallization by affecting storage energy. Formula (1) describes the recrystallization nucleation rate n ˙ [38]:
n ˙ = C 1 G G 0 C 2 e x p Q n / R T
where C1 and C2 are the material parameters; Q n is the recrystallization activation energy; R is the gas constant; T is the deformation temperature, and the value of the deformation temperature is 1293 K; G0 is the minimum stored energy required for recrystallization nucleation to occur; and G is the deformation stored energy generated by the deformation process, which can be expressed as:
G = τ ρ
where τ = α μ b 2 and is the dislocation energy. Where α is a constant and μ and b are the values of the shear modulus and the Burgers vector modulus, respectively, ρ is the dislocation density, and can be obtained from Equation (3) by measuring the von Mises equivalent stress [39]:
ρ = σ / α μ b 2
Therefore, according to Equations (1) to (3), recrystallization of the deformed grains is possible only when the local von Mises equivalent stress σ 1 is higher than the yield stress σ 0 under the thermal deformation condition. The recrystallization nucleation rate model is used as the basis for judging the formation mechanism of ALGs; that is, when the deformation storage energy in the ALG formation region is greater than the critical deformation storage energy of recrystallization, the formation mechanism of the ALGs is judged as finite recrystallization nucleation. Therefore, a cellular automata model is established, and the equivalent stress σ for calculating storage energy G is obtained by the FE method. The parameters used in developing CA are consistent with those in reference [30].
Figure 13 shows the microstructure, von Mises equivalent stress distribution nephograms, and experimentally obtained stress–strain curve of the sample under the conditions of #1020-1-10. The figure shows the yield stress σ 0 = 315 MPa under the thermal deformation condition. The figure can be divided into three areas based on the amount of deformation and the distribution of microstructures in the sample section: the deformation dead zone, the ALGs region, and the central region. The smallest equivalent stress occurs in the deformation dead zone, where the driving force is insufficient for recrystallization nucleation. However, the stress in the local area of the ALGs is higher than σ 0 , and nucleation-limited recrystallization may occur. As the position moves towards the central region, the equivalent stress gradually increases, presenting a gradient distribution. Additionally, the driving force of recrystallization increases, leading to complete recrystallization.
The cellular automata (CA) simulation results of the formation process of ALGs are shown in Figure 14 and Figure 15, which correspond to the boundary regions between the deformation dead zone and the ALGs region (region A) and the central region and the ALGs region (region B) in Figure 13, respectively. It can be seen from Figure 14 that due to the low storage energy in the ALGs region, fewer recrystallized grains are produced, and these recrystallized grains with low energy storage devour the surrounding high-energy deformed grains and grow rapidly until they collide with each other and stop growing. The simulated ALGs are composed of 200–300 μm grains. At the same time, these large grains will also swallow the grains in the deformation dead zone, making the ALGs present in a columnar shape. The experimental microstructure diagram in Figure 14d reveals a continuous elongation of the simulated and experimental ALGs, demonstrating consistency between the two.
Figure 15 shows the formation process of ALGs in the B region, as obtained by CA simulation. In the figure, the ALGs region is above the red dashed line, and the central region is below. It can be seen that a small amount of recrystallized grains produced in the ALGs region swallowed the surrounding grains, and the formed ALGs were composed of 50–150 μm grains. Because of the high storage energy in the central region, sufficient recrystallization can occur. These recrystallized grains consume the surrounding high storage energy grains and eventually come into contact with the ALGs, as shown in Figure 15a–c. The grain size of the ALGs in this region is smaller relative to the A region, which is due to the higher stress in the B region, which produces relatively more recrystallized grains.
Figure 16 is a TEM image of region A before and after over-solution treatment under the thermal deformation conditions #1020-1-10, and the location of region A is shown in Figure 13b. After thermal deformation, the dislocations in region A are entangled and a small number of recrystallized nuclei are formed at the grain boundaries. After over-solution treatment, the recrystallized grains in this region grew significantly, the grain boundaries became straight, the dislocations were annihilated, and a large number of spherical γ′ phases are evenly precipitated in the grain boundaries. This shows that the stored energy after thermal deformation is consumed in the A region during the over-solution treatment, and the small amount of recrystallized grains formed further consume the stored energy and interface energy of deformation and eventually develop into ALGs. The experimental results are consistent with those of the CA.

5. Conclusions

This paper studied the abnormal grain growth behavior of a powdered nickel-based superalloy during deformation heat treatment using microstructure analysis and a combined FE-CA approach. The research results of this paper are of great significance for avoiding ALG occurrence in the manufacturing process of nickel-based superalloy components. The main conclusions are as follows:
(1)
The hot deformation conditions, including the hot deformation temperature, reduction, and reduction rate, significantly influence the formation of ALGs in powder nickel-based superalloys after solution treatment. Combined with the finite element simulation and experimental results, the hot deformation conditions required for the alloy to form ALGs are obtained. ALGs only appeared at deformation temperatures of 1020 °C and 1070 °C, and no ALGs were found when the deformation exceeded 60%.
(2)
In this study, the grain coarsening caused by the dissolution of the local γ′ phase during solid solution treatment did not produce ALGs. The formation mechanism of ALGs after over-solution is influenced by the distribution of equivalent stress. After thermal deformation, if the partial equivalent stress of the ALG formation region is higher than the yield strength under corresponding conditions, the main formation mechanism of ALGs is limited recrystallization. Otherwise, the main formation mechanism of ALGs is the uneven distribution of storage energy; that is, the grains with low storage energy after thermal deformation swallow the grains with high storage energy.
(3)
The FE-CA approach can accurately simulate the formation process of ALGs generated by the limited recrystallization mechanism. Moreover, for ALGs formed by the limited nucleation recrystallization mechanism, the grain size of ALGs is related to the equivalent stress value in this region, and the higher the stress value, the smaller the grain size of the ALGs finally formed.

Author Contributions

Conceptualization, Y.Y.; methodology, X.C. and Y.Y.; software, X.C. and B.Z.; formal analysis, X.C., B.Z., X.W. and L.S.; investigation, X.C., B.Z., X.W. and Y.L.; writing—original draft preparation, B.Z. and X.C.; writing—review and editing, B.Z. and Y.Y.; visualization, B.Z., X.C., Y.F. and Z.L.; supervision, Y.Y.; project administration, Y.Y.; funding acquisition, Y.Y. All authors have read and agreed to the published version of the manuscript.

Funding

This work has been financially supported by National Natural Science Foundation of China (No. 5154195).

Data Availability Statement

The data presented in this study are available on request from the corresponding authors due to privacy.

Acknowledgments

The authors would like to thank the support of the National Natural Science Foundation of China (No. 5154195).

Conflicts of Interest

Author Xiuquan Chen was employed by the company Shanghai Kingfa Technology Development Company Ltd. Xiaoxuan Wang was employed by the company Xi’an Aerospace Power Machinery Company Ltd. The remaining authors declare that the research was conducted in the absence of any commercial or financial relationships that could be construed as a potential conflict of interest.

References

  1. Kumar, S.S.S.; Raghu, T.; Bhattacharjee, P.P.; Appa Rao, G.; Borah, U. Evolution of microstructure and microtexture during hot deformation in an advanced P/M nickel base superalloy. Mater. Charact. 2018, 146, 217–236. [Google Scholar] [CrossRef]
  2. Gessinger, G.H.; Bomford, M.J. Powder metallurgy of superalloys. Int. Metall. Rev. 1974, 19, 51–76. [Google Scholar] [CrossRef]
  3. Li, Z.; Qin, H.; Xu, K.; Xie, Z.; Ji, P.; Jia, M. Fatigue Behavior of the FGH96 Superalloy under High-Temperature Cyclic Loading. Materials 2023, 16, 5883. [Google Scholar] [CrossRef]
  4. Sreenu, B.; Sarkar, R.; Kumar, S.S.S.; Chatterjee, S.; Rao, G.A. Microstructure and mechanical behaviour of an advanced powder metallurgy nickel base superalloy processed through hot isostatic pressing route for aerospace applications. Mater. Sci. Eng. A 2020, 797, 140254. [Google Scholar] [CrossRef]
  5. Kikuchi, S.; Ando, S.; Futami, S.; Kitamura, T.; Koiwa, M. Superplastic deformation and microstructure evolution in PM IN-100 superalloy. J. Mater. Sci. 1990, 25, 4712–4716. [Google Scholar] [CrossRef]
  6. Gong, X.; Duan, Z.; Pei, W.; Chen, H. Superplastic Deformation Mechanisms of Superfine/Nanocrystalline Duplex PM-TiAl-Based Alloy. Materials 2017, 10, 1103. [Google Scholar] [CrossRef] [PubMed]
  7. Tan, G.; Li, H.; Wang, Y.; Yang, L.; Qiao, S.; Huang, Z.; Liu, M. Hot working characteristics of HEXed PM nickel-based superalloy during hot compression. Trans. Nonferrous Met. Soc. China 2020, 30, 2709–2723. [Google Scholar] [CrossRef]
  8. Song, K.; Aindow, M. Grain growth and particle pinning in a model Ni-based superalloy. Mater. Sci. Eng. A 2008, 479, 365–372. [Google Scholar] [CrossRef]
  9. Gabb, T.P.; Kantzos, P.T.; Telesman, J.; Gayda, J.; Sudbrack, C.K.; Palsa, B. Fatigue resistance of the grain size transition zone in a dual microstructure superalloy disk. Int. J. Fatigue 2011, 33, 414–426. [Google Scholar] [CrossRef]
  10. Kirchmayer, A.; Pröbstle, M.; Huenert, D.; Neumeier, S.; Göken, M. Influence of Grain Size and Volume Fraction of η/δ Precipitates on the Dwell Fatigue Crack Propagation Rate and Creep Resistance of the Nickel-Base Superalloy ATI 718Plus. Metall. Mater. Trans. A 2023, 54, 2219–2226. [Google Scholar] [CrossRef]
  11. Benz, M.G.; Blankenship, C.P.; Henry, M.F.; Huron, E.S.; Kissinger, R.D.; Raymond, E.L. Control of Grain Size of Nickel-Base Superalloy. U.S. Patent US5759305A, 4 February 1997. [Google Scholar]
  12. Carter, J.L.W.; Kuper, M.W.; Uchic, M.D.; Mills, M.J. Characterization of localized deformation near grain boundaries of superalloy René-104 at elevated temperature. Mater. Sci. Eng. A 2014, 605, 127–136. [Google Scholar] [CrossRef]
  13. Charpagne, M.; Franchet, J.; Bozzolo, N. Overgrown grains appearing during sub-solvus heat treatment in a polycrystalline γ-γ’ Nickel-based superalloy. Mater. Des. 2018, 144, 353–360. [Google Scholar] [CrossRef]
  14. Qiao, S.; Wang, Y.; Lv, L.; Huang, Z.; Tan, G. Normal and abnormal grain growth in a FGH96 superalloy during thermomechanical treatment. J. Mater. Res. Technol. 2021, 15, 7033–7049. [Google Scholar] [CrossRef]
  15. Wang, X.; Huang, Z.; Cai, B.; Zhou, N.; Magdysyuk, O.; Gao, Y.; Srivatsa, S.; Tan, L.; Jiang, L. Formation mechanism of abnormally large grains in a polycrystalline nickel-based superalloy during heat treatment processing. Acta Mater. 2019, 168, 287–298. [Google Scholar] [CrossRef]
  16. Hardy, M.; Huron, E.; Glatzel, U.; Griffin, B.; Lewis, B.; Rae, C.; Seetharaman, V.; Tin, S. Inhomogeneous Grain Coarsening Behavior in Supersolvus Heat Treated Nickel-Based Superalloy RR1000. In Proceedings of the Superalloys 2016: Proceedings of the 13th Intenational Symposium of Superalloys, Seven Spring, PA, USA, 11 September 2016. [Google Scholar]
  17. Miao, J.; Pollock, T.M.; Wayne Jones, J. Crystallographic fatigue crack initiation in nickel-based superalloy René 88DT at elevated temperature. Acta Mater. 2009, 57, 5964–5974. [Google Scholar] [CrossRef]
  18. Huron, E.; Srivatsa, S.; Raymond, E. Control of Grain Size Via Forging Strain Rate Limits for R88DT. Superalloys 2000, 2000, 49–58. [Google Scholar]
  19. Rios, P.R.; Zöllner, D. Critical assessment 30: Grain growth—Unresolved issues. Mater. Sci. Technol. 2018, 34, 629–638. [Google Scholar] [CrossRef]
  20. Kern, M.; Bernhard, M.; Presoly, P.; Brandl, D.; Bernhard, C. Critical Examination of the Representativeness of Austenite Grain Growth Studies Performed In Situ Using HT-LSCM and Application to Determine Growth-inhibiting Mechanisms. Bhm Berg-Und Hüttenmännische Monatshefte 2024, 169, 161–166. [Google Scholar] [CrossRef]
  21. DeMania, D.A. Recovery and Recrystallization in Nickel-Based Superalloy René 88 DT; University of Virginia: Charlottesville, VA, USA, 2002; p. 114. [Google Scholar]
  22. Rios, P.R. Abnormal growth in the presence of coarsening particles. Acta Metall. Et Mater. 1992, 40, 649–651. [Google Scholar] [CrossRef]
  23. Rios, P.R. Abnormal grain growth in materials containing particles. Acta Metall. Et Mater. 1994, 42, 839–843. [Google Scholar] [CrossRef]
  24. Kronberg, M.L.; Wilson, U.F. Secondary recrystallization in copper. JOM 1949, 1, 501–514. [Google Scholar] [CrossRef]
  25. Jung, S.; Yoon, D.Y.; Kang, S.L. Mechanism of abnormal grain growth in ultrafine-grained nickel. Acta Mater. 2013, 61, 5685–5693. [Google Scholar] [CrossRef]
  26. Schirra, J.J. Recovery And Recrystallization After Critical Strain In The Nickel-Based. Structure 2004, 34, 38. [Google Scholar]
  27. Blankenship, C.P.; Henry, M.F.; Hyzak, J.M.; Rohling, R.B.; Hall, E.L. Hot-Die Forging of P/M Ni-Base Superalloys. Superalloys 1966, 1996, 653–662. [Google Scholar]
  28. He, G.; Tan, L.; Liu, F.; Huang, L.; Huang, Z.; Jiang, L. Unraveling the formation mechanism of abnormally large grains in an advanced polycrystalline nickel base superalloy. J. Alloys Compd. 2017, 718, 405–413. [Google Scholar] [CrossRef]
  29. Zener, C.; Hollomon, J.H. Effect of Strain Rate Upon Plastic Flow of Steel. J. Appl. Phys. 1944, 15, 22–32. [Google Scholar] [CrossRef]
  30. Yang, Y.; Zhang, B.; Chen, X.; Wang, X.; Sun, J. Modeling and simulation of grain growth for FGH96 superalloy using a developed cellular automaton model. Model. Simul. Mater. Sci. Eng. 2024, 32, 55011. [Google Scholar] [CrossRef]
  31. GB/T 6394-2017[S]; Determination of Estimating the Average Grain Size of Metal. General Administration of Quality Supervision, Inspection and Quarantine of P.R.C: Beijing, China, 2017.
  32. Rios, P.R. Some Theoretical Considerations on Abnormal Grain Growth. Mater. Sci. Forum 1996, 204–206, 247–256. [Google Scholar] [CrossRef]
  33. Rios, P.R.; Glicksman, M.E. Topological theory of abnormal grain growth. Acta Mater. 2006, 54, 5313–5321. [Google Scholar] [CrossRef]
  34. Novikov, V.Y. Microstructure evolution during grain growth in materials with disperse particles. Mater. Lett. 2012, 68, 413–415. [Google Scholar] [CrossRef]
  35. Semiatin, S.L.; McClary, K.E.; Rollett, A.D.; Roberts, C.G.; Payton, E.J.; Zhang, F.; Gabb, T.P. Plastic Flow and Microstructure Evolution during Thermomechanical Processing of a PM Nickel-Base Superalloy. Metall. Mater. Trans. A 2013, 44, 2778–2798. [Google Scholar] [CrossRef]
  36. Srolovitz, D.J.; Grest, G.S.; Anderson, M.P. Computer simulation of grain growth-V. Abnormal grain growth. Acta Metall. 1985, 33, 2233–2247. [Google Scholar] [CrossRef]
  37. Lee, S.B.; Yoon, D.Y.; Henry, M.F. Abnormal grain growth and grain boundary faceting in a model Ni-base superalloy. Acta Mater. 2000, 48, 3071–3080. [Google Scholar] [CrossRef]
  38. Zheng, C.; Xiao, N.; Li, D.; Li, Y. Microstructure prediction of the austenite recrystallization during multi-pass steel strip hot rolling: A cellular automaton modeling. Comput. Mater. Sci. 2008, 44, 507–514. [Google Scholar] [CrossRef]
  39. Lin, Y.C.; Liu, Y.; Chen, M.; Huang, M.; Ma, X.; Long, Z. Study of static recrystallization behavior in hot deformed Ni-based superalloy using cellular automaton model. Mater. Des. 2016, 99, 107–114. [Google Scholar] [CrossRef]
Figure 1. The microstructure of the P/M nickel-based superalloy bar at the edge position. (a) The SEM images of the primary and secondary γ′; (b) the IPF map of the alloy grain.
Crystals 15 00091 g001
Figure 2. The schematic diagram of the sampling location for hot compression specimens and the subsequent experimental processes.
Crystals 15 00091 g002
Figure 3. The microstructure at P1 after holding the alloy at 1150 °C for 2 h following separate hot deformation at 1020 °C. The reduction amounts of (aici) (i = 1, 2, 3) are 10%, 30%, and 60%, respectively; the reduction rates corresponding to (a1a4) are 0.001 s−1, 0.01 s−1, 0.1 s−1, and 1 s−1, respectively; and the meanings of (b1b4,c1c4) are the same as those of (a1a4).
Crystals 15 00091 g003
Figure 4. The microstructure at P1 after holding the alloy at 1150 °C for 2 h following separate hot deformation at 1090 °C. The reduction amounts of (aici) (i = 1, 2, 3) are 10%, 30%, and 60%, respectively; the reduction rates corresponding to (a1a4) are 0.001 s−1, 0.01 s−1, 0.1 s−1, and 1 s−1, respectively; and the meanings of (b1b4) and (c1c4) are the same as those of (a1a4).
Crystals 15 00091 g004
Figure 5. The microstructure photos and corresponding grain size distributions of the alloy after hot deformation and over-solution treatment. Hot deformation conditions: (a) 1020 °C, reduction 30%, reduction rate 0.005 s−1; (b) 1070 °C, reduction 10%, reduction rate 0.1 s−1; (c) 1090 °C, reduction 30%, reduction rate 0.005 s−1; (d) 1070 °C, reduction 30%, reduction rate 0.3 s−1. The grain size distributions of (ad) correspond to (eh).
Crystals 15 00091 g005
Figure 6. The displacement–load curve and final dimensions of the specimen obtained by simulation and test under thermal deformation conditions of 1020 °C, a reduction rate of 0.1 s−1, and a reduction 60%.
Crystals 15 00091 g006
Figure 7. The distribution nephograms of strain, strain rate, and stress after a deformation temperature of 1020 °C, reduction rate of 1 s−1 and reduction of 10%, and microstructure photographs after over-solution treatment. (ac) Nephograms of equivalent stress, equivalent strain, and equivalent strain rate distribution in the shaded area in (d) after thermal deformation, respectively; (e) is the microstructure of the shaded area in (d) after solution treatment; and (f) is the enlarged area of abnormally large grain microstructure in (e).
Crystals 15 00091 g007
Figure 8. The distribution nephograms of strain, strain rate, and stress after a deformation temperature of 1070 °C, reduction rate of 0.3 s−1 and reduction of 30%, and microstructure photographs after over-solution treatment. (ac) Nephograms of equivalent stress, equivalent strain, and equivalent strain rate distribution in the shaded area in (d) after thermal deformation, respectively; (e) is the microstructure of the shaded area in (d) after solution treatment; and (f) is the enlarged area of abnormally large grain microstructure in (e).
Crystals 15 00091 g008
Figure 9. Microstructure of ALGs after over-solution treatment under different heat deformation conditions. (a) #1020-0.5-30; (b) #1020-1-10.
Crystals 15 00091 g009
Figure 10. The CA simulation results of grain growth accompanied by the dissolution of the γ′ phase in supersolvus heat treatment. (a1a4) The CA simulation results of the grain growth accompanied by the local dissolution of the γ′ phase. (b1b4) The CA simulation results of the grain growth accompanied by the complete dissolution of the γ′ phase.
Crystals 15 00091 g010
Figure 11. LM and twin boundary maps for hot-deformed microstructures (#1020-0.5-30) corresponding to ALGs zone before and after over-solution treatment. (a) LM maps before over-solution treatment; (b) LM maps after over-solution treatment; (c) inverse pole figure after over-solution treatment; (d) twin boundary maps after over-solution treatment.
Crystals 15 00091 g011
Figure 12. LM and twin boundary maps for hot-deformed microstructures (#1020-1-10) corresponding to ALGs zone before and after over-solution treatment. (a) LM maps before over-solution treatment; (b) LM maps after over-solution treatment; (c) inverse pole figure after over-solution treatment.
Crystals 15 00091 g012
Figure 13. Stress–strain curve, cross section microstructure, and von Mises equivalent stress distribution diagram of specimen under thermal deformation conditions #1020-1-10. (a) The stress–strain curve. (b) Cross section microstructure and von Mises equivalent stress distribution diagram.
Crystals 15 00091 g013
Figure 14. The CA simulation and experimental results of the formation process of ALGs in the over-solution treatment process of zone A. (ac) The CA simulation results from the initial, middle, and end of the over-solution treatment, respectively. (d) The microstructure of region A after over-solution treatment.
Crystals 15 00091 g014
Figure 15. The CA simulation and experimental results of the formation process of ALGs in the over-solution treatment process of zone B. (ac) The CA simulation results from the initial, middle, and end of the over-solution treatment, respectively. (d) The microstructure of region B after over-solution treatment.
Crystals 15 00091 g015
Figure 16. TEM images of region A before and after over-solution treatment under thermal deformation conditions #1020-1-10. (a) Before over-solution treatment; (b) after over-solution treatment.
Crystals 15 00091 g016
Table 1. Parameters of isothermal hot compression experiment.
ParametersValue
Temperature (°C)1020, 1050, 1070, 1090
Strain rate (s−1)0.001, 0.003, 0.005, 0.01, 0.03, 0.1, 0.3, 0.5, 1
Reduction amount (%)10, 30, 60
Table 2. The range of deformation conditions in the regions where ALGs appear.
Thermal Deformation ConditionsTemperature (°C)Reduction Rate (s−1)ReductionStrainStrain Rate (s−1)Stress (MPa)
#1020-0.05-1010200.0510%0.099~0.1100.049~0.056176~188
#1020-0.05-300.0530%0.133~0.2650.027~0.052141~164
#1020-0.1-100.110%0.106~0.1370.106~0.142249~268
#1020-0.3-100.310%0.108~0.1230.087~0.103242~267
#1020-0.3-300.330%0.040~0.2680.040~0.278187~244
#1020-0.5-300.530%0.039~0.2110.0676~0.468194~274
#1020-1-10110%0.056~0.1070.341~1.16276~329
#1070-0.1-3010700.130%0.268~0.3740.151~0.224119~145
#1070-0.3-300.330%0.125~0.3510.028~0.315132~185
#1070-0.3-300.530%0.143~0.2850.245~0.452149~199
Disclaimer/Publisher’s Note: The statements, opinions and data contained in all publications are solely those of the individual author(s) and contributor(s) and not of MDPI and/or the editor(s). MDPI and/or the editor(s) disclaim responsibility for any injury to people or property resulting from any ideas, methods, instructions or products referred to in the content.

