
Analysis of Microstructure and Performance of Cr3C2/Ni60A Coating on 45 Steel for Laser Cladding Piston Rod

Abstract
1. Introduction
2. Experimental Materials and Methods
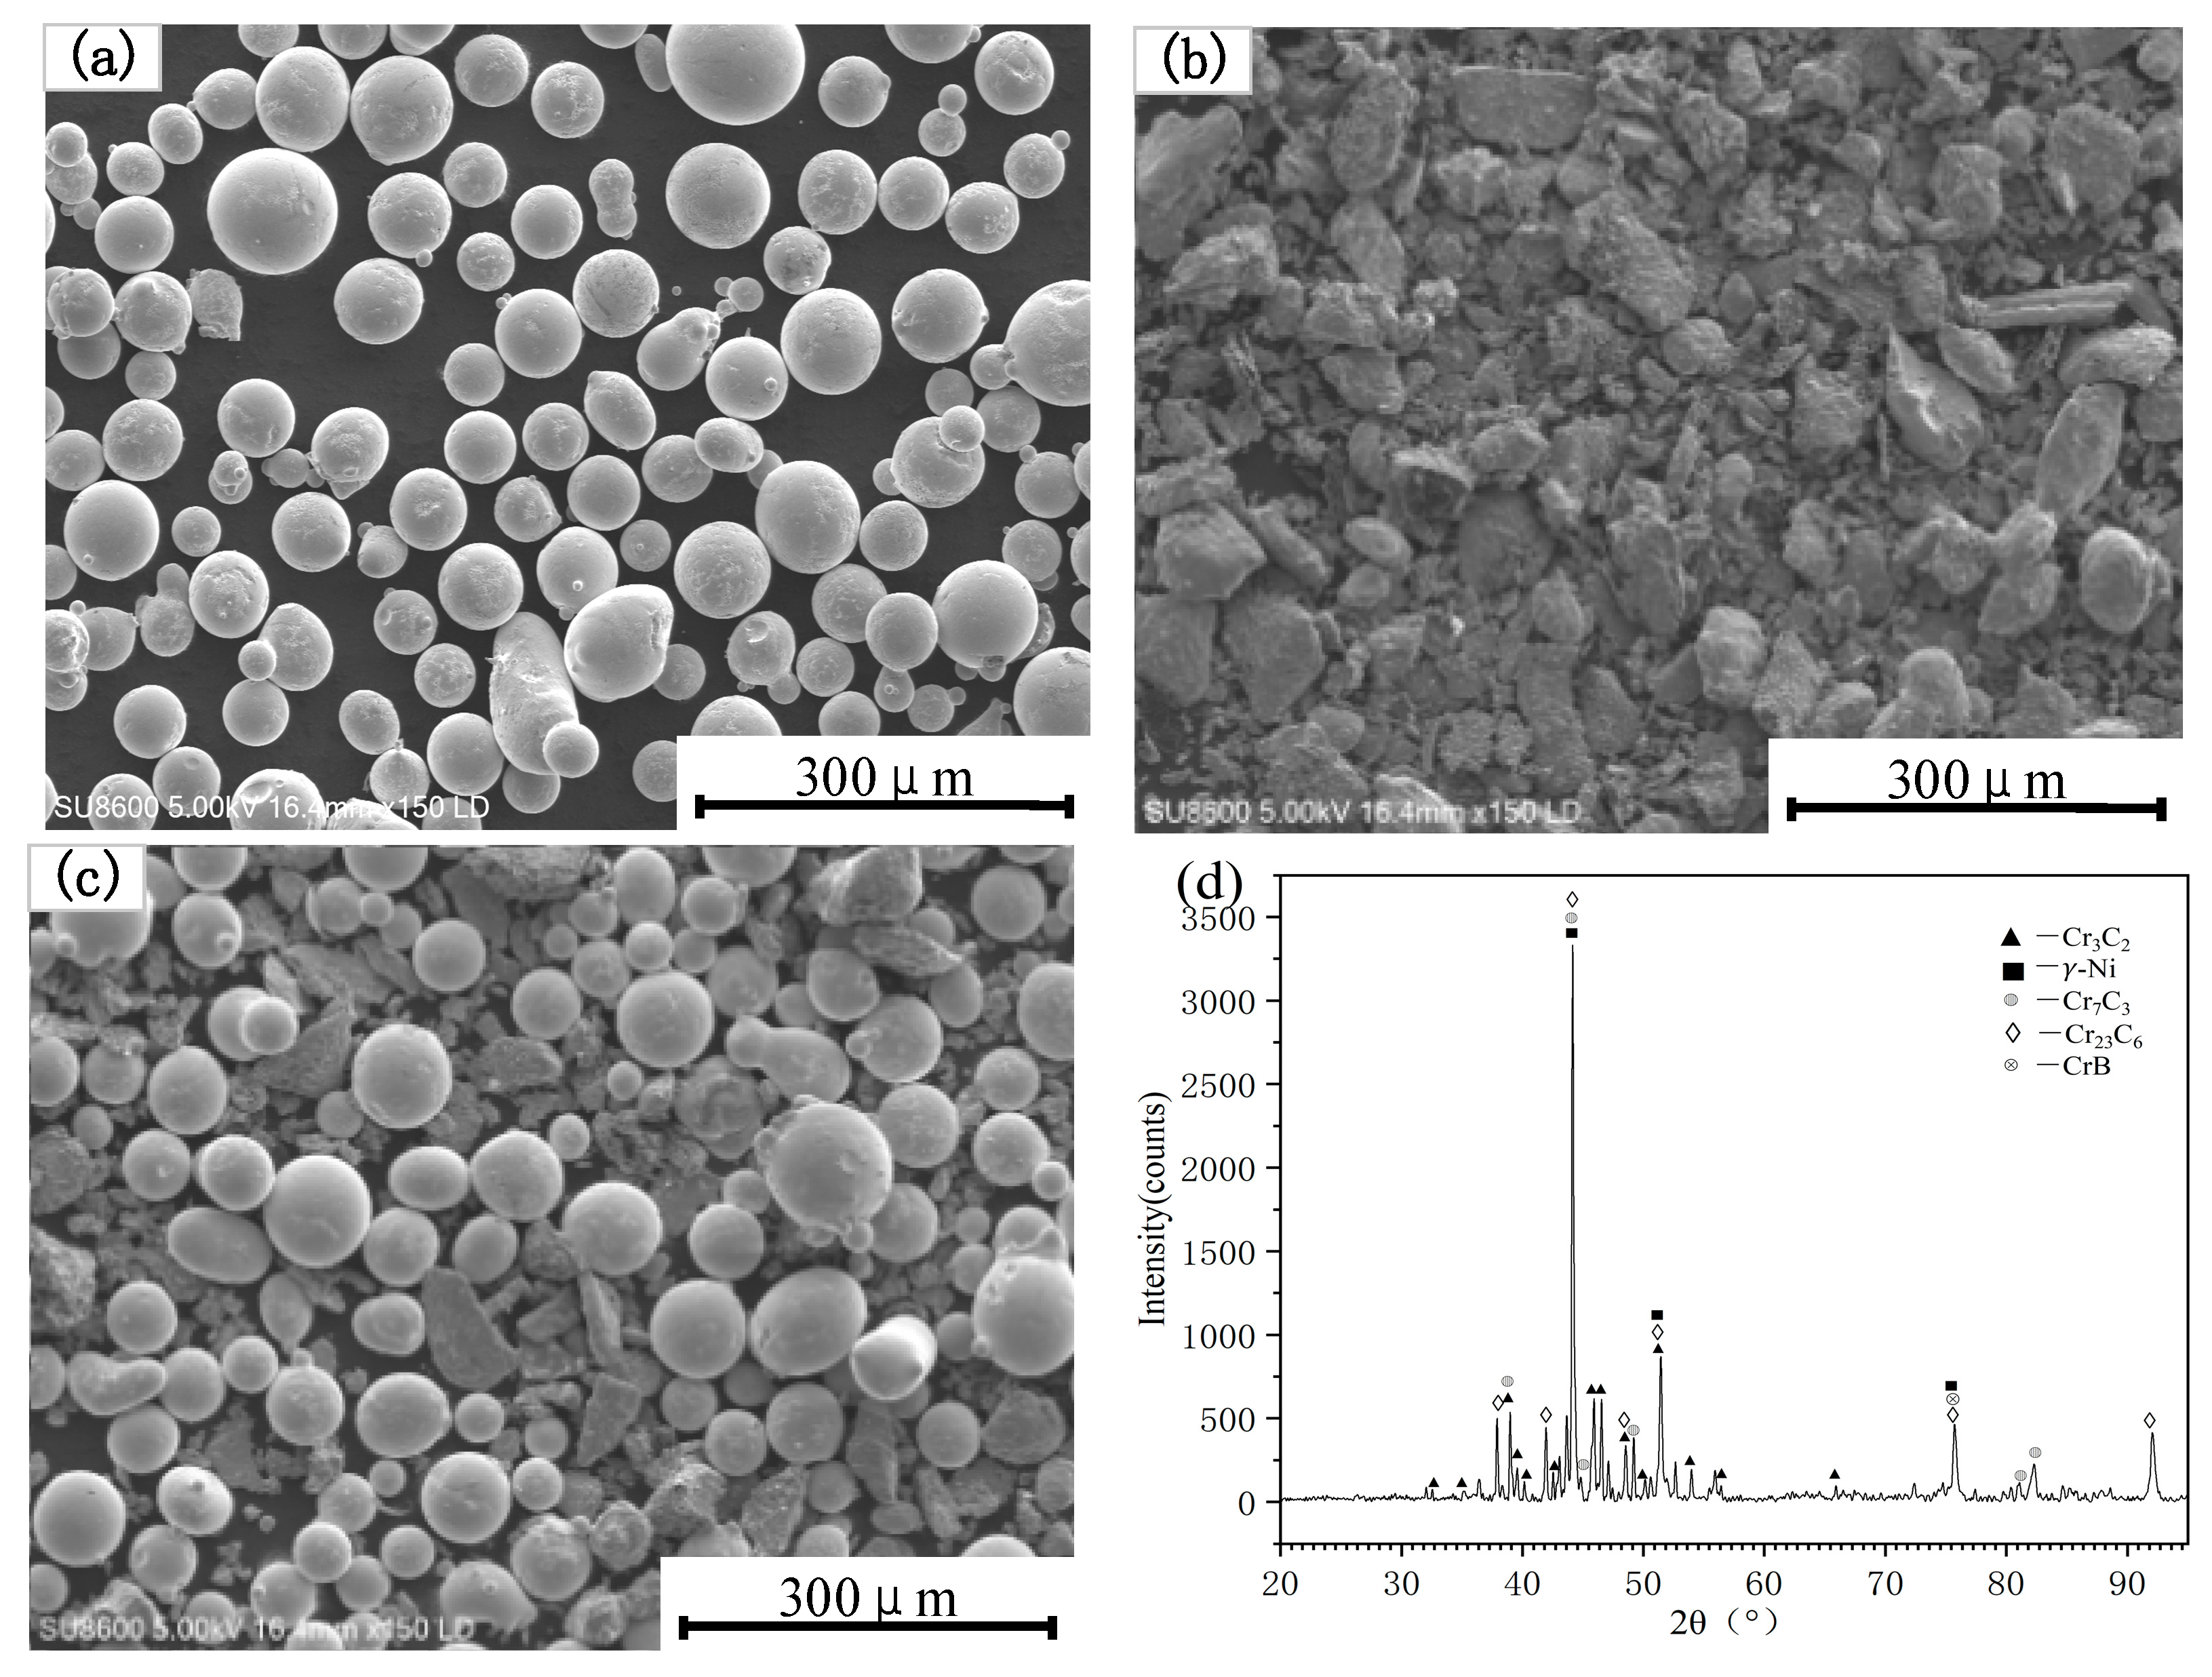
2.1. Materials
2.2. Coating Preparation Process
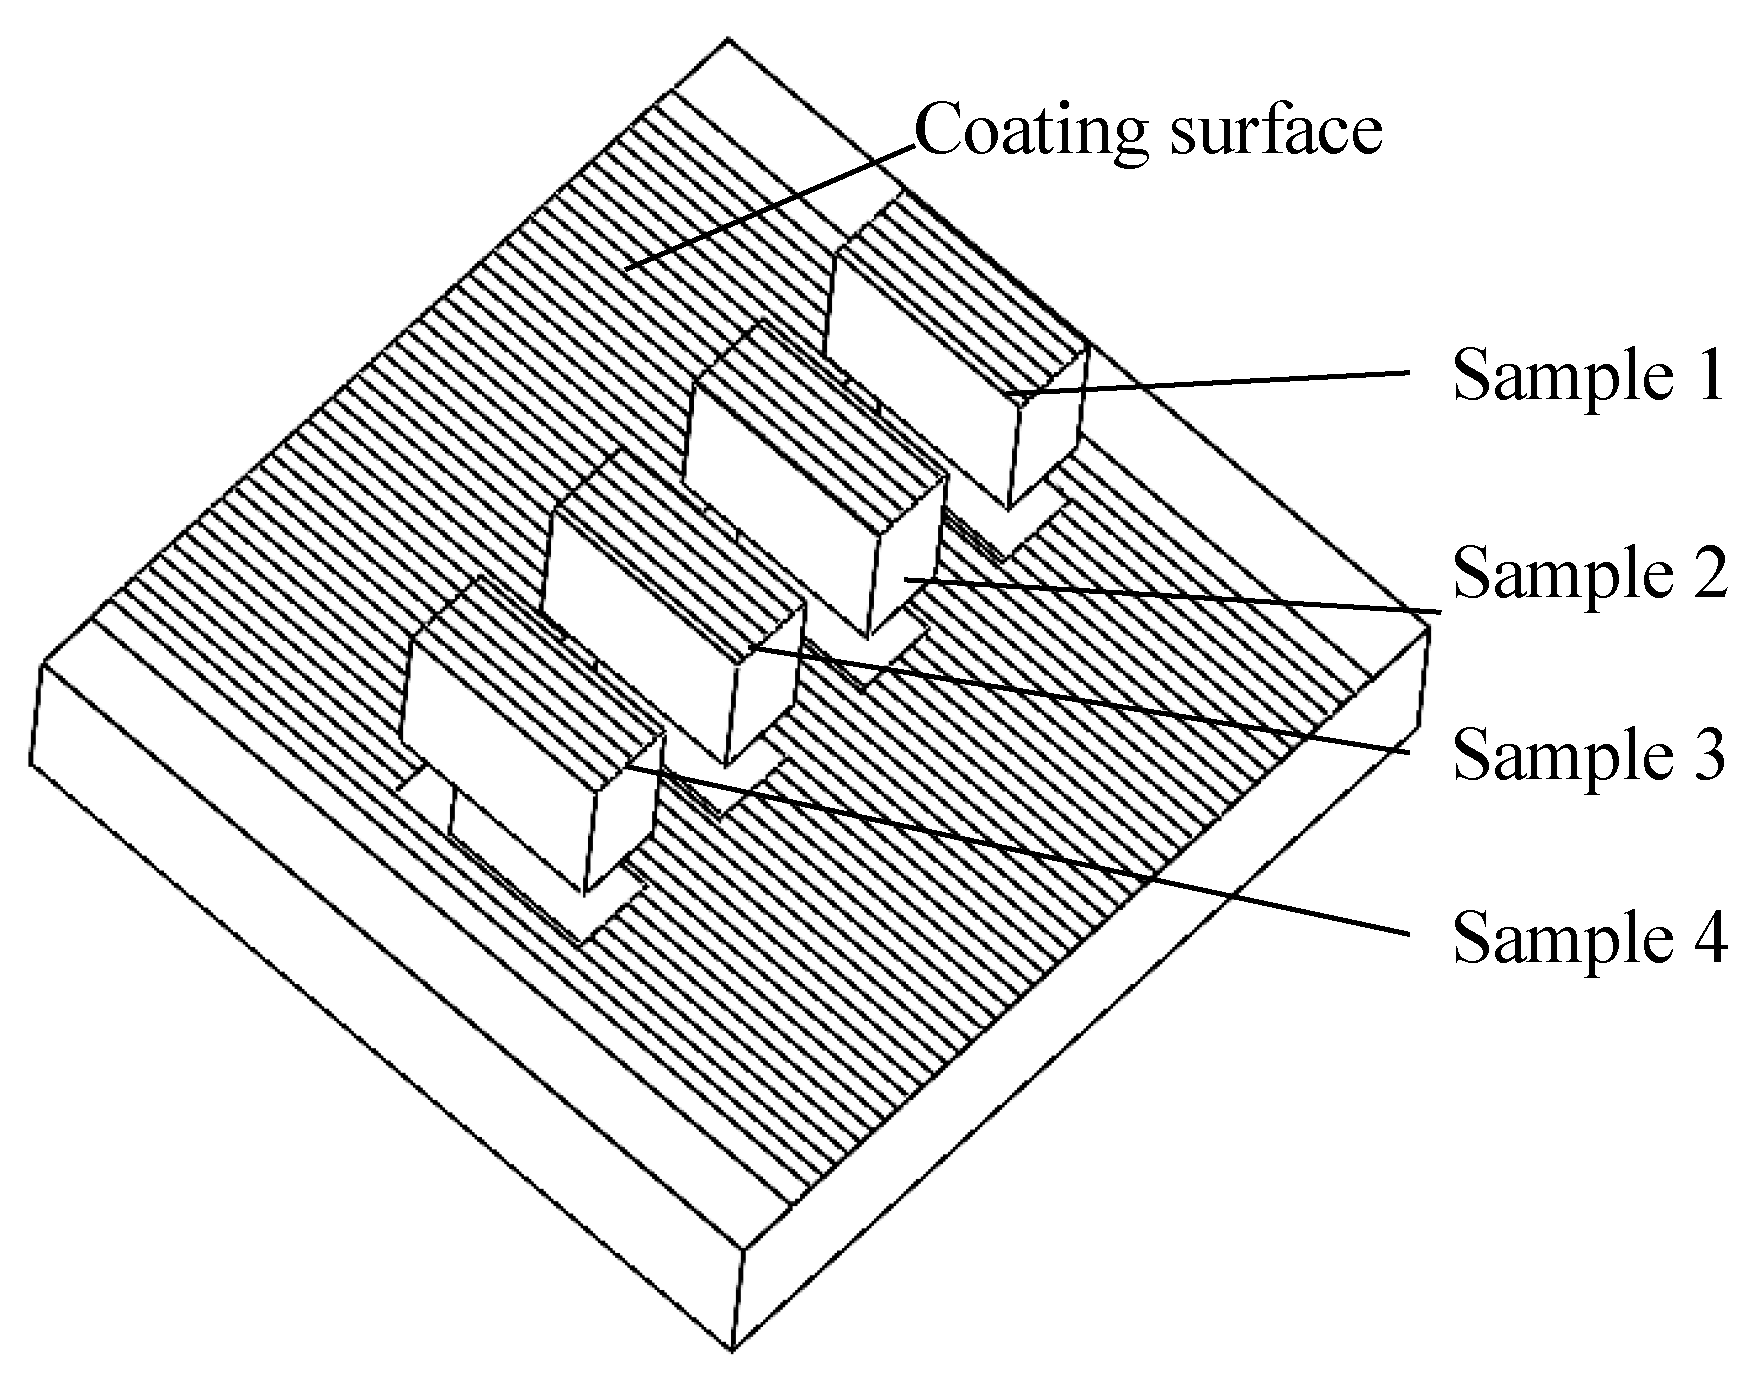
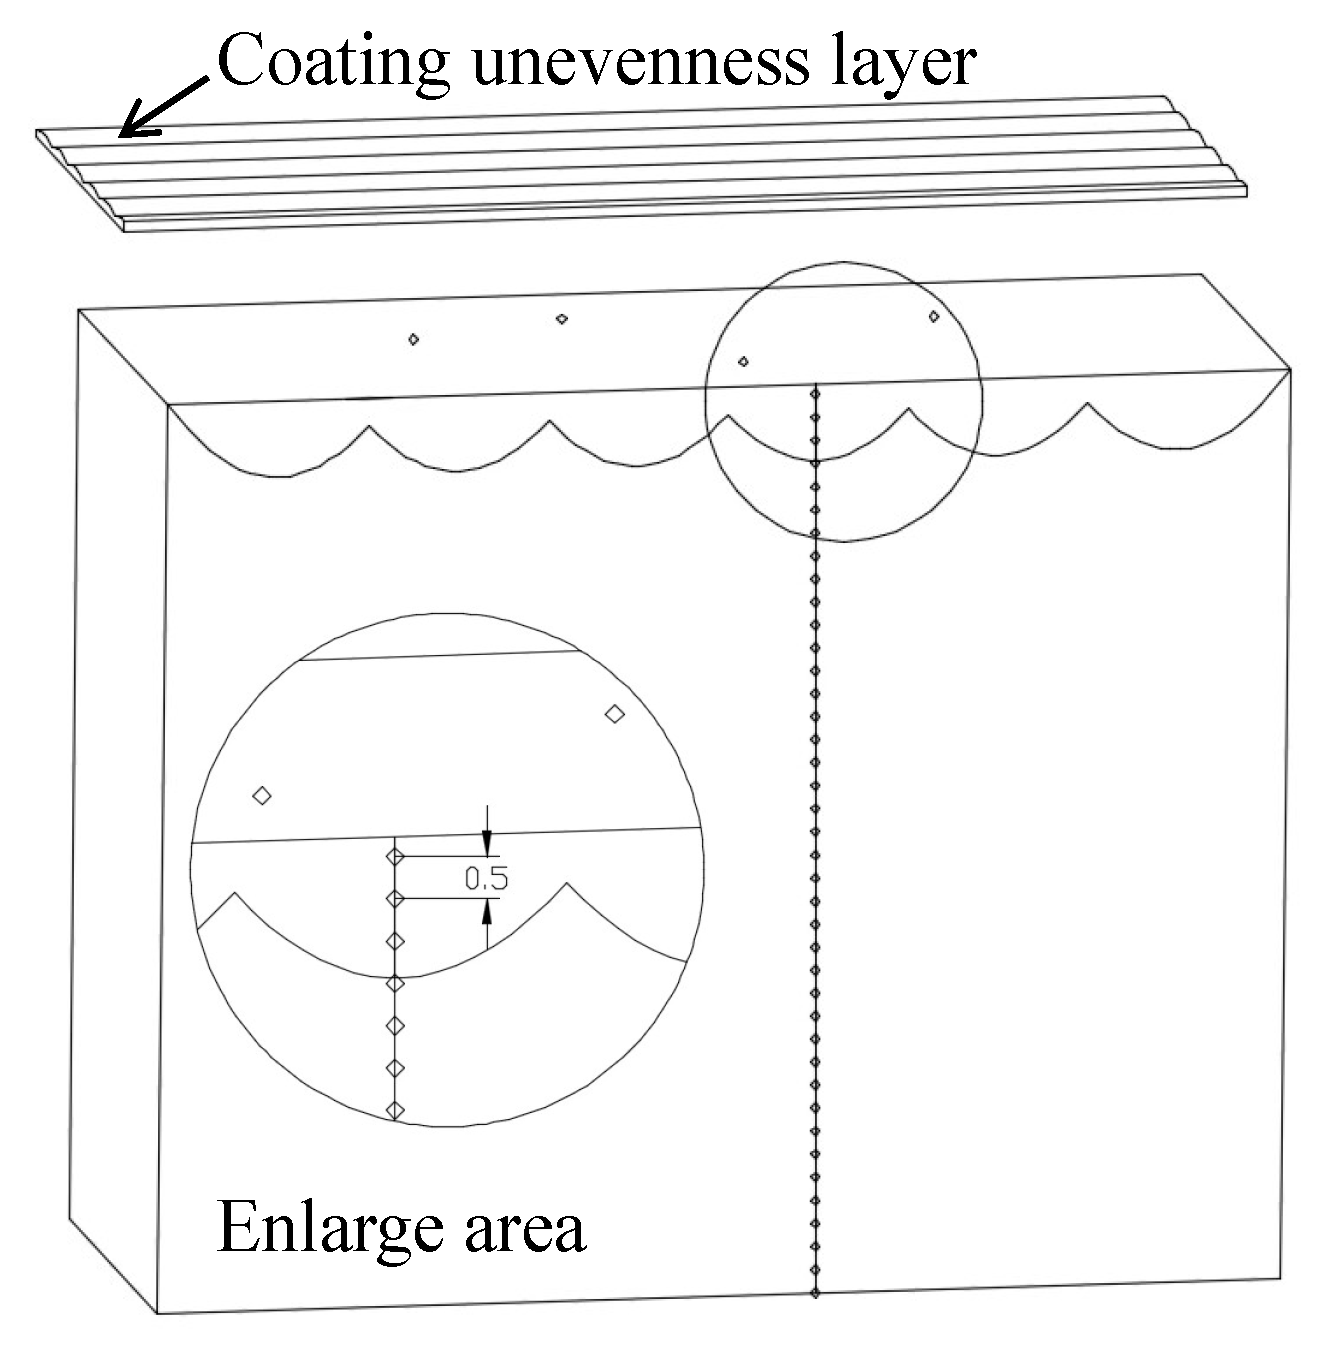
2.3. Coating Forming Quality and Residual Stress
2.4. Microstructure and Phase Composition
2.5. Microhardness and Wear Resistance Testing Method
3. Results and Discussion
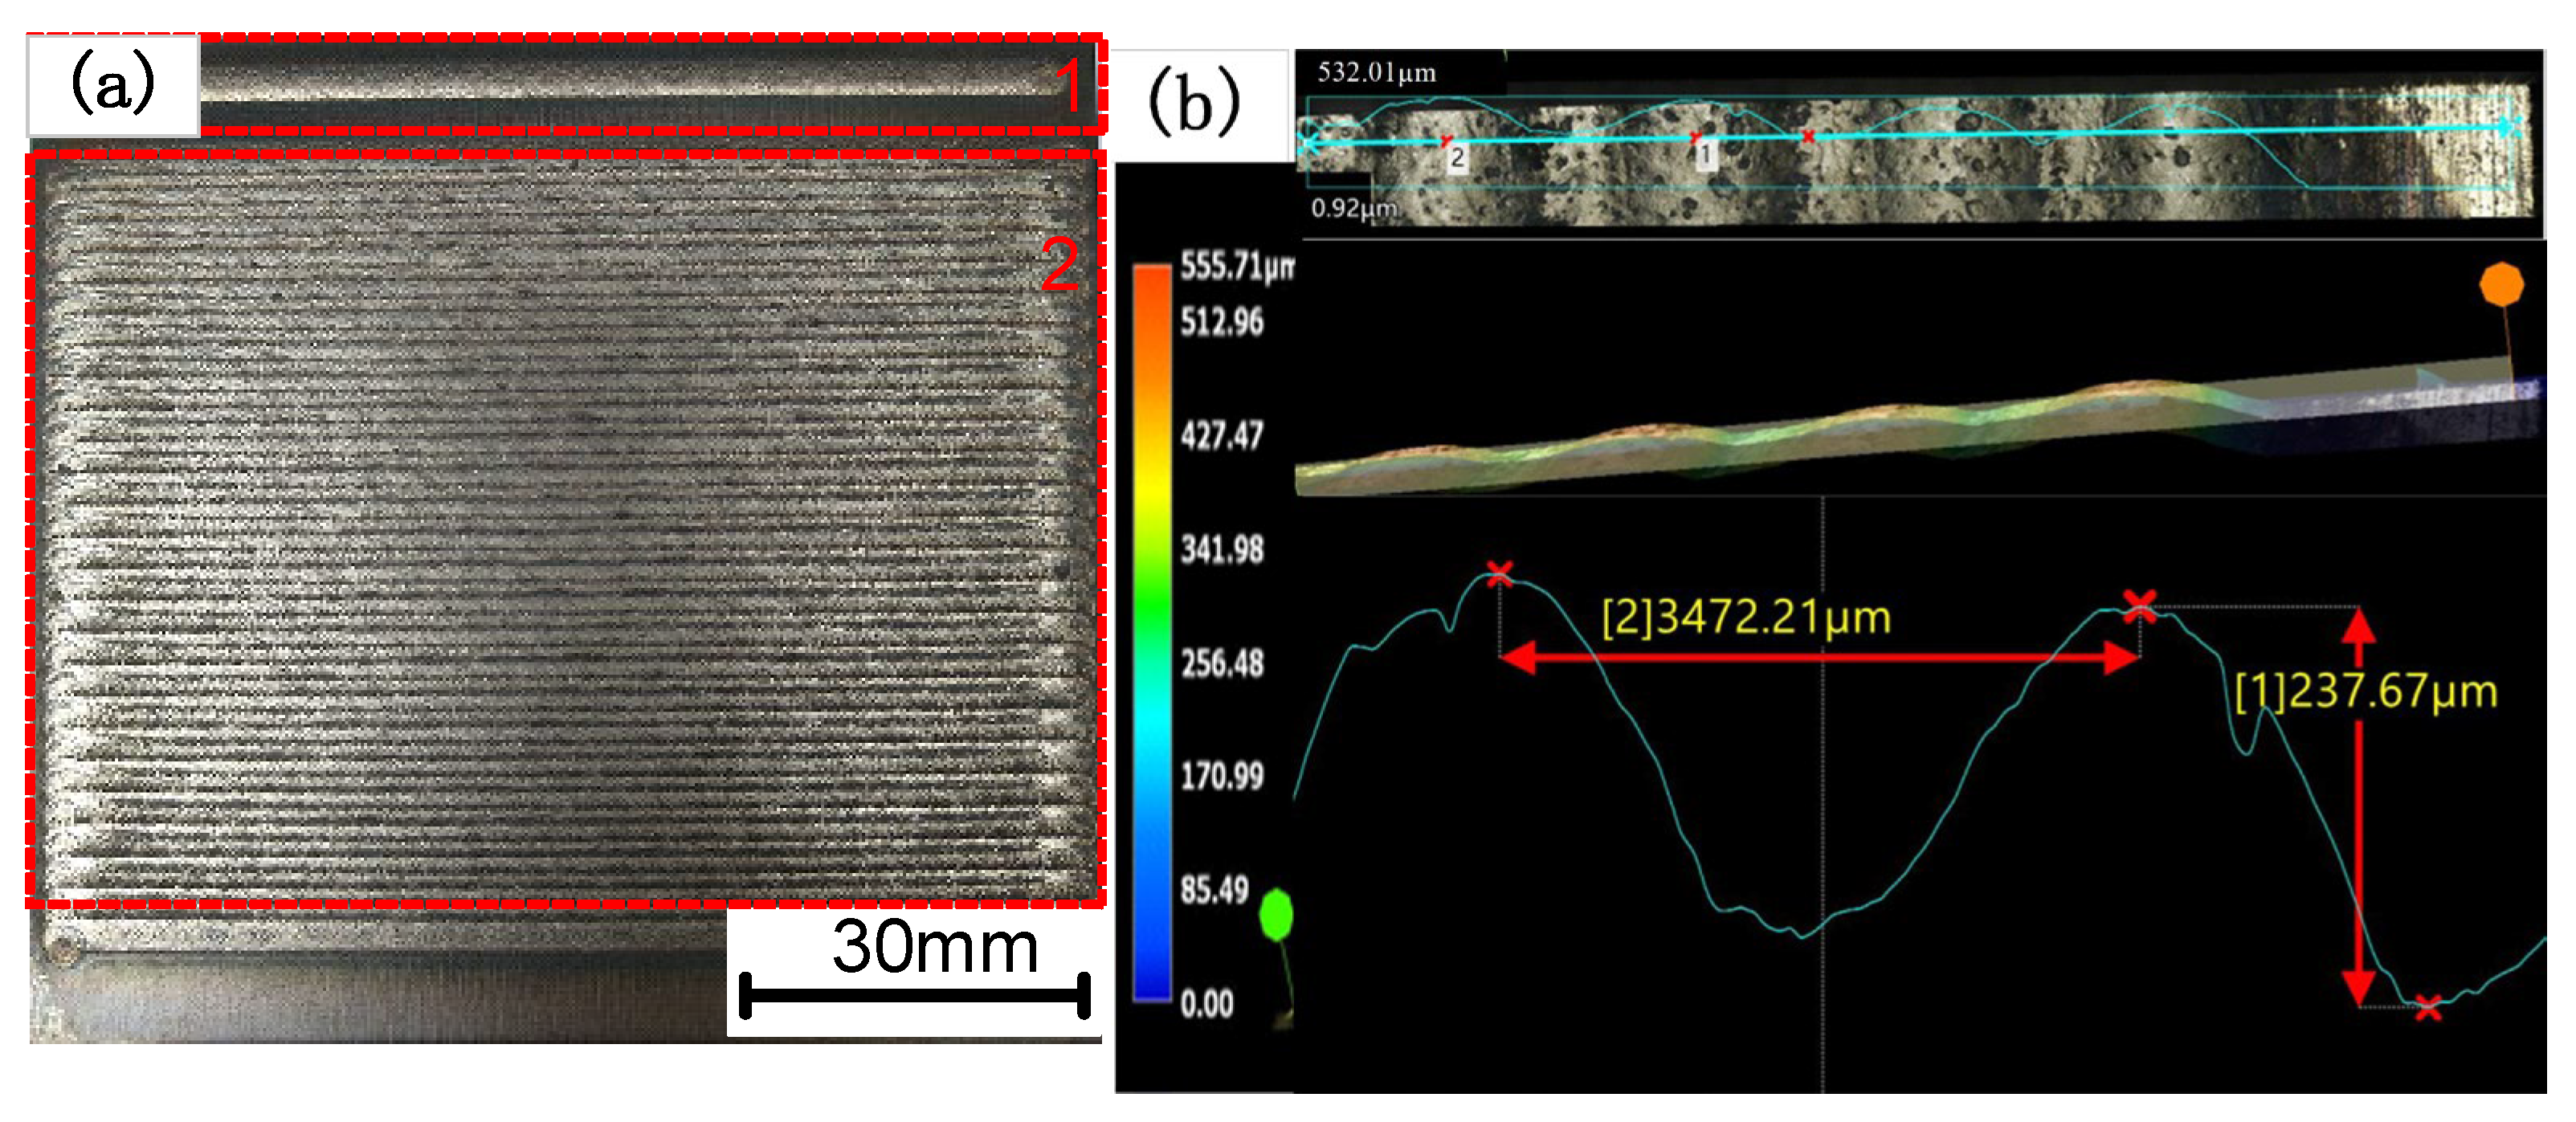
3.1. Surface Topography and Residual Stress of the Coating
3.2. Coating Microstructure
3.3. Microhardness and Wear Resistance
4. Conclusions
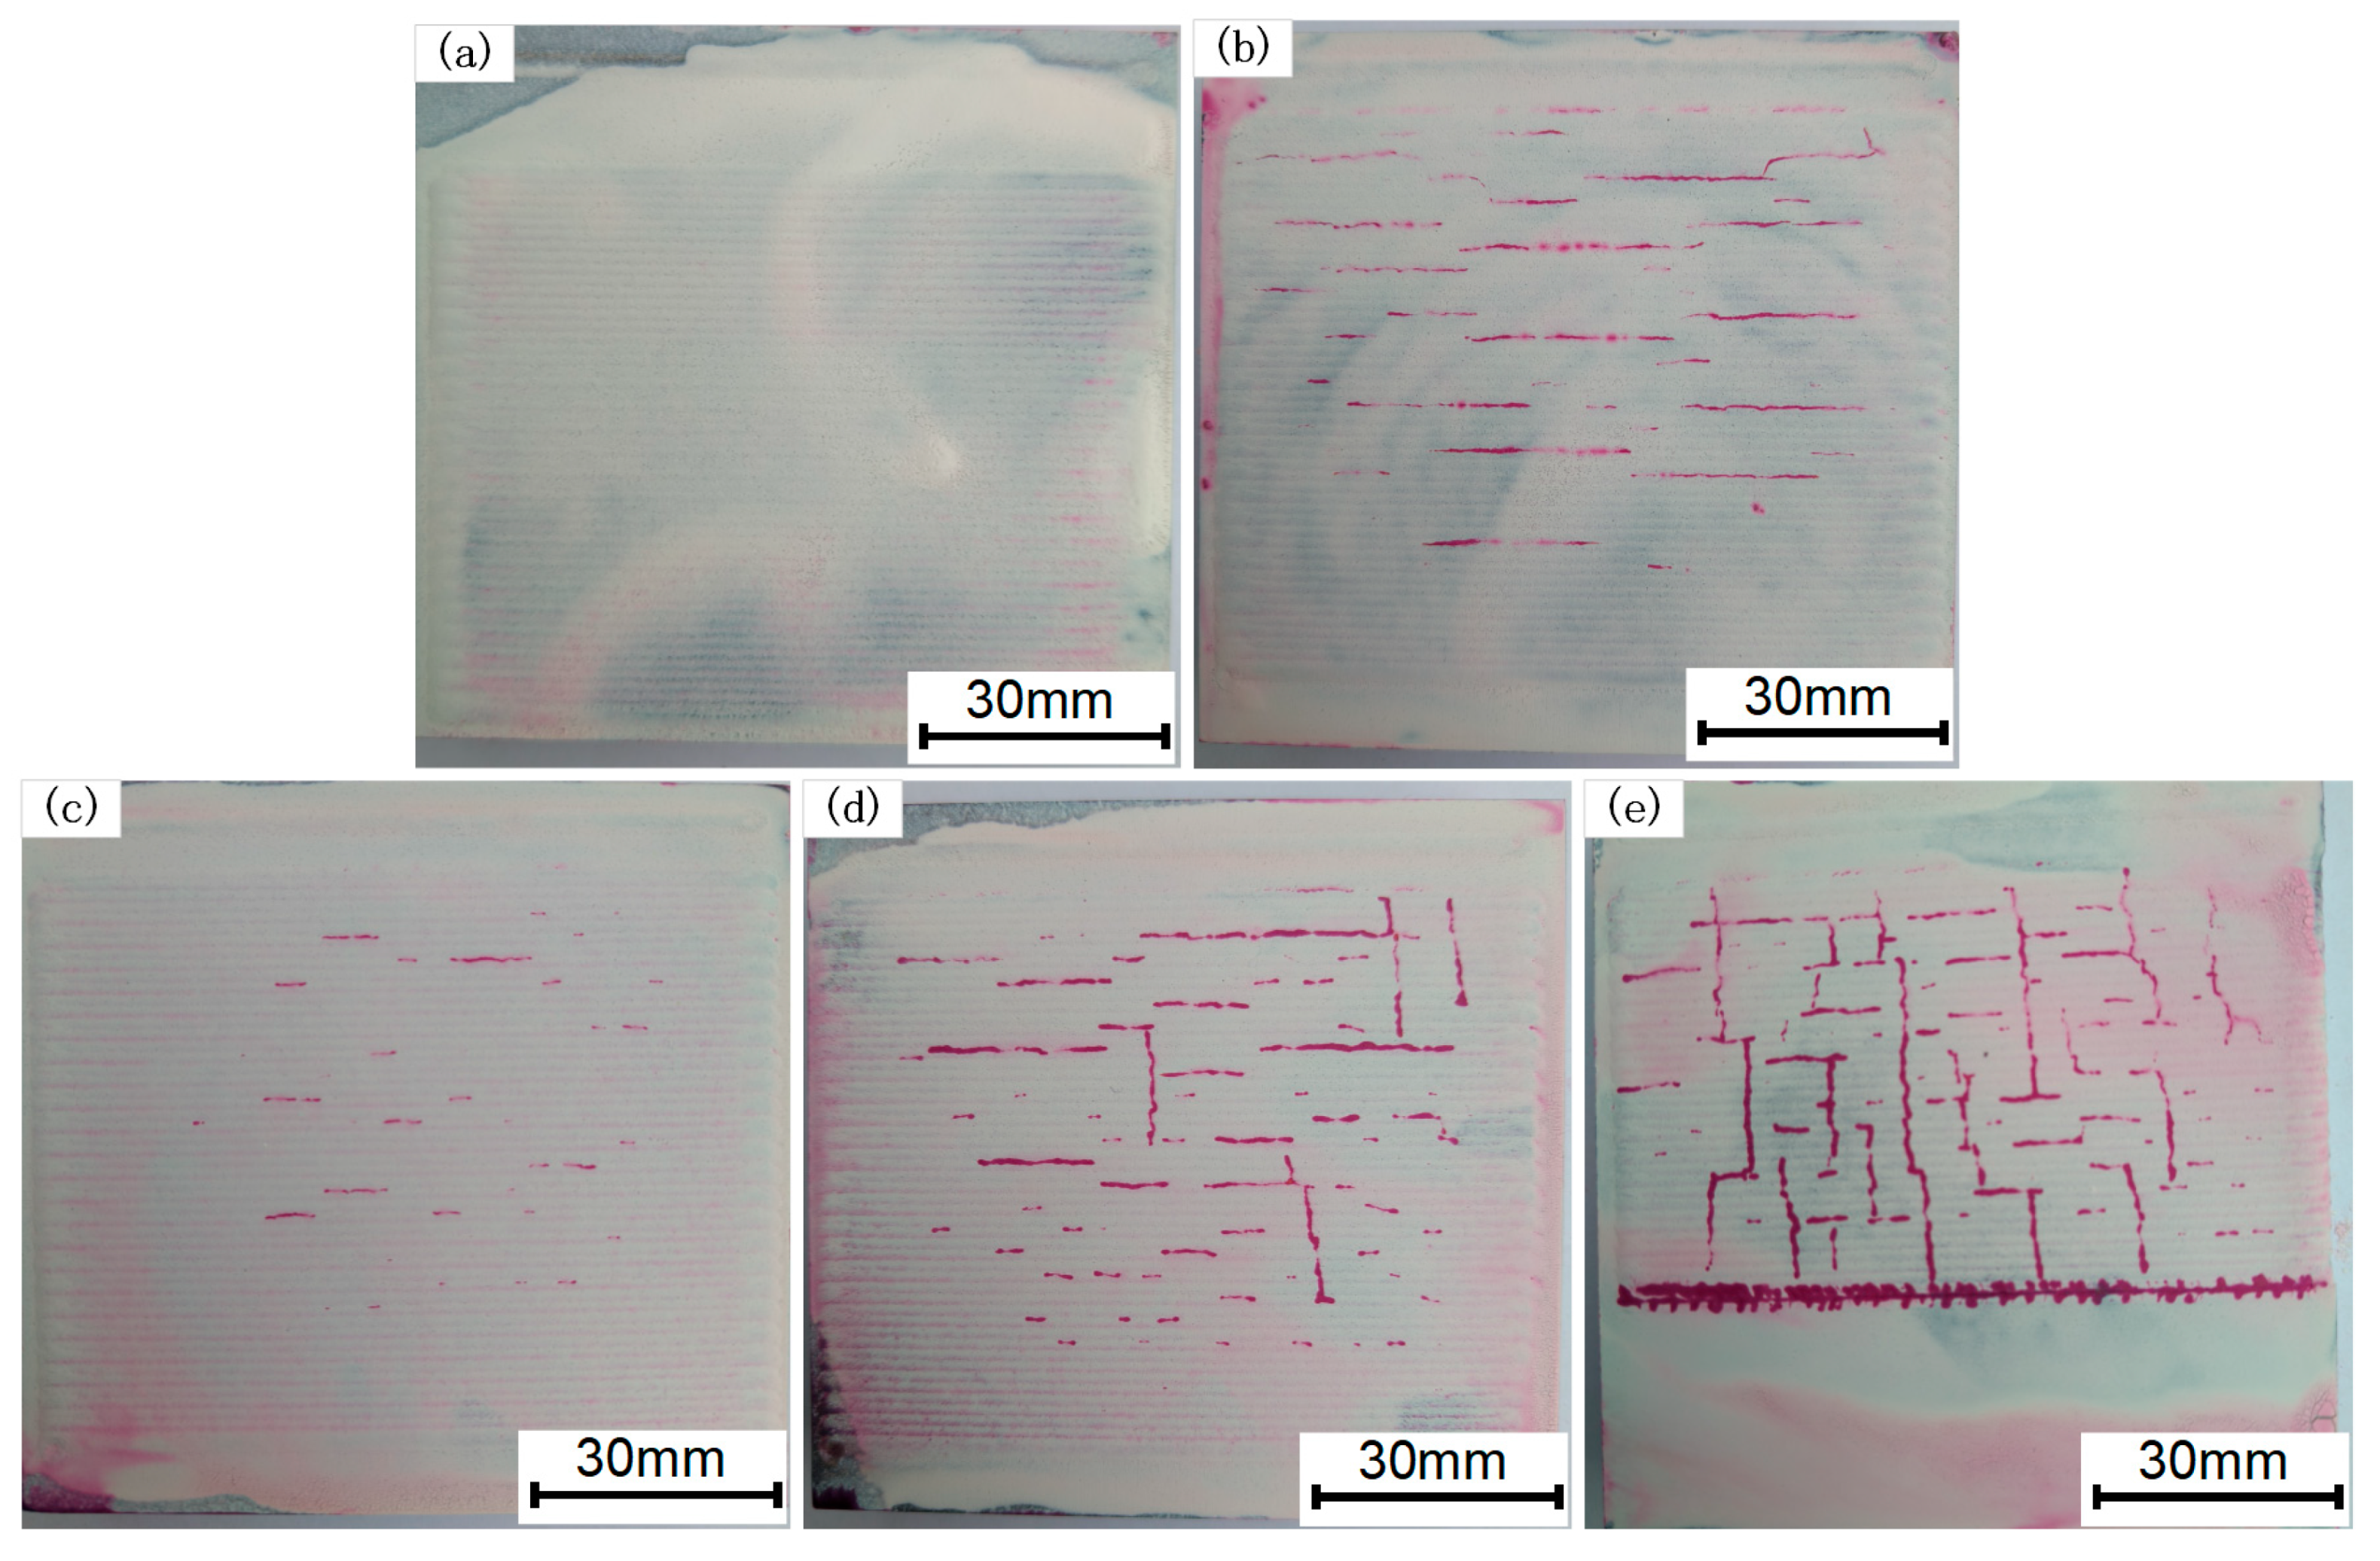
- (1)
- The residual stress and crack area on the coating surface increase as the Cr3C2 mass ratio in the coating rises. When the Cr3C2 powder mass percentage is less than 35%, the coating exhibits fewer surface cracks, presenting primarily short and fine parallel cracks at overlapping boundaries. When the Cr3C2 content exceeds 45%, the surface crack area expands and the cracks form a vertical and parallel cross pattern.
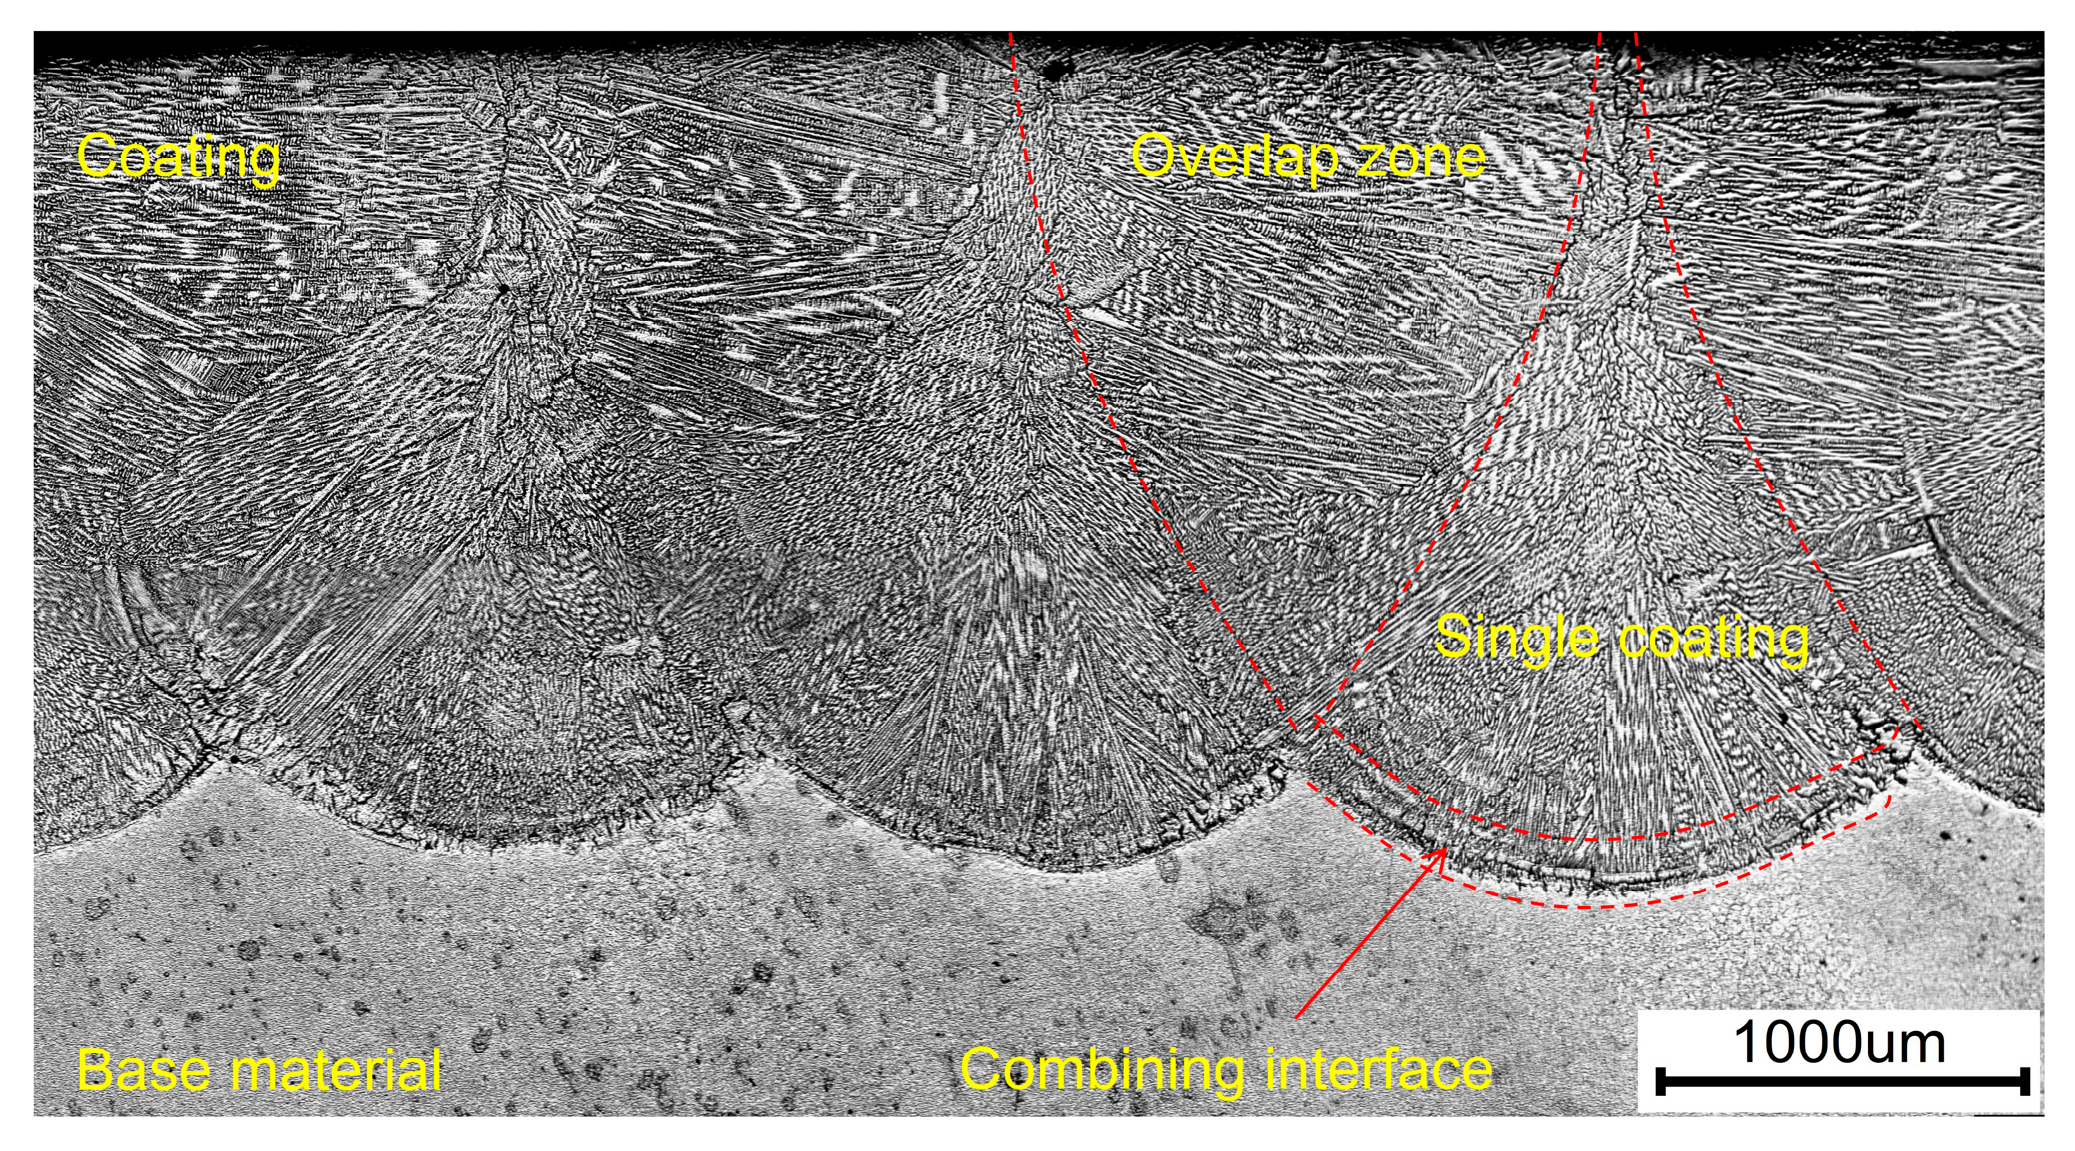
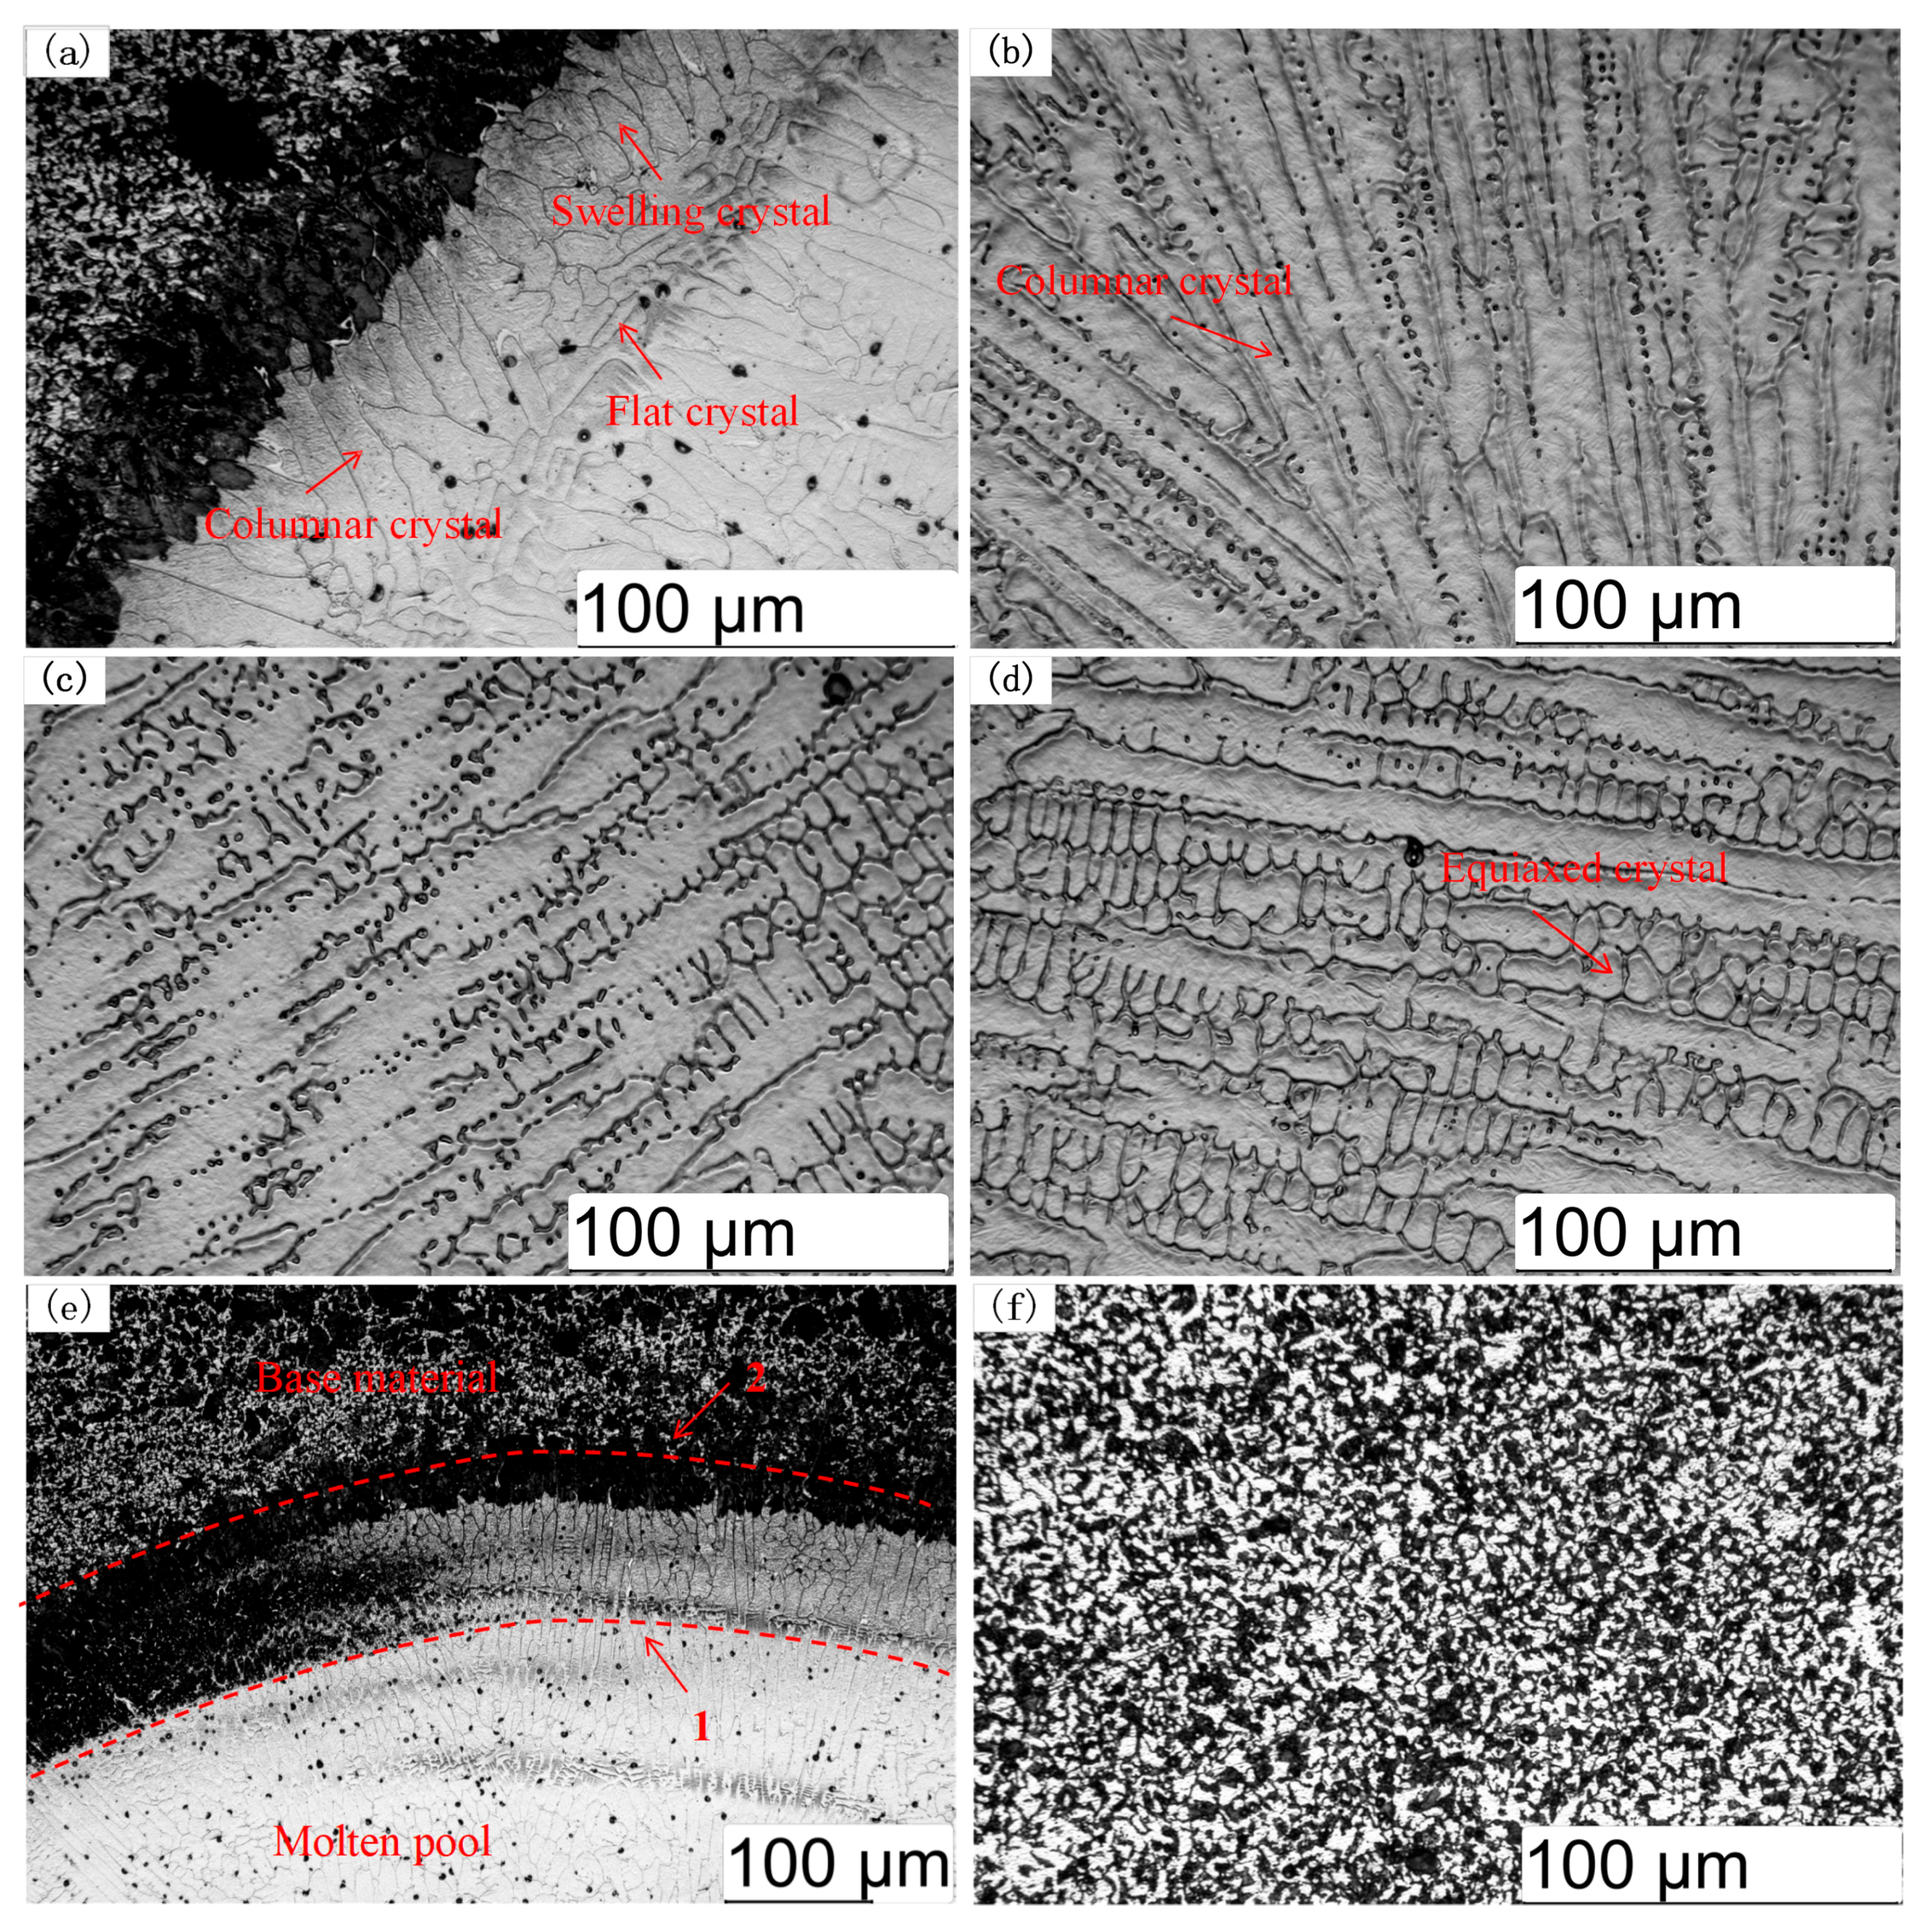
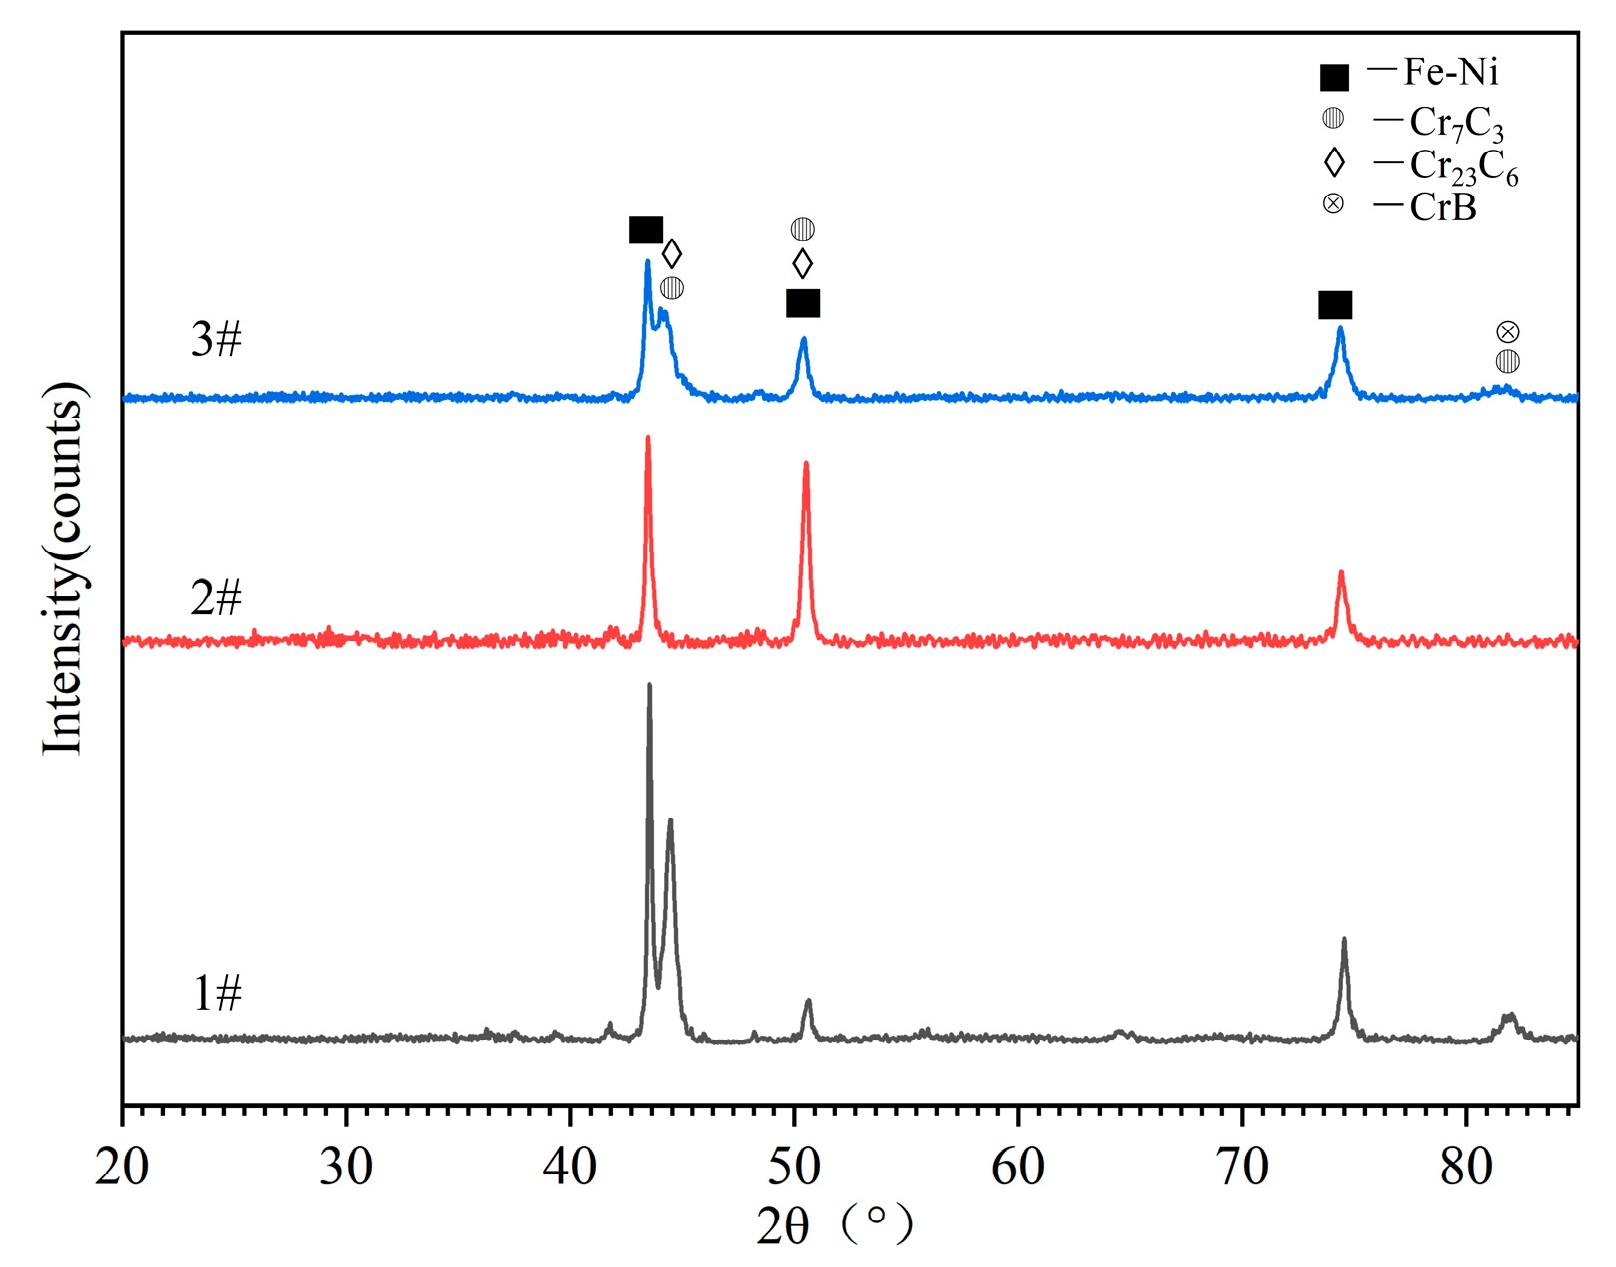
- (2)
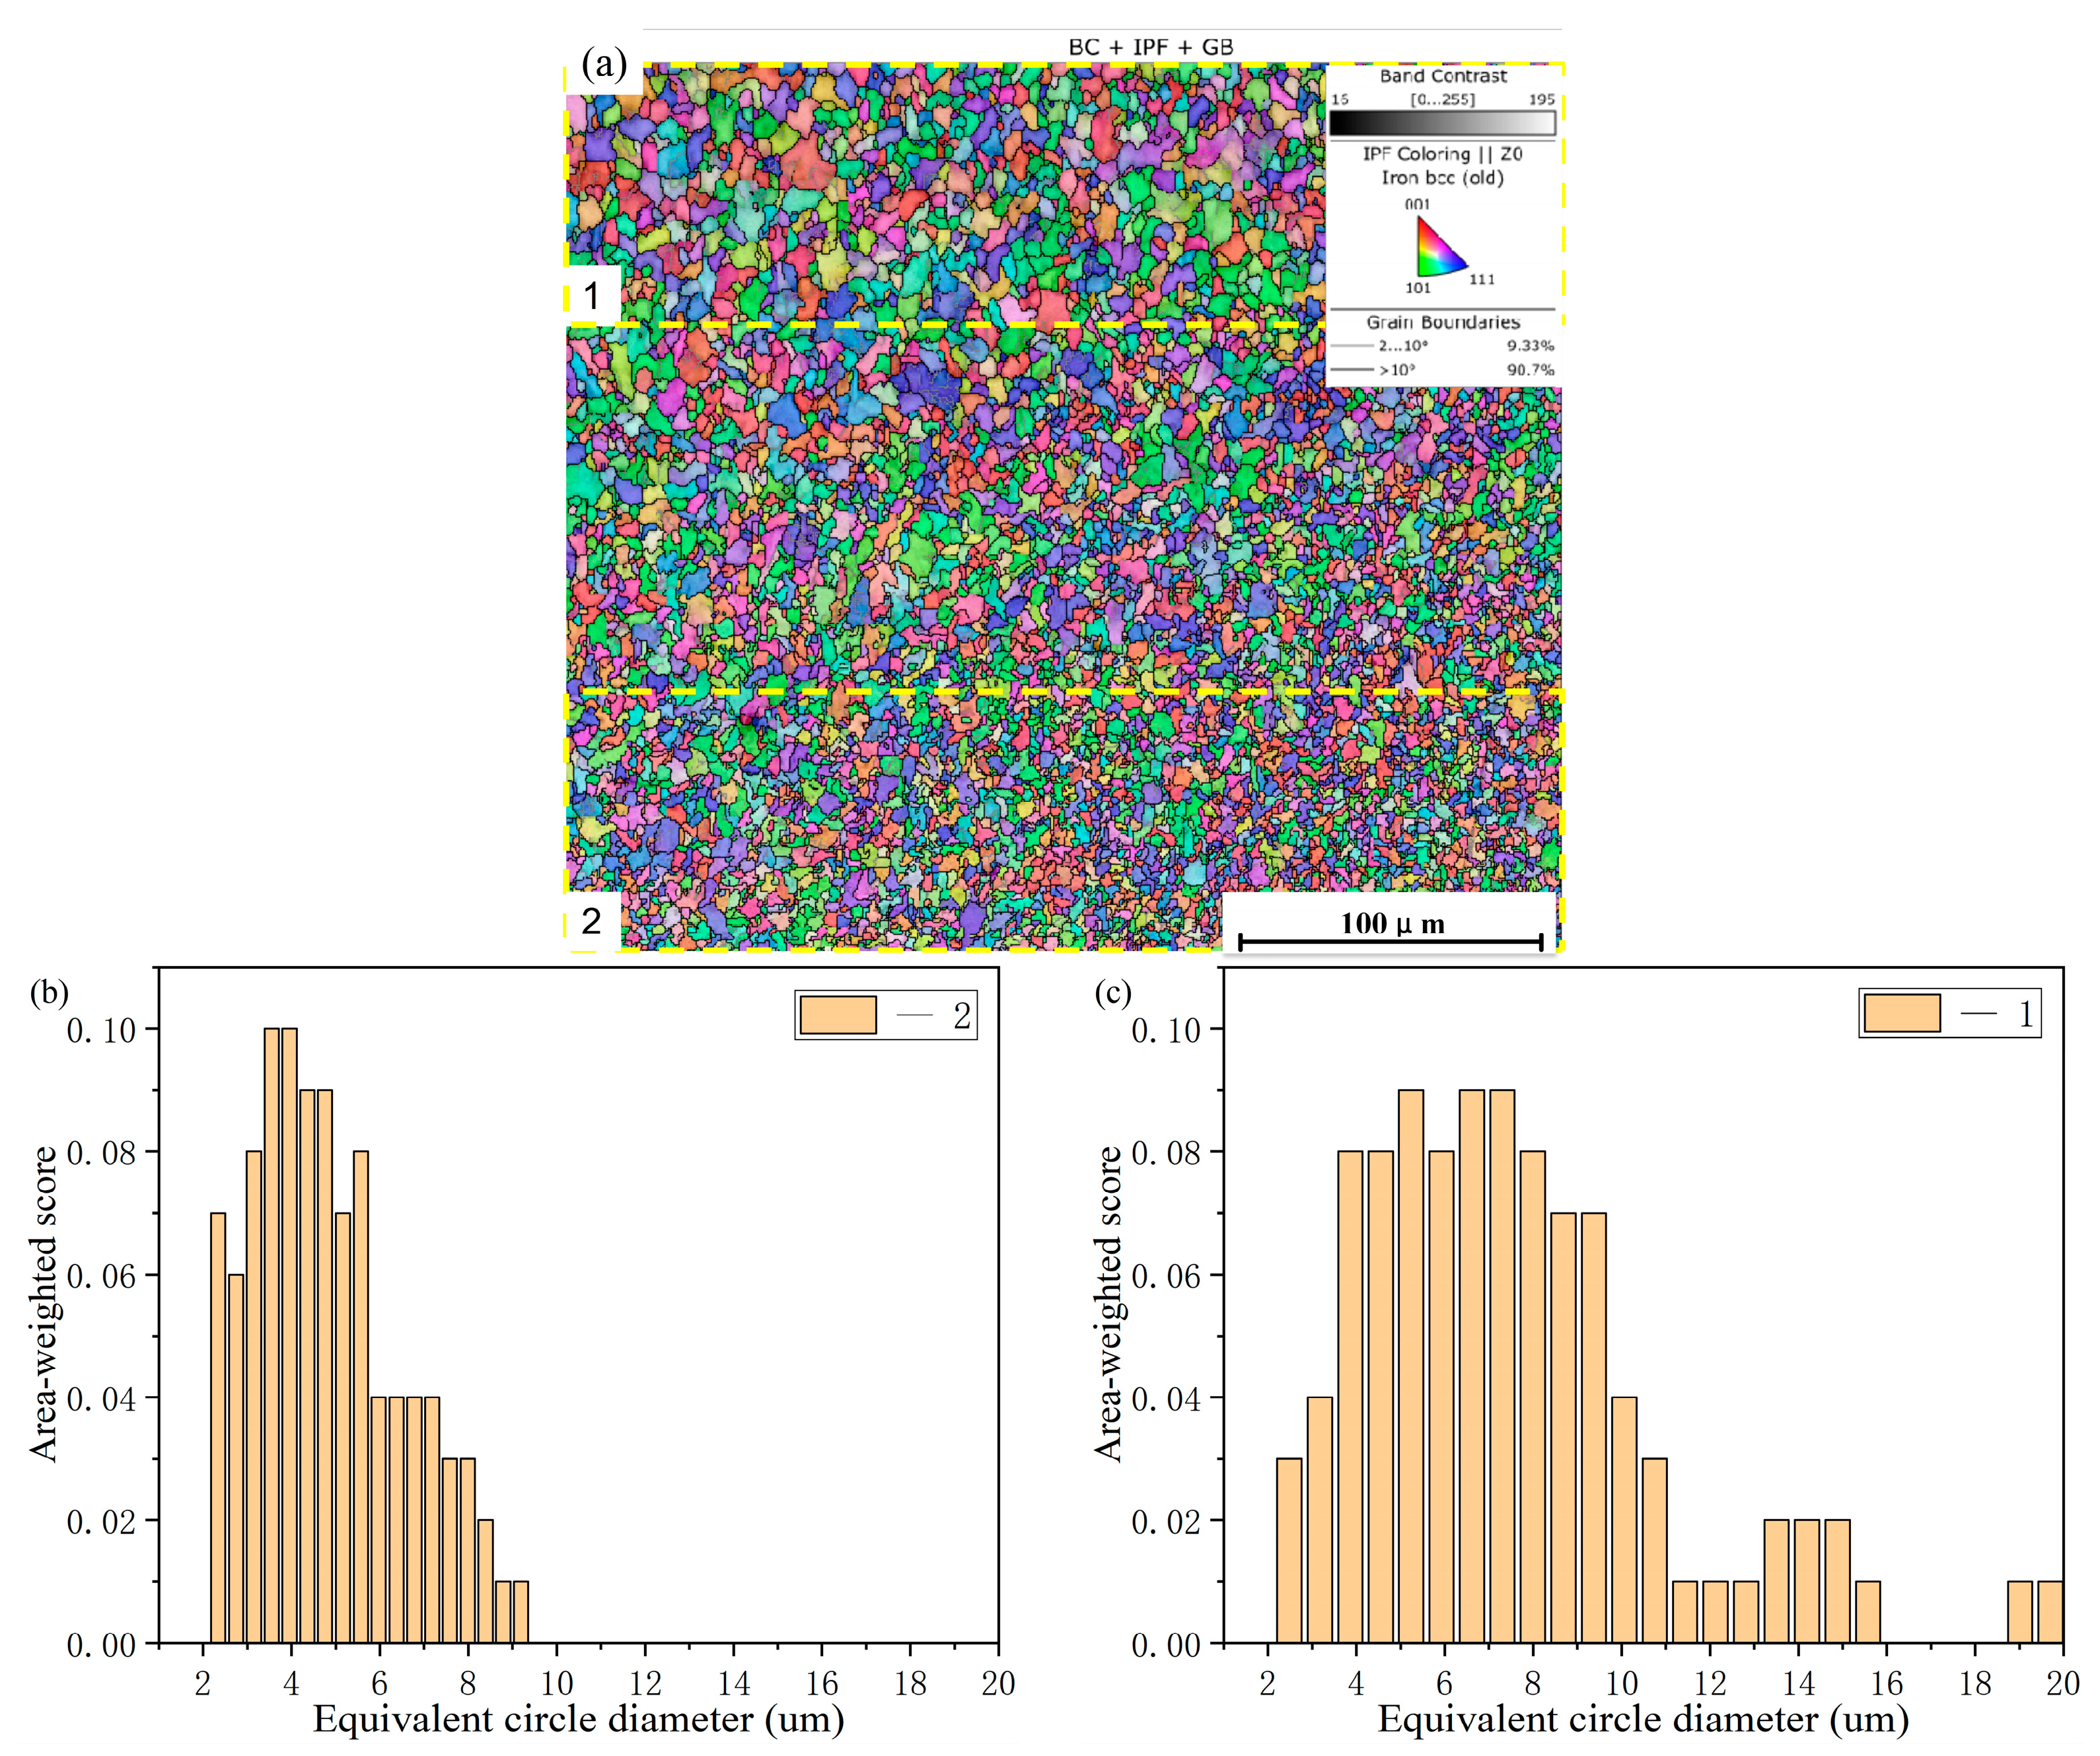
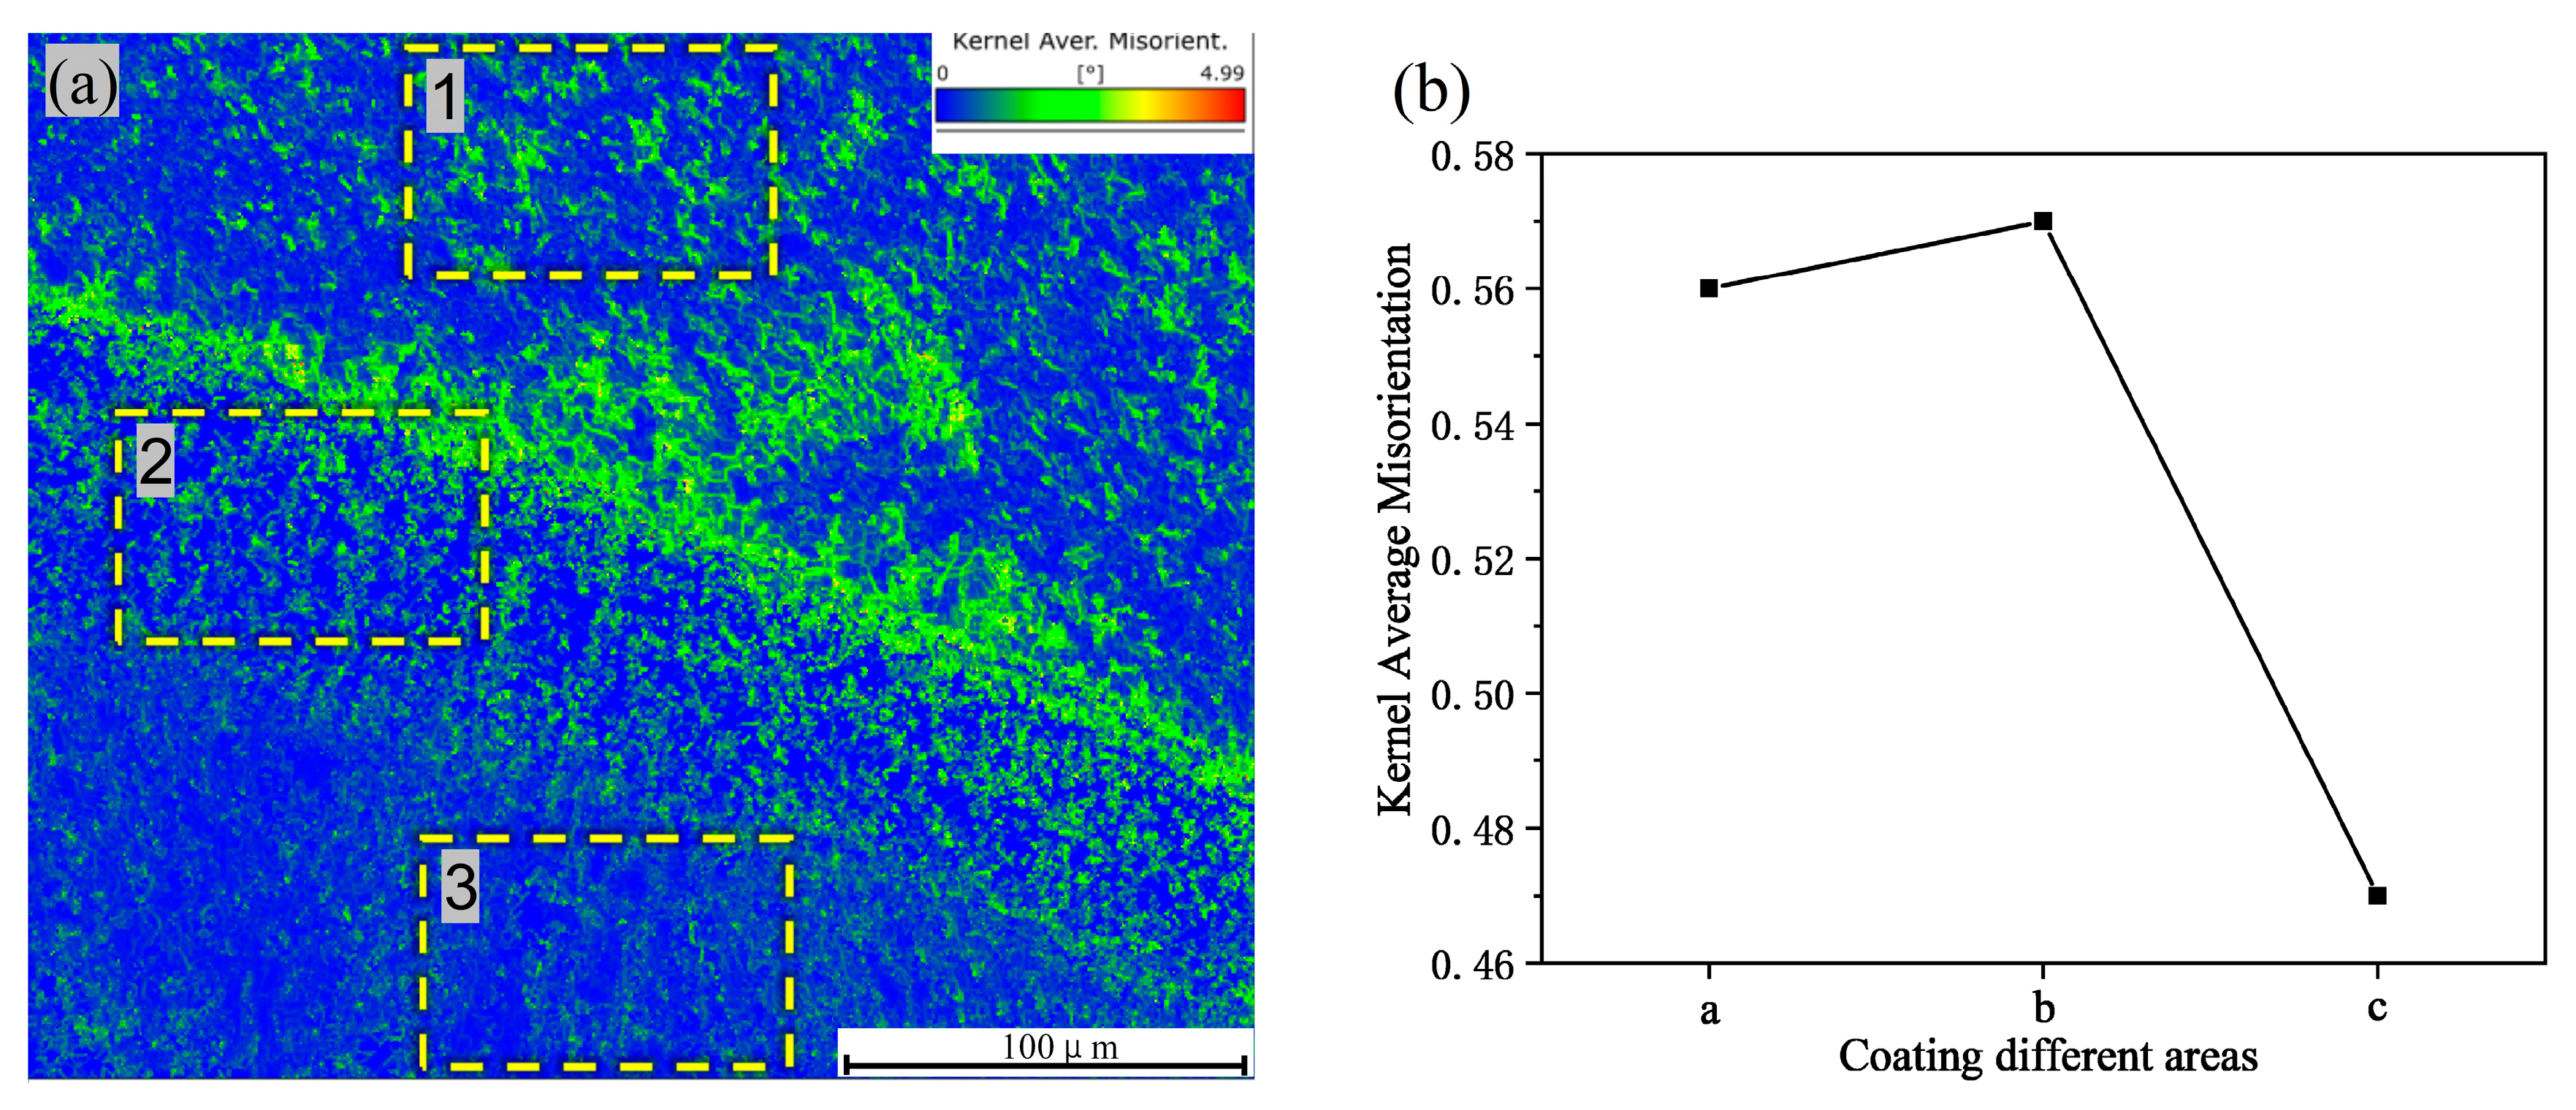
- The cross-sectional microstructure of the laser cladded Cr3C2/Ni60A multi-channel coating was examined. As the molten alloy interacts with the substrate, the process aligns with the theory of rapid solidification of liquid metal. Moving from the solid–liquid interface toward the top of the coating, coarse columnar crystals, dendrites, and equiaxed crystals appear in succession. Stress concentration is evident in the solid–liquid bonding area between the coating and the substrate, leading to a higher dislocation density and a concentration of deformed grains. The heat-affected zone (HAZ) of the 45 steel matrix undergoes noticeable recrystallization. The coating is primarily composed of Fe-Ni solid phases, Cr7C3 and Cr23C6. As the mass percentage of Cr3C2 in the Cr3C2/Ni60A composite powder increases, the precipitation of the reinforcing phases, Cr7C3 and Cr23C6, is suppressed.
- (3)
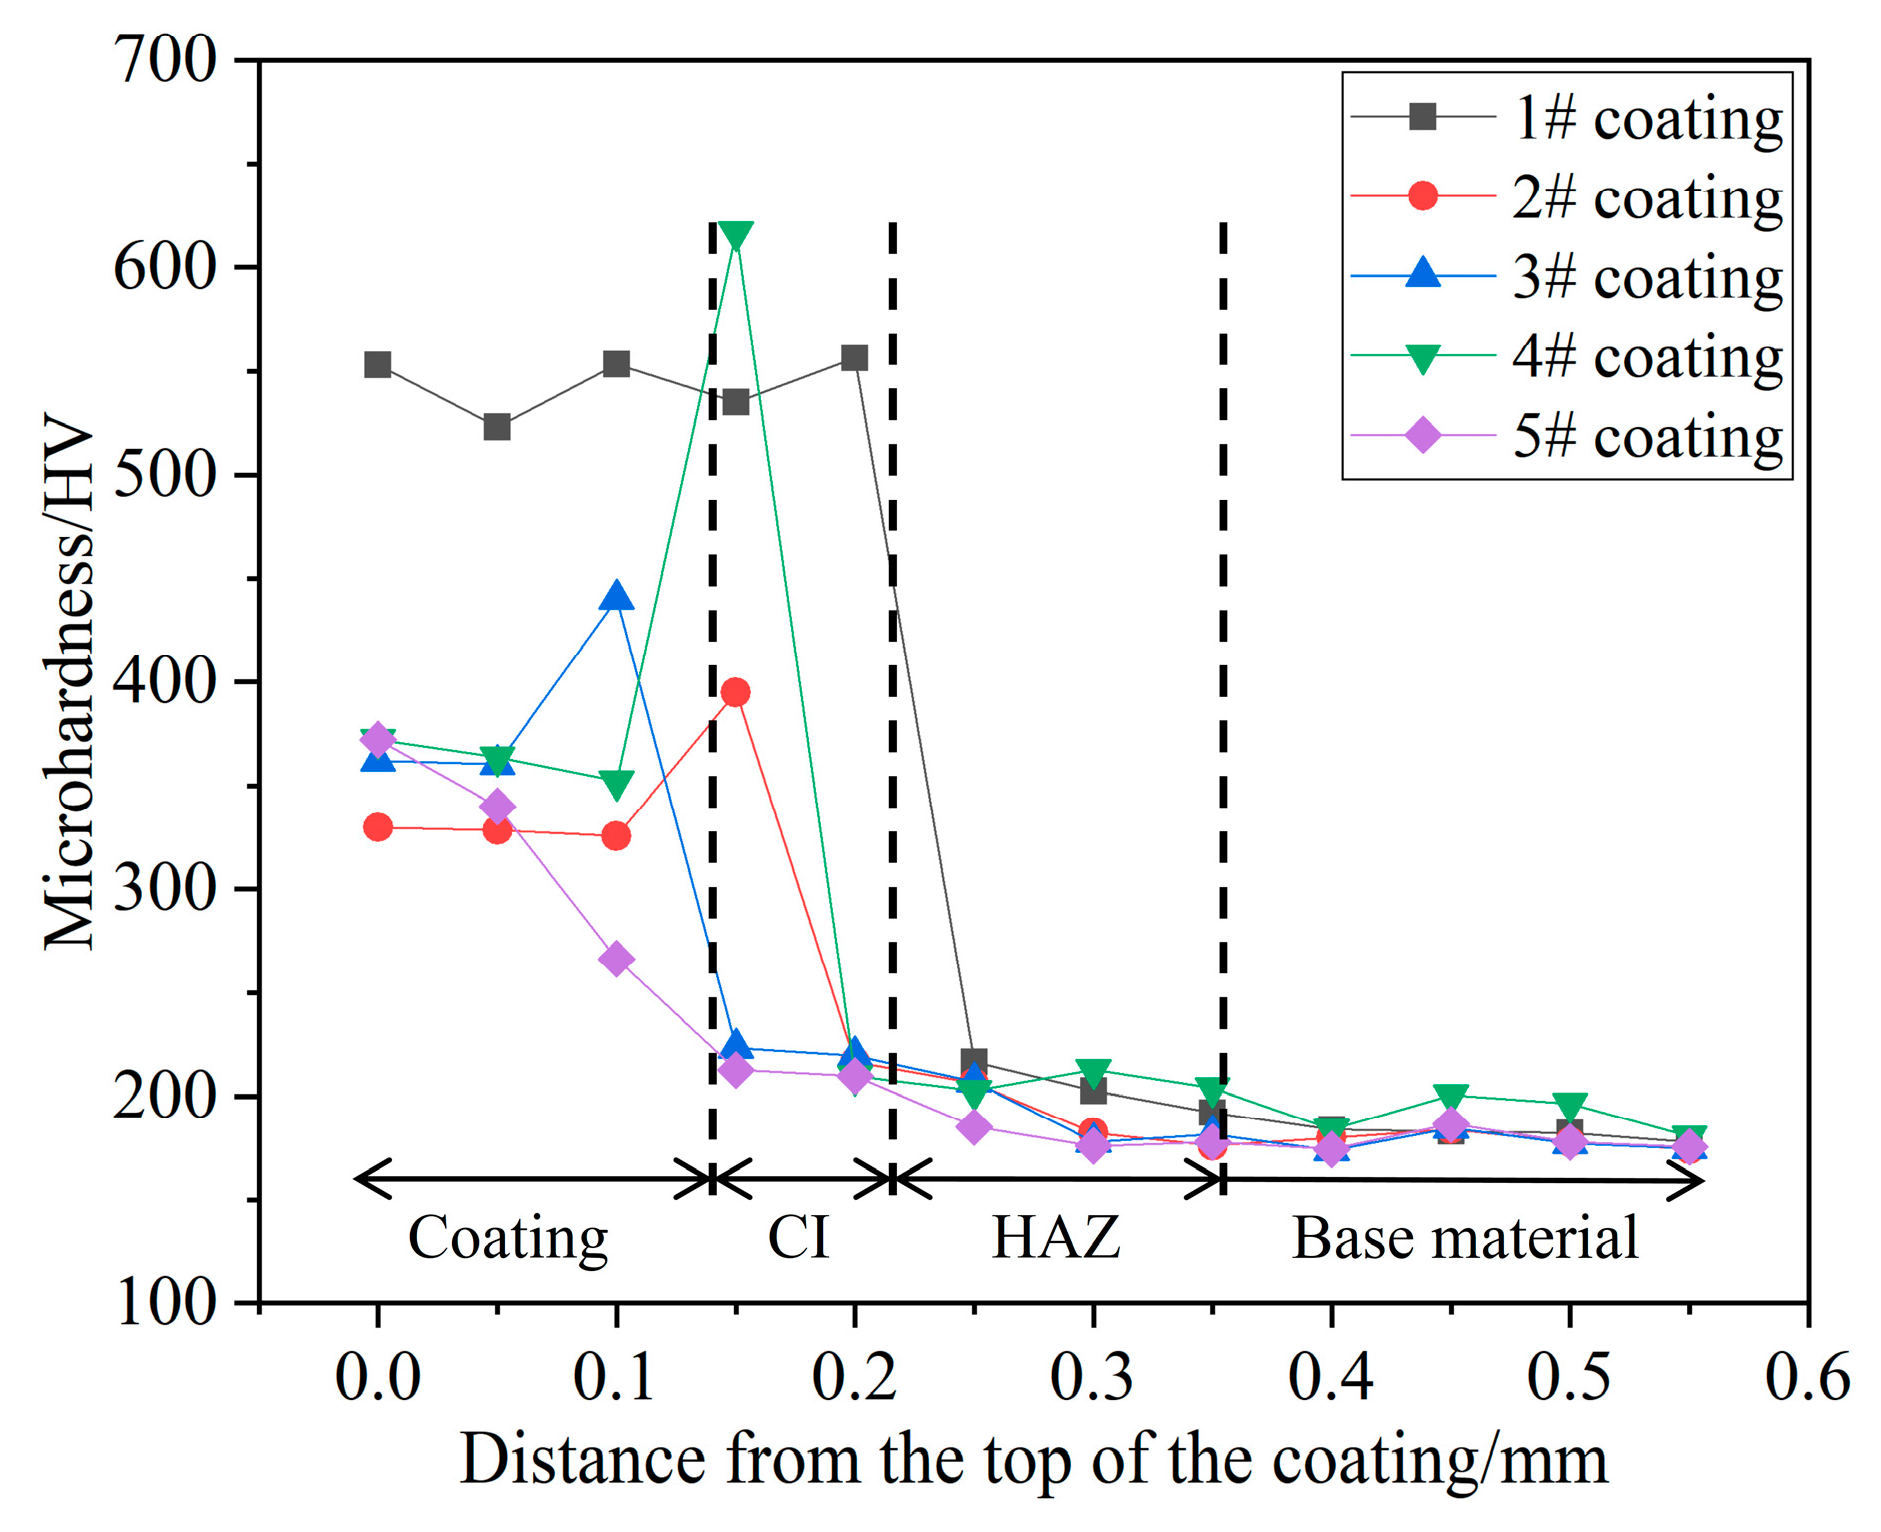
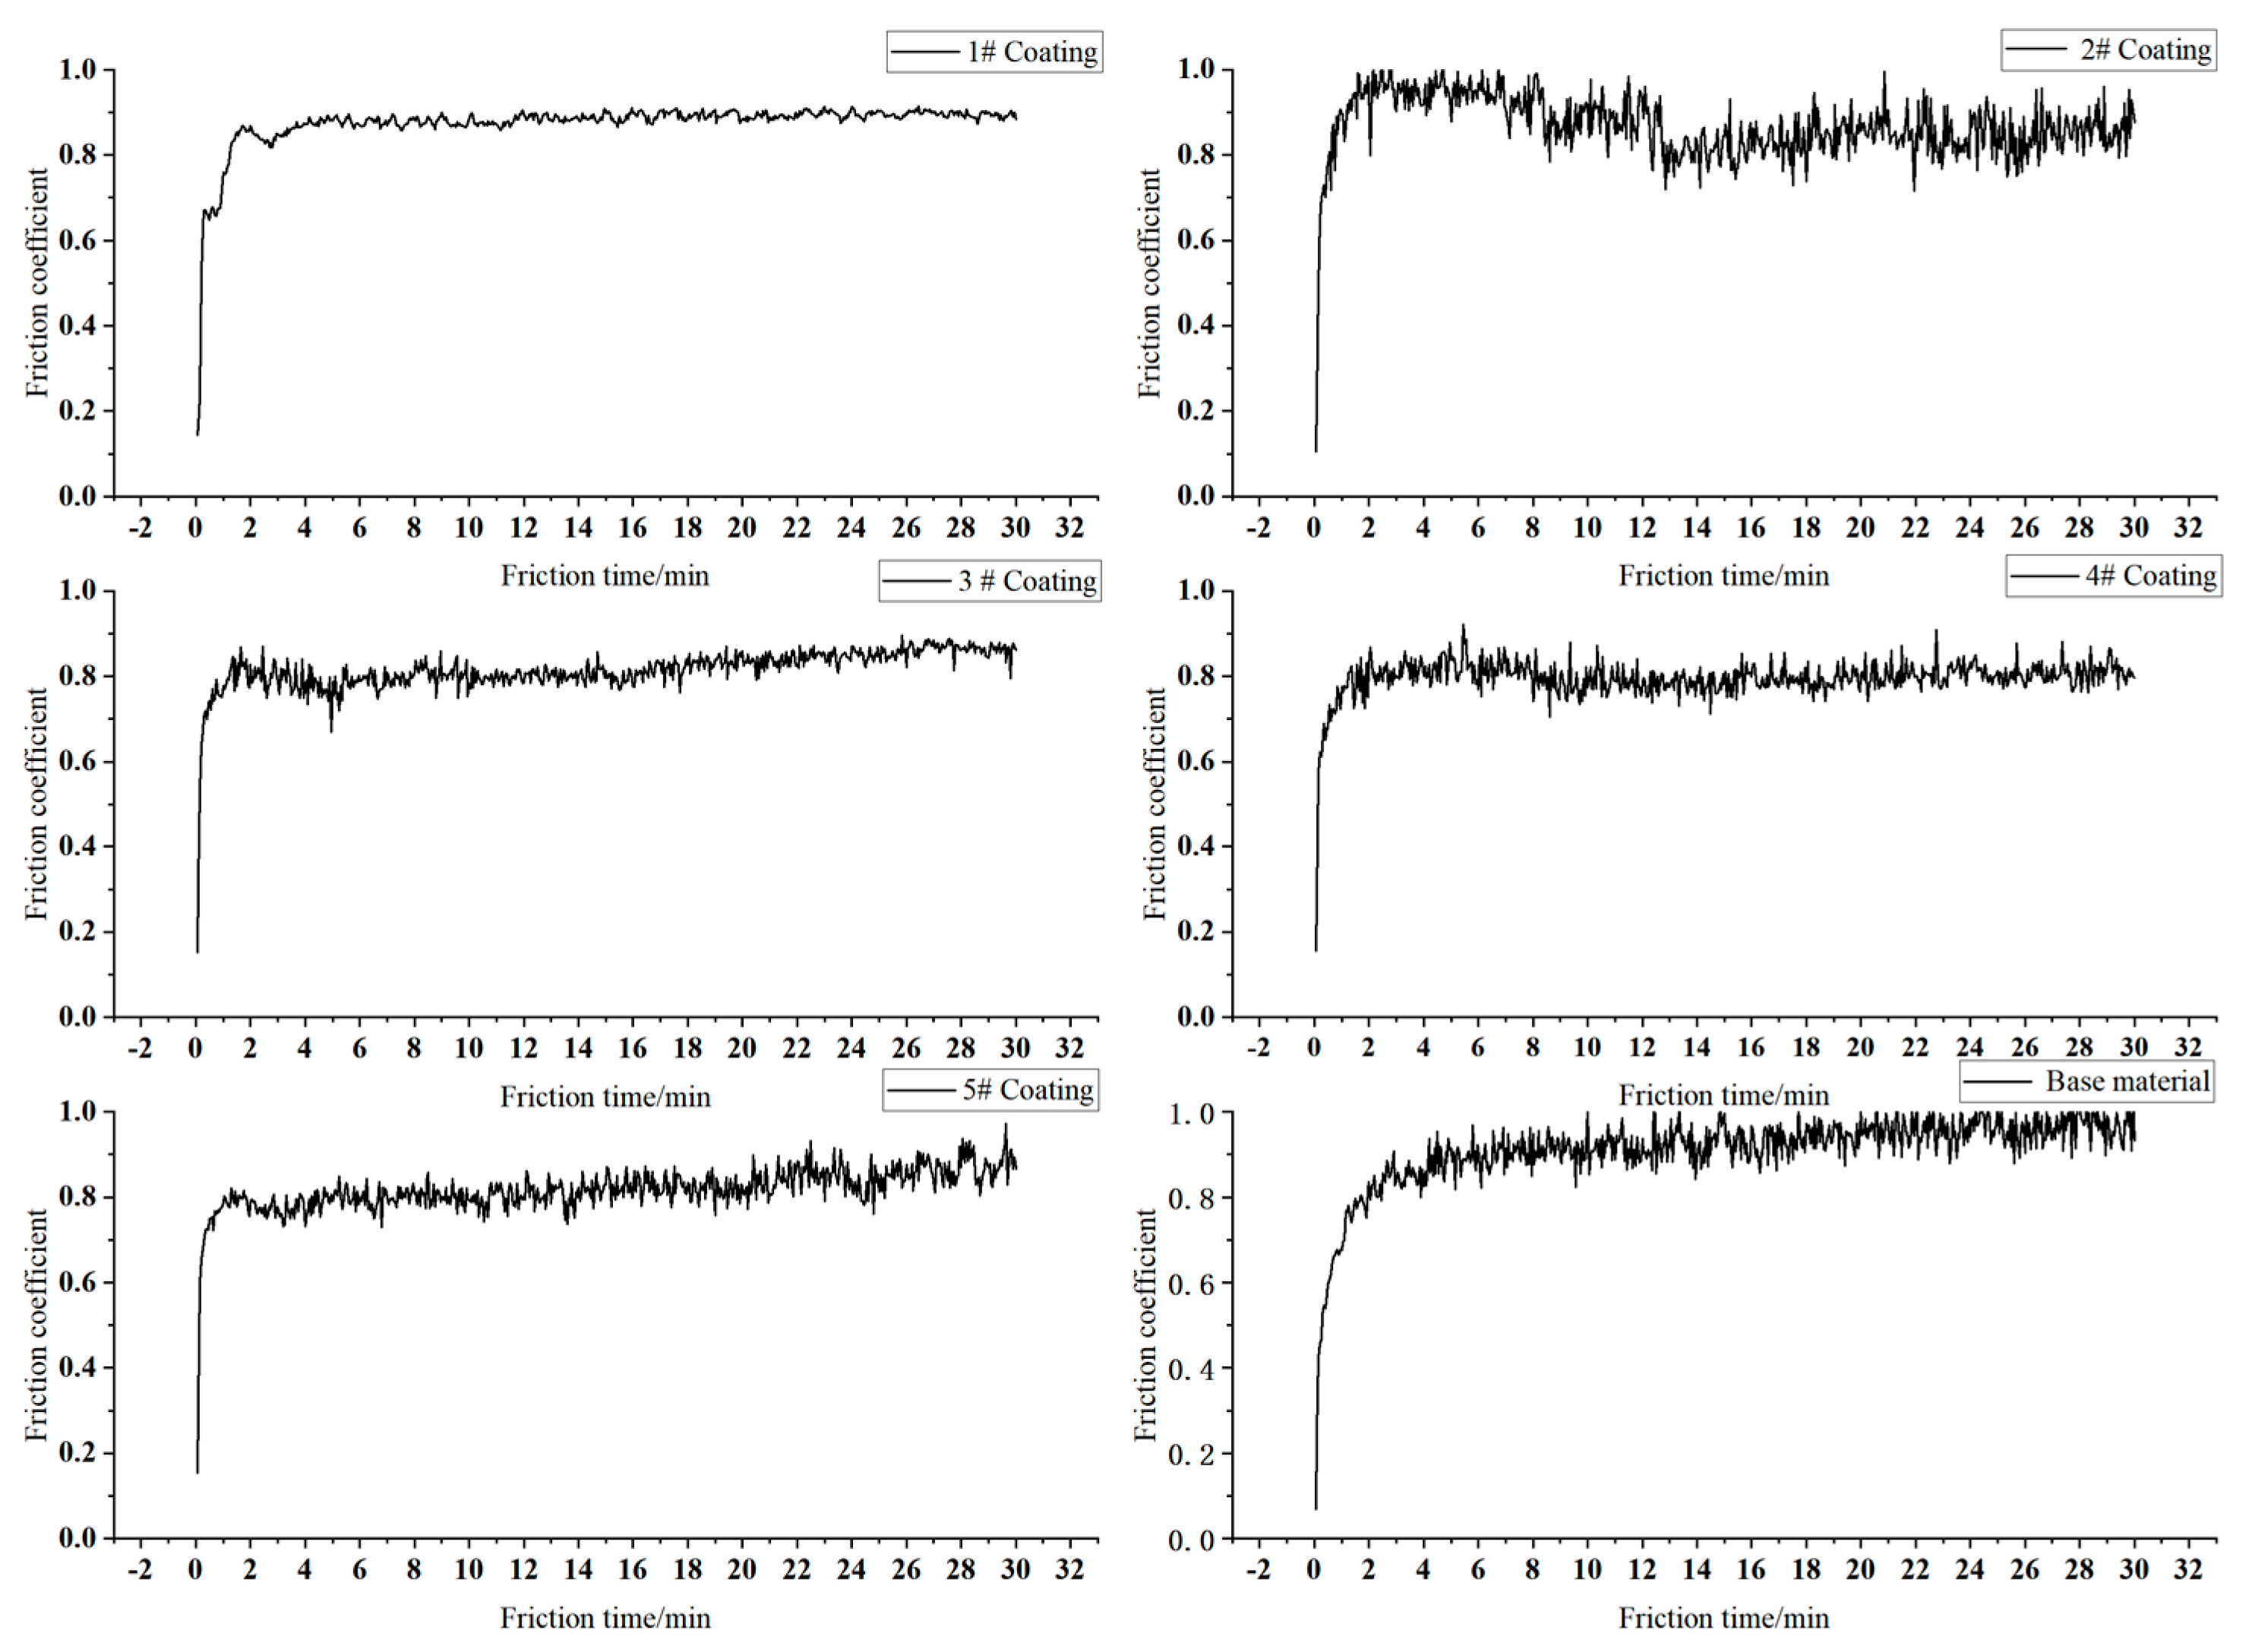
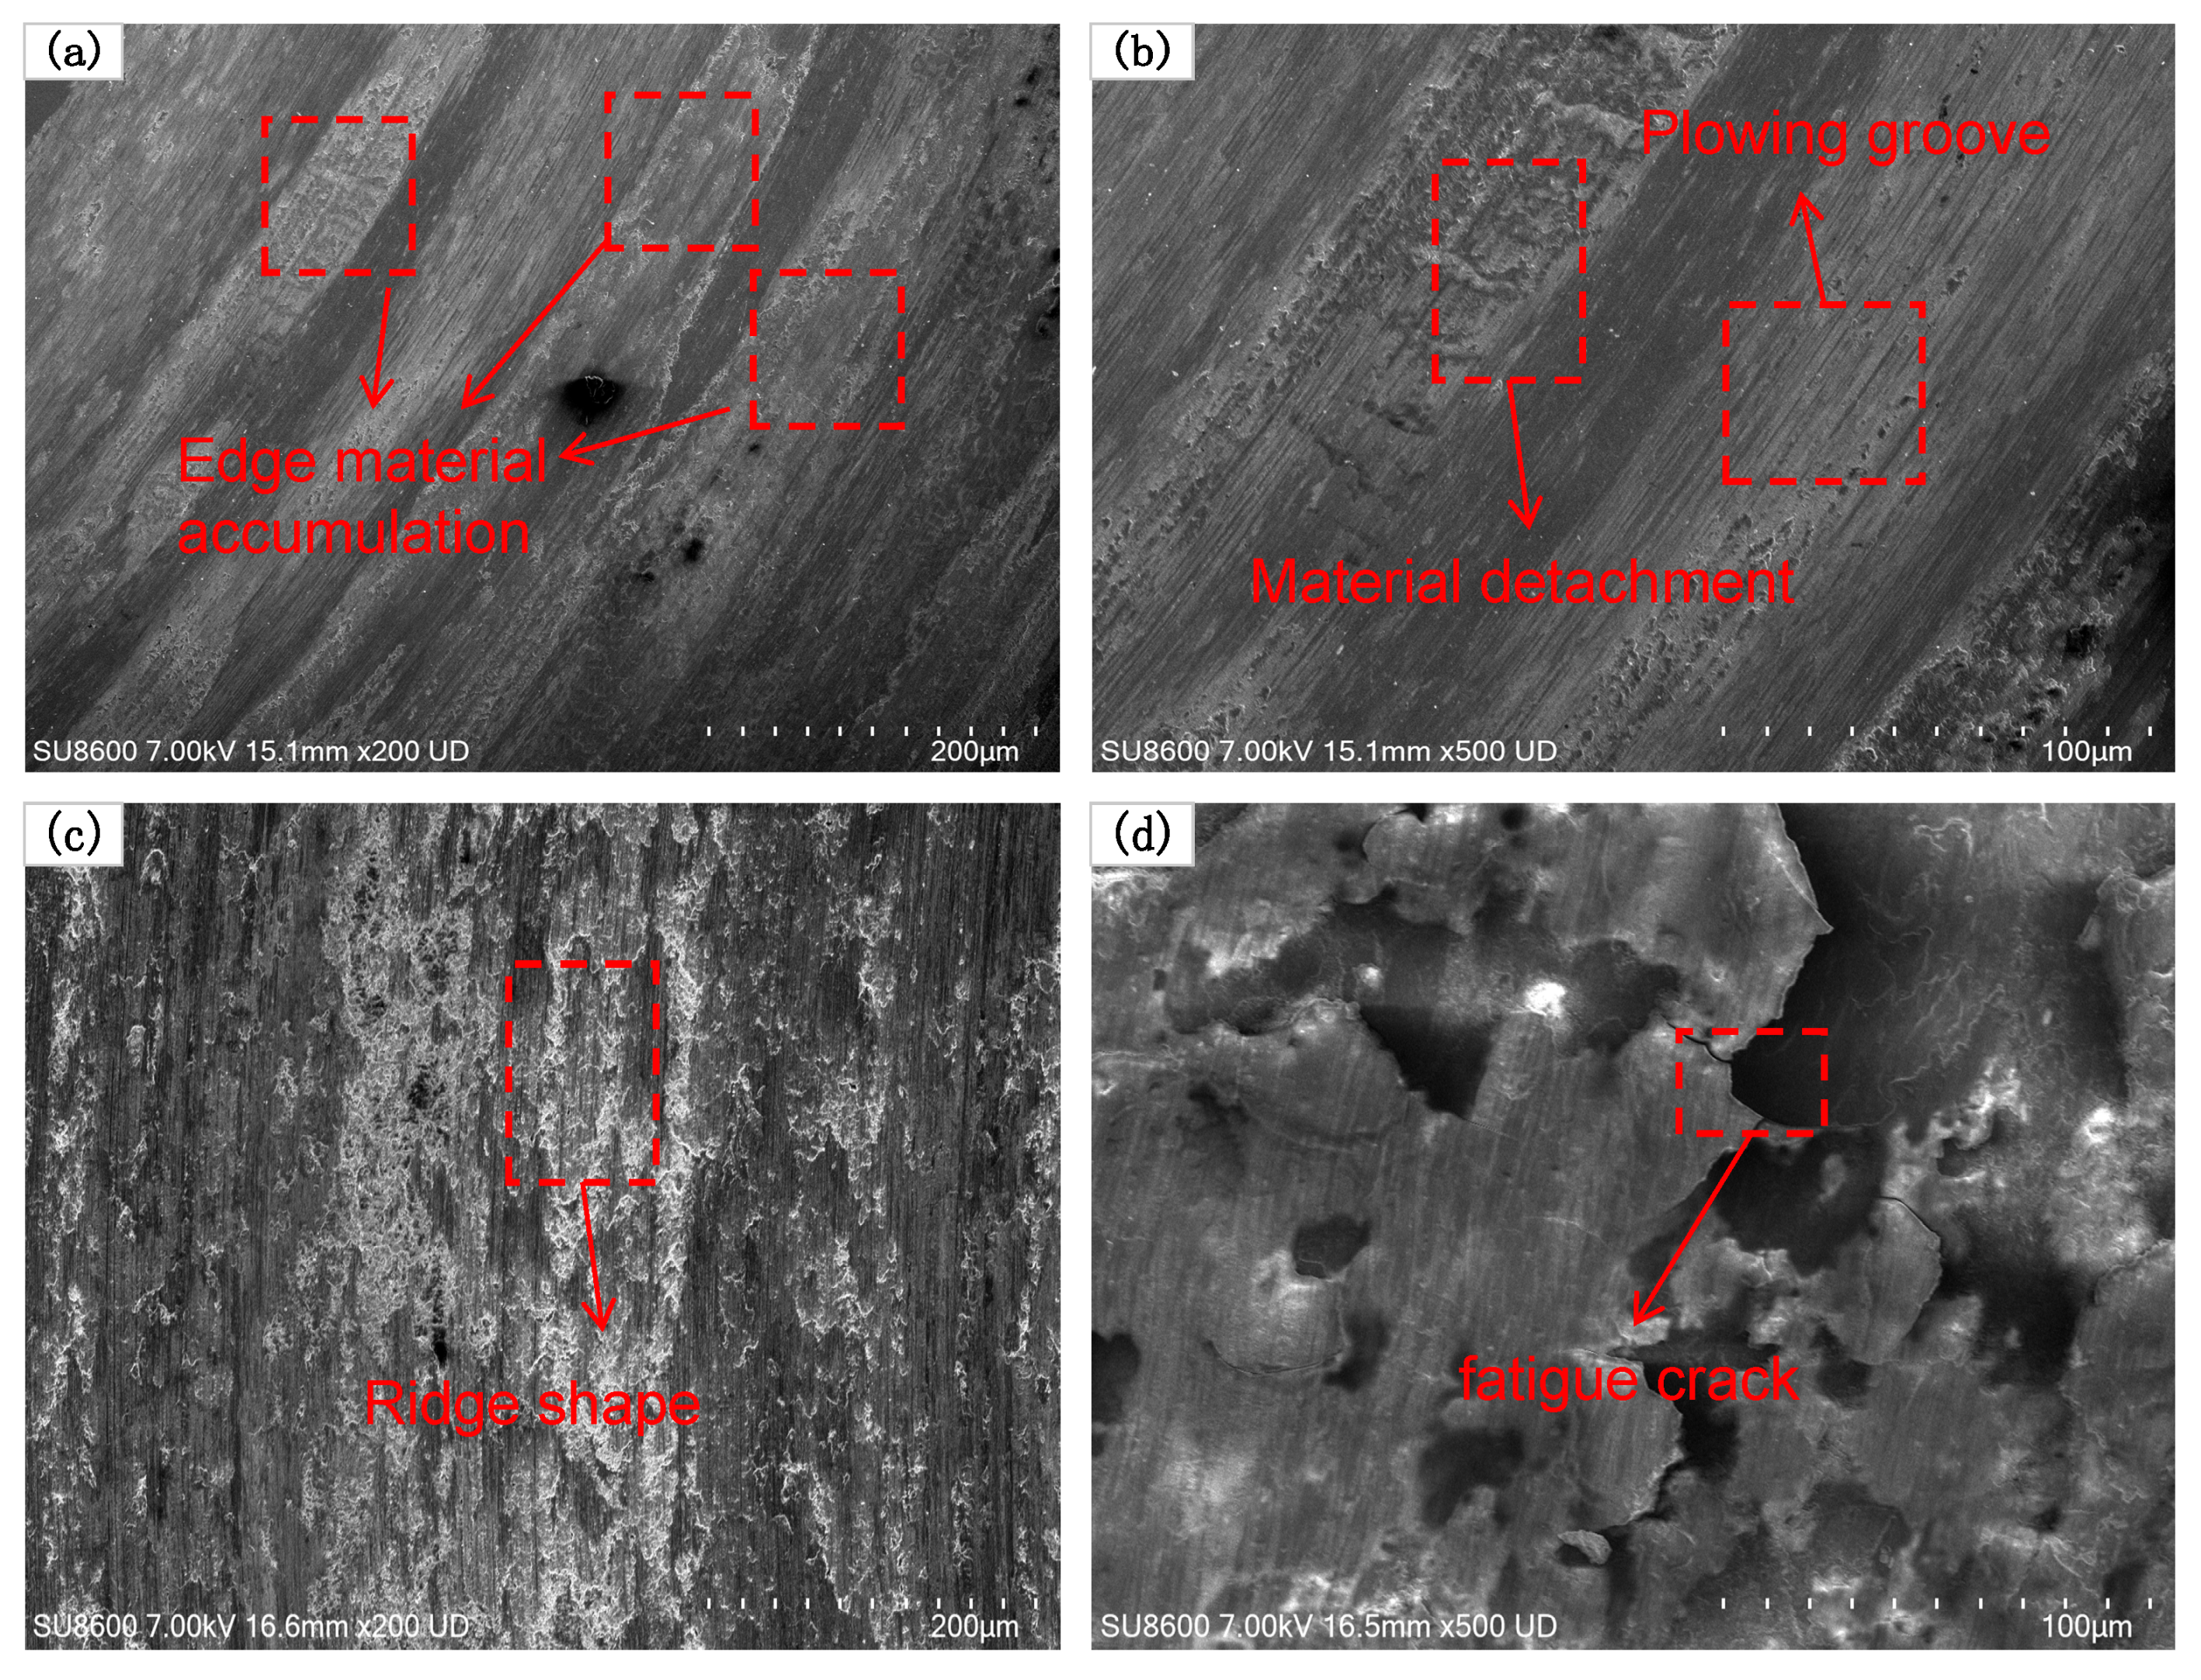
- The obtained maximum microhardness for the coat was approximately 520 HV1–556 HV1 three times that of the No. 45 steel. As the Cr3C2 powder mass ratio increases in the composite cladding powder, the surface wear of the coating initially decreases and then increases. At a 35% mass proportion of Cr3C2 powder, the surface wear of the coating is significantly reduced to 0.15 mg, which is approximately one-fifth of the wear of the 45# steel substrate. When the mass ratio of Cr3C2 powder is 45% and 55%, the crack area of the coating surface increases and the wear resistance decreases. The friction surface of the coating is relatively smooth, with no significant material adhesion. The wear surface features small, dense plow grooves, which are indicative of abrasive wear, local fatigue wear, and adhesive wear.
Author Contributions
Funding
Data Availability Statement
Acknowledgments
Conflicts of Interest
References
- Min, T. Research on Failure Analysis and Countermeasures of Piston Rod Fracture in Reciprocating Compressors. Ph.D. Thesis, South China University of Technology, Guangzhou, China, 2018; pp. 5–30. [Google Scholar]
- Guo, F. Common faults and countermeasures of natural gas compressors. China Pet. Chem. Stand. Qual. 2023, 43, 15–17. [Google Scholar]
- Zhang, T. Numerical Simulation and Experimental Study on Laser Cladding of Hydraulic Shock Absorber Piston Rod. Ph.D. Thesis, Xiangtan University, Xiangtan, China, 2020; pp. 5–50. [Google Scholar]
- Li, D.; Wu, J.; Lin, Y.; Huang, L. Analysis and Treatment of Piston Rod Wear Fault of Reciprocating Compressor. Equip. Manag. Maint. 2021, 9, 52–54. [Google Scholar]
- Zhang, B.; Ma, X.; Liu, L.; Wang, Y.; Yu, H.; Morina, A.; Lu, X. Reciprocating sliding friction behavior and wear state transition mechanism of cylinder liner and piston ring. Wear 2024, 546–547. [Google Scholar] [CrossRef]
- Xiao, W. Experimental Study on Wear Resistance and Corrosion Resistance Treatment Technology of Piston Rod Local Surface. Ph.D. Thesis, Jiangnan University, Wuxi, China, 2008; pp. 5–7. [Google Scholar]
- Yuan, W.; Li, R.; Chen, Z.; Gu, J.; Tian, Y. A comparative study on microstructure and properties of traditional laser cladding and high-speed laser cladding of Ni45 alloy coatings. Surf. Coat. Technol. 2021, 405, 126–582. [Google Scholar] [CrossRef]
- Koclęga, D.; Radziszewska, A.; Dymek, S.; Morgiel, J.; Maj, Ł.; Kranzmann, A. Improvement of Corrosion Resistance of 13CrMo4-5 Steel by Ni-Based Laser Cladding Coatings. J. Mater. Eng. Perform. 2020, 29, 3702–3713. [Google Scholar] [CrossRef]
- Fuli; Chen, X.; Liu, W.; Mao, P.; Huang, H. Study on Properties of CoNiCrAl/Cr2O3·SiO2·TiO2 Composite Coating Prepared on Piston Rod Surface. Hot Work. Technol. 2021, 50, 69–71+76. [Google Scholar]
- Fu, S.; Ren, S.; Zou, W.; Wu, D.; Feng, L. Analysis and control of cracks repaired by laser cladding on thin-walled tip of turbine blade. Mod. Coat. Coat. 2024, 27, 42–45. [Google Scholar]
- Gan, L.; Sun, H.; Lei, Y.; Wei, L.; Gu, J.; Zhang, T.; Li, G.J.; Mu, Z. Laser cladding repair materials and process of 30Cr13 steel blade wheel shaft. Shipbuild. Technol. 2019, 52, 55–58. [Google Scholar]
- Guo, Y.; Lei, Z.; Guan, Y.; Zhang, S.; Li, J.; Li, S. Valve Stem Failure Analysis and Surface Laser Cladding Repair. Electric Welding Machine 2019, 54, 43–49. [Google Scholar]
- Zhai, J.; Liu, Z.; Zhang, Y.; Shi, Y.; Deng, H.; Wei, X. Laser cladding repair of inner cylinder piston Rod. Prog. Laser Optoelectron. 2017, 54, 273–280. [Google Scholar]
- Wu, L.; Li, T.; Zhang, S.; Zhang, S. Feasibility study on Repairing Strain of Piston Rod of Hydraulic Cylinder by Laser Cladding. Mech. Eng. 2020, 11, 146–147+151. [Google Scholar]
- Zhang, N.; Xu, Y.-f.; Wang, M.-h.; Hou, X.-d.; Du, B.-r.; Ge, X.-y.; Shi, H.; Xie, X. M2 coating prepared by ultra-high speed laser cladding: Microstructure and interfacial residual stress. Mater. Today Commun. 2023, 35, 105638. [Google Scholar] [CrossRef]
- Zhu, Y.; Zhou, H.; Chen, Z.; Wang, Z.; He, F.; Xu, C. Study on Microstructure and Properties of Ni60A/WC Composite Coating by Alternating-Magnetic-Field-Assisted Laser Cladding. Micromachines 2022, 13, 653. [Google Scholar] [CrossRef] [PubMed]
- Youdi, J.; Hongying, G.; Chentong, S.; Xingpeng, J.; Zhiwei, Z.; Liang, Q. Effect of Lap Ratio on Microstructure and Properties of Laser Cladding Ni Based Coating on 45 Steel. In Proceedings of the 2019 2nd World Conference on Mechanical Engineering and Intelligent Manufacturing (WCMEIM), Shanghai, China, 22–24 November 2019. [Google Scholar] [CrossRef]
- Li, Y.; Ji, N.; Liu, J. Microstructure and Tribological Properties of Laser Cladding Ni-based Alloy on 45 Steel Surface. Hot Work. Technol. 2012, 41, 170–172. [Google Scholar] [CrossRef]
- Liu, X.; Sing, L.; Liu, C.; Xing, F. Electrolytic Polishing Solution and Electrolytic Polishing Process for EBSD Sample of Titanium Alloy. CN202010876494.5, 28 October 2024. [Google Scholar]
- Wang, Y.; Lin, X.; Wang, L.; Yang, H.; Huang, W. Laser remelting microscopic solidification process of molten ChiHong real-time observation. Appl. Laser 2015, 35, 5. [Google Scholar] [CrossRef]
- Chen, Z.-K.; Liu, M.; Zheng, D.-C.; Ma, W.-Y. Research on formation causes and elimination methods of the laser cladding cracks. Laser J. 2009, 30, 55–57. [Google Scholar] [CrossRef]
- Wang, C. Process Optimization of Laser Cladding of Co-9Al-12W alloy. Master’s Thesis, Lanzhou University of Technology, Lanzhou, China, 2019; pp. 10–50. [Google Scholar]
- Wang, G.; Yong, Y.; Wang, Q.; Chen, X. Negative thermal expansion materials and its application in laser cladding. J. Laser Infrared 2023, 53, 677–684. [Google Scholar] [CrossRef]
- Li, J. Research on Fe-Based Wear-Resistant Coating by Laser Cladding in Middle Groove of Scraper Conveyor. Ph.D. Thesis, China University of Mining and Technology, Xuzhou, China, 2022; pp. 32–37. [Google Scholar]
- Liu, X. Study on Preparation and Wear Resistance of Laser Cladding Fe-Ni Alloy Coating. Ph.D. Thesis, Jiangsu University, Zhenjiang, China, 2021; pp. 27–32. [Google Scholar]
- Jiang, H.; Zhikai, Z.; Wenqing, S.; Yang, Z.; Tianwen, J.; Kaiyue, L. Microstructure and properties analysis of Ni60-based/WC composite coatings prepared by laser cladding. Heliyon 2024, 10, e24494. [Google Scholar] [CrossRef]
- Li, L. Experimental Study on Preparation and Cutting of Ni60 Laser Cladding Layer. Ph.D. Thesis, Tianjin Vocational and Technical Normal University, Tianjin, China, 2021; pp. 20–75. [Google Scholar]
- Li, Y.; Wang, L.; Zhang, J.; Liu, M.; Guo, S.; Liu, J.; Cao, L. Effect of multiple laser remelting on microstructure and corrosion resistance of Fe0. 5CoCrNi1.5Nb0.68Mo0.3 high entropy alloy coatings. J. Mater. Res. Technol. 2024, 31, 3935–3949. [Google Scholar] [CrossRef]
- Liu, H.; Wang, R.; Gao, Q.; Chen, P.; Hao, J.; Yang, H.; Liu, X. Evolution in microstructure and tribological behavior of laser cladded MoxNbTiZr high-entropy refractory alloy coatings with varying Mo content. Mater. Charact. 2023, 206 Pt B, 113449. [Google Scholar] [CrossRef]
- Yu, T. Microstructure and Wear Resistance of In Situ Synthesized Ti(C, N) Ceramic-Reinforced Nickel-Based Coatings by Laser Cladding. Materials 2024, 17, 3878. [Google Scholar] [CrossRef] [PubMed]
- Yu, A.; Han, T.; Han, Y. Nickel-based Si3N4 friction and wear properties of composite coating. Lubr. Seal. 2006, 4, 3. [Google Scholar] [CrossRef]
- Yingtao, Z.; Yongliang, M.; Gang, W.; Xiulin, J.; Zhichao, L. Experimental Study on the Wear Properties of 42CrMo Steel with Different Microstructures and T15 Laser Cladding. J. Mater. Eng. Perform. 2022, 5, 31. [Google Scholar] [CrossRef]


| Chemical Composition | C | Cr | Si | B | Fe | Ni |
|---|---|---|---|---|---|---|
| wt% | 0.8 | 16.5 | 4.0 | 4.0 | 3.0~5.0 | Balance |
| Number | Power (W) | Scanning Speed (mm/s) | Powder Delivery Rate (g/min) | Overlap Rate (%) | Spot Diameter (mm) | Mass Proportion of Mixed Powder (%) | |
|---|---|---|---|---|---|---|---|
| Cr3C2 | Ni60A | ||||||
| 1# | 1400 | 10 | 6.0 | 50 | 3.6 | 15 | 85 |
| 2# | 1400 | 10 | 6.0 | 50 | 3.6 | 25 | 75 |
| 3# | 1400 | 10 | 6.0 | 50 | 3.6 | 35 | 65 |
| 4# | 1400 | 10 | 6.0 | 50 | 3.6 | 45 | 55 |
| 5# | 1400 | 10 | 6.0 | 50 | 3.6 | 55 | 45 |
Disclaimer/Publisher’s Note: The statements, opinions and data contained in all publications are solely those of the individual author(s) and contributor(s) and not of MDPI and/or the editor(s). MDPI and/or the editor(s) disclaim responsibility for any injury to people or property resulting from any ideas, methods, instructions or products referred to in the content. |
© 2025 by the authors. Licensee MDPI, Basel, Switzerland. This article is an open access article distributed under the terms and conditions of the Creative Commons Attribution (CC BY) license (https://creativecommons.org/licenses/by/4.0/).
Share and Cite
Pu, J.; Tarelnyk, V.; Ju, Y.; Grigorievicth, B.S.; Wang, X.; Dong, Q.; Wang, H.; Song, W. Analysis of Microstructure and Performance of Cr3C2/Ni60A Coating on 45 Steel for Laser Cladding Piston Rod. Crystals 2025, 15, 93. https://doi.org/10.3390/cryst15010093
Pu J, Tarelnyk V, Ju Y, Grigorievicth BS, Wang X, Dong Q, Wang H, Song W. Analysis of Microstructure and Performance of Cr3C2/Ni60A Coating on 45 Steel for Laser Cladding Piston Rod. Crystals. 2025; 15(1):93. https://doi.org/10.3390/cryst15010093
Chicago/Turabian StylePu, Jiafei, Viacheslav Tarelnyk, Yao Ju, Bondarev Sergii Grigorievicth, Xingrong Wang, Qi Dong, Hongfeng Wang, and Weiwei Song. 2025. "Analysis of Microstructure and Performance of Cr3C2/Ni60A Coating on 45 Steel for Laser Cladding Piston Rod" Crystals 15, no. 1: 93. https://doi.org/10.3390/cryst15010093
APA StylePu, J., Tarelnyk, V., Ju, Y., Grigorievicth, B. S., Wang, X., Dong, Q., Wang, H., & Song, W. (2025). Analysis of Microstructure and Performance of Cr3C2/Ni60A Coating on 45 Steel for Laser Cladding Piston Rod. Crystals, 15(1), 93. https://doi.org/10.3390/cryst15010093