Article

Estimation of Hardness of Single-Phase Metallic Alloys

1
H-ION kft., H-1121 Budapest, Hungary
2
Department of Materials Physics, Eötvös Loránd University, Pázmány Péter Sétány 1/A, H-1117 Budapest, Hungary
3
Institute for Solid State Physics and Optics, Wigner Research Center for Physics, P.O. Box 49, H-1525 Budapest, Hungary
4
Applied Material Physics, Department of Material Science and Engineering, Royal Institute of Technology, SE-100 44 Stockholm, Sweden
*
Author to whom correspondence should be addressed.
Crystals 2025, 15(2), 156; https://doi.org/10.3390/cryst15020156 (registering DOI)
Submission received: 9 January 2025 / Revised: 24 January 2025 / Accepted: 31 January 2025 / Published: 2 February 2025
(This article belongs to the Special Issue Microstructure and Deformation of Advanced Alloys)

Abstract

:
First, we discuss a common feature of single-phase pure metals and amorphous and high-entropy alloys: the maximum value of hardness corresponding to a valence electron count (VEC) value of around 6.5–7. This correlation is explained by the coincidence that by subtracting the number of sp valence electrons (Nsp = 2) from the VEC we obtain the maximal number of unpaired d electrons, Nd = 4.5–5 in the 3d, 4d, and 5d rows of transition elements. These unpaired d electrons form orbital overlap bonding, which is stronger than the isotropic metallic bonds of a delocalized electron cloud. The more unpaired d electrons there are, the higher the bonding strength. Second, we will discuss the hardness formulas derived from cohesion energy and shear modulus. We will demonstrate that both types of formulas originate in the electrostatic energy density of metallic bonds, expressing a 1/R4 dependence. Finally, we show that only two parameters are sufficient to estimate hardness: the atomic radius and the cohesion-based valence. In the case of alloys, our formula gives a lower bound on the hardness only. It is not suitable for calculation of the hardness increase caused by solid solution, grain size, precipitation, and phase mixture.

1. Introduction

Many attempts have been made to predict the hardness of materials. In the case of covalently bound solids, the hardness of a material is mainly determined by the bond length, bond valence, and bond density [1]. For covalently bonded solids with a tetrahedral structure, the maximum hardness is attained when the valence electron count per atom (VEC) is about 4 [2]. No such phenomenological model exists for metallic bonded solids. In the vast composition space of metallic alloys, the trial-and-error method is still used to design high hardness compositions. Although many methods have emerged from the development of computational facilities such as density functional theory, phase diagram calculations, molecular dynamics, etc. [3,4], the design problem has not yet been solved because the efficiency of computer time should be improved and the computational cost must also be brought down. Therefore, in engineering practice, simple phenomenological formulas are needed where the connections between the parameters can also be understood and interpreted immediately. Recently we have published a series of articles [5,6,7] presenting interesting phenomenological formulas revealing the relationships between mechanical properties and composition and properties.
We would like to emphasize that we deal with single-phase metals and metal alloys. We list three material families here: pure metals, amorphous (glassy) metal alloys, and high-entropy alloys. Pure metals, if they do not show an allotropic crystal structure transformation, are naturally single-phase. But if they show an allotropic transformation, then either the high-temperature phase disappears during cooling (see pure iron) or it remains and can only be removed with long, tricky heat treatments (see cobalt, which in natural conditions is an HCP-FCC phase mixture, and this causes the unusual hardness of the pure metal cobalt). Amorphous metal alloys are inherently single-phase, since they do not have a crystal structure. High-entropy alloys are usually present in three phases depending on their composition [5], i.e., depending on the average VEC: below VEC = 4, HCP; for 4.25 < VEC < 7.55 BCC; for 7.55 < VEC < 7.76 BCC + FCC; and for 7.76 < VEC < 10 FCC.
Our goal is to understand and interpret the basics of hardness, which is to be found in the strength of atomic bonds. To express this relationship, we present formulas to derive the hardness value from the cohesive energy, force constant, and shear modulus. The real breakthrough came when it became possible to reduce the different hardness formulas to a basic formula containing only two tabulated parameters, the atomic radius and the metallic valence. Actual hardness is determined by other types of hardness contributions as well, that are added to this base, like hardness contributions from solid solution, grain boundary, precipitation, and phase mixture hardnesses, but we will not deal with these contributions here.
In the first part of this article, we present and interpret the dependence of hardness on the valence electron count. In the second part, we show that hardness mainly depends on the electrostatic energy density contribution to the metallic bond and, as a consequence, hardness depends on the inverse of the fourth power of the metallic atomic radius, and is proportional to the second power of valence Z.

2. Results

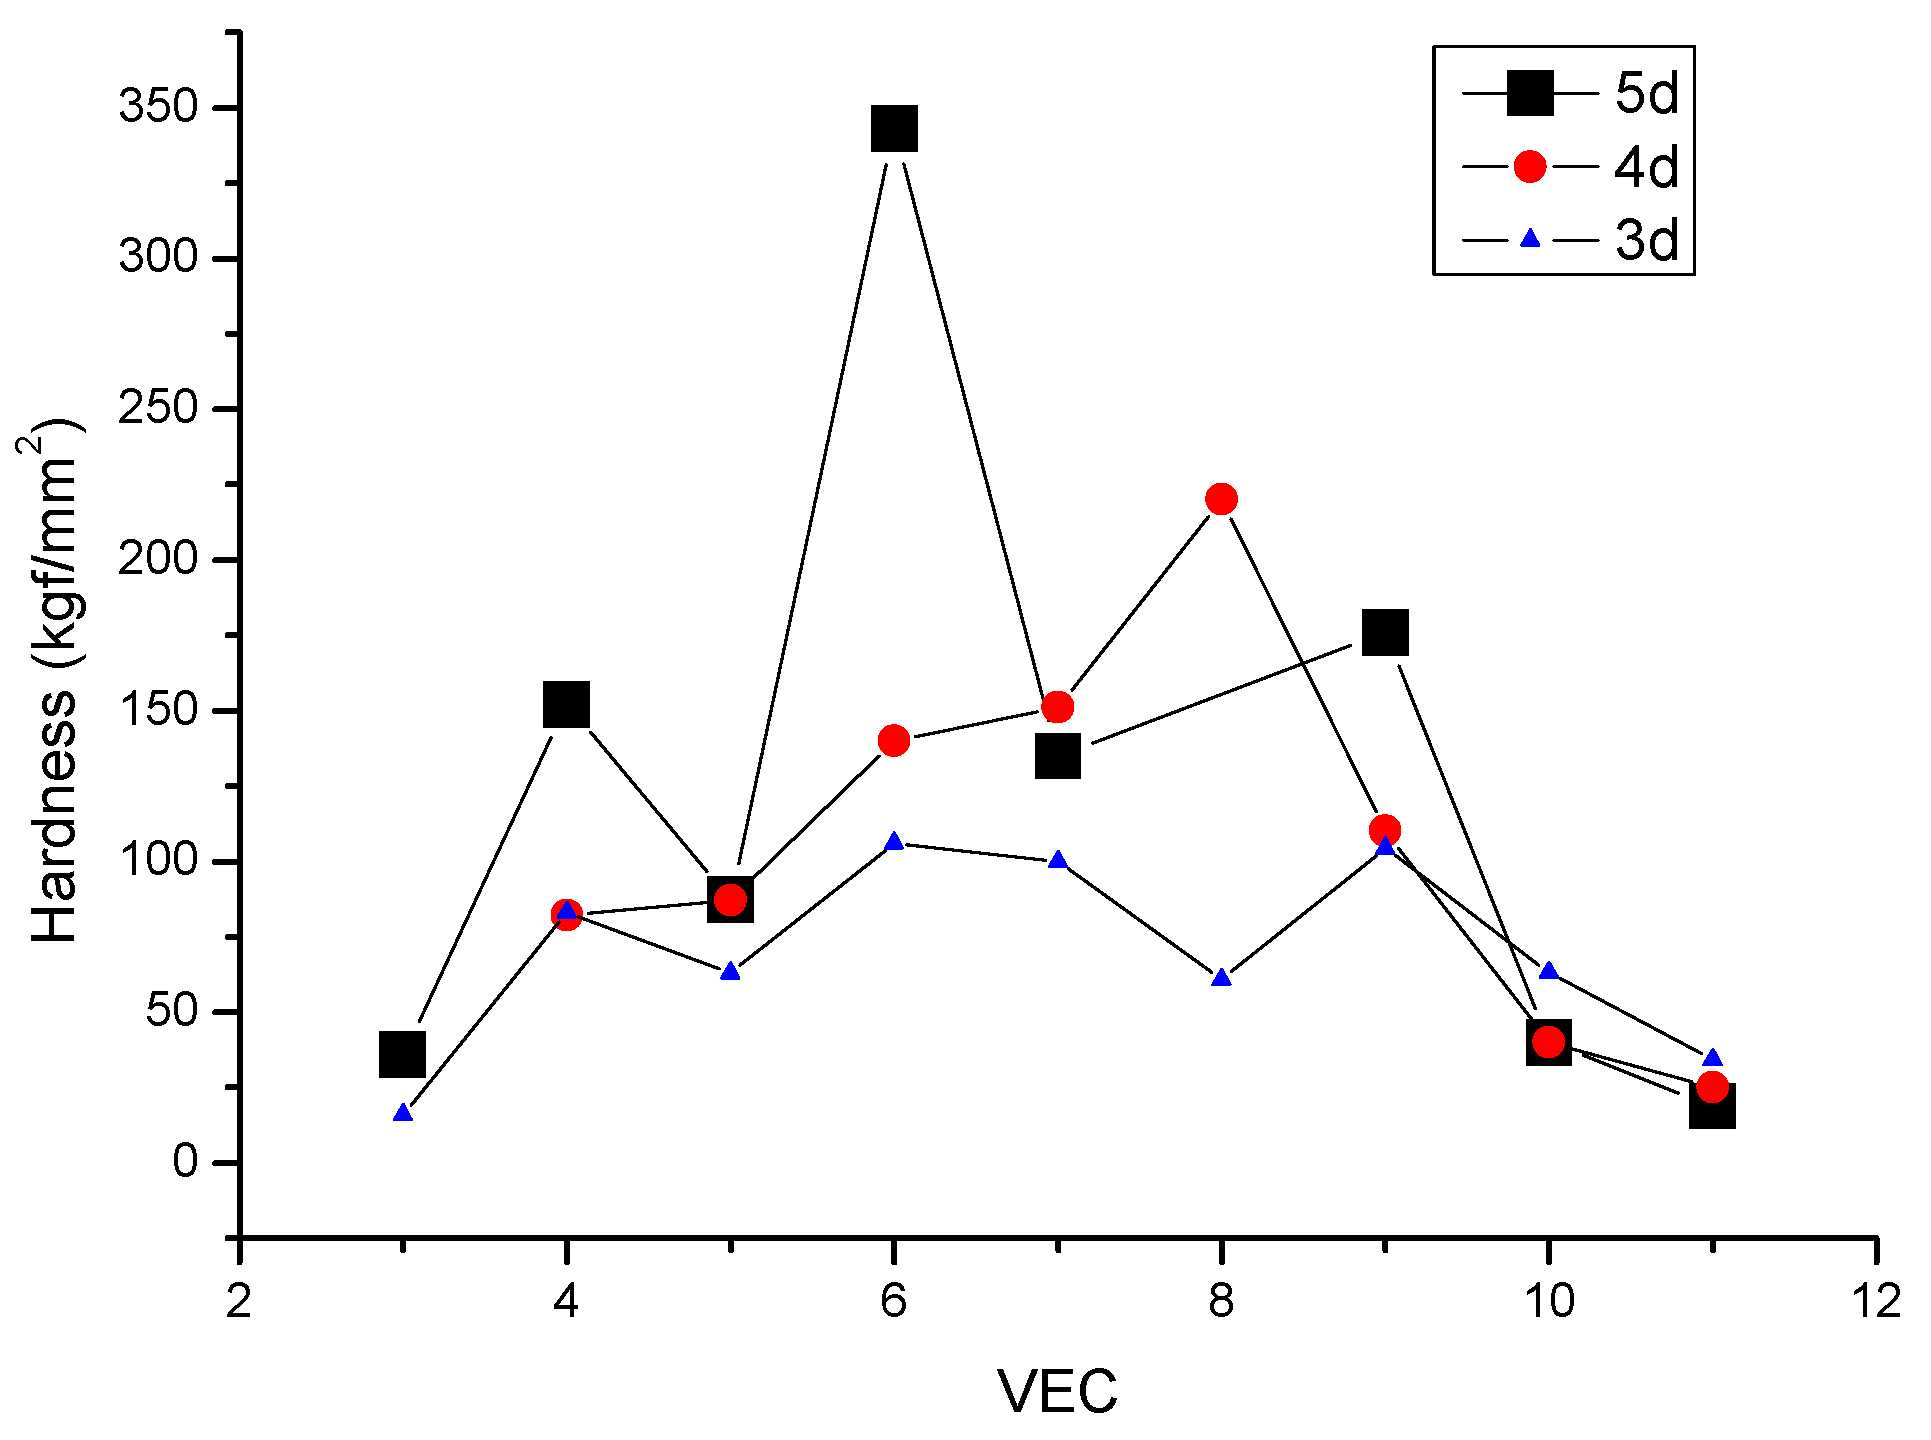
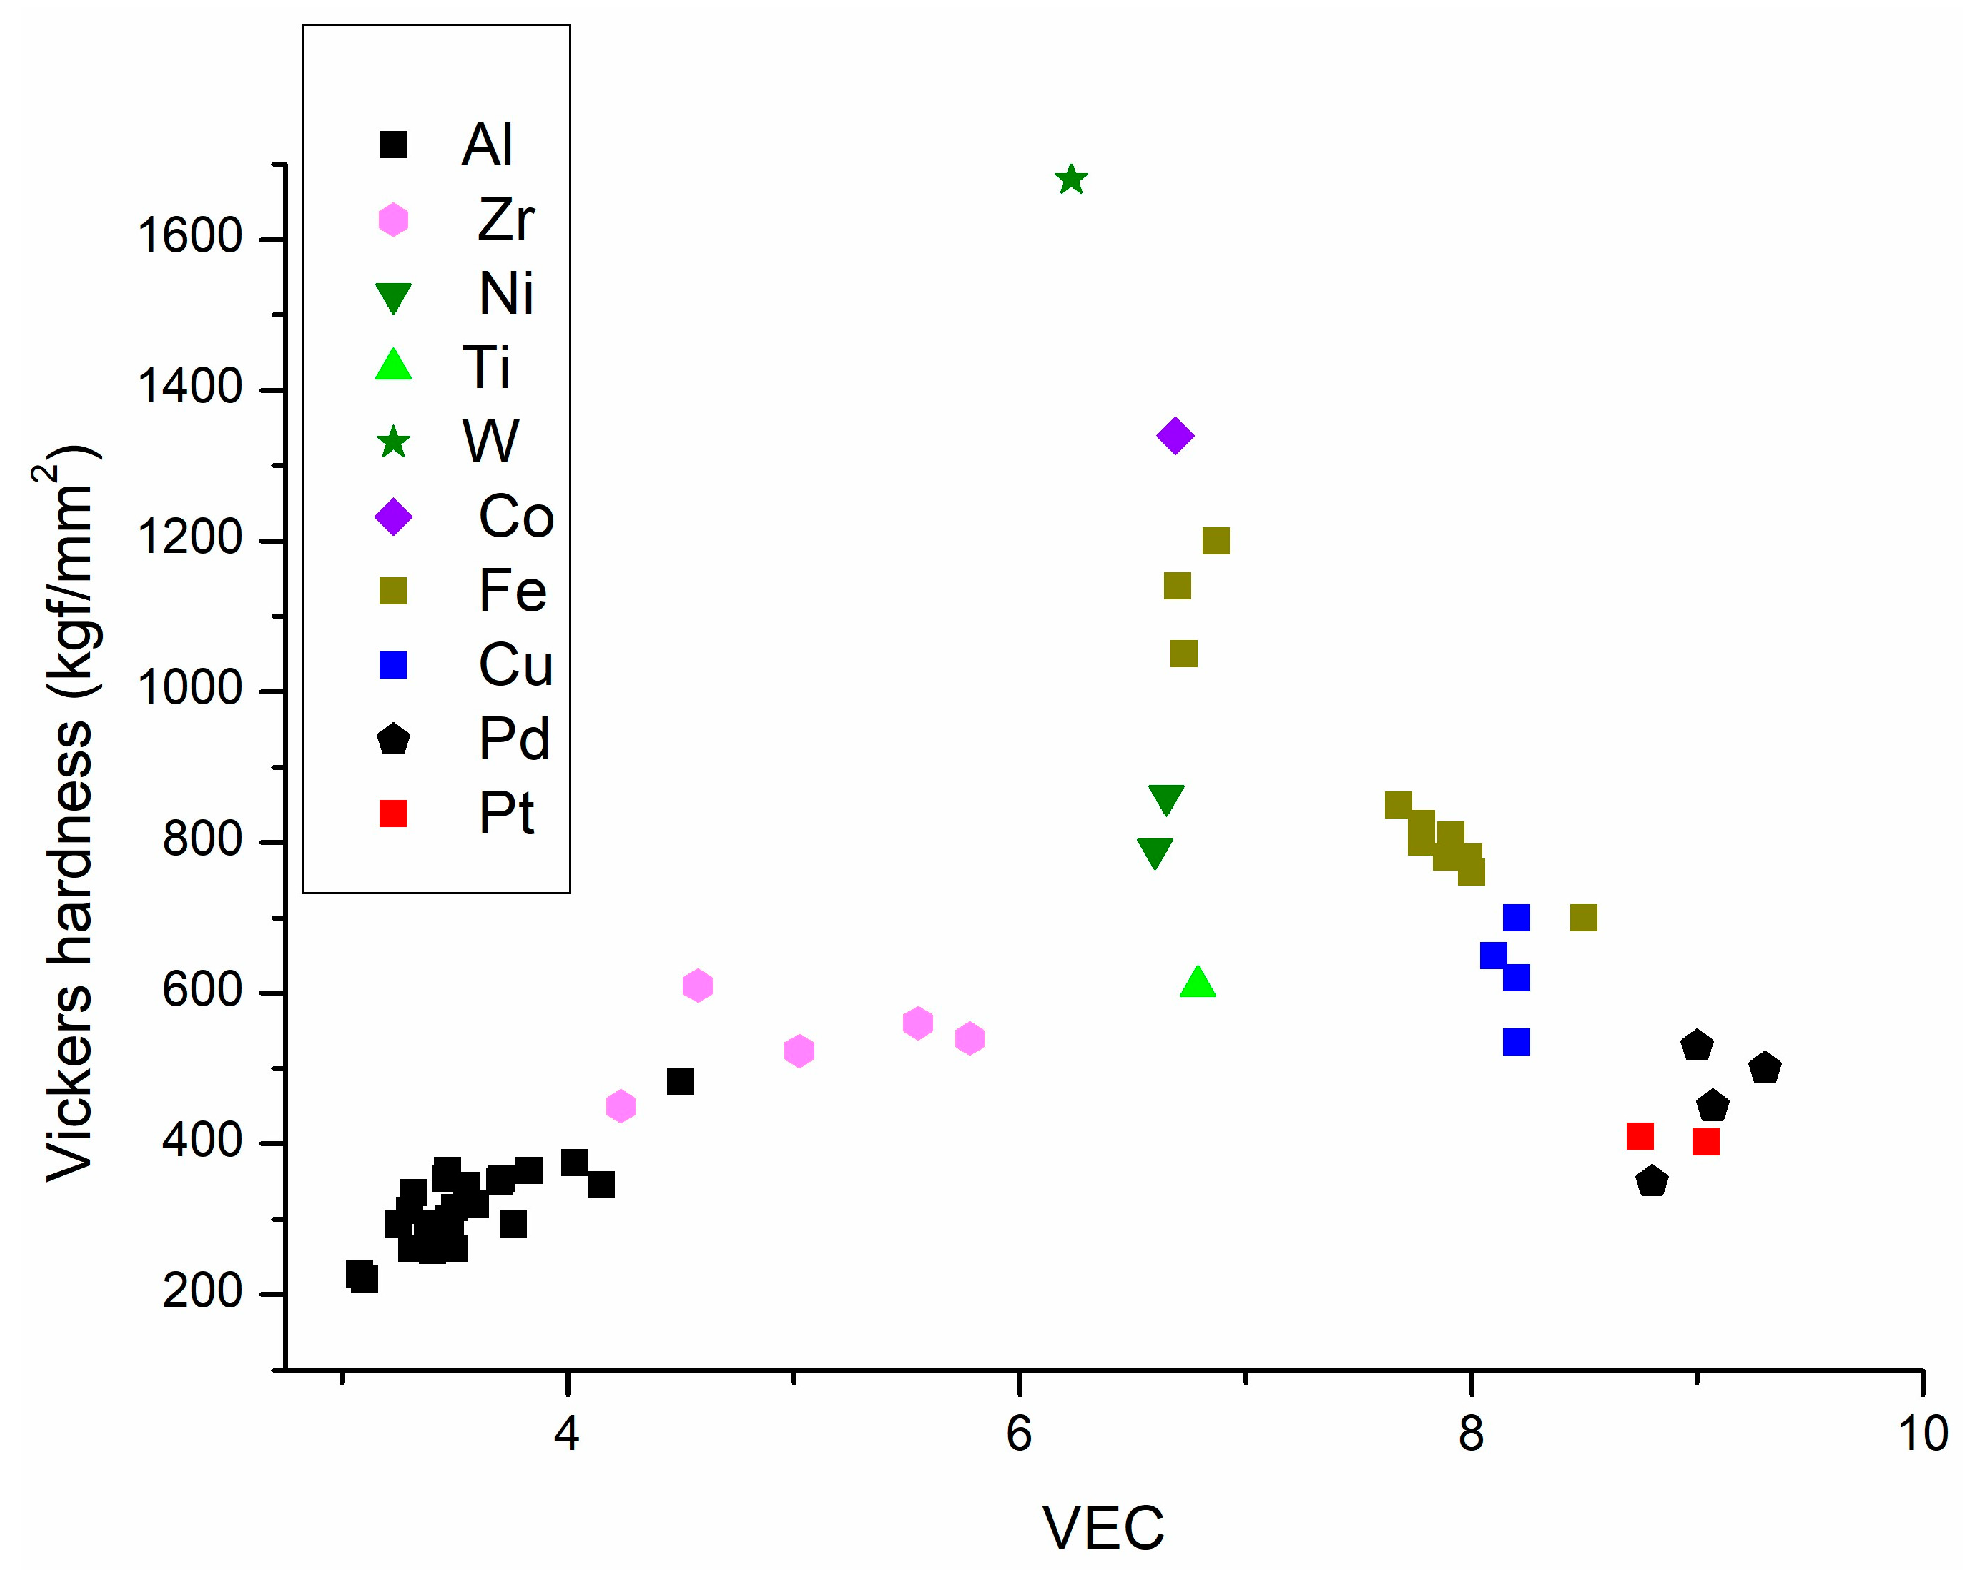
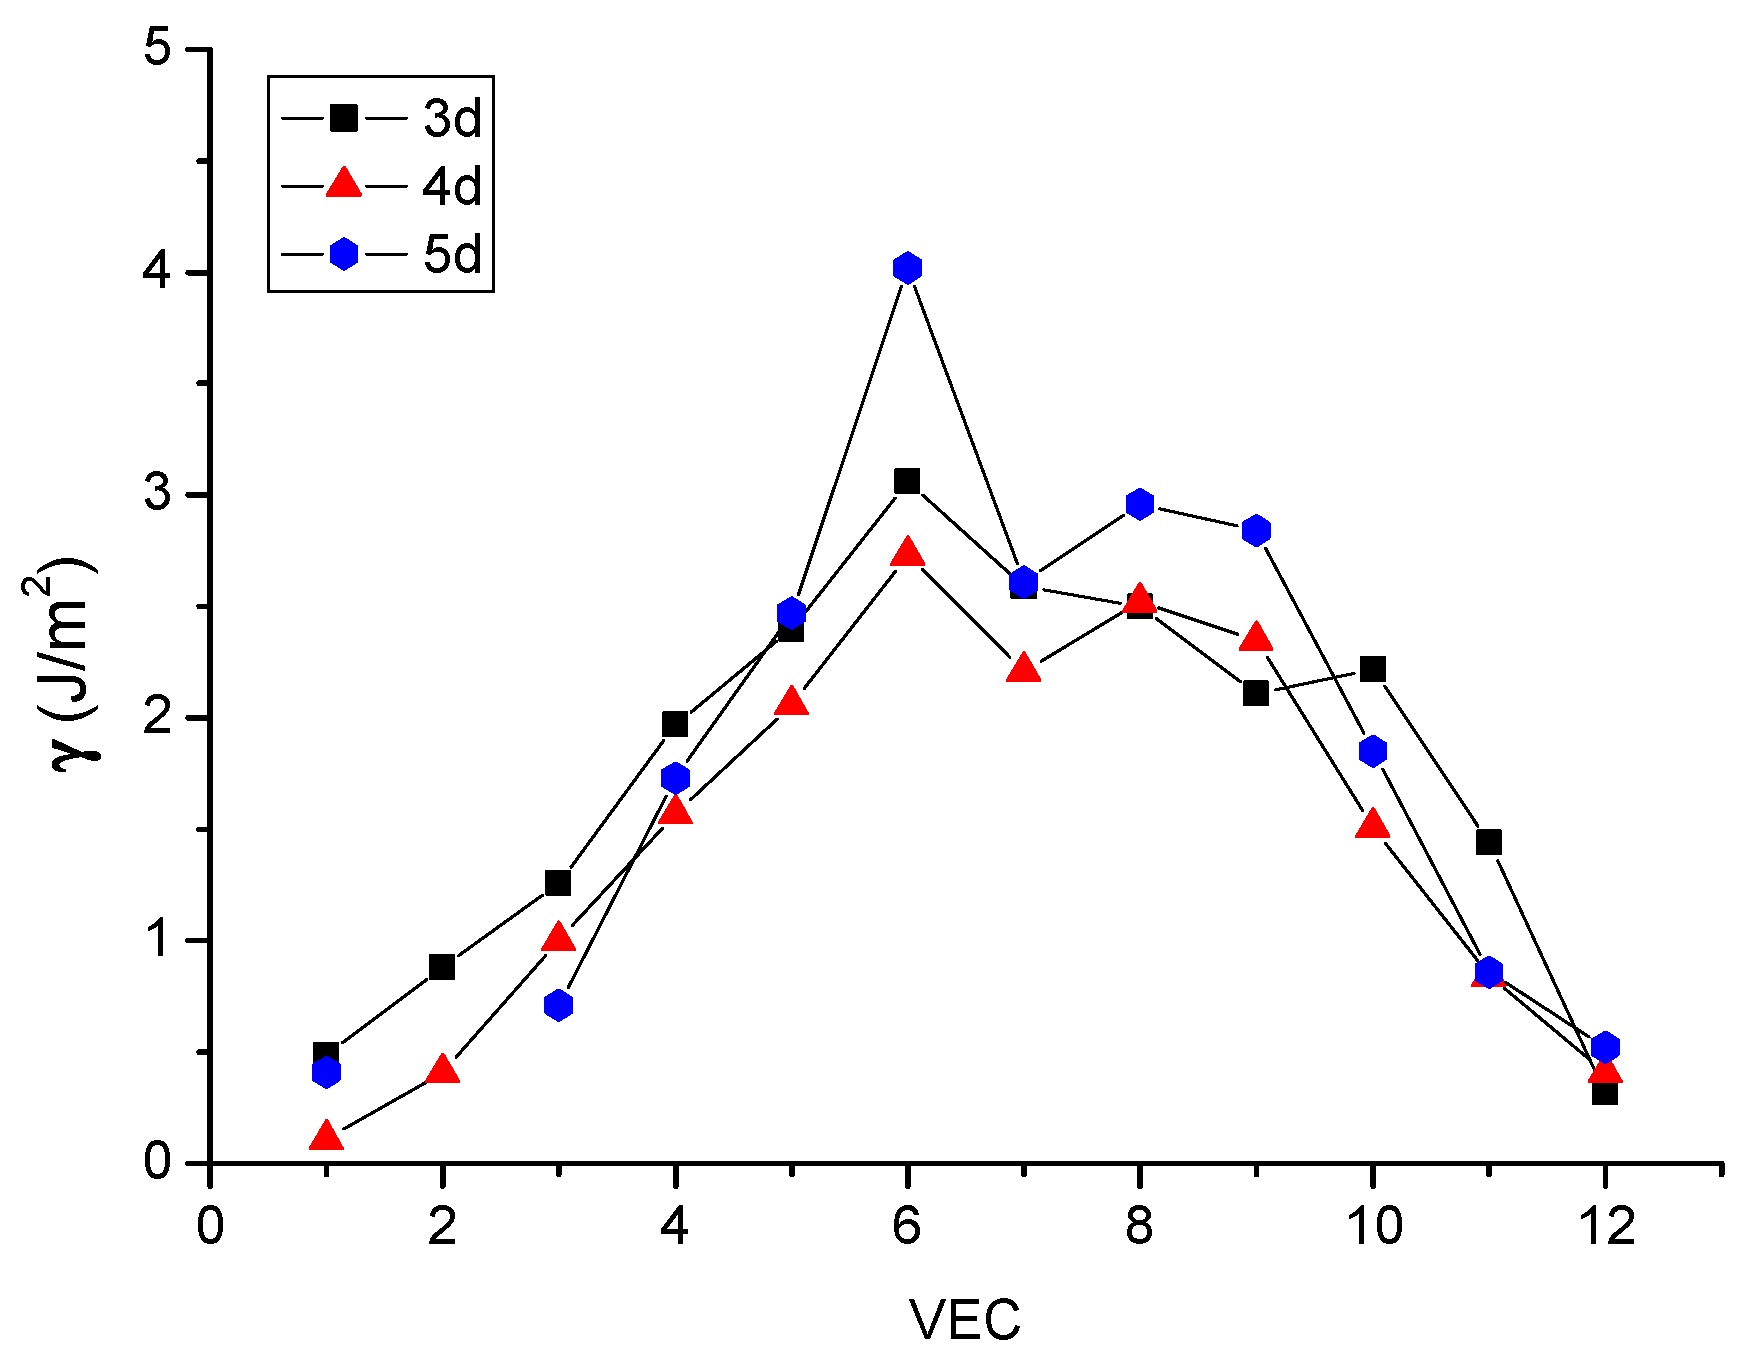
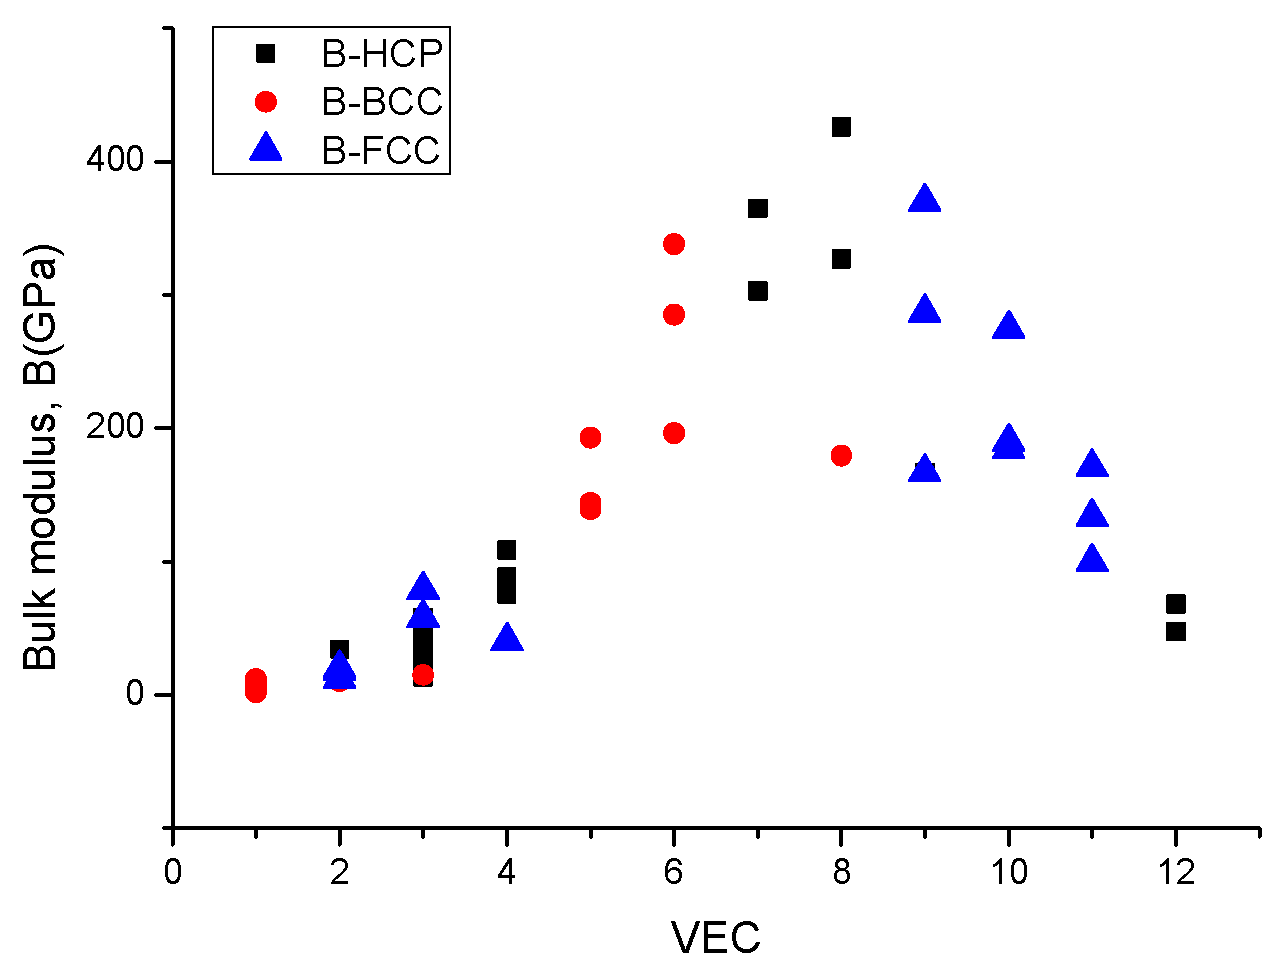
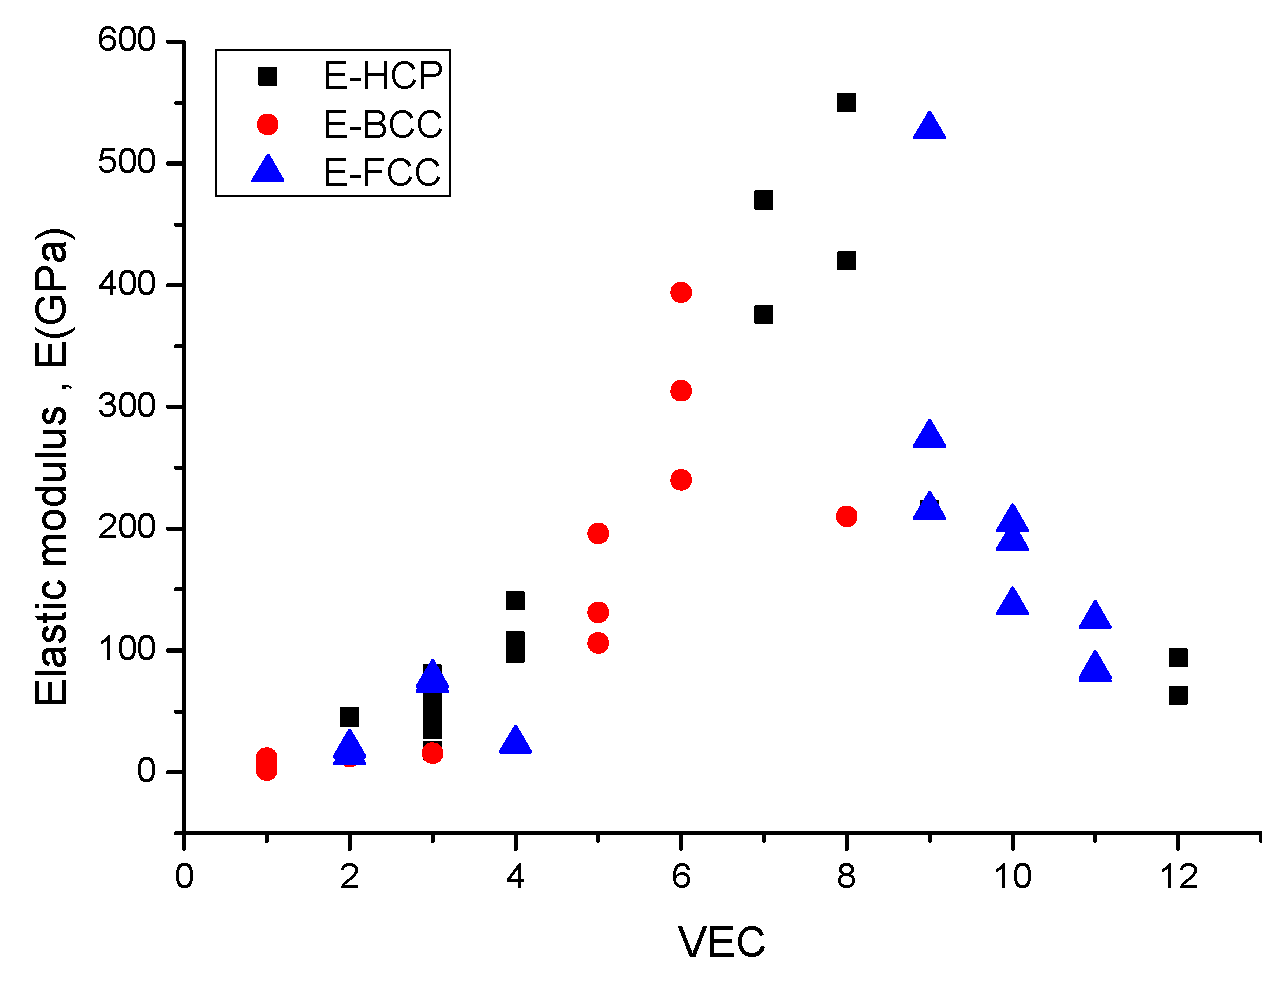
2.1. The Valence Electron Count (VEC) Dependence of Hardness

To start with, we would like to report on an interesting experimental fact: for single-phase metallic alloys, maximum hardness is attained when the VEC is around 6.5–7. This relationship has long been known for pure metals [8] (see Figure 1), but we have revealed it for two other single-phase systems as well: amorphous metals (see Figure 2) and single-phase high-entropy alloys (HEAs) (see Figure 3). The data for Figure 2 and Figure 3 were collected from our recent published articles [6,7] and from the literature [9,10,11,12,13,14,15,16,17,18,19].
We concentrate on these two single-phase systems, the metallic glasses and HEAs, because, as a first approximation, both can be treated as extended solid solutions. A standard view on metallic glasses is to regard them as very slow liquids with extremely high shear viscosity [20]. In the case of HEAs the high configurational entropy stabilizes the single-phase solid solution’s structure [21].
The understanding of VEC dependence is based on the observation that both hardness and cohesion energy depend on bond strength and both show maximums at a VEC of around 6.5–7 (compare Figure 1, Figure 2, Figure 3 and Figure 4), which corresponds to Nd = VEC-2 = 4.5 ÷ 5 unpaired d electrons. Hardness and cohesion energy show proportional variation as a function of unpaired valence d electrons. The higher the number of unpaired d electrons, the higher the directional bond density. This, together with the isotropic metallic bond density, determines the hardness. The maximum hardness is attained when the VEC is around 6.5–7. This corresponds to 4.5 ÷ 5 d electrons, where 5 is the maximum number of unpaired d electrons.
For the sake of a deeper understanding, we recall here the simple calculation of the textbook Friedel model [22] regarding the dependence of the cohesion energy on the d electron number, Nd. The Friedel model is based on rectangular d band approximation, with a constant density of states D(E) = 5/W (see Figure 5). By integrating D(E), we can obtain the Fermi energy as a function of Nd:
E F = W 10 ( N d 5 ) + E d
Considering Ed = 0 as a reference, we obtain the cohesion energy as:
E c = 2 W / 2 E F E 5 W d E = W 20 N d ( N d 10 ) .
It turns out that the cohesion energy shows a parabolic dependence on d electron numbers, attaining the maximum for Nd = 5, where W = 5, 7, and 10 eV for the 3d, 4d, and 5d elements, respectively.
Similar parabolic dependence as a function of Nd is found for other cohesion correlated properties. Using the tabulated data from knoledgedoor.com (accessed 20 December 2024) and from [22] we are presenting the VEC dependence of, Tm, the melting point (see Figure 6); γ, the surface energy (see Figure 7); and, more importantly, the elastic properties B, the bulk moduli; E, the elastic moduli; and G, the shear moduli (See Figure 8, Figure 9 and Figure 10).
Due to similar VEC dependencies, these characteristic parameters can also be expressed in terms of their dependence on each other. For example, cohesive energy and surface energy depend on the melting point, as we showed in our recently published article [7]:
E c o h ( k J / m o l ) = 0.24 × T m ( K )
γ s u r f ( eV ) = T m ( K ) 1000

2.2. Estimation of Hardness from Debye Temperature

The strength of interatomic cohesive forces in metals and alloys also manifests itself in the Debye temperature (θD(K)), so it can be correlate to the hardness. This relationship was formulated by Deus and Schneider [23]:
H V = C k B h 2 A V m 1 / 3 θ D 2
where A is the molar mass, V is the molecular volume, and C is a linear fitted parameter.
Let me note that the formula of Deux and Schneider can also be expressed with the force constant, k, for lattice vibrations. The frequency limit of lattice vibrations is in correlation both to the force constant k = A ω 2 and to the Debye temperature θ D k B = ω . From these two equations we obtain the force constant:
k = k B 2 A θ D 2 = 2.86 10 5 A θ D 2
The unit of k is N/m (J/m2), and the numerical factor was calculated for normal (tabulated) atomic mass values. Inserting Equation (6) into Equation (5) we obtain hardness as a function of force constant:
H V = C V m 1 / 3 k
On the other hand, the force constant scales with the shear modulus as we have shown in a recent published (see Figure 11) paper [7]. So, we have returned to the well-known hardness–shear modulus relationship in a roundabout way. Nevertheless, all formulas hoping to find the one with least scattering of the data are welcome.

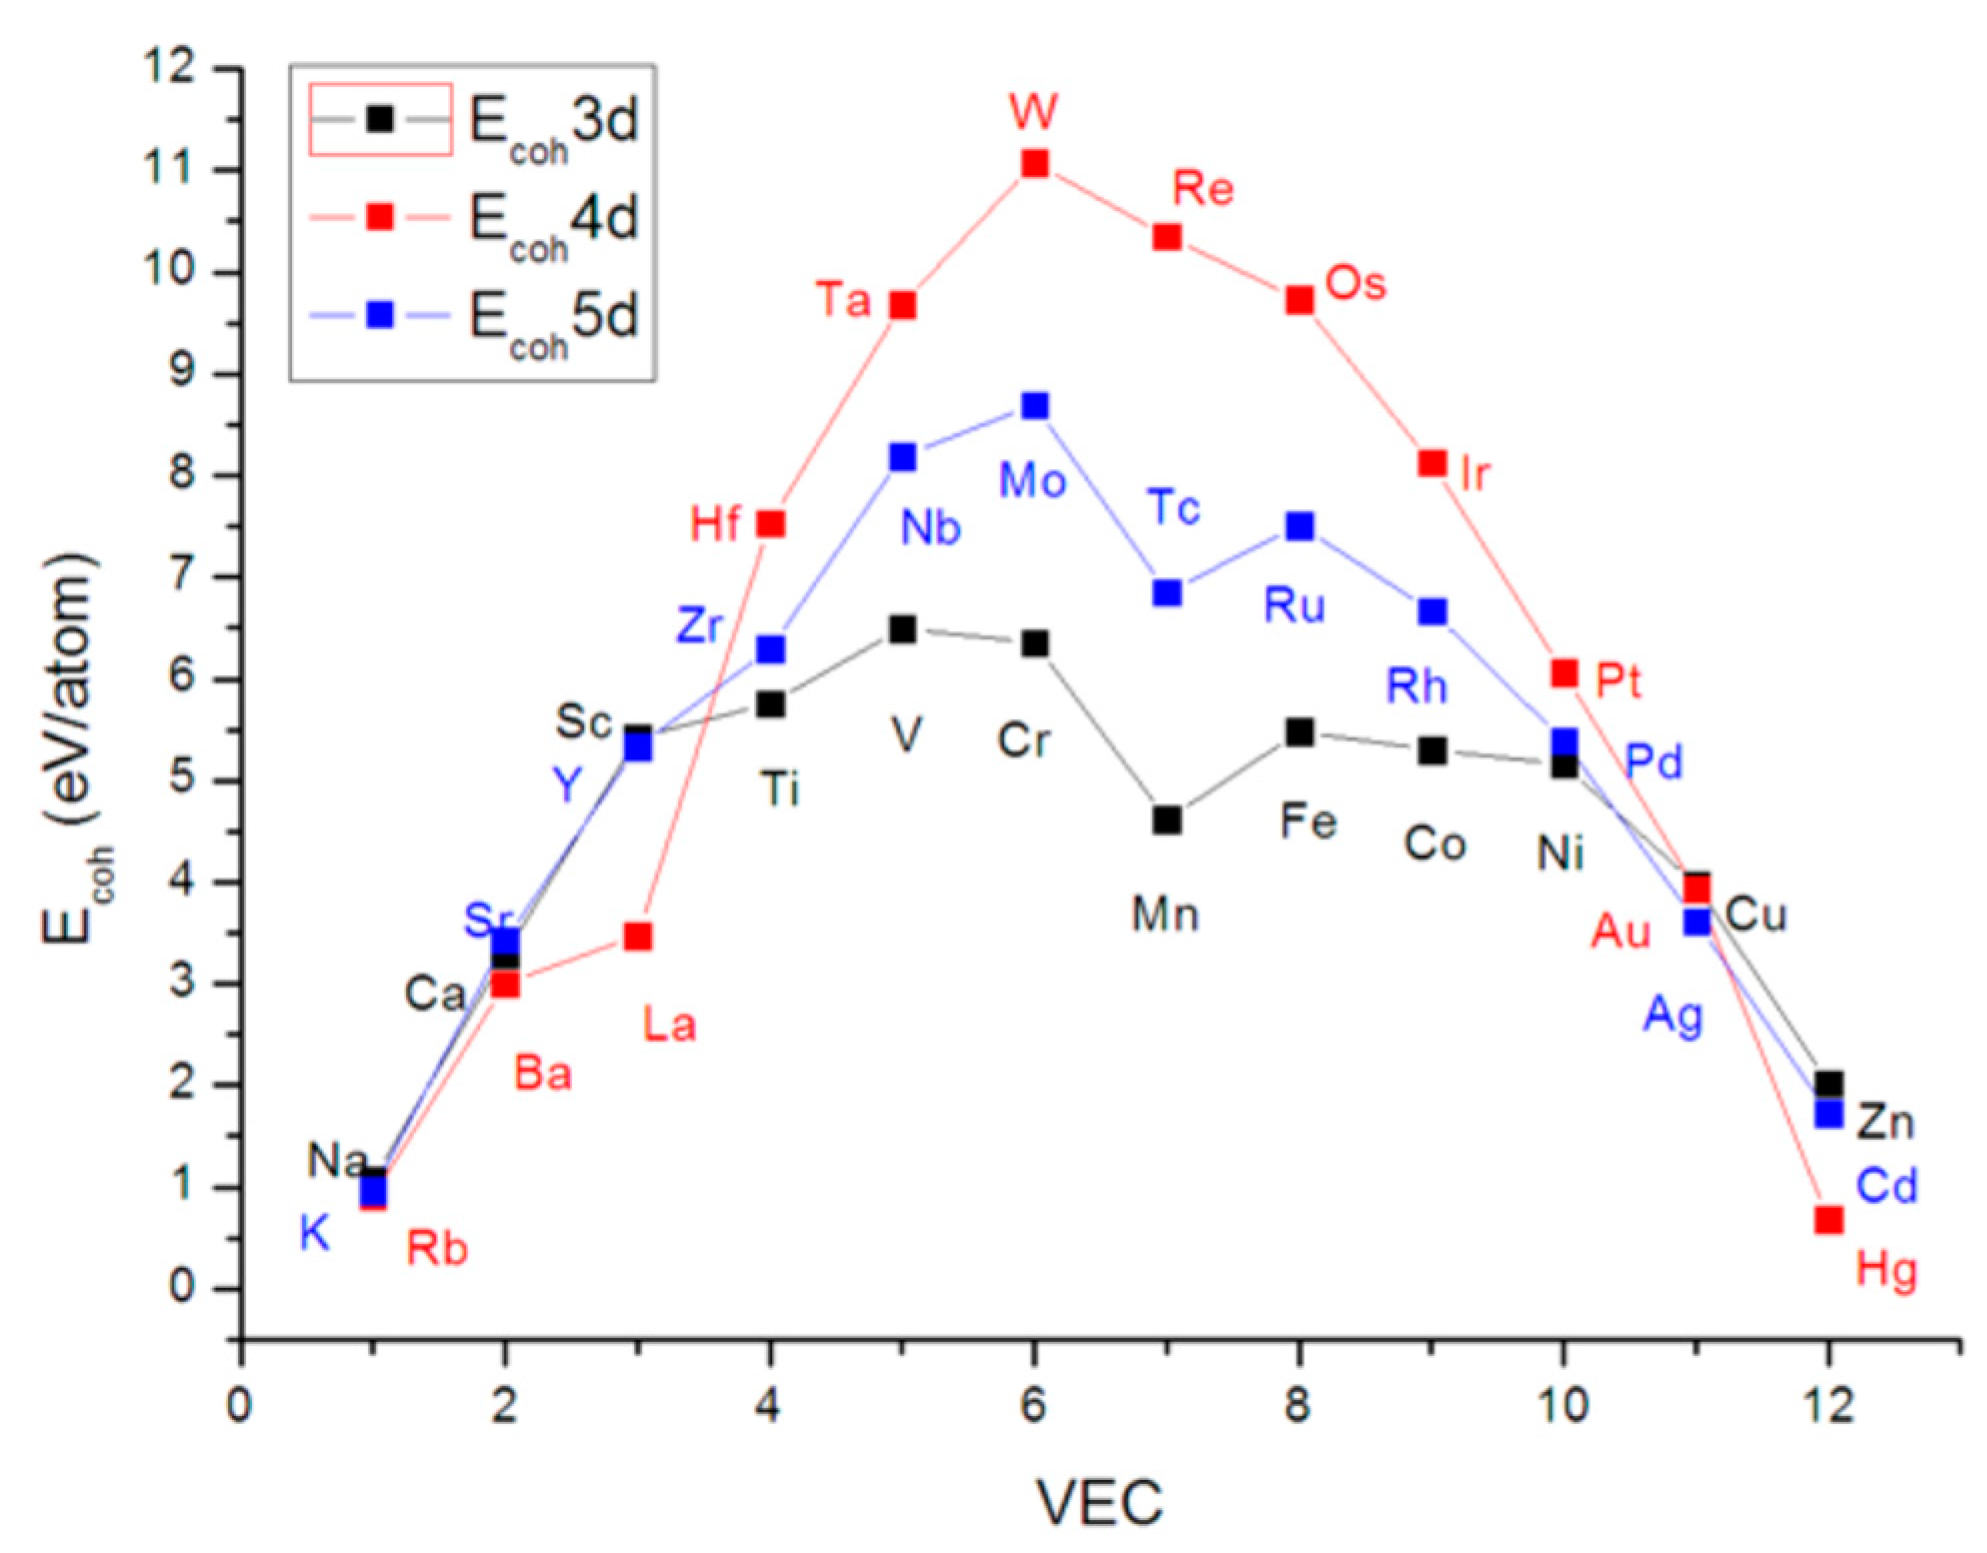
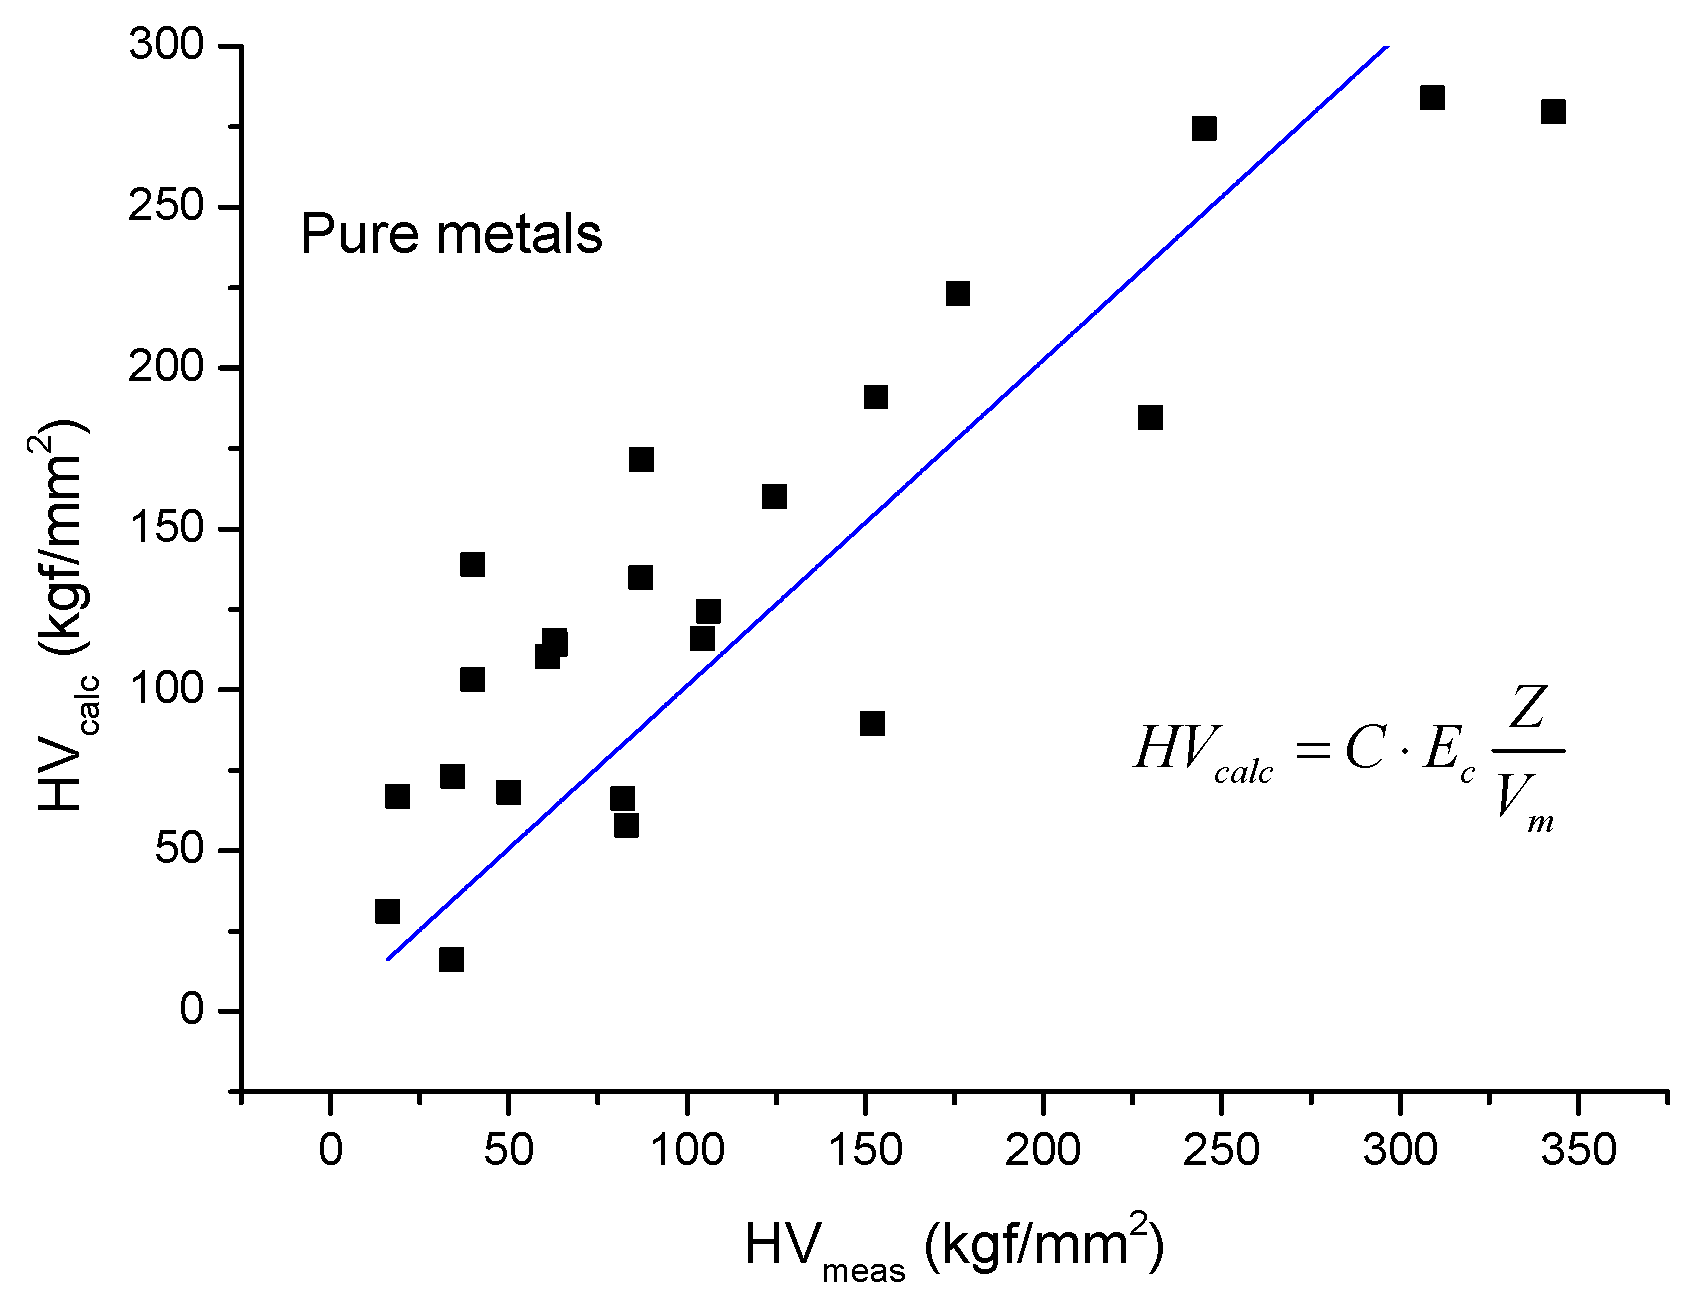
2.3. Estimation of Hardness from Cohesion Energy

Since cohesive energy and hardness showed a similar parabolic dependence on VEC, it is obvious that we should look for a formula to express hardness as a function of cohesive energy. With the help of dimensional analysis, we suggest that HV is proportional to cohesion energy multiplied by electron density, n = Z/Vm, where Z is the metallic valence and Vm is the molar volume. In this way, beside the unpaired d electrons, the sp electrons are also taken into account in determining hardness; so, we propose the following expression:
H V c a l c = C E c Z V m ,
where C is a linear fitted parameter, a constant to be determined; Z is the valence; Ec is in kJ/mol; and Vm is in cm3; then the unit of HV calc is in GPa.
We have found a rather good correlation between the calculated and measured values (see Figure 12), although the measured hardness values published in the literature [6] show a large amount of scatter. Unfortunately, the Ec and Z values also show significant scatter in the literature, this is why we are working on a review paper on the valence electron number and the related electron density values published in the literature. Here, we applied the Ec values published by George Kaptay [24] and the molar volume calculated from the atomic mass (A) and density ρ (Vm = A/ρ) and the Z calculated using the Miedema formula from bulk moduli:
n = 10 2 × 6.748 × B V m Z = n V w s = n × 1.666 × V m .
A normalizing factor C = 1/(100*2.6) adjusts the values to GPa. Finally, the calculated values are obtained in kgf/mm2 by multiplying by 100, because 1 GPa = 100 kgf/mm2. For high-entropy alloys, all three parameters (Ec, Z, and Vm) can be calculated as a weighted average of the elemental values. Equation (8) permits estimation of the low bound for hardness of any single-phase alloy.

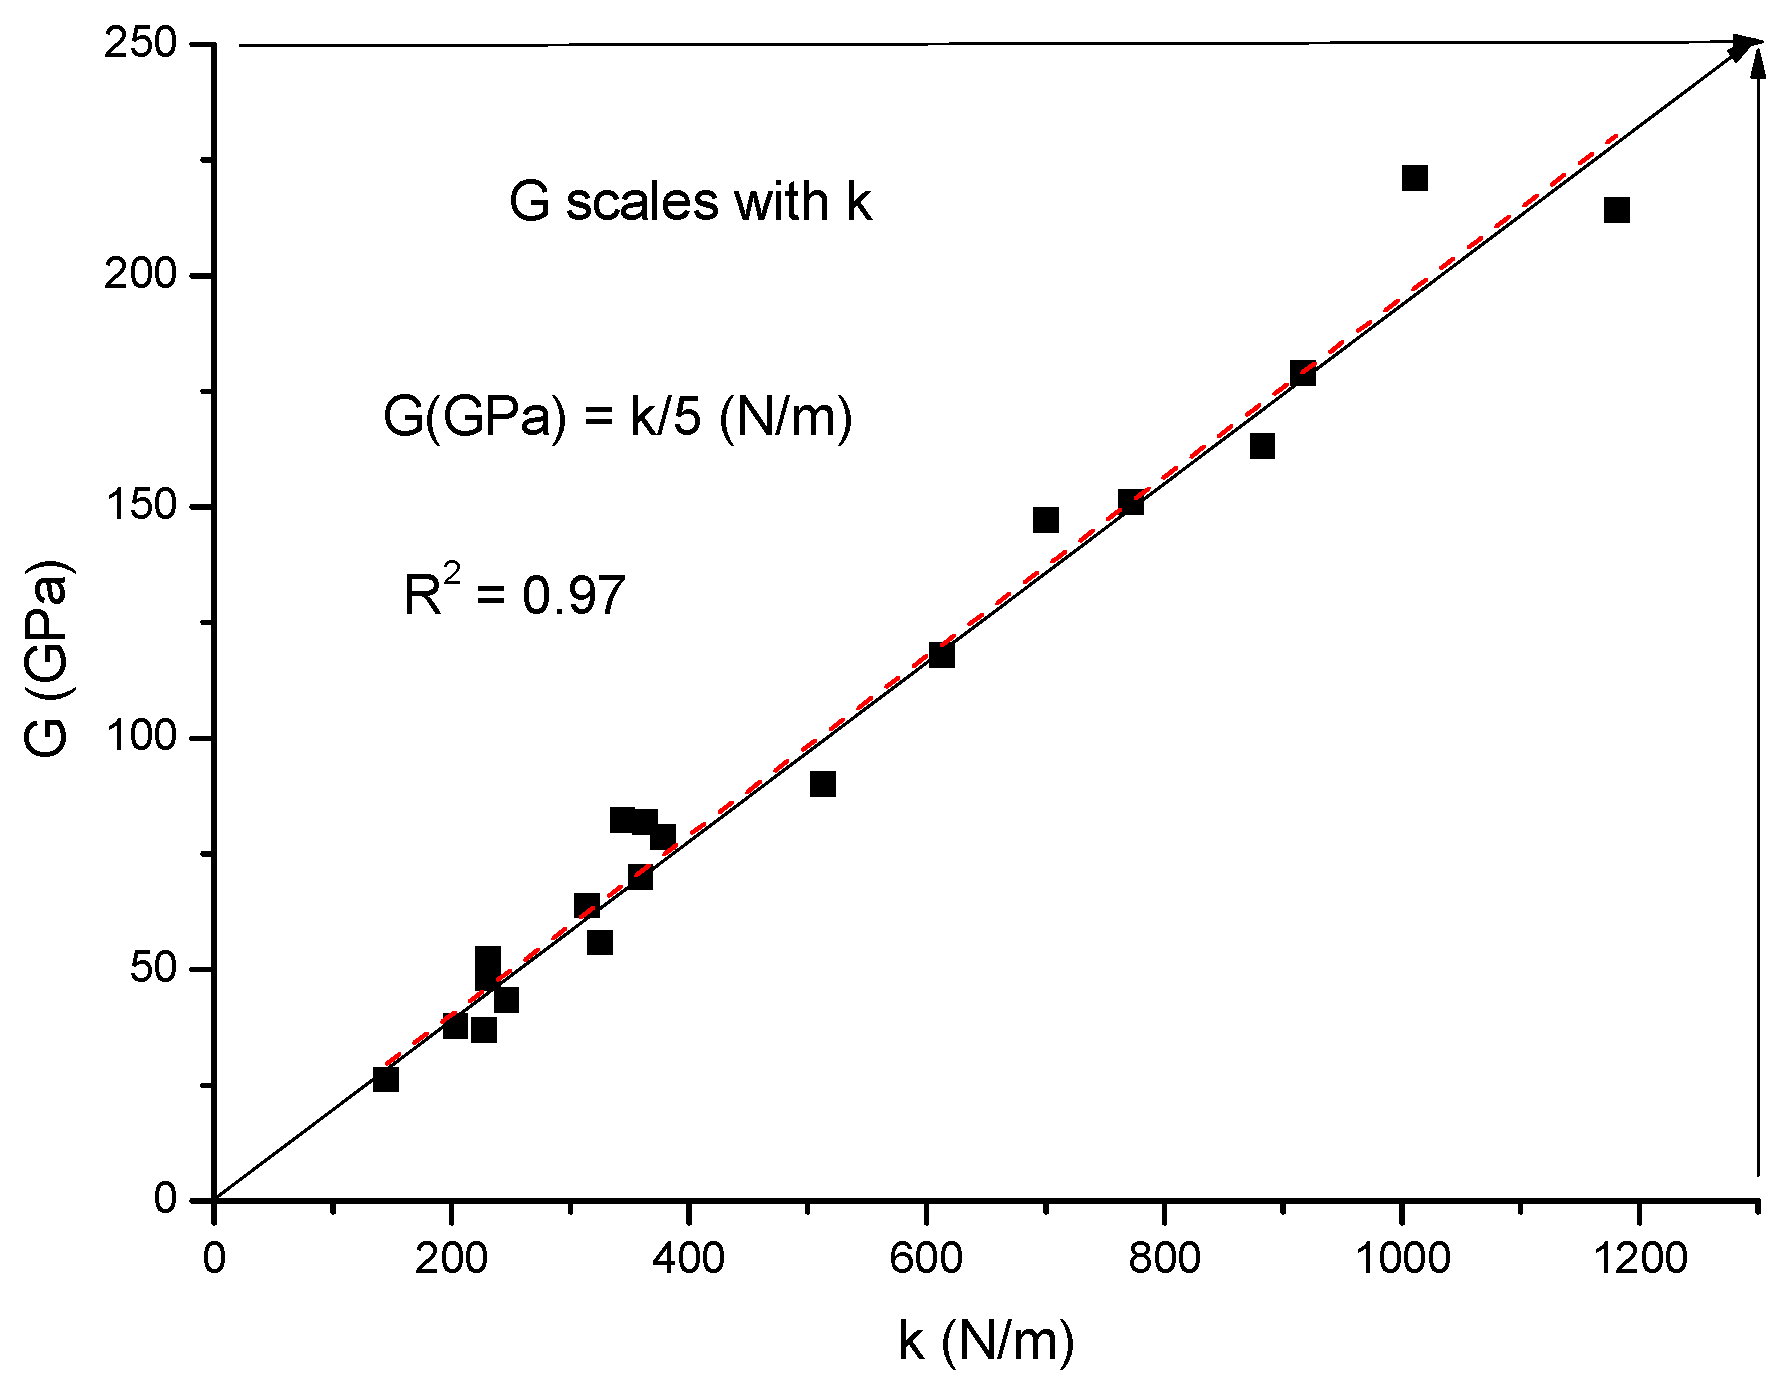
2.4. Estimation of Hardness from Elastic Moduli

Our Formula (8) is a good contribution to the literature [25,26], where various correlations between hardness (HV) and different elastic moduli (bulk, B, shear, G, and elastic, E) or a combination of them have been published. The correlation strongly depends on the type of atomic bonding. In the case of covalent bonding, the correlation is closer than in the case of metallic bonding. For covalent bonding, the following correlations have been found [25]:
B = 10.38 × HV
E = 16.48 × HV
G = 6.78 × HV
In the case of metallic bonding the correlation of hardness to bulk and Young’s modulus is loose. The best correlation is obtained with the shear modulus, G, which can be understood by the creation and motion of dislocation which are facilitated by shear deformation rather than by volume change. In a recent publication by us [6], this relationship was deduced and tested.
HV = 0.0167 × G
Nevertheless, in the literature one can find many correlations, and it is from there that we have selected the following:
From [26]:
H = 0.1475 × G H = 0.0607 × E
From [27]:
H = 0.1769 × G 2.899
From [28]:
H = 0.0635 × E
From [29]:
H V = G B E 6 1 2 ν 1 + ν   or   H = ( 1 2 ν ) B 6 ( 1 + ν )
H = 2 ( k 2 G ) 0.585 3 ; k = G / B
Formulas (8) and (11) look completely different, but we will show that both depend on the atomic radius (half of the neighboring distance) as, 1/R4, and from the metallic valence as Z2. Actually, all elastic moduli and hardnesses together represent a density of energy (J/m3), which we identify with the density of bonding energy. As long as the main energy contribution is electrostatic, energy is proportional to 1/R and its density is obtained by dividing it with the atomic volume proportional to R cub; as a result, we obtained the 1/R4 dependence. The numerical factor can be debated, but the power dependence cannot.

2.5. The Estimation of Hardness Using the Electrostatic Energy Density of Metallic Bonding

For the sake of a deeper understanding, we recall here the simple calculation from any textbook on electrostatics. We imagine the metal as a regular arrangement of positively charged ions Z, which are neutralized and held together by a common, negatively charged electron sea. The effective shear modulus can be calculated as the second derivative of the total electrostatic energy density:
G e f f = τ γ = α R 2 U t d 2 ,
where τ is the shear stress,
γ is the shear strain;
R is the distance between neighboring ions;
α is a geometric factor that depends on the volume fraction of packing, p;
n is the number of nearest neighbors.
Before applying the shear stress, the electrostatic energy is calculated for a sphere-like situation:
U = 3 2 e 2 Z 2 d 9 10 9 ,
where d = 2 R.
Applying the shear stress, the sphere is deformed to an ellipsoid with the axis:
a = R
b = R(1 − γ/2)
c = R(1 + γ/2)
and the electrostatic energy will be U = 3 4 e 2 Z 2 ( a b c ) 1 / 3 9 10 9 . Dividing this with the atomic volume, we obtain the electrostatic energy density:
U V = 3 4 3 4 π R 3 e 2 Z 2 ( R 3 ( 1 γ 2 / 4 ) ) 1 / 3 )
derivative twice, then by neglecting the gamma quadratic terms, we obtain:
G e f f = 3 32 π e 2 Z 2 R 4 9 10 9
In addition to this back-of-an-envelope calculation, much more serious calculations were also carried out; all the more so because of the astrophysical importance of determining the G of the crust of neutron stars.
For such a Coulomb lattice, the elastic constants c′ and c44 were calculated by (Baiko [30,31], and using the Voight, Reuss, and Hill approximations [32], the effective shear modulus G is given [32] by
G e f f = 0.3462 n N e 2 Z 2 2 a 9 10 9
where n N = 3 2 4 π R 3 w s is the number density with two atoms/cell and where a is the length of the side of the cubic cell containing two atoms. a = 2Rm, where Rm is the metallic radius, nN is the number density of the atoms, Z is the valence number of the positive ions, and e is the elementary charge. The factor 9 × 10⁹ appears because we calculate in SI and the result for G is in GPa. In a BCC lattice, Rm = 0.876 × Rws. Inserting the numerical factors after some algebra, we obtain a formula which depends on two tabulated properties only, the valence Z and the metallic radius, Rm, which are easily accessible in [7] and at www.knowledgedoor.com, accessed on 20 December 2024:
G = 14 Z 2 R m 4 ( GPa ) ,
where R is in Å and Z is the valence.
Combining Equation (23) with Equation (11) one obtains the hardness of pure metals as a function of two parameters only: Z and Rm:
H = 0.234 Z 2 R m 4 ( GPa )

2.6. Estimation of Hardness Based on Selected Atomic Radius and Metallic Valence Data

Finally, we show that only two parameters are sufficient to estimate the hardness: the atomic radius and the cohesion-based valence. In Formula (24), there are indeed only two parameters, without a third fitting parameter, yet the estimation of the hardness is made difficult by the fact that there are a great many atomic radii and valence tables in the literature and our task now is to select the most suitable ones. For this purpose, we introduce a reference hardness (a norm) for each metal separately, with the help of which we “normalize” the hardness data of the different metals. The reference value is obtained from Formula (24) by keeping the atomic radius of the metal in question, but taking the valence as Z = 1
In Figure 13, we represented the reference values which scatter around 6.5 kgf/mm2.
The largest deviations are given by the metals with the smallest (Be) and the largest (Ca) atomic radii. It is clear that the variation in hardness from element to element is caused not by the atomic radius but by the variation in valence. Table 1 summarizes the most commonly used R and Z values for the most common metals.
We need not spend much time discussing the atomic radii, because the radii data collected in the four columns differ little from each other. We have chosen the Goldsmidt data which is obtained after a correction of tabulated atomic radii to the value they would have in a close-packed structure with 12-fold coordination [33].
Before starting the calculations, we make a short compendium of the valence parameters.
Concerning the valence, there are many tables, all showing great differences. In chemistry, the nominal valence is used reflecting an oxidation state. The maximal valency is 8 and is realized, for example, by Osmium in the oxide compound OsO4. Valences given by Trömel [34], show that the d electron of the transition metals could contribute to the valence electrons.
Looking for valence values with more fundamental grounding, we have decided to use the electron density obtainable from ab initio calculations [35]. Conducting calculations for minimizing the electron energy as a function of Wigner–Seitz (WS) radii, one can obtain the numerical value for 4πr2n(r) where r is the WS radii. Using the WS radii, we can determine the electron density, n. Finally, the metallic valence, ZVit, is obtained from this n using the Wigner–Seitz volume instead of the atomic volume, ZVit = nx4π(Rws)3/3.
Rose and Shore [36] have introduced the “bonding valency”, (Zb), which proved to give quite a good description of the binding energy even for transition metals. The tabulated data of Zb can also be found in [37].
We can guess that, if we need to calculate a property related to cohesion, we use the valence derived from the cohesive energy, and if we use the formula related to elastic moduli, we use the ZBM introduced by Miedema, which was calculated based on the bulk modulus. In a recently published article [6], we can find the calculation formulas for the Z-BM (Equation (5) in [6]) and Zcoh (Equation (8) in [6]) column data. We should also mention that the corrected values of the cohesive energy were taken from G. Kaptay’s article [24].
The best correlation between the calculated and measured hardness data is obtained for Zcoh (see Figure 14).
From the reference and measured hardnesses, an effective valence can be calculated, which shows a close correlation with the Zcoh and ZBM data (see Figure 15) but correlates poorly with the other three datasets (ZVit, Zbond, and ZTrö). The explanation is that the hardness is closely related to the cohesive property.

3. Conclusions

-
We have succeeded in interpreting the maximum hardness in the VEC function for single-phase pure metals, amorphous metals, and high-entropy alloys. The maximum is caused by the change in atomic bonds depending on the number of unpaired d electrons. In addition to s-p-type electrons, d-type electrons also participate in the common metallic electron sea and increase the effective valence.
-
We have created formulas for calculating hardness from physical properties that directly depend on the strength of atomic bonds: force constant (Equation (7)), cohesion energy (Equation (8)), and shear modulus (Equation (11)).
-
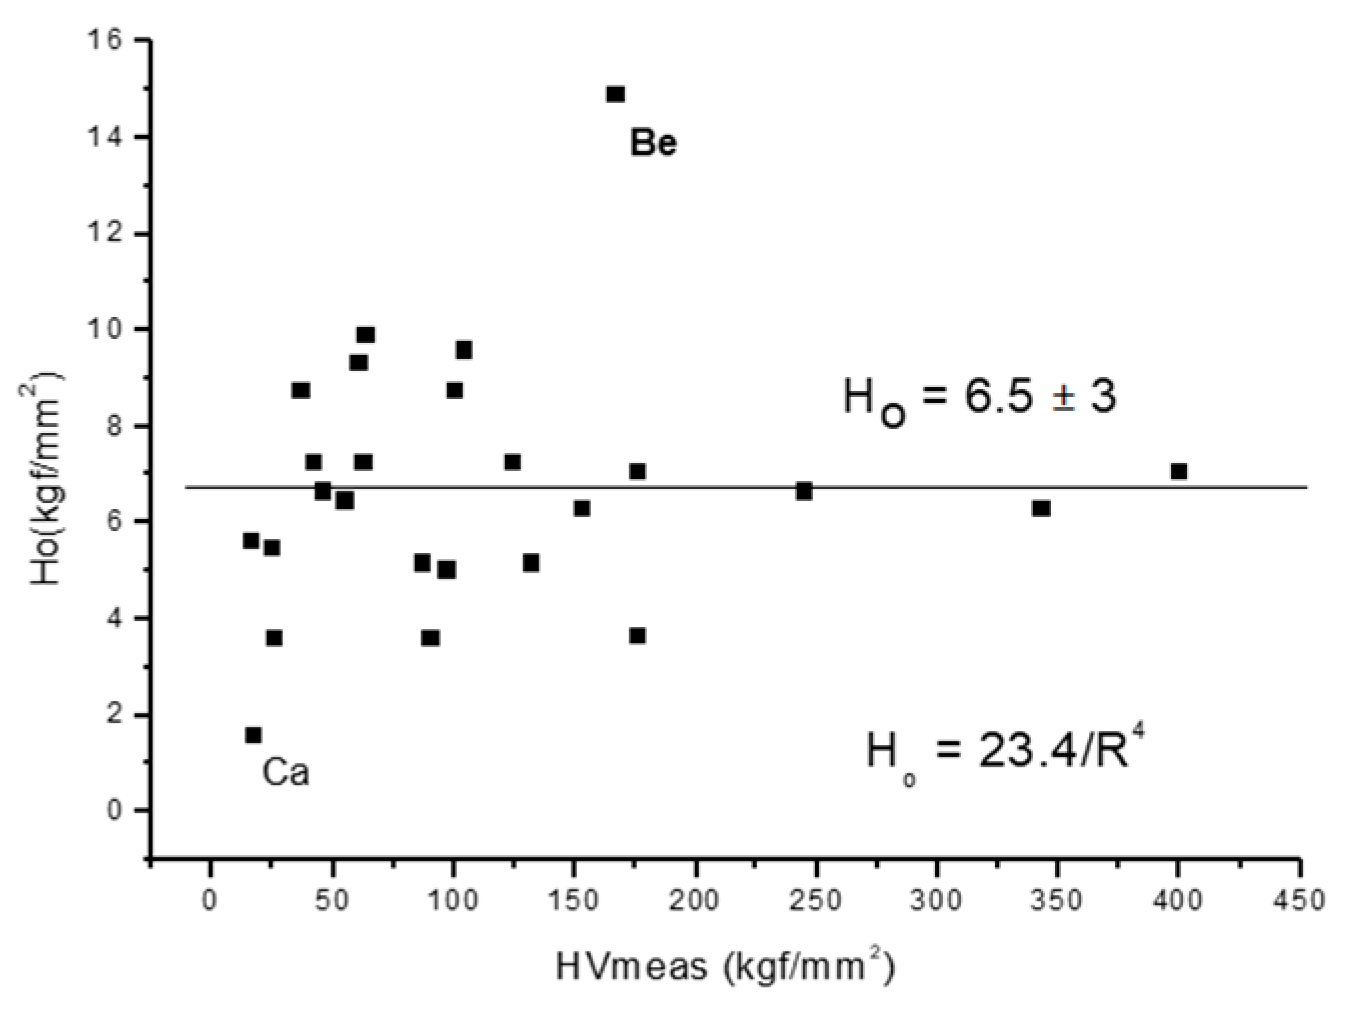
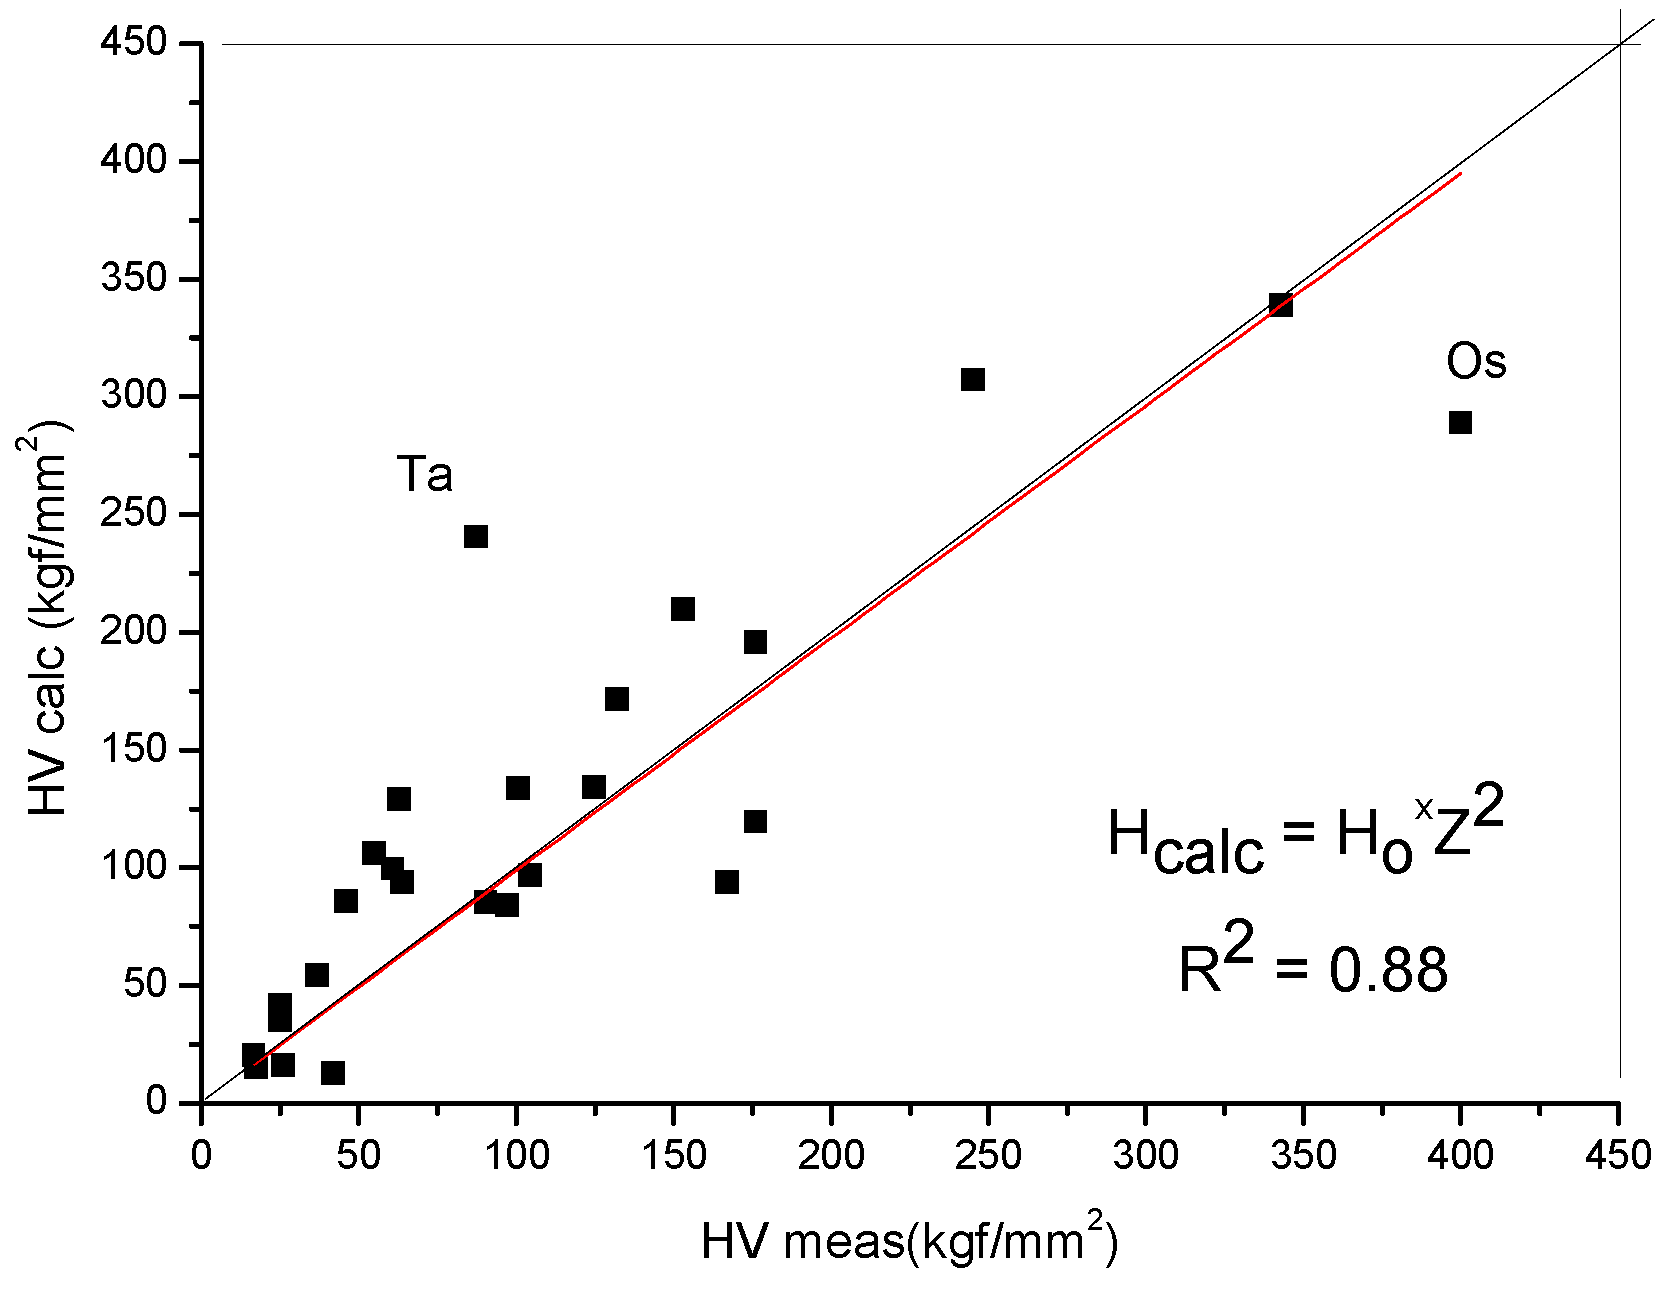
We have reduced all these formulas to a common formula that depends only on two parameters: the atomic radius R and the valence Z:
H = 0.234 Z2/R4
-
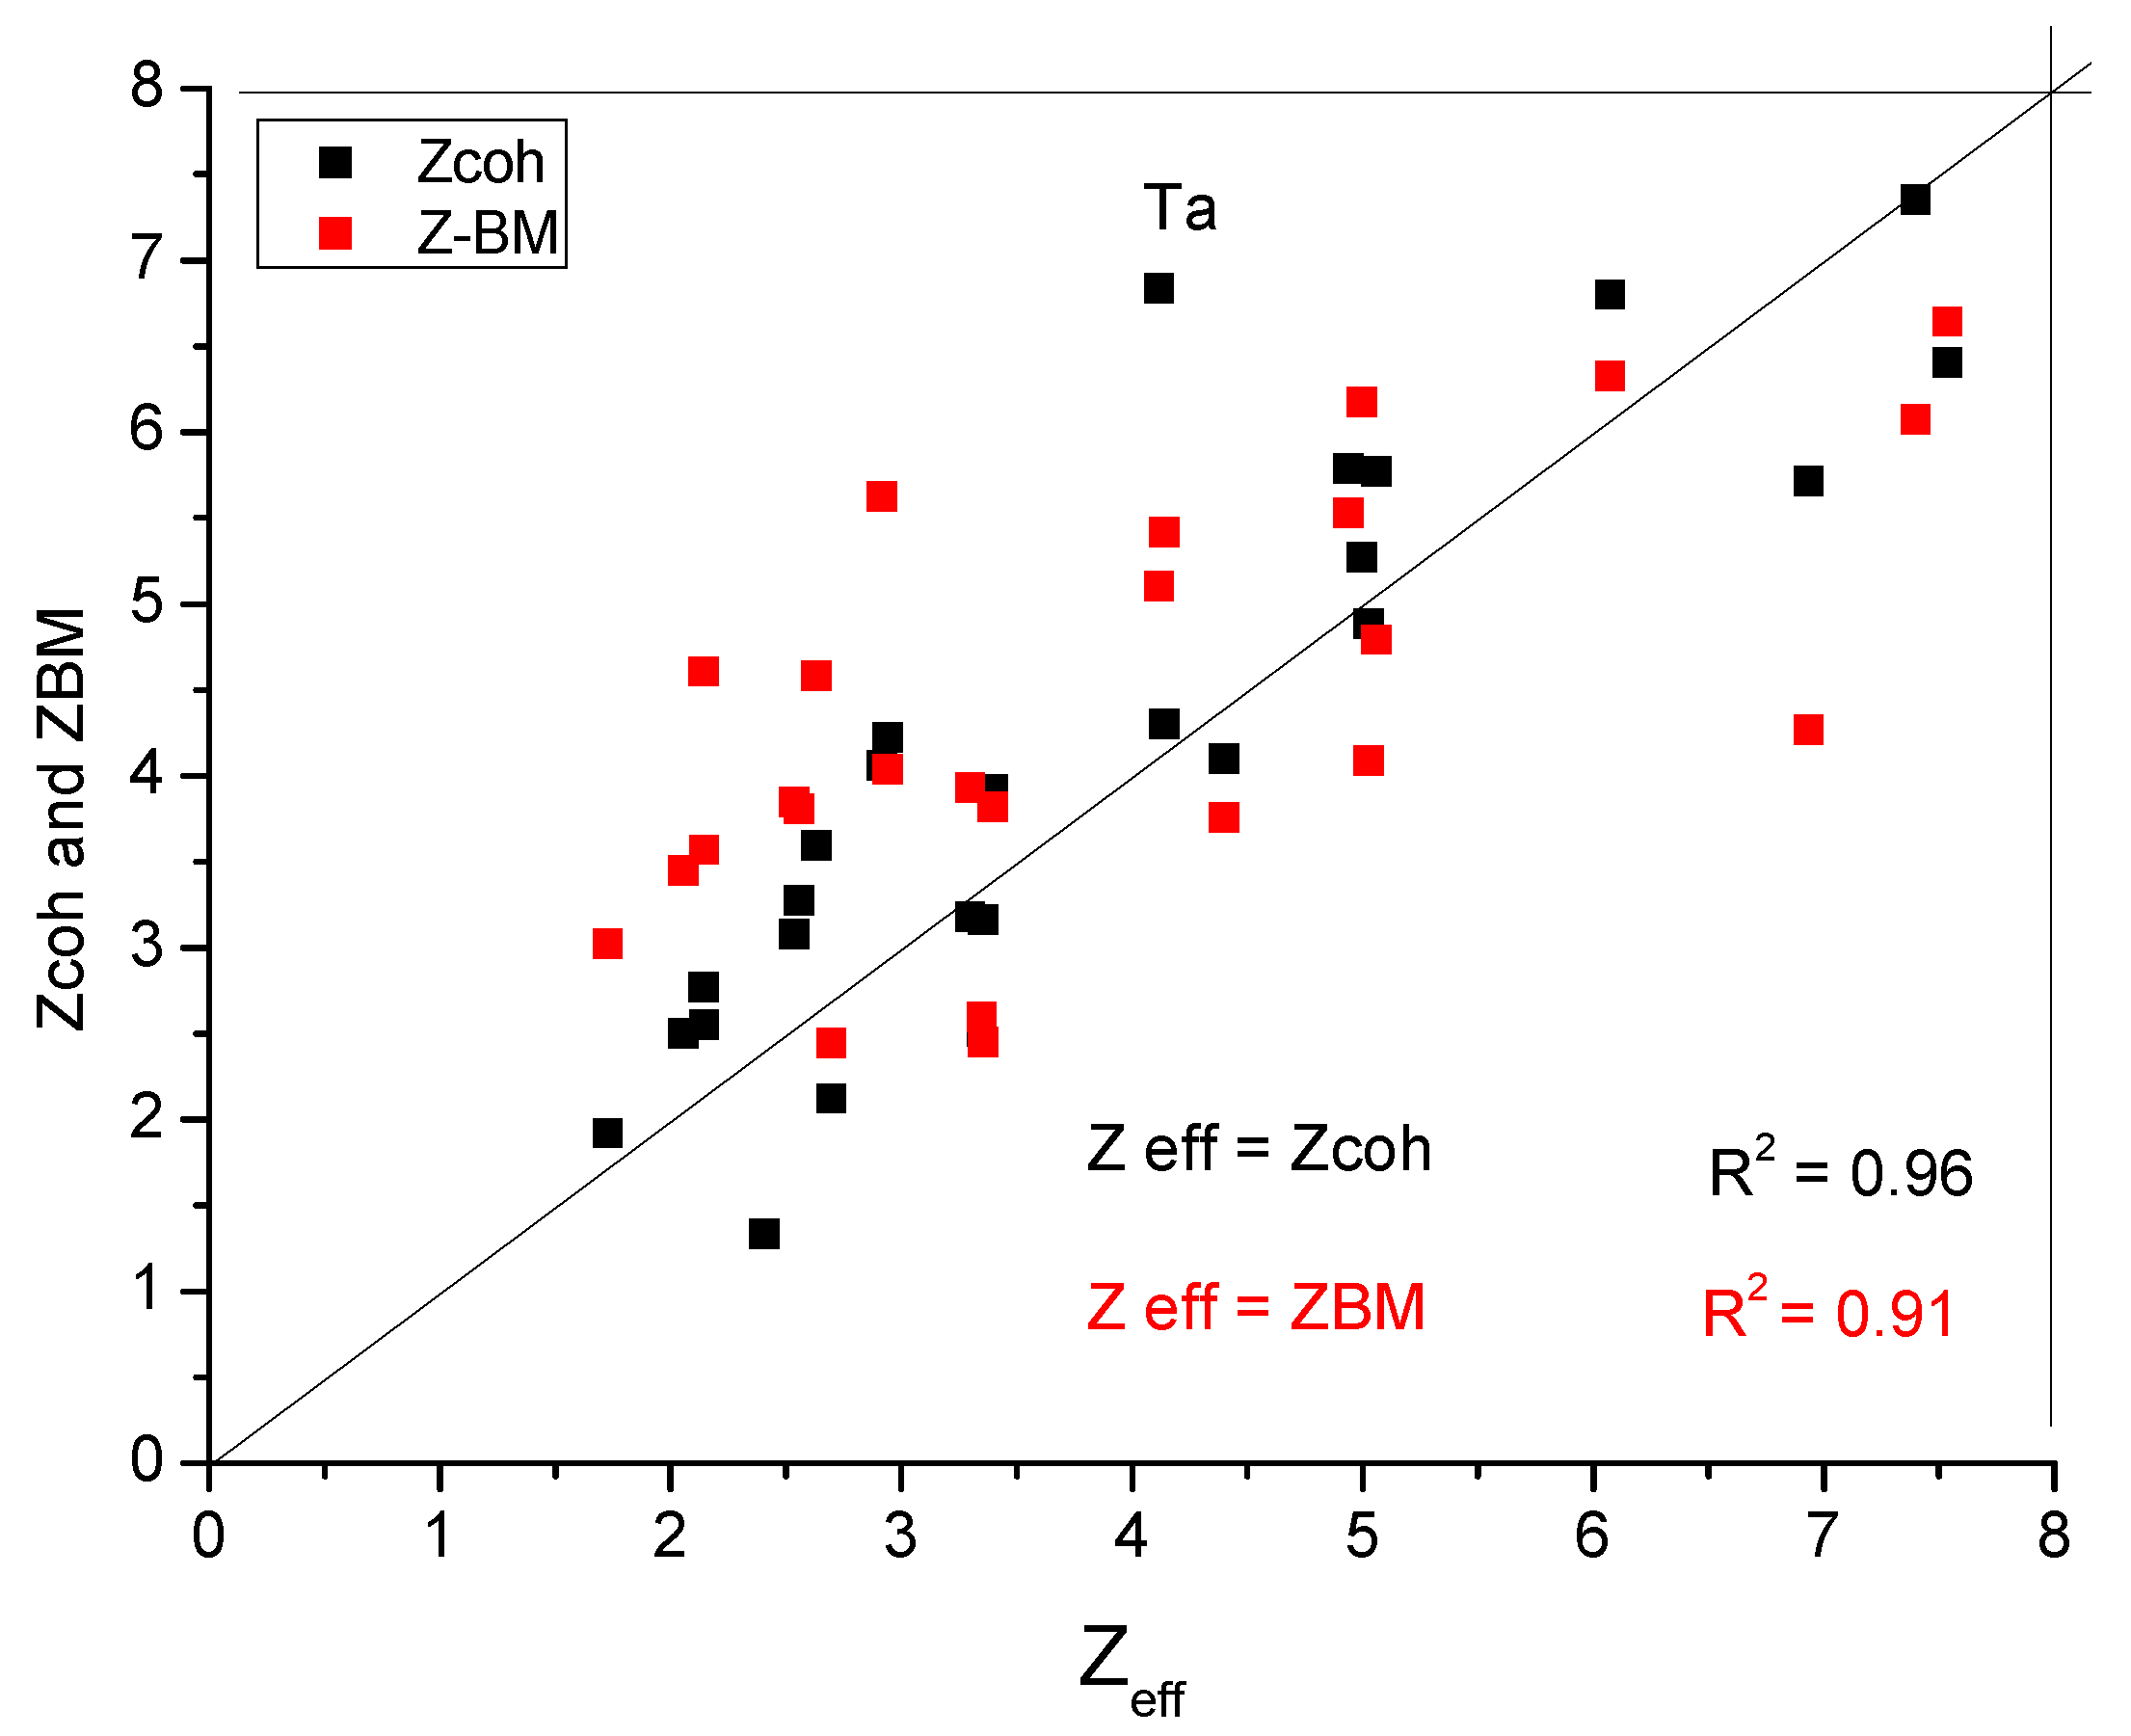
We have considered the possibilities and decided to use the Goldschmidt radius for R and the valence calculated from the cohesive energy for Zcoh.
-
We have introduced the effective valence calculated from the hardness values, which only correlates closely with the valence values that we calculated from the properties that depend on the atomic bond strength: Zcoh (Equation (8) from [6]) and ZBM (Equation (5) from [6]).
-
In the case of alloys, our formula gives a lower bound on the hardness only. It is not suitable for calculating the increase of hardness caused by solid solution, grain size, precipitation, and phase mixture hardnesses.

Author Contributions

O.K.T.: writing—original draft and data curation; L.K.V.: conceptualization, writing—original draft, and review and editing; N.Q.C.: formal analysis and writing—review editing; L.V.: supervision, validation and writing—editing. All authors have read and agreed to the published version of the manuscript.

Funding

This research was supported by the Government of Hungary for support from the Market-driven R&D and Innovation grant (2020-1.1.2-PIACI-KFI-2020-00025).

Data Availability Statement

The data that support the findings of this study are partly taken from the cited references.

Acknowledgments

Thanks to the Government of Hungary for the support from the Market-driven R&D and Innovation grant (2020-1.1.2-PIACI-KFI-2020-00025). This research was funded by Hungarian Scientific Research Fund OTKA, Grant number: 128229.

Conflicts of Interest

The authors declare that the research was conducted in the absence of any commercial or financial relationships that could be construed as potential conflicts of interest.

References

  1. Liu, X.; Wang, H.; Wang, W.; Fu, Z. Simple Method for the Hardness Estimation of Inorganic Crystals by the Bond Valence Model. Inorg. Chem. 2016, 55, 11089–11095. [Google Scholar] [CrossRef]
  2. Soto, G.; Moreno-Armenta, M.G.; Reyes-Serrato, A. The role of valence electron concentration in the cohesive properties of YBxN1−x, YCxN1−x and YNxO1−x compounds. J. Alloys Compd. 2008, 463, 559–563. [Google Scholar] [CrossRef]
  3. Lederer, Y.; Toher, C.; Vecchio, K.S.; Curtarolo, S. The search for high entropy alloys: A high-throughput ab-initio approach. Acta Mater. 2018, 159, 364–383. [Google Scholar] [CrossRef]
  4. Curtarolo, S.; Hart, G.L.W.; Nardelli, M.B.; Mingo, N.; Sanvito, S.; Levy, O. The high-throughput highway to computational materials design. Nat. Mater. 2013, 12, 191–201. [Google Scholar] [CrossRef] [PubMed]
  5. Tian, F.; Varga, L.K.; Chen, N.; Shen, J.; Vitos, L. Empirical design of single phase high-entropy alloys with high hardness. Intermetallics 2015, 58, 1–6. [Google Scholar] [CrossRef]
  6. Temesi, O.K.; Varga, L.K.; Chinh, N.Q.; Vitos, L. Prediction of the Cohesion Energy, Shear Modulus and Hardness of Single-Phase Metals and High-Entropy Alloys. Materials 2024, 17, 2728. [Google Scholar] [CrossRef]
  7. Temesi, O.K.; Varga, L.K.; Chinh, N.Q.; Vitos, L. Ductility Index for Refractory High Entropy Alloys. Crystals 2024, 14, 838. [Google Scholar] [CrossRef]
  8. O’Neill, H. Hardness Measurements of Metals and Alloys; Chapman and Hall: London, UK, 1967; p. 192. [Google Scholar]
  9. Stubičar, M.; Tonejc, A.; Radić, N. Microhardness characterization of Al–W thin films. Vacuum 2001, 61, 309–316. [Google Scholar] [CrossRef]
  10. Cho, K.; Schuh, C.A. W-based amorphous phase stable to high temperatures. Acta Mater. 2015, 85, 331–342. [Google Scholar] [CrossRef]
  11. Fazakas, E.; Varga, L.K. Glass forming ability (GFA) of Cu and Al-based alloys by melt quenching. J. Mater. Sci. Technol. 2007, 15, 211–224. [Google Scholar]
  12. Han, F.F.; Inoue, A.; Han, Y.; Kong, F.L.; Zhu, S.L.; Shalaan, E.; Al-Marzouki, F.; Greer, A.L. Novel Heating-Induced Reversion during Crystallization of Al-based Glassy Alloys. Sci. Rep. 2017, 7, 46113. [Google Scholar] [CrossRef] [PubMed]
  13. Fazakas, E.; Russew, K.; Stojanova, L.; Csanady, A.; Varga, L.K. Al85Ni9Ta6, a refractory Al-rich ternary alloy glass and its crystallization kinetics. J. Phys. Conf. Ser. 2009, 144, 012100. [Google Scholar] [CrossRef]
  14. Fazakas, E.; Varga, L.K. Al-U based amorphous alloys obtained by melt spinning method. Rev. Adv. Mater. Sci. 2008, 18, 494–496. [Google Scholar]
  15. Inoue, A.; Ohtera, K.; Tsai, A.; Masumoto, T. Aluminum-based amorphous alloys with tensile strength above 980 MPa (100 kg/mm2). Jpn. J. Appl. Phys. 1988, 27, L479. [Google Scholar] [CrossRef]
  16. Inoue, A. Amorphous, nanocrystalline and nanocrystalline alloys in Al-based systems. Prog. Mater. Sci. 1998, 43, 365–520. [Google Scholar] [CrossRef]
  17. Inoue, A.; Ohtera, K.; Tsai, A.P.; Masumoto, T. New amorphous alloys with good ductility in Al-Y-M and Al-La-M (M=Fe, Co, Ni or Cu) systems. Jpn. J. Appl. Phys. 1998, 27, L280. [Google Scholar] [CrossRef]
  18. Inoue, A.; Kawamura, Y.; Kinura, H.M.; Mano, H. Nanocrystalline Al-based bulk alloys with high strength above 1000 MPa. Mater. Sci. Forum 2001, 360–362, 129–136. [Google Scholar] [CrossRef]
  19. Inoue, A.; Sobu, S.; Louzguine, D.V.; Kimura, H.; Sasamori, K. Ultrahigh strength Al-based amorphous alloys containing Scandium. J. Mater. Res. 2004, 19, 1539–1543. [Google Scholar] [CrossRef]
  20. Angell, C.A. Formation of Glasses from Liquids and Biopolymers. Science 1995, 267, 1924–1935. [Google Scholar] [CrossRef]
  21. Yeh, J.-W.; Chen, S.K.; Lin, S.-J.; Gan, J.-Y.; Chin, T.-S.; Shun, T.-T.; Tsau, C.-H.; Chang, S.-Y. Nanostructured high-entropy alloys with multiple principal elements: Novel alloy design concepts and outcomes. Adv. Eng. Mater. 2004, 6, 299–303. [Google Scholar] [CrossRef]
  22. Lee, J.Y.; Punkkinen, M.P.J.; Schönecker, S.; Nabi, Z.; Kádas, K.; Zólyomi, V.; Koo, Y.M.; Hu, Q.M.; Ahuja, R.; Johansson, B.; et al. The surface energy and stress of metals. Surf. Sci. 2018, 674, 51–68. [Google Scholar] [CrossRef]
  23. Deus, P.; Schneider, H.A. Estimation of the Debye temperature of diamond-like semiconducting compounds from bulk moduli and microhardness. Cryst. Res. Technol. 1983, 18, 491–500. [Google Scholar] [CrossRef]
  24. Kaptay, G.; Csicsovszki, G.; Yaghmaee, M.S. An Absolute Scale for the Cohesion Energy of Pure Metals. Mater. Sci. Forum 2003, 414–415, 235–240. [Google Scholar] [CrossRef]
  25. Jiang, X.; Zhao, J.; Jiang, X. Correlation between hardness and elastic moduli of the covalent crystals. Comput. Mater. Sci. 2011, 50, 2287–2290. [Google Scholar] [CrossRef]
  26. Dovale-Farelo, V.; Tavadze, P.; Lang, L.; Bautista-Hernandez, A.; Romero, A.H. Vickers hardness prediction from machine learning methods. Sci. Rep. 2022, 12, 22475. [Google Scholar] [CrossRef] [PubMed]
  27. Teter, D.M. Computational alchemy: The search for new superhard materials. MRS Bull. 1998, 23, 22–27. [Google Scholar] [CrossRef]
  28. Jiang, X.; Zhao, J.; Wu, A.; Bai, Y.; Jiang, X. Mechanical and electronic properties of B12-based ternary crystals of orthorhombic phase. J. Phys. Condens. Matter 2010, 22, 315503. [Google Scholar] [CrossRef] [PubMed]
  29. Miao, N.; Sa, B.; Zhou, J.; Sun, Z. Theoretical investigation on the transition-metal borides with Ta3B4-type structure: A class of hard and refractory materials. Comput. Mater. Sci. 2011, 50, 1559–1566. [Google Scholar] [CrossRef]
  30. Baiko, D.A. Shear modulus of neutron star crust. Mon. Not. R. Astron. Soc. 2011, 416, 22–31. [Google Scholar] [CrossRef]
  31. Baiko, D.A. Shear Modulus of a Coulomb Crystal of Ions: Effects of Ion Motion and Electron Background Polarization. Contrib. Plasma Phys. 2012, 52, 157–160. [Google Scholar] [CrossRef]
  32. Kobyakov, D.; Pethick, C.J. Elastic properties of polycrystalline dense matter. Mon. Not. R. Astron. Soc. Lett. 2015, 449, L110–L112. [Google Scholar] [CrossRef]
  33. Goldschmidt, V.M. Die Gesetze der Krystallochemie. Sci. Nat. 1926, 14, 477–485. [Google Scholar] [CrossRef]
  34. Trömel, M.; Hübner, S. Metallradien und Ionenradien. Z. Krist. Cryst. Mater. 2000, 215, 429–432. [Google Scholar] [CrossRef]
  35. Vitos, L. Computational Quantum Mechanics for Materials Engineers: The EMTO Method and Applications; Engineering Materials and Processes Series; Springer: London, UK, 2007; ISBN 978-1-84628-950-7. [Google Scholar]
  36. Rose, J.H.; Shore, H.B. Uniform electron gas for transition metals: Input parameters. Phys. Rev. B 1993, 48, 18254–18256. [Google Scholar] [CrossRef]
  37. Wojciechowski, K.F. Bulk properties of the stabilized uniform ‘metallic’ electron gas in transition metals. Phys. B Condens. Matter 1996, 229, 55–62. [Google Scholar] [CrossRef]
Figure 1. HV versus VEC for pure metals.
Crystals 15 00156 g001
Figure 2. HV versus VEC for amorphous alloys. In the insert you can find the main componenof the amorphous alloy.
Crystals 15 00156 g002
Figure 3. HV versus VEC for HEAs with different crystallographic structures.
Crystals 15 00156 g003
Figure 4. Experimental cohesion energy of the resultant cohesion energy for transition metals.
Crystals 15 00156 g004
Figure 5. Schematic of density of state.
Crystals 15 00156 g005
Figure 6. Melting point vs. VEC.
Crystals 15 00156 g006
Figure 7. Surface energy vs. VEC.
Crystals 15 00156 g007
Figure 8. Bulk modulus vs. VEC.
Crystals 15 00156 g008
Figure 9. Elastic modulus vs. VEC.
Crystals 15 00156 g009
Figure 10. Shear modulus vs. VEC.
Crystals 15 00156 g010
Figure 11. The force constant scales with the shear modulus.The linear fit coincide with the scaled line.
Crystals 15 00156 g011
Figure 12. The correlation of the measured and calculated Vickers hardness based on Formula (8).
Crystals 15 00156 g012
Figure 13. The reference hardness as a function of the measured one.
Crystals 15 00156 g013
Figure 14. The correlation of the measured and cohesion-based valency-calculated hardness.The linear fitting line coincide with the first bisector indicating a good correlation.
Crystals 15 00156 g014
Figure 15. The effective valency Zeff is in good correlation with the cohesion and elastic modulus- based valencies.
Crystals 15 00156 g015
Table 1. More common atomic radii and valence values.
MetalHVR-mR-GR-TakR-VitZeffZcohZ-VitZ-TröZ-BondZ-BM
--kgf/mm2Å,Å,Å,Å,----
Li--1.5221.521.521.45--0.99131.1181.0001.0901.439
Be1671.1431.121.131.053.3512.5122.0412.0002.0802.593
Na--1.8551.861.861.8--0.99191.1041.0001.1101.478
Mg261.6031.61.61.52.6982.1232.0972.0002.0802.445
Al16.71.4311.431.431.251.7281.9192.9283.0002.7603.022
K--2.3052.272.262.2--1.0981.1361.0001.2101.453
Ca17.51.9691.971.971.83.3563.1582.1672.0002.2202.450
Sc--1.6571.621.651.6--4.2202.8273.0002.8503.210
Ti971.4741.471.471.44.4004.0973.1373.5103.2003.757
V62.81.3111.341.321.352.9424.2183.4015.0003.4504.034
Cr100.61.2521.281.251.43.3973.9193.5016.0003.5303.821
Mn--1.2581.271.121.4--2.7734.4133.0003.4102.929
Fe60.81.2411.261.241.42.5593.2773.2164.0003.3303.808
Co104.31.2511.251.251.353.2993.1773.0734.0003.0303.931
Ni63.81.2451.241.251.352.5393.0802.8884.0002.8303.847
Cu36.91.2781.281.281.352.0572.4992.5583.0002.5703.447
Zn421.3321.341.331.352.4061.3342.6752.0002.400--
Y--1.8231.81.821.8--4.6553.0423.0003.2103.199
Zr90.31.6151.61.621.555.0294.8873.6353.5903.7504.086
Nb1321.4291.461.431.455.0635.7724.0875.0004.1404.793
Mo1531.361.391.361.454.9405.7874.3896.0004.4205.527
Tc--1.3711.361.351.35----4.3324.9004.2405.663
Ru--1.3441.341.331.3--4.8604.1776.0004.0505.555
Rh124.61.3451.341.341.354.1434.3013.8044.8503.6705.414
Pd46.11.3741.371.371.42.6343.5943.2144.0003.1504.581
Ag25.11.4451.441.441.62.1482.5542.6653.0002.7003.570
Hf1761.5951.591.61.556.9335.7143.9863.7503.9704.263
Ta87.31.431.461.431.454.1176.8384.3995.0004.5105.100
W3431.371.391.371.357.3977.3534.8536.0004.7906.074
Re2451.3841.371.371.356.0736.8004.9396.0004.7906.322
Os4141.361.351.351.37.5356.4044.9076.0004.7206.645
Ir1761.3171.351.351.354.9985.2714.5985.0004.3606.174
Pt54.91.3871.381.391.352.9174.0573.9894.0003.9005.622
Au251.4411.441.441.352.1432.7703.2893.0003.2604.606
Pb--1.751.81.761.8--1.5542.6394.0002.350--
Disclaimer/Publisher’s Note: The statements, opinions and data contained in all publications are solely those of the individual author(s) and contributor(s) and not of MDPI and/or the editor(s). MDPI and/or the editor(s) disclaim responsibility for any injury to people or property resulting from any ideas, methods, instructions or products referred to in the content.

