

Hydrothermal Synthesis of Lithium Lanthanum Titanate

 ,
,  ,
,
Abstract
1. Introduction
2. Materials and Methods
2.1. Preparation of the LLTO Perovskite
2.2. Investigation Techniques
3. Results
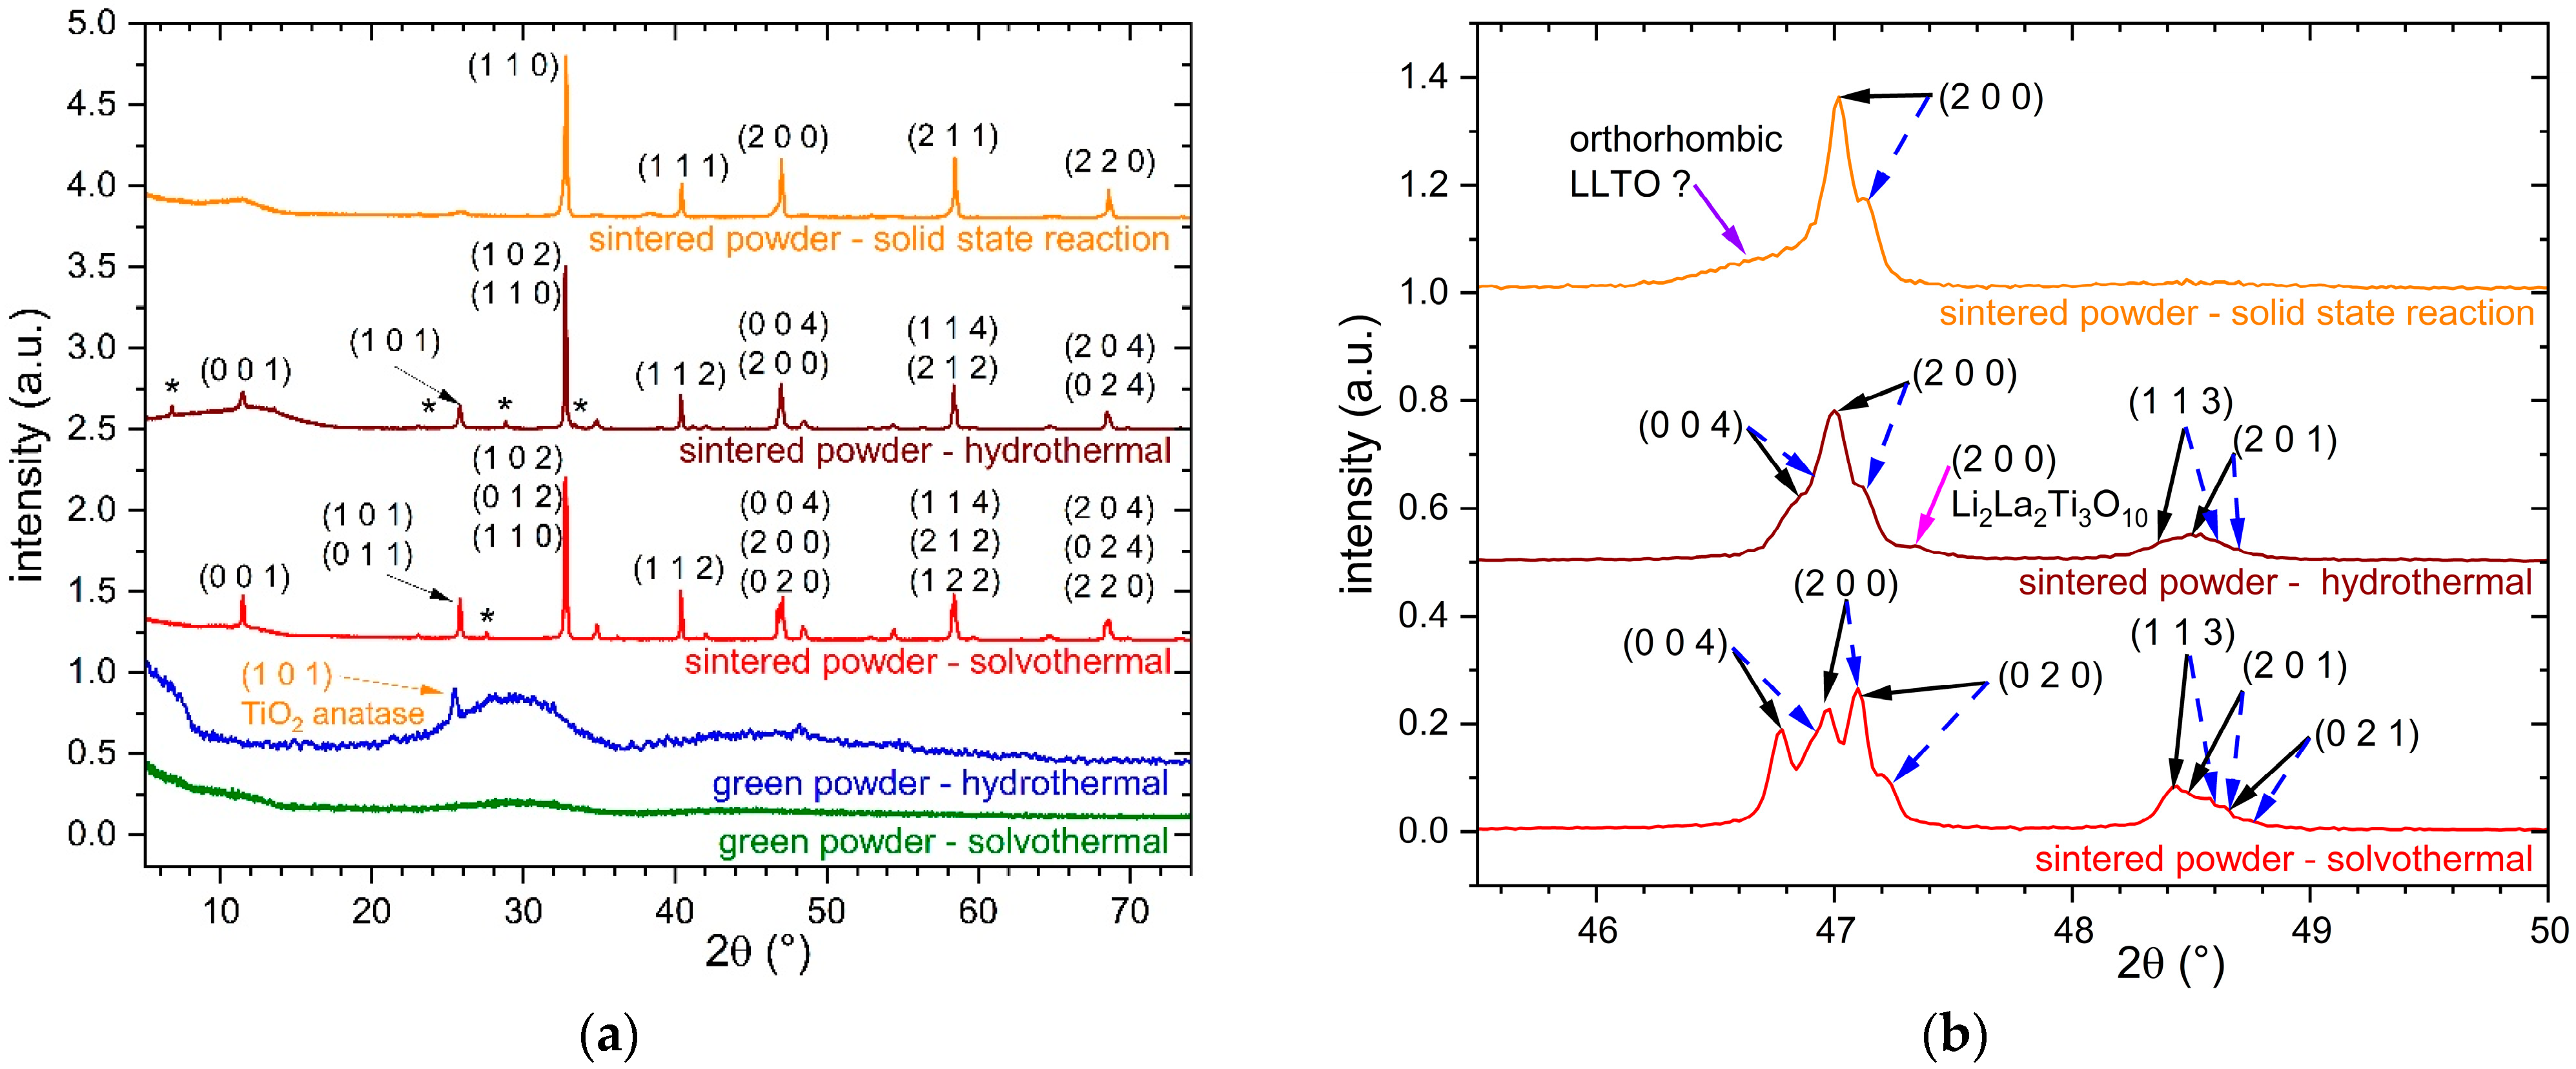
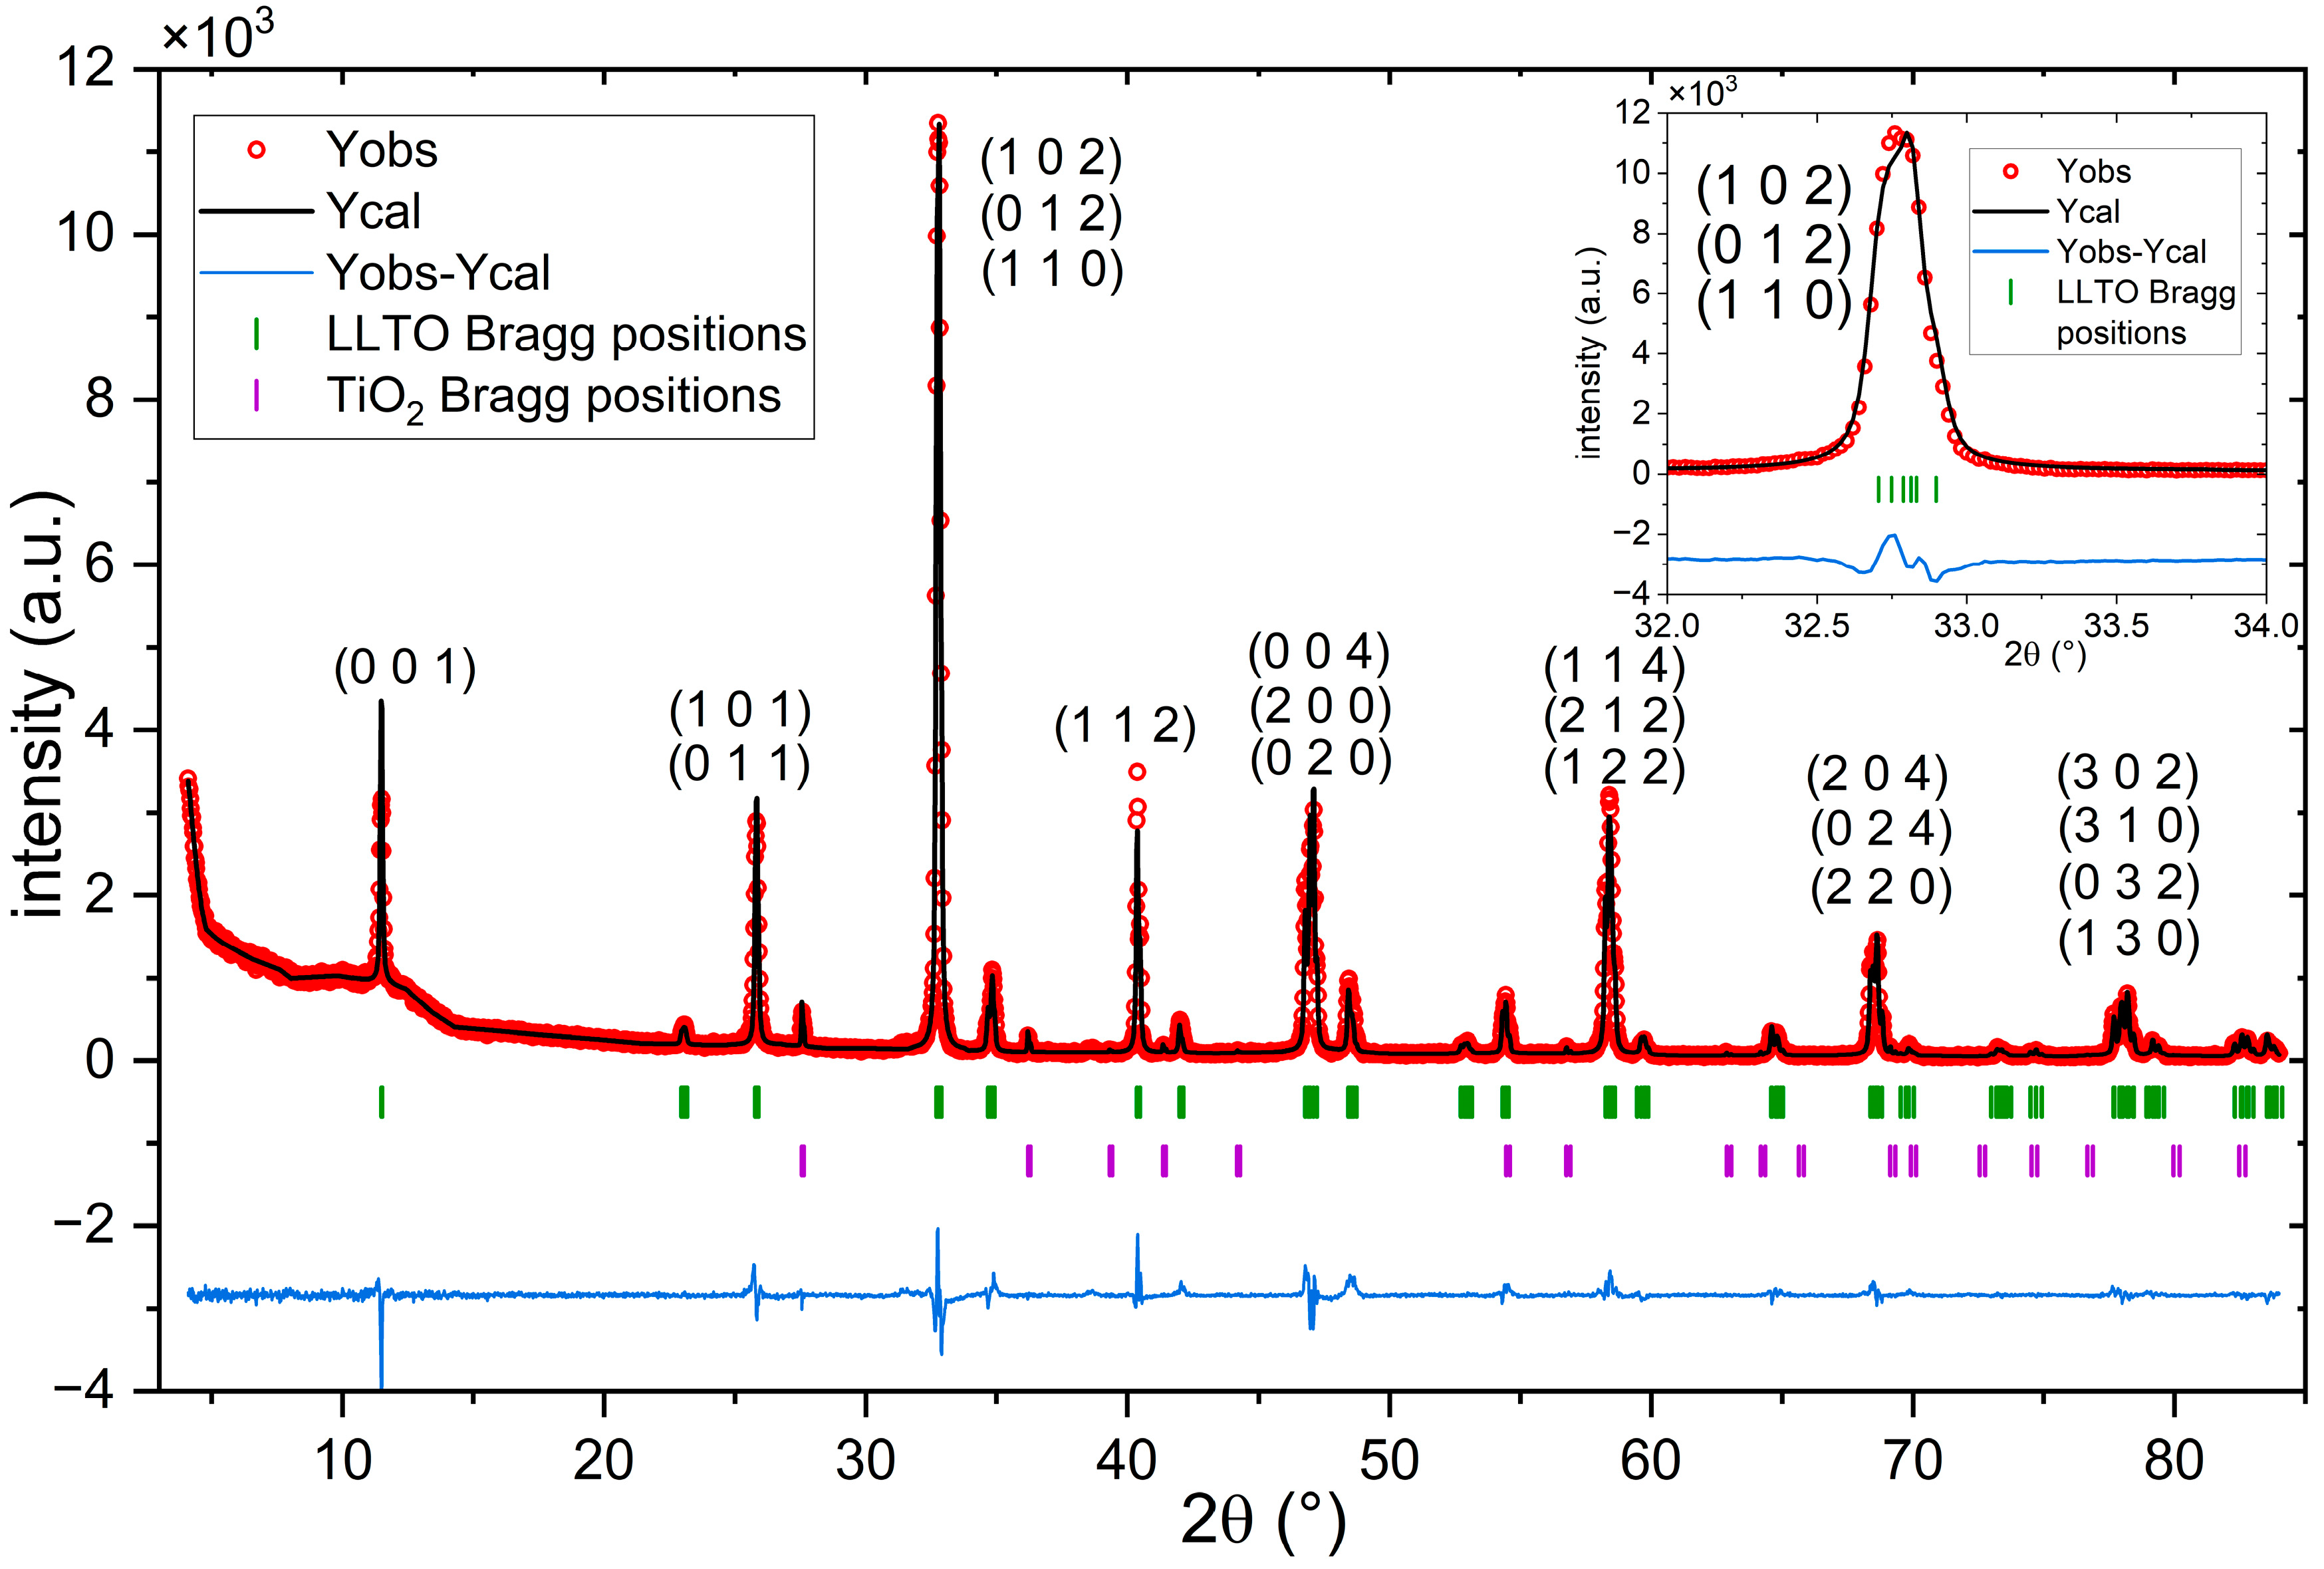
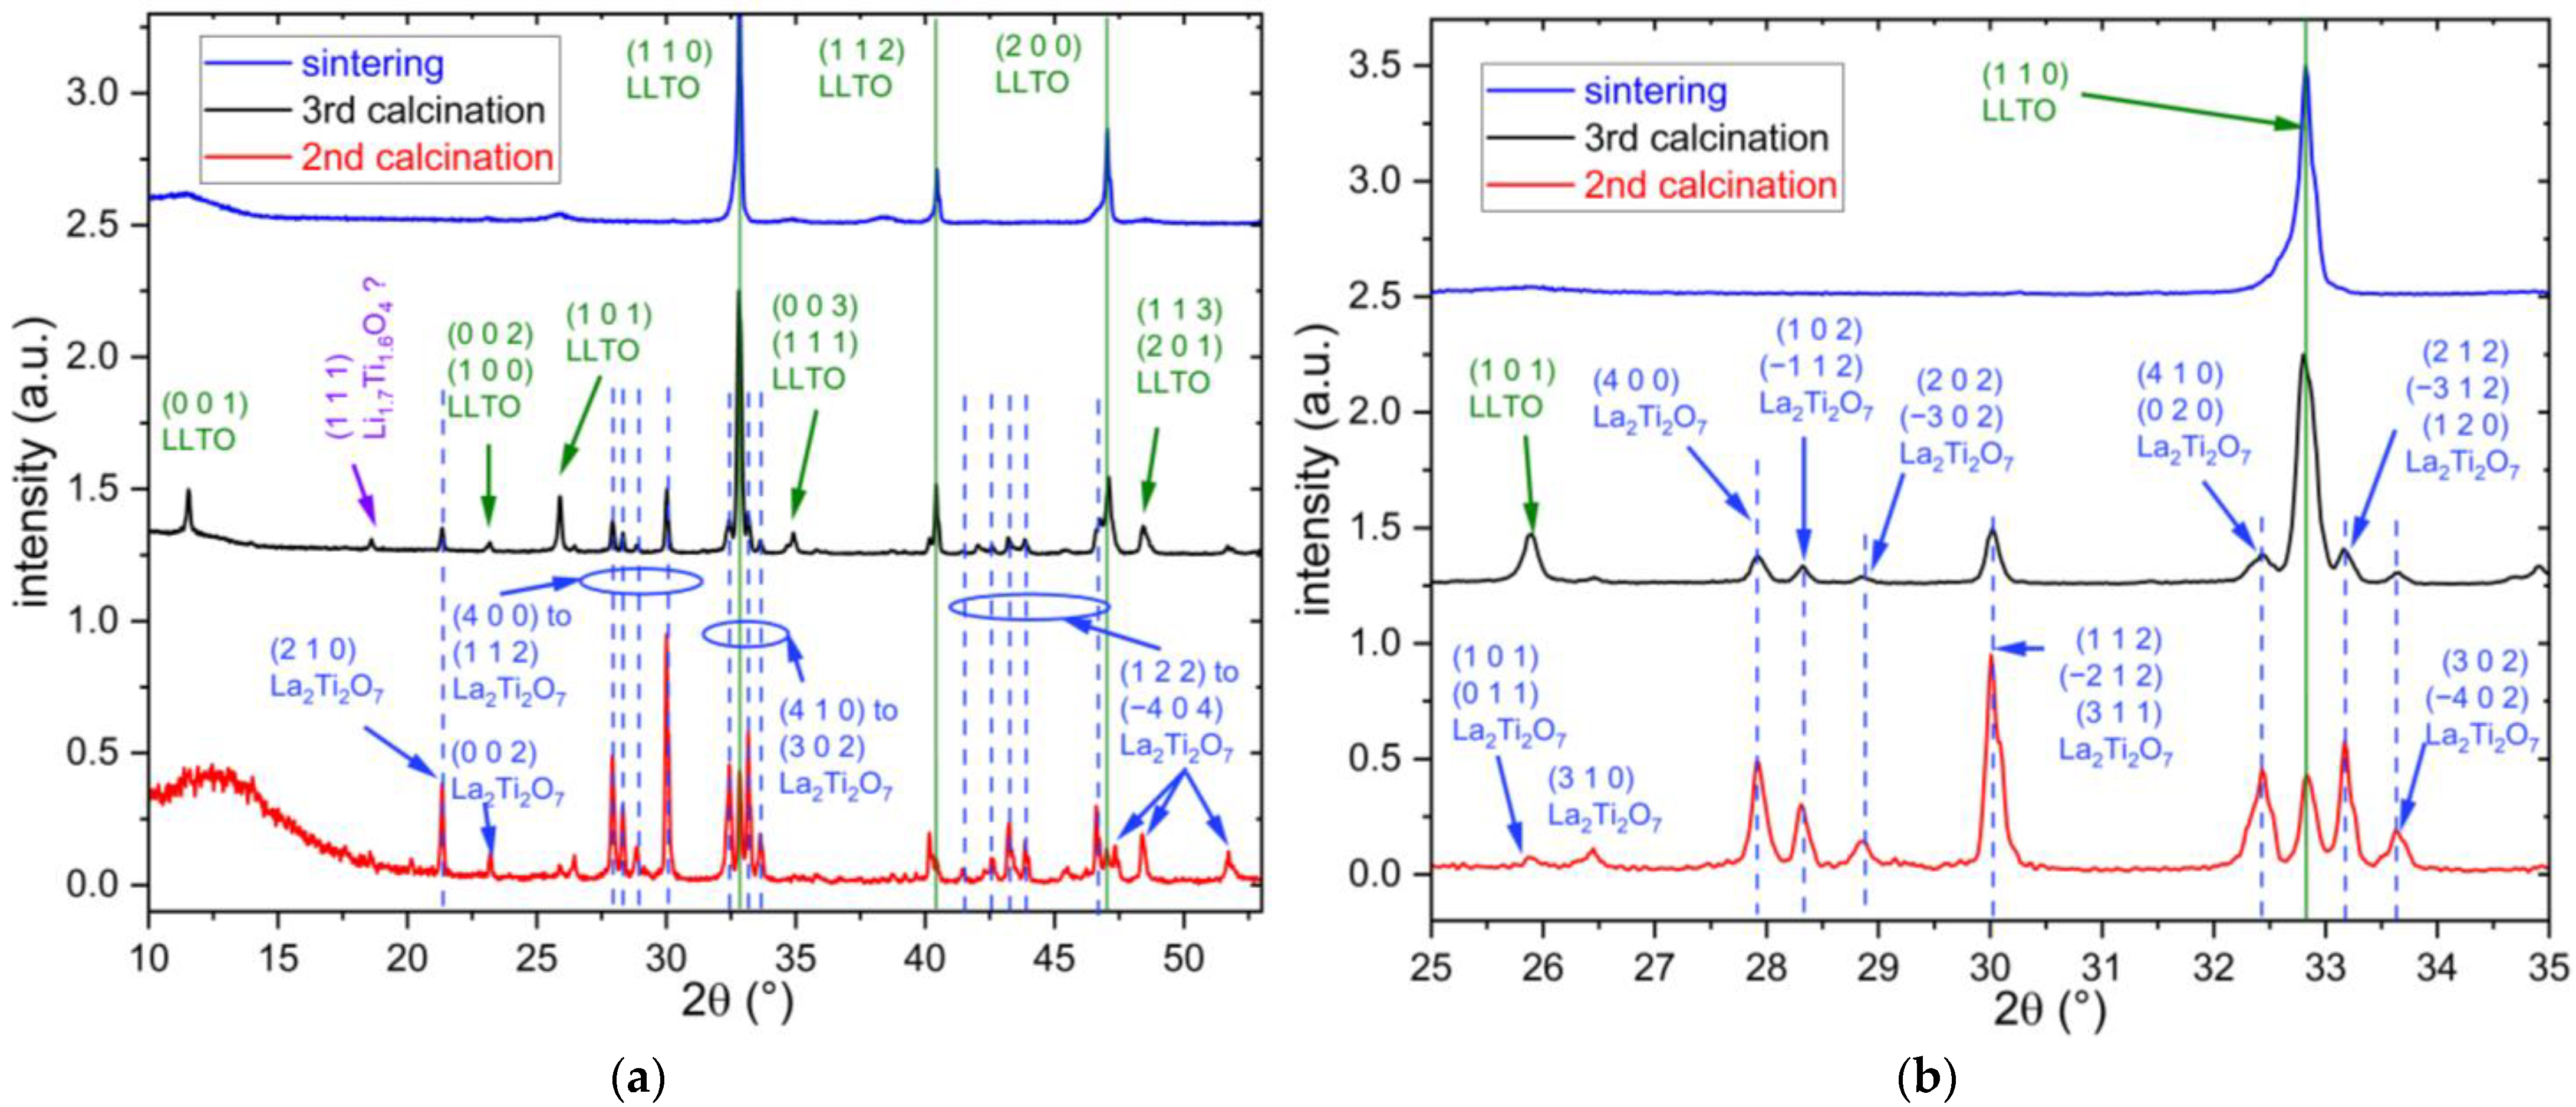
3.1. XRD Results
3.2. SEM Results
3.3. Chemical Composition
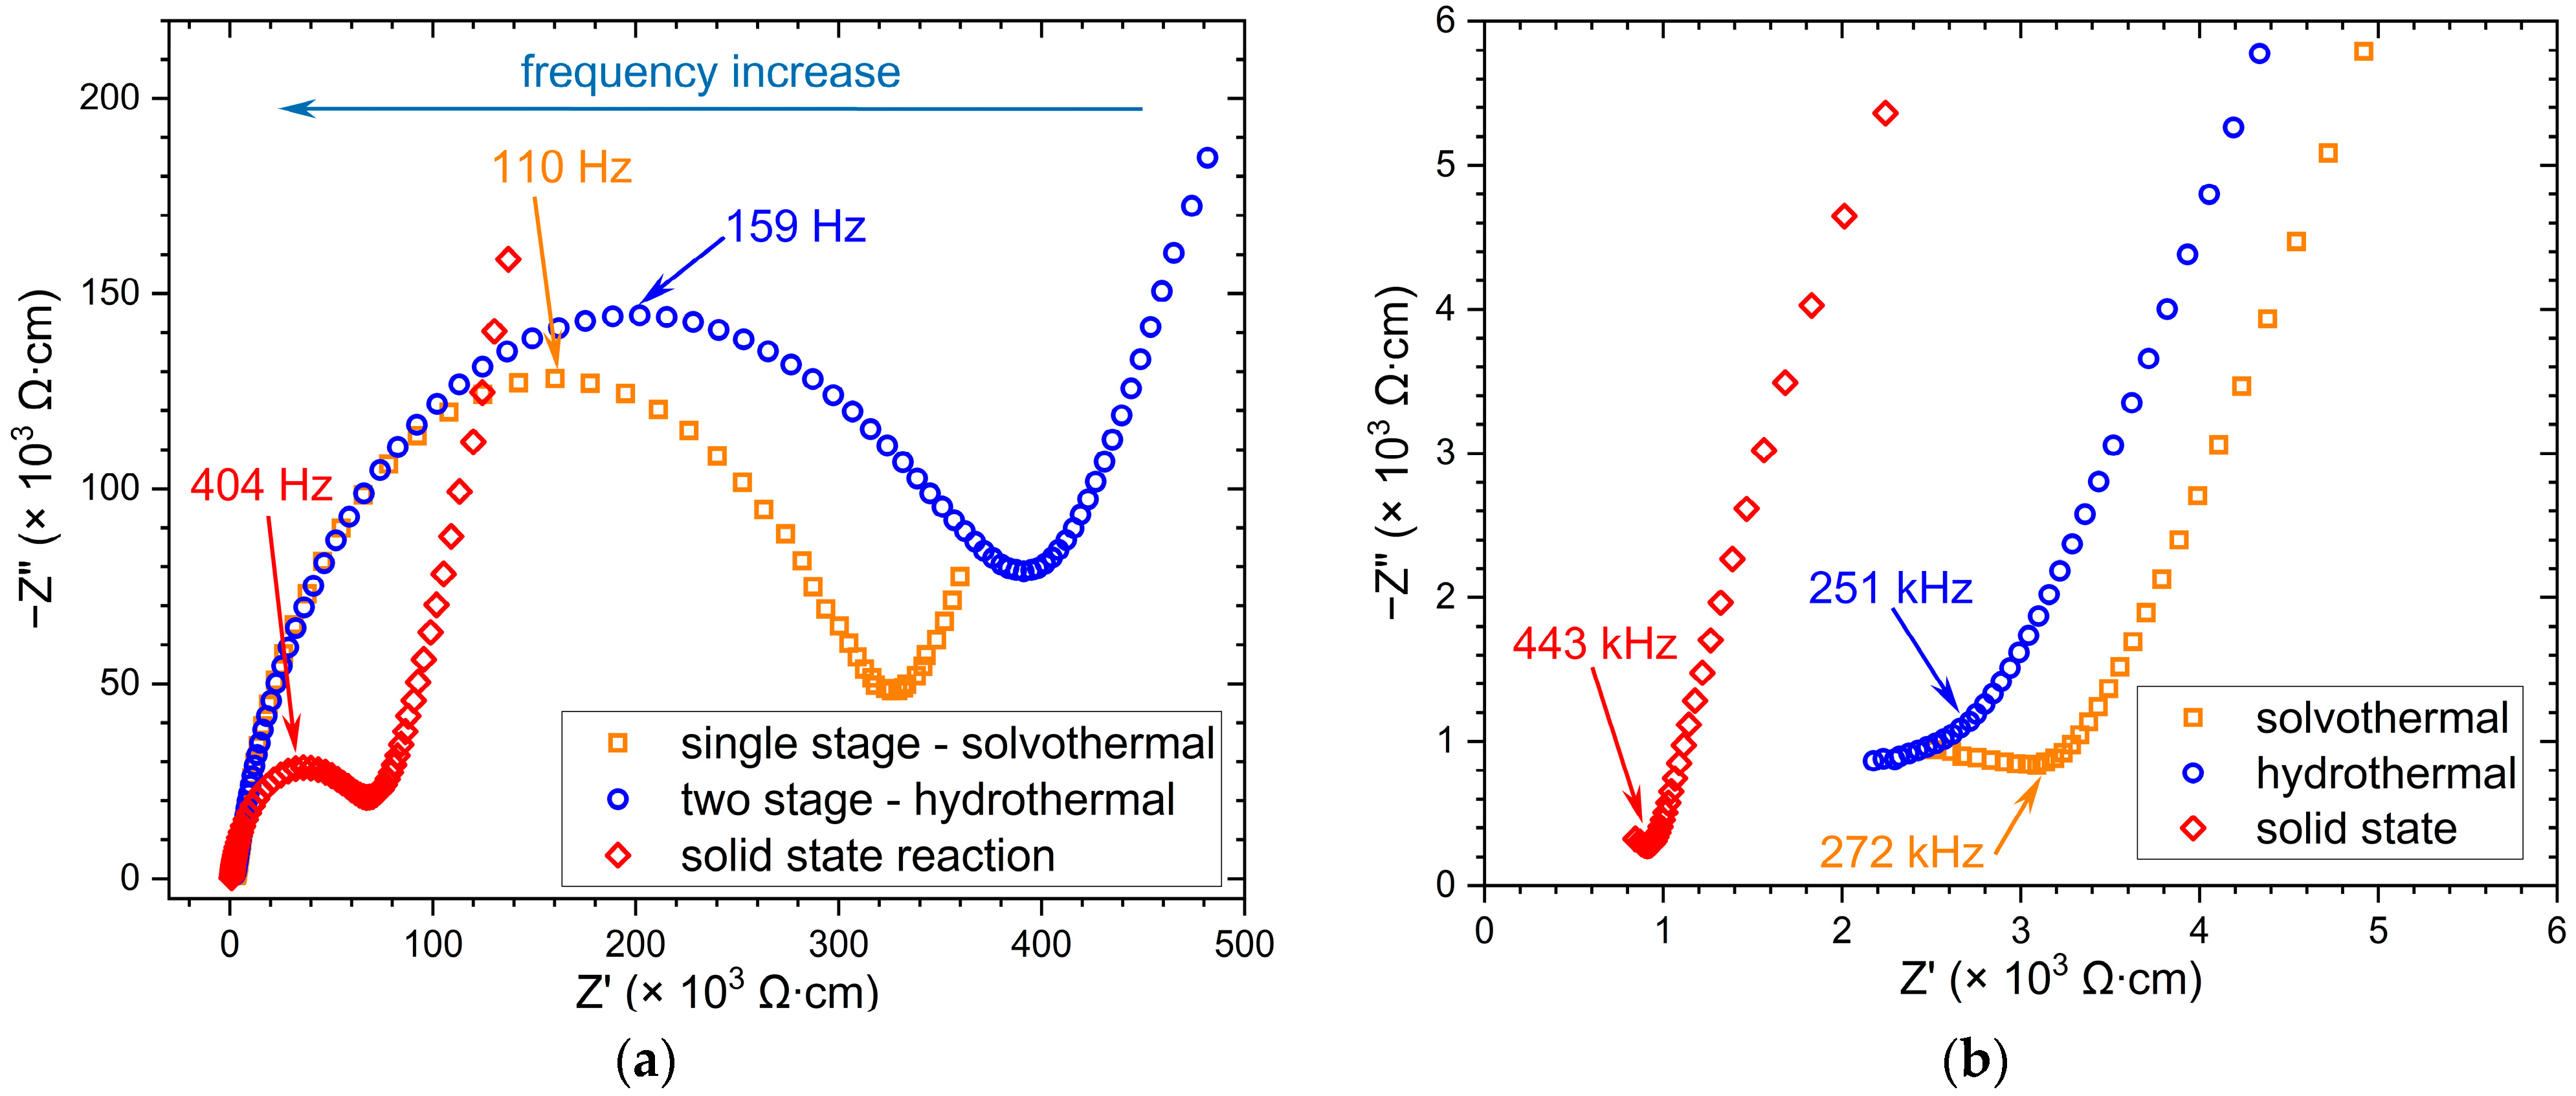
3.4. EIS Investigations
4. Conclusions
Supplementary Materials
Author Contributions
Funding
Data Availability Statement
Acknowledgments
Conflicts of Interest
Correction Statement
References
- Voropaeva, D.Y.; Stenina, I.A.; Yaroslavtsev, A.B. Solid-state electrolytes: A way to increase the power of lithium-ion batteries. Russ. Chem. Rev. 2024, 93, RCR5126. [Google Scholar] [CrossRef]
- Conlin, P.; Kim, H.; Hu, Y.; Liang, C.; Cho, M.; Cho, K. Mechanism of mixed conductivity in crystalline and amorphous lithium lanthanum titanate. Solid State Ion. 2022, 386, 116029. [Google Scholar] [CrossRef]
- Zhou, X.; Gao, C.; Wang, D.; Peng, S.; Huang, L.; Yang, W.; Zhang, W.-H.; Gao, X. Revealing the dominant factor of domain boundary resistance on bulk conductivity in lanthanum lithium titanates. J. Energy Chem. 2022, 73, 354–359. [Google Scholar] [CrossRef]
- Li, B.; Su, Q.; Yu, L.; Liu, W.; Dong, S.; Ding, S.; Zhang, M.; Du, G.; Xu, B. Biomimetic PVDF/LLTO composite polymer electrolyte enables excellent interface contact and enhanced ionic conductivity. Appl. Surf. Sci. 2021, 541, 148434. [Google Scholar] [CrossRef]
- Yang, T.; Li, Y.; Chan, C.K. Enhanced lithium-ion conductivity in lithium lanthanum titanate solid electrolyte nanowires prepared by electrospinning. J. Power Sources 2015, 287, 164–169. [Google Scholar] [CrossRef]
- Inaguma, Y.; Liquan, C.; Itoh, M.; Nakamura, T. High ionic conductivity in Lanthanum Titanate. Solid State Commun. 1993, 86, 689–693. [Google Scholar] [CrossRef]
- Schröckert, F.; Schiffmann, N.; Bucharsky, E.C.; Schell, K.G.; Hoffmann, M.J. Tape casted thin films of solid electrolyte Lithium-Lanthanum-Titanate. Solid State Ion. 2018, 328, 25–29. [Google Scholar] [CrossRef]
- Gao, X.; Fisher, C.A.J.; Kimura, T.; Ikuhara, Y.H.; Kuwabara, A.; Moriwake, H.; Oki, H.; Tojigamori, T.; Kohama, K.; Ikuhara, Y. Domain boundary structures in lanthanum lithium titanate. J. Mater. Chem. A 2014, 2, 843–852. [Google Scholar] [CrossRef]
- Takatori, K.; Kadoura, H.; Matsuo, H.; Tani, T. Microstructural analyses and improved ionic conductivity of La0.62Li0.16TiO3 ceramics prepared by a reactive-templated grain growth (RTGG) process. J. Eur. Ceram. Soc. 2019, 39, 384–388. [Google Scholar] [CrossRef]
- Abhilash, K.P.; Selvin, P.C.; Nalini, B.; Somasundaram, K.; Sivaraj, P.; Bose, A.C. Study of the temperature dependent transport properties in nanocrystalline lithium lanthanum titanate for lithium-ion batteries. J. Phys. Chem. Sol. 2016, 91, 114–121. [Google Scholar] [CrossRef]
- Mei, A.; Wang, X.-L.; Lan, J.-L.; Feng, Y.-C.; Geng, H.-X.; Lin, Y.-H.; Nan, C.-W. Role of amorphous boundary layer in enhancing ionic conductivity of lithium–lanthanum–titanate electrolyte. Electrochim. Acta 2010, 55, 2958–2963. [Google Scholar] [CrossRef]
- Salami, T.J.; Imanieh, S.H.; Lawrence, J.G.; Martin, I.R. Amorphous glass-perovskite composite as solid electrolyte for lithium-ion battery. Mater. Lett. 2019, 254, 294–296. [Google Scholar] [CrossRef]
- Inaguma, Y.; Chen, L.; Itoh, M.; Nakamura, T. Candidate compounds with perovskite structure for high lithium ionic conductivity. Solid State Ion. 1994, 70, 196–202. [Google Scholar] [CrossRef]
- Vijayakumar, M.; Pham, Q.N.; Bohnke, C. Lithium lanthanum titanate ceramic as sensitive material for pH sensor: Influence of synthesis methods and powder grains size. J. Eur. Ceram. Soc. 2005, 25, 2973–2976. [Google Scholar] [CrossRef]
- Bohnke, C.; Regrag, B.; Le Berre, F.; Fourquet, J.-L.; Randrianantoandro, N. Comparison of pH sensitivity of lithium lanthanum titanate obtained by sol–gel synthesis and solid-state chemistry. Solid State Ion. 2005, 176, 73–80. [Google Scholar] [CrossRef]
- Diktanaitė, A.; Gaidamavičienė, G.; Kazakevičius, E.; Kežionis, A.; Žalga, A. Aqueous sol-gel synthesis, structural, thermoanalytical studies, and conductivity properties of lithium lanthanum titanate. Thermochim. Acta 2022, 715, 179268. [Google Scholar] [CrossRef]
- Borštnar, P.; Žuntar, J.; Spreitzer, M.; Dražič, G.; Daneu, N. Exaggerated grain growth and the development of coarse-grained microstructures in lithium lanthanum titanate perovskite ceramics. J. Eur. Ceram. Soc. 2023, 43, 1017–1027. [Google Scholar] [CrossRef]
- V’yunov; Plutenko, T.O.; Fedorchuk, O.P.; Belous, A.G.; Lobko, Y.V. Synthesis and dielectric properties in the lithium-ion conducting material La0.5Li0.5−xNaxTiO3. J. Alloys Compd. 2021, 889, 161556. [Google Scholar] [CrossRef]
- Maqueda, O.; Sauvage, F.; Laffont, L.; Martínez-Sarrión, M.; Mestres, L.; Baudrin, E. Structural, microstructural and transport properties study of lanthanum lithium titanium perovskite thin films grown by Pulsed Laser Deposition. Thin Solid Films 2008, 516, 1651–1655. [Google Scholar] [CrossRef]
- Chambers, M.S.; Chen, J.; Sacci, R.L.; McAuliffe, R.D.; Sun, W.; Veith, G.M. Memory Effect on the Synthesis of Perovskite-Type Li-Ion Conductor LixLa2/3–x/3TiO3 (LLTO). Chem. Mat. 2024, 36, 1197–1213. [Google Scholar] [CrossRef]
- Kežionisa, A.; Kazakevičius, E.; Kazlauskas, S.; Žalga, A. Metal-like temperature dependent conductivity in fast Li+ ionic conductor Lithium Lanthanum Titanate. Solid State Ion. 2019, 342, 115060. [Google Scholar] [CrossRef]
- Avila, V.; Yoon, B.; Neto, R.R.I.; Silva, R.S.; Ghose, S.; Raj, R.; Jesus, L.M. Reactive flash sintering of the complex oxide Li0.5La0.5TiO3 starting from an amorphous precursor powder. Scr. Mater. 2020, 176, 78–82. [Google Scholar] [CrossRef]
- Kim, M.; Nam, W.; Seo, J.; Park, J.; Heo, S.; Hwang, Y.; Chee, S.-S.; Lee, S.; Cho, S.; An, G.; et al. TiO2 phase-controlled synthesis of Li-La-TiO solid electrolytes for advanced all-solid-state batteries. J. Asian Ceram. Soc. 2024, 12, 296–305. [Google Scholar] [CrossRef]
- Vásquez, F.A.; Thomas, J.E.; Visintin, A.; Calderón, J.A. LiMn1.8Ni0.2O4 nanorods obtained from a novel route using α-MnOOH precursor as cathode material for lithium-ion batteries. Solid State Ion. 2018, 320, 339–346. [Google Scholar] [CrossRef]
- Luo, X.D.; Zeng, W.; Yuan, M.; Huang, B.; Li, Y.W.; Yang, J.W.; Xiao, S.H. Controllable Hydrothermal Synthesis of Spinel LiMn2O4 and its Electrochemical Properties. Int. J. Electrochem. Sci. 2018, 13, 7748–7764. [Google Scholar] [CrossRef]
- Rao, B.N.; Muralidharan, P.; Kumar, P.R.; Venkateswarlu, M.; Satyanarayana, N. Fast and Facile Synthesis of LiMn2O4 Nanorods for Li Ion Battery by Microwave Assisted Hydrothermal and Solid-State Reaction Methods. Int. J. Electrochem. Sci. 2014, 9, 1207–1220. [Google Scholar] [CrossRef]
- Nyamaa, O.; Kang, G.-H.; Kim, J.-S.; Goo, K.-M.; Baek, I.-G.; Huh, S.-C.; Yang, J.-H.; Nam, T.-H.; Noh, J.-P. Streamlined two-step synthesis of spinel LiMn2O4 cathode for enhanced battery applications. Inorg. Chem. Commun. 2024, 160, 111825. [Google Scholar] [CrossRef]
- Yan, H.; Zhang, D.; Guo, G.; Wang, Z.; Liu, Y.; Wang, X. Hydrothermal synthesis of spherical Li4Ti5O12 material for a novel durable Li4Ti5O12/LiMn2O4 full lithium-ion battery. Ceram. Int. 2016, 42, 14855–14861. [Google Scholar] [CrossRef]
- Luo, F.; Xie, H.; Jin, H.; Han, Y. Hydrothermal synthesis of Mg-doped LiMn2O4 spinel cathode materials with high cycling performance for lithium-ion batteries. Int. J. Electrochem. Sci. 2022, 17, 220632. [Google Scholar] [CrossRef]
- Yao, J.; Lv, L.; Shen, C.; Zhang, P.; Aguey-Zinsou, K.-F.; Wang, L. Nano-sized spinel LiMn2O4 powder fabricated via modified dynamic hydrothermal synthesis. Ceram. Int. 2013, 39, 3359–3364. [Google Scholar] [CrossRef]
- Liu, X.-W.; Tang, J.; Qin, X.-S.; Deng, Y.-F.; Chen, G.-H. Supercritical-hydrothermal accelerated solid state reaction route for synthesis of LiMn2O4 cathode material for high-power Li-ion batteries. Trans. Nonferrous Met. Soc. China 2014, 24, 1414–1424. [Google Scholar] [CrossRef]
- Chen, K.; Donahoe, A.C.; Noh, Y.D.; KeyanLi; Komarneni, S.; Xue, D. Conventional and microwave hydrothermal synthesis of LiMn2O4: Effect of synthesis on electrochemical energy storage performances. Ceram. Int. 2014, 40, 3155–3163. [Google Scholar] [CrossRef]
- Lv, X.; Chen, S.; Chen, C.; Liu, L.; Liu, F.; Qiu, G. One-step hydrothermal synthesis of LiMn2O4 cathode materials for rechargeable lithium batteries. Solid State Sci. 2014, 31, 16–23. [Google Scholar] [CrossRef]
- Wu, H.M.; Tu, J.P.; Yuan, Y.F.; Chen, X.T.; Xiang, J.Y.; Zhao, X.B.; Cao, G.S. One-step synthesis LiMn2O4 cathode by a hydrothermal method. J. Power Sources 2006, 161, 1260–1263. [Google Scholar] [CrossRef]
- Jiang, C.H.; Dou, S.X.; Liu, H.K.; Ichihara, M.; Zhou, H.S. Synthesis of spinel LiMn2O4 nanoparticles through one-step hydrothermal reaction. J. Power Sources 2007, 172, 410–415. [Google Scholar] [CrossRef]
- Jiang, R.; Cui, C.; Ma, H. Poly(vinyl pyrrolidone)-assisted hydrothermal synthesis of LiMn2O4 nanoparticles with excellent rate performance. Mater. Lett. 2013, 91, 12–15. [Google Scholar] [CrossRef]
- Yue, H.; Huang, X.; Lv, D.P.; Yang, Y. Hydrothermal synthesis of LiMn2O4/C composite as a cathode for rechargeable lithium-ion battery with excellent rate capability. Electrochim. Acta 2009, 54, 5363–5367. [Google Scholar] [CrossRef]


| Method | Calcination | Sintering | Crystallographic System | Conductivity (σ) (S/cm) | Reference |
|---|---|---|---|---|---|
| Solid-state reaction | 1250 °C, 1300 °C, 1350 °C | Li poor—orthorhombic Li rich—tetragonal | 1.2∙10−3 to 1.8∙10−4 bulk Li rich, tetragonal—high σ Li poor, orthorhombic—low σ | [3] | |
| Solid-state | 800 °C/4 h, then 1150 °C/12 h (×2) | 1350 °C/6 h | Tetragonal | 1∙10−3 bulk 2∙10−5 total | [6] |
| Flash sintering | 550 °C/4 h | 1250 °C/45 s, electric field strength E = 80–120 V/cm | Cubic | 0.5∙10−3 bulk 3.4 to 5.9∙10−7 grain boundary | [22] |
| Solid-state reaction, TiO2 nanoparticles | 1000–1200 °C/8 h | 1150–1300 °C/12 h | Cubic/tetragonal | ~10−3–10−4 bulk ~10−4–10−6 grain boundary | [23] |
| Sol–gel | 900 °C/6 h | 900 °C/1 h | Cubic with superlattice formation | ~1.2 to 1.6∙10−3 bulk 1.5 to 4.4∙10−4 grain boundary | [10] |
| Sol–gel | 800–1100 °C | 1250 °C | Tetragonal/tetragonal + orthorhombic (depending on heat treatment temperature) | 14.1∙10−3 bulk | [16] |
| Method | Starting Materials | Parameters to Obtain the Initial Powder | Heat Treatment | Result |
|---|---|---|---|---|
| Sol–gel | TTL + La(NO3)3∙6H2O + LiNO3 | Drying the gel at 120 °C Calcination at 800 °C/1 h | 1000 °C/10 h | Low crystallinity, high porosity, low conductivity (~10−5 S/cm bulk conductivity), but also lowest Li losses. |
| Solid-state reaction | TiO2 + La(OH)3 + LiOH∙H2O + Li2CO3 | Calcination at 800 °C/4 h Calcination at 1150 °C/12 h (one stage) | 1150 °C/12 h | High crystallinity, but some Al-based secondary phases are observed in small quantities (the high reactivity of LiOH causes reactions with the Al2O3 crucible). |
| Solid-state reaction | TiO2 + La2O3 + Li2CO3 | Calcination at 800 °C/4 h Calcination at 1150 °C/12 h (two stages) | 1350 °C/6 h | High crystallinity, high phase purity (no contamination), highest observed conductivity. |
| Hydrothermal | TiOCl2(aq.) + La(NO3)3(aq.) + LiCl∙H2O | P = 90 bar, T = 200 °C, t = 2 h | - | Total loss of Li into the solution. |
| Hydrothermal | Step 1: TiOCl2(aq.) + La(NO3)3(aq.) Step 2: precursor obtained from step 1 + Li2CO3 | Step 1: P = 100 bar, T = 200 °C, t = 2 h Step 2: freeze-dry | 1350 °C/6 h | Good crystallinity, low amounts of secondary phases, low conductivity despite the low Li losses. |
| Solvothermal | TTL + La(NO3)3∙6H2O + LiNO3 | P = 92 bar, T = 200 °C, t = 3 h | 1350 °C/6 h | Significant Li loss, very low phase purity (68 wt% to 54 wt% LLTO and, respectively, 32 wt% to 46 wt% La4Ti9O24). |
| Solvothermal | TTL + La2O3 + Li2CO3 | P = 85 bar, T = 200 °C, t = 20 h | 1350 °C/6 h | The majority phase for this sample is Li2La2Ti3O10. La2Ti2O7 and LLTO are formed as secondary phases. The LLTO fraction is approximately 20 wt%. |
| Solvothermal | TTL + La(NO3)3∙6H2O + LiOH + Li2CO3 | P = 85 bar, T = 200 °C, t = 3 h | 1350 °C/6 h | Significant Li losses into the solution. |
| Solvothermal | TTL + La(NO3)3∙6H2O + Li2CO3 (10 wt% excess Li) | P = 75 to 106 bar, T = 200 °C, t = 3 to 6 h, respectively | 1350 °C/6 h | Identical samples are obtained through the specified pressure and dwell time ranges. The samples present good crystallinity, high phase purity, moderate Li losses, but low conductivity. |
| Solvothermal | TTL + La(NO3)3∙6H2O + Li2CO3 (27 wt% excess Li) | P = 85 bar, T = 200 °C, t = 20 h | 1350 °C/6 h | Increased Li losses into the solution compared with the previous case, but otherwise, the samples are comparable. |
| Starting Materials | Pressure (bar) | Temperature (°C) | Time (h) | Heat Treatment (°C/h) | Lattice Parameters (Å) |
|---|---|---|---|---|---|
| TTL + La(NO3)3∙6H2O + Li2CO3 (10 wt% excess Li) | 75 | 200 | 3 | 1350 °C/6 h | a = 3.875 b = 3.865 c = 7.779 |
| TTL + La(NO3)3∙6H2O + Li2CO3 (10 wt% excess Li) | 106 | 200 | 6 | 1350 °C/6 h | a = 3.876 b = 3.866 c = 7.782 |
| TTL + La(NO3)3∙6H2O + Li2CO3 (27 wt% excess Li) | 85 | 200 | 20 | 1350 °C/6 h | a = 3.874 b = 3.863 c = 7.786 |
| TTL + La(NO3)3∙6H2O + Li2CO3 (10 wt% excess Li) | 114 | 200 | 3 | 1350 °C/6 h | a = 3.874 b = 3.864 c = 7.786 |
| TTL + La(NO3)3∙6H2O + LiNO3 (10 wt% excess Li) * | 92 | 200 | 3 | 1350 °C/6 h | a = 3.875 b = 3.863 c = 7.786 |
| Sample | Main LLTO Phase: System, Space Group, Lattice (Å) | Secondary LLTO Phase: System, Space Group, Lattice (Å) | Phase Composition |
|---|---|---|---|
| Solvothermal (single stage) | orthorhombic Pmmm a = 3.876(1) b = 3.865(1) c = 7.783(1) | cubic Pm−3m a = 3.88 | 83% orthorhombic LLTO 3% cubic LLTO 10% La0.67TiO3 4% TiO2 |
| Hydrothermal (two stages) | tetragonal P4/mmm a = 3.870(2) c = 7.770(1) | cubic Pm−3m a = 3.875(1) | 64% tetragonal LLTO 29% cubic LLTO 7% Li2La2Ti3O10 |
| Solid-state reaction (last heat treatment) | cubic Pm−3m a = 3.870(1) | orthorhombic Pmmm a = 3.887 b = 3.874 c = 7.805 | 72% cubic LLTO 26% orthorhombic LLTO 2% other impurities |
| Sample | σgrain (S/cm) | σgrain boundary (S/cm) |
|---|---|---|
| Solvothermal method (1 stage) | 7.48∙10−4 | 3.66∙10−6 |
| Hydrothermal method (2 stages) | ~10−4 | 2.80∙10−6 |
| Solid-state synthesis | 1.44∙10−3 | 1.93∙10−5 |
Disclaimer/Publisher’s Note: The statements, opinions and data contained in all publications are solely those of the individual author(s) and contributor(s) and not of MDPI and/or the editor(s). MDPI and/or the editor(s) disclaim responsibility for any injury to people or property resulting from any ideas, methods, instructions or products referred to in the content. |
© 2025 by the authors. Licensee MDPI, Basel, Switzerland. This article is an open access article distributed under the terms and conditions of the Creative Commons Attribution (CC BY) license (https://creativecommons.org/licenses/by/4.0/).
Share and Cite
Okos, A.; Mocioiu, A.-M.; Drăguț, D.V.; Matei, A.C.; Bogdănescu, C. Hydrothermal Synthesis of Lithium Lanthanum Titanate. Crystals 2025, 15, 241. https://doi.org/10.3390/cryst15030241
Okos A, Mocioiu A-M, Drăguț DV, Matei AC, Bogdănescu C. Hydrothermal Synthesis of Lithium Lanthanum Titanate. Crystals. 2025; 15(3):241. https://doi.org/10.3390/cryst15030241
Chicago/Turabian StyleOkos, Alexandru, Ana-Maria Mocioiu, Dumitru Valentin Drăguț, Alexandru Cristian Matei, and Cristian Bogdănescu. 2025. "Hydrothermal Synthesis of Lithium Lanthanum Titanate" Crystals 15, no. 3: 241. https://doi.org/10.3390/cryst15030241
APA StyleOkos, A., Mocioiu, A.-M., Drăguț, D. V., Matei, A. C., & Bogdănescu, C. (2025). Hydrothermal Synthesis of Lithium Lanthanum Titanate. Crystals, 15(3), 241. https://doi.org/10.3390/cryst15030241