Article

Macroscopic Dehydration Control of ZnSO4·7H2O: Infrared and Raman Spectra of ZnSO4 Hydrates

1
College of Material Engineering, Fujian Agriculture and Forestry University, Fuzhou 350100, China
2
School of Resources and Chemical Engineering, Sanming University, Sanming 365004, China
3
School of Chemical Engineering, Fuzhou University, Fuzhou 350116, China
*
Authors to whom correspondence should be addressed.
Crystals 2025, 15(3), 257; https://doi.org/10.3390/cryst15030257
Submission received: 18 February 2025 / Revised: 26 February 2025 / Accepted: 3 March 2025 / Published: 10 March 2025

Abstract

:
With microscopic thermogravimetric analysis, it is difficult to prepare metastable intermediate phases with precise water contents during the dehydration process of hydrates, making it a challenge to acquire their related spectra. The gradual dehydration process of ZnSO4·7H2O proceeds through 7 → 6 → 4 → 1 → 0. Vibrational spectra of ZnSO4 hydrates, especially ZnSO4·6H2O and ZnSO4·4H2O, have not been previously reported. By macroscopic thermogravimetric analysis of ZnSO4·7H2O, the dehydration process can be precisely controlled to produce a variety of ZnSO4 hydrates with specific water contents. In this study, powder X-ray diffraction confirmed the purities of 7H2O, 6H2O, 4H2O, 1H2O and anhydrous ZnSO4. IR and Raman spectra of ZnSO4 hydrates were obtained and compared for the first time. Spectroscopic and crystallographic analysis revealed that structural similarity plays a key role in the 7 → 6 → 4 → 1 → 0 dehydration process. Macroscopic thermogravimetric analysis combined with powder X-ray diffraction is a valuable method for investigating the intermediate phases in the hydrate dehydration process.

1. Introduction

Inorganic salt hydrates can lose their crystallized water with increasing temperature or decreasing humidity [1,2,3]. The dehydration process can involve multiple steps before the hydrate reaches a thermodynamically stable state [4,5,6]. The dehydration and reverse processes of inorganic salt hydrates involve the absorption and release of a large amount of energy, which makes inorganic salt hydrates a potential candidate for thermal energy storage and release [7,8]. Understanding the multi-step dehydration process of inorganic salt hydrates is of great significance for understanding their fundamental properties and their applications as energy storage materials.
The main research methods for hydrate dehydration are X-ray diffraction (XRD) and microscopic thermal analysis (TA) techniques [9,10,11,12], such as thermogravimetric analysis (TGA), differential scanning calorimetry (DSC) and differential thermal analysis (DTA). It is a challenge to combine powder XRD (PXRD) and microscopic TA, even in ex situ conditions, for the following reasons. (1) The atmosphere for PXRD testing is usually air at ambient humidity, and that for microscopic TA is usually dry air or N2. These different atmospheres can make it difficult to discern changes in water content in ex situ conditions. (2) The sample mass for microscopic TA is milligram-scale, which is usually not large enough for PXRD, and is not easily transferred from the crucible. (3) Some inorganic salt hydrates do not have a clear dehydration step, and it is difficult to obtain intermediate phases with precise water contents in microscopic TA. For inorganic salt hydrates with clear dehydration steps, these problems are not critical. For example, the dehydration process of CuSO4·5H2O, a common standard material for calibrating DSC-TGA instruments [13], is 5 → 3 → 1 → 0, with clear dehydration steps [14]. The stability of CuSO4·3H2O, CuSO4·H2O and anhydrous CuSO4 is sufficient in air. Thus, IR [15,16] and Raman [17] spectra of various CuSO4 hydrates have been reported to align well with microscopic TGA. However, in the case of ZnSO4·7H2O (Table 1), the gradual dehydration process proceeds through 7 → 6 → 4 → 1 → 0, which has been confirmed by microscopic TA [18] and diffraction methods [19,20]. Dehydration from ZnSO4·7H2O to ZnSO4·H2O is only a continuous process in microscopic TGA, making it challenging to isolate intermediate products with precise compositions. The single-crystal data of ZnSO4·7H2O, 6H2O, 4H2O, 1H2O and anhydrous ZnSO4 have been reported (Table 2), but the IR and Raman spectra of ZnSO4·6H2O and ZnSO4·4H2O have not been reported.
Macroscopic TGA is widely used for determining the moisture content in food [35,36]. Different from TGA, DSC and DTA, macroscopic TGA is operated with samples of mass in the order of grams under air conditions. This method enables the dehydration process to be interrupted at any time and the product to be transferred. Using grams of sample can enhance the reproducibility of the experiment and the storage stability of the sample, which is conducive to the combination of this method with PXRD and spectroscopic analysis.
In this work, macroscopic TGA was successfully used for the preparation of various ZnSO4 hydrates with precise water contents. PXRD confirmed that the prepared ZnSO4·7H2O, ZnSO4·6H2O, ZnSO4·H2O and anhydrous ZnSO4 are pure and ZnSO4·4H2O has high purity with a small amount of ZnSO4·6H2O and ZnSO4·H2O. IR and Raman spectra of the various ZnSO4 hydrates were obtained for the first time. Spectroscopic and crystallographic analysis indicate that the gradual dehydration of ZnSO4·7H2O through 7 → 6 → 4 → 1 → 0 is consistent with the principle of structural similarity. The combination of macroscopic TGA analysis and PXRD has advantages in preparing the intermediate phases with precise water contents, determining the polymorphs of the intermediate phases and obtaining the spectra of the intermediate phases in the dehydration process.

2. Materials and Methods

2.1. Materials

Zinc sulfate heptahydrate (ZnSO4·7H2O, 99.5%) was bought from Xilong Chemical Co. Raw ZnSO4·7H2O would dehydrate during storage, and the fresh ZnSO4·7H2O used in this work was prepared by the following method. A total of 5 g of ground raw ZnSO4·7H2O was totally dissolved in 10 mL of water, and then the solution was evaporated in air (26 °C, ~60% humidity) until most of the solution had crystallized. The crystals were collected by vacuum filtration, and the moisture on the surface of the crystals was absorbed with dry filter paper.

2.2. Methods

Dehydration Sample Preparations. ZnSO4·6H2O was obtained after 1 g of fresh ZnSO4·7H2O lost its 6.3% moisture content on a thermobalance (MB120ZH, OHAUS, Changzhou, China) set at 50 °C. The dehydration sample, mainly composed of ZnSO4·4H2O (ZnSO4·4H2O*), was obtained by heating 1 g of fresh ZnSO4·7H2O with 18.9% water lost on a thermobalance set at 70 °C. ZnSO4·H2O was obtained while 1 g of fresh ZnSO4·7H2O lost its 37.8% moisture content on a thermobalance set at 150 °C. Anhydrous ZnSO4 was obtained after dehydration treatment for two hours at 350 °C on a hot stage (HP380-Pro, DLAB SCIENTIFIC, Beijing, China) with 1 g of raw ZnSO4·7H2O.
Spray Drying of ZnSO4 Aqueous Solution. A total of 25 mg·mL−1 ZnSO4 aqueous solution was spray dried (Shanghai Pilotech YC-015, feed rate 1.5–2 L·h−1, inlet temperature 200 °C, outlet temperature ~110 °C, atomization air pressure 24 kg·cm−2, drying air flow rate 30 m3·h−1).
Conventional Characterization. ZnSO4 samples were characterized with differential scanning calorimetry–thermogravimetric analysis (DSC-TGA, NETZSCH STA 449F3, NETZSCH, Germany, dry N2, 10 K·min−1), powder X-ray diffraction (PXRD, Philips X’Pert Pro, PANalytical, Netherlands, Cu Kα, 40 kV, 30 mA, 10–30°, 4°·min−1 and Rigaku SmartLab, Cu Kα, 40 kV, 50 mA, 10–30°, 5°·min−1), Fourier transform infrared spectroscopy (IR, Shimadzu IRAffinity-1S, Shimadzu, Japan, absorbance, 400–4000 cm−1) and confocal Raman spectroscopy (Thermo Fisher Scientific, USA, DXR3xi, 532 nm, 40 mW, 0.002–0.02 s, 1000 scans of 50–3400 cm−1, 50× objective lens).
Difference Spectra Analysis. The IR spectrum of ZnSO4·4H2O* is a composite spectrum of the main ZnSO4·4H2O and a small amount of ZnSO4·6H2O and ZnSO4·H2O. The Raman spectrum of ZnSO4·4H2O* is equal to that of ZnSO4·4H2O because the Raman spectroscopy was obtained from a micro area. The Raman spectrum of ZnSO4·4H2O in the ZnSO4·4H2O* sample can be easily identified, which is different from that of ZnSO4·6H2O and ZnSO4·H2O. All the obtained spectra were normalized for difference spectra analysis. Briefly, IR bands at 1084 cm−1 of ZnSO4 saturated aqueous solution, 1053 cm−1 of ZnSO4·7H2O and 6H2O, 1063 cm−1 of ZnSO4·4H2O*, 1082 cm−1 of ZnSO4·H2O, and 1050 cm−1 of anhydrous ZnSO4 were used for normalization, and Raman bands at 982 cm−1 of aqueous solution and ZnSO4·6H2O, 983 cm−1 of ZnSO4·7H2O, 991 cm−1 of ZnSO4·4H2O, 1020 cm−1 of ZnSO4·H2O, and 1040 cm−1 of anhydrous ZnSO4 were used for normalization. Difference spectra were obtained by the subtraction of two related spectra with further baseline deduction based on a polynomial fitting method. Absolute deviation of the values in the difference spectrum (a.d.) was used to compare the similarity.
a . d . = x n
Each sample was characterized three times individually, and the corresponding nine difference spectra can be obtained. Further, the error of the a.d. can be calculated.

3. Results

3.1. Microscopic DSC-TGA and Macroscopic TGA of ZnSO4·7H2O

Fresh ZnSO4·7H2O was prepared via slowly evaporating the aqueous solution of ZnSO4. The microscopic TGA curve of fresh ZnSO4·7H2O with a heating rate of 10 K·min−1 reveals a two-stage dehydration process within the temperature range of 25–400 °C (Figure 1a). The first dehydration step takes place below 200 °C with a weight loss of 37.1%, confirmed as the 7 → 1 dehydration process with theoretical weight loss of 37.6%. The second dehydration step occurs in the temperature range of 200–400 °C with a weight loss of 7.6%, similar to the 1 → 0 dehydration process with theoretical weight loss of 6.3%. The microscopic TGA curve does not provide additional insights about the 7 → 1 dehydration process even with a slow heating rate of 1 K·min−1 (Figure S1). The corresponding DSC curve exhibits four distinct endothermic peaks at 56, 95, 146, and 315 °C, indicating a four-step dehydration process denoted as 7 → X1 → X2 → 1 → 0. X1 and X2 are two unknown intermediate phases. The X1 phase can be obtained because the endothermic peak corresponding to the transition from 7H2O to X1 is isolated. The synthesis of the X2 phase with good purity seems to be rather challenging because the endothermic peaks of X1 → X2 and X2 → 1H2O transformation processes are overlapping even with a slow heating rate of 1 K·min−1. The X2 phase might be unstable and easy to transform into ZnSO4·H2O. Macroscopic TGA curves of ZnSO4·7H2O at different temperatures only show one continuous step in a 7 → 1 process (Figure 1b), similar to the microscopic TGA curves. The weight loss of ZnSO4·7H2O is 36.0% at 50 °C and 100 °C (ZnSO4 + 1.2H2O) and 37.8% (ZnSO4 + 1.0H2O) at 150 °C. The macroscopic TGA curves reach equilibrium within 10 min at 100 and 150 °C, which is too rapid to capture intermediate phases. The macroscopic TGA curve obtained at 50 °C shows a gradual and nearly linear weight loss, which is conducive to obtaining intermediate products with precise compositions (e.g., ZnSO4 + 6.0H2O, ZnSO4 + 4.0H2O).

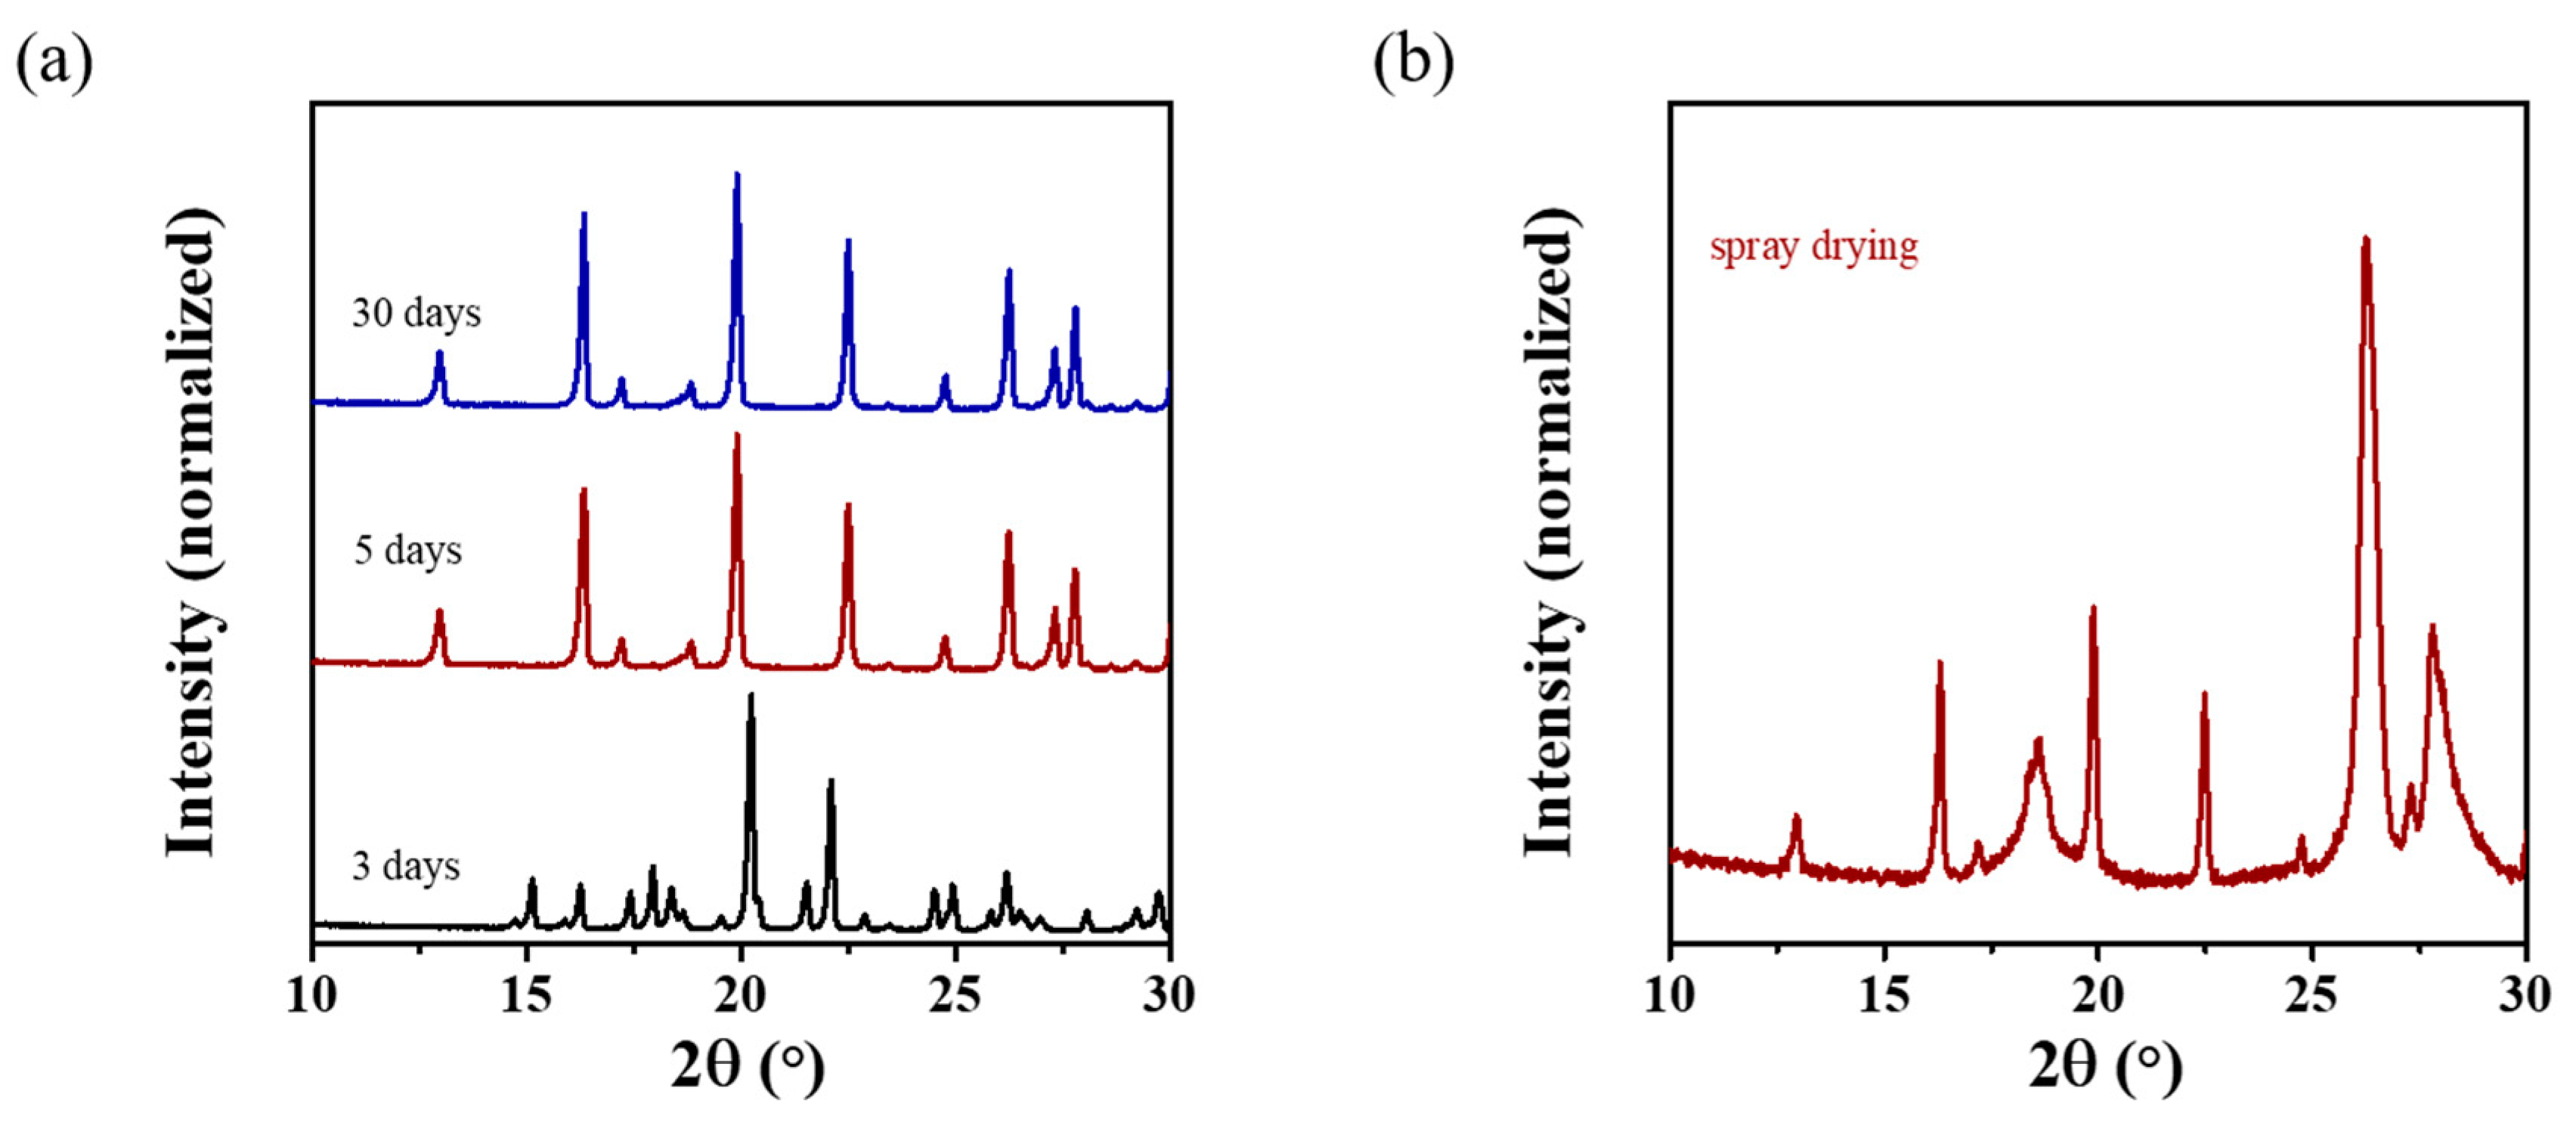
3.2. Macroscopic Dehydration Control of ZnSO4·7H2O

Four phases, including ZnSO4·7H2O, ZnSO4·6H2O, ZnSO4·H2O and anhydrous ZnSO4, can be prepared with good purity and robust repeatability via macroscopic TGA, confirmed by the simulated PXRD patterns of the pure phases. The characteristic 2θ peaks of ZnSO4 hydrates are compared and identified (Table S1). The fresh ZnSO4·7H2O is confirmed again from the PXRD pattern (Figure 2a). The sample of ZnSO4 + 6.0H2O is the product of fresh ZnSO4·7H2O with 6.3% weight loss in the macroscopic TGA carried out at 50 °C, whose PXRD pattern aligns with the simulated PXRD pattern of ZnSO4·6H2O (Figure 2b). ZnSO4 + 1.0H2O is the equilibrium product of ZnSO4·7H2O in the macroscopic TGA carried out at 150 °C, and its PXRD pattern agrees with the simulated PXRD pattern of ZnSO4·H2O (Figure 2c). The equilibrium product of ZnSO4·7H2O in the macroscopic TGA at 50 °C is ZnSO4 + 1.2H2O, and its PXRD pattern is also consistent with that of ZnSO4·H2O. The water content of ZnSO4·H2O can be variable. Anhydrous ZnSO4 is the equilibrium product of the macroscopic TGA at 350 °C confirmed by the PXRD pattern (Figure 2d). After being stored in a sealed environment for one week, the PXRD patterns of these four phases remained unchanged, indicating good storage stability. Through macroscopic TGA, the exact water contents of ZnSO4·6H2O and ZnSO4·H2O can be precisely determined and controlled, which is an advantage that other methods do not possess.
ZnSO4 samples with precise water contents of 5.0H2O, 4.0H2O, 3.0H2O and 2.0H2O can be easily prepared by macroscopic TGA at 50 °C. After a careful comparison, we found that the PXRD patterns of these fresh samples only show the characteristic 2θ peaks of ZnSO4·6H2O and ZnSO4·H2O (Figure 3a). The characteristic 2θ peaks of ZnSO4·4H2O at 13.0, 22.5, 24.8, 27.4° are all not observed. The diffraction intensity ratio of the peak at 20.3° of ZnSO4·6H2O and peak at 26.2° of ZnSO4·H2O shows a good linear relationship with the mass ratio of ZnSO4·6H2O and ZnSO4·H2O (Figure S2), indirectly confirming that these samples only contain ZnSO4·6H2O and ZnSO4·H2O. ZnSO4·4H2O is a distinct kinetic intermediate phase, which can only be obtained under a suitable dehydration rate. The ZnSO4 + 4.0H2O sample can also be easily prepared by conducting macroscopic TGA at a higher temperature (Figure 3b). When the operation temperature was 60 °C, a small amount of ZnSO4·4H2O appeared. ZnSO4·4H2O became the main product when macroscopic TGA was carried out at 70–80 °C. The proportion of ZnSO4·4H2O declined at the operation temperature of 90 °C. The ZnSO4 + 4.0H2O obtained at 70 °C (ZnSO4·4H2O*) was selected to study the physical and chemical properties of ZnSO4·4H2O due to its high content of ZnSO4·4H2O and the low operation temperature. By carefully comparing the PXRD patterns, it can be concluded that ZnSO4·4H2O* is a mixture of primary ZnSO4·4H2O, ZnSO4·6H2O and ZnSO4·H2O. The composition of ZnSO4 + 5.0H2O obtained at 70 °C is mainly ZnSO4·6H2O with a small amount of ZnSO4·4H2O (Figure 3c). The ZnSO4 + 4.0H2O obtained from ZnSO4·6H2O at 70 °C is also mainly composed of ZnSO4·4H2O, similar to ZnSO4·4H2O*. The direct transformation from ZnSO4·7H2O to ZnSO4·4H2O was not observed. ZnSO4·4H2O was mainly formed by the dehydration of ZnSO4·6H2O. Thus, we consider that for the 7 → X1 → X2 → 1 → 0 dehydration process indicated by microscopic DSC-TGA mentioned above, X1 is ZnSO4·6H2O and X2 is ZnSO4·4H2O. The gradual dehydration process of ZnSO4·7H2O can be 7 → 6 → 4 → 1 and 7 → 6 → 1 in this work. ZnSO4·4H2O* was not stable and would transform into a product composed of ZnSO4·6H2O (main) and ZnSO4·H2O even after only one day of storage (Figure 3d). ZnSO4·4H2O was hardly detectable in the PXRD pattern after storage for 5 days. ZnSO4·4H2O* should be characterized as soon as possible to avoid its polymorphism transition.

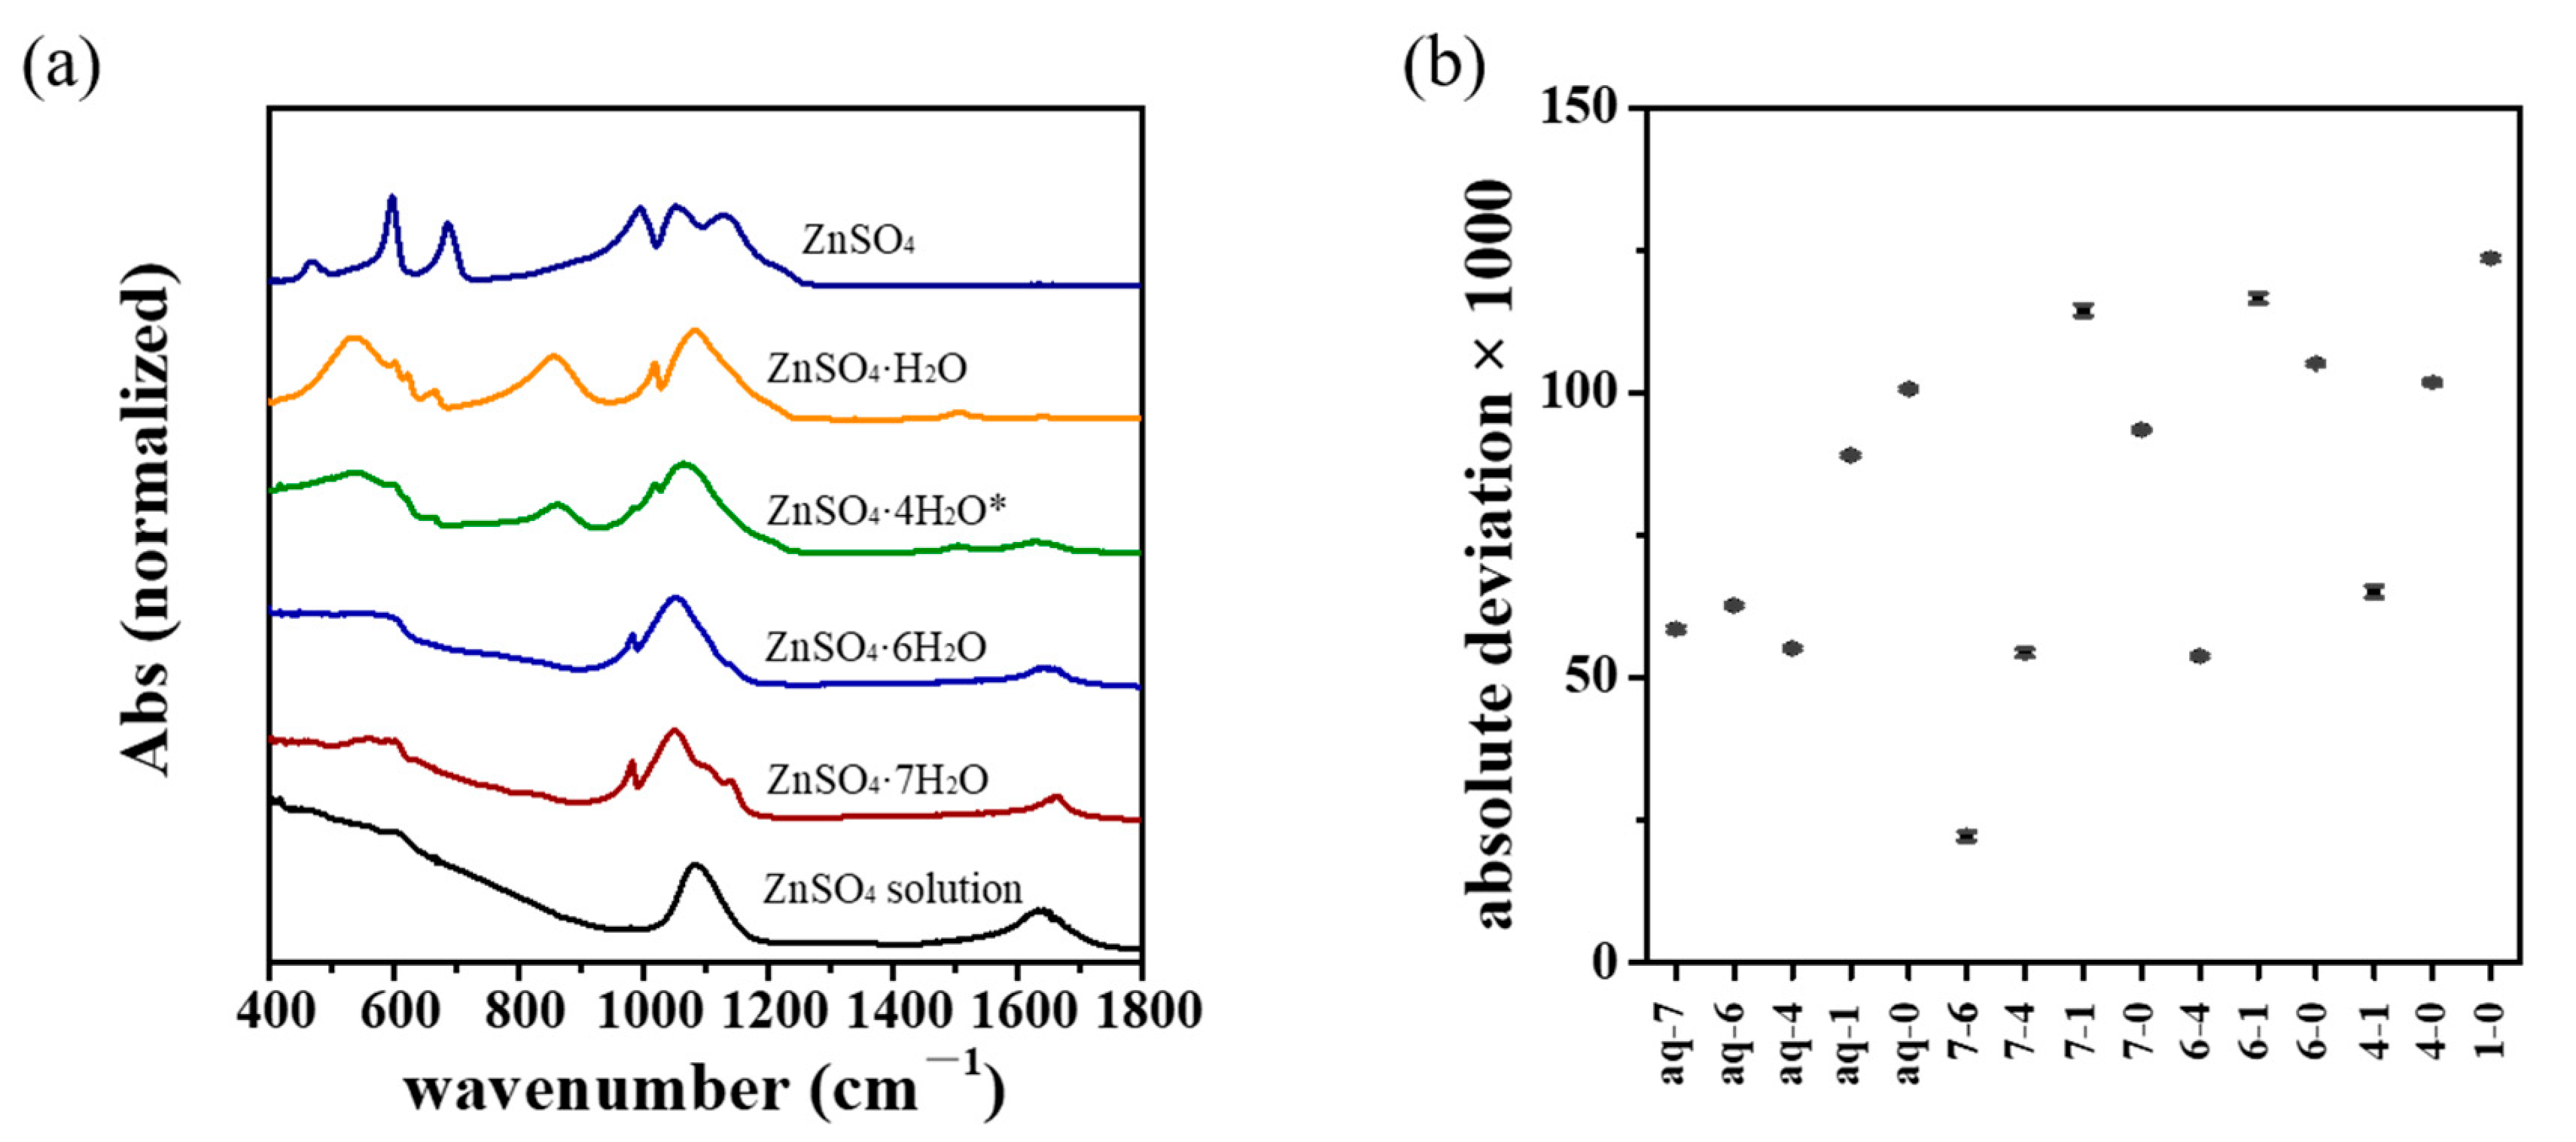
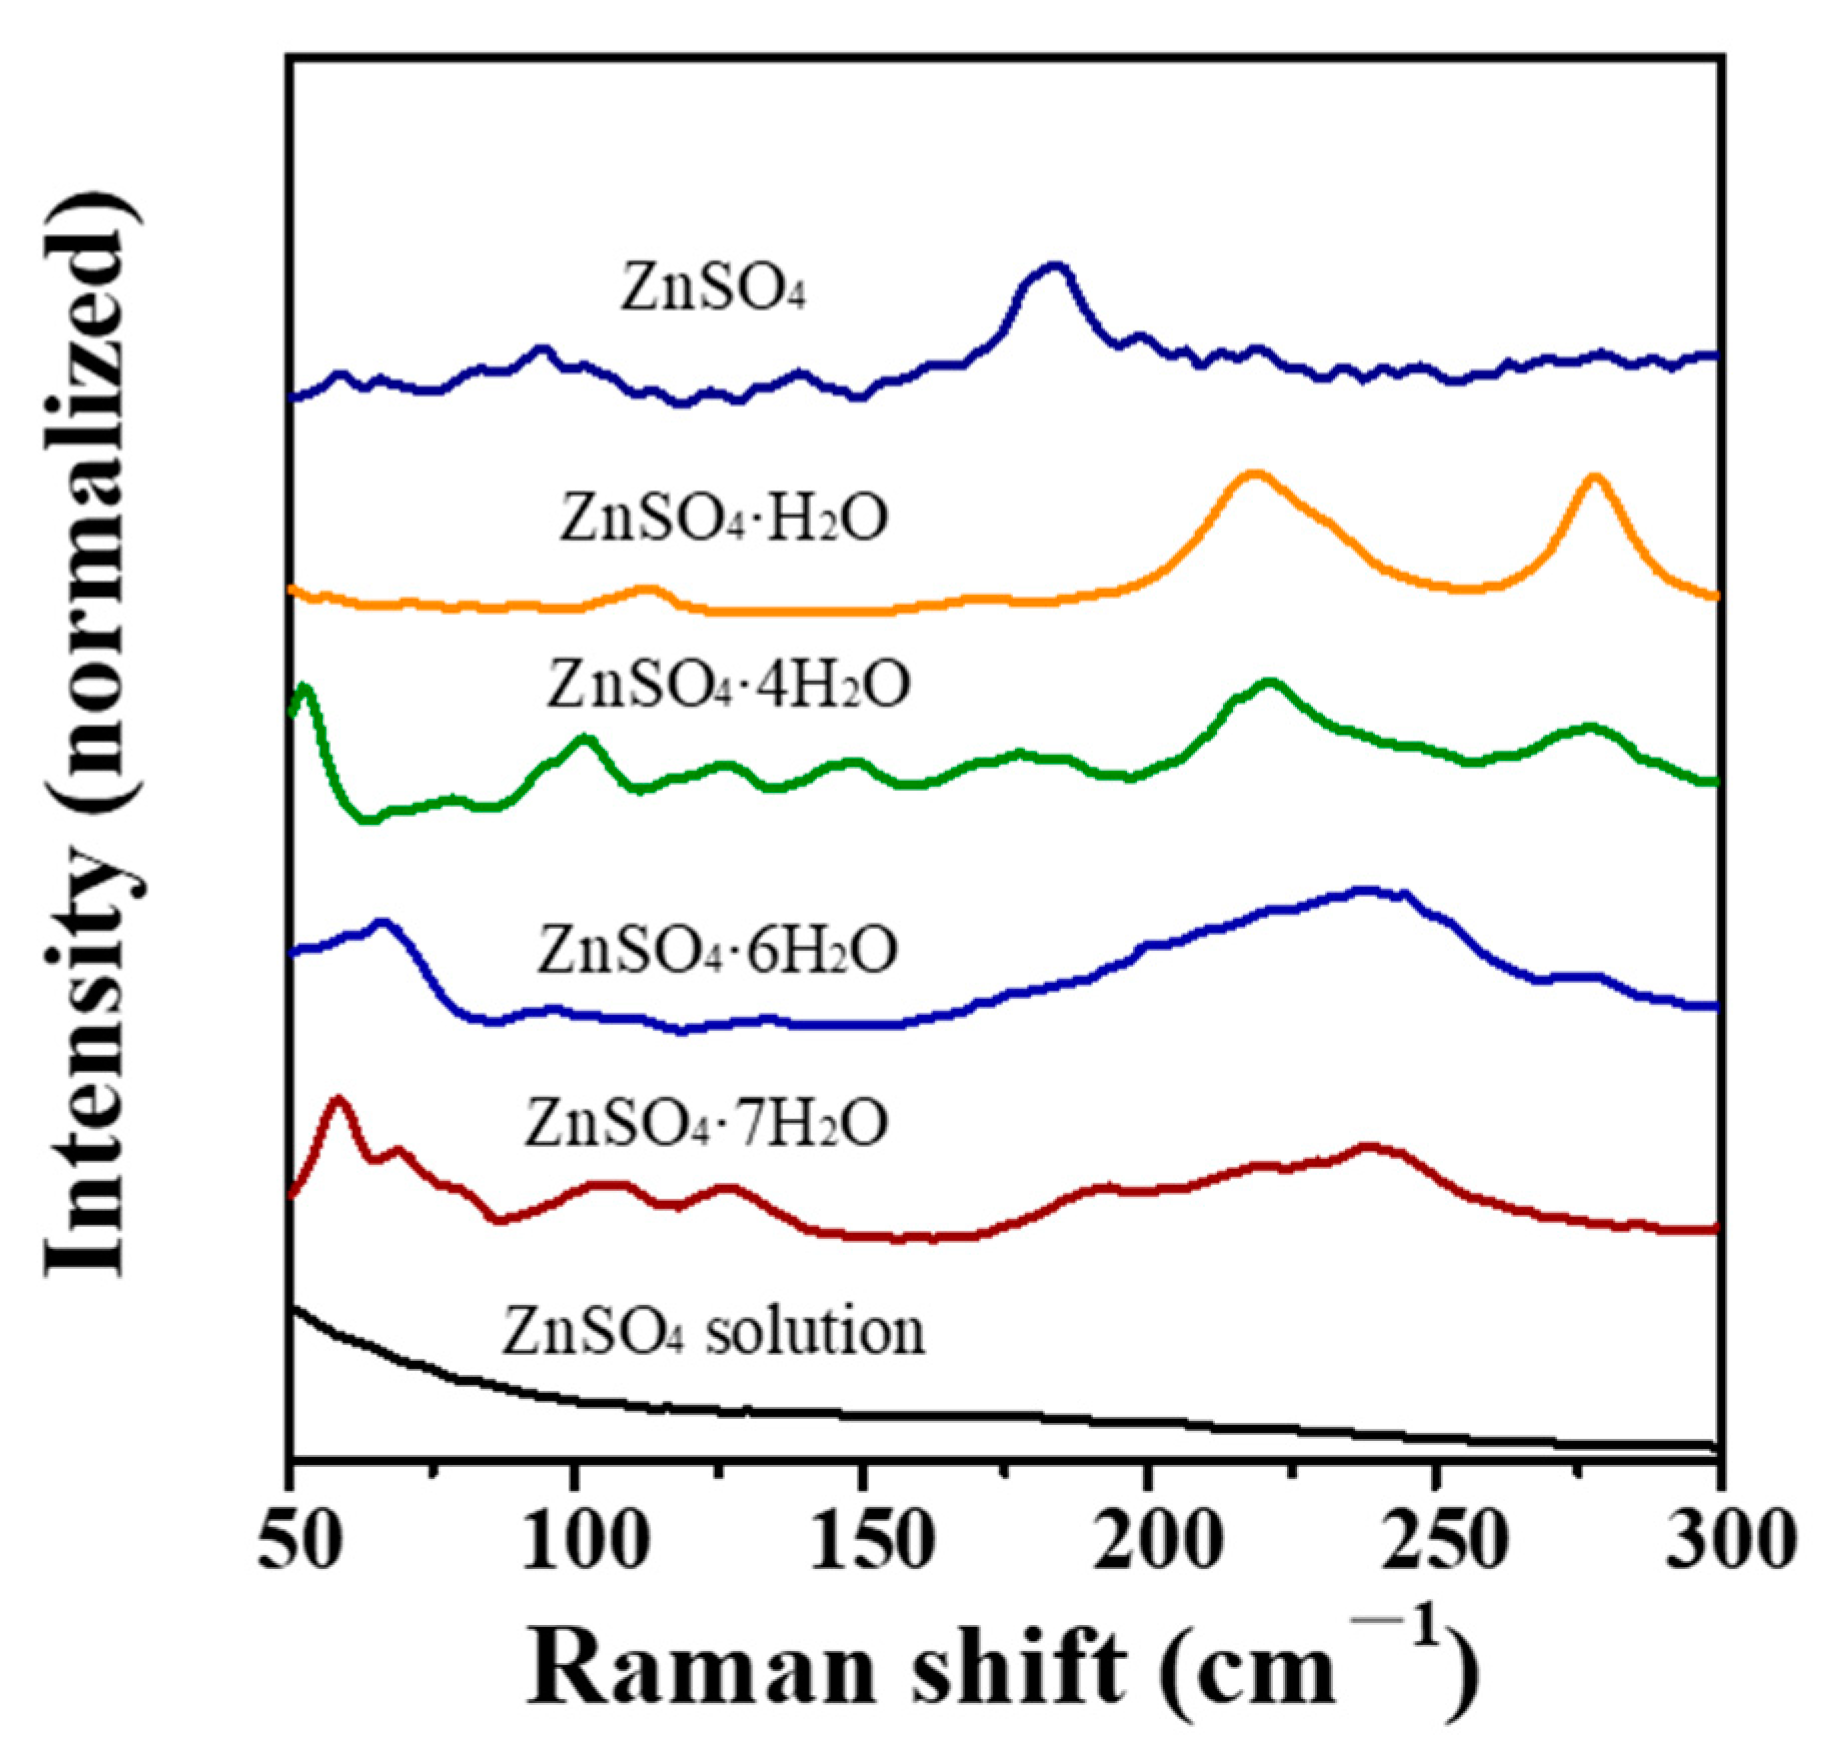
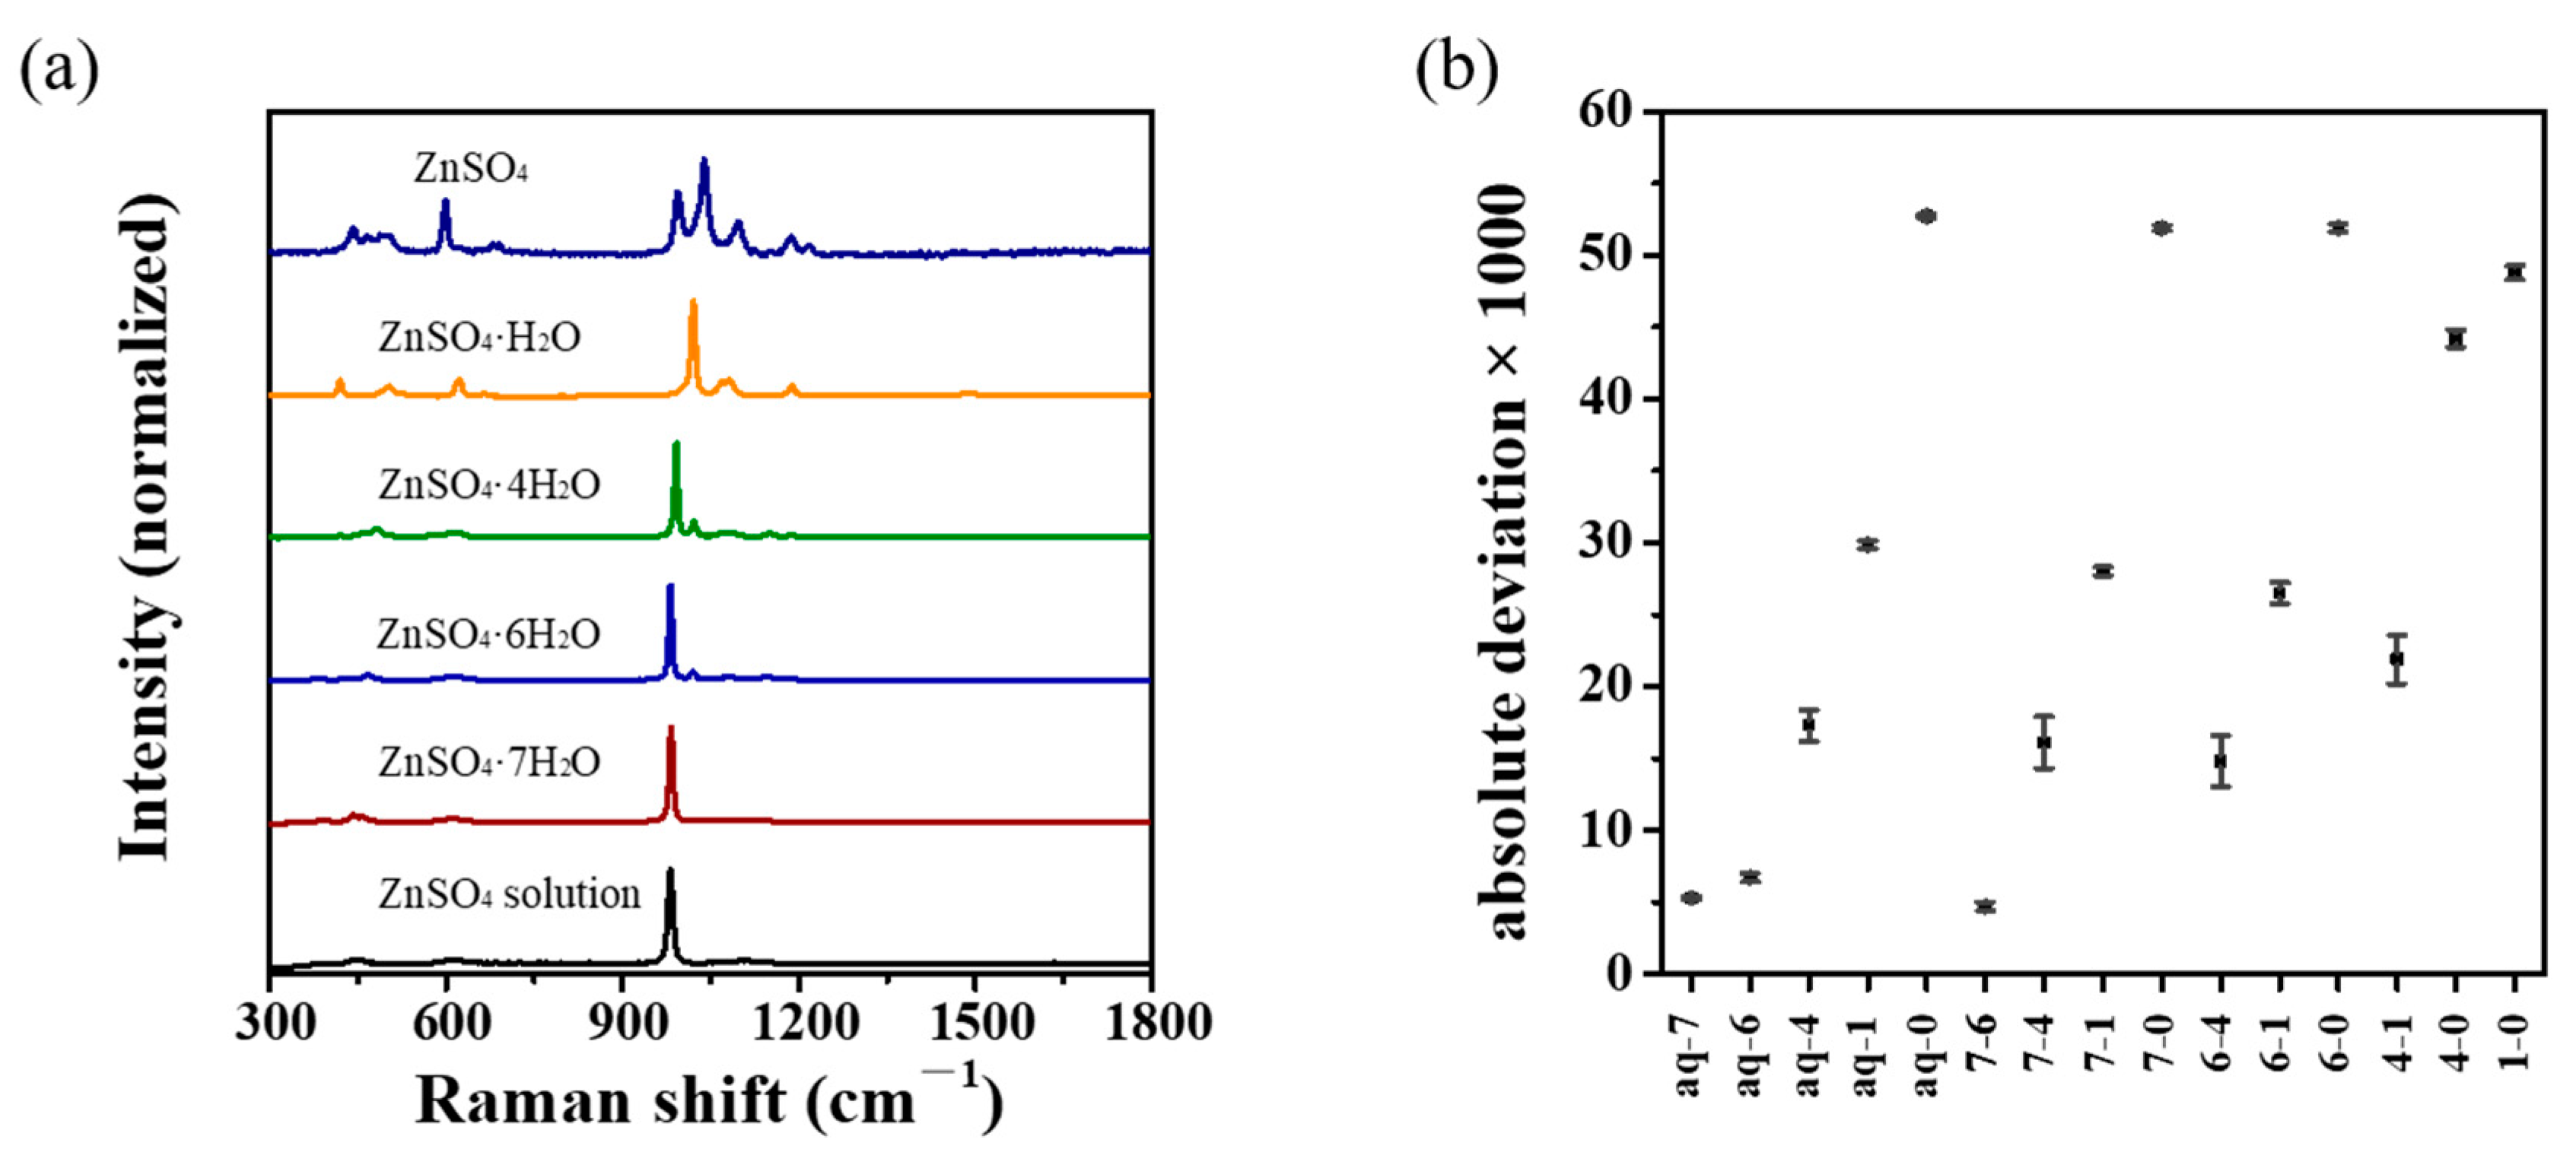
3.3. Vibrational Spectroscopic Analysis

The spectroscopic method has been widely used in the field of hydrates [37]. Spectroscopic techniques are usually non-destructive, and can provide information at the molecular levels, which is helpful for understanding the dehydration process. The limitation of the spectroscopic method lies in the fact that without the PXRD results or standard spectra, the crystal form cannot be determined. The combination of macroscopic TGA and PXRD makes it possible to study the dehydration of ZnSO4·7H2O by infrared (IR) and Raman spectroscopy.
Mid-frequency IR spectra (in the range of 400–1800 cm−1, Figure 4a, Table 3) show the main signals of ZnSO4 samples, while high-frequency IR spectra do not provide much information (Figure S3). The IR spectrum of ZnSO4 saturated aqueous solution shows two strong bands at 1084 cm−13- SO 4 2 , asymmetric stretching vibration band) and 1643 cm−1 (δ-OH), and two weak bands at 601 cm−1as- SO 4 2 , asymmetrical angular vibration band) and 980 cm−11- SO 4 2 , symmetric stretching vibration band) [17,38]. ν3 at 1053 cm−1 is observed in ZnSO4·7H2O and ZnSO4·6H2O, and shifts to 1063 cm−1 for ZnSO4·4H2O* and 1082 cm−1 for ZnSO4·H2O. δ-OH exists in ZnSO4·7H2O, 6H2O and 4H2O*, and disappears in ZnSO4·H2O and anhydrous ZnSO4. The IR spectrum of anhydrous ZnSO4 is quite different from those of the other samples, indicating a different molecular packing pattern. IR difference spectra analysis was used to establish the similarity orders among ZnSO4 samples, as reported in our previous work [39]. The absolute deviations of values in the IR difference spectra show that the similarity can be easily divided into three regions (Figure 4b). The most similar region is 7–6. The second similar region includes aq-7, aq-6, aq-4,7-4, 6-4, and 4-1. The other comparisons show poor similarities.
Low-frequency Raman spectroscopy (LFRS, below 300 cm−1) is associated with lattice vibrations, which is often used to distinguish polymorphs [40,41]. The LFRS of ZnSO4 aqueous solution does not show obvious bands, confirming the features of the solution. The LFRS values of ZnSO4·7H2O (59, 69, 107, 127, 193, 220, 238 cm−1), ZnSO4·6H2O (66, 96, 111, 133, 221, 236 cm−1), ZnSO4·4H2O (52, 78, 102, 126, 149, 178, 221, 277 cm−1), ZnSO4·H2O (112, 171, 218, 278 cm−1) and anhydrous ZnSO4 (95, 139, 184 cm−1 with a poor signal-to-noise ratio) show different characteristic Raman bands (Figure 5).
Mid-frequency Raman spectra (MFRS, range of 300–1800 cm−1, Figure 6a, Table 4) showing the molecular vibration signals with a good signal-to-noise ratio are commonly used for compound identification [42], whereas high-frequency Raman spectra do not provide useful information (Figure S4). The MFRS of ZnSO4 solution shows one strong band at 982 cm−11- SO 4 2 ), and three weak bands at 448, 613, and 1104 cm−1, corresponding to ν2- SO 4 2 (depolarized deformation modes), ν4- SO 4 2 (depolarized deformation modes), and ν3- SO 4 2 [43,44]. The MFRS values of ZnSO4 solution, ZnSO4·7H2O, 6H2O, 4H2O and 1H2O are similar in visual. The strong ν1 of ZnSO4 solution, ZnSO4·7H2O and 6H2O is at 982 cm−1, and shifts to 991 cm−1 for 4H2O and 1020 cm−1 for 1H2O. The MFRS of anhydrous ZnSO4 is different from those of the other ZnSO4 samples. Mid-frequency Raman difference spectra analysis was also used to establish the similarity orders [39] among ZnSO4 samples. The absolute deviations of the values in Raman difference spectra show that the similarity can be divided into four regions (Figure 6b). The most similar region is aq-7, aq-6, and 7-6. The second similar region includes aq-4, 7-4, and 6-4. The third similar region includes aq-1, 7-1, and 6-1. The comparison of 4-1 is between the second region and the third region. The other comparisons show poor similarities.

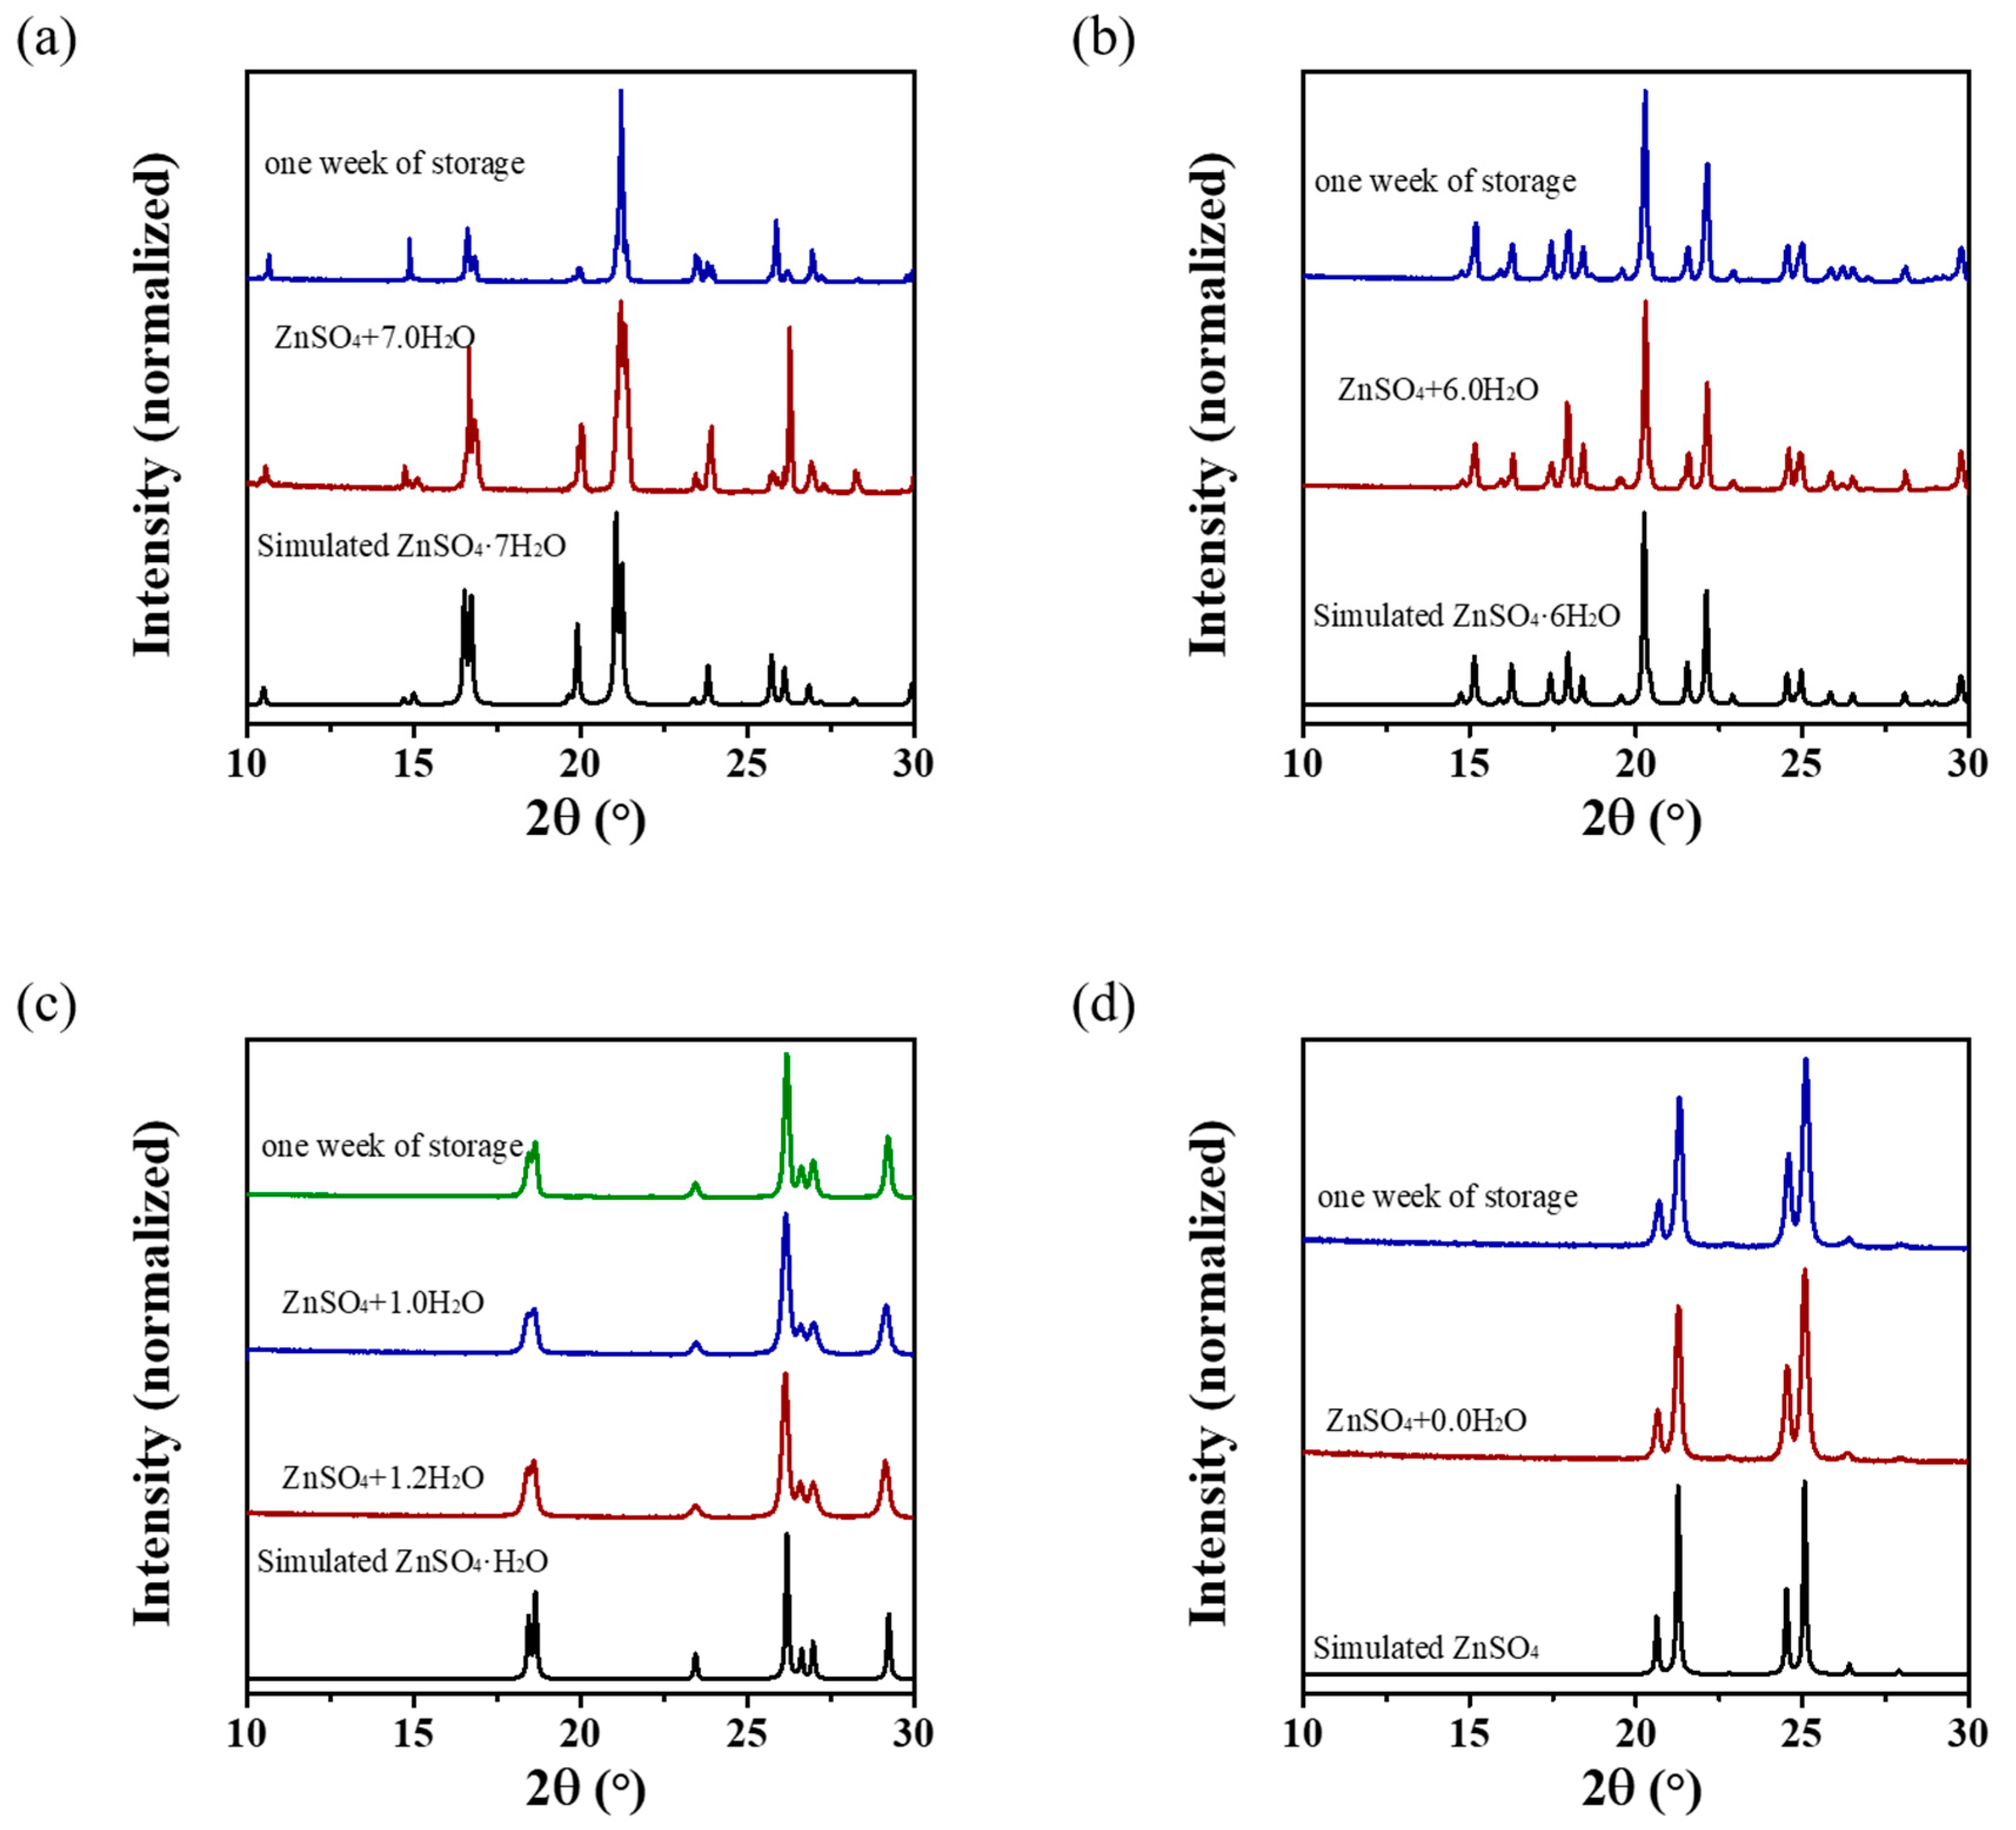
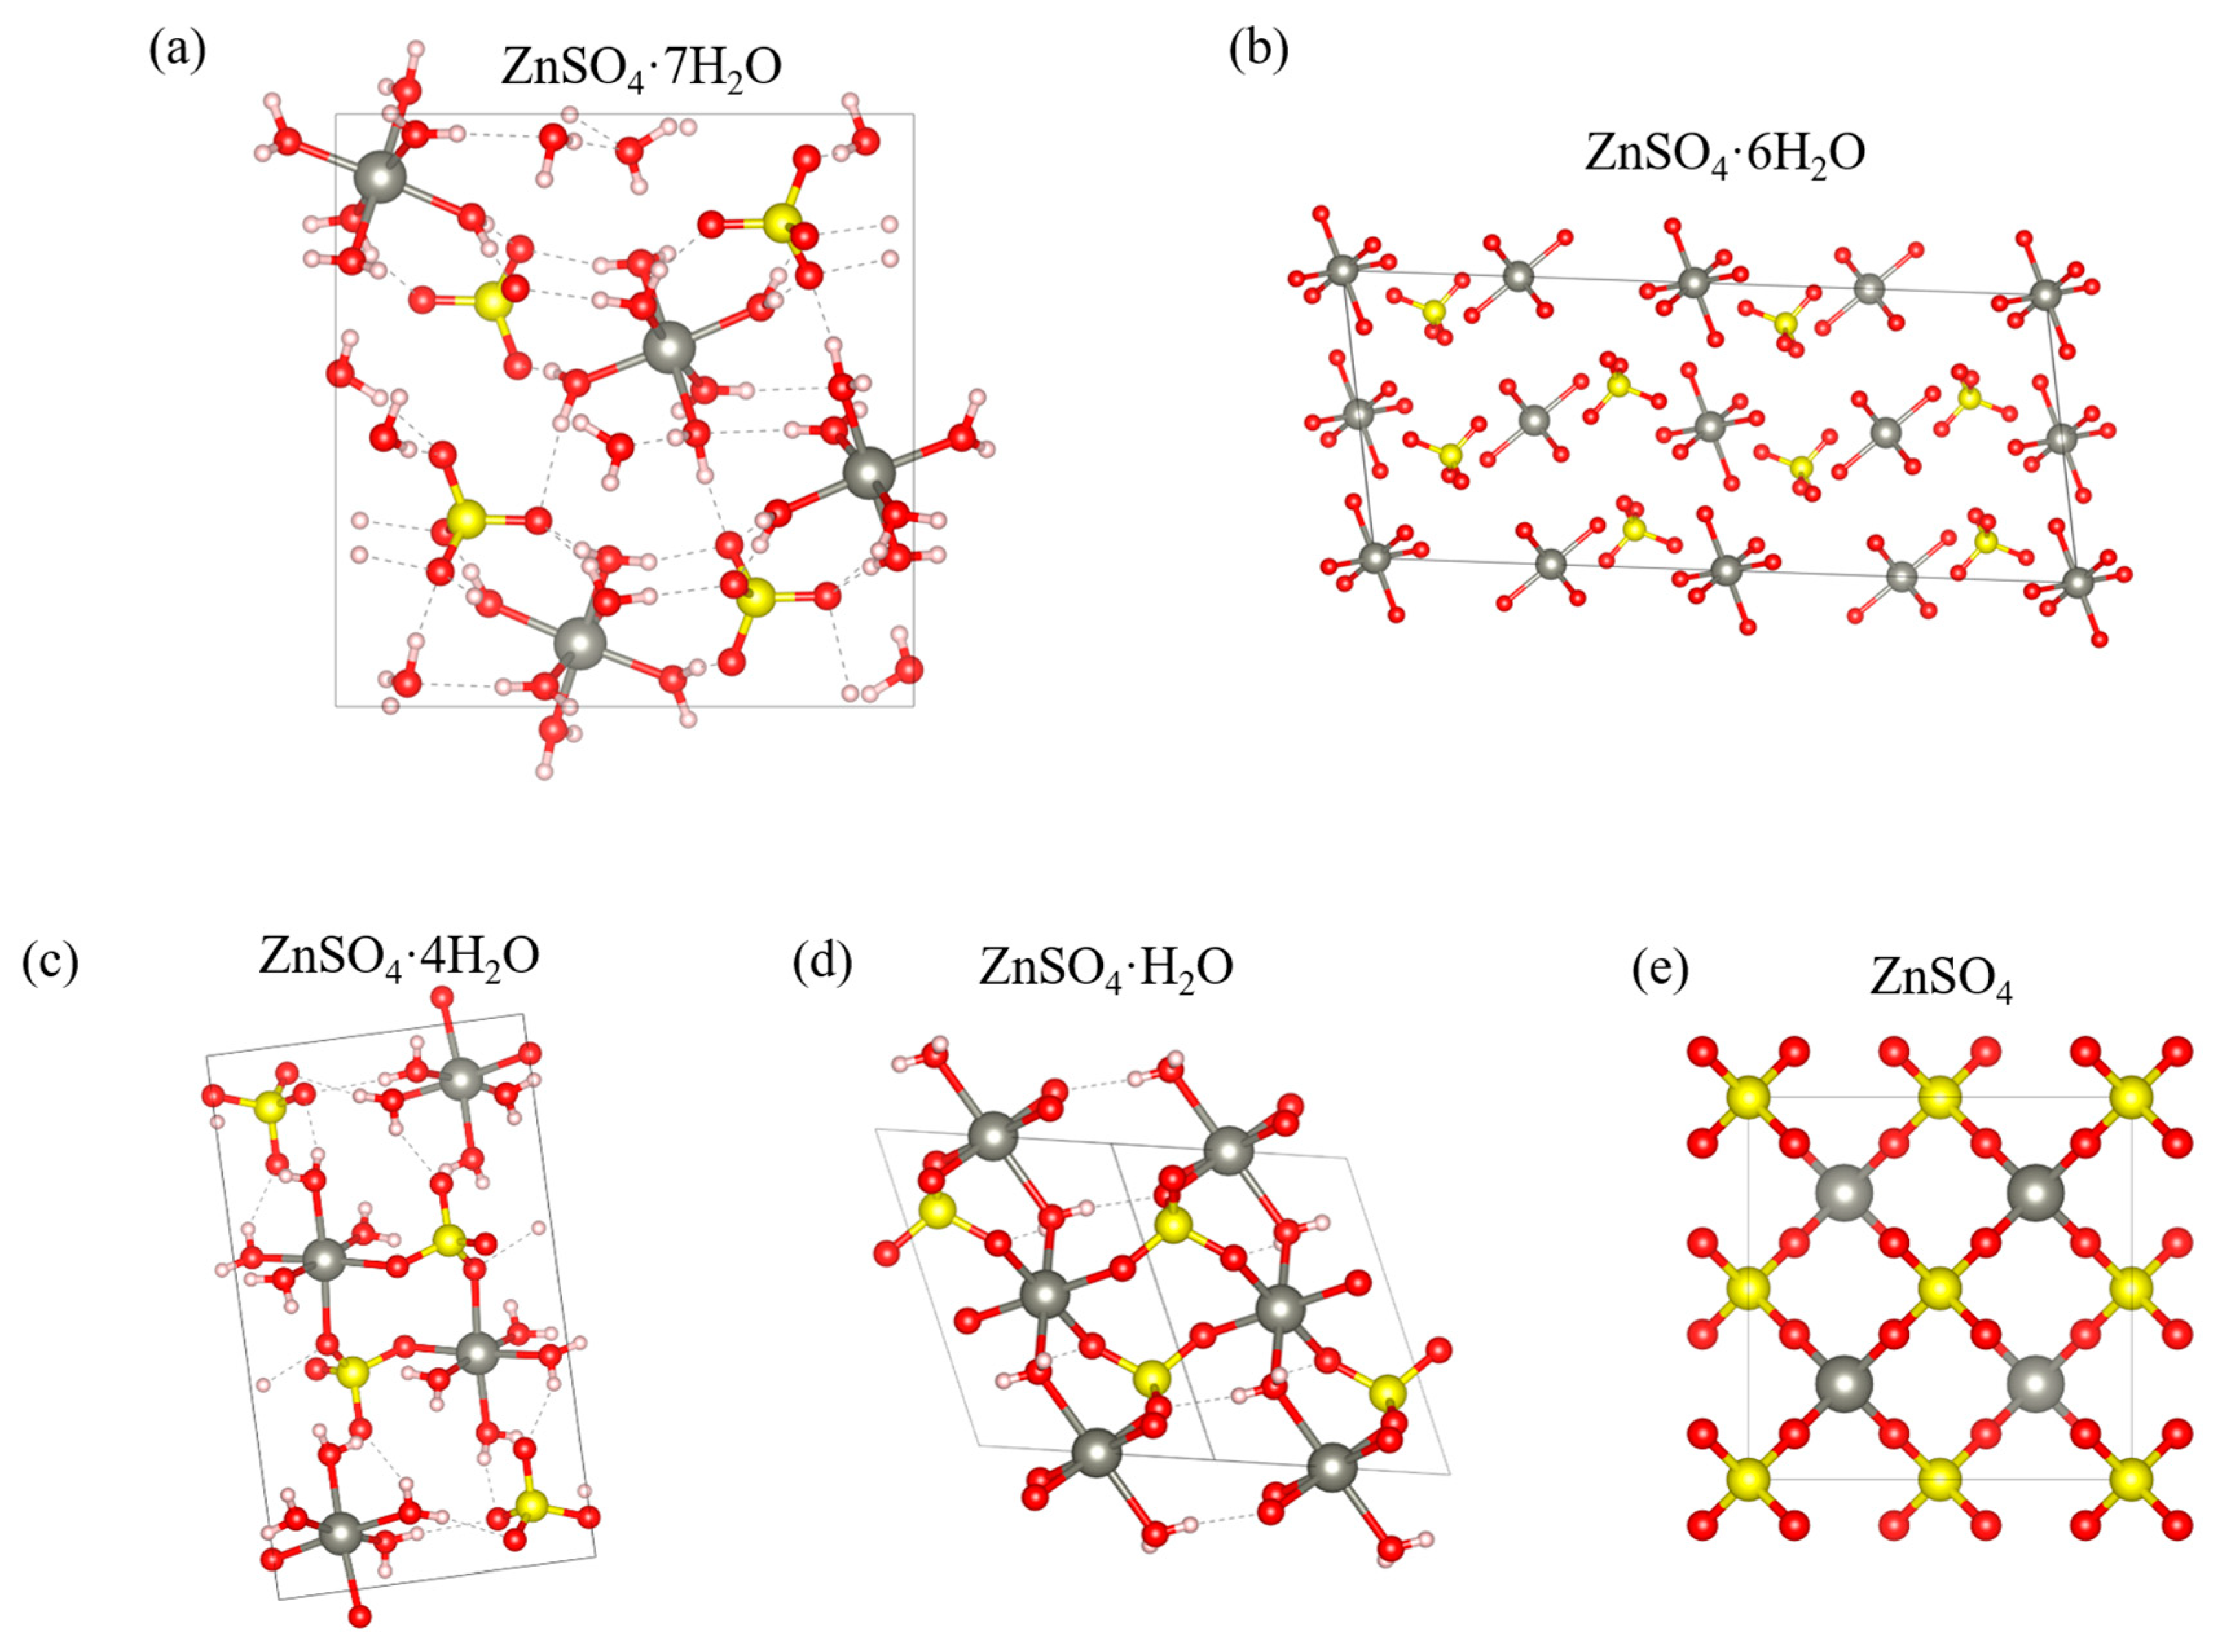
3.4. Crystallographic Analysis

The crystal structure of ZnSO4·7H2O (Figure 7a) reveals the presence of two distinct zinc ions in the unit cell. The coordination environments of the two Zn2+ are identical, coordinated with six water molecules in the form of [Zn(H2O)6]2+, but the orientations of the two [Zn(H2O)6]2+ are different. SO 4 2 does not coordinate with Zn2+. ZnSO4·7H2O can be represented as [Zn(H2O)6]SO4·H2O. The two O atoms in the sulfate group are connected to the water molecule of two [Zn(H2O)6]2+ molecules with hydrogen bonding, forming a zigzag one-dimensional chain structure denoted as [Zn(H2O)6SO4]n. The additional water molecule is linked to [Zn(H2O)6]2+ and SO 4 2 with hydrogen bonding. Although the crystal structure of ZnSO4·6H2O (Figure 7b) is different from that of ZnSO4·7H2O, the coordination environments of Zn2+ and SO 4 2 in ZnSO4·6H2O are almost the same as those in ZnSO4·7H2O, which can be represented as [Zn(H2O)6]SO4. The unit cell of ZnSO4·6H2O contains two [Zn(H2O)6]2+ molecules with different orientations. The crystal structure of ZnSO4·4H2O (Figure 7c) reveals that the coordination environment of Zn2+ is [Zn(H2O)4(1/2SO4)2] with two orientations. The two O atoms of SO 4 2 are coordinated with a Zn2+ ion. The crystal structure of ZnSO4·H2O (Figure 7d) reveals that the coordination environment of Zn2+ changes [Zn(1/2H2O)2(1/4SO4)4], the O atom of water is coordinated with two Zn2+ ions and each O atom of SO 4 2 is coordinated with one Zn2+ ion. The crystal structure of anhydrous ZnSO4 (Figure 7e) has a high degree of symmetry compared to ZnSO4 hydrates. The coordination environment of Zn2+ can be written as [Zn(1/4SO4)4] which is different from the hexacoordinated Zn2+, and the coordination environment of SO 4 2 is similar to that in ZnSO4·H2O. The significant differences of the Zn2+ coordination environment between ZnSO4·H2O and anhydrous ZnSO4 make the direct transformation between them difficult, which can explain the appearance of a liquid intermediate phase [45].

3.5. Similarity Analysis

Similarity analysis based on different methods may yield different results. It is necessary to adopt various methods to perform the structural similarity analysis. Herein, vibrational spectroscopy and crystal structure are used to determine the similarity order. IR difference spectra indicate that 7H2O and 6H2O are most similar, suggesting a kinetic dehydration process of 7 → 6. 4H2O is the most similar to 6H2O in the dehydration process of 6H2O, suggesting a kinetic process of 6 → 4. The kinetic process of 4 → 1 is proposed with similar analysis. The IR spectra analysis suggests that the gradual dehydration process of 7H2O is 7 → 6 → 4 → 1 → 0 (Figure 8a). Raman difference spectra analysis shows similar results to IR difference spectra analysis, except in the dehydration process of 6H2O; the kinetic process can be 6 → 4 or 6 → 1. The Raman spectra analysis suggests that the gradual dehydration process of 7H2O is 7 → 6 → 4 → 1 → 0 and 7 → 6 → 1 → 0 (Figure 8b). The simplified coordination environments of Zn2+ in various crystal structures are schematized and compared (Figure 8c). The simplified Zn2+ environments are [Zn(H2O)6]2+ in 7H2O and 6H2O, [Zn(H2O)4(1/2SO4)2] in 4H2O, [Zn(1/2H2O)2(1/4SO4)4] in 1H2O, and [Zn(1/4SO4)4] in anhydrous ZnSO4. The coordination environment analysis of Zn2+ suggests that the gradual dehydration process of 7H2O is 7 → 6 → 4 → 1 → 0. The simplified coordination environment of SO 4 2 suggests that the gradual dehydration process of 7H2O is 7 → 6 → 4 → 1 → 0 and 7 → 6 → 4 → 0 (Figure 8d). Both the similarity analysis based on vibrational spectroscopy and crystal structure suggest that the kinetic gradual dehydration process of ZnSO4·7H2O is 7 → 6 → 4 → 1 → 0.

4. Discussion

4.1. Macroscopic TGA Combined with PXRD

Macroscopic TGA and PXRD are very common methods in the laboratory and industry. The combination of macroscopic TGA and PXRD is a feasible method that enables the acquisition of intermediate products with precise water content and accurate polymorph during the dehydration process of hydrates. Macroscopic TGA ensures the precise determination of compositions, while PXRD guarantees the accurate identification of crystalline forms. Macroscopic TGA conducted under different conditions may induce different dehydration processes and result in different products. Products with precise compositions and accurate polymorphs are conducive to obtaining the fundamental spectra, which is difficult to achieve through other methods. Acquisition of these fundamental data facilitates the proposal of dehydration mechanisms and designs of the thermal energy storage and release systems based on ZnSO4·7H2O [46]. The method combining macroscopic TGA with PXRD is also suitable for capturing the intermediate phases during the desolvation process of solvates and the solvent evaporation crystallization process.

4.2. Preparations of ZnSO4·4H2O

ZnSO4·4H2O single crystal can be prepared via vapor phase diffusion of diethyl ether into a reflux acetonitrile solution of hydrated zinc tetrafluoroborate and 2,6-bis(2-mercapto-1-methylimidazole)pyridine after a period of seven months [47], showing that it is difficult to prepare ZnSO4·4H2O. Based on the results of similarity analysis, it is possible to obtain ZnSO4·4H2O at room temperature with a suitable humidity through the 7 → 6 → 4 dehydration process. The PXRD patterns indicate that under atmospheric conditions (26 °C, 60% humidity), ZnSO4·7H2O mainly transforms into ZnSO4·6H2O after 3 days and into ZnSO4·4H2O with a small amount of ZnSO4·H2O after 5 days (Figure 9a). The sample mainly composed of ZnSO4·4H2O remained stable even after being exposed to the air for one month. IR and Raman spectroscopic analyses also indicate that it is possible to crystalize ZnSO4·4H2O from ZnSO4 aqueous solution. The spray drying product of ZnSO4 aqueous solution is a mixture of ZnSO4·4H2O and ZnSO4·H2O (Figure 9b). Similarity principle can guide the preparation methods of metastable intermediate phases. However, neither of these two methods can prepare pure phase of ZnSO4·4H2O with accurate composition. The macroscopic dehydration of ZnSO4·7H2O at 70 °C to ZnSO4 + 4.0H2O is a quick and feasible method for the preparation of ZnSO4·4H2O.

5. Conclusions

In the dehydration process of ZnSO4·7H2O, intermediate hydrates with precise water contents, including ZnSO4·6H2O, ZnSO4·4H2O and ZnSO4·H2O, were prepared by macroscopic TGA and confirmed by PXRD. IR and Raman spectra of the various ZnSO4 hydrates were obtained and compared for the first time. IR, Raman spectroscopic analysis and crystallographic analysis explain the gradual dehydration process of 7 → 6 → 4 → 1 → 0 based on the principle of similarity. Macroscopic TGA combined with PXRD is a feasible method for preparing intermediate hydrates with precise water contents and accurate polymorphs, and obtaining the related spectra in the dehydration process of hydrates.

Supplementary Materials

The following supporting information can be downloaded at: https://www.mdpi.com/article/10.3390/cryst15030257/s1, Table S1: Characteristic 2θ peaks of ZnSO4·nH2O; Figure S1: DSC-TGA curve of ZnSO4·7H2O with a heating rate of 1 K·min−1; Figure S2: Linear relationship between the PXRD diffraction intensity ratio and the mass ratio of ZnSO4·6H2O and ZnSO4·H2O; Figure S3: High-frequency IR spectra of ZnSO4 samples; Figure S4: High-frequency Raman spectra of ZnSO4 samples.

Author Contributions

Conceptualization, methodology, supervision, resources, F.C. and R.X.; project administration, investigation, data curation, validation, C.D. and W.Z.; visualization, writing—original draft preparation, F.C.; writing—review and editing, R.X.; funding acquisition, F.C. and R.X. All authors have read and agreed to the published version of the manuscript.

Funding

This research was funded by the National Natural Science Foundation of China (grant number 22005175), the Natural Science Foundation of Fujian Province (grant number 2020J01374, 2021J011116).

Data Availability Statement

The original contributions presented in the study are included in the article/Supplementary Material; further inquiries can be directed to the corresponding authors.

Conflicts of Interest

The authors declare no conflicts of interest.

References

  1. Makatun, V.N.; Shchegrov, L.N. State of water in inorganic crystal hydrates and the characteristic features of their dehydration. Russ. Chem. Rev. 1972, 41, 905. [Google Scholar] [CrossRef]
  2. Li, Y.; Li, C.; Lin, N.; Xie, B.; Zhang, D.; Chen, J. Review on tailored phase change behavior of hydrated salt as phase change materials for energy storage. Mater. Today Energy 2021, 22, 100866. [Google Scholar] [CrossRef]
  3. Hua, W.; Yan, H.; Zhang, X.; Xu, X.; Zhang, L.; Shi, Y. Review of salt hydrates-based thermochemical adsorption thermal storage technologies. J. Energy Storage 2022, 56, 106158. [Google Scholar] [CrossRef]
  4. Yan, T.S.; Li, T.X.; Xu, J.X.; Chao, J.W. Understanding the transition process of phase change and dehydration reaction of salt hydrate for thermal energy storage. Appl. Therm. Eng. 2020, 166, 114655. [Google Scholar] [CrossRef]
  5. Xu, J.; Li, T.; Yan, T.; Chao, J.; Wang, R. Dehydration kinetics and thermodynamics of magnesium chloride hexahydrate for thermal energy storage. Sol. Energy Mater. Sol. Cells 2021, 219, 110819. [Google Scholar] [CrossRef]
  6. Okhrimenko, L.; Dussouillez, J.; Johannes, K.; Kuznik, F. Thermodynamic equilibrium and kinetic study of lanthanum chloride heptahydrate dehydration for thermal energy storage. J. Energy Storage 2022, 48, 103562. [Google Scholar] [CrossRef]
  7. Xie, N.; Huang, Z.; Luo, Z.; Gao, X.; Fang, Y.; Zhang, Z. Inorganic salt hydrate for thermal energy storage. Appl. Sci. 2017, 7, 1317. [Google Scholar] [CrossRef]
  8. Man, X.; Lu, H.; Xu, Q.; Wang, C.; Ling, Z. Review on the thermal property enhancement of inorganic salt hydrate phase change materials. J. Energy Storage 2023, 72, 108699. [Google Scholar] [CrossRef]
  9. Raijada, D.; Arnfast, L.; Bond, A.D.; Aho, J.; Bøtker, J.; Sandler, N.; Rantanen, J. Dehydration of nitrofurantoin monohydrate during melt extrusion. Cryst. Growth Des. 2017, 17, 3707–3715. [Google Scholar] [CrossRef]
  10. Preturlan, J.G.D.; Vieille, L.; Quiligotti, S.; Favergeon, L. Kinetics and mechanism of the dehydration of calcium sulfate dihydrate: A comprehensive approach for studying the dehydration of ionic hydrates under controlled temperature and water vapor pressure. J. Phys. Chem. C 2020, 124, 26352–26367. [Google Scholar] [CrossRef]
  11. Eaby, A.C.; Myburgh, D.C.; Kosimov, A.; Kwit, M.; Esterhuysen, C.; Janiak, A.M.; Barbour, L.J. Dehydration of a crystal hydrate at subglacial temperatures. Nature 2023, 616, 288–292. [Google Scholar] [CrossRef]
  12. Koplík, J.; Švec, J.; Másilko, J.; Sedlačík, M.; Bartoníčková, E. Synthesis of calcium aluminate hydrates, their characterization and dehydration. Ceram. Int. 2025, 51, 5536–5543. [Google Scholar] [CrossRef]
  13. de Castelnuovo, S.; Harness, J.B.; McColm, I.J. The role of liquid water in crystalline hydrate dehydration: Copper sulphate pentahydrate. J. Therm. Anal. Calorim. 2001, 63, 233–247. [Google Scholar] [CrossRef]
  14. Cheng, L.; Li, W.; Li, Y.; Yang, Y.; Li, Y.; Cheng, Y.; Song, D. Thermal analysis and decomposition kinetics of the dehydration of copper sulfate pentahydrate. J. Therm. Anal. Calorim. 2019, 135, 2697–2703. [Google Scholar] [CrossRef]
  15. Gamo, I. Infrared absorption spectra of water of crystallization in copper sulfate penta- and monohydrate crystals. Bull. Chem. Soc. Jpn. 1961, 34, 764–766. [Google Scholar] [CrossRef]
  16. White, R.L. Variable temperature infrared study of copper sulfate pentahydrate dehydration. Thermochim. Acta 2012, 528, 58–62. [Google Scholar] [CrossRef]
  17. Widjaja, E.; Chong, H.H.; Tjahjono, M. Use of thermo-Raman spectroscopy and chemometric analysis to identify dehydration steps of hydrated inorganic samples—Application to copper sulfate pentahydrate. J. Raman Spectrosc. 2010, 41, 181–186. [Google Scholar] [CrossRef]
  18. Rabbering, G.; Wanrooy, J.; Schuijff, A. The dehydration of ZnSO4·7H2O and NiSO4·6H2O. Thermochim. Acta 1975, 12, 57–63. [Google Scholar] [CrossRef]
  19. Anderson, J.L.; Peterson, R.C.; Swainson, I.P. Combined neutron powder and X-ray single-crystal diffraction refinement of the atomic structure and hydrogen bonding of goslarite (ZnSO4·7H2O). Mineral. Mag. 2005, 69, 259–271. [Google Scholar] [CrossRef]
  20. Anderson, J.L.; Peterson, R.C.; Swainson, I.P. The atomic structure of deuterated boyleite ZnSO4·4D2O, ilesite MnSO4·4D2O, and bianchite ZnSO4·6D2O. Am. Mineral. 2012, 97, 1905–1914. [Google Scholar] [CrossRef]
  21. Chihara, H.; Seki, S. Studies of crystalline hydrates. II. Thermal transition and dehydration of Ni-, Fe-, Co-, Zn-, Mn-, and Mg-sulfate hydrates. Bull. Chem. Soc. Jpn. 1953, 26, 88–92. [Google Scholar] [CrossRef]
  22. Wheeler, R.C.; Frost, G.B. A comparative study of the dehydration kinetics of several hydrated salts. Can. J. Chem. 1955, 33, 546–561. [Google Scholar] [CrossRef]
  23. Razouk, R.I.; Mikhail, R.S.; Ghorab, H.Y. Dehydration and rehydration behaviour of zinc and magnesium sulphate heptahydrates. J. Appl. Chem. 1969, 19, 329–335. [Google Scholar] [CrossRef]
  24. Grønvold, F.; Meisingset, K.K. Thermodynamic properties and phase transitions of salt hydrates between 270 and 400 K I. NH4Al(SO4)2 · 12H2O, KAl(SO4)2 · 12H2O, Al2(SO4)3 · 17H2O, ZnSO4 · 7H2O, Na2SO4 · 10H2O, and Na2S2O3 · 5H2O. J. Chem. Thermodyn. 1982, 14, 1083–1098. [Google Scholar] [CrossRef]
  25. Straszko, J.; Olszak-Humienik, M.; Możejko, J. Kinetics of thermal decomposition of ZnSO4·7H2O. Thermochim. Acta 1997, 292, 145–150. [Google Scholar] [CrossRef]
  26. Lin, F.; Yang, S. The study of the dehydrating mechanism of zinc sulfate heptahydrate. J. Chongqing Norm. Uni. 2006, 23, 55–57. [Google Scholar]
  27. Saha, J.; Podder, J. Crystallization of zinc sulphate single crystals and its structural, thermal and optical characterization. J. Bangladesh Acad. Sci. 2011, 35, 203–210. [Google Scholar] [CrossRef]
  28. Attia, S.; Hevroni, L.; Danon, A.; Meyerstein, D.; Koresh, J.E.; Finkelstein, Y. The role of the cation in the oxygen isotopic exchange in crystalline sulfate salt hydrates. Adsorption 2013, 19, 821–833. [Google Scholar] [CrossRef]
  29. Carsky, M.; Veselý, V.; Hartman, M.; Haluza, J. Dehydration of zinc sulphate in a fluidised bed drier. S. Afr. J. Chem. Eng. 2014, 19, 1–8. [Google Scholar]
  30. Yang, W.; Jun, Y. Gibbs free energy minimization and TG-DTA analysis for thermal decomposition of zinc sulfate heptahydrate. Inorg. Chem. Ind. 2014, 46, 31–33. [Google Scholar]
  31. Höffler, F.; Müller, I.; Steiger, M. Thermodynamic properties of ZnSO4 (aq) and phase equilibria in the ZnSO4 –H2O system from 268 K to 373 K. J. Chem. Thermodyn. 2018, 116, 279–288. [Google Scholar] [CrossRef]
  32. Rehman, A.U.; Maosheng, Z.; Hayat, A. Hydration performance and cycling stability of threeTCM:MgSO4, ZnSO4 and FeSO4. Int. J. Energy Res. 2020, 44, 6981–6990. [Google Scholar] [CrossRef]
  33. Liu, H.; Chen, G.-M.; Ma, J.; Fan, Y.-X.; Tao, Z.-Y. Zinc sulfate hydrates characterization by terahertz time domain spectroscopy. Optik 2022, 253, 168594. [Google Scholar] [CrossRef]
  34. Rego, A.S.C.; Navarro, R.C.S.; Brocchi, E.A.; Souza, R.F.M. Kinetic modeling of the thermal decomposition of zinc sulfate through a global optimization method. Metall. Mater. Trans. B 2022, 53, 4105–4113. [Google Scholar] [CrossRef]
  35. Bertouche, S.; Tomao, V.; Ruiz, K.; Hellal, A.; Boutekedjiret, C.; Chemat, F. First approach on moisture determination in food products using alpha-pinene as an alternative solvent for Dean–Stark distillation. Food Chem. 2012, 134, 602–605. [Google Scholar] [CrossRef]
  36. Moya, M.; Sánchez, D.; Romero, J.Á.; Villar-García, J.R. Influence of Moisture Content on Some Mechanical Properties of Wheat. Agronomy 2024, 14, 347. [Google Scholar] [CrossRef]
  37. Sivakumar, A.; Sahaya Jude Dhas, S.; Elberin Mary Theras, J.; Jose, M.; Sivaprakash, P.; Arumugam, S.; Martin Britto Dhas, S.A. Spectroscopic and diffraction studies of polycrystalline copper sulfate pentahydrate at shocked conditions. Solid State Sci. 2021, 121, 106751. [Google Scholar] [CrossRef]
  38. Yuvaraj, M.; Subramanian, K.S. Development of slow release Zn fertilizer using nano-zeolite as carrier. J. Plant Nutr. 2018, 41, 311–320. [Google Scholar] [CrossRef]
  39. Fan, Y.; Xue, R.; Chen, F. Explanation and prediction for the product of trehalose dihydrate selective dehydration process using mid-frequency Raman difference spectra. Vib. Spectrosc. 2024, 130, 103626. [Google Scholar] [CrossRef]
  40. Koskela, J.; Sutton, J.J.; Lipiäinen, T.; Gordon, K.C.; Strachan, C.J.; Fraser-Miller, S.J. Low- versus mid-frequency Raman spectroscopy for in situ analysis of crystallization in slurries. Mol. Pharm. 2022, 19, 2316–2326. [Google Scholar] [CrossRef]
  41. Robert, C.; Fraser-Miller, S.J.; Berzins, K.; Okeyo, P.O.; Rantanen, J.; Rades, T.; Gordon, K.C. Monitoring the isothermal dehydration of crystalline hydrates using low-frequency Raman spectroscopy. Mol. Pharm. 2021, 18, 1264–1276. [Google Scholar] [CrossRef] [PubMed]
  42. Fan, Y.; Liang, C.; Li, Y.; Xiao, W.; Niu, Y.; Jin, H.; Xue, R.; Chen, F. Explanation and prediction of the selective crystallization of boscalid by mid-frequency Raman difference spectroscopy analysis. CrystEngComm 2023, 25, 3548–3555. [Google Scholar] [CrossRef]
  43. Zhang, Y.-H.; Chan, C.K. Understanding the hygroscopic properties of supersaturated droplets of metal and ammonium sulfate solutions using Raman spectroscopy. J. Phys. Chem. A 2002, 106, 285–292. [Google Scholar] [CrossRef]
  44. Hayes, A.C.; Kruus, P.; Adams, W.A. Raman spectroscopic study of aqueous (NH4)2SO4 and ZnSO4 solutions. J. Sol. Chem. 1984, 13, 61–75. [Google Scholar] [CrossRef]
  45. Kurban, G.V.T.; Rego, A.S.C.; Mello, N.M.; Brocchi, E.A.; Navarro, R.C.S.; Souza, R.F.M. Thermodynamics and kinetic modeling of the ZnSO4·H2O thermal decomposition in the presence of a Pd/Al2O3 catalyst. Energies 2022, 15, 548. [Google Scholar] [CrossRef]
  46. Pandey, R.; Pourhashem, G.; Gladen, A.C. Screening of salt hydrates and cellulose nanocrystal composites for thermochemical energy storage using life cycle assessment. Sustainable Mater. Technol. 2024, 40, e00889. [Google Scholar] [CrossRef]
  47. Blake, A.J.; Cooke, P.A.; Hubberstey, P.; Sampson, C.L. Zinc(II) sulfate tetrahydrate. Acta Crystallogr. Sect. E Struct. Rep. Online 2001, 57, i109–i111. [Google Scholar] [CrossRef]
Figure 1. (a) Microscopic DSC-TGA curves and (b) macroscopic TGA curves at different temperatures (50, 100 and 150 °C) of ZnSO4·7H2O.
Crystals 15 00257 g001
Figure 2. Preparations of ZnSO4·7H2O, ZnSO4·6H2O, ZnSO4·H2O and anhydrous ZnSO4 with high purity. PXRD patterns of fresh and stored (a) ZnSO4 + 7.0H2O (freshly obtained by slow evaporation of ZnSO4 aqueous solution, (b) ZnSO4 + 6.0H2O (obtained with macroscopic TGA at 50 °C), (c) ZnSO4 + 1.0H2O obtained with macroscopic TGA carried out at 150 °C and ZnSO4 + 1.2H2O obtained with macroscopic TGA at 50 °C, and (d) ZnSO4 + 0.0H2O prepared by macroscopic TGA at 350 °C. The PXRD pattern simulation was carried out with Mercury 2022.3.0 software.
Crystals 15 00257 g002
Figure 3. Preparations of ZnSO4·4H2O as the main product. PXRD patterns of (a) ZnSO4 + 5.0H2O, 4.0H2O, 3.0H2O and 2.0H2O prepared from ZnSO4·7H2O in the macroscopic TGA carried out at 50 °C, (b) ZnSO4 + 4.0H2O obtained at 60, 70 (ZnSO4·4H2O*), 80 and 90 °C, (c) ZnSO4 + 4.0H2O prepared from ZnSO4·6H2O via macroscopic TGA carried out at 70 °C, (d) ZnSO4·4H2O* after being stored for 1, 3, 5 days (the characteristic peak of ZnSO4·4H2O marked with a black arrow disappeared after being stored for 5 days).
Crystals 15 00257 g003
Figure 4. Mid-frequency IR spectroscopic analysis among ZnSO4 solution (aq), ZnSO4·7H2O, ZnSO4·6H2O, ZnSO4·4H2O*, ZnSO4·H2O and anhydrous ZnSO4. (a) IR spectra and (b) absolute deviation (a.d.) of values in the IR difference spectra in the range of 400–1800 cm−1. The errors of the a.d. are shown.
Crystals 15 00257 g004
Figure 5. Low-frequency Raman spectra of ZnSO4 samples.
Crystals 15 00257 g005
Figure 6. Mid-frequency Raman spectra (in the range of 300–1800 cm−1) analysis of ZnSO4 samples. (a) Raman spectra and (b) absolute deviation (a.d.) of values in the Raman difference spectra. The errors of the a.d. are shown.
Crystals 15 00257 g006
Figure 7. Crystal structure analysis among (a) ZnSO4·7H2O, (b) ZnSO4·6H2O, (c) ZnSO4·4H2O, (d) ZnSO4·H2O and (e) anhydrous ZnSO4 (gray: Zn, yellow: S, red: O, white: H).
Crystals 15 00257 g007
Figure 8. Structural similarity analysis based on (a) IR spectra, (b) Raman spectra, and coordination environment of (c) Zn2+ and (d) SO 4 2 among ZnSO4·7H2O, ZnSO4·6H2O, ZnSO4·4H2O, ZnSO4·H2O and anhydrous ZnSO4. ZnSO4·nH2O is represented by the number of water molecules (7, 6, 4, 1 and 0) it contains.
Crystals 15 00257 g008
Figure 9. Preparations of ZnSO4·4H2O. PXRD patterns of (a) dehydration products of ZnSO4·7H2O under air (26 °C, 60% humidity) after 3, 5, and 30 days, (b) spray drying product of ZnSO4 aqueous solution.
Crystals 15 00257 g009
Table 1. Some reported dehydration processes of ZnSO4·7H2O.
YearProcessMethodRefs.
19537 → 6 → 1DTA[21]
19557 → 1 → amorphousXRD (vacuum)[22]
19697 → 6 → 1TGA-DTA[23]
19757 → 6 → 4 → 1DSC, DTA, TGA[18]
19827 → 6 → 1Calorimetric containers of fused silica[24]
19977 → 6 → 1DTA, DTG, TG (5 K·min−1, 20–1000 °C)[25]
20057 → 6 → 4 → 1Neutron PXRD and single-crystal XRD[19]
20067 → 6 → 1 → 0DTA, TG (5 K·min−1)[26]
20117 → 1TGA-DTA (30 °C·min−1 in air)[27]
20127 → 6 → 4 → 1In situ diffraction[20]
20137 → 1 → 0TPD-MS-SMB[28]
20147 → 6 → 1TG-DTA, fluidized bed drier[29]
20147 → 6 → 1 → X → 0TG-DTA (5 K·min−1, 25–1100 °C, air)[30]
20187 → 6 → 1Water vapor sorption analyzer, microbalance[31]
20207 → 5 → 1DSC-TG (1 K·min−1, 25–150 °C, N2)[32]
20227 → 6 → 1All-fiber terahertz time-domain spectroscopy[33]
20227 → 6 → 1TGA (10 K·min−1, 25–1000 °C, N2)[34]
Table 2. Unit cell parameters of ZnSO4·7H2O, ZnSO4·6H2O, ZnSO4·4H2O, ZnSO4·H2O and anhydrous ZnSO4.
7H2O6H2O4H2OH2OAnhydrous
Year19591979200119911978
ICSD No.10728741708280878713482456
SystemOrthorhombicMonoclinicMonoclinicMonoclinicCubic
Space GroupP212121C2/cP21/nC2/cF-43m
a (Å)11.7799.9815.9046.9257.176
b (Å)12.0507.25013.5197.5917.176
c (Å)6.82224.2807.8837.6357.176
α (°)9090909090
β (°)9098.4590.26118.1990
γ (°)9090909090
Table 3. Mid-frequency IR bands of ZnSO4 samples.
Solution7H2O6H2O4H2O*1H2OAnhydrousAssignment [38]
470
561557536534
601602597600601599δas- SO 4 2
623
665665689
861855
980982982984 992ν1- SO 4 2
10171017
105310531063 1050
1084 1082 ν3- SO 4 2
1142 1129
15041504
1643166116511632 δ-OH
Table 4. Mid-frequency Raman bands of ZnSO4 samples.
Solution7H2O6H2O4H2O1H2OAnhydrousAssignment [43,44]
448442 421420442ν2- SO 4 2
466483 468
503496
613612619624623600ν4- SO 4 2
691
982983982991 993ν1- SO 4 2
1020102210201040
1058 10731071
110410941080 10821098ν3- SO 4 2
114011441151
118811881186
1218
Disclaimer/Publisher’s Note: The statements, opinions and data contained in all publications are solely those of the individual author(s) and contributor(s) and not of MDPI and/or the editor(s). MDPI and/or the editor(s) disclaim responsibility for any injury to people or property resulting from any ideas, methods, instructions or products referred to in the content.

