Article

The Diversity of Crystals, Microstructures and Texture That Form Ostreoidea Shells

by
Anna Sancho Vaquer
1,
Erika Griesshaber
1,
Carmen Salas
2,
Elizabeth M. Harper
3,
Antonio G. Checa
4,* and
Wolfgang W. Schmahl
1
1
Department of Geo- and Environmental Sciences, Ludwig-Maximilians-Universität München, 80333 Munich, Germany
2
Department of Animal Biology, Faculty of Sciences, University of Malaga, 29071 Malaga, Spain
3
Department of Earth Sciences, University of Cambridge, Cambridge CB2 3EQ, UK
4
Department of Stratigraphy and Paleontology, University of Granada, 18071 Granada, Spain
*
Author to whom correspondence should be addressed.
Crystals 2025, 15(3), 286; https://doi.org/10.3390/cryst15030286
Submission received: 31 January 2025 / Revised: 7 March 2025 / Accepted: 14 March 2025 / Published: 20 March 2025
(This article belongs to the Section Mineralogical Crystallography and Biomineralization)

Abstract

:
The shells of bivalved molluscs comprise, in general, few microstructures and very few textures. In the case of ostreoid oysters, a high diversity has been observed. The shells consist of columnar-prismatic, foliated, granular calcite and myostracal-prismatic aragonite. Furthermore, voids are incorporated into the ostreoid shell: the pores of the vesicular shell segments and the blades/laths of the chalk lenses. These initiate formation of additional microstructures and textures. We investigated the shells of Magallana gigas, Ostrea stentina, Ostrea edulis (Ostreidae), Hyotissa hyotis, Hyotissa mcgintyi and Neopycnodonte cochlear (Gryphaeidae) with high-resolution, low-kV, electron backscatter diffraction (EBSD) measurements and scanning electron microscopy (FE-SEM) imaging and review the diversity of ostreoid Ca-carbonate microstructures and textures. From a crystallographic perspective, we (i) characterized the sub-micrometer crystal assembly pattern of ostreoid microstructures and textures, (ii) investigated crystal organization at the changeover from one microstructure into the other and (iii) examined how curved crystal surfaces are generated at inner shell surface as well as within the shell, in and at aggregations of folia and foliated units. We show that Ostreoidea are capable of secreting single crystalline, graded and dendritic calcite within the same shell and, hence, are able to vary strongly the degree of crystal co-alignment. We demonstrate that Ostreoidea myostracal aragonite is twinned, while shell calcite is not twinned, neither within different microstructures nor at the changeover between adjacent microstructures. We highlight the very specific microstructure of the foliated shell and demonstrate the strongly regulated gradedness of both the c- and a*-axes orientation of the foliated calcite crystallites.

1. Introduction

The superfamily Ostreoidea appeared in the Triassic and has an excellent fossil record [1,2,3]. The Ostreoidea have been highly successful and have today a global distribution across a wide range of salinities and habitats [4,5]. Ostreoidea live cemented to hard substrates and colonize intertidal to subtidal, marine to brackish environments [3,6]; nonetheless, some species (Neopycnodonte zibrowii, Gofas, Salas and Taviani 2009) extend into deep water, up to near 1000 m water depth [6]. The superfamily Ostreoidea comprises the families Gryphaeidae (foam oysters) and Ostreidae (true oysters) [7,8,9].
Ostreoidea shells are composites of biopolymers and minerals (e.g., [7,10,11,12,13]). The biopolymer component is present in the shell (i) as a network between the crystals, (ii) as thick membranes encasing the columns, (iii) as an organic glue surrounding the cementation granules and, only for Ostrea sp., (iv) as an organic layer incorporating the assembly of rhombohedral crystals [14]. The Ostreoidea form their shell of low-Mg calcite and myostracal and ligament aragonite [15,16,17]. In this regard, the Ostreoidea are unusual among bivalves, as most other bivalves include in their shell some aragonite (e.g., [15]).
Below an outermost thin organic periostracum [18], Ostreoidea secrete six Ca-carbonate microstructures. The bulk of the Ostreoidea shell consists of foliated calcite (e.g., [15,17,18,19,20,21,22]), complemented, however, along the external surface of both valves with a layer of columnar-prismatic calcite [15,23,24] and, along sections of the proximal surface of the lower valve, with a cementation layer comprising granular calcite [4,25,26,27]. The muscle attachment sites, myostraca, are formed of prismatic aragonite. The columnar-prismatic, foliated, granular calcite and prismatic myostracal aragonite microstructures generate compact shell layers. However, Ostreoidea intercalate voids into their shells. The Ostreidae incorporate a meshwork of wavy calcite blades and laths into the foliated shell, forming the chalk lenses [16,19,22], whilst Gryphaeidae incorporate lenses of submicrometer- to micrometer-sized vesicles into a shell layer that is formed of fractal-shaped dendrites [7].
The Ostreoidea secrete thick shells [3,15]. This they achieve by incorporating large volumes of cavities into the structural material of the shell, the chalk and the vesicular lenses [7]. In Ostreoidea shell cross-sections, the growth lines are widely spaced between the foliated layer and the chalk as well as between the foliated and the vesicular microstructures. This indicates a higher thickening speed for shell layers containing the cavity-rich microstructures, relative to the speed of thickening of the foliated shell [7,28]. It has also been demonstrated that the chalk assists with its cavity-rich structural plasticity, the attachment of the shell to uneven-surfaced substrates ([29] and references therein).
In the present article, we summarize and review crystallographic aspects of the crystals and of their arrangements that were observed, so far, for Ostreoidea shells. Due to the huge diversity in crystal morphologies and organizational patterns, Ostreoidea shells are best suited for the latter, as well as for examining the crystallographic nature at the changeover from one microstructure into the other. We find eight crystal/crystal unit morphologies, six different microstructures and five transitions between adjacent crystal assembly patterns. Disregarding the aragonite of the myostraca, all Ostreoidea shell microstructures are formed of one Ca-carbonate polymorph, namely calcite. Hence, there is no delimitation between adjacent microstructures in the form of, e.g., a biopolymer membrane, as is often the case when the shell is formed of superimposed layers of calcite and aragonite [30]. For Ostreoidea shells, the changeover from one microstructure into the other is, to a large degree, controlled by crystallographic aspects of the crystals and microstructures.
The foliated shell layer is topologically related to all other shell microstructures. Accordingly, for understanding the shell as an entity, one of the aims of this study, it is essential to assess the crystallographic-structural attributes of all types of shell-forming crystals, as well as of the microstructures these generate. Crystallographic characteristics of crystals and of their assemblies are best characterized with diffraction methods: X-ray diffraction (XRD) or electron backscatter diffraction (EBSD), the latter carried out with a scanning electron microscope (SEM) or a transmission electron microscope (TEM). The advantage of X-ray diffraction is that the measurement covers a large section of the sample [21,24,30,31], and it determines the texture of the material. However, it does not give information on its microstructure. Electron backscatter diffraction measures and visualizes both the microstructure and the texture of the material in question; nonetheless, high-resolution EBSD scans cover significantly smaller sample portions, relative to sample sections that can be examined with XRD measurements. A further advantage of EBSD measurements is that, in addition to texture determination, many further structural attributes, such as the mode and degree of misorientation between crystals, crystal morphology, the degree of interlinkage, etc., are also obtained. These can be related to the texture pattern of the microstructure in question, and, even though smaller sample sections are scanned, the mode of crystal organization can be better assessed and understood.
When EBSD is carried out conventionally with an SEM-EBSD system, an acceleration voltage of 20 kV is used. This gives, depending on the investigated material, a minimal space resolution between 300 and 400 nm. The foliated calcite of Ostreoidea shells consists of parallel arrays of 200 to 400 nm thick, 2–4 µm wide and up to 20 µm long folia (e.g., this study and [19,21,22]). Hence, for high-quality EBSD measurements of the foliated, granular and chalk crystals, data acquisition must be conducted with a space resolution below 300 nm. We performed for this study low kV electron backscatter diffraction (EBSD) measurements on adult Ostreidae and Gryphaeidae shells and conducted these with an acceleration voltage between 18 to 12 kV. This allows for a space resolution < 300 nm [32].
With this study, we characterize the nanometer-scale internal structure of the ostreoid shell forming crystals and crystal units, address their microstructure and texture and describe the degree and mode of misorientation between the crystals and the crystal units. We demonstrate (i) crystallographic axes discontinuity and some continuity between adjacent microstructures and (ii) the mode of crystallographic axes organization at the change from one microstructure into the other, and we discuss (iii) possible determinants for the changeover from one shell layer structure into the other, such as crystal twinning, gradation in crystal orientation or oriented nucleation. We highlight (vi) the outstanding texture of the assembly of folia and that of foliated units and (v) illustrate, from a structural point of view, the accomplishment of curvature within the shells as well as at the shell inner surface.

2. Methods

2.1. Samples

We investigated shell crystal microstructure and texture for six species of Ostreoidea. The Ostreidae Magallana gigas (Thunberg, 1793), was obtained from Formosa inlet, close to Cacela Velha (S. Portugal), Ostrea stentina (Payraudeau, 1826), from intertidal in the littoral (or coast) of Benalmádena, Málaga, South Spain and Ostrea edulis (Linnaeus, 1758), from the Northern Atlantic Spanish coast. The Gryphaeidae Hyotissa hyotis (Linnaeus, 1758) were obtained from the Philippines (locality unknown), Hyotissa mcgintyi (H. W. Harry, 1985) were sampled from Florida Keys, USA [33], and Neopycnodonte cochlear (Poli, 1795) were collected off the Almería coast, SE Mediterranean of Spain.

2.2. Sample Preparation for FE-SEM Imaging and EBSD Measurements

The shells were cut transversely. Shell pieces were embedded into epoxy resin, and several mechanical grinding and polishing steps were performed on them. The final polishing step consisted of etch-polishing with colloidal alumina, with 0.06 μm particle size, using a vibratory polisher. The latter is a requirement for high-quality EBSD measurements. Mechanical polishing generates very flat surfaces but also induces some damage of the sample surface, as, at mechanical polishing, it destroys the crystal lattice of the uppermost surface. As the Kikuchi signal comes from the upper 50 to 80 nm of the sample surface, with the destroyed uppermost layer of the surface, part of the EBSD signal becomes lost. The latter is counteracted with slight etch-polishing in a vibratory polisher. EBSD measurements required 4–6 nm of carbon coating, while for FE-SEM imaging, samples were coated with 5 nm of Pt/Pd.

2.3. EBSD Measurements and Data Analysis

A Hitachi SU5000 field emission SEM, equipped with an Oxford Instruments Nordlys II EBSD detector, was used to perform the EBSD measurements. The SEM operation during measurements was mainly between 12 and 18 kV, and for some measurements, at 8 kV. The choice of voltage was based on the minimum space resolution required. We performed 12 to 14 EBSD measurements per species. For Kikuchi indexing, the Oxford Instruments CHANNEL 5 and AZTec Crystal version 3.0 software were used. Most measurements were made with increments of 100 to 300 nm. This ensured very high indexing rates, of or even over 95%. The latter is necessary for understanding the foliated crystal arrangements and the nature of the changeover from one microstructure into the other.
EBSD results were complemented with FE-SEM micrographs, taken on fractured surfaces. As our study was conducted on very small scale levels, we wanted to ensure that the structural information was not distorted by etching artefacts.

2.4. Terminology

The idealized concept of a crystal refers to a 3-dimensionally periodic lattice-like array of atoms or ions that extends coherently over the space occupied by the crystal. During their growth, real crystals develop imperfections. Frequent imperfections are small-angle grain boundaries. These are arrays of dislocations, across which the orientation of the crystal lattice changes slightly [32]. Accordingly, real crystals consist of subunits (called mosaic blocks or mosaic domains) which are mutually misoriented by small angles, for which an upper limit of 10° is often used [32].
A mesocrystal is defined as a crystal formed of submicrometer-sized subcrystallites of similar size and shape, which have a good common crystallographic register. The crystallites in mesocrystals are separated from each other by voids and/or impurities [34,35,36,37].
We use the term crystal unit for mosaic- or mesocrystal morphological entities such as columns, prisms, blades, laths, rhombohedra, dendrites or granules. These crystal units assemble to microstructures. We present EBSD-measured shell microstructures with EBSD band contrast and crystal orientation maps. EBSD band contrast is shown grey-scaled; crystal orientation maps are shown with colors coding for crystal orientation. We use the inverse pole figure (IPF) and all-Euler coloring codes. The relevant coloring code is either given in the figure or indicated in the figure caption.
Crystallographic-preferred orientation, the texture of a microstructure, is shown with pole figures. These display stereographic projections of crystal axis or plane normal orientations, either as individual data points or as contoured density distributions. In this study, we set, for the contouring, the half-width of 5° and the cluster size of 3°.
Microstructures have a crystallographic texture (crystallographic preferred orientation). We speak of a single crystal-like texture when, e.g., for calcite, the pole figure hemisphere shows one cluster for c-axes and three separate clusters of a*-axes, or, for, e.g., aragonite, separate clusters are present for the a-, b- and c-axes poles. A single crystal-like texture with a graded distribution of calcite c- and a*-axes is present when the clusters of axis or plane normals have an elongated (curvilinear) appearance, due to a recurrent gradual tilt of crystal orientation. An axial texture is present if there is clustering of a common crystallographic axis in a joint orientation and a uniform random distribution of the other crystallographic axes on circles around the texture axis.
Crystal co-orientation strength within an EBSD map or a subset of an EBSD map is calculated from the density distribution of EBSD orientation data. We present crystal co-orientation strength with MUD (multiple of uniform distribution) values. A high MUD indicates a high crystal co-orientation strength (e.g., MUD > 700 for a single crystal with the half-width of 5° and a cluster size of 3°). An MUD value of 1 indicates a uniform, random distribution of crystal orientations.

3. Results

EBSD band contrast measurement maps of Figure 1 highlight the different microstructures that were observed for the shells of the investigated Ostreoidea species. As the crystal assembly patterns are not only characterized by crystal or/and crystal unit shape, size, structure and organization, but also by the degree and mode of misorientation between the constituent crystals, we highlight, as well for the different modes of crystal organization the corresponding pattern of misorientation between the crystals (Figure 1 and Figure 2). For the shell of the investigated species, we find an ordered, as well as a disordered pattern of misorientation between the comprising crystals (Figure 2). For discrimination between ordered and disordered misorientation patterns, we show the MacKenzie curves for calcite and aragonite. These give the distribution of misorientation angles for randomly textured carbonate crystals (Figure 2H, [38]).
We observe significant structural differences for the crystals that comprise the Ostreoidea shell microstructures. Columnar prisms are graded in size towards the outer shell surface (Figure 1A and Figure S1). Individual columns are markedly structured (Figure 1A and Figure S1); however, the comparison of the band contrast maps and the misorientation angle patterns shows that the structuring within the columns does not resemble the internal structuring of the foliated units (Figure 1A,B and Figure S1). For the latter, well visible from the band contrast map is the, more or less, parallel, strongly co-aligned arrangement of folia (Figure 1B). This is not observed for the internal architecture of the columns. The layer that cements the outer surface of the lower valve comprises a conglomerate of granules and small prism-shaped crystals (Figure 1C). The microstructure of the chalk is a meshwork of interlaced, in part, connected calcite blades and laths, where the latter often have curved/undulated morphologies (Figure 1D). The occlusion of vesicular pores into the shell is accomplished with the generation of a shell-layer microstructure consisting of a tight interlinkage of variously sized, strongly fractal-shaped, dendritic crystals (Figure 1E). These form a dense microstructure and surround the round-shaped pores (Figure 1E). The microstructure of adductor myostraca (the muscle attachment sites) results from an interconnection of aragonite prisms (Figure 1F). The prisms are graded in size and increase in dimension towards the inner shell surface (Figure 1F). Most striking and only observed for the Ostreidae is the formation of crystals with strictly rhombohedral morphologies (Figure 1G). The morphology of these crystals is distinct to that of other biologically secreted Ca-carbonate crystals and resembles the morphology of inorganic rhombohedra precipitated from solution or grown in hydrogels [39,40]. A detailed description of the rhombohedron-shaped crystals is given by Sancho Vaquer et al. [14]. Accordingly, we not only find significant differences in morphologic-structural attributes of crystals, crystal units and shell layer microstructures, but also in the corresponding misorientations between the microstructures comprising crystals (Figure 2). For the columns (Figure 2A), the granules (Figure 2D), the dendritic crystals (Figure 2E) and the chalk blades/laths, we observe a wide range in misorientation angle, up to 100°, and a misorientation angle distribution that equals random distribution (see the MacKenzie curves in Figure 2H). Random distribution of misorientation angles is not observed for the assembly of folia (Figure 2B), for the rhombohedral crystals (Figure 2G and [14]) or for the assembly of myostracal prisms (Figure 2F). The misorientation angle distribution of myostracal prisms is specific. We find a large range in misorientation angle (Figure 2F); however, the myostracal crystal misorientation diagram is dominated by a marked peak at 64° (Figure 2F). Thus, very many myostracal crystals are misoriented to each other by 64°, but the myostracum comprises crystals as well that are misoriented to each other by various degrees. Note also the difference in the degree of misorientation angle between the assembly of foliated crystals (Figure 2B) and the assembly of chalk blades/laths (Figure 2C). For the foliated crystals, we see a large peak at low-angle misorientations, while for the chalk blades, we see a large peak mainly at large-angle misorientations.
Figure 1. Ostreoidea shell crystal morphology, shell layer internal structuring and relative frequency–misorientation angle distributions for the crystal assembly patterns that we observe in the shells. (AG): EBSD band contrast measurement images. The inserts give relative frequency versus misorientation angle diagrams for the shown EBSD scans and, thus, microstructures. (A): Sequence of columnar prisms seaming outer valve surfaces. (B): Array of folia forming the foliated units. (C): String of granules intercalated into the organic matrix of the cementation layer, the layer that attaches the lower valve external surface to the substrate. (D): Meshwork of blades and laths forming the cavity-rich structure of the chalk. (E): Conglomeration of variously sized dendritic crystals facilitating the occlusion of pores into the Gryphaeidae shells. (F): The prisms of the myostraca, the shell section where the muscles attach. (G): Accumulation of rhombohedral crystals within organic substance in Ostreidae shells. Larger versions of the misorientation vs relative frequency plots can be found in Figure 2.
Crystals 15 00286 g001
Figure 2. (AG): Diversity in relative frequency versus misorientation angle patterns for the microstructures that comprise Ostreoidea shells. (A,CE): For these microstructures, we find random distribution of misorientation angles. (B,F,G): For these microstructures, we observe a structured distribution of misorientation angles. Note the strongly structured distribution of misorientation angles for folia (B). We find for (A,E) a comparable pattern for the distribution of misorientation angles, alike for (C,D). For the latter, we find a gradual change and increasing development to the formation of large misorientations. Note the difference in magnitude of misorientation angle between the assembly of folia (B) and the assembly of chalk blades/laths (C). (H): MacKenzie curves for random misorientation angle distribution [38], given for calcite and aragonite.
Crystals 15 00286 g002

3.1. The Compact Shell Layers

Subsequently, we present in more detail the structural and crystallographic attributes of the crystals and crystal units that form the different shell layers of the investigated Ostreoidea species (Figure 3, Figure 4, Figure 5, Figure 6, Figure 7, Figure 8, Figure 9, Figure 10 and Figures S1–S8). We describe first the crystal arrangements that form compact layers of calcite. Second, we describe the cavity-rich microstructures that become incorporated into the compact layers.

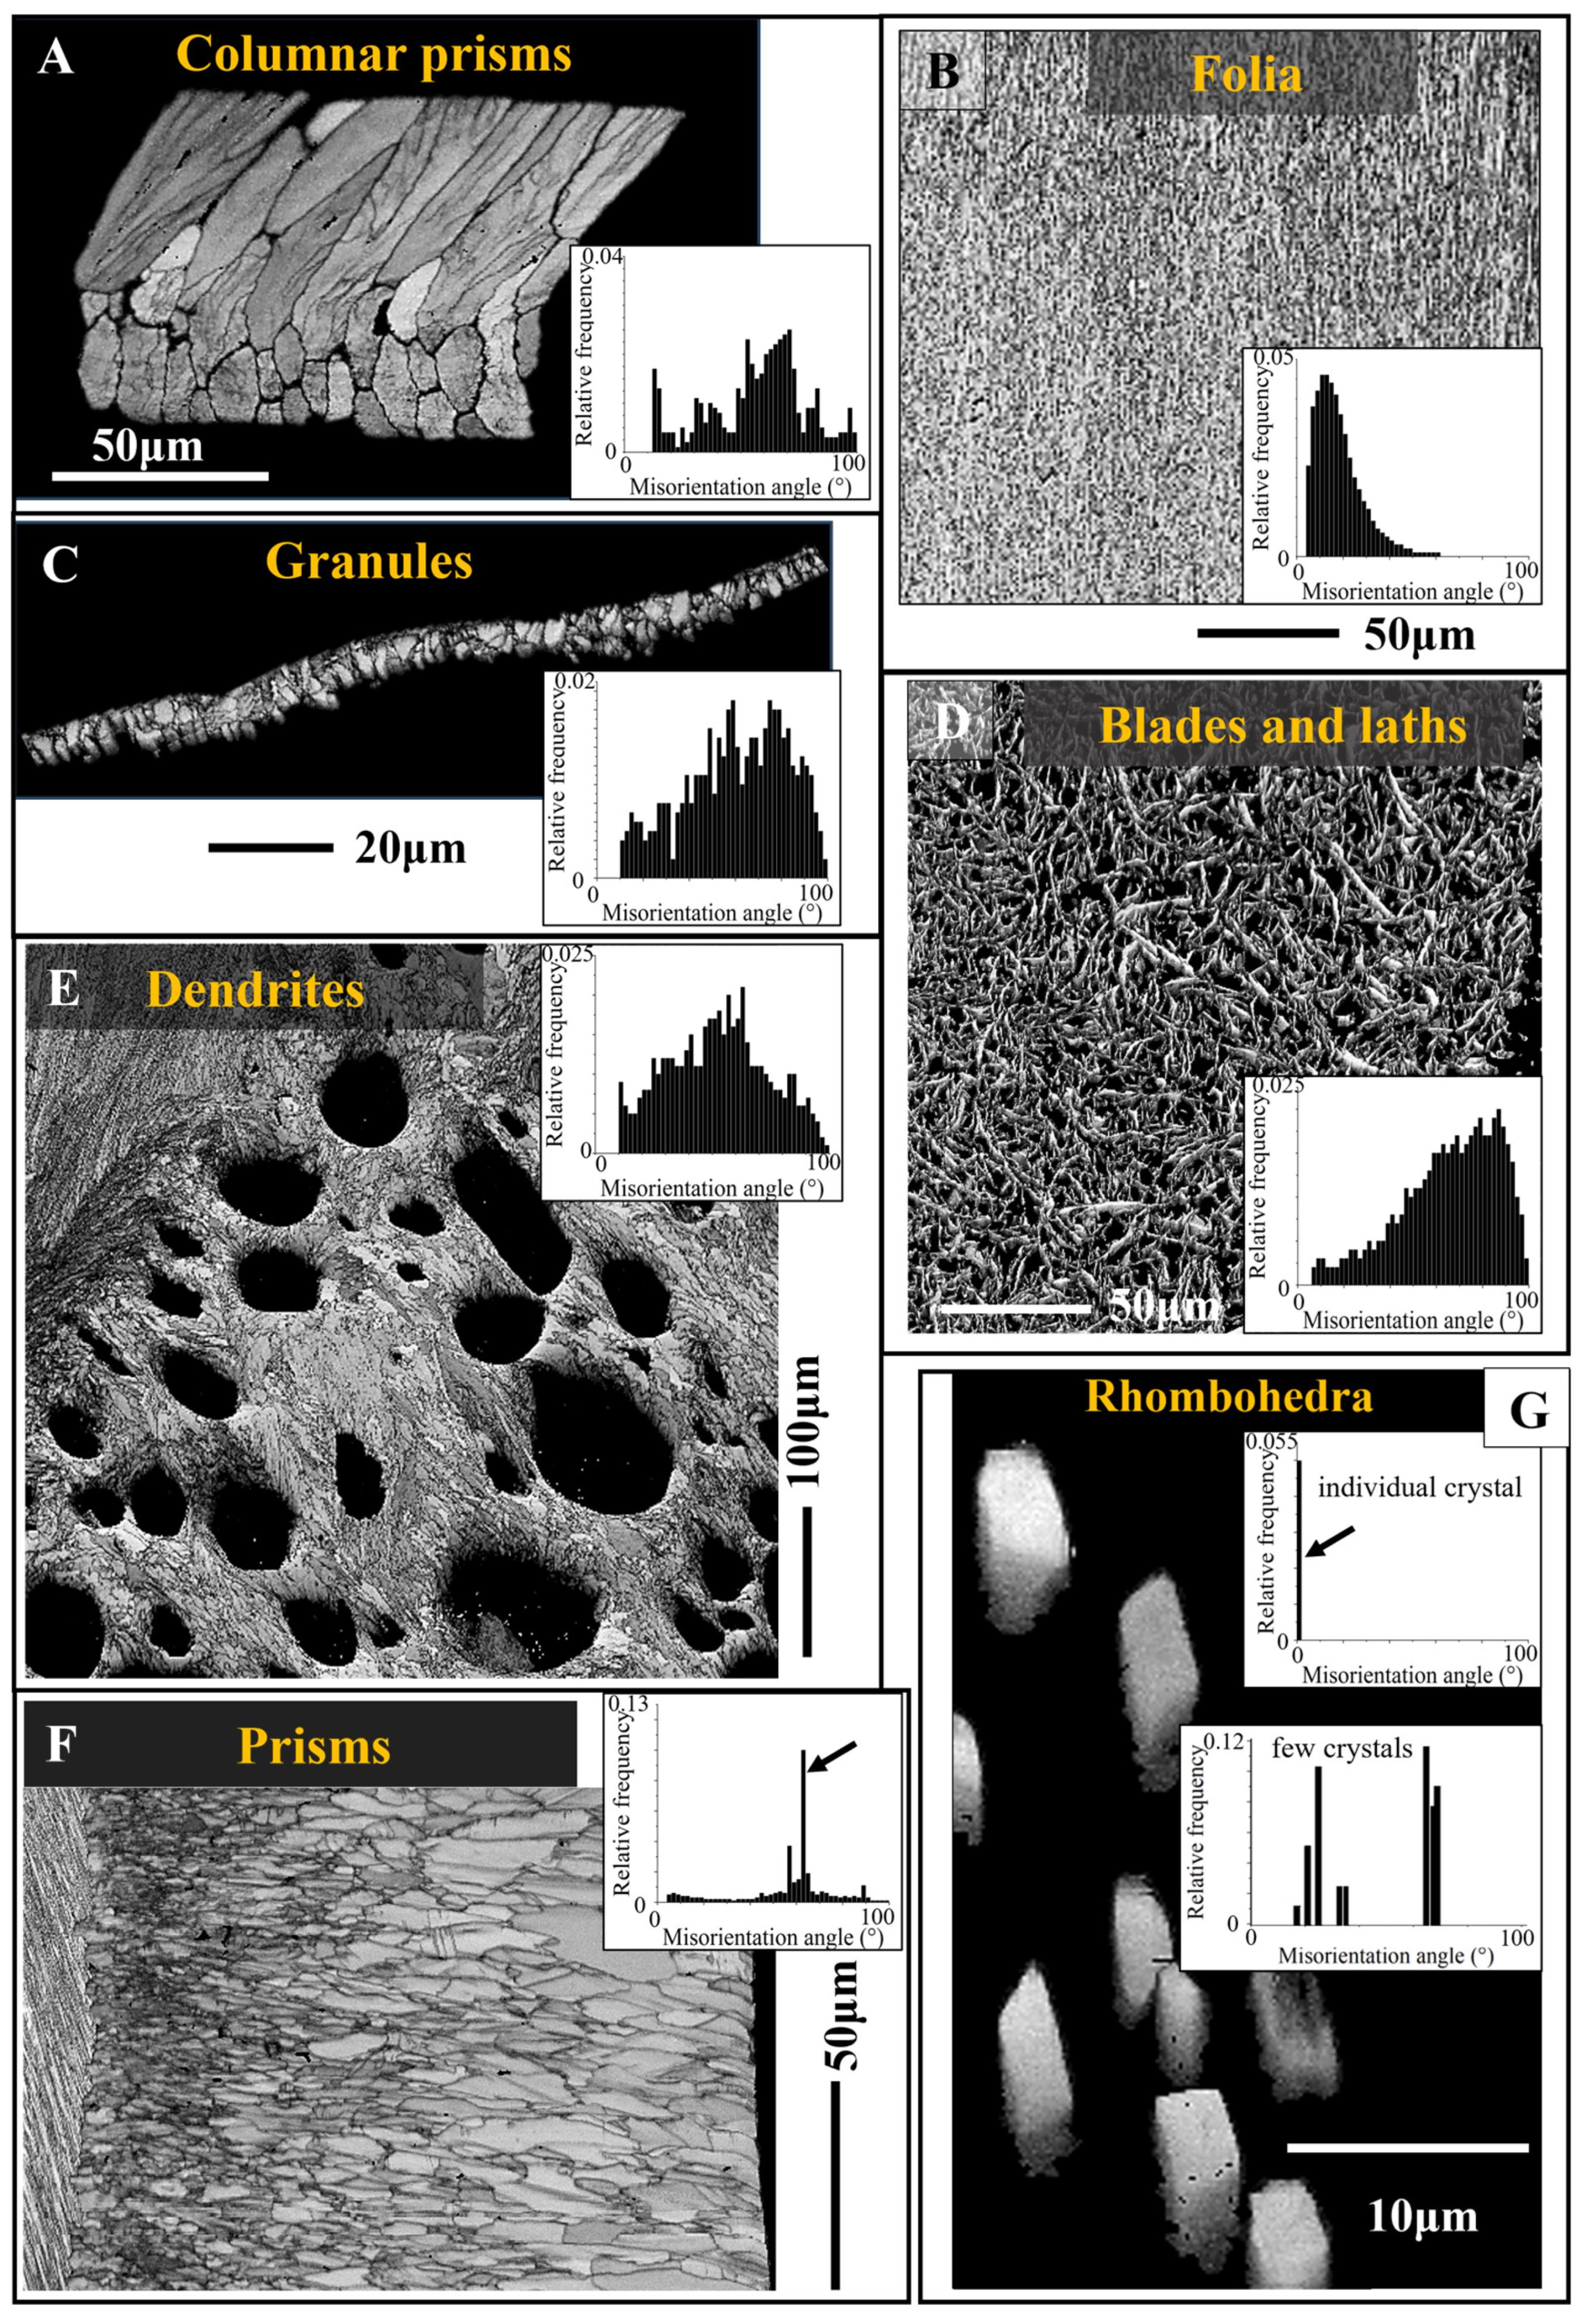
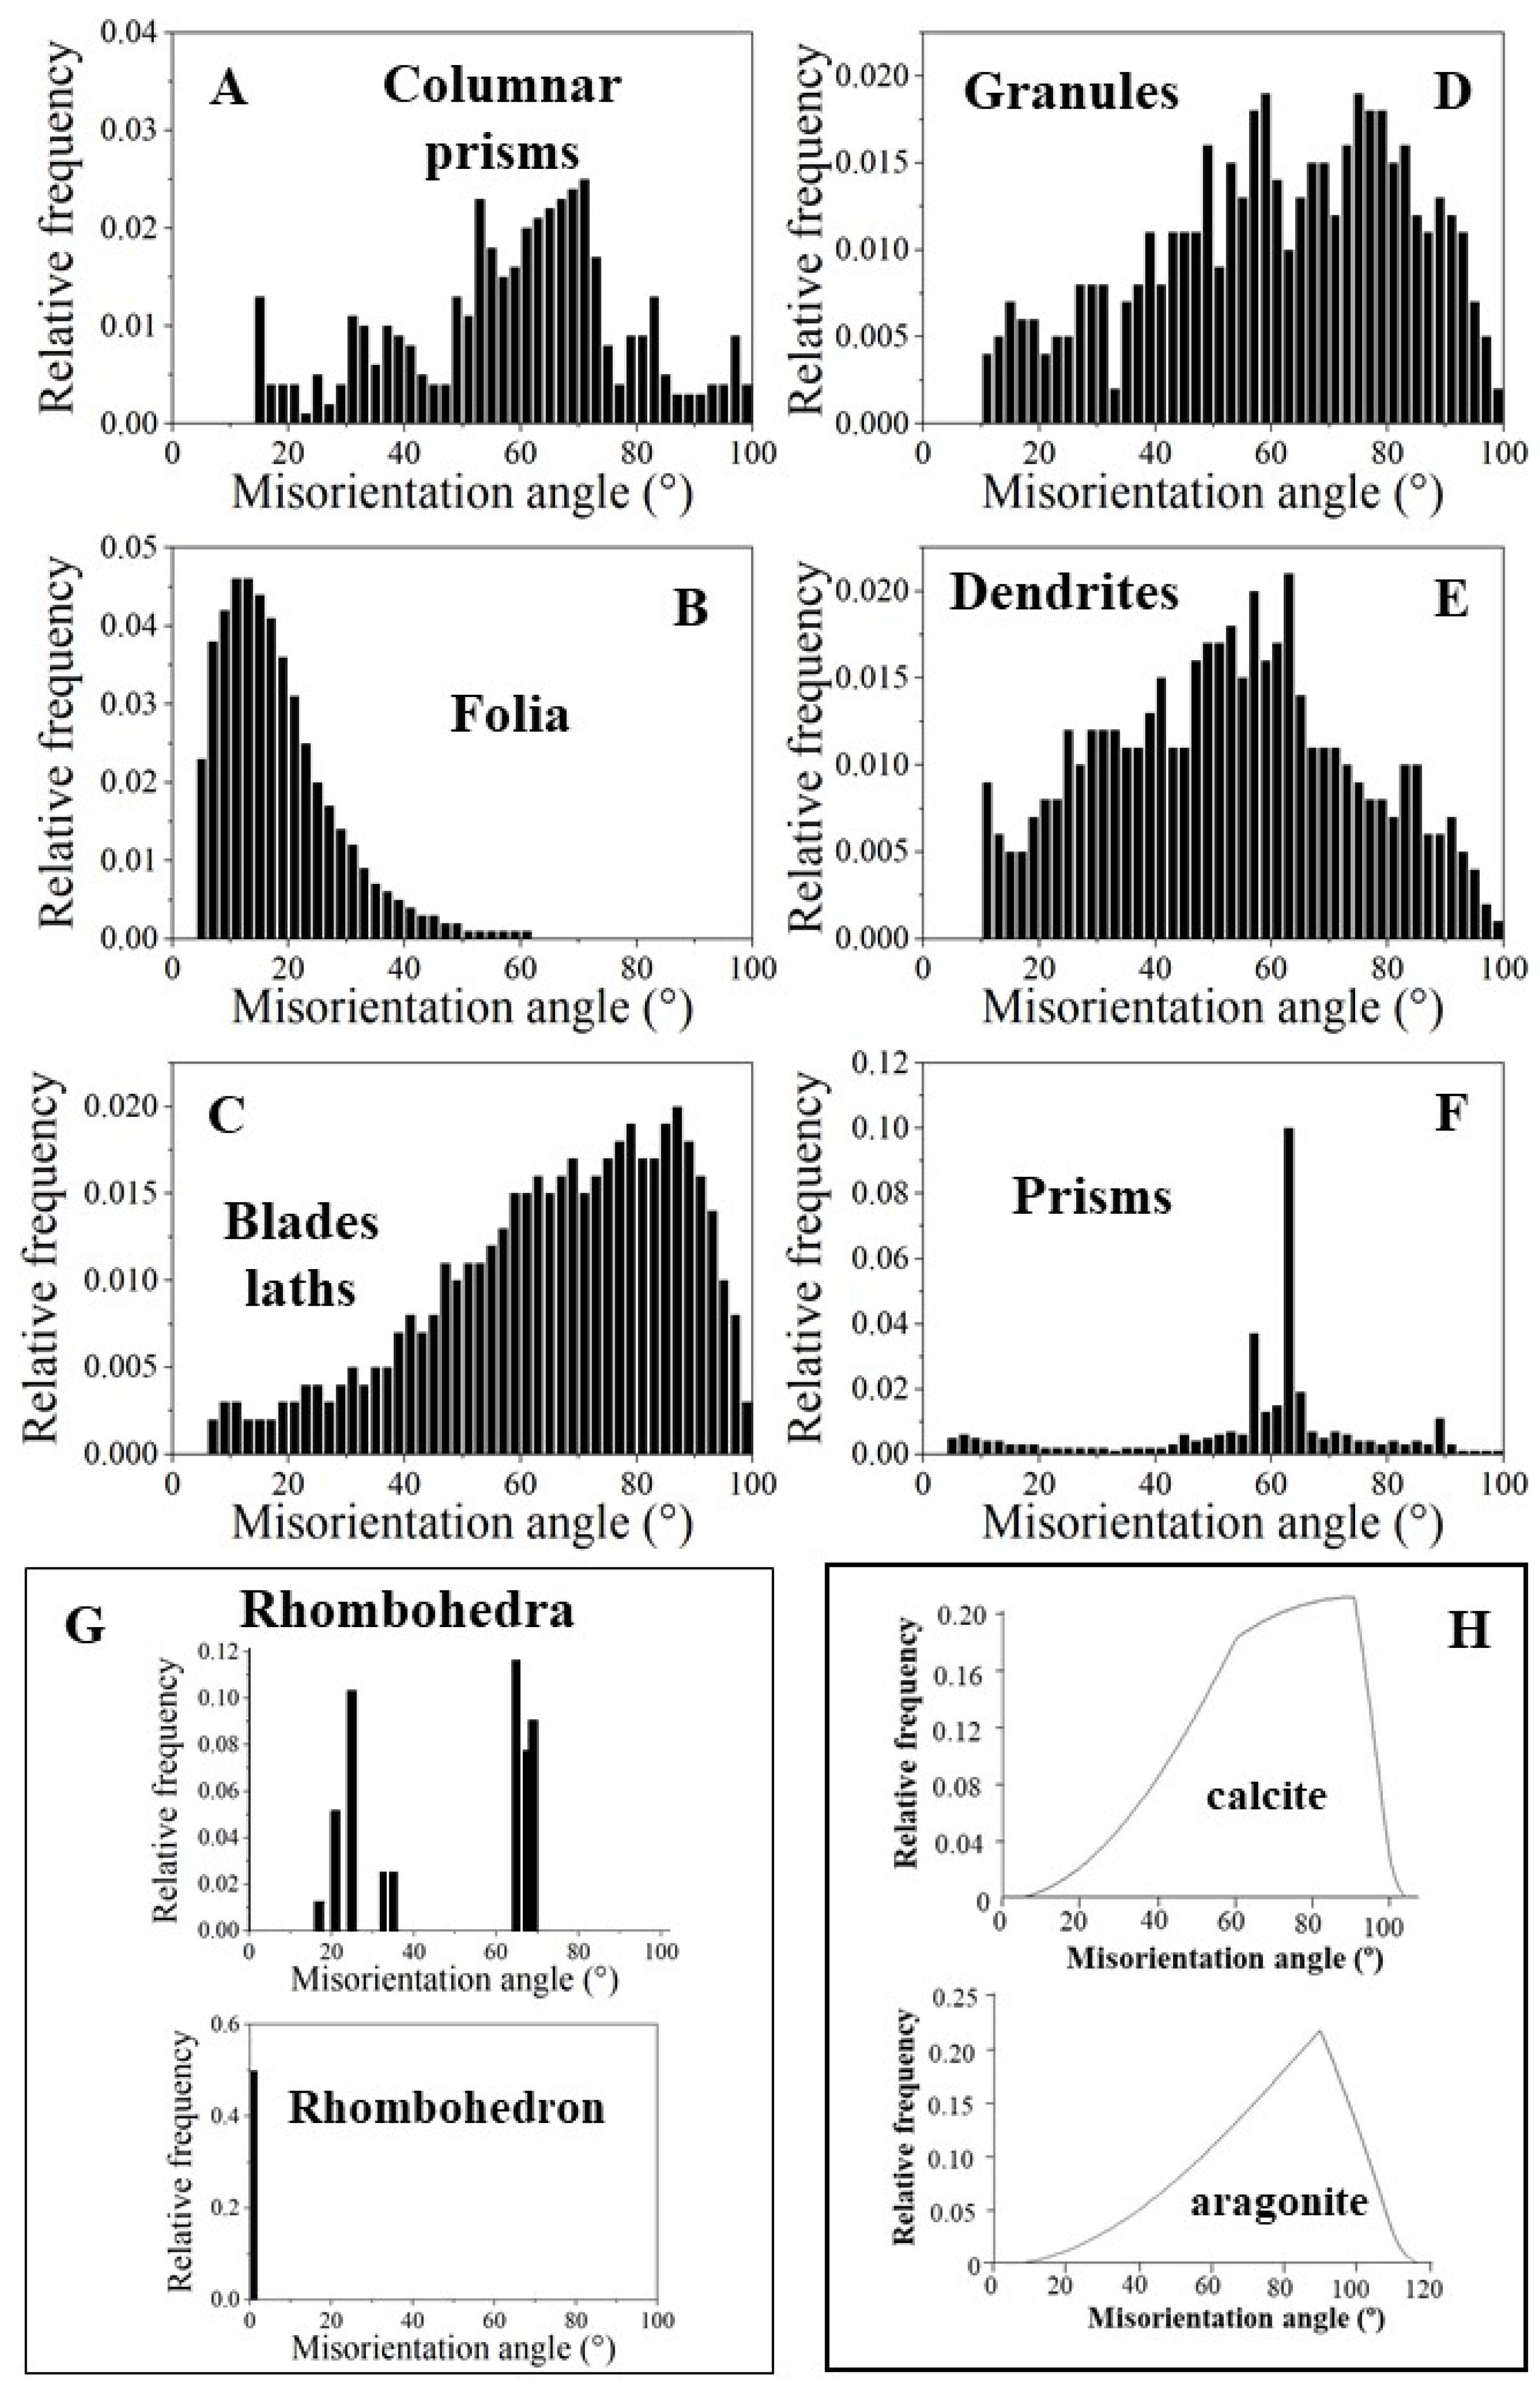
3.1.1. The Columnar Prisms

Calcite columnar prisms with dimensions of 8–10 µm × 4–5 µm × 40–50 µm (e.g., for M. gigas) form large sections of the outer layer of the two valves (Figure 3A). BSE images show an internal layering of individual columns, consisting of equally sized dark and light bands (Figure 3B,C). These reflect differences in organic content (light layers are more mineralized, and the dark bands are more organic-rich) and indicate different stages of column growth. The internal structure of the columns is particular (Figure 3D–F, Figures S2 and S3). We observe in the band contrast measurement images that the columns consist of domains (Figure 3E,F and Figure S3). These are formed of platy crystals (Figure S3C). The width, length and morphology of these platy crystals do not resemble at all those of the folia which form the foliated units (compare images of Figure S3A–C with images shown in Figure 4A–C). The columnar domains consist of thin, platy, irregularly shaped crystallites, resembling flakes. Nonetheless, as is the case for the folia in the foliated units, the crystallites within a columnar domain are strongly co-oriented. Misorientation within the columnar domains is low; it scatters up to about 5°. Even though the calcite of individual columns is well co-oriented (MUD value of 460 for the column in Figure 3J), individual columns cannot be addressed as being single crystalline. The latter would require for the crystal unit an MUD value of 700 or higher. An array of columns, forming the outer valve surface, is very little co-oriented (see MUD value in Figure 3I), a characteristic that resembles the arrangement of folia in foliated units and that of foliated units in the foliated layer of the shell (see MUD value in Figure 3H). In general, we find, for the investigated Ostreoidea shells, that within the individual crystal units, the crystallites are highly co-oriented, while for the assembly of the crystal units, forming a shell layer, crystal co-orientation strength is very low. The texture pattern of individual columns is single crystal-like, we observe individual maxima for the c- and the a*-axes (pole figure in Figure 3J), while the texture pattern of an assembly of columns is axial, we find a maximum in c-axes and scattering for the a*-axes on a great circle (pole figure in Figure 3I).
Figure 3. Internal structure, microstructure, crystal texture and crystal co-orientation strength of the array of columns that seam the outermost valve layer of Magallana gigas shells. (AD,F): BSE micrographs. (E): EBSD band contrast measurement image. (F,G,IK): Color-coded crystal orientation (EBSD maps), crystal texture (pole figures) and crystal co-orientation strength (MUD value) of individual columns (F,J) and of arrays of columns (G,I). (H): The foliated shell adjacent to a sequence of columns (I). Note the difference in texture but similarity in crystal co-orientation strength for the columns and for the adjacent sequence of foliated units (H,I). Individual columns are internally structured and are formed of subunits (domains) consisting of well co-oriented calcite crystallites (F,J) (Figure S3B). The internal structure of the columns as well as of their subunits is different from that of the foliated units; nonetheless, we find only low-angle misorientations within the columns (see the relative frequency–misorientation angle diagrams for individual columns in (K)), as is also the case for the assembly of folia and foliated units (see the misorientation angle diagram in Figure 1B). Note the layering within the columns (AC), visualizing different growth stages. Black arrows in the pole figures in (H,I) indicate the overall direction of c-axis orientation and show an about 30° misorientation in c-axis orientation between an array of columns and the adjacent foliated shell (H,I).
Crystals 15 00286 g003

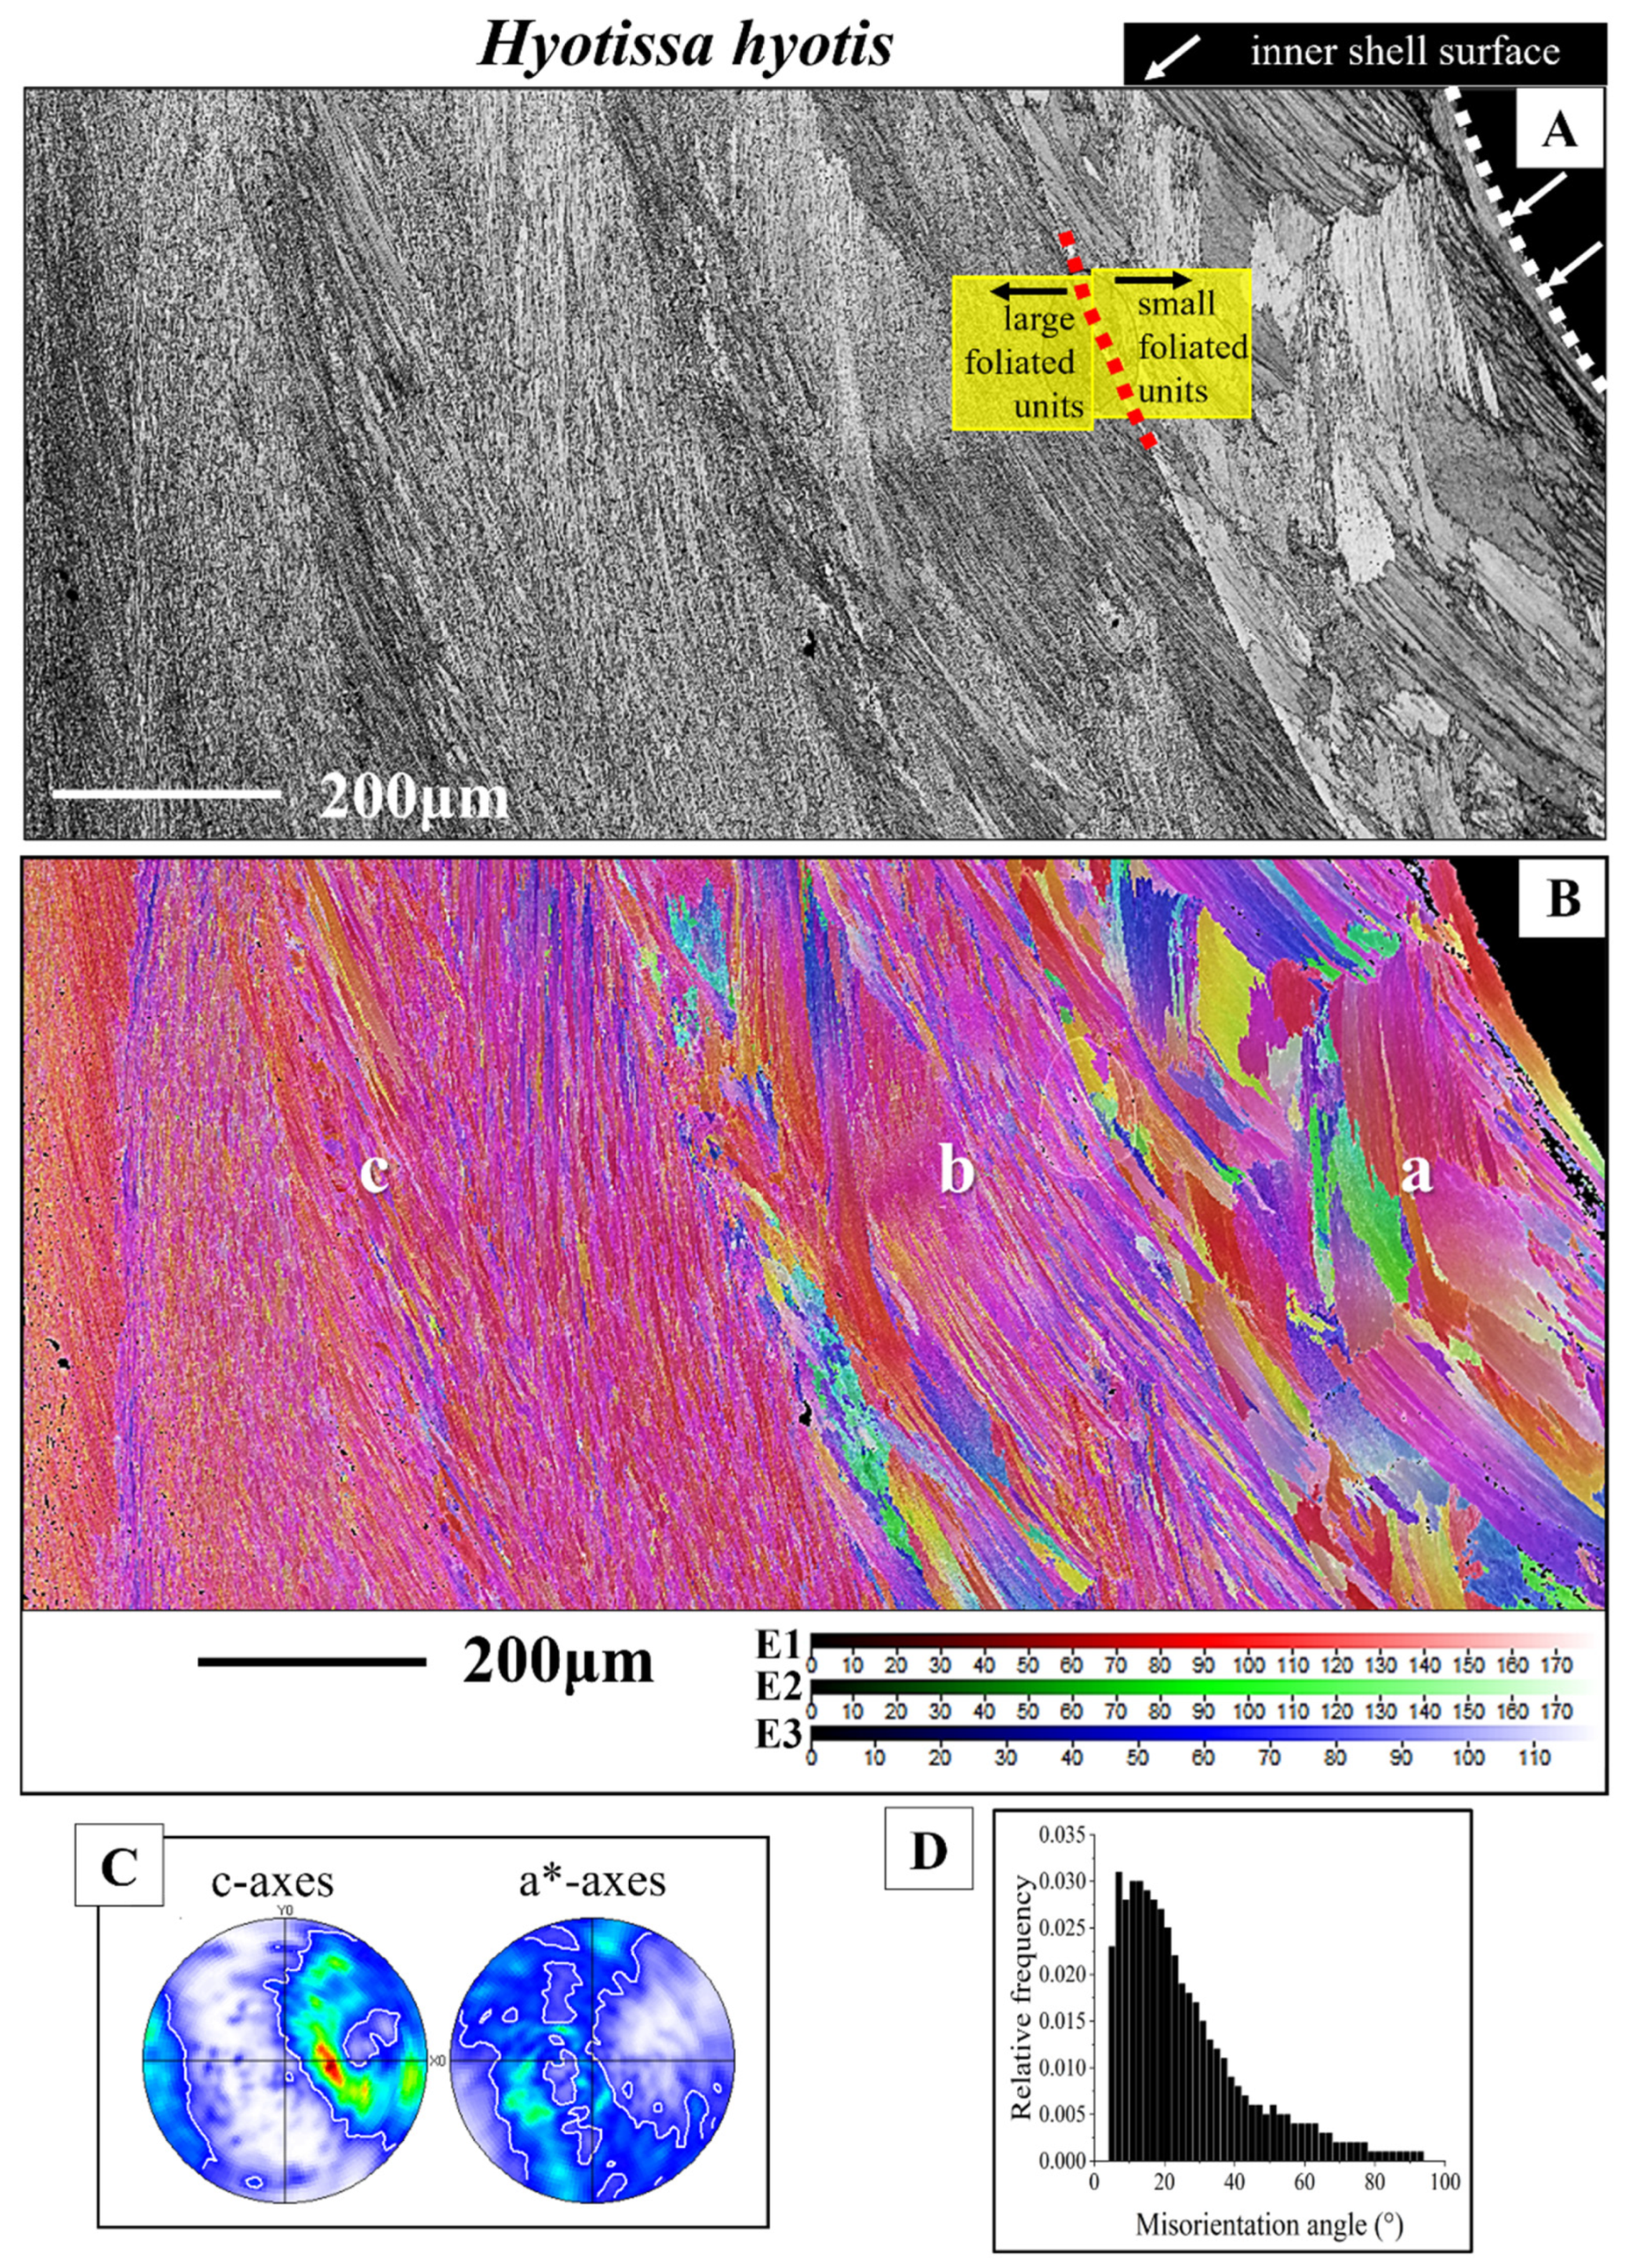
3.1.2. The Foliated Units

Structural properties and crystallographic attributes of units forming the foliated shell layer are presented with Figure 4, Figure 5, Figure 6, Figure 7, Figures S4 and S5. BSE images of Figure 4A,C visualize the thickness and width of individual folia, while Figure 4B shows the shape and size of crystals that comprise a folium. A folium is formed of more or less parallel arrays of lath-shaped crystals with arrowhead endings (Figure 4B and [20]). The calcite of individual folia is very co-oriented (MUD values 591, 626, Figure 4D) and can be addressed to be single crystal-like.
When investigating calcite c- and a*-axes orientation of a stack of folia, generating a foliated unit (e.g., Figure 4E,F), we observe in the pole figure an elongated appearance of the c- and a*-axes orientation data points. This is an expression of a gradation in calcite c- and a*-axes orientation distribution (see pole figures in Figure 4E,F) and is the result of the graded assembly of folia in the foliated unit (Figure S5B,C). Gradation in orientation of one of the crystallographic axes of calcite or aragonite crystals has been observed for biological carbonates; however, gradation in all crystallographic axes of carbonate crystals is outstanding. For biologically secreted calcite, this study is the second report so far that demonstrates gradation of both the c- as well as the a*-axes of the calcite in a crystal unit.
The texture of the foliated crystal units, irrespective of whether these are small or large, is very specific (see pole figures in Figure 5, Figure 6, Figure 7 and Figure S4). In the micrograph of the 2D pole figure, we observe a ring-shaped orientation distribution of calcite c-axis and a*-axes (black arrows in pole figures in Figure 6C,D) for an EBSD scan comprising many foliated crystal units. With Figure 6, we attempt to visualize how the c- and a*-axes orientation ring is generated for an assembly of adjacent foliated units. When reduced to the core crystal of a large foliated unit (Figure 6B), we see, for the latter, in the pole figure a cluster in c-axis and three clusters in a*-axes orientation. Nonetheless, we observe for these clusters in the pole figure and in the corresponding EBSD map that the core crystal of the foliated unit is formed of two subunits, slightly differently oriented. We term these as subunits (see the minute difference in color of the c- and a*-axes clusters; Figure 6B). When two to three adjacent foliated units are regarded (Figure 6C), we find that each of these is structured by interdigitating subunits, and that, in turn, each foliated unit adds in the pole figure a cluster in c- and three clusters in a*-orientation. Hence, for a 3D assembly of some adjacent foliated units, the c- and a*-axes clusters of the different foliated units merge and generate the ring-shaped c- and a*-axes orientation distribution in the 2D pole figure (see the pole figures in Figure 6D, as well as, for a different measurement on the foliated shell, the pole figures in Figure 7D).
In Figure 6, we describe the texture of large foliated units. Even though not as well observable as we see it for the large foliated units, the small foliated units are also interdigitations of adjacent, substructured, foliated units, and we observe for these as well the generation of c-axes and a*-axes rings in the 2D pole figures (Figure S4C,D). In the case of the small foliated units, the EBSD scan covers many, to each other, strongly misoriented, foliated units. Thus, the ring-shaped c- and a*-axes orientation distribution for an assembly of small foliated units becomes rather noisy and is not as clear-cut as is the case for the large foliated units (compare the pole figure shown in Figure S4B with that shown in Figure S4C).
Figure 5 shows an EBSD scan that covers many foliated units and extends from the inner shell surface well into the foliated shell layer. We see in this measurement how inner shell surface curvature is generated with foliated units. It is formed with a decrease in foliated unit size towards the curved surface. In Figure S5A, we show the same EBSD scan as in Figure 5. The red, yellow and white stars (Figure 5A) point to different foliated unit entities, selected from different parts of the EBSD map, representing differently sized foliated units. We show for the selected units, with sketched crystals and pole figures, the orientation pattern of calcite c- and a*-axes. For the foliated units of Figure S5B,C we see clearly the gradual rotation of calcite c- and a*-axes with the length of the foliated unit and, to a lesser degree, the rotation of crystallographic axes perpendicular to the length of the foliated unit.
With Figure S5 we show also misorientation angle distributions for the selected foliated units. The latter is given along trajectories a to b and c to d. The position of the trajectories is indicated with arrows on the corresponding foliated units. Trajectories a to b (white arrows) run parallel to the length of the foliated unit, and trajectories c to d (red arrows) run orthogonal to the length of the foliated unit. For these trajectories, we show cumulative misorientation angle (misorientation angle relative to the first point) as well as local misorientation angle distributions (misorientation angle from point to point). We find that, irrespective of the orientation of the trajectory, both cumulative as well as local misorientation angles increase with the length of the trajectory. This is best observable for the foliated units shown in (B) and (C). We find, furthermore, that the increase in misorientation angle is very smooth when the trajectory is parallel to the length of the foliated unit, while its course is slightly uneven when the trajectory runs orthogonal to the length of the foliated unit.
As described above, we find for the foliated units gradation in calcite c- and a*-axes orientation. This points to their mesocrystalline nature. A mesocrystal is defined as a mesoscopically structured crystal consisting of submicrometer-sized crystallites, the latter assembled with a crystallographic register [35,36,37]. The distinction of the individual nanocrystals is not clear-cut because the crystal lattice is continuous across them [41]. The length, width and thickness of crystallites that form a mesocrystal do not have to be similar in size [41]. For the generation of a mesocrystal, the change in crystallographic axes orientation needs to have a controlled tilt [41]. This is what we find for the foliated units of the investigated shells. For the foliated units, we see in the relative frequency–misorientation angle diagrams only low-angle (up to 10°) misorientations (Figure 4E,F), thus, a very small range in misorientation angle.
Figure 4. The folia and assemblies of folia that generate ostreoidean foliated units, e.g., those shown in (E,F). (AC): BSE micrographs highlighting the morphology and dimension (width and thickness) of lath-shaped arrowheaded crystals and of individual folia. (D): Crystal orientation, crystal texture and crystal co-orientation strength of two individual folia. The calcite of a folium is very co-oriented (see MUD values in (D)). (E,F): EBSD scans of foliated units, consisting of stacks of folia. Note the mode of c- and a*-axes orientation distribution in the pole figures (E,F). The gradual change in color (EBSD map and pole figures), as well as the gradual change in tilt of both crystallographic axes (see the pole figures), demonstrate that the foliated crystal units are entities with a graded calcite c- and a*-axes orientation. (E,F): Relative frequency–misorientation angle diagrams for the crystals shown in the figure; we observe very low misorientation angles between adjacent folia.
Crystals 15 00286 g004
Figure 5. The distribution of small and large foliated units (A,B) in the Hyotissa hyotis shell and generation of a curved inner shell surface with foliated units (A,B). (A): EBSD band contrast measurement image. (B): Calcite orientation color-coded EBSD scan. For the scan shown in (B), we use the Euler angle coloring code. It is well observable that towards the inner shell surface, the size of the foliated units decreases gradually; hence, a curved surface is formed with an assembly of small foliated units, in contrast to the size of foliated units that are present in more outward sections of the foliated shell layer. We find layers formed of small (a), larger (b) and very large (c) foliated units (B). (C): The texture pattern of foliated calcite; well observable is the ring-shaped orientation distribution of calcite c- and a*-axes. (D): The typical pattern of misorientation angle distribution that we find for Ostreoidea foliated calcite.
Crystals 15 00286 g005
Figure 6. The microstructure of large foliated units (BD) and their texture (BD). Formation and development of c- and a*-axes orientation rings for the texture pattern of the foliated units (BD). The colors in Figure 6 code for crystal orientation. The core crystal entity (e.g., that shown in (B)) of a large foliated unit is a structured arrangement of crystallites and consists of an interwoven meshwork of, mainly, two subunits having slightly different orientations (see blue and green colors in the map and pole figure in (B); see the sketched crystals in (B)). Nonetheless, we find in the corresponding pole figure (B) a cluster for c-axes and three clusters for the a*-axes orientations. However, we observe well in the pole figures (B) that the c- and a*-axes clusters are substructured. Selecting a larger section of a foliated unit (C), e.g., the core crystal entity and adjacent foliated crystals (C), in the pole figures, we find that additional c- and a*-axes clusters are added to the c- and a*-axes clusters of the core crystal entity in such a way that the c- and a*-axes orientations of a few adjacent large foliated units form a ring in the c- and a*-axes pole figures (black arrows in (C,D)). This is a very specific texture pattern and very different to the texture of fibrous, columnar and nacreous biocalcified microstructures, where the texture pattern of the latter microstructures is axial. (A): The entire EBSD scan, with the colors indicating crystal orientation. The dashed yellow, red and black rectangles in (A) depict the EBSD scan portions that are shown in (BD).
Crystals 15 00286 g006

3.1.3. The Myostracal Prisms

Figure 7 gives the calcium carbonate phase, microstructure, texture and crystal co-orientation strength of granular to prismatic crystals that comprise the shell at the attachment sites, myostraca, of the adductor and pallial muscles. We observe for these aragonitic shell sections a different Ca-carbonate phase as that of the calcitic rest of the shell (Figure 7A,F), a specific microstructure (Figure 7C,E) that is distinct from that of the rest of the shell, an axial texture (see pole figures for aragonite in Figure 7C,E), a higher crystal co-orientation strength, as observed for all other shell portions (see MUD values in Figure 7C,E), and a marked peak at 64° misorientation in the misorientation angle diagram (black arrows in Figure 7C,G). The crystallographic-structural difference between myostraca and the other valve sections is the result of different calcium carbonate hard tissue forming determinants (e.g., [42,43]).

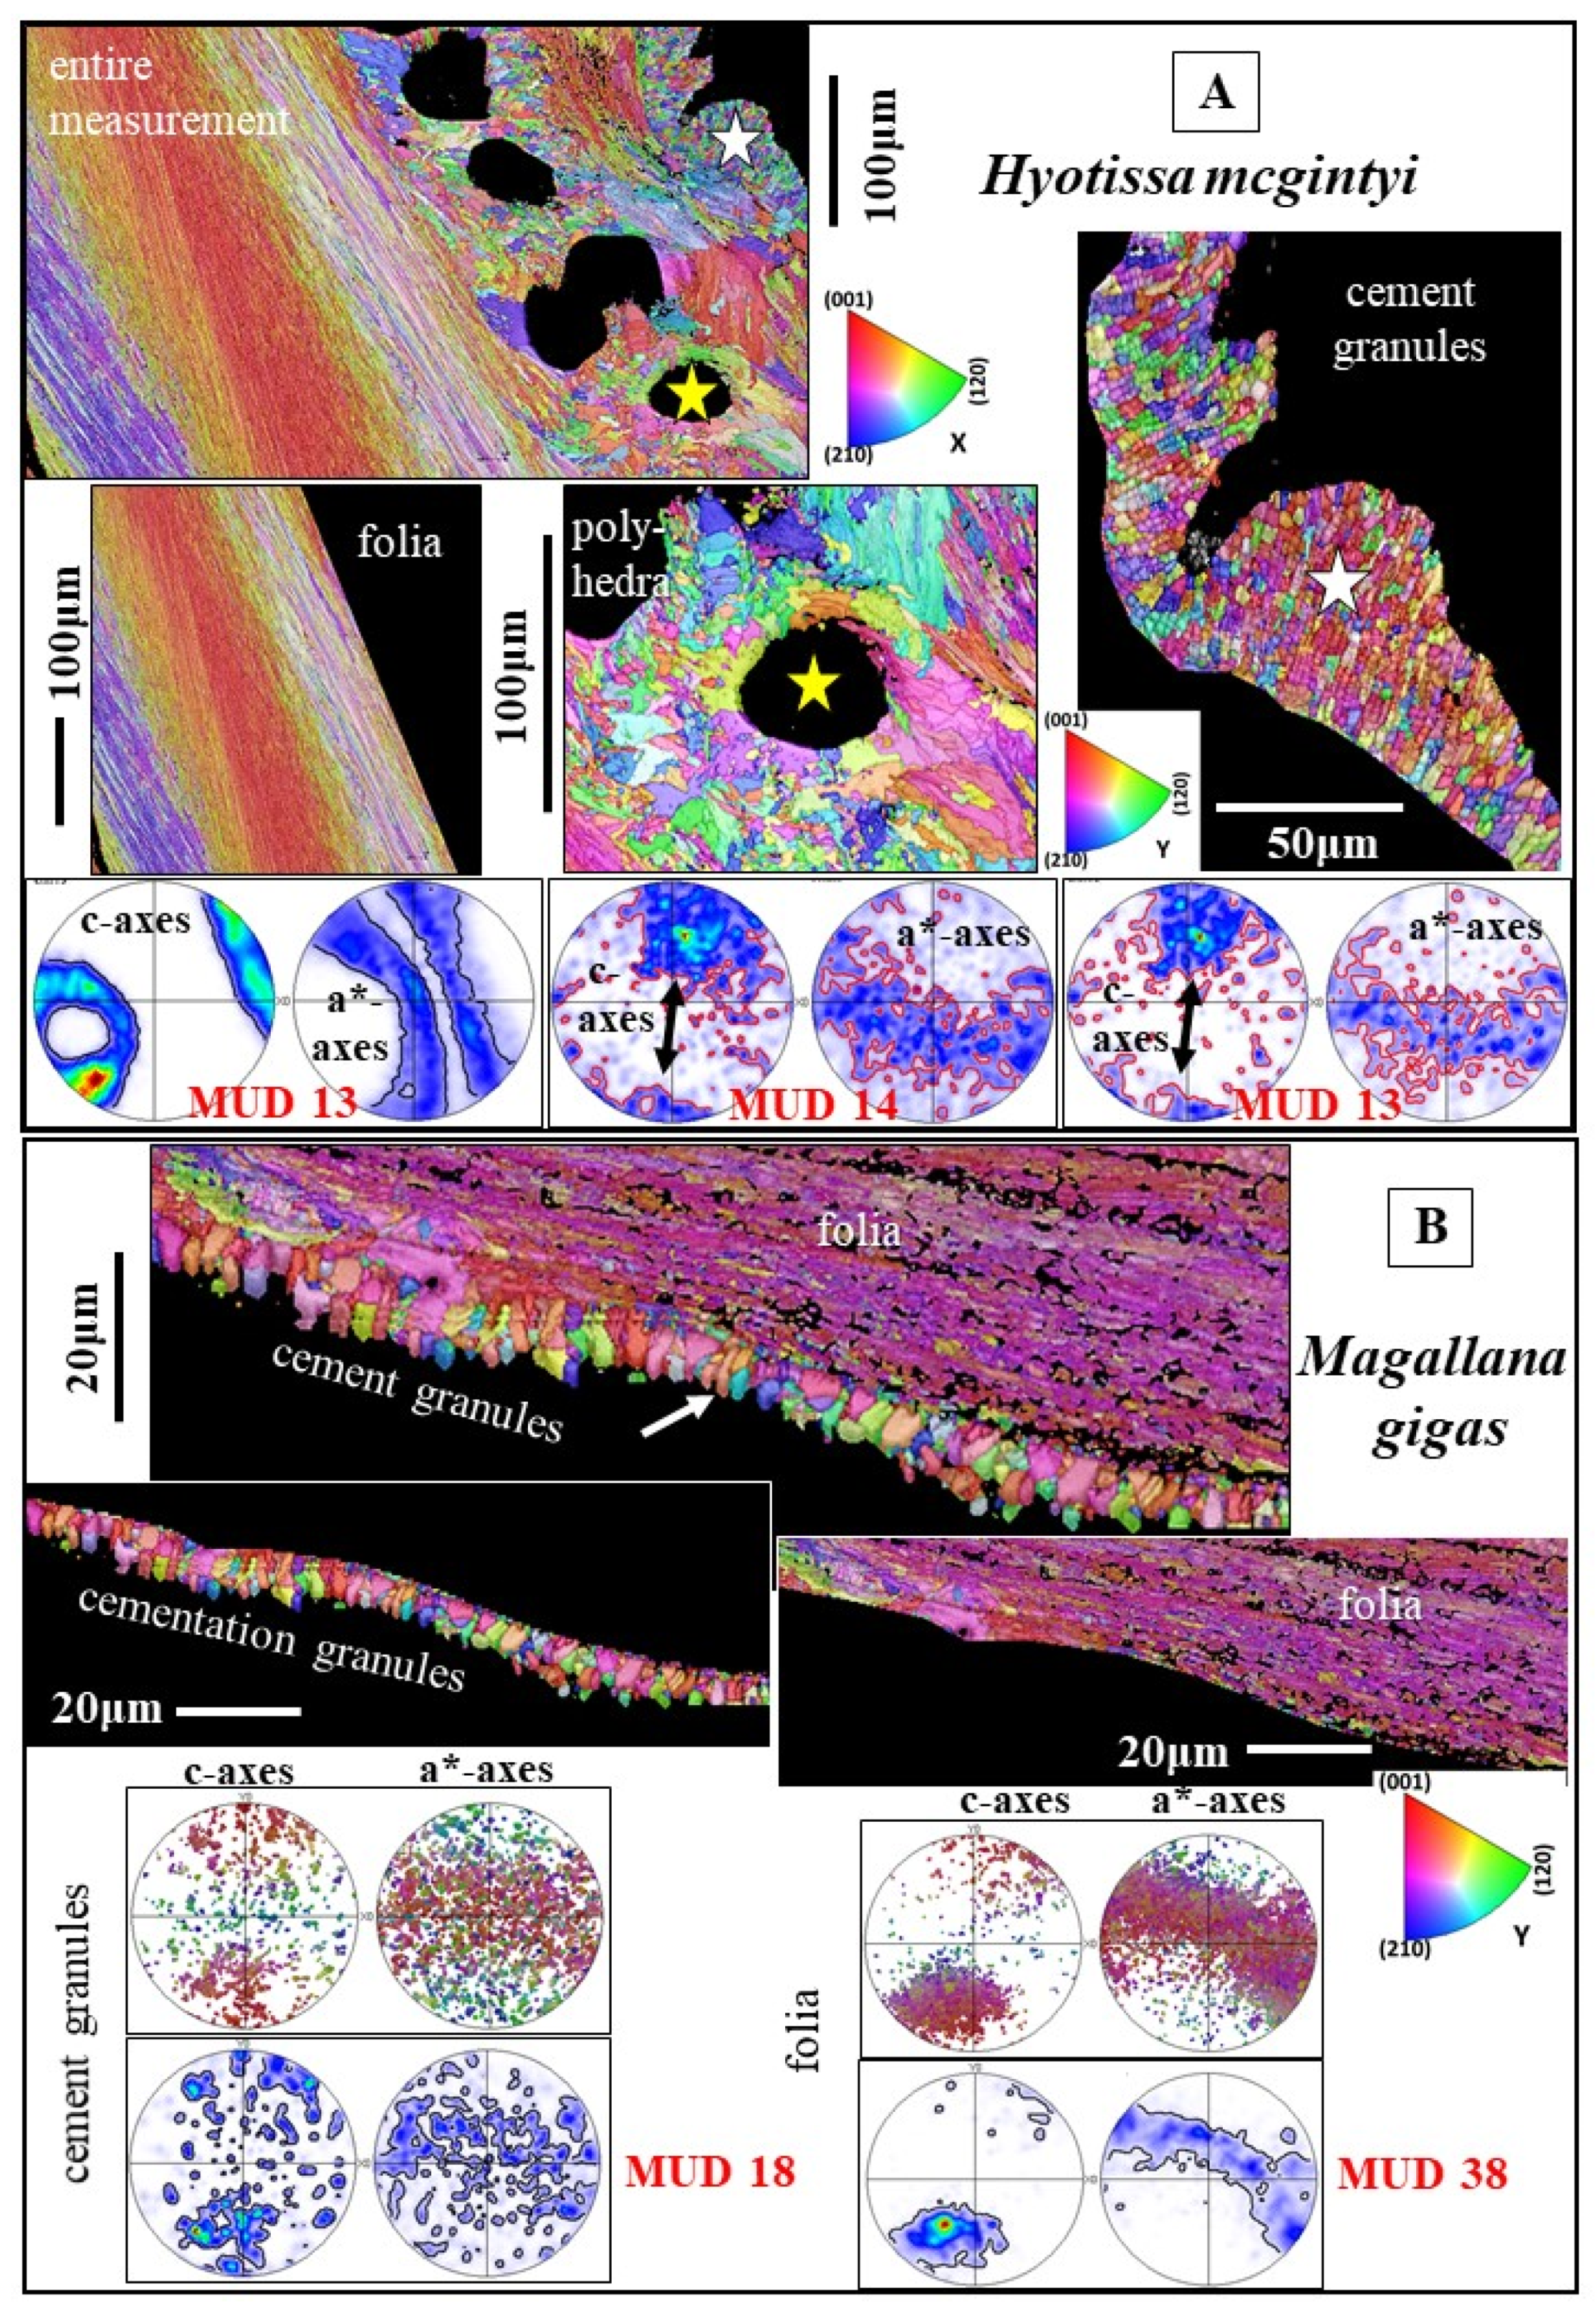
3.1.4. The Granules of the Cement Layer

Calcite crystals within the cement layer are mainly granular (Figure 8A); when slightly larger-sized (Figure 8B), the morphology of the cement layer crystals tends to be prismatic (Figure 8B). The crystal co-orientation strength for the cement layer crystals is low (see MUD values in Figure 8A,B). The crystal texture can be very vaguely axial (pole figure in Figure 8B). Calcite c- and a*-axes can be developed with some directed orientation (pole figure for the granules in Figure 8A).
Figure 7. The microstructure, texture and carbonate phase of ostreoidean adductor myostraca (AG). (A): Hyotissa mcgintyi. (B): Ostrea stentina. The myostraca are formed of aragonite prisms (A,F). These have a characteristic microstructure derived from their growth process [42,43], form an axial texture (see pole figures for aragonite in (C,E)) and are characterized by a marked peak at about 63° to 64° misorientation in the relative frequency versus misorientation angle diagram (blue arrow in (C,G)). The latter indicates the twinning of the aragonite on the {110} plane. In comparison to shell calcite, myostracal aragonite crystals are more co-oriented (see the difference in MUD value between myostracal aragonite (C,E) and shell calcite (D)). Black arrows in the pole figures shown in (E) indicate the direction of c-axis orientation for foliated calcite and myostracal aragonite. We find for the two microstructures some correspondence in c-axes orientation.
Crystals 15 00286 g007
Figure 8. (A,B): Morphology, microstructure, texture and co-orientation strength of crystals that reinforce the biopolymer glue of Hyotissa mcgintyi (Gryphaeidae) and Magallana gigas (Ostreidae) which cements the shell to the substrate. White star in (A) indicates the granular nature of the cementation layer and the arrangement/assembly of granules into chains/strings. We observe from the pole figures some oriented arrangement of the cementation granules as well as for the adjacent assembly of dendritic crystals (A). Black arrows in the pole figures in (A) indicate the overall direction of c-axis orientation of the granular (the cementation granules) and of the dendritic calcite (the calcite encasing the pores).
Crystals 15 00286 g008

3.2. The Shell Layers Incorporating Voids and Pores

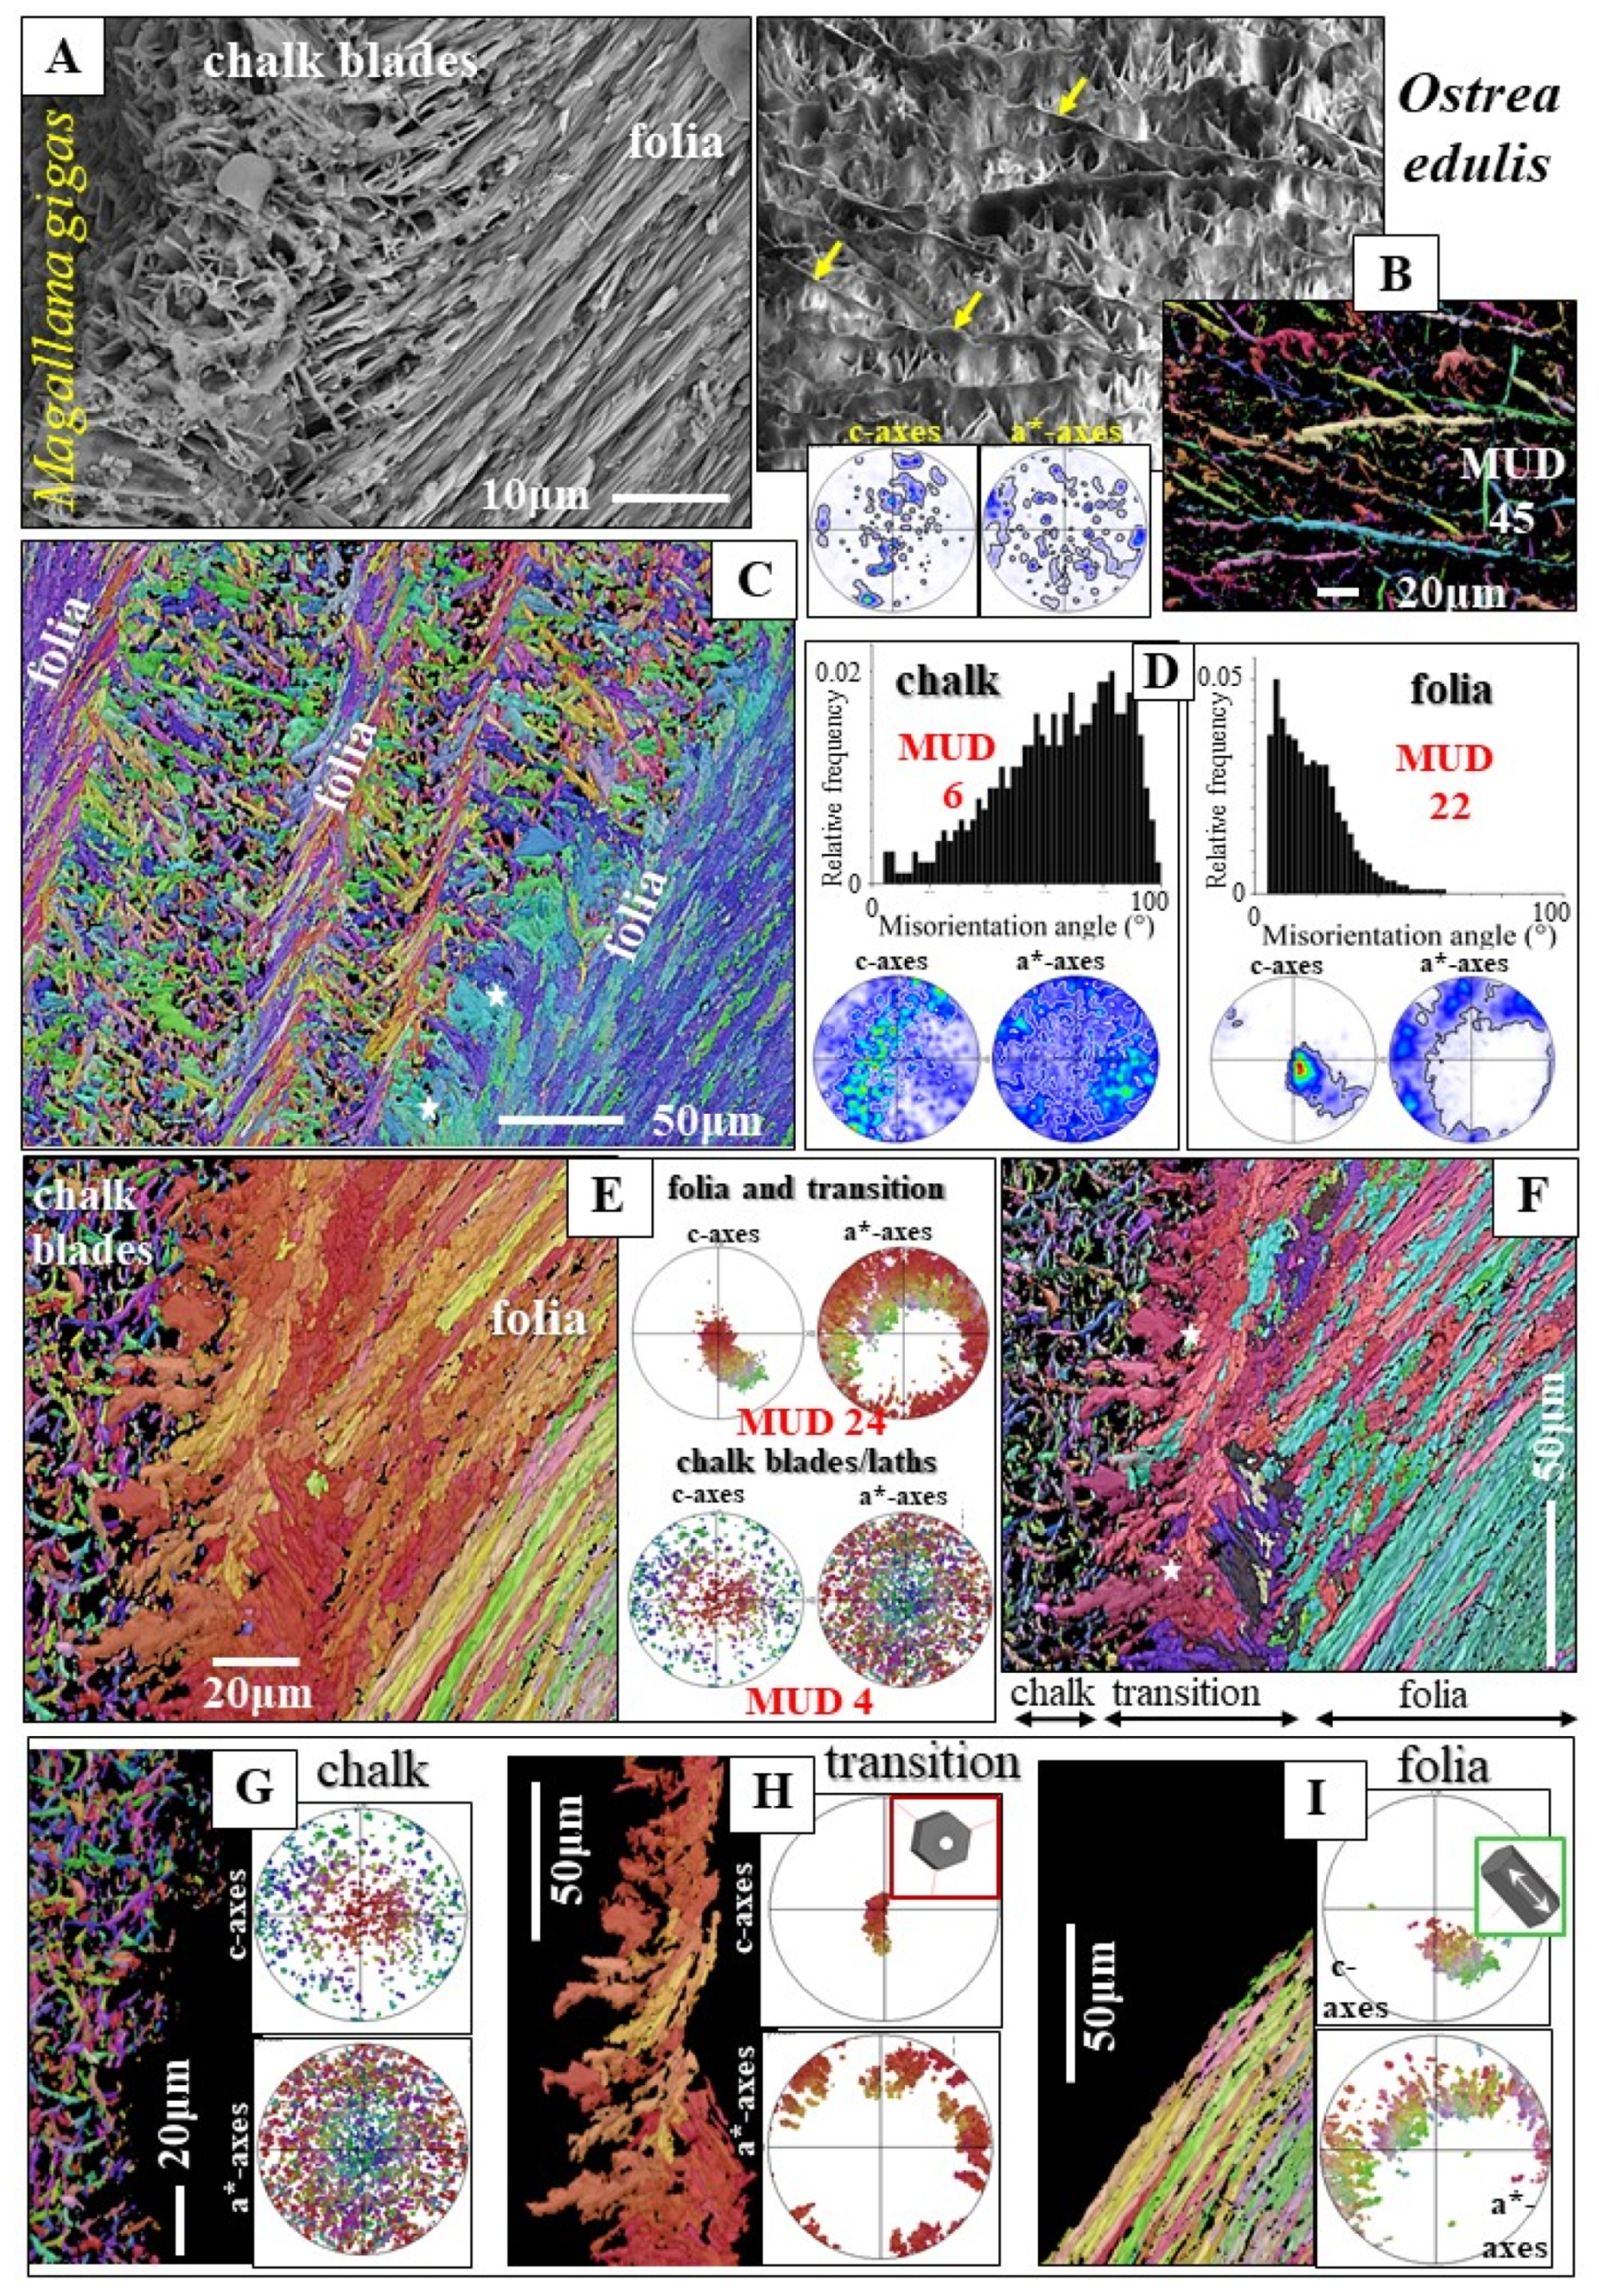
3.2.1. The Chalk Blades and Laths

Figure 9, Figure 10 and Figures S6–S8 visualize the structural arrangement of calcite crystals when voids and pores are incorporated into ostreoid shells. The latter is achieved differently in the two Ostreoidea families. Ostreidae incorporate a meshwork of calcite blades and laths, the chalk sections, in between the stacks of folia. Gryphaeidae occlude lenses of vesicular material. When based on SEM images, the crystal meshwork of the chalk appears to be entirely unstructured (Figure 9A,B and Figure S6A,B). This is the case to a large degree, as indicated by the large-angle misorientations in the relative frequency vs. misorientation angle diagrams (e.g., Figure 9D). However, we observe a slight structuring of the chalk by larger-sized blades/struts (see EBSD measurements in Figures S6C,D and Figure 9B). We not only find low MUD values for the calcite of the chalk (MUD 4 or 6, Figure 9D,E) but also an increased MUD (e.g., MUD 45, Figure 9B; MUD 24, Figure S6F). Thus, the crystallites that comprise the chalk portions of the shell are not at all entirely random in orientation. Our EBSD measurements demonstrate, when based on structure, the presence of a transitional zone between the foliated units and the meshwork of crystals of the chalk (white stars in Figure 9C,F). The structure of this transitional zone is chaotic; we do not find in the latter the typical structure of either the foliated units, or the blades of the meshwork of the chalk. Regarding crystal organization for the topologically closely related foliated, transitional and chalky crystal unit arrangements (Figure 9G–I and Figure S7), we observe a rotation in c-axis orientation from the folia (Figure 9I) to the crystals of the transition from the folia to the chalk blades/laths (Figure 9H). While c-axis orientation of calcite folia is within the plane of view (green to yellow data points in the pole figure in Figure 9I), it becomes gradually tilted out of the plane of view and is oriented perpendicular to the plane of view when approaching the transitional section to the chalk (yellow to red data points in the pole figure in Figure 9I). Calcite c-axis orientation of the transitional zone between the folia and the chalk is mainly perpendicular to the plane of view (red data points in the pole figure in Figure 9H).
Our study shows that calcite with a chalk-like microstructure is not only present in lenses within the foliated shell. We observe, for O. stentina, formation of a layer with a chalk-like microstructure, texture and misorientation angle distribution also at outer shell portions (Figure S6E), however, always in topological relation to the foliated shell layer (EBSD map in Figure S6F).

3.2.2. The Vesicular Pores

Figure 10 and Figure S8 show for the gryphaeids Hyotissa mcgintyi, H. hyotis and Neopycndonte cochlear the mode of crystal organization around vesicles and pores (e.g., Figure 10A–D). The calcite microstructure that surrounds the pores consists of an assembly of fractal-shaped dendritic crystals (Figure 10B–D and Figure S8). These are very diverse in size and, in particular, highly fractal in morphology. Adjacent crystals interlock strongly in 3D with neighboring fractal crystals (Figure 10B,C). The calcite of individual dendritic crystals is well co-oriented (see MUD values in Figure 10B,C); we find for individual dendritic crystals only low-angle misorientation (Figure 10B). Even though crystal co-orientation strength within an individual crystal is high, due to the more or less random interconnection of crystals, crystal co-orientation strength of the whole dendritic microstructure is low (e.g., MUD value in Figure 10A,D). The crystal co-orientation strength of the dendritic microstructure is comparable to that of the adjacent foliated shell. The texture of the dendritic granular microstructure is, in general, very weak (see pole figures for entire measurements in Figure 10A,D). Nonetheless, in rare cases, we see for the assembly of dendritic crystals the development of a weak axial texture (pole figure for the dendritic shell layer in Figure 8A). For the H. mcgintyi shell section, shown in Figure 8A, covering the foliated, the dendritic and the cement shell layers, we find very similar, but strongly decreased, crystal co-orientation strength, two texture patterns and some correspondence in c-axis orientation for the crystals that form the cement and the dendritic shell layers (Figure 8A).
Figure 9. The meshwork of crystals, and their microstructure and texture, that form chalk lenses in Ostreidae shells (AC) and the crossover from the foliated to the chalk-related assembly of crystals (EI). (A,CI): Magallana gigas. (B): Ostrea edulis. (A): SE micrograph. (B): BSE micrograph and orientation-coded EBSD map. (C,EI): EBSD maps, color coded for crystal orientation. (D,E,GI): Corresponding pole figures, showing orientation data or their density distribution. (D): Relative frequency versus misorientation angle diagrams highlighting the difference in misorientation angle pattern between the chalk blades and the assembly of folia. Crystal co-orientation strength is given with MUD values (D,E). (B): The meshwork of chalk blades and laths is structured by long-ranged struts (yellow arrows in (B)). The calcite of these is very co-oriented (see the high MUD value in (B)). We find between the stacks of folia and the agglomeration of chalk blades/laths a transitional zone (white stars in (C,F), marked by a chaotic microstructure, not resembling in structure either the arrays of folia or the aggregation of chalk blades/laths. (GI): Subsets of the EBSD measurement shown in (E,F) highlight the difference in crystal orientation between the blades, laths of the chalk (G), the crystals that form the transitional section between the chalk and the stacks of folia (H) and the stacks of folia (I). In the shell, these microstructures are adjacent to each other. Sketched crystals visualize calcite crystallographic axes orientation of the folia (I) and of the crystals that form the transitional section between the folia and the chalk blades (H). Calcite c-axes of the latter are perpendicular to the plane of view (H), while calcite c-axes of the folia are largely within the plane of view (I).
Crystals 15 00286 g009
Figure 10. The crystals, their size, morphology, microstructure and texture that encase the vesicular pores in the shell of the gryphaeid species Hyotissa mcgintyi (A,B), Hyotissa hyotis (C) and Neopycnodonte cochlear (D). (AD): For crystal orientation-coded EBSD maps, corresponding pole figures, crystal co-orientation strengths and misorientation angle diagrams. (AD): The fractal-shape of the dendrites encasing the vesicular pores in Hyotissa mcgintyi, Hyotissa hyotis and Neopycnodonte cochlear. These vary strongly in shape, size and orientation, relative to their neighboring dendrites; they are, however, formed of well co-oriented calcite (see corresponding pole figures and the related MUD value in, e.g., (C,D)). The texture pattern and misorientation angle distribution of the dendritic crystal assembly is distinct from that of the assembly of the foliated units (see, e.g., pole figures and misorientation angle diagrams in (A)). Note the axial texture for the dendritic shell portion and the turbostratic-like texture pattern of the foliated shell portion. (B,C): Strong interlinkage of dendritic crystals, well visible from the EBSD maps as well as from their interlinkage with their direct neighboring crystals. The three white arrows in the EBSD map in (B) point to the three individual dendrites shown in (B). The white stars in (C) mark the position of the dendrite (shown in (C)) in the corresponding EBSD map. EBSD map in (D): The assembly of folia lashes out into the adjacent dendritic layer, encasing the pores.
Crystals 15 00286 g010

3.2.3. The Rhombohedral Crystals

The calcite rhombohedra and their organization (Figure 1G) is detailed and discussed in Sancho Vaquer et al. [14].

4. Discussion

It is a challenge to obtain the right balance between strength, toughness and resilience (e.g., [41]) during the fabrication of structural materials. Nonetheless, when attained, it is mainly determined by the arrangement of the components of the structural material in question (e.g., [44,45,46,47,48]). The strength and toughness of a structural material can be influenced in many ways: (1) by incorporating impurities into the crystals, (2) by varying crystal size and crystal organization, (3) by forming composites out of different minerals, (4) by generating composites of organic substance and mineral or (5) by incorporating interfaces into crystals or into crystal microstructures [45,47,48].
Driven by different evolutionary selection pressures, a large variety of biologically secreted materials evolved in the geological past. These are characterized by a material performance which results from (1) their three-dimensional hierarchical architecture, (2) the bridging of many scale levels and connecting the atomic to the macro scale (e.g., [45,48]) and (3) fabricating composites, in particular, of biopolymers and minerals. Apart from the very minor amounts of aragonite in the myostraca and in the ligament, oysters form their shells of low-Mg calcite [15,16,17]. Hence, for their shells, the balance between strength, toughness and resilience is achieved, to a large degree, by the architecture of the different shell layers, that is, the morphology, size, interlinkage of crystals (microstructure) and the mode of crystal assembly in the different layers of the shell (texture) (Figure 1, Figure 2, Figure 3, Figure 4, Figure 5, Figure 6, Figure 7, Figure 8, Figure 9, Figure 10, Figure 11, Figure 12 and Figures S1–S11).

4.1. The Microstructures

The Ostreoidea are able to secrete crystals with many morphologies: columns, prisms, granules, rhombohedra, dendrites, blades, laths, folia, foliated units, and generate out of these six different microstructures and five different textures (Figure 1, Figure 2, Figure 3, Figure 4, Figure 5, Figure 6, Figure 7, Figure 8, Figure 9, Figure 10, Figure 11 and Figure 12). Apart from the myostracal aragonitic microstructure, all calcitic microstructures have low crystal co-orientation strengths, varying, for the measurements conducted in this study, from an MUD value of 4 to an MUD of 67 (Table 1, Figure 1, Figure 2, Figure 3, Figure 4, Figure 5, Figure 6, Figure 7, Figure 8, Figure 9, Figure 10, Figure 11 and Figure 12). Nonetheless, when individual crystals or crystal units are regarded, e.g., a rhombohedron, a dendrite, a folium, a foliated unit or a column, then calcite co-orientation strength is very high (e.g., Figure 3J, Figure 4D,E and Figure 12C,D, Table 1). Thus, little co-oriented is the assembly of the crystal units that form the different shell layers, while the calcite of individual units is highly co-oriented. The low crystal co-orientation strength of the different shell layer microstructures is striking, in particular, when compared to the co-orientation strength of other bivalve shell microstructures, where MUD values (for a particular microstructure and, thus, a particular shell layer) scatter between 200 and 400 [45,48]. The low crystal co-orientation strength of ostreoid shell microstructures is not just the result of fast shell secretion. The low MUD values of some ostreoid microstructures can be explained with the specific utilization of the shell layer, as is, e.g., the case for the assembly of columns, for the assembly of cement granules and for the assembly of the dendritic crystals.

4.1.1. The Microstructures of the Compact Shell Layers

The columnar-prismatic layer
The columnar layer consists of closely packed, discrete, column-shaped large calcite units, in some references termed also as prisms. In cross-section, individual columns have polygonal morphologies (Figure 3D). The columnar prisms are variable in size (see Figure S1A,B). In general, their arrangement in the layer is such that, towards the outer columnar layer surface, the columns decrease in size (Figure S1A). For the investigated species, we found that the outermost shell-layer surface is seamed by rather small-sized columns, which increase in size toward the changeover to the foliated shell layer (Figure S1A,B).
We find two main structural characteristics for the columnar layer of the investigated ostreoid species:
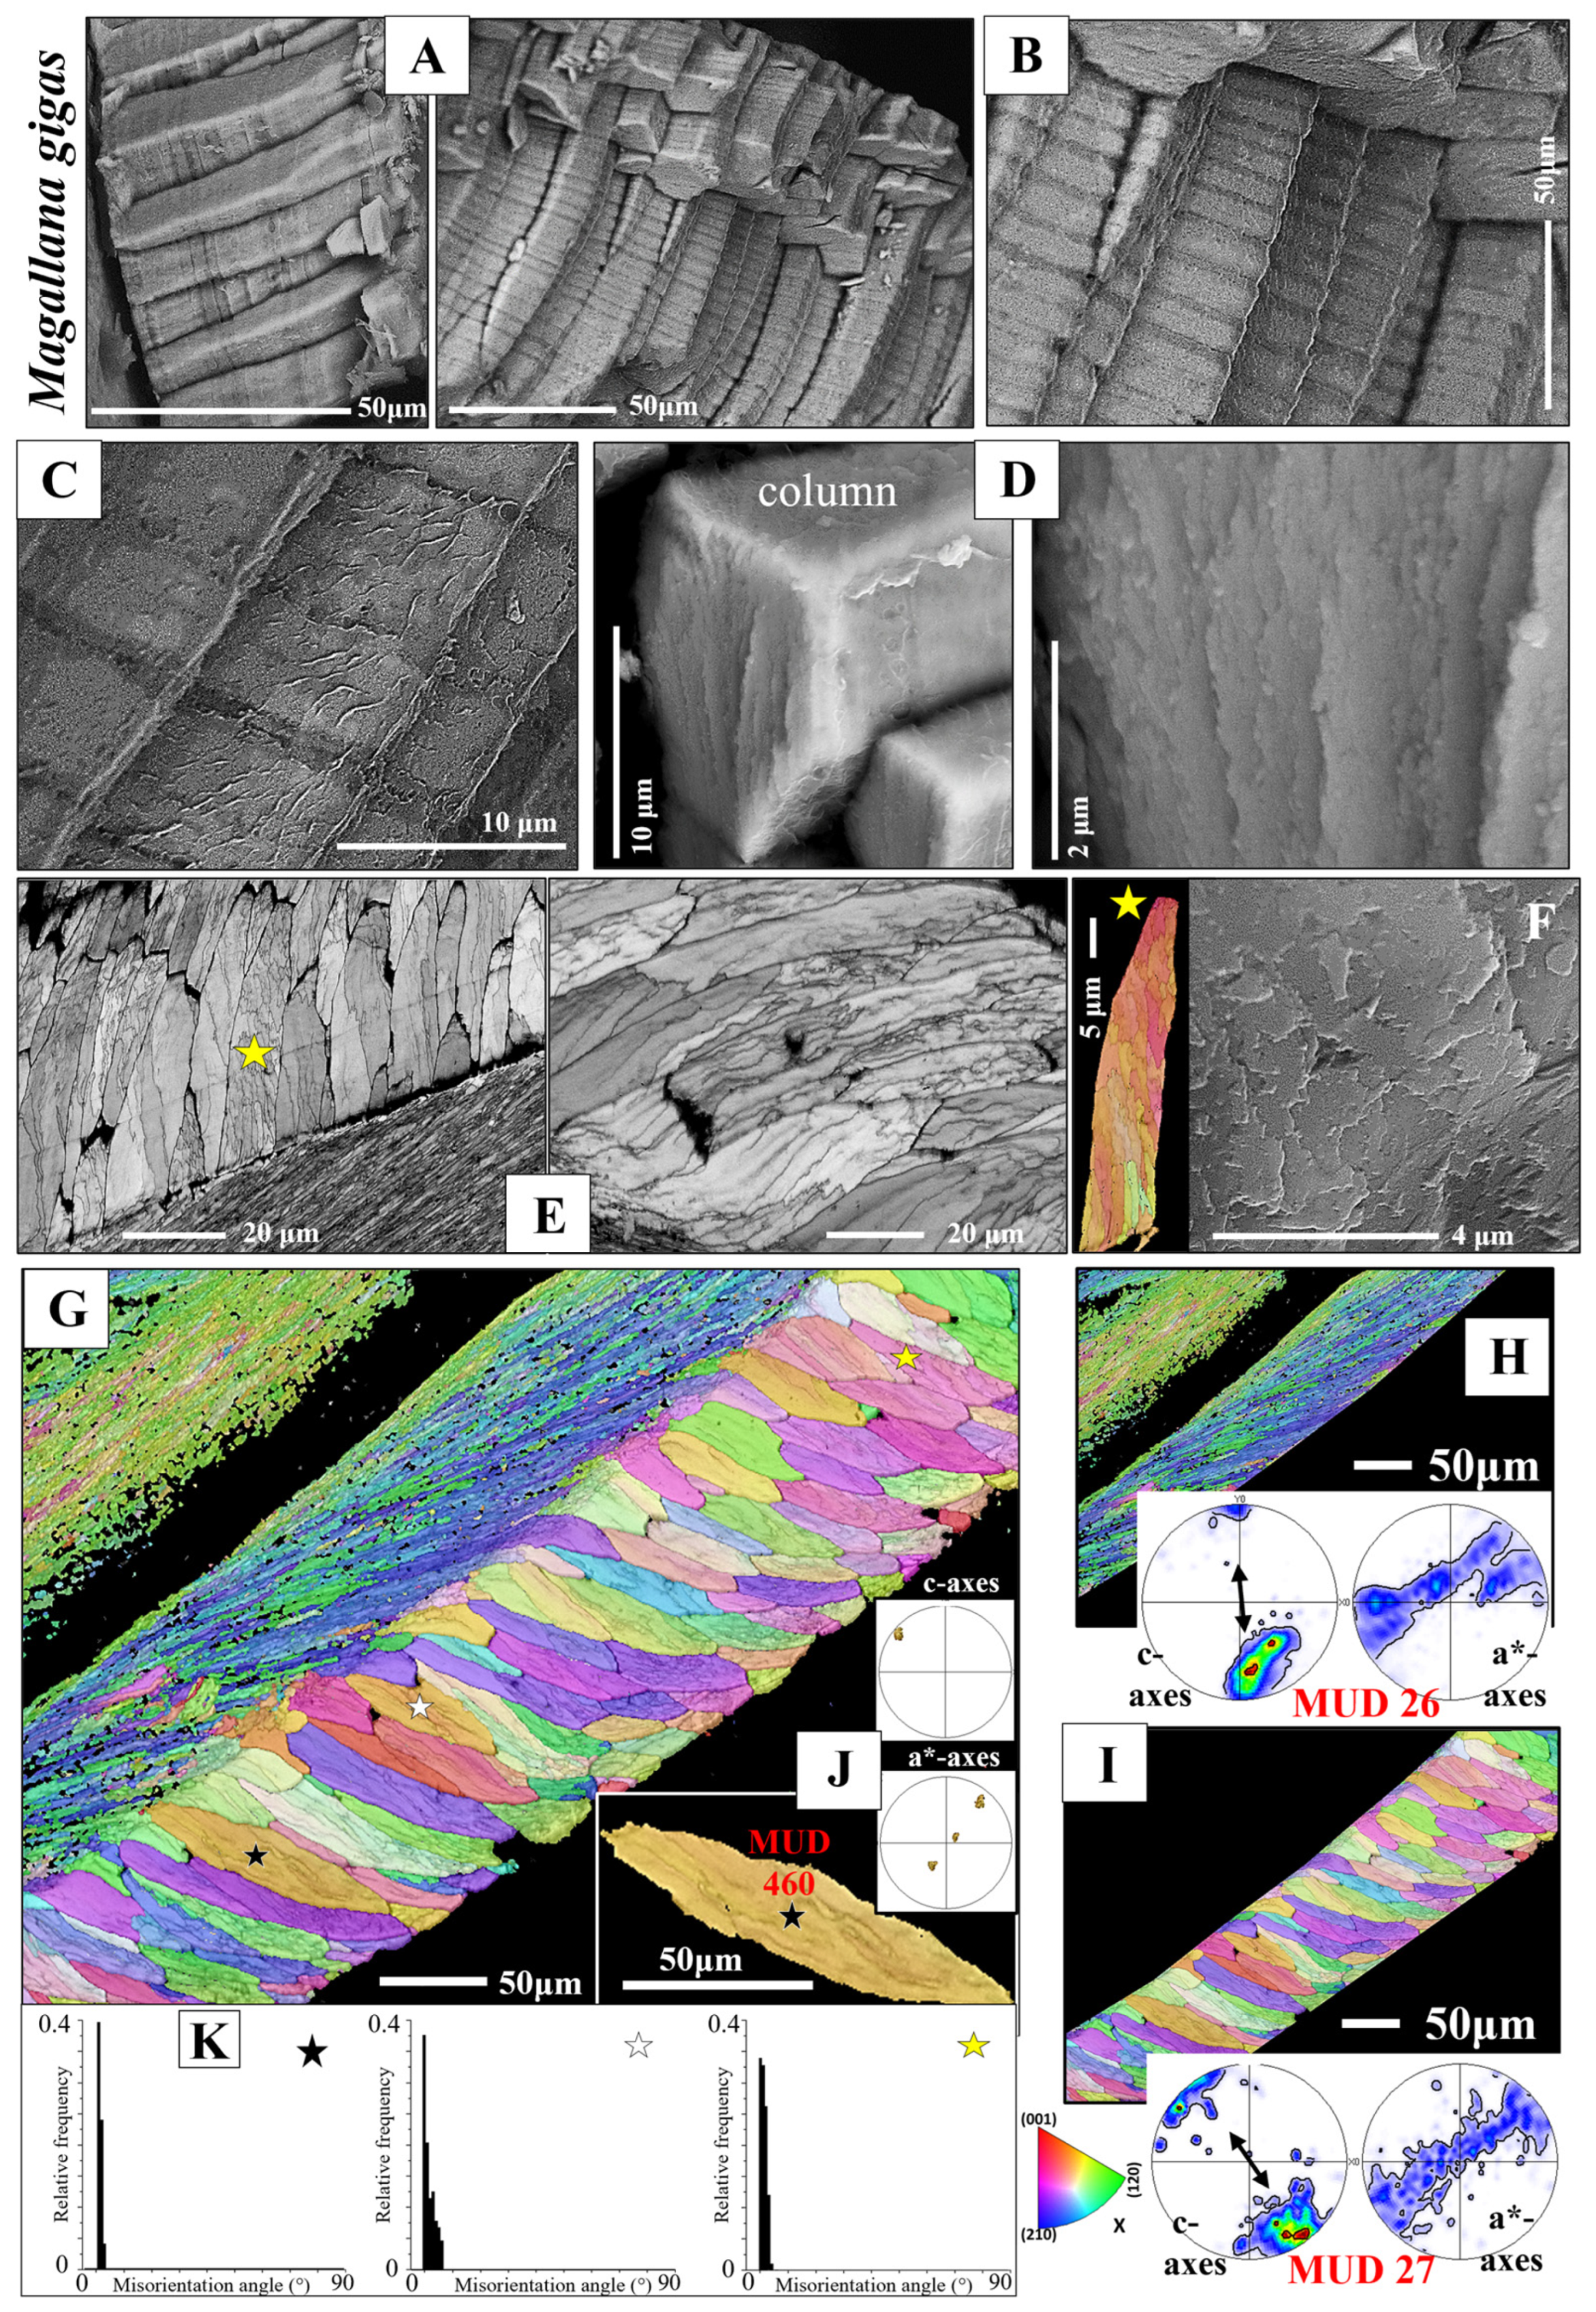
  • The columnar layer is strongly enriched in organic substance. The latter is developed as thick membranes delineating adjacent columns ([48] and Figures 35 and 37 in [49]). In addition, we observed that much organic substance is present within the columns, e.g., Figure 3B,C. Surprisingly, the deposition of organic substance in the columns has a banded appearance (Figure 3A–C). Thus, we find within a column an alternation of organic-rich and slightly less organic-rich bands (Figure 3B,C). Organic substance distribution in a column is rather inhomogeneous, as is not the case for other bivalve aragonitic columnar prisms (e.g., Elliptio crassidens (Lamarck, 1819) [31]). The growth bands in ostreoid columnar layers are episodic growth bands. Harper and Checa [48] investigated the organic content of the shell layers of pearl oysters (very many species of 29 taxa). These form their shells of columnar calcite and nacreous aragonite. The authors detected a significant difference in organic substance content between the columnar and the nacreous shell layers and suggested that the high percentage of organic substance of the columnar layer, relative to the nacreous shell layer, might be regarded as a functional trait. The more organic substance-rich and, thus, more ductile the columnar layer is, the better is the structural flexibility of the columnar shell layer. The authors suggested that a tighter closure of the valves could be achieved and, with this, a better protection of the soft tissue and the organs [48].
  • The other structural characteristic that we observed for the columnar layer of the investigated species is the strong structuring of the columns (Figure 3E,F and Figure S3). An individual column consists of many subunits, domains. These have very irregular shapes and sizes (Figure 3E and Figure S3A) and are misoriented to each other by about 5° to 10° (Figure 3K). The subunits or domains of the columns are formed of platy calcite crystals (Figure S2). These have strongly irregular morphologies and vary highly in size (Figure 3F and Figure S3B,C). It should be noted that, for the species investigated in this study, neither the structuring of the columns into subunits/domains nor the crystals that comprise the domains resemble the structures that we find for the corresponding foliated shells. It should be kept in mind that we observed very different microstructures and textures for the columnar-prismatic and for the foliated shell layers. Despite the latter, three structural characteristics are similar for these shell layers: (i) their very hierarchical architecture, (ii) the high co-orientation strength of calcite crystals in the subunits/domains (Figure 3J and Figure 4E,F) and (iii) the very low co-orientation strength of individual units (columns, foliated units) in the relevant shell layer (Figure 3H,I).
The foliated layer
For all investigated species, the foliated shell layer comprises the largest part, by volume, of the valves and is outstanding in microstructure and crystal texture (per, e.g., the results of this study and [15,16,21,22,50,51]). The crystals of the foliated material are arrowhead terminated laths. These assemble, more or less, in parallel and form sheets, consisting of a few parallel laths. Two to three sheets form a folium. Assemblies of folia form a foliated unit, and aggregations of foliated units form the foliated shell layer (e.g., Figure 4, Figure 5, Figures S4 and S5). We observe, for the foliated shell of the investigated species, single crystallinity for individual sheets of the foliated crystals and for assemblies of sheets and folia, thus, for a foliated unit, a gradation in c- and a*-axes orientation distribution (see pole figures in Figure 4E,F). Thus, for an assembly of foliated units, we find in the 2D pole figure a ring-shaped orientation distribution of calcite c- and a*-axes (see the pole figures in Figure 6D and Figure 7B). The latter is, from a crystallographic point of view, a very remarkable structural characteristic. Other organisms, such as gastropods and bryozoans, also have foliated layers, but their textures are different from the foliated calcite of the Ostreoidea (e.g., [52,53]).
The combined interpretation of crystallographic characteristics gained from the ostreoid foliated microstructures and the corresponding textures allows the conclusion that the texture pattern of the foliated shell layer of the investigated species resembles, to some extent, a turbostratic arrangement of the folia and of the foliated units, however, only to some extent. For the description of a turbostratic arrangement of particles, see, e.g., [54,55]. Cumulative misorientation angle patterns along trajectories parallel or/and orthogonal to the length of a foliated unit show that the course of the misorientation angle in the cumulative misorientation diagram is very smooth with the length of the foliated unit. It is, however, jagged when the trajectory runs orthogonal to the length of the foliated unit (Figure S5B,C). The latter and the appearance of crystallographic axes of the calcite in the pole figures indicate that the texture of the ostreoid foliated microstructure is not axial (it is not an axial texture with the c-axis being the texture axis), and neither is it single crystalline. The foliated texture pattern resembles a turbostratic arrangement of components [54,55]. Nonetheless, the Ostreoidea foliated texture is a specific form of the turbostratic texture motif [51]. Turbostratic textures are described for aggregates of clay particles and clay particle units, for example. Clay particles are also platelets, and many of them form clay platelet units. When settling in clay–water suspensions, a layer is formed of clay platelet units, and the units are arranged in the layer with a turbostratic arrangement pattern [54,55]. The crystals that form the ostreoid foliated shell are lath-shaped. Aggregations of these form sheets and folia. The folia generate units, and a multitude of units generates the foliated shell. Nonetheless, the structural difference between the foliated units and the clay platelet units is that the arrangement of the clay platelets in the clay platelet unit is little structured or even unstructured, while the arrangement of folia in the foliated unit is highly structured. The texture pattern of the foliated microstructure is very intricate and not yet fully understood. A turbostratic motif comes closest to explaining the arrangement of the folia and of the foliated units within the ostreoid foliated shell.
The cement layer
The cement layer of ostreoids has a compact microstructure, relative to the cavity-rich microstructures of both the chalk and of the vesicular lenses. The crystals in the cement layer of the investigated species are mainly granular and can be regarded to be reinforcements of the organic glue that cements the shell to the rough substrate. Although the orientation pattern of the cement granules is rather isotropic (see the pole figures in Figure 8B for the cement granules), in some instances, we observed some directed orientation of the granules (see the pole figure for the granules in Figure 8A) and, as is shown in Figure 8A, some co-orientation of calcite c-axes of the cement granules and the c-axes of the adjacent dendritic crystals (see the pole figures for the dendritic crystals and cementation granules in Figure 8A). Our study did not suggest a reason for the low co-orientation strength of the cement granules. Nonetheless, the low degree of their co-alignment in the layer is in concert with the low co-alignment of the units (e.g., the columnar and foliated units) that form the other ostreoid shell layers.
From our EBSD measurements, we did not observe the ridge-and-furrow structure of the cementation granules, as reported by Yamaguchi [56]. Nor can we confirm the conclusion of MacDonald et al. [27] that the cement granules are precipitated from seawater and are not secreted by the organism. MacDonald et al. [27] justify the latter conclusion with the observations that (i) the cement granules consist of high-Mg calcite and (ii) that the cement granules are fully random in orientation. We investigated in great detail the cement layer of H. mcgintyi and M. gigas and did not find any difference in Mg content between the granules and the adjacent folia. In contrast, when EBSD measurements were conducted with high resolution, we observed (i) a tight structural connection between the foliated shell and the adjacent assembly of cementation granules (Figure 8A,B) and (ii) even some continuity in orientation of calcite c- and a*-axes between the dendritic and the granular crystals (Figure 8A). As shown in this as well as in other studies [30], not all Ca-carbonate skeletons/skeletal elements need to have a high crystal co-orientation strength. It is not uncommon for an organism to secrete a carbonate hard tissue consisting of crystals with a low or almost random crystal co-orientation strength (e.g., [30,50]). This is observed for, e.g., the shell of thecideid brachiopods [57] and for the shell of the bivalve Arctica islandica (Linnaeus, 1767) [58]. Based on crystal co-orientation strength, it cannot be determined if the mineralized components of the shell are precipitated from seawater or are the products of biological secretion. We consider the cement granules as well as the calcite of the rest of the ostreoid shell as being the products of biological secretion.
The myostracal layer
The myostraca of bivalves are always formed of aragonite, even if the rest of the shell consists of calcite (e.g., [42,43] and references therein). This is not the case for all bivalved marine organisms, e.g., for modern rhynchonelliform brachiopod myotests/myostraca, the scars of the brachiopod muscle attachment sites consist of calcite [59]. Modern rhynchonelliform brachiopods secrete calcitic shells as well as calcitic muscle attachment sites [59].
In the case of Ostreoidea, not only the carbonate phase of their myostraca is different from the mineralogy of the rest of the shell, but all other structural attributes of their myostraca are different as well, e.g., crystal morphology, crystal co-orientation strength, myostracal microstructure and texture (Figure 7C,E). The marked difference in structure, microstructure and texture between the myostraca and the rest of the shell is the result of the influence of different microstructure formation determinants [28]. The columnar-prismatic, foliated, granular and myostracal microstructures are biologically secreted. For the myostracal microstructure, however, the growth of the crystals is not only determined by biological secretion but also by the crystal growth process, namely competitive growth. For myostracal crystal growth, see also Hoerl et al. [42,43]. The growth process that influences the microstructure of ostreoid myostracal crystals is the process of growth competition. At the latter growth process, the orientation of the crystal’s growth axis, for calcite, the c-axis, determines the success of a crystal to grow to a larger entity. Myostracal crystals nucleate onto the adjacent shell layer template; in the case of the Ostreoidea, this is the foliated shell template. At nucleation, many crystals form next to each other and compete for space. The first crystals are minute and have random orientation [22,60,61]. Those crystals that have their fastest growth axis oriented perpendicular to the orientation of the template surface, thus, perpendicular to the foliated layer surface, can grow without any inhibition and develop into large entities. Crystals that have their fastest growth axis direction at an angle to the nucleation template collide at growth with their neighbors and, due to restriction in available space, become eliminated. Hence, even though the nucleation of myostracal crystals is biologically determined, the growth process of the myostracal crystals effects that the inner, myostracal shell surface is seamed by large myostracal prisms. The c-axes of adjacent prisms are parallel to each other and are oriented normal to the inner shell surface.
Our EBSD results show a further important structural characteristic for the myostracal microstructure of the investigated species. Myostracal aragonite is always twinned (see the marked misorientation peaks at 63°/64° in the misorientation diagrams in Figure 7C,G), while columnar-prismatic, lath, foliated, granular, blade, dendritic, rhombohedral calcite of the investigated species in not twinned. The crystal twinning of the calcite will be discussed subsequently.

4.1.2. The Microstructures Hosting the Cavities and Pores

The ostreoids have developed two strategies for enabling cavity incorporation into the shell. The shell layer that hosts the vesicular pores is never within the foliated microstructure; nonetheless, it is always associated to it. However, the meshwork of the chalk blades is positioned always within the foliated microstructure.
The chalk and the vesicular microstructures are considered to be structurally unrelated [7,11] and might be taken as an indication that the Ostreidae and the Gryphaeidae arrived independently to a comparable Ca-carbonate material functionalization solution, possibly driven by adaptation to similar environmental requirements. The foliated microstructure plays an important role in facilitating these open, cavity-rich microstructures, as both the void-rich chalk lenses and the arrays of the vesicular pores are in topological relation to the foliated mode of crystal and crystal unit arrangement. They are not in structural relation to other crystal arrangements, e.g., to the assembly of the columns.
The structure of the meshwork of chalk blades and laths is specific, in particular, when the degree of structuring is considered. It is very different to the arrangement of folia that, nonetheless, surrounds the chalk lenses. The observation of these differences led to the suggestion that the blades/laths and the folia are formed through different biomineralization processes. The latter was investigated by Korringa [62], Pelseneer [63], Ranson [64], Galtsoff [65], Margolis and Carver [66], Ullmann et al. [67], Checa et al. [22], Banker and Sumner [29] and de Winter et al. [68]. All these studies indicate that the chalk as well as all other oyster shell layers are deposited directly by the oyster. A possible explanation for the specific microstructure of the chalk and for its disordered structural nature was given by Checa et al. [22]. The authors suggested that the foliated layer and the chalk lenses form at different growth rates; namely, the cavity-rich chalk calcite is formed at a higher thickening speed, relative to the thickening speed of the compact foliated calcite. Ostreoidea secrete bulky and robust shells. Thus, quickly and easily formed intercalation of cavity- and pore-rich segments into the shell is a well-devised mode of generating thick shells.
SEM images of the chalk structure convey the impression that the chalk is a fully random assembly of blades and laths (Figure S7C). However, EBSD scans taken on the chalk show some internal structuring (Figure 9B and Figure S6C,D). The aggregation of the laths is pervaded by undulated blades, possibly for the stabilization of the cavity-rich chalk structure. Individual chalk blades have increased to even high crystal co-orientation strengths (Table 1) and traverse the chalk structure over large distances (Figure 9B and Figure S6C,D). Thus, one can also find, for EBSD scans performed on the chalk, an increased crystal co-orientation strength. Furthermore, we see in misorientation angle diagrams for all EBSD scans conducted on the chalk, the tendency to the formation of, mainly, large misorientations. This indicates as well some structural organization of the chalk microstructure.
The Gryphaeidae developed a different strategy for the incorporation of cavities into their shells. Gryphaeidae secrete a shell layer with a specific microstructure, which is capable of accommodating extended sequences of vesicles and, often, large-sized pores. The latter is possible through formation of a layer consisting of strongly interlinked crystals having highly irregular and strongly fractal morphologies (Figure 12B,C). These crystals are dendrites, interlink extensively in 3D and form a microstructure that has also a very low crystal co-orientation strength (Table 1). The vesicles are, in general, large-sized cavities; thus, the mineralized structure that encases them needs to be particularly robust. This is realized by the Gryphaeidae by a shell layer structure formed of interdigitated fractal-shaped dendrites. As is the case for the columnar and for the foliated shell layers, for the dendritic crystal layer as well, we find that the individual crystal units are well to even strongly co-oriented, while the respective shell layer has a low crystal co-orientation strength (Table 1).
The ability to secrete a meshwork of fractal crystals for shell formation is also found outside the molluscs. We find a similar microstructural motif, rooted in the interlinkage of strongly fractal-shaped calcite crystals, for the formation of the primary shell layer of modern rhynchonelliform brachiopods (Figues 19A–C and 20A in [57]). A tight interlinkage of fractal-shaped calcite crystals generates the microstructure of modern thecideid brachiopod shells (Figure 10 in [69]) and the ornamentation microstructure of the modern euheterodont bivalve Chama arcana (F. R. Bernard, 1976) (Figure 3b,c in [42]). The pronounced fractality of the crystals facilitates the very tight interlinkage of crystals in 3D and an undirected mode of interlinkage. It should be noted that all the above-given examples for shell layer formation out of interlinked, fractal-shaped, dendritic crystals are calcitic microstructures. To our knowledge, this microstructure motif has not been observed yet for biologically formed aragonites.

4.1.3. Microstructures Generating Curved Surfaces

When a curved inner shell surface is generated by the Ostreoidea, the size of the foliated units decreases towards the inner shell surface (Figure 5 and Figure S4). In addition, as the difference in point-to-point misorientation between the foliated units shows (Figure S5B,C), the degree of misorientation between adjacent folia in a foliated unit decreases towards the inner shell surface. Thus, at the inner shell surface, a microstructure is present that consists of small foliated units, with the comprising folia having a low crystal co-orientation strength. See the difference in microstructure between sections a and b of the EBSD scan given in Figure 5. We observed clearly that the shell layer section formed of small foliated units does not abruptly change into a shell portion with large foliated units. The change from large to small foliated units is gradual (Figure 5B).
Curved surfaces forming the inner surface of the vesicles of the Gryphaeidae (Figure 10) are generated with formation of a shell layer consisting of strongly interlinked, little co-oriented, fractal-shaped crystals.
Thus, the main difference in structural strategy of curved surface formation between Ostreidae and Gryphaeidae lies in crystal shape.

4.2. The Textures

We described in the Results Section and discussed in the Discussion Section the large diversity of crystal morphologies and the diversity of microstructures that oysters can generate for shell formation.
Do we find such a diversity in crystal textures?
As the pole figures in Figure 3, Figure 5, Figure 7, Figure 8, Figure 9 and Figure 10 demonstrate, ostreoids are capable of secreting calcite with diverse texture modes, and this in the same shell. Within the same oyster shell, we find single crystal-like textures (individual columns, individual foliated units), axial textures (columnar layer), turbostratic-like textures (foliated layer) and dendritic-polycrystalline textures, with an almost random preferred orientation of the crystals (meshwork of the chalk, the shell layer formed by dendritic crystals, the crystals of the cement layer). Thus, we find for ostreoid shells a wider abundance of texture patterns, as observed today for the Ca-carbonate microstructures secreted by other shelled marine organism orders (Figure 12.15 in [31]).
Concluding the microstructure and texture Discussion Section, the results of our study show the following for the texture of ostreoid shells:
(i)
For the Ostreoidea, the diversity of crystal texture patterns is increased, relative to the diversity of texture patterns that we detect for the shells of other bivalved, biocarbonate-forming, marine organism orders.
(ii)
We observe, for Ostreoidea shells, a larger diversity in crystal microstructures, relative to what we find for their crystal textures.

4.3. The Changeover Between Adjacent Microstructures

As ostreoid shells comprise many microstructure patterns, they are ideal for an investigation of structural features at the changeover from the one microstructure into the other. We investigated the latter from a crystallographic point of view and discuss, subsequently, some crystallographic characteristics of calcite crystals that we observe for the different microstructure changeovers (Figure 11, Figure 12 and Figures S9–S11). We show the crystal orientation that prevails at the interface between adjacent microstructures with the corresponding EBSD maps, but also with the {100} (a*-axes), <001> (c-axes) and the {104}, {018}, {012} pole figures. These pole figures are shown for the one microstructure, e.g., for the columns, as well as for the two adjacent microstructures, e.g., for the columns and for the adjacent folia. For a better visualization of the nature of the changeover, we complement the EBSD scans and pole figures with relative frequency–misorientation angle diagrams (Figure 11, Figure 12 and Figure S9).

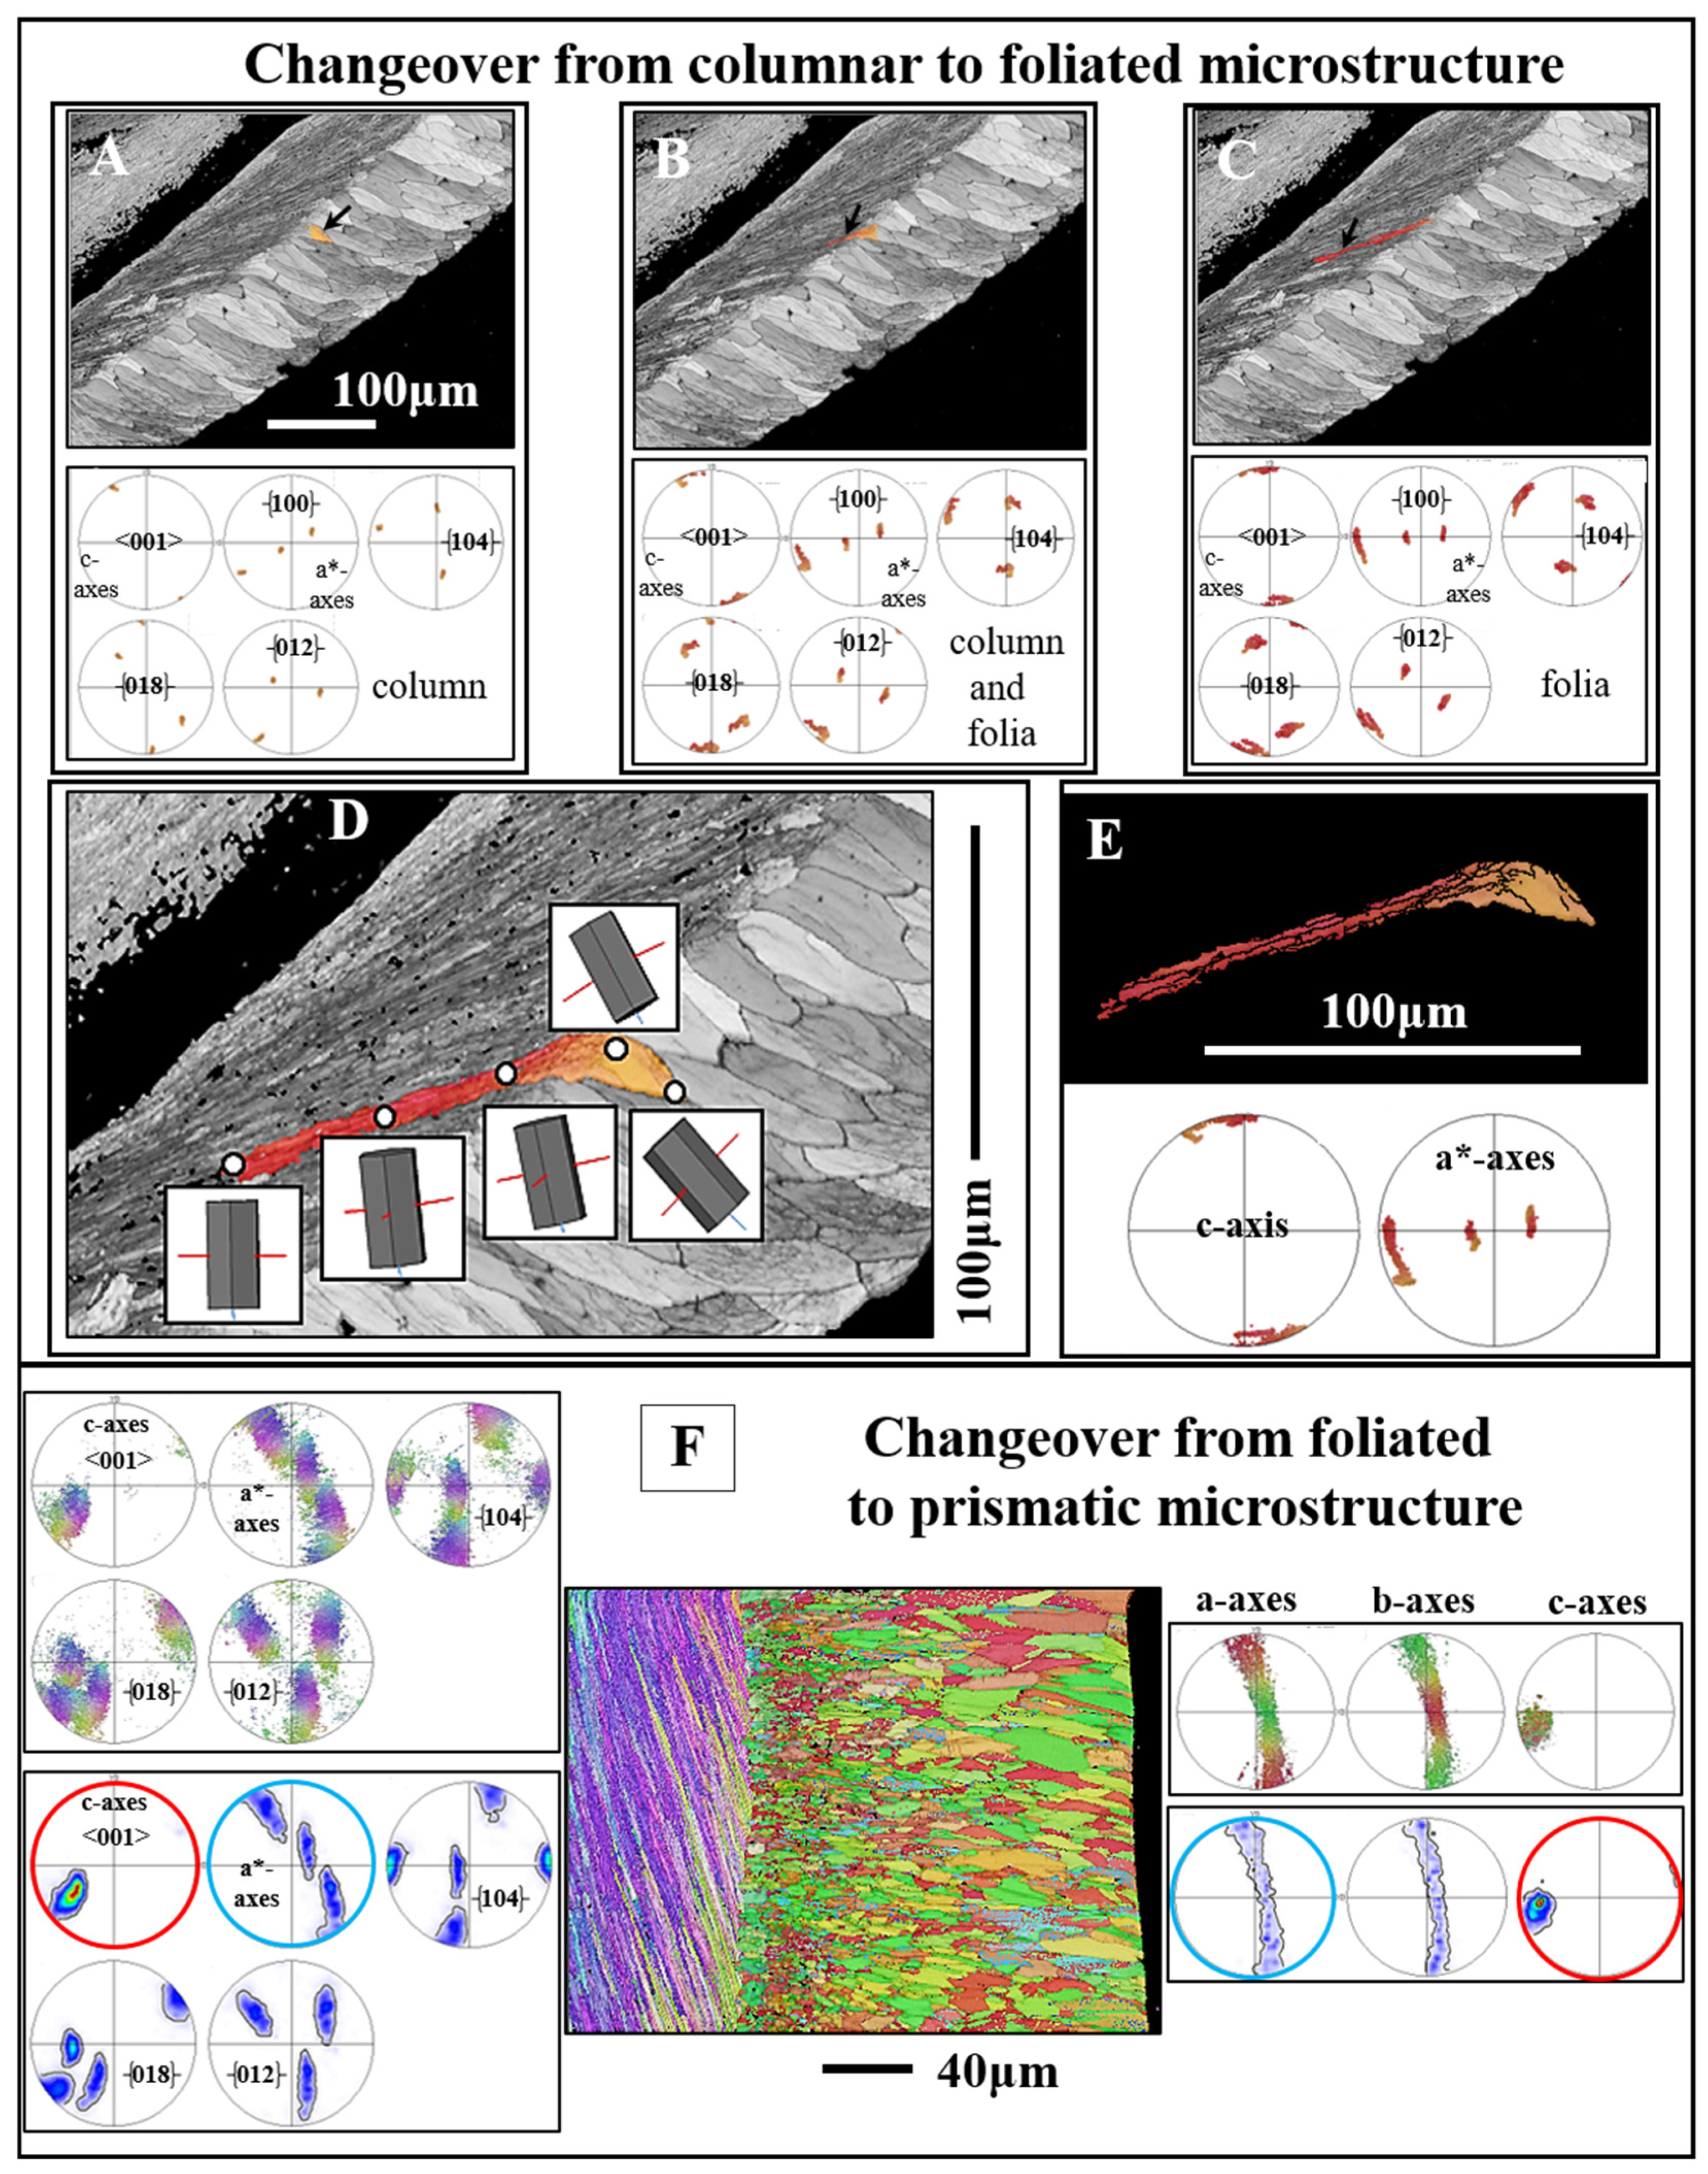
4.3.1. Oriented Nucleation Related Changeover

The changeover from foliated calcite to prismatic aragonite can be addressed as the oriented nucleation of myostracal prisms onto the foliated crystals (Figure 11F). Even though we find significant differences in texture for the folia and the myostracal prisms, as the c-axes orientation of an assembly of foliated units has a ring-shaped orientation distribution with orientational clusters superimposed on the c-axis orientation ring (Figures 6 and 9A in [51]), there will always be c-axes orientations of some foliated units that are parallel to the c-axes orientation of myostracal prism aragonite. However, due to the difference in the foliated and the myostracal-prismatic texture (see pole figures in Figure 11F), there is no correspondence between the foliated calcite and the myostracal aragonite a*- (calcite) and a- (aragonite) axes orientations (Figure 11F). For further discussion of the latter, see Griesshaber et al. [51].
Figure 11. Calcite c- and a*-axes orientations at the changeover from columns to the stacks of folia (AE) and from the assembly of folia to myostracal prisms (F). For investigation of a possible crystal twin-related change between adjacent microstructures, we show, in addition to the c-axis (the {001} pole figure) and a*-axes (the {110} pole figure) orientations, pole figures for {104}, {018} and {012} plane orientations. As is well visible from the pole figures in (AC), the transition from the columns to the adjacent folia is not twin operation related. It is, rather, a gradual, crystal rotation-based change between the crystallites of the columnar to the crystallites of the foliated shell layers (D,E). (F): Changeover from foliated calcite to myostracal, prismatic, aragonite. Even though the microstructures, as well as the textures, are very different for these two shell layers, we find some correspondence in c-axes orientation (see pole figures encircled in red in (F)) and some correspondence in a*-axes orientations for the calcite and the aragonite (see the pole figures encircled in blue in (F)). (AE): Magallana gigas. (F): Ostrea stentina.
Crystals 15 00286 g011
Figure 12. EBSD scans, color coded for crystal orientation, visualize calcite c- and a*-axes orientation at the changeover from foliated to chalky calcite (AC). We show with pole figures c-axis ({001} pole figure) and a*-axes ({100} pole figure) as well as the {104}, {018} and {012} orientations. These are shown for (i) only the foliated calcite and (ii) for the foliated calcite and the -chalk blades attaching to the calcite. In addition, we give corresponding relative frequency–misorientation angle diagrams for the crystal orientations given in (AC). We do not find a crystal twin-related changeover from foliated to chalk calcite. If the latter were the case, we would need to observe in the misorientation angle diagrams for the folia and the directly adjacent chalk crystals a marked peak in either 60°, 78.1°, 78.8° or 104° misorientation, as defined according to the twin laws of calcite [42,43]. We demonstrate with the absence of a marked peak at 60°, 78°/79° and 104° misorientation and the {001}, {104}, {018} and {012} pole figures that foliated and chalk calcite are not twinned and that the changeover from folia to chalk calcite is not given with a calcite twin related crystallographic operation. A to C: Magallana gigas.
Crystals 15 00286 g012

4.3.2. Crystal Twin-Related Changeover

From folia and foliated units to chalk blades
Due to the large spread in crystallographic axes orientation of chalk calcite (e.g., the pole figure for chalk calcite in Figure 9G), it is difficult to describe the changeover from foliated to chalk calcite, as the widespread chalk calcite orientation masks the nature of the changeover. Nonetheless, based on misorientation diagrams and on the pole figures for the four twin laws of calcite (Figure 12 and Figure S9), we can determine whether there is a crystal twin-related relationship between the folia and the chalk blades/laths, thus, a twin-related changeover from the foliated shell layer to the chalk lens.
A twinned crystal is an intergrowth of two or more crystal domains of the same phase and chemical composition [70]. The twin domains have different orientations. Their orientational relationship, however, is crystallographically defined through a mirror operation on a crystallographic lattice plane or a rotation around a crystallographic axis. Thus, the domains of a twinned crystal are related to each other through crystallographically defined misorientations; the degree of the twin-related misorientation is defined by the twin law. As twin crystals are intergrowths of adjacent domains, for the proof of a crystal twin-based relation between adjacent crystals, it is necessary to examine neighboring crystals, thus, to examine a possible twin formation for a folium or a foliated unit that is directly adjacent to a chalk blade or to a cluster of chalk blades. This is the case for the examples that we show in Figure 12A–C and Figure S9. We give for three EBSD scans misorientation angle diagrams and twin law-related pole figures for (i) only the foliated calcite and (ii) the foliated calcite and the directly adjacent chalk blades.
The mode of intergrowth of twin domains is defined by the twin laws [70]. Inorganic calcite is known to follow four classical twin laws, named after the Miller indices of the twin planes, the {104}, {018}, {012} and {001} planes [70,71]. These twin laws are regarded as the classical twin laws of calcite. Yin et al. [72], Lastam et al. [73] and Lastam et al. [74] showed that the most frequently occurring biocalcite twin law is the {001} twin. Pokroy et al. [75] identified a fifth {108} twin in non-biologic calcite. Schmahl et al. [76] detected, also for biologically secreted calcite, a further systematically and frequently reoccurring misorientation, at 78° on the [6 −6 1] twin axis, and addressed this misorientation as a non-classical form of calcite twinning. Accordingly, if the changeover from folia to chalk blades is determined by a twin-related crystallographic operation, we not only need to see this in the pole figure given for the relevant twin, but also and in particular, we need to see a marked peak in the misorientation angle diagram at a specific misorientation, which is defined by the relevant twin law. In the case of crystal twinning at the changeover from foliated to bladed calcite, we should see a peak either at 60°, 78°, 79° and/or 104° misorientation. For the EBSD measurements, covering the foliated and adjacent chalk calcite, we find neither in the pole figures nor in the corresponding misorientation angle diagrams any indication for a twin-related changeover from the folia to the chalk blades (Figure 12 and Figure S9).
The structural relationship between adjacent columns
The EBSD scans that were measured for this study allowed the investigation of the mode of misorientation between adjacent columns of the ostreoid columnar shell layer, in particular, an assessment of if adjacent columns are related to each other by a twin-related orientation relationship. As the orientational relationship of the twin domains of a twin crystal is crystallographically defined and is either a mirror operation on a crystallographic lattice plane or a rotation around a crystallographic axis, we show, for a large array of columns along trajectories A to B, the following:
(i)
Relative frequency versus misorientation angle diagrams;
(ii)
Degree of misorientation versus distance diagrams (Figure S10).
In addition, we give for 67 trajectories taken on adjacent columns (Figure S11A), the following:
(i)
The misorientation angles and their frequencies (Figure S11B);
(ii)
The crystallographic indices of the misorientation axes and the frequencies of these misorientation axes (Figure S11C).
Thus, if adjacent ostreoid columns are related to each other through a crystal twin-defined orientational relationship, we would need to see a specific calcite twin law-related misorientation (at 60°, 78°, 79° and/or 104° misorientation) in one of the misorientation diagrams (Figure S10) or a calcite twin law-related angle (Figure S11B,C) or a frequently occurring, twin law-related crystallographic axis, preferentially the (001) axis (Figure S11C). None of these is the case. We see neither a marked peak at 60°, 78°, 79° or/and 104° misorientation in one of the misorientation diagrams, nor an often-occurring, calcite twin-related, misorientation angle, nor the frequent presence of a twin-related, crystallographic axis (Figures S10 and S11).
In essence, we examined in great detail calcite and aragonite crystal twin generation for the different shell microstructures of the investigated ostreoid species. For none of the calcite structures did we find any twin formation, only for myostracal aragonite. Crystal twin formation is widely observed for biological aragonites, e.g., for bivalves, gastropods, otoliths, corals [77,78], for bivalve columnar [77,79] and sheeted [77,78,80] nacre, for bivalve complex and crossed-lamellar aragonite [43,58,59,78,79,81] and for bivalve myostracal aragonite [43,82]. In contrast, disregarding the calcite of rotaliid foraminifera shells [72,74], crystal twin formation is absent in biologically secreted calcite. For the latter, we still need to find the reason.

5. Conclusions

When regarded from a structural perspective, the modern oyster shell is particular and outstanding among the shells of many other bivalves, as the oyster generates its shell with a wide range of crystal morphologies, microstructures and textures.
The following questions led to the present study: Is there a similar diversity in ostreoid calcite crystal texture as observed for the microstructures? How is the arrangement of calcite crystallographic axes at the transition from one microstructure crystal texture to the other? Do we find continuity or/and discontinuity in crystallographic axes of the calcite for adjacent shell microstructures? How are convex and concave surfaces generated with the crystals that Ostreoidea secrete for shell formation?
Our crystallographic-structural analysis gives some answers to the questions above:
  • The diversity in Ostreoidea shell crystal morphology is extensive. The microstructures that are formed out of these crystals are numerous. The crystal textures that are generated by the microstructures are large in number.
  • It is most interesting that the same ostreoid organism secretes crystals with many morphologies and generates many microstructures and textures for shell formation. As ostreoid organisms are, in general, short lived, this structural diversity in crystal formation is secreted in a short time period.
  • The calcite of the individual crystals (the laths of a folium, the laths and blades of the chalk, rhombohedra, dendrites, granules) is very co-oriented. It is single crystalline or is very close to being single crystalline. In contrast, when these crystals form a crystal unit, the assembly of the crystal units in the shell layer is very little co-oriented. The assembly of crystal units for some microstructures is close to being random.
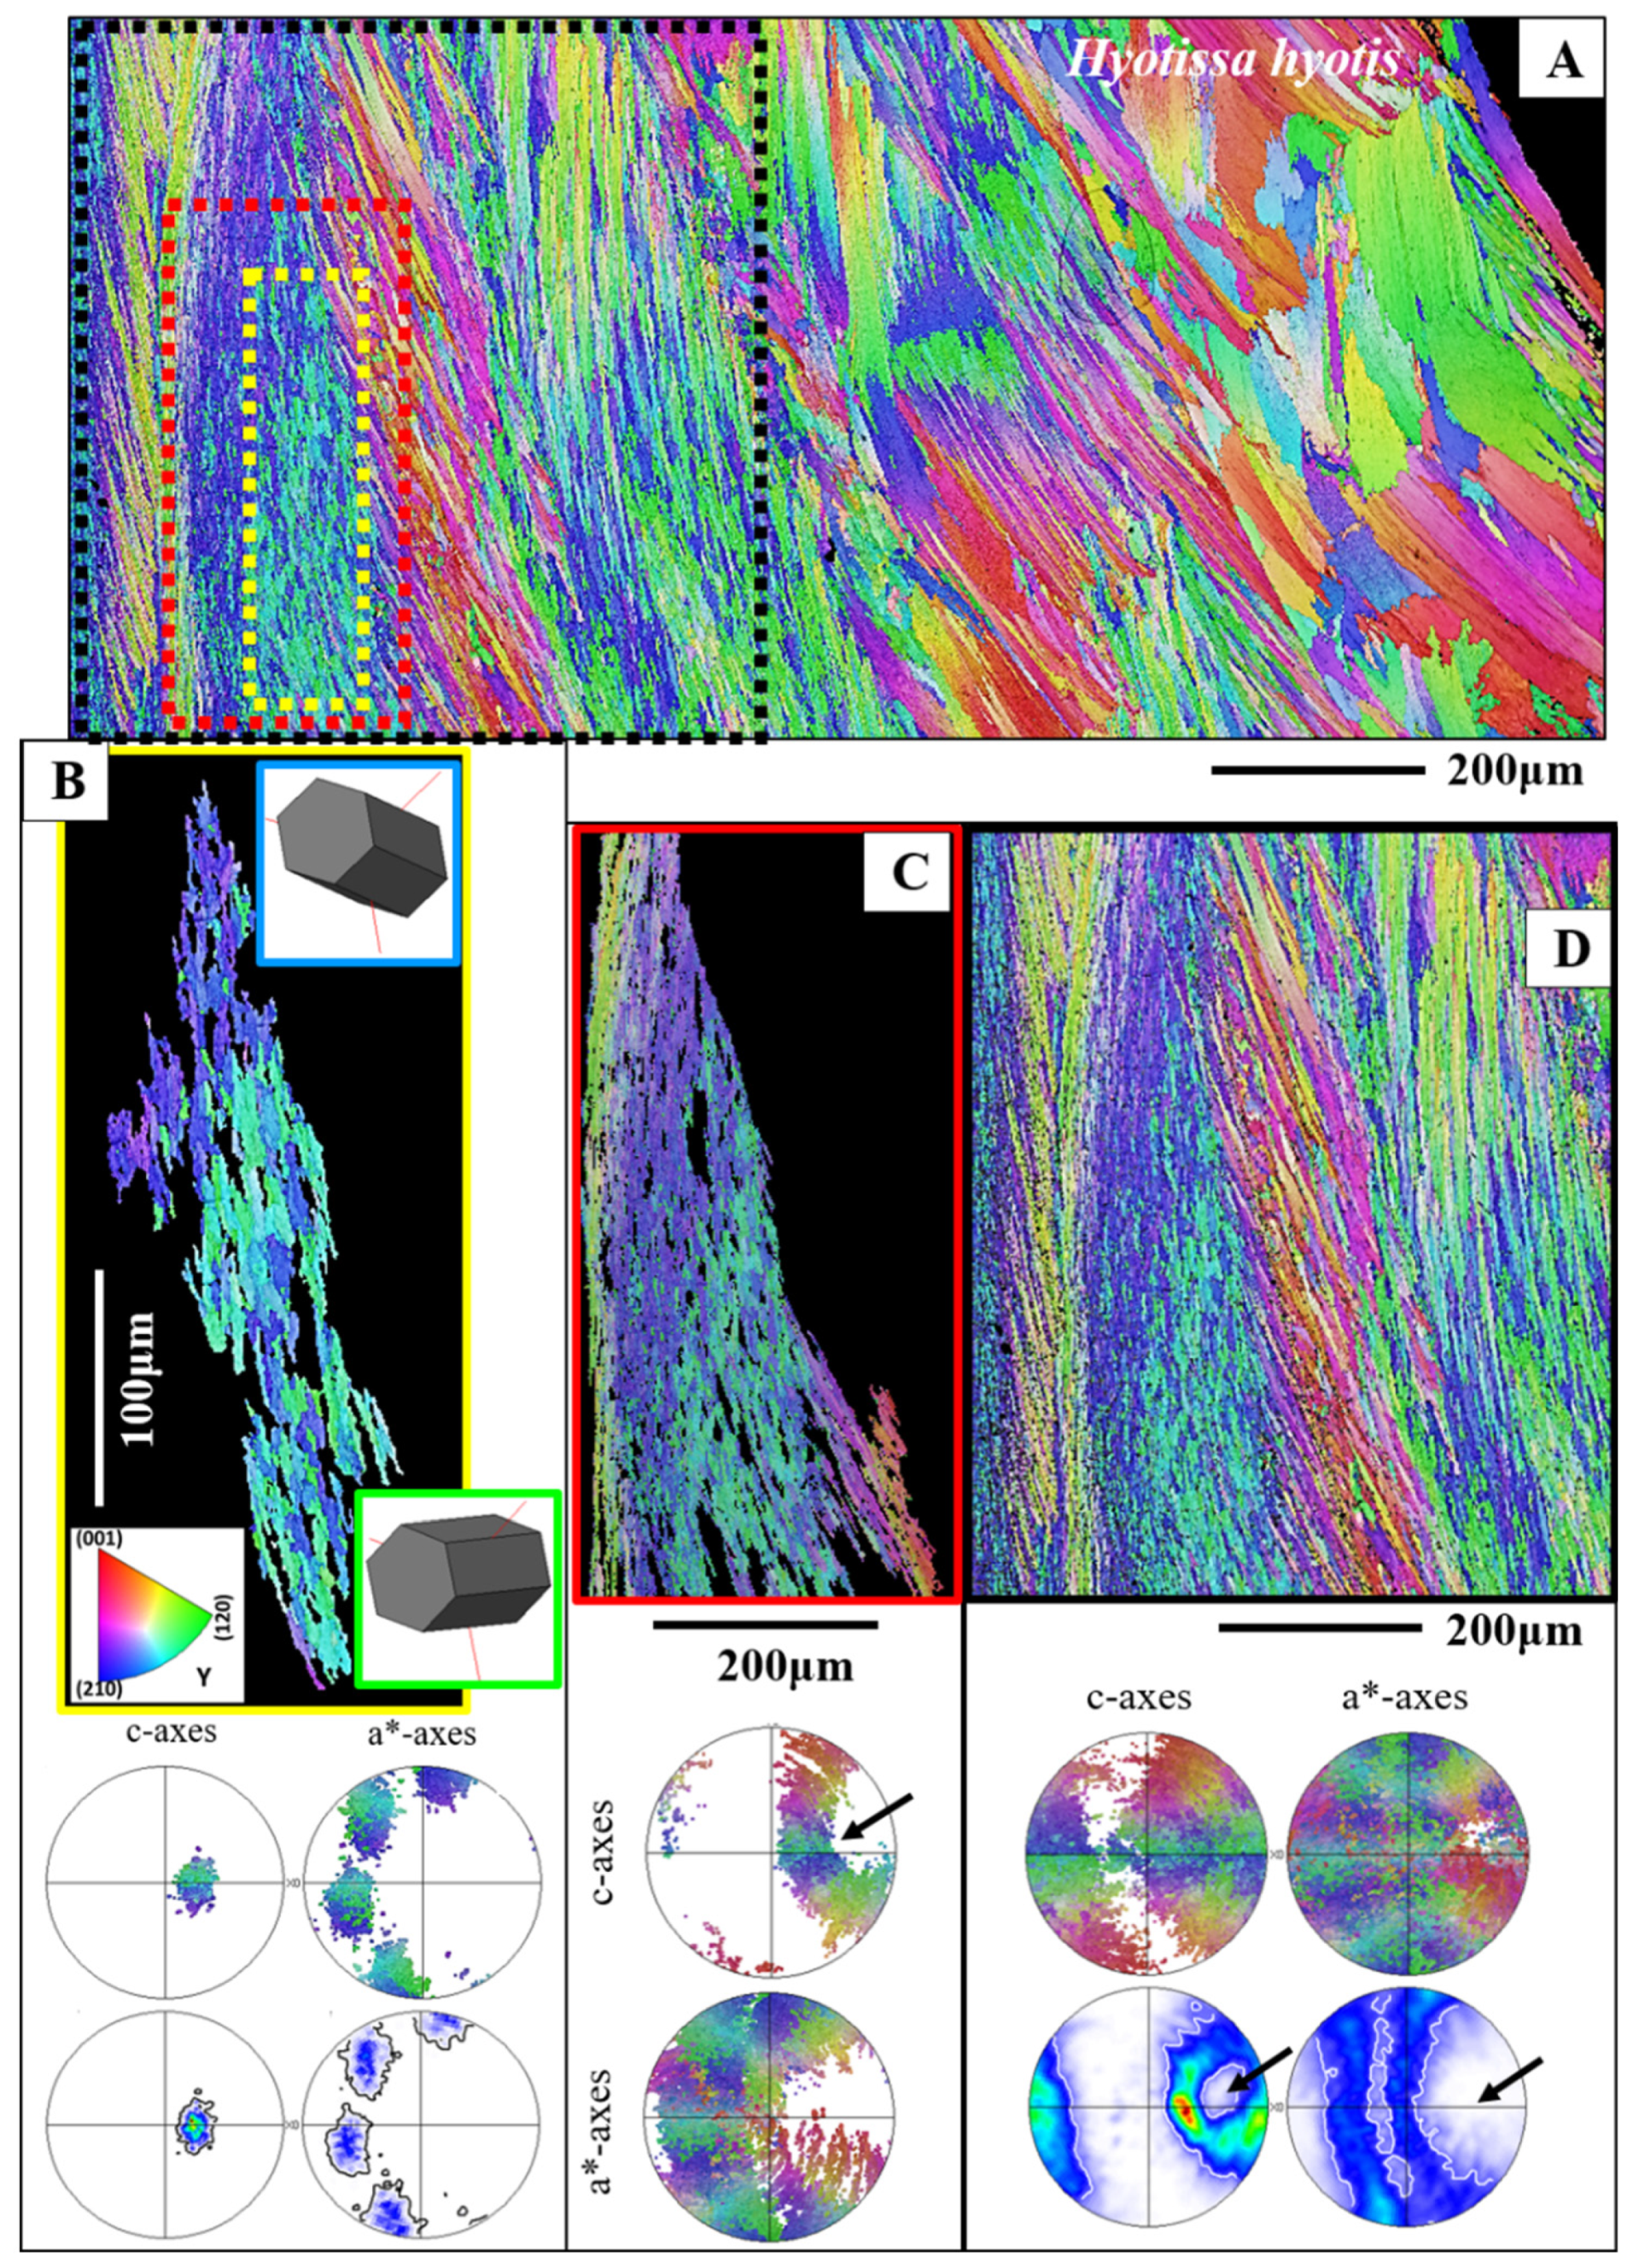
  • The foliated microstructure and the foliated texture are very specific. Both are rooted in the nature and mode of assembly on different hierarchical levels of the foliated crystal morphology, the lath-shaped arrow-headed crystals. The foliated assembly of these crystals evokes gradedness in c- and a*-axes orientation distribution and formation of a ring-shaped c- and a*-axes orientation distribution for the foliated texture. In addition, the arrowhead ending of the foliated crystals and their orientation, relative to inner shell surface, results in the fact that the foliated texture axis is not the calcite c-axis.
  • The structure of the shell layer that hosts the vesicular pores of the Gryphaeidae is very particular. This shell layer is formed by fractal-shaped dendrites. These interlink strongly in 3D, generate a compact layer of calcite and host a multitude of pores.
  • Twinned crystals were only observed for myostracal aragonite. There is no twin-related changeover between adjacent calcitic shell layers nor between adjacent calcite columns.
  • We did not observe any clear-cut co-orientation of crystallographic axes for the crystals between adjacent shell layers.
  • The rounded shape of inner shell surfaces is generated in both the Ostreidae and the Gryphaeidae by forming a little co-oriented assembly of small, foliated units along the innermost shell surface. The size of the foliated units increases gradually, away from the inner shell surface.

Supplementary Materials

The following supporting information can be downloaded at: https://www.mdpi.com/article/10.3390/cryst15030286/s1, Figure S1. Assembly of columns that seam distal valve surfaces. We find a decrease in column size towards outermost valve portions (bottom of images) (A, B), a vaguely developed axial texture, low crystal co-orientation strength (D) and a wide range in misorientation angle (C). A to D: Magallana gigas. Figure S2. BSE micrographs visualizing the internal structure of Magallana gigas columns. Figure S3. A: Enlargement of EBSD band contrast measurement image shown in Figure 3E. B,C: Enlargement of crystal orientation measurement and SEM image shown in Figure 3F. Note the strong internal structuring of the columns into subunits/domains (white stars in (B)). The latter have very irregular morphologies and sizes (A, B). However, calcite crystallites within the subunits are platy, resemble flakes (C) and do not show the typical morphology of folia. A to C: Magallana gigas. Figure S4. The texture pattern of assemblies of large and small foliated units (A to C) and the texture of an individual small foliated unit (D). We observe for all foliated units, small or large, the same texture pattern, namely, formation of c- and a*-axes orientation rings in the corresponding pole figures. The outline of the c- and a*-axes orientation rings is very irregular for small foliated units (C), due to their high abundance and almost random orientation organization (MUD of 5 (C)). We find also formation of c- and a*-axes rings for an individual small foliated unit. Figure S5. A: EBSD crystal orientation map of an assembly of foliated crystals for the shell of Hyotissa hyotis, visualizing their size, internal structure and interlinkage. B to D: Individual foliated units selected from different parts of the foliated shell (indicated with a red, yellow or white star in the EBSD map in (A)). The organization of crystallographic c- and a*-axes of/in the foliated units is indicated with sketched crystals and corresponding misorientation angle–distance diagrams. These show misorientation between crystallites along trajectories a to b and c to d (B to D). We give (i) the cumulative misorientation angle, the increase in misorientation angle, relative to the first point on the trajectory, and (ii) the misorientation angle from point to point along the trajectory, thus the local misorientation angle, misorientation between adjacent crystals. For the foliated units shown in (B) and (C), we observe a gradual rotation of crystallographic c- and a*-axes orientation, in both directions, along the length as well as perpendicular to the length of the foliated unit; see sketched crystals in (B) and (C). The result is that we find a gradual increase in misorientation angle relative to the first point on the trajectory and a very low degree of misorientation from point to point (B, C). The crystals in (B) and (C) are small foliated units, while the crystal shown in (D) is a large foliated unit. For the latter crystal (D), we do not find, for the crystal portion that is scanned with EBSD, such a clear-cut gradual rotation in crystallographic axes orientation, but rather, for adjacent crystallites (possibly folia), an abrupt tilt between two crystallographic axes orientations (see the sketched crystals in (D)). This is also observable from the misorientation angle-distance diagrams (E). Even though an increase in the degree of misorientation angle, relative to the first point on the trajectory, is still present in the misorientation angle–distance diagrams (D), the gradual increase in cumulative misorientation angle, with distance away from the first point on the trajectory, is not as smooth as it is for the foliated units shown in (B) and (C). In addition, we find, for the crystal in (D), a large degree of misorientation from crystallite to crystallite, from folium to folium. Note as well that the degree of misorientation relative to the first point, as well as from point to point, is different for the crystals given in (B), (C), (D), thus, different for the different parts of the foliated shell. The degree of misorientation between adjacent crystallites increases significantly with distance away from the inner shell surface. Figure S6. The meshwork of chalk blades and laths within the foliated layers (A to D) as well as adjacent to the foliated layers at outer shell sections (E). The microstructure of the chalk is structured, e.g., by struts, traversing the chalk lenses (C, D). E: A chalk-type microstructure at outer shell layers (white stars in E), developed with an axial texture (pole figure for the chalk in E), a slightly increased crystal co-orientation strength (MUD value for the chalk in E) and the typical relative frequency–misorientation angle pattern that is also observed for the chalky microstructure of the chalk lenses within the foliated shell. This is the first report of a chalk-type microstructure at outer shell layers. A, B: SE micrographs highlighting the meshwork of the chalk and the changeover from the folia to the meshwork of the chalk blades and laths. C, D: EBSD band contrast measurement and crystal orientation map highlighting the slightly structured nature of the chalk. E: SE micrographs of an outer shell portion; the white stars indicate the position of the EBSD map shown in (F). F: For crystal orientation color-coded EBSD map, corresponding pole figures and misorientation angle diagrams of a shell segment, located at outermost shell surface, of an assembly of folia and the adjacent conglomeration of chalk blades and laths. Figure S7. The structural and crystallographic relationship between foliated calcite, the blades/laths of the chalk and the calcite at the changeover from the foliated to the chalk microstructure (Magallana gigas). A to C: EBSD map showing crystal orientation and, with the corresponding pole figures, the microstructure-related textures. A to C give subsets of the EBSD measurements given in Figure 9C. Figure S8. The strongly fractal shape of gryphaeid calcite dendrites generating a dense shell layer that hosts the many vesicular pores. These can be small- as well as very large-sized. Figure S9. Enlargement of the relative frequency–misorientation angle diagrams shown in Figure 12. Framed in blue are misorientation angle diagrams for only the folia; framed in red are misorientation angle diagrams for the folia and the adjacent, directly touching, chalk blades. We do not observe a marked peak at 60°, 78.1, 78.8°, 104° misorientation. This demonstrates the absence of a calcite twin operation-related structural change from the foliated into the chalk microstructure. A to F: Magallana gigas. Figure S10. Lack of a calcite twin-related crystallographic relationship between adjacent columns (A) for the columnar layer of Magallana gigas. We demonstrate this with relative frequency-misorientation angle (B) and misorientation angle-distance diagrams (C). Misorientation data in (B) and (C) are shown for those columns that are highlighted in color in (A); the color of these columns codes for crystal orientation. The location of the used trajectory and its length is indicated with a black arrow in (A, C). We do not observe a twin relationship between the columns as, according to the 4 twin laws of calcite, we would need to see a marked peak at either 60°, 78.1°, 78.8° or 104° misorientation in the misorientation angle diagram or a misorientation of either 60°, 78°, 79° or 104° between adjacent columns in the misorientation angle–distance diagram. Figure S11. Lack of a twin relationship between adjacent Magallana gigas columns. A: EBSD band contrast measurement of a large section of columns showing the trajectories of line profiles a to b and their numeration. We checked the degree of misorientation (misorientation angle) (B) and crystallographic orientation of the corresponding misorientation axis (C) for 67 trajectories (A). B: Table highlighting the frequency of a particular misorientation angle; e.g., the misorientation angle of 60° was detected for the 67 trajectories three times (B). C: Frequency of the different misorientation axes that were detected for the 67 trajectories. The misorientation axes are characterized with their crystallographic indices, e.g., the <001> axis was not detected (C). Accordingly, there is no crystal twin-related relationship between adjacent Ostreoidea columns, nor between adjacent calcite crystallites that comprise individual columns.

Author Contributions

A.S.V. wrote the manuscript and evaluated the EBSD data; E.G. performed EBSD measurements and evaluated the EBSD data; A.G.C. discussed the EBSD data and wrote the manuscript; W.W.S. discussed the EBSD data and wrote the manuscript; C.S. and E.M.H. discussed EBSD data and helped with writing the manuscript. All authors have read and agreed to the published version of the manuscript.

Funding

W.W.S., E.G. and A.S.V. were funded by the German Research Council Programs GR 9/1234, SCHM 930/11-2. A.G.C. and C.S.C. were funded by projects PID2020-116660GB-I00 and PID2023-146394NB-I00 (Spanish Ministry of Science and Innovation: MCIN/AEI/10.13039/501100011033/). A.G.C. also acknowledges the Unidad Científica de Excelencia UCE-PP2016-05 (University of Granada) and the Research Group RNM363 (Junta de Andalucía).

Data Availability Statement

The raw data supporting the conclusions of this article will be made available by the authors on request.

Acknowledgments

We thank Sebastian Hoerl for evaluating many EBSD data sets also with AZTec Crystal and for his comments to the manuscript. We thank Lisa Kreitmeier for the preparation of some Ostreoidea samples.

Conflicts of Interest

The authors declare no conflicts of interest.

References

  1. Stenzel, H.B. Systematic Descriptions. In Treatise on Invertebrate Paleontology: Part N Mollusca 6: Bivalvia: Oysters; Moore, R.C., Ed.; The Geological Society of America: Boulder, CO, USA, 1971; Volume 3, pp. 1096–1172. ISBN 0-8137-3026-0. [Google Scholar]
  2. Márquez-Aliaga, A.; Jiménez-Jiménez, A.P.; Checa, A.G.; Hagdorn, H. Early Oysters and Their Supposed Permian Ancestors. Palaeogeogr. Palaeoclimatol. Palaeoecol. 2005, 229, 127–136. [Google Scholar] [CrossRef]
  3. Mouchi, V.; Andrus, C.F.T.; Checa, A.G.; Elliot, M.; Griesshaber, E.; Hausmann, N.; Huyghe, D.; Lartaud, F.; Peharda, M.; de Winter, N.J. Oyster Shells as Archives of Present and Past Environmental Variability and Life History Traits: A Multi-Disciplinary Review of Sclerochronology Methods and Applications. Limnol. Oceanogr. Lett. 2025. [Google Scholar] [CrossRef]
  4. Yonge, C.M. Oysters; Collins: New York, NY, USA, 1960. [Google Scholar]
  5. Bricteux-Gregoire, S.; Duchateau-Bosson, G.; Jeuniaux, C.; Florkin, M. Constituants Osmotiquement Actifs des Muscles Adducteurs d’Ostrea edulis Adaptée a L’eau de Mer Ou a L’eau Saumatre. Arch. Int. Physiol. Biochim. 1964, 72, 267–275. [Google Scholar] [CrossRef] [PubMed]
  6. Van Rooij, D.; De Mol, L.; Le Guilloux, E.; Wisshak, M.; Huvenne VA, I.; Moeremans, R.; Henriet, J.P. Environmental Setting of Deep-Water Oysters in the Bay of Biscay. Deep Sea Res. 2010, 57, 1561–1572. [Google Scholar] [CrossRef]
  7. Checa, A.G.; Linares, F.; Maldonado-Valderrama, J.; Harper, E.M. Foamy Oysters: Vesicular Microstructure Production in the Gryphaeidae via Emulsification. J. R. Soc. Interface 2020, 17, 20200505. [Google Scholar] [CrossRef]
  8. Liu, J.; Li, Q.; Kong, L.; Yu, H.; Zheng, X. Identifying the True Oysters (Bivalvia: Ostreidae) with Mitochondrial Phylogeny and Distance-Based DNA Barcoding. Mol. Ecol. Resour. 2011, 11, 820–830. [Google Scholar] [CrossRef] [PubMed]
  9. Bai, Y.; Liu, S.; Hu, Y.; Yu, H.; Kong, L.; Xu, C.; Li, Q. Multi-Omic Insights into the Formation and Evolution of a Novel Shell Microstructure in Oysters. BMC Biol. 2023, 21, 204. [Google Scholar] [CrossRef]
  10. Nakahara, H.; Bevelander, G. The Formation and Growth of the Prismatic Layer of Pinctada radiata. Calcif Tissue Res. 1971, 7, 31–45. [Google Scholar] [CrossRef]
  11. MacDonald, J.; Freer, A.; Cusack, M. Alignment of Crystallographic C-Axis throughout the Four Distinct Microstructural Layers of the Oyster Crassostrea gigas. Cryst. Growth Des. 2010, 10, 1243–1246. [Google Scholar] [CrossRef]
  12. Checa, A.G.; Macías-Sánchez, E.; Harper, E.M.; Cartwright, J.H.E. Organic Membranes Determine the Pattern of the Columnar Prismatic Layer of Mollusc Shells. Proc. R Soc. B 2016, 283, 20160032. [Google Scholar] [CrossRef]
  13. Dauphin, Y.; Ball, A.D.; Castillo-Michel, H.; Chevallard, C.; Cuif, J.-P.; Farre, B.; Pouvreau, S.; Salomé, M. In Situ Distribution and Characterization of the Organic Content of the Oyster Shell Crassostrea gigas (Mollusca, Bivalvia). Micron 2013, 44, 373–383. [Google Scholar] [CrossRef] [PubMed]
  14. Sancho Vaquer, A.; Checa, A.G.; Griesshaber, E.; Fernández-Díaz, L.; Salas, C.; Schmahl, W.W. Layers Formed of Rhombohedral Calcite and Biopolymers in Oyster Shells. Crystals 2025, submitted. [Google Scholar]
  15. Taylor, J.D.; Kennedy, W.J.; Hall, A. The Shell Structure and Mineralogy of the Bivalvia Introduction. Nuculacea—Trigonacea. Bull Br. Mus. Nat. Hist. Zool. Suppl. 1969, 1–125. [Google Scholar] [CrossRef]
  16. Carriker, M.R.; Swann, C.P.; Prezant, R.S.; Counts, C.L. Chemical Elements in the Aragonitic and Calcitic Microstructural Groups of Shell of the Oyster Crassostrea virginica: A Proton Probe Study. Mar. Biol. 1991, 109, 287–297. [Google Scholar] [CrossRef]
  17. Dungan, C.F. Aragonite-Fiber Calcification of the Hinge Ligament Mechanical Antagonist to Valve Adduction in Oysters. J. Shellfish. Res. 2008, 27, 1004–1005. [Google Scholar]
  18. Carriker, M.R.; Palmer, R.E.; Prezant, R. Functional Ultramorphology of the Dissoconch Valves of the Oyster Crassostrea virginica. J. Shellfish Res. 1981, 70, 139–183. [Google Scholar]
  19. Mouchi, V.; Lartaud, F.; Guichard, N.; Immel, F.; de Rafélis, M.; Broussard, C.; Crowley, Q.G.; Marin, F. Chalky versus Foliated: A Discriminant Immunogold Labelling of Shell Microstructures in the Edible Oyster Crassostrea gigas. Mar. Biol. 2016, 163, 256. [Google Scholar] [CrossRef]
  20. Runnegar, B. Crystallography of the Foliated Calcite Shell Layers of Bivalve Molluscs. Alcheringa 1984, 8, 273–290. [Google Scholar] [CrossRef]
  21. Checa, A.G.; Esteban-Delgado, F.J.; Rodríguez-Navarro, A.B. Crystallographic Structure of the Foliated Calcite of Bivalves. J. Struct. Biol. 2007, 157, 393–402. [Google Scholar] [CrossRef]
  22. Checa, A.G.; Harper, E.M.; González-Segura, A. Structure and Crystallography of Foliated and Chalk Shell Microstructures of the Oyster Magallana: The Same Materials Grown under Different Conditions. Sci. Rep. 2018, 8, 7507. [Google Scholar] [CrossRef]
  23. Esteban-Delgado, F.J.; Harper, E.M.; Checa, A.G.; Rodríguez-Navarro, A.B. Origin and Expansion of Foliated Microstructure in Pteriomorph Bivalves. Biol. Bull. 2008, 214, 153–165. [Google Scholar] [CrossRef]
  24. Checa, A.G.; Esteban-Delgado, F.J.; Ramírez-Rico, J.; Rodríguez-Navarro, A.B. Crystallographic Reorganization of the Calcitic Prismatic Layer of Oysters. J. Struct. Biol. 2009, 167, 261–270. [Google Scholar] [CrossRef] [PubMed]
  25. Harper, E.M. Post-Larval Cementation in the Ostreidae and Its Implications for Other Cementing Bivalvia. J. Molluscan Stud. 1992, 58, 37–47. [Google Scholar] [CrossRef]
  26. Harper, E.M. Attachment of Mature Oysters (Saccostrea cucullata) to Natural Substrata. Mar. Biol. 1997, 127, 449–453. [Google Scholar] [CrossRef]
  27. MacDonald, J.; Freer, A.; Cusack, M. Attachment of Oysters to Natural Substrata by Biologically Induced Marine Carbonate Cement. Mar. Biol. 2010, 157, 2087–2095. [Google Scholar] [CrossRef]
  28. Checa, A.G. Physical and Biological Determinants of the Fabrication of Molluscan Shell Microstructures. Front. Mar. Sci. 2018, 5, 353. [Google Scholar] [CrossRef]
  29. Banker, R.M.W.; Sumner, D.Y. Structure and Distribution of Chalky Deposits in the Pacific Oyster Using X-Ray Computed Tomography (CT). Sci. Rep. 2020, 10, 12118. [Google Scholar] [CrossRef]
  30. Hedegaard, C.; Wenk, H.-R. Microstructure and Texture Patterns of Mollusc Shells. J. Molluscan Stud. 1998, 64, 133–136. [Google Scholar] [CrossRef]
  31. Griesshaber, E.; Yin, X.; Ziegler, A.; Kelm, K.; Checa, A.; Eisenhauer, A.; Schmahl, W.W. Patterns of Mineral Organization in Carbonate Biological Hard Materials. In Highlights in Applied Mineralogy; Heuss-Aßbichler, S., Amthauer, G., John, M., Eds.; De Gruyter: Berlin, Germany; Boston, MA, USA, 2017; pp. 245–272. ISBN 978-3-11-049734-2. [Google Scholar]
  32. Chateigner, D.; Hedegaard, C.; Wenk, H.-R. Mollusc Shell Microstructures and Crystallographic Textures. J. Struct. Geol. 2000, 22, 1723–1735. [Google Scholar] [CrossRef]
  33. Bieler, R.; Mikkelsen, P.M.; Collins, T.M.; Glover, E.A.; González, V.L.; Graf, D.L.; Harper, E.M.; Healy, J.; Kawauchi, G.Y.; Sharma, P.P.; et al. Investigating the Bivalve Tree of Life—An Exemplar-Based Approach Combining Molecular and Novel Morphological Characters. Invertebr. Syst. 2014, 28, 32–115. [Google Scholar] [CrossRef]
  34. Hull, D.; Bacon, D.J. Introduction to Dislocations, 5th ed.; Butterworth-Heinemann: Oxford, UK, 2011; ISBN 978-0-08-096672-4. [Google Scholar]
  35. Seto, J.; Ma, Y.; Davis, S.A.; Meldrum, F.; Gourrier, A.; Kim, Y.Y.; Schilde, U.; Sztucki, M.; Burghammer, M.; Maltsev, S.; et al. Structure-Property Relationships of a Biological Mesocrystal in the Adult Sea Urchin Spine. Proc. Natl. Acad. Sci. USA 2012, 109, 3699–3704. [Google Scholar] [CrossRef]
  36. Bergstrom, L.; Sturm, E.V.; Salazar-Alvarez, G.; Cölfen, H. Mesocrystals in Biominerals and Colloidal Arrays. Acc. Chem. Res. 2015, 48, 1391–1402. [Google Scholar] [CrossRef]
  37. Ma, M.-G.; Cölfen, H. Mesocrystals—Applications and Potential. Curr. Opin. Colloid Interface Sci. 2014, 19, 56–65. [Google Scholar] [CrossRef]
  38. Mackenzie, J.K. Second Paper on Statistics Associated with the Random Disorientation of Cubes. Biometrika 1958, 45, 229–240. [Google Scholar] [CrossRef]
  39. Yin, X.; Griesshaber, E.; Fernández-Díaz, L.; Ziegler, A.; García-García, F.J.; Schmahl, W.W. Influence of Gelatin–Agarose Composites and Mg on Hydrogel-Carbonate Aggregate Formation and Architecture. Cryst. Growth Des. 2019, 19, 5696–5715. [Google Scholar] [CrossRef]
  40. Yin, X.; Weitzel, F.; Griesshaber, E.; Fernández-Díaz, L.; Jiménez-López, C.; Ziegler, A.; Rodríguez-Navarro, A.B.; Schmahl, W.W. Bacterial EPS in Agarose Hydrogels Directs Mineral Organization in Calcite Precipitates: Species-Specific Biosignatures of Bacillus subtilis, Mycobacterium phley, Mycobacterium smagmatis, and Pseudomonas putida EPS. Cryst. Growth Des. 2020, 20, 4402–4417. [Google Scholar] [CrossRef]
  41. Gao, H.; Ji, B.; Jäger, I.L.; Arzt, E.; Fratzl, P. Materials Become Insensitive to Flaws at Nanoscale: Lessons from Nature. Proc. Natl. Acad. Sci. USA 2003, 100, 5597–5600. [Google Scholar] [CrossRef]
  42. Hoerl, S.; Le Moine, T.; Peter, N.J.; Amini, S.; Griesshaber, E.; Wang, J.; Harper, E.M.; Salas, C.; Checa, A.G.; Schwaiger, R.; et al. Crystal Organisation and Material Properties of Chama and Glycymeris Myostraca and Shells. Materialia 2024, 36, 102149. [Google Scholar] [CrossRef]
  43. Hoerl, S.; Griesshaber, E.; Checa, A.G.; Schmahl, W.W. The Biological Crystals in Chamid Bivalve Shells: Diversity in Morphology and Crystal Arrangement Pattern. Crystals 2024, 14, 649. [Google Scholar] [CrossRef]
  44. Gim, J.; Schnitzer, N.; Otter, L.M.; Cui, Y.; Motreuil, S.; Marin, F.; Wolf, S.E.; Jacob, D.E.; Misra, A.; Hovden, R. Nanoscale Deformation Mechanics Reveal Resilience in Nacre of Pinna nobilis Shell. Nat. Commun. 2019, 10, 4822. [Google Scholar] [CrossRef]
  45. Wegst, U.G.K.; Bai, H.; Saiz, E.; Tomsia, A.P.; Ritchie, R.O. Bioinspired Structural Materials. Nat. Mater. 2015, 14, 23–36. [Google Scholar] [CrossRef]
  46. Lu, K. Stabilizing Nanostructures in Metals Using Grain and Twin Boundary Architectures. Nat. Rev. Mater. 2016, 1, 1–13. [Google Scholar] [CrossRef]
  47. Sun, J.; Bhushan, B. Hierarchical Structure and Mechanical Properties of Nacre: A Review. RSC Adv. 2012, 2, 7617–7632. [Google Scholar] [CrossRef]
  48. Harper, E.M.; Checa, A.G. Tightly Shut: Flexible Valve Margins and Microstructural Asymmetry in Pterioid Bivalves. Mar Biol 2020, 167, 78. [Google Scholar] [CrossRef]
  49. Carriker, M.R. The Shell and Ligament. In The Eastern Oyster: Crassostrea virginica; Kennedy, V.S., Newell, R.I.E., Eble, A.F., Eds.; Maryland Sea Grant College: College Park, MD, USA, 1996; pp. 1–8. [Google Scholar]
  50. Carter, J.G. Chapter 10. Evolutionary Significance of Shell Microstructure in the Palaeotaxodonta, Pteriomorphia and Isofilibranchia (Bivalvia: Mollusca). In Skeletal Biomineralization, Patterns, Processes and Evolutionary Trends; Carter, J.G., Ed.; Van Nostrand Reinhold: New York, NY, USA, 1990; Volume 1, pp. 135–296. [Google Scholar]
  51. Griesshaber, E.; Sancho Vaquer, A.; Checa, A.G.; Salas, C.; Harper, E.M.; Schmahl, W.W. The Textural Motif of Foliated Calcite in Ostreoidea (Mollusca). Crystals 2025, 15, 244. [Google Scholar] [CrossRef]
  52. Grenier, C.; Griesshaber, E.; Schmahl, W.; Berning, B.; Checa, A.G. Skeletal Microstructures of Cheilostome Bryozoans (Phylum Bryozoa, Class Gymnolaemata): Crystallography and Secretion Patterns. Mar. Life Sci. Technol. 2024, 6, 405–424. [Google Scholar] [CrossRef] [PubMed]
  53. Grenier, C.; Griesshaber, E.; Schmahl, W.W.; Checa, A.G. Microstructure and Crystallographic Characteristics of Stenolaemate Bryozoans (Phylum Bryozoa and Class Stenolaemata). Cryst Growth Des 2023, 23, 965–979. [Google Scholar] [CrossRef]
  54. Aylmore, L.a.G.; Quirk, J.P. Swelling of Clay–Water Systems. Nature 1959, 183, 1752–1753. [Google Scholar] [CrossRef]
  55. Lutterotti, L. Total Pattern Fitting for the Combined Size–Strain–Stress–Texture Determination in Thin Film Diffraction. Nucl. Instrum. Methods Phys. Res. Sect. B Beam Interact. Mater. At. 2010, 268, 334–340. [Google Scholar] [CrossRef]
  56. Yamaguchi, K. Shell Structure and Behaviour Related to Cementation in Oysters. Mar. Biol. 1994, 118, 89–100. [Google Scholar] [CrossRef]
  57. Simonet Roda, M.; Griesshaber, E.; Angiolini, L.; Rollion-Bard, C.; Harper, E.M.; Bitner, M.A.; Milner Garcia, S.; Ye, F.; Henkel, D.; Häussermann, V.; et al. The Architecture of Recent Brachiopod Shells: Diversity of Biocrystal and Biopolymer Assemblages in Rhynchonellide, Terebratulide, Thecideide and Craniide Shells. Mar. Biol. 2021, 169, 4. [Google Scholar] [CrossRef]
  58. Casella, L.A.; He, S.; Griesshaber, E.; Fernández-Díaz, L.; Greiner, M.; Harper, E.M.; Jackson, D.J.; Ziegler, A.; Mavromatis, V.; Dietzel, M.; et al. Hydrothermal Alteration of Aragonitic Biocarbonates: Assessment of Micro- and Nanostructural Dissolution–Reprecipitation and Constraints of Diagenetic Overprint from Quantitative Statistical Grain-Area Analysis. Biogeosciences 2018, 15, 7451–7484. [Google Scholar] [CrossRef]
  59. Almagro, I.; Drzymała, P.; Berent, K.; Sainz-Díaz, C.I.; Willinger, M.G.; Bonarski, J.; Checa, A.G. New Crystallographic Relationships in Biogenic Aragonite: The Crossed-Lamellar Microstructures of Mollusks. Cryst. Growth Des. 2016, 16, 2083–2093. [Google Scholar]
  60. Carriker, M.R.; Palmer, R.E.; Sick, L.V.; Johnson, C.C. Interaction of Mineral Elements in Sea Water and Shell of Oysters (Crassostrea virginica (Gmelin)) Cultured in Controlled and Natural Systems. J. Exp. Mar. Biol. Ecol. 1980, 46, 279–296. [Google Scholar] [CrossRef]
  61. Higuera-Ruiz, R.; Elorza, J. Biometric, Microstructural, and High-Resolution Trace Element Studies in Crassostrea gigas of Cantabria (Bay of Biscay, Spain): Anthropogenic and Seasonal Influences. Estuar. Coast. Shelf Sci. 2009, 82, 201–213. [Google Scholar] [CrossRef]
  62. Korringa, P. On the Nature and Function of “Chalky” Deposits in the Shell of Ostrea edulis Linnaeus. In Proceedings of the California Academy of Sciences, San Francisco, CA, USA, 1 May–31 August 1951; 4th Series. Creative Media Partners, LLC: Sacramento, CA, USA, 1951; Volume 27, pp. 133–158. [Google Scholar]
  63. Pelseneer, P. Hermaphrodite Oysters. Nature 1929, 124, 14. [Google Scholar] [CrossRef]
  64. Ranson, G. Les Espèces Actuelles et Fossils Du Genre Pycnodonta F. de W.: 1. Pycnodonta hyotis (L.). Bull. Mus. Natl. Hist. Nat. Paris 1941, 13, 82–92. [Google Scholar]
  65. Galtsoff, P.S. The American Oyster, Crassostrea virginica (Gmelin). Chesap. Sci. 1965, 6, 199. [Google Scholar] [CrossRef]
  66. Margolis, S.V.; Carver, R.E. Microsculpture of Chalky Deposits Found in Shells of the Oyster Crassostrea virginica. Nautilus 1974, 88, 62–65. [Google Scholar]
  67. Ullmann, C.V.; Böhm, F.; Rickaby, R.E.M.; Wiechert, U.; Korte, C. The Giant Pacific Oyster (Crassostrea gigas) as a Modern Analog for Fossil Ostreoids: Isotopic (Ca, O, C) and Elemental (Mg/Ca, Sr/Ca, Mn/Ca) Proxies. Geochem. Geophys. Geosystems 2013, 14, 4109–4120. [Google Scholar] [CrossRef]
  68. de Winter, N.J.; Daemmer, L.K.; Falkenroth, M.; Reichart, G.-J.; Moretti, S.; Martinez-Garcia, A.; Hoeche, N.; Schoene, B.R.; Rodiouchkina, K.; Goderis, S.; et al. Multi-Isotopic and Trace Element Evidence against Different Formation Pathways for Oyster Microstructures. Geochim. Cosmochim. ACTA 2021, 308, 326–352. [Google Scholar] [CrossRef]
  69. Simonet Roda, M.; Griesshaber, E.; Angiolini, L.; Harper, D.A.T.; Jansen, U.; Bitner, M.A.; Henkel, D.; Manzanero, E.; Müller, T.; Tomašových, A.; et al. The Evolution of Thecideide Microstructures and Textures: Traced from Triassic to Holocene. Lethaia 2021, 54, 558–577. [Google Scholar] [CrossRef]
  70. Hahn, T.; Klapper, H. Twinning of Crystals. In International Tables for Crystallography, Online MRW; John Wiley & Sons, Ltd.: Hoboken, NJ, USA, 2006; pp. 393–448. ISBN 978-0-470-68575-4. [Google Scholar]
  71. Richards, R.P. The Four Twin Laws of Calcite and How to Recognize Them. Rocks Miner. 1999, 75, 308–317. [Google Scholar] [CrossRef]
  72. Yin, X.; Griesshaber, E.; Checa, A.G.; Nindiyasari-Behal, F.; Sánchez-Almazo, I.; Ziegler, A.; Schmahl, W.W. Calcite Crystal Orientation Patterns in the Bilayers of Laminated Shells of Benthic Rotaliid Foraminifera. J. Struct. Biol. 2021, 231, 107707. [Google Scholar] [CrossRef]
  73. Lastam, J.; Griesshaber, E.; Yin, X.; Rupp, U.; Sánchez-Almazo, I.; Heß, M.; Walther, P.; Checa, A.; Schmahl, W.W. Patterns of Crystal Organization and Calcite Twin Formation in Planktonic, Rotaliid, Foraminifera Shells and Spines. J. Struct. Biol. 2022, 215, 107898. [Google Scholar] [CrossRef]
  74. Lastam, J.; Griesshaber, E.; Yin, X.; Rupp, U.; Sánchez-Almazo, I.; Heß, M.; Walther, P.; Checa, A.; Schmahl, W.W. The Unique Fibrilar to Platy Nano- and Microstructure of Twinned Rotaliid Foraminiferal Shell Calcite. Sci. Rep. 2023, 13, 2189. [Google Scholar] [CrossRef]
  75. Pokroy, B.; Kapon, M.; Marin, F.; Adir, N.; Zolotoyabko, E. Protein-Induced, Previously Unidentified Twin Form of Calcite. Proc. Natl. Acad. Sci. USA 2007, 104, 7337–7341. [Google Scholar] [PubMed]
  76. Schmahl, W.W.; Yin, X.; Lastam, J.; Griesshaber, E.; Hörl, S.; Sancho Vaquer, A. Statistical Analysis of EBSD Data and Geometrical Theory of Classical and Non-Classical Twinning in Foraminiferal Shell Calcite. Sci. Rep. 2025, accepted. [Google Scholar] [CrossRef]
  77. Suzuki, M.; Kim, H.; Mukai, H.; Nagasawa, H.; Kogure, T. Quantitative XRD Analysis of {1 1 0} Twin Density in Biotic Aragonites. J. Struct. Biol. 2012, 180, 458–468. [Google Scholar] [CrossRef]
  78. Kogure, T.; Suzuki, M.; Kim, H.; Mukai, H.; Checa, A.G.; Sasaki, T.; Nagasawa, H. Twin Density of Aragonite in Molluscan Shells Characterized Using X-Ray Diffraction and Transmission Electron Microscopy. J. Cryst. Growth 2014, 397, 39–46. [Google Scholar] [CrossRef]
  79. Griesshaber, E.; Schmahl, W.W.; Ubhi, H.S.; Huber, J.; Nindiyasari, F.; Maier, B.; Ziegler, A. Homoepitaxial Meso- and Microscale Crystal Co-Orientation and Organic Matrix Network Structure in Mytilus edulis Nacre and Calcite. Acta Biomater. 2013, 9, 9492–9502. [Google Scholar] [CrossRef] [PubMed]
  80. Mutvei, H. Ultrastructural Characteristics of the Nacre in Some Gastropods. Zool. Scr. 1978, 7, 287–296. [Google Scholar] [CrossRef]
  81. Kobayashi, I.; Akai, J. Twinned Aragonite Crystals Found in the Bivalvian Crossed Lamellar Shell Structure. J. Geol. Soc. Jpn. 1994, 100, 177–180. [Google Scholar] [CrossRef]
  82. Crippa, G.; Griesshaber, E.; Checa, A.G.; Harper, E.M.; Simonet Roda, M.; Schmahl, W.W. SEM, EBSD, Laser Confocal Microscopy and FE-SEM Data from Modern Glycymeris Shell Layers. Data Brief 2020, 33, 106547. [Google Scholar] [CrossRef]
Table 1. The different crystals that comprise Ostreoidea shells and the range of crystal co-orientation strength, expressed as MUD values, for individual crystals as well as for a particular microstructure. When the MUD values of a microstructure are considered, we observe the highest crystal co-orientation strength for the myostraca and the lowest for the chalk and for the dendritic crystals. When the MUD value of individual crystals is considered, we find the highest crystal co-orientation strength for individual rhombohedral crystals, followed by the individual prisms of the myostraca.
MUD Value of an
EBSD Scan Covering
Many Crystals
MUD Value of an
EBSD Scan Over an
Individual Crystal
Columnar crystals25–30250–460
Foliated units18–67Folium: 591, 626
Foliated unit: 174, 545
Pallial prisms125–130650–680
Adductor prisms85–90650–700
Chalk blades/laths4–45450–500
Dendritic crystals12–27350–600
Cementation granules13–18600–650
Rhombohedral crystals-700, >700
Disclaimer/Publisher’s Note: The statements, opinions and data contained in all publications are solely those of the individual author(s) and contributor(s) and not of MDPI and/or the editor(s). MDPI and/or the editor(s) disclaim responsibility for any injury to people or property resulting from any ideas, methods, instructions or products referred to in the content.

