Article

The Influence of Process and Slag Parameters on the Liquid Slag Layer in Continuous Casting Mold for Large Billets

1
College of Metallurgical and Energy, North China University of Science and Technology, Tangshan 063210, China
2
HBIS Group ShiSteel Company, Shijiazhuang 050018, China
3
Jiangyou Changcheng Special Steel Co., Ltd. of Panggang Group, Jiangyou 621701, China
4
Yanzhao Iron and Steel Laboratory, Tangshan 063210, China
5
College of Materials Science and Engineering, Hebei University of Science and Technology, Shijiazhuang 050018, China
*
Author to whom correspondence should be addressed.
Crystals 2025, 15(5), 388; https://doi.org/10.3390/cryst15050388
Submission received: 18 February 2025 / Revised: 13 April 2025 / Accepted: 17 April 2025 / Published: 23 April 2025
(This article belongs to the Special Issue Crystallization of High Performance Metallic Materials (2nd Edition))

Abstract

:
In the continuous casting of special steel blooms, low casting speeds result in slow renewal of the molten steel surface in the mold, adversely affecting mold flux melting and liquid slag layer supply, which may lead to surface cracks, slag entrapment, and breakout incidents. To optimize the flow and heat transfer behavior in the mold, a three-dimensional numerical model was developed based on the VOF multiphase flow model, k ϵ RNG turbulence model, and DPM discrete phase model, employing the finite volume method with SIMPLEC algorithm for solution. The effects of casting speed, argon injection rate, and mold flux properties were systematically investigated. Simulation results demonstrate that when casting speed increases from 0.35 m·min−1 to 0.75 m·min−1, the jet penetration depth increases by 200 mm and meniscus velocity rises by 0.014 m·s−1. Increasing argon flow rate from 0.50 L·min−1 to 1.00 L·min−1 leads to 350 mm deeper bubble penetration, 10 mm reduction in jet penetration depth, 0.002 m·s−1 increase in meniscus velocity, and decreased meniscus temperature due to bubble cooling. When mold flux viscosity increases from 0.2 Pa·s to 0.6 Pa·s, the average liquid slag velocity decreases by 0.006 m·s−1 with a maximum temperature drop of 10 K. Increasing density from 2484 kg·m−3 to 2884 kg·m−3 results in 0.005 m·s−1 higher slag velocity and average 8 K temperature reduction. Comprehensive analysis indicates that optimal operational parameters are casting speed 0.35–0.45 m·min−1, argon flow ≤ 0.50 L·min−1, mold flux viscosity 0.2–0.4 Pa·s, and density 2484–2684 kg·m−3. These conditions ensure more stable flow and heat transfer characteristics, effectively reducing slab defects and improving casting process stability.

1. Introduction

Special steel refers to steel grades characterized by specific chemical compositions, unique microstructures, and properties, enabling them to meet the demands of specific applications [1,2,3,4,5]. Large billet continuous casting of special steel products is primarily employed in the rolling of low-alloy structural steels, heavy rail steels, hard wire steels, seamless steel pipes, medium and large H-beams, along with various bars and forgings [6,7,8]. The continuous casting process of special steel billets is more challenging due to their large cross-sectional dimensions and the substantial differences in composition compared to carbon steel, necessitating a slower drawing speed for production [9]. Once the protective slag is added above the mold in continuous casting, it melts and flows onto the billet shell surface under the influence of high-temperature molten steel, providing functions such as heat transfer regulation and lubrication of the billet shell. At lower drawing speeds, the renewal of the mold liquid surface slows down, exacerbating the melting conditions of the protective slag and resulting in issues such as a thinning slag layer and inadequate slag supply. This can lead to quality defects or production accidents, such as surface cracks, slag inclusion, and steel leakage in the continuous casting billet [10,11].
Fluid dynamics has made significant advances in the field of continuous casting. Scholars have conducted extensive research by integrating numerical simulations with continuous casting processes [12,13,14]. For instance, Hu et al. [15] tackled the application challenges of the light pressing process at the solidification end of round billets in continuous casting. They proposed a dual-roll, triple-roll, and four-roll staggered extrusion scheme, and developed a 3D heat-force coupled model to compare and analyze the advantages and disadvantages of each scheme. Liu et al. [16] conducted numerical simulations of the magnetic-driven flow field and solidification process of high-strength low-alloy steel round billets in continuous casting, analyzing the casting surface temperature and shell thickness. Qiu et al. [17] established a 3D mathematical model to simulate molten steel flow in the continuous casting mold for small square billets. They analyzed the effects of drawing speed and submerged nozzle parameters on the flow field. An et al. [18] developed a 3D mathematical model for small square billets in continuous casting, including the effects of electromagnetic forces and heat transfer, and analyzed the impact of current strength and frequency on the flow and temperature fields. Yang J [19,20] analyzed the relationship between molten steel, protective slag, and billet shell heat transfer under ultra-high-speed continuous casting conditions, as well as the flow and heat transfer behavior within the mold. Vakhrushev et al. [21] conducted 2D simulations using an advanced multi-material model based on the new single grid method. They investigated the effects of different insulation conditions and clogging layers at submerged nozzles, finding that missing nozzle insulation could lead to parasitic solidification, while clogging promoted molten steel solidification. Both parasitic solidification and clogging together enhanced jet flow and weakened overheating transmission within the mold. Ma et al. [22] modified the heat transfer model using measured billet shell thickness and surface temperature data, achieving high accuracy in simulating the continuous casting solidification process. This model offers the potential for improved simulation of dynamic solidification processes and optimization of secondary cooling water.
In recent years, there has been significant progress in the optimization research of continuous casting large square billets. Yang et al. [23] developed a 3D real-time heat transfer model for the initial and final stages of large billet continuous casting. The model was accelerated using specific algorithms and optimization of discretization parameters, and uncertainty was minimized by calibrating thermal/physical and boundary condition parameters with experimental data. The accuracy of the model was validated through online surface temperature measurements, with calculation errors kept below ±10 °C. Fang et al. [24] developed a 3D mathematical model for large billet continuous casting, analyzing the effects of submerged nozzle structure and installation on the flow field, temperature field, and solidification process. Ren et al. [25] developed a 3D mathematical model for large billet continuous casting to analyze the effects of current strength on the flow field, temperature field, and solidification process.
However, existing research primarily focuses on fluid field optimization, inclusion control, and other areas, with limited attention paid to the effects of process parameters on the protective slag and liquid slag layer in the mold. To gain a comprehensive understanding of the behavior of liquid protective slag under various operating conditions in the continuous casting mold of large billets of special steel, this study focuses on billets with cross-sections of 300 mm × 340 mm. This study considers various factors, including molten steel temperature, mold geometry, casting speed, submerged nozzle parameters, and others, to analyze their impact on the flow of protective slag in the mold.
The structure of the rest of this paper is as follows: In Section 2, a three-dimensional mathematical model for the mold is presented. Section 3 displays and discusses the simulation results, revealing the varying patterns of the flow field and temperature field of the molten steel and slag layer under different operating conditions. Finally, in Section 4, the study’s findings are summarized.

2. Mathematical Models

2.1. Geometric and Algorithmic Models

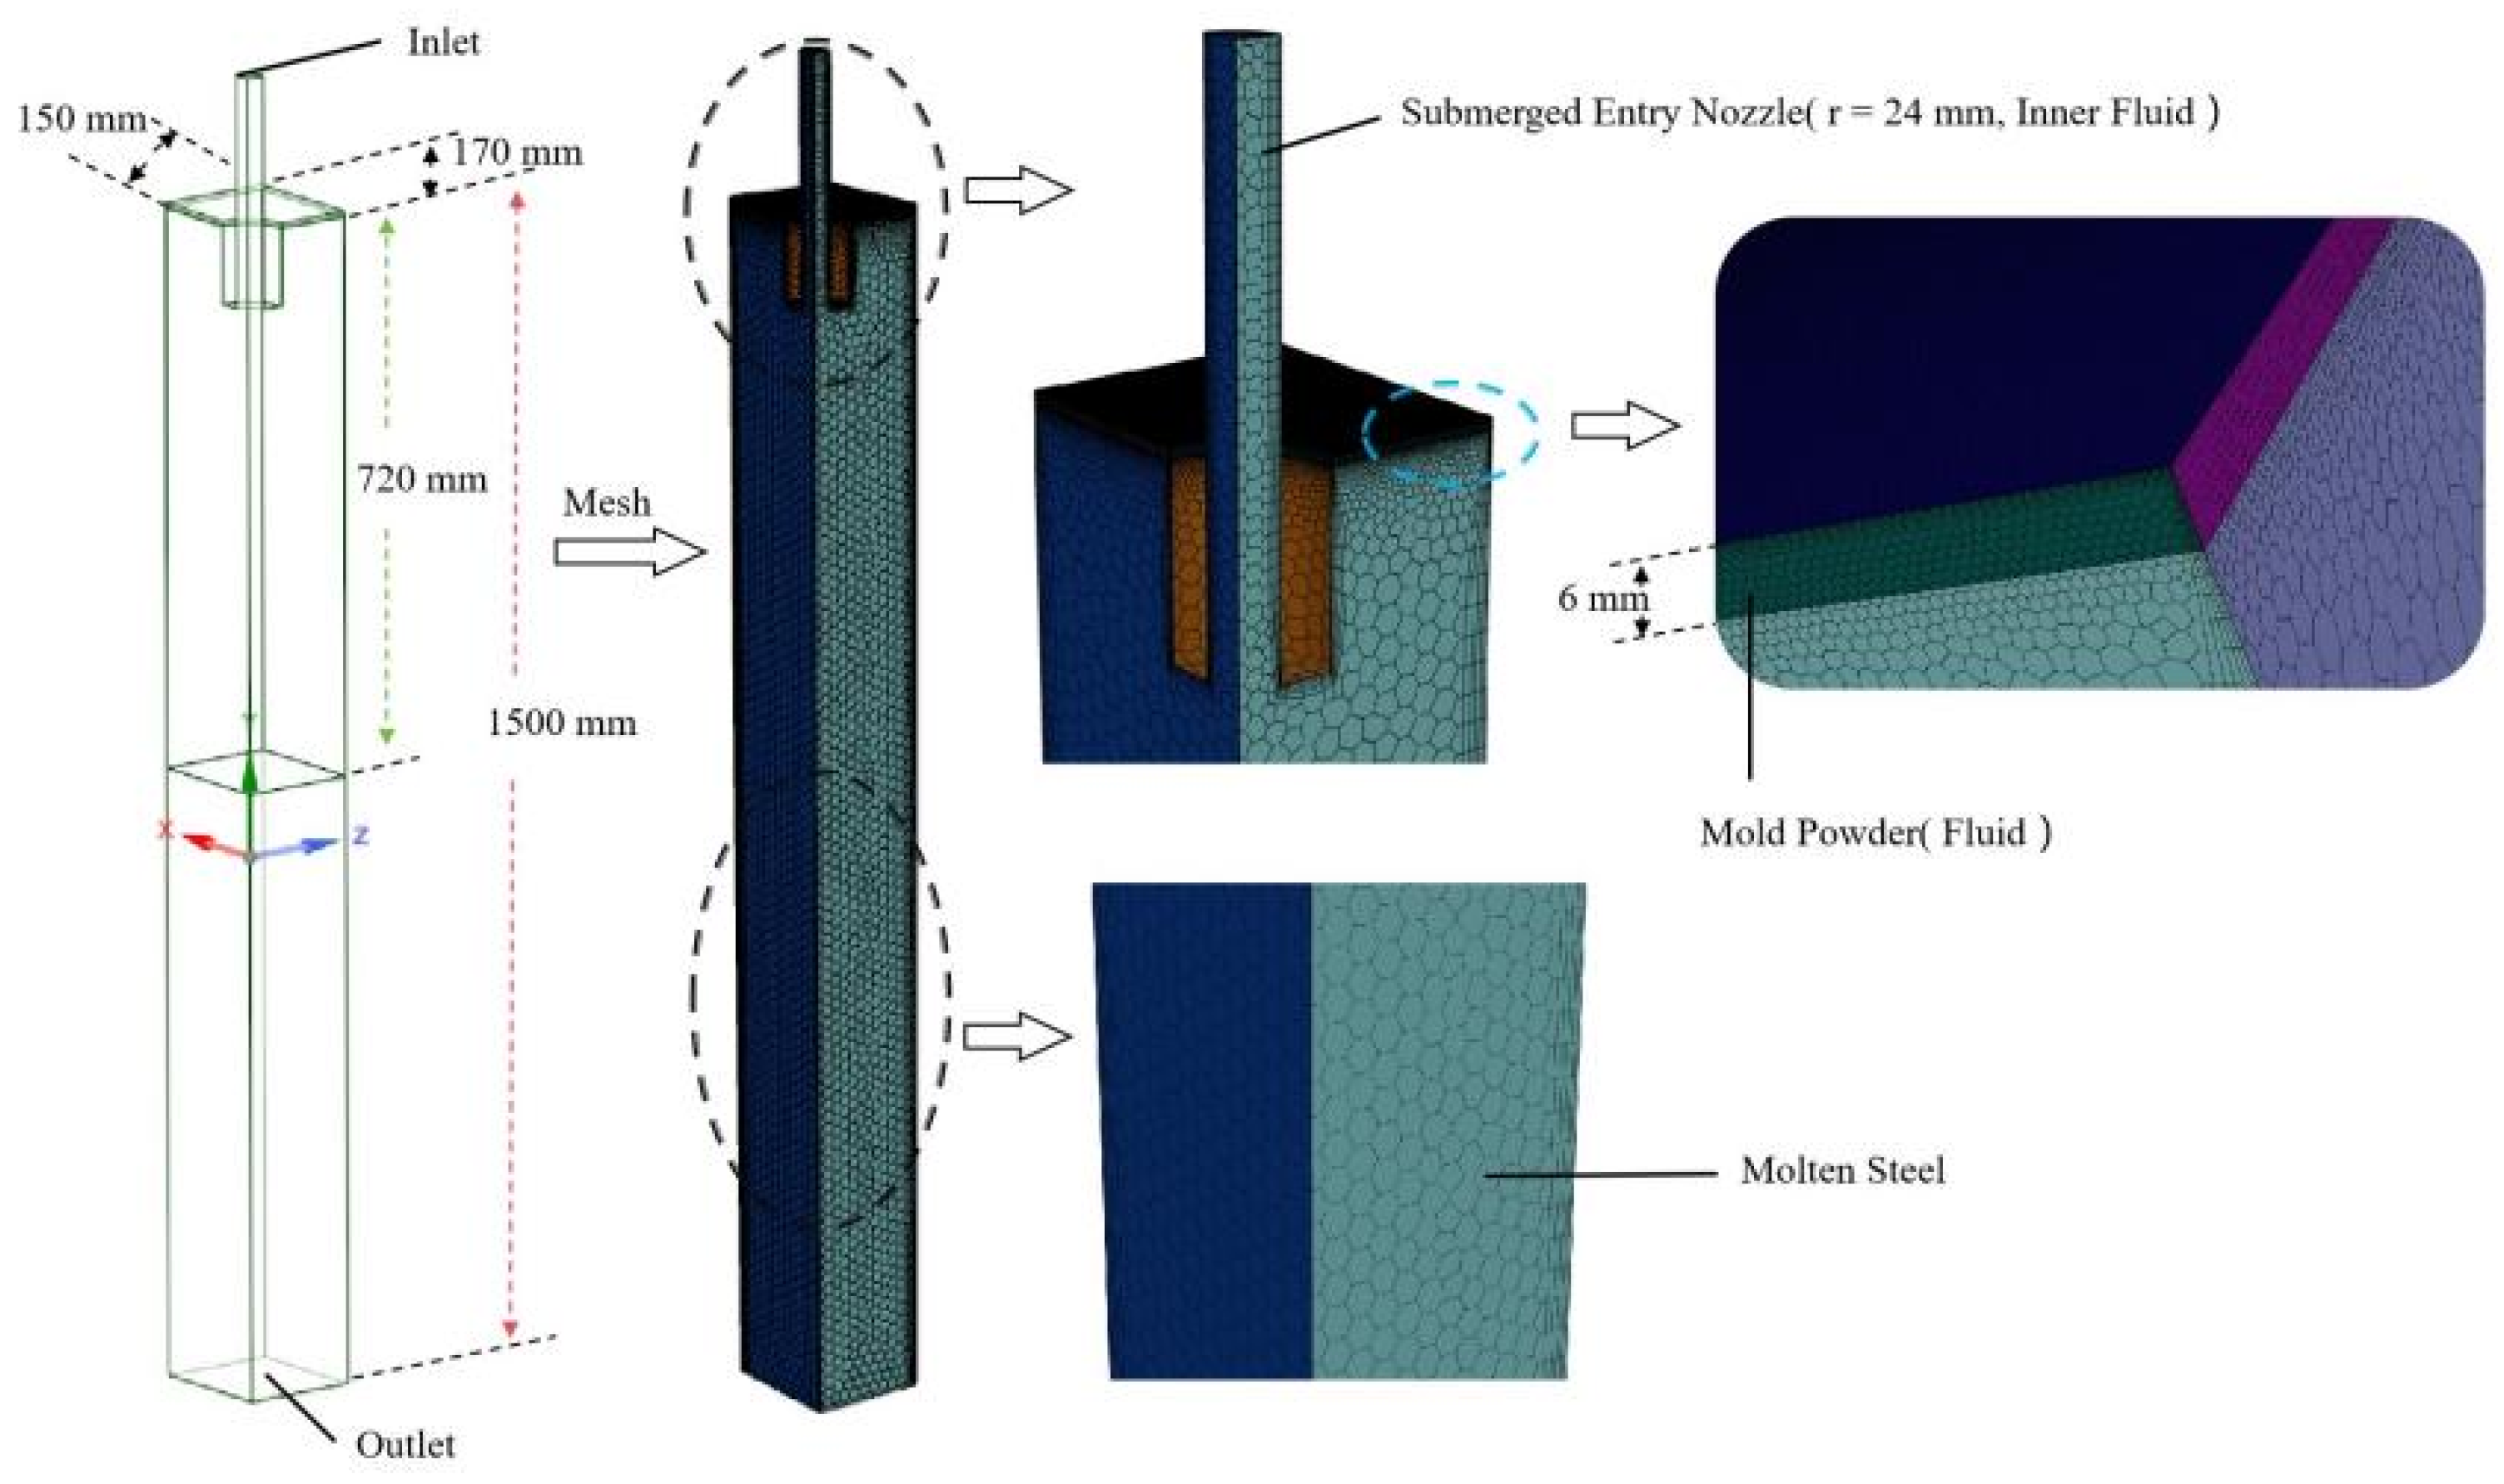
2.1.1. Geometric Models

Owing to the bilateral symmetry of the geometric model, a practical 1:1 scaled three-dimensional quarter model was developed, incorporating key features such as the submerged nozzle, molten steel, and slag layers within the crystallizer. The computational domain and mesh division of the geometric model are illustrated in Figure 1. The submerged nozzle employed is a single-hole design, and the effective height of the crystallizer, initially 720 mm, was extended to 1500 mm to facilitate adequate fluid development. The mesh division adopts a hexahedral structure, with the slag layer refined to a 1 mm grid size, resulting in an overall mesh count of approximately 440,000 elements.

2.1.2. Algorithm Model

This study utilizes the multiphase flow VOF (volume of fluid) model, the k ϵ RNG (renormalization group) turbulence model, and the DPM (discrete phase model) to simulate and track fluid dynamics under varying operational conditions.
Common multiphase flow models include three primary types: the volume of fluid (VOF) model, the mixture model, and the Eulerian model. Among these, the VOF model is particularly suitable for tracking interfaces between immiscible fluids. It employs a shared momentum equation for all phases while distinguishing individual phases through volume fraction tracking. This model effectively simulates stratified flows, free-surface flows, filling processes, sloshing dynamics, and gas bubble behavior in liquids. To investigate the three-phase interaction (molten steel, mold flux, and argon gas) in the continuous casting mold, the VOF model was adopted for phase distribution calculations. The governing equations are as follows [26]:
q = 1 n a q = 1
In the equation above, q represents the phase; n denotes the total number of phases; and a q refers to the volume fraction of the specified phase. When a q = 0 , it indicates that phase q is absent in the computational cell; when 0 < a q < 1 , it signifies the coexistence of phase q and other phases in the computational cell; when a q = 1 , it indicates that only phase q is present in the computational cell.
When the critical Reynolds number of a flowing fluid exceeds a certain threshold, the flow transitions from laminar to turbulent, characterized by random fluctuations, enhanced diffusivity, and energy dissipation. To accurately capture turbulent phenomena—such as steel jet impingement and argon bubble-induced flow—while balancing computational efficiency and model accuracy, the k ϵ RNG (renormalization group) turbulence model was selected. The corresponding equations are [27]:
ρ k t + ρ u i k x i = x i α k μ eff k x i + G k + G b ρ ϵ + S k Y M
ρ ϵ t + ρ u i ϵ x i = x i α ϵ μ eff ϵ x i + C 1 ϵ ϵ k G k + C 3 ϵ G b C 2 ϵ ρ ϵ 2 k + S ϵ
μ eff = μ 0 + μ t = μ 0 + ρ C μ k 2 ϵ
C 2 ε = C 2 ε + C μ ρ η 3 1 η η 0 1 + β η 3
η = k ε · S ¯
S ¯ = 2 · S i j ¯ · S i j ¯
S i j ¯ = 1 2 u i ¯ x j + u j ¯ x i
The variables in the equations above are defined as follows: k is the turbulence kinetic energy (m2·s−2); ϵ is the turbulence dissipation rate (m2·s−3); ρ is the fluid density (kg·m−3); t represents time (s); u i and u j are the velocity components in the i and j directions (m·s−1); x i and x j are the coordinates in the i and j directions (m); G k is the turbulence kinetic energy generated by the mean velocity gradient (m2·s−2); G b is the turbulence kinetic energy produced by buoyancy (m2·s−2); Y M represents the influence of fluctuating expansion on the turbulence dissipation rate; S k , S ϵ , S ¯ , and S i j ¯ are user-defined source terms. Additionally, α k and α ϵ are the effective Prandtl numbers for turbulence kinetic energy and turbulence dissipation rate, respectively. u eff denotes the effective turbulence viscosity coefficient (Pa·s); u 0 and u t represent the laminar and turbulent viscosities (Pa·s), respectively; β , η 0 , C μ , α k , α ϵ , C 1 ϵ , and C 2 ϵ are empirical constants, where β = 0.012 , η 0 = 4.377 , C μ = 0.0845 , α k = α ϵ = 1.39 , C 1 ϵ = 1.42 , and C 2 ϵ = 1.68 .
To account for argon bubble dispersion effects caused by turbulent velocity fluctuations, the discrete phase model (DPM) was applied to track bubble trajectories within the mold. The governing equations for bubble motion are [28]:
d u g d t = 18 u ρ g d g 2 · C D R e 24 · ( u u g ) + g 1 ρ g ρ ρ g + F i
In the equation above, the variables are defined as follows: u and u g represent the velocities of the fluid and argon bubbles (m·s−1), respectively; t is time (s); ρ and ρ g represent the densities of molten steel and argon bubbles (kg·m−3), respectively; u g is the diameter of the argon bubbles (m); C D is the drag coefficient of the bubbles in the fluid, which is a function of the Reynolds number (Re); and F i represents other forces acting on a unit mass of argon bubbles (kg·m−3).

2.2. Model Assumptions and Boundary Conditions

2.2.1. Assumption Conditions

To ensure that the simulation results are not significantly affected, the following assumptions are made, based on the necessity for coupled calculations of complex phenomena such as fluid flow and heat transfer within the crystallizer [29]: (1) The fluid within the crystallizer is assumed to be incompressible, viscous, and homogeneous; (2) the influence of the solidifying shell inside the crystallizer is neglected; (3) the effects of vibrations and the tapering of the crystallizer are disregarded; (4) the impact of chemical reactions occurring within the crystallizer is omitted; (5) interactions between argon bubbles are neglected, and their sizes are considered constant; and (6) argon bubbles are assumed to enter the crystallizer uniformly from the nozzle outlet.

2.2.2. Boundary Conditions

1.
Inlet conditions
The inlet velocity is determined using Equation (10), which is calculated based on the casting speed of the billet, the cross-sectional dimensions, and the inner diameter of the submerged nozzle. The direction of flow is aligned along the negative Y-axis. The turbulent kinetic energy and turbulent dissipation rate at the inlet are derived from empirical formulas, specifically Equations (11) and (12). The inlet temperature corresponds to the pouring temperature of the molten steel, which is calculated using the liquidus temperature of the steel grade being cast and the overheating temperature during actual casting, as shown in Equation (13).
v in = v 0 60 · ( a × b ) π d 2 2
k in = 0.01 · v in 2
ϵ in = k in 3 2 1 2 · D in
T = T Liquid + Δ T
In the equations, v i n represents the inlet velocity (m·s−1); v 0 denotes the casting speed of the billet (m·min−1); a and b refer to the width and thickness of the billet (m), respectively; d is the inner diameter of the submerged nozzle (m); k i n represents the inlet turbulent kinetic energy (m2·s−2); ϵ i n denotes the inlet turbulent dissipation rate (m2·s−3); D i n is the hydraulic diameter (m); T, T L i q u i d and Δ T refer to the inlet temperature, liquidus temperature, and overheating temperature of the molten steel (K), respectively.
2.
Outlet conditions
Due to the challenges in obtaining detailed parameters such as flow velocity and pressure at the outlet, the steel liquid outlet is defined as a free outflow type, meaning the fluid is assumed to be fully developed at the outlet.
3.
Wall conditions
The wall is modeled as a no-slip wall, and the near-wall flow field is handled using the standard wall function method. The steel liquid wall temperature near the crystallizer is set to the liquidus temperature of the molten steel. The wall temperature of the protective slag and the liquid slag near the crystallizer is set to the liquidus temperature of the protective slag. Other walls are treated as adiabatic walls.
4.
Initial conditions
The fluid is initially at rest, with the initial steel liquid temperature set to the casting temperature. The initial temperature of the slag layer is set to the liquidus temperature of the protective slag. All regions, except for the initial slag layer region, are initially set to steel liquid.
5.
Free Liquid Surface
The surface of the steel liquid is covered by liquid protective slag. The surface of the slag layer is modeled as a free liquid surface (wall), with the free liquid surface temperature set to the liquidus temperature of the protective slag.
Condition Setting Explanation:
Since the focus of this model is primarily on the slag layer, which is derived from the sintered layer and melts at the liquidus temperature of the protective slag, the initial temperature of the slag layer is set to the liquidus temperature of the protective slag. The liquidus temperature is determined by the melting point and melting rate.

2.3. Model Calculation Method and Process

2.3.1. Calculation Method

The mathematical model employs the finite volume method (FVM) and is coupled and solved using the SIMPLEC algorithm. To enhance the accuracy of the calculation results, all variables in the equations are discretized using a second-order upwind scheme. The convergence criterion for residuals is set to 10−5. A typical simulation case requires approximately 8.8 h of computational time.

2.3.2. Calculation Process

The entire calculation process consists of the following steps: (1) Identify the target fluid region; (2) define the fluid state; (3) determine the grid resolution; (4) apply boundary conditions; (5) set initial parameters and initialize the solver; (6) solve the model; (7) extract the calculation results.

2.4. Model Process Parameters

Based on the actual production process of a specific plant, parameters, including the steel grade, casting speed, and the billet cross-sectional dimensions, are presented in Table 1. The composition of the molten steel is provided in Table 2.
Based on the steel composition provided in Table 2, the physical properties of the molten steel, including density, viscosity, thermal conductivity, and specific heat capacity, were calculated at 1793 K using the JMatPro-v132 software. The specific values of these properties are summarized in Table 3.

3. Results and Discussion

The temperature field within the crystallizer significantly affects the melting behavior and flow characteristics of the protective slag. Therefore, it is crucial to investigate the variations in the temperature and flow fields within the crystallizer under different processing conditions and to analyze the metallurgical behavior of the protective slag within this environment.

3.1. Flow and Heat Transfer of Molten Steel

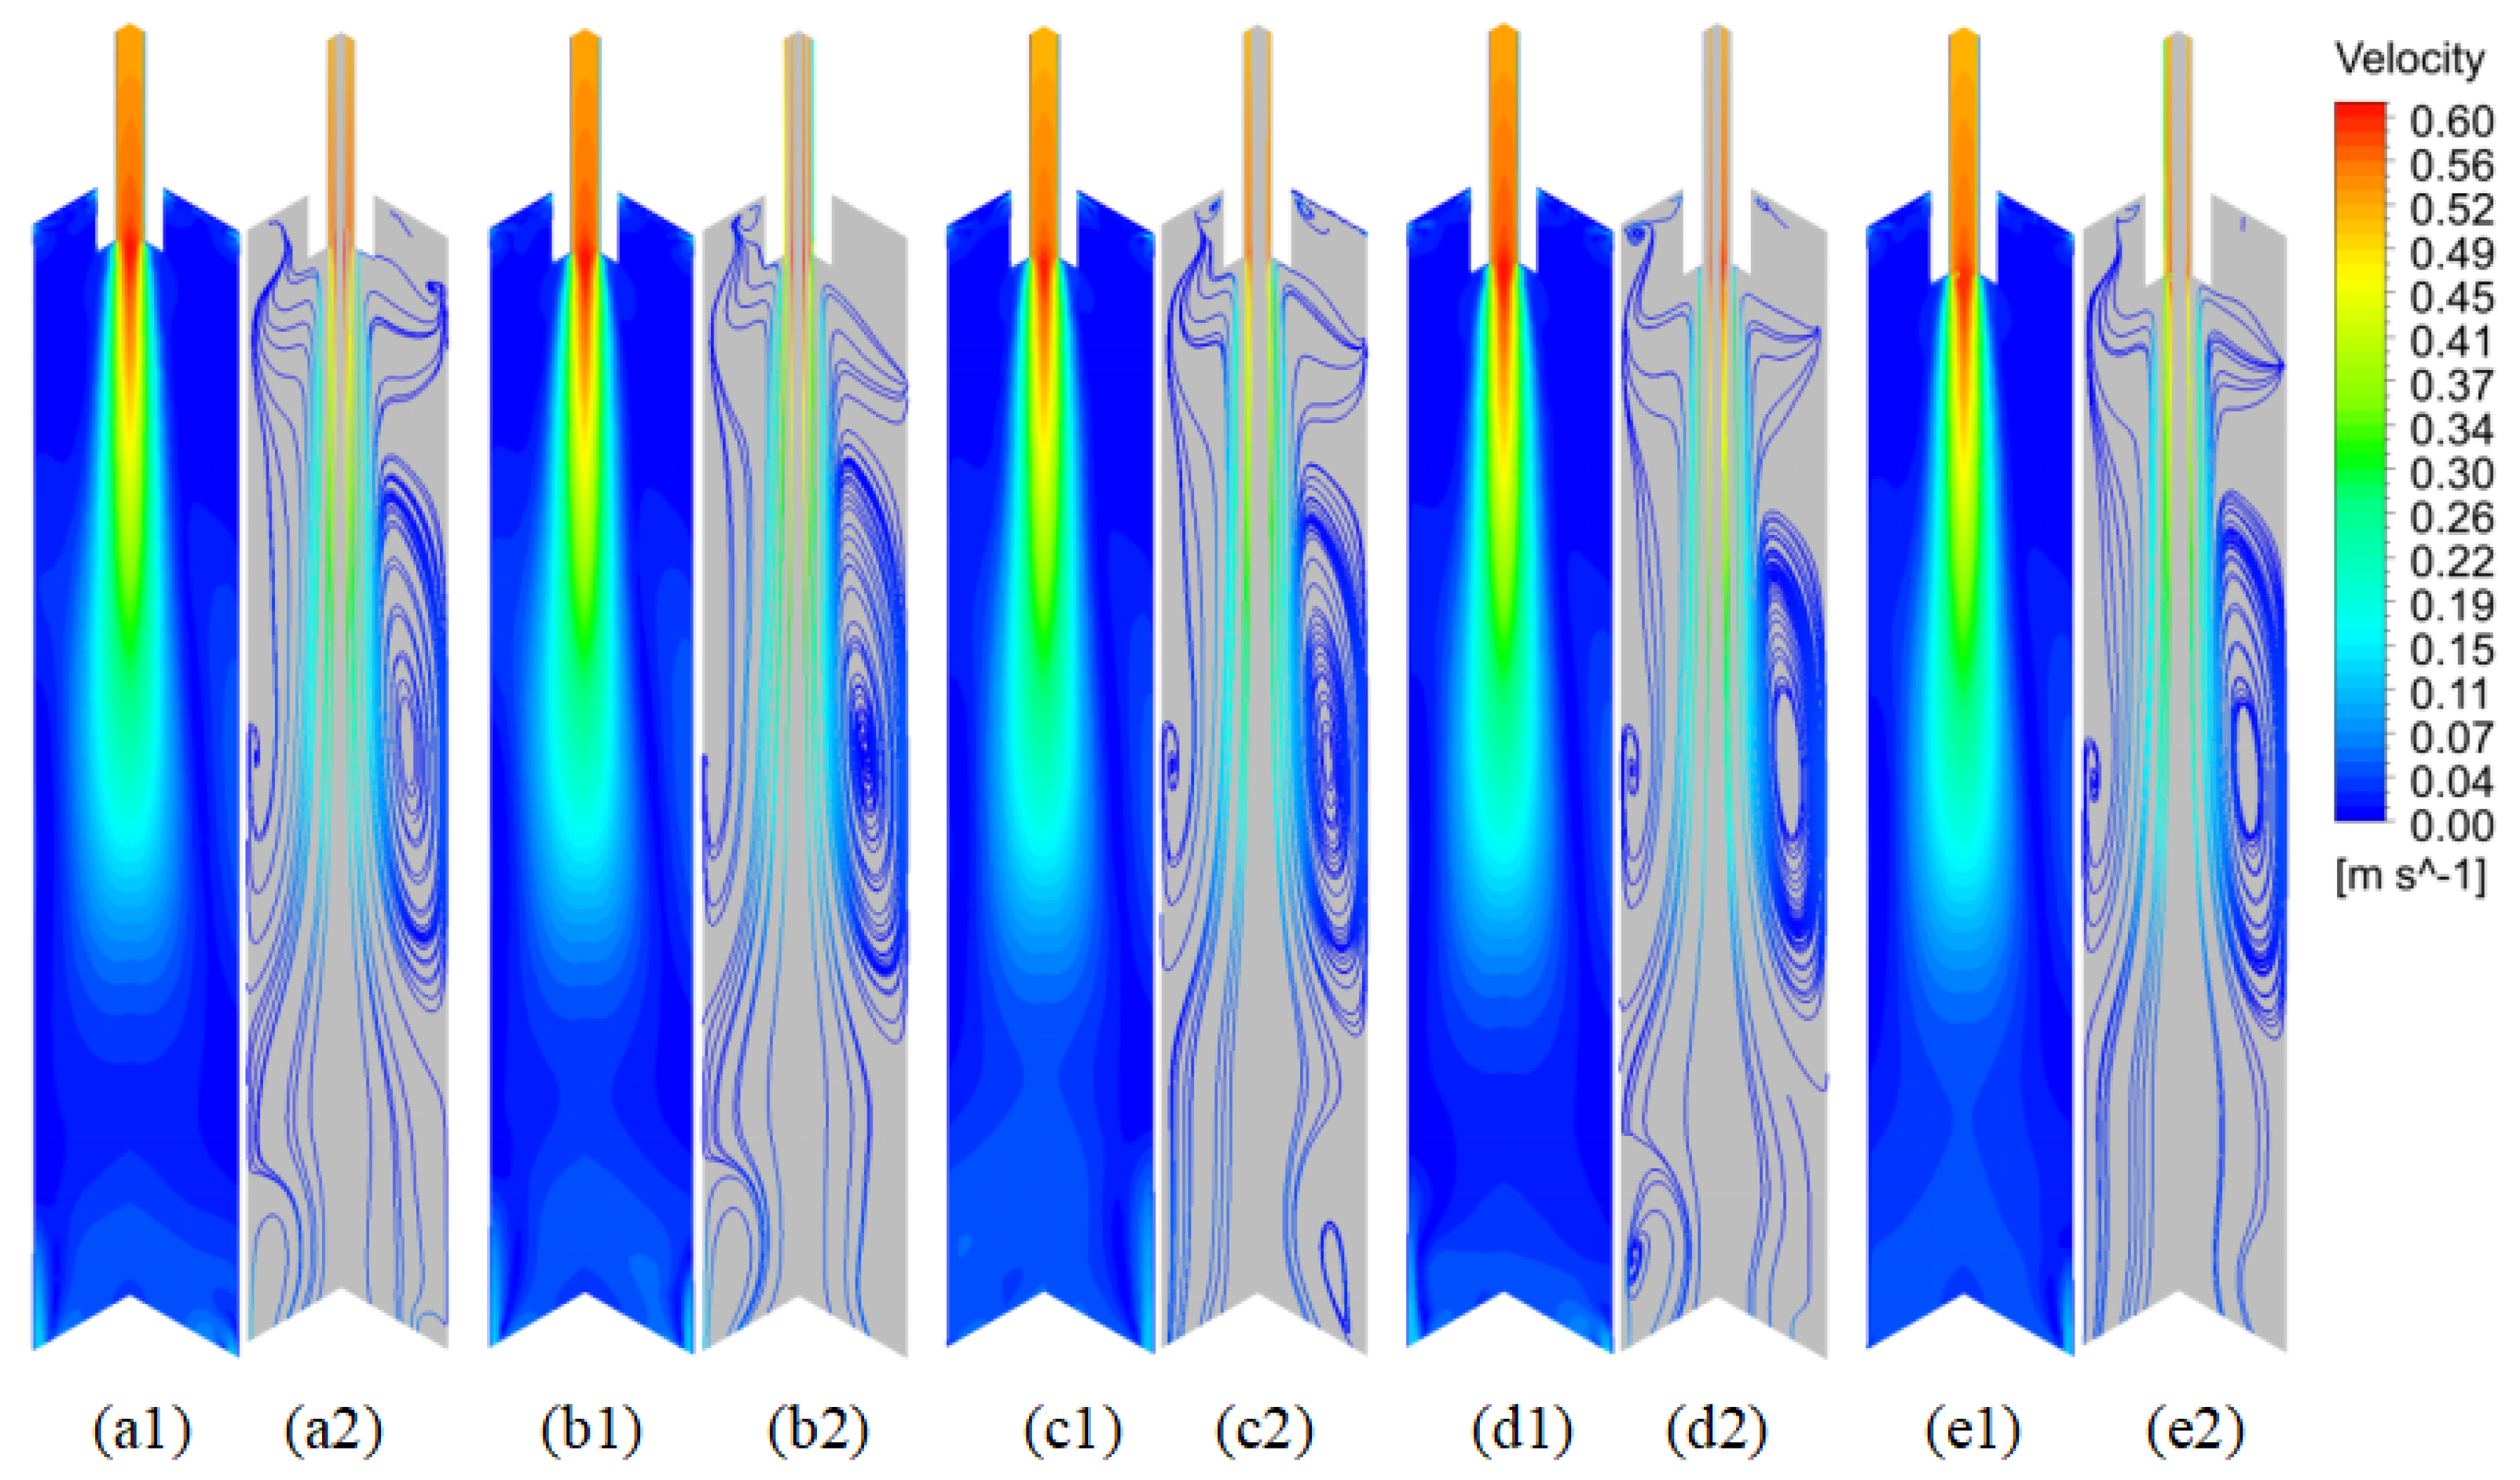
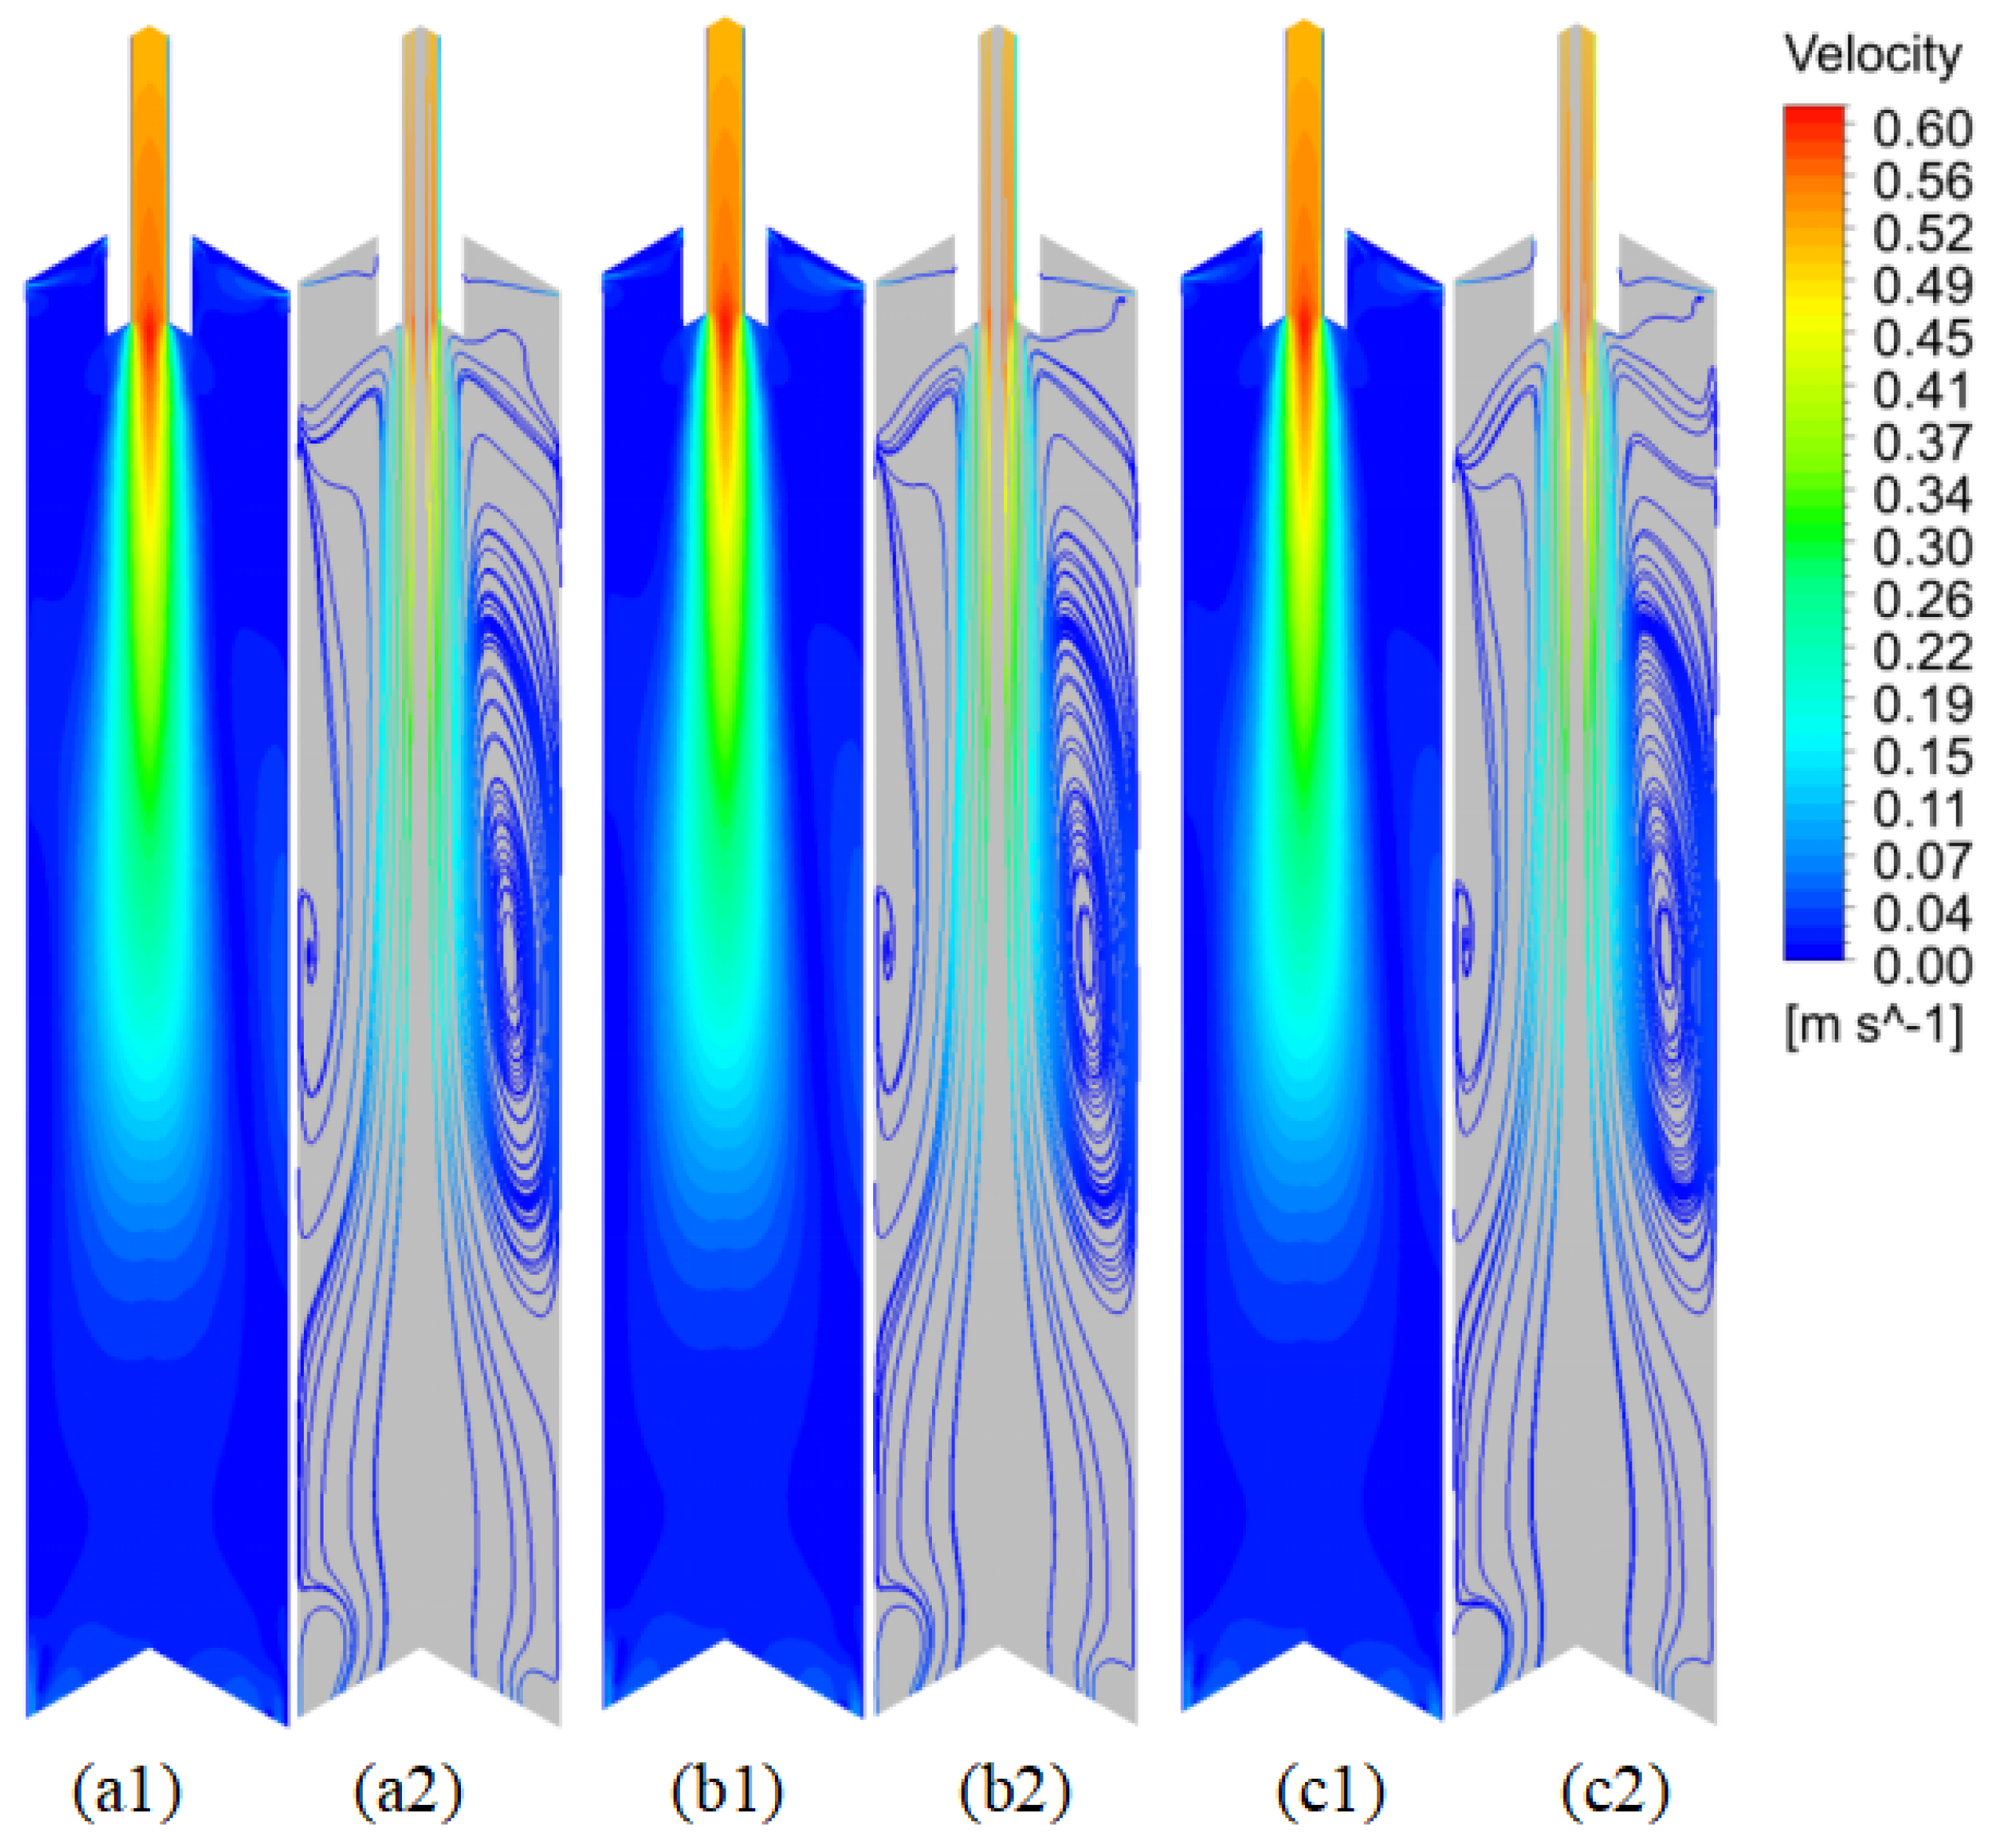
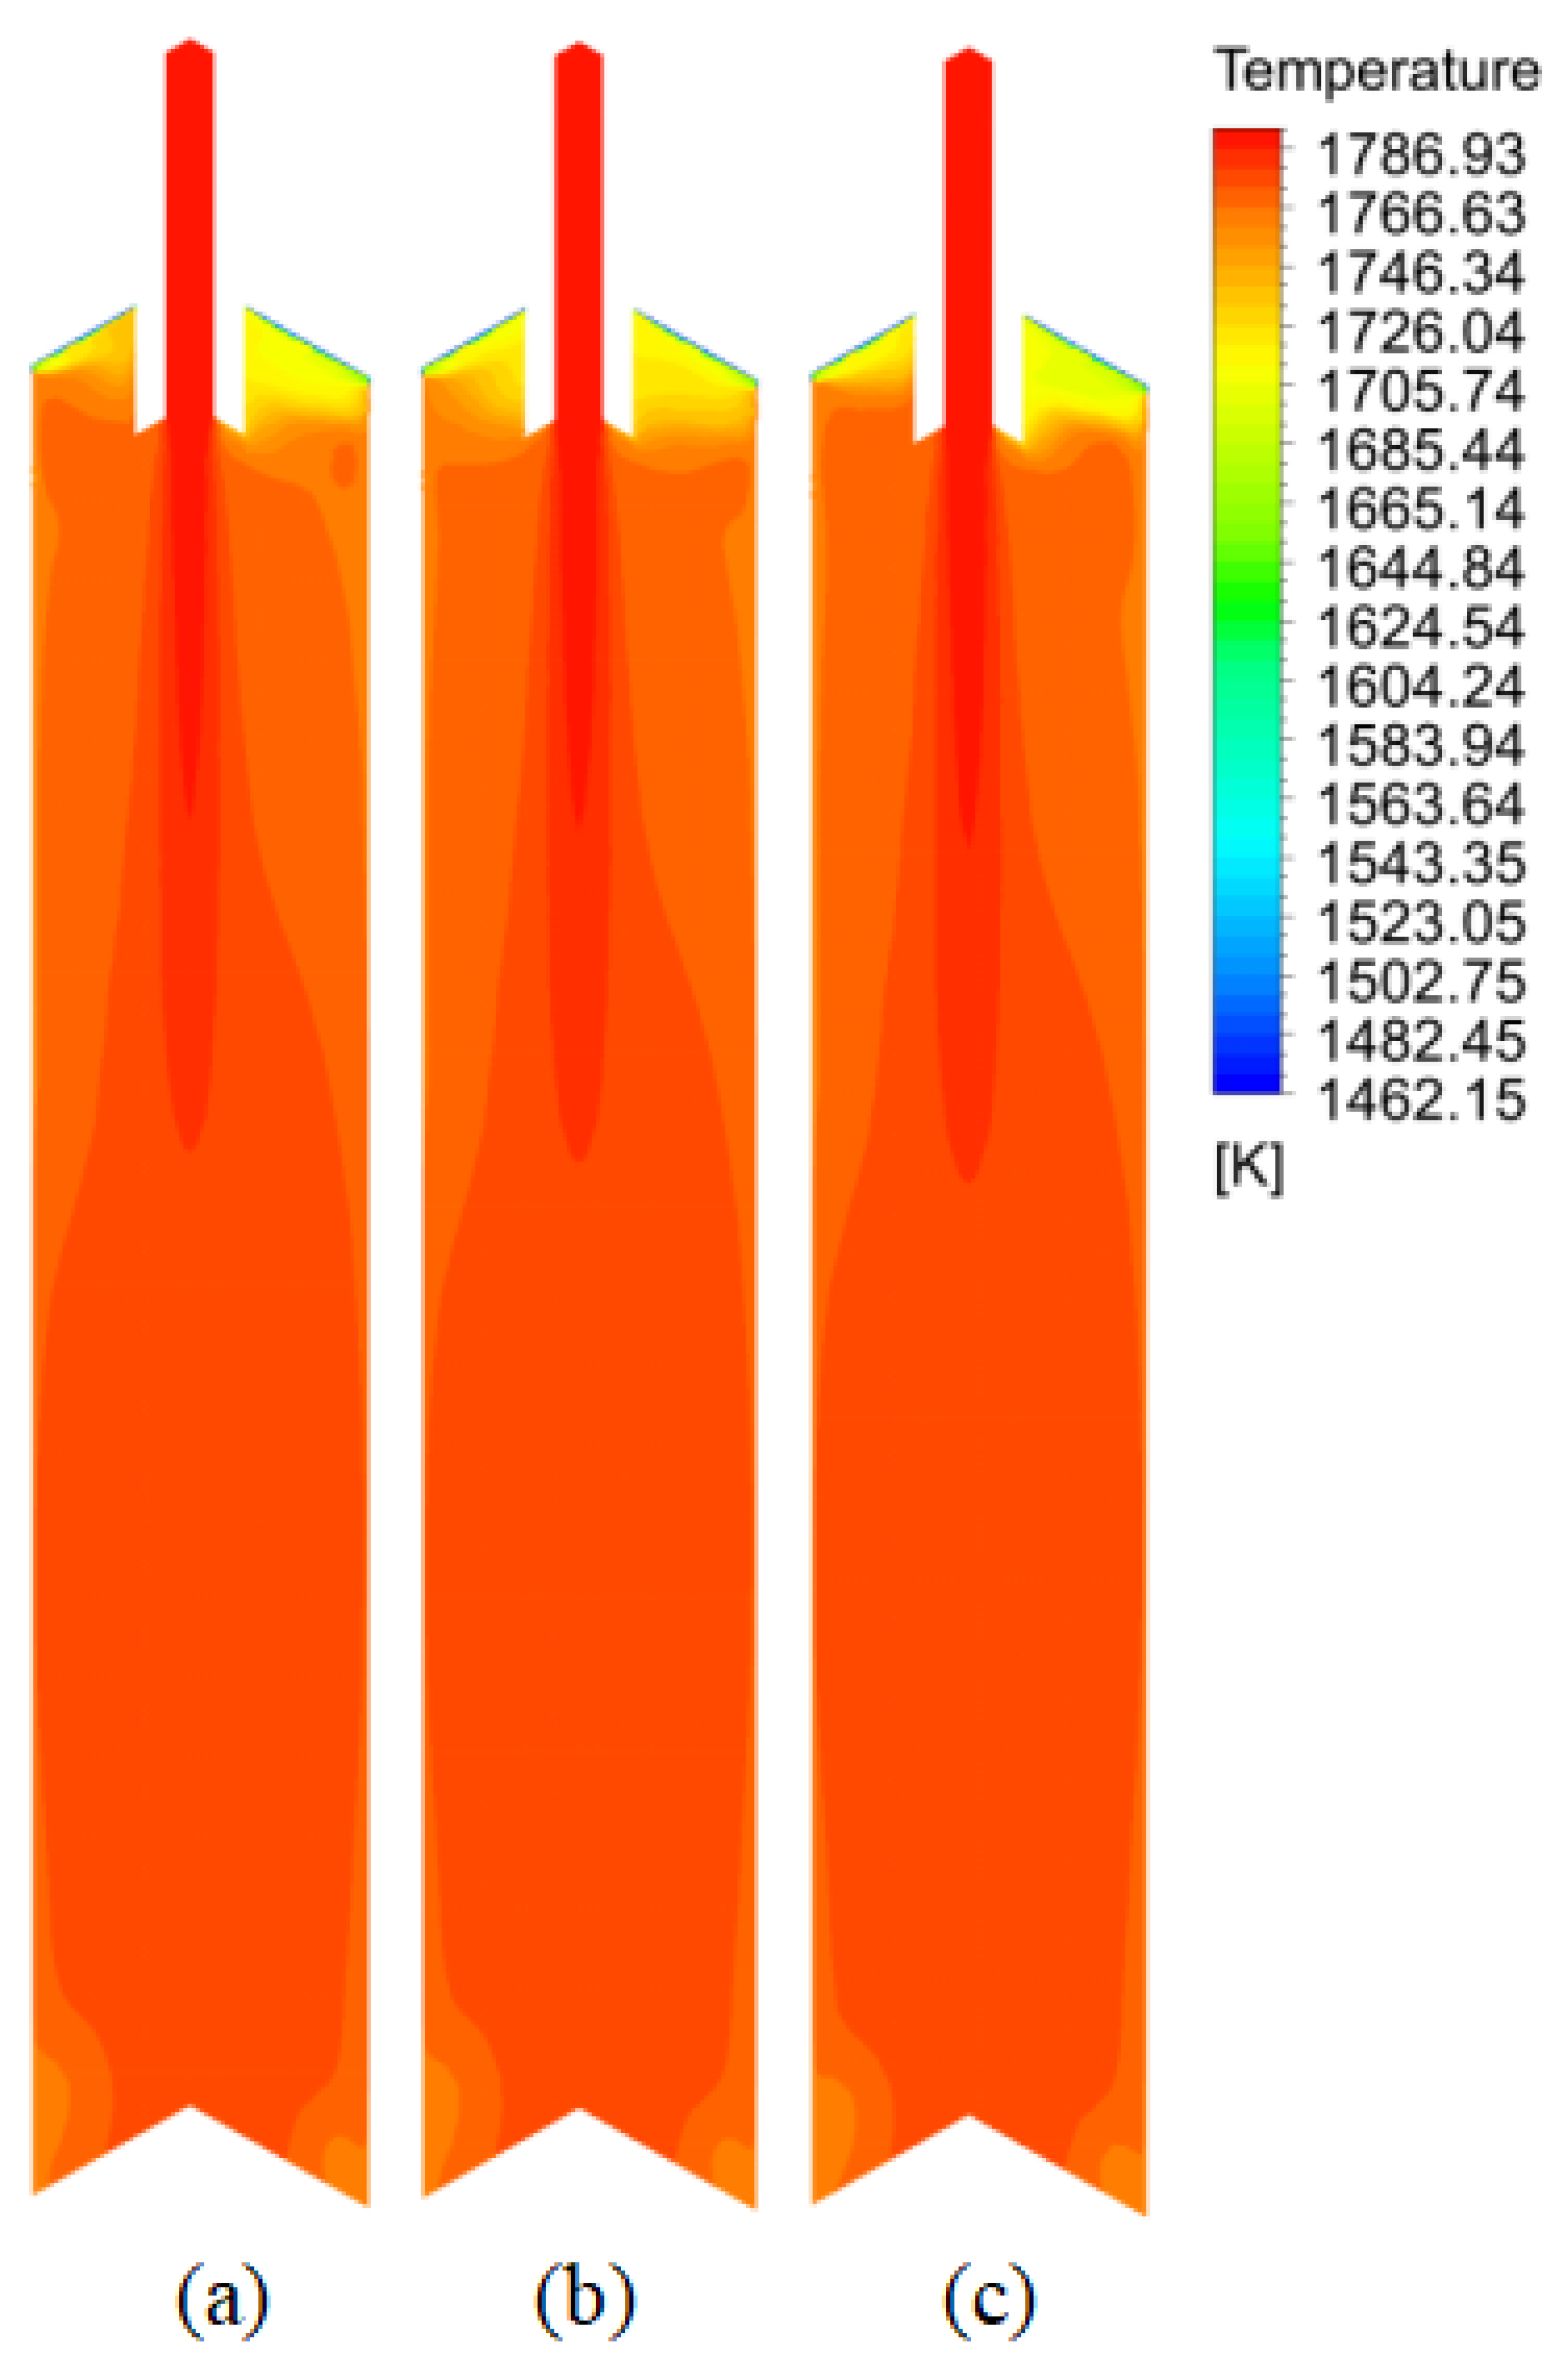
3.1.1. Effect of Casting Speed on Flow and Temperature Fields

The velocity distribution on the symmetry planes (narrow face and wide face) at varying casting speeds is illustrated in Figure 2. Figure 2(a1,b1,c1,d1,e1) clearly demonstrate that the casting speed significantly influences the flow field. As the casting speed increases, the impact depth of the molten steel flow gradually increases, showing a direct correlation. The impact depths of the molten steel flow at casting speeds of 0.35, 0.45, 0.55, 0.65, and 0.75 m·min−1 are measured at 280 mm, 330 mm, 380 mm, 430 mm, and 480 mm, respectively. For each 0.1 m·min−1 increase in the casting speed, the impact depth increases by 50 mm, indicating a linear relationship. Figure 2(a2,b2,c2,d2,e2) clearly illustrate that the casting speed significantly affects the distribution of molten steel backflow. As the casting speed increases, the backflow region of the molten steel expands, the lower vortex center shrinks, and the vortex speed progressively increases.
The surface velocity distribution of molten steel at varying casting speeds is illustrated in Figure 3. The figure indicates that the high- and low-velocity regions of the liquid surface remain relatively consistent at different casting speeds. The flow speed of molten steel near the copper and nozzle walls is relatively higher, while the speed in other areas is slower. As the casting speed increases, the average velocity of the liquid surface gradually increases in a consistent manner. The average liquid surface velocities at casting speeds of 0.35, 0.45, 0.55, 0.65, and 0.75 m·min−1 are 0.031 m·s−1, 0.035 m·s−1, 0.039 m·s−1, 0.042 m·s−1, and 0.045 m·s−1, respectively.
The temperature distribution on the symmetry planes (narrow and wide faces) at various casting speeds is illustrated in Figure 4. As shown in the figure, the casting speed has a notable influence on the temperature field. With an increase in casting speed, the temperature of the molten steel in the upper section of the crystallizer gradually decreases, while the temperature of the steel flow moving downward increases, covering a broader range. Figure 5 presents the temperature distribution on the molten steel surface at various casting speeds. As observed in the figure, the casting speed has a minimal effect on the temperature distribution at the liquid surface.
The temperature near the nozzle on the liquid surface is comparatively lower. With an increase in the casting speed, the average temperature of the liquid surface progressively decreases. The average temperatures of the liquid surface at casting speeds of 0.35, 0.45, 0.55, 0.65, and 0.75 m·min−1 are 1754.32 K, 1753.62 K, 1752.97 K, 1752.46 K, and 1752.2 K, respectively. When the casting speed surpasses 0.65 m·min−1, the temperature of the liquid surface stabilizes and remains nearly constant.
In conclusion, when the casting speed ranges between 0.35 and 0.45 m·min−1, the impact depth and liquid surface flow velocity are moderate, which positively influences the rise of inclusions and bubbles.

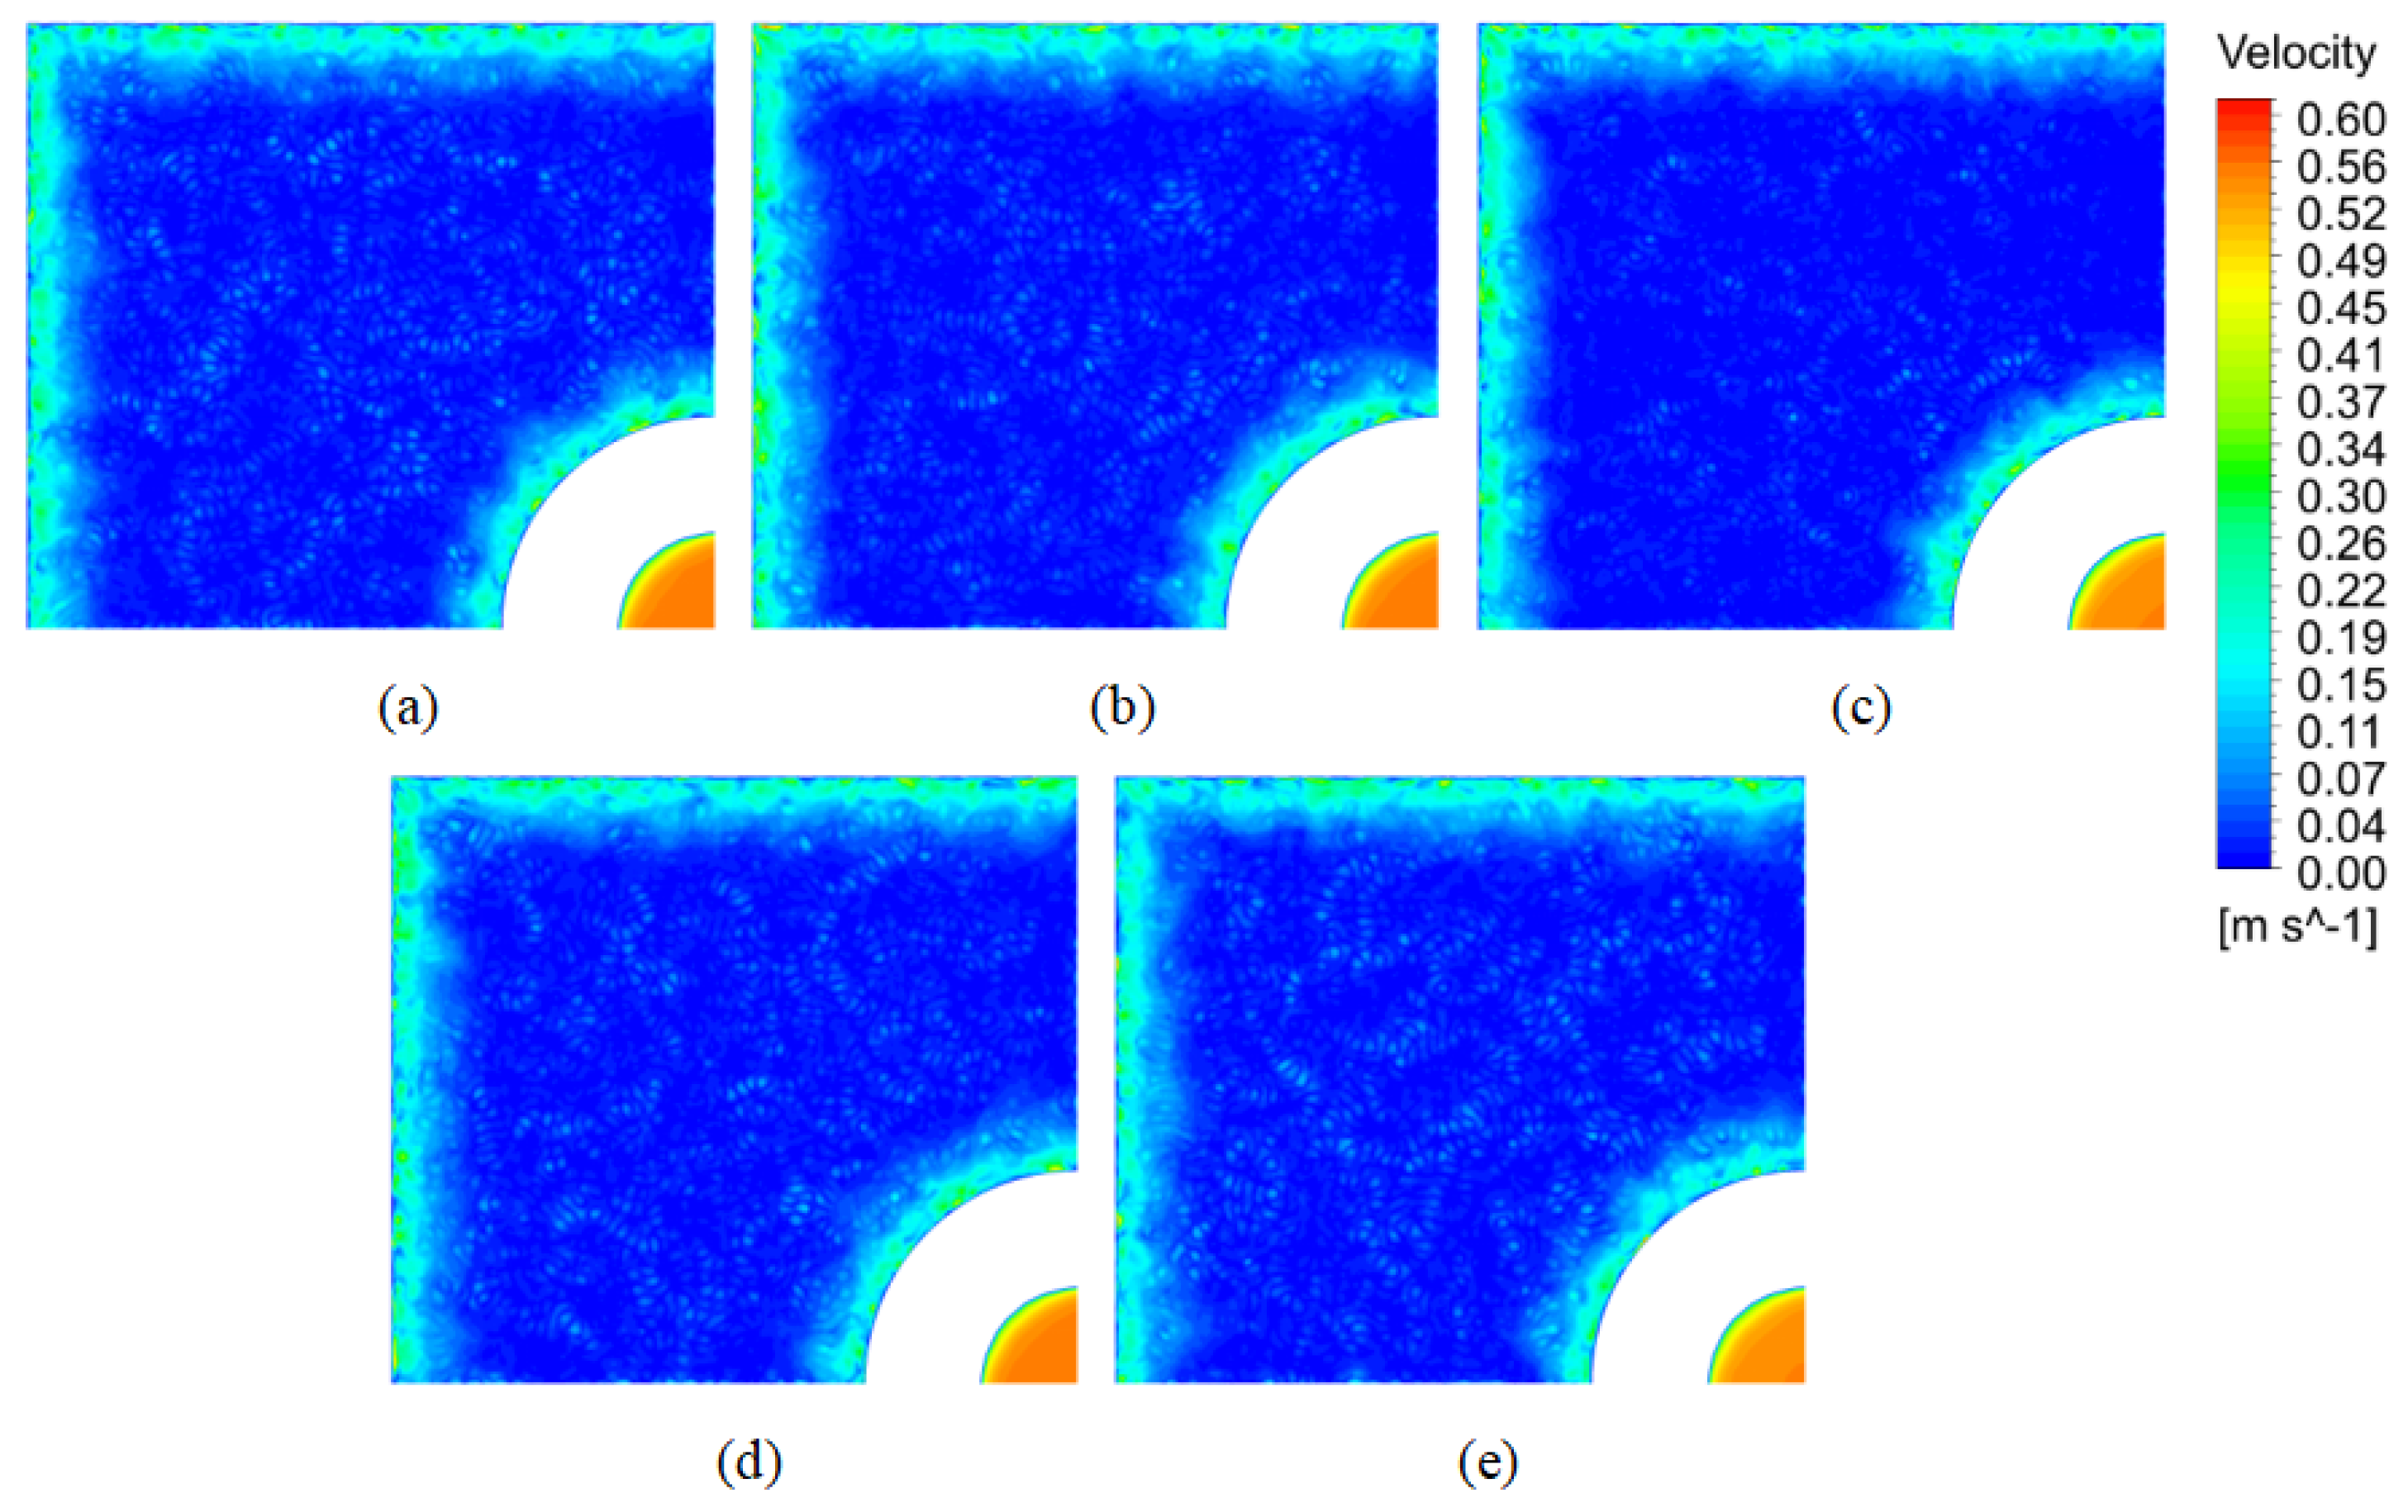
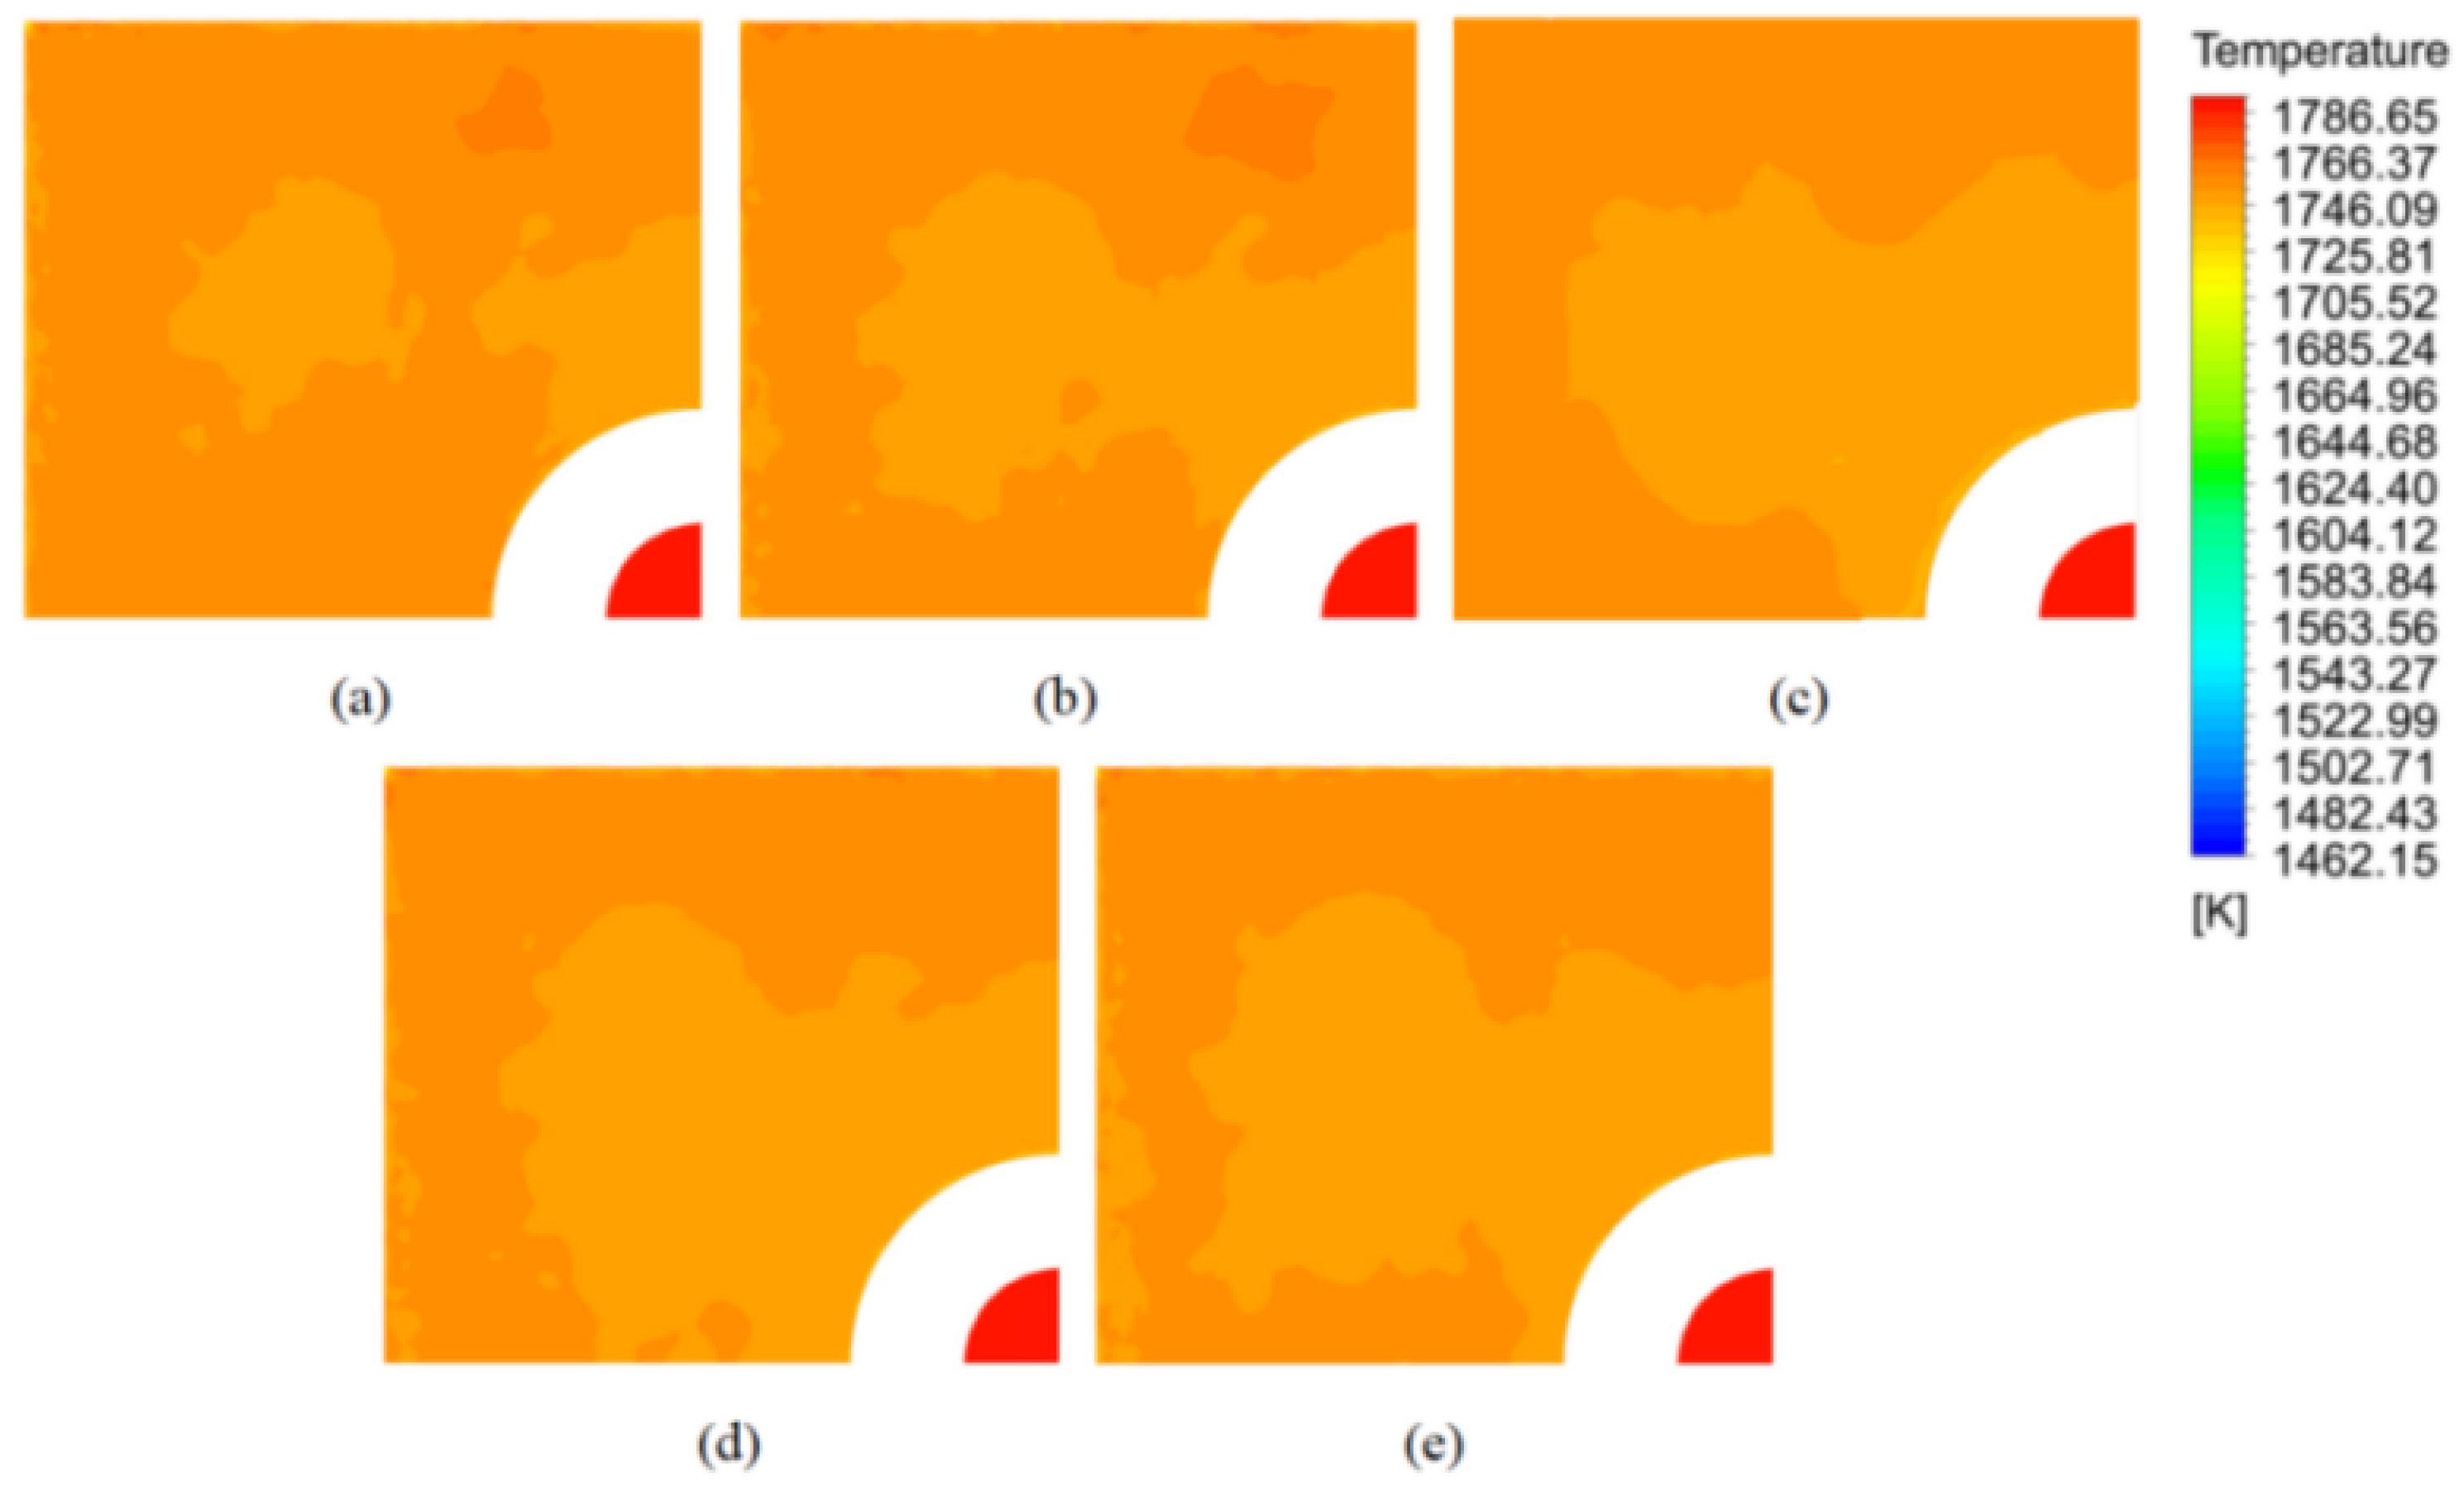
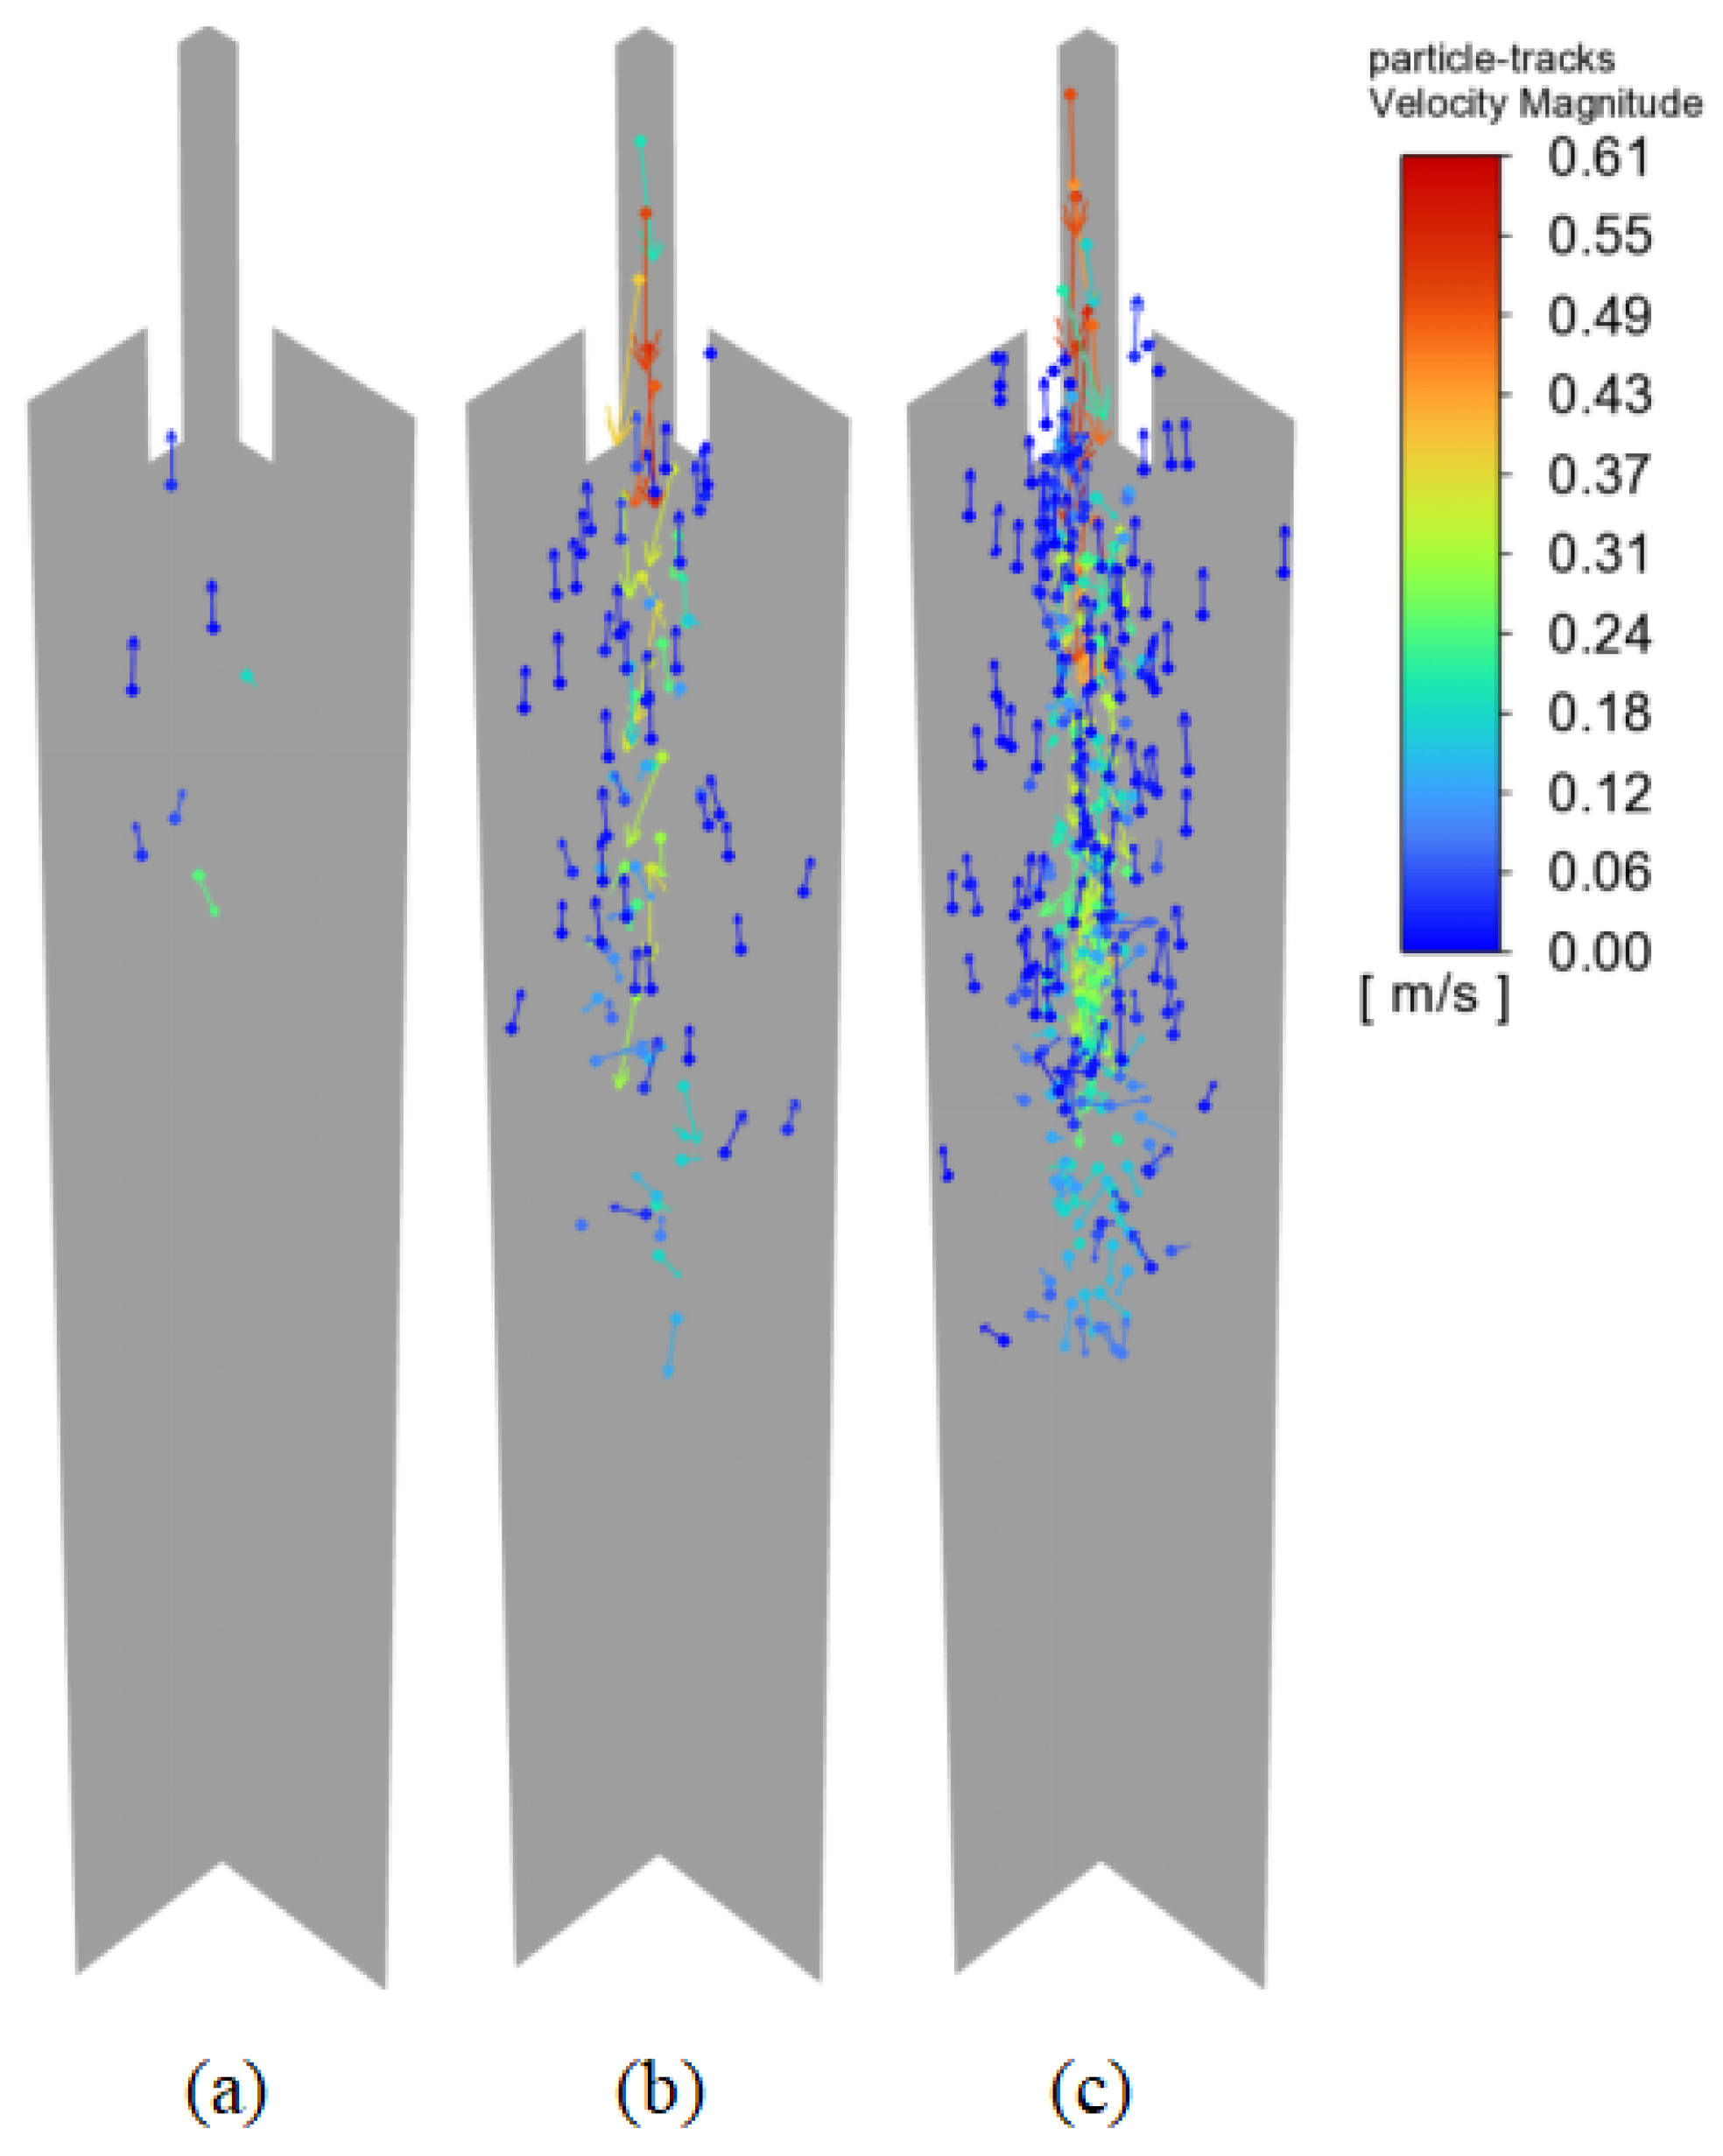
3.1.2. Effect of Argon Flow Rate on the Flow Field and Temperature Field

The distribution of argon bubbles at various argon flow rates is illustrated in Figure 6. As shown in the figure, with an increase in the argon flow rate, the number of argon bubbles retained in the molten steel steadily increases. The impact of the rising bubbles on the molten steel becomes increasingly significant, and the maximum depth reached by the argon bubble flow progressively increases. At argon flow rates of 0.50, 0.75, and 1.00 L·min−1, the maximum depths reached by the argon bubbles are 650 mm, 950 mm, and 1000 mm, respectively.
The velocity distribution on the symmetry planes (both narrow and wide faces) at various argon flow rates is presented in Figure 7. As observed from Figure 7(a1,b1,c1), the influence of the argon flow rate on the flow field is minimal. With an increase in the argon flow rate, the impact depth of the molten steel flow gradually diminishes. At argon flow rates of 0.50, 0.75, and 1.00 L·min−1, the impact depths of the molten steel flow are 330 mm, 322 mm, and 320 mm, respectively. As shown in Figure 7(a2,b2,c2), the distribution of the molten steel recirculation zone changes with varying argon flow rates. With an increase in the argon flow rate, the molten steel flow in the upper section of the crystallizer is slightly enhanced due to the upward force exerted by the rising argon bubbles.
The distribution of molten steel surface velocity at various argon flow rates is presented in Figure 8. As observed from the figure, the effect of argon flow rate on the surface velocity distribution is minimal. The average surface velocities at argon flow rates of 0.50, 0.75, and 1.00 L·min−1 are 0.024 m·s−1, 0.025 m·s−1, and 0.026 m·s−1, respectively. With an increase in the argon flow rate, the average surface velocity gradually increases.
The temperature distribution on the symmetry planes (narrow and wide faces) at various argon flow rates is presented in Figure 9. As seen in the figure, the effect of the argon flow rate on the temperature field in different regions of the crystallizer varies: the temperature distribution in the lower part of the molten steel is less affected, whereas the upper part experiences noticeable changes. As the argon flow rate increases, the flow and escape rate of the argon bubbles accelerate, thereby modifying the molten steel flow in the upper part of the crystallizer and disrupting the kinetic energy of the upward-flowing steel, leading to a reduction in the proportion of the high-temperature region on the crystallizer’s surface.
The temperature distribution of the molten steel surface at various argon flow rates is shown in Figure 10. As observed in the figure, the argon flow rate has a notable impact on the surface temperature distribution. The average surface temperatures at argon flow rates of 0.50, 0.75, and 1.00 L·min−1 are 1709.45 K, 1708.33 K, and 1703.74 K, respectively. As the argon flow rate increases, the average surface temperature gradually decreases. At an argon flow rate of 1.00 L·min−1, the surface temperature significantly decreases. The argon bubbles contribute to making the surface temperature distribution of the crystallizer more uniform.
If the argon flow rate is too low, it will fail to effectively remove inclusions; on the other hand, if the flow rate is too high, it will induce excessive fluctuations in the molten steel surface, which can cause slag entrapment. When the argon flow rate is between 0 and 0.50 L·min−1, the flow and heat transfer of molten steel are optimized.

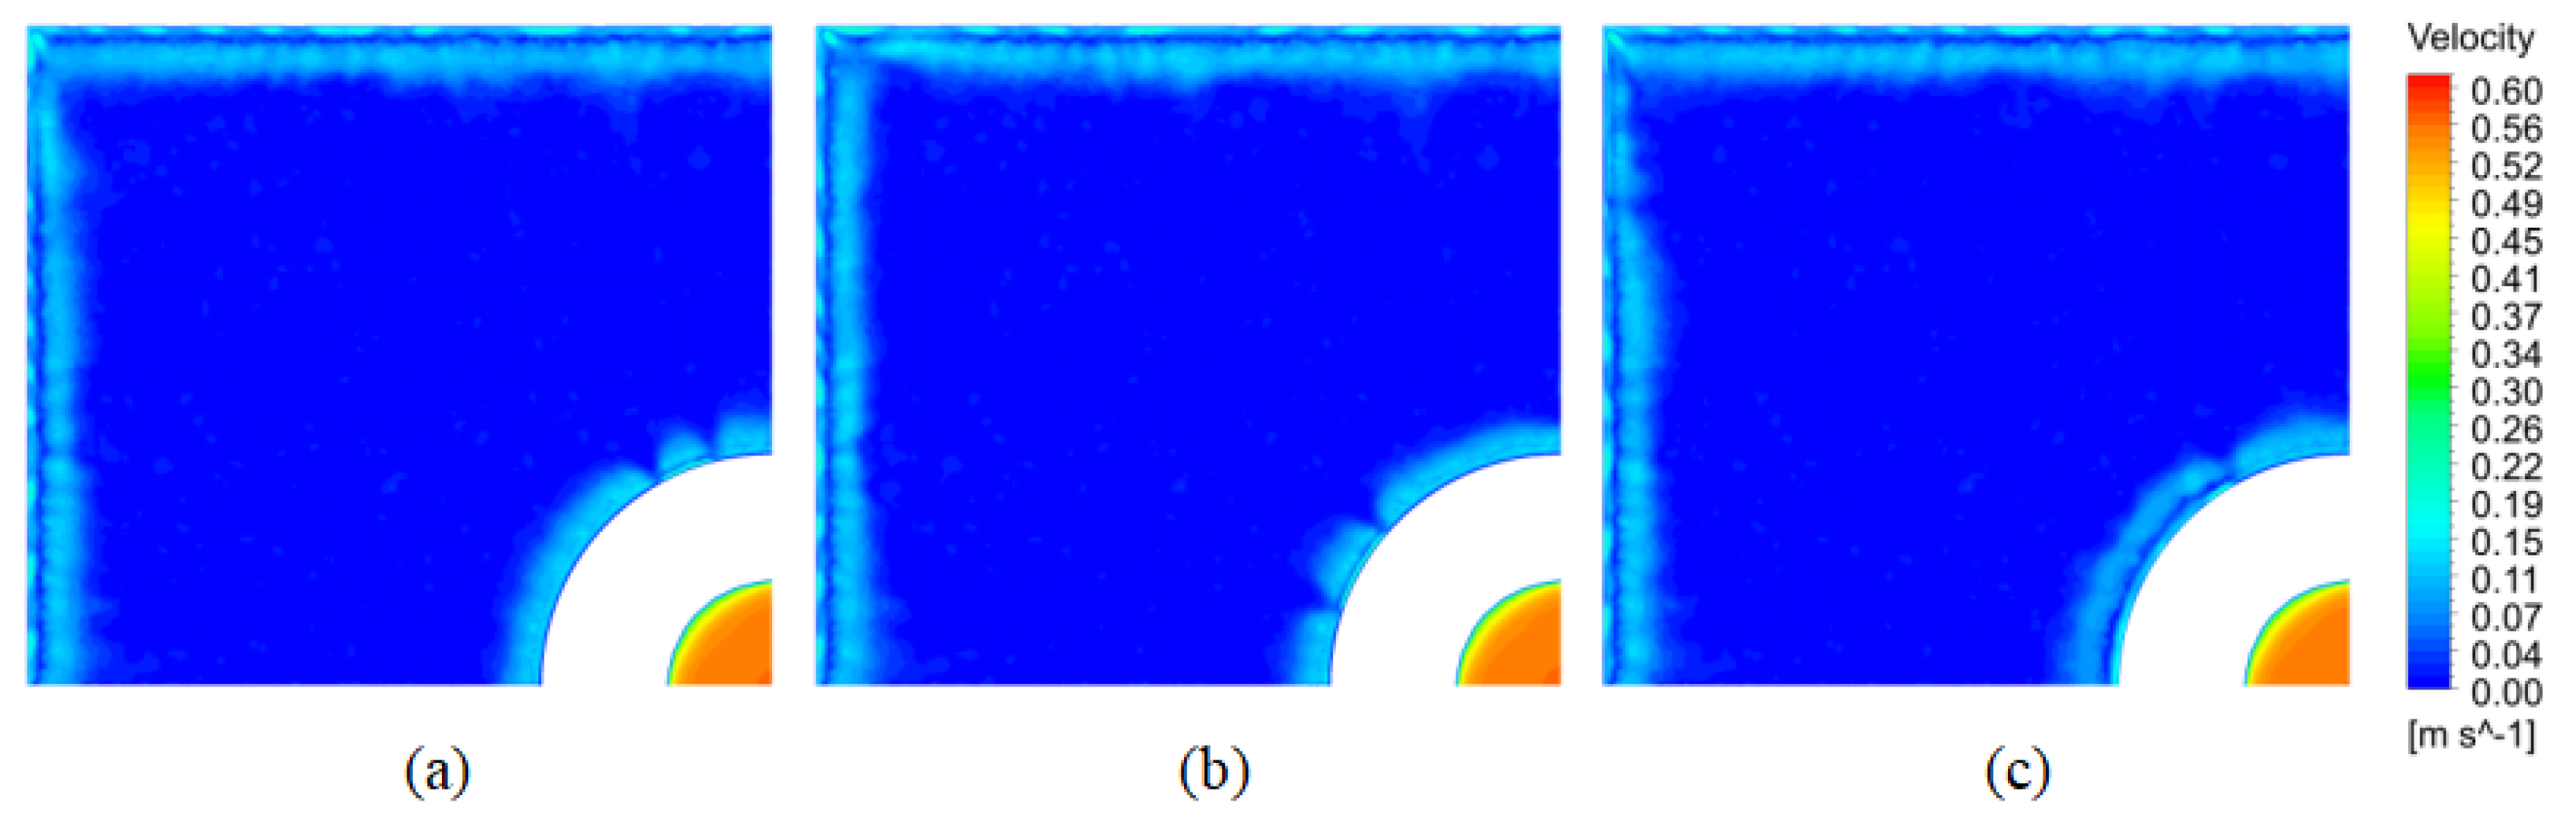
3.2. Flow and Heat Transfer of the Slag Layer

The optimal viscosity of the protective slag enables it to flow uniformly into the gap between the crystallizer wall and the billet shell, effectively acting as a lubricant. This reduces drawing resistance and prevents the billet shell from adhering to the crystallizer wall, thereby facilitating smooth billet demolding. Moreover, the lower density of the protective slag facilitates its smooth flow into the billet shell gap, while the increased number of internal pores helps prevent heat loss, thereby maintaining the temperature of the molten steel and promoting a more uniform solidification process. The flow of the slag layer is primarily influenced by the upper recirculation of molten steel. The behavior of the slag layer is mainly governed by the viscosity and density of the protective slag, which subsequently influences the heat transfer process and temperature distribution within the slag layer. As the properties of the protective slag change, significant changes in the behavior of the slag layer are observed.

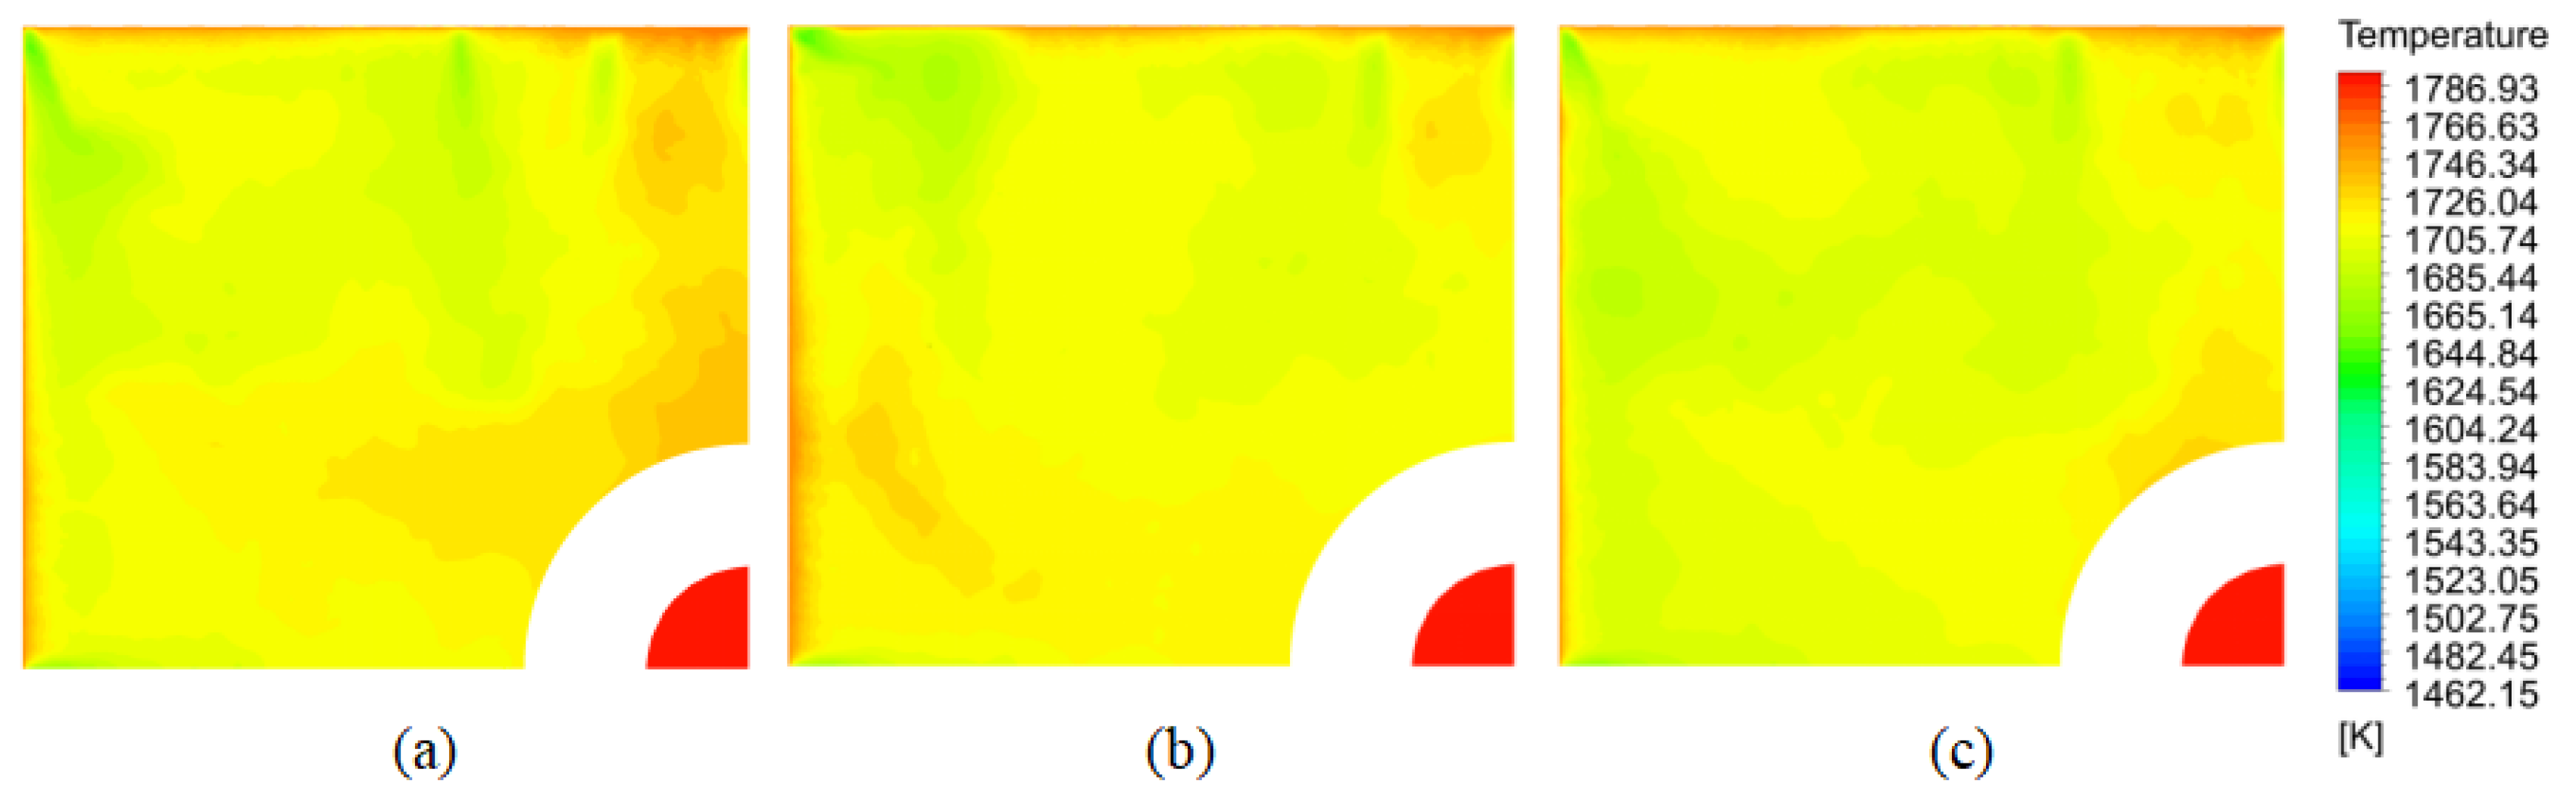
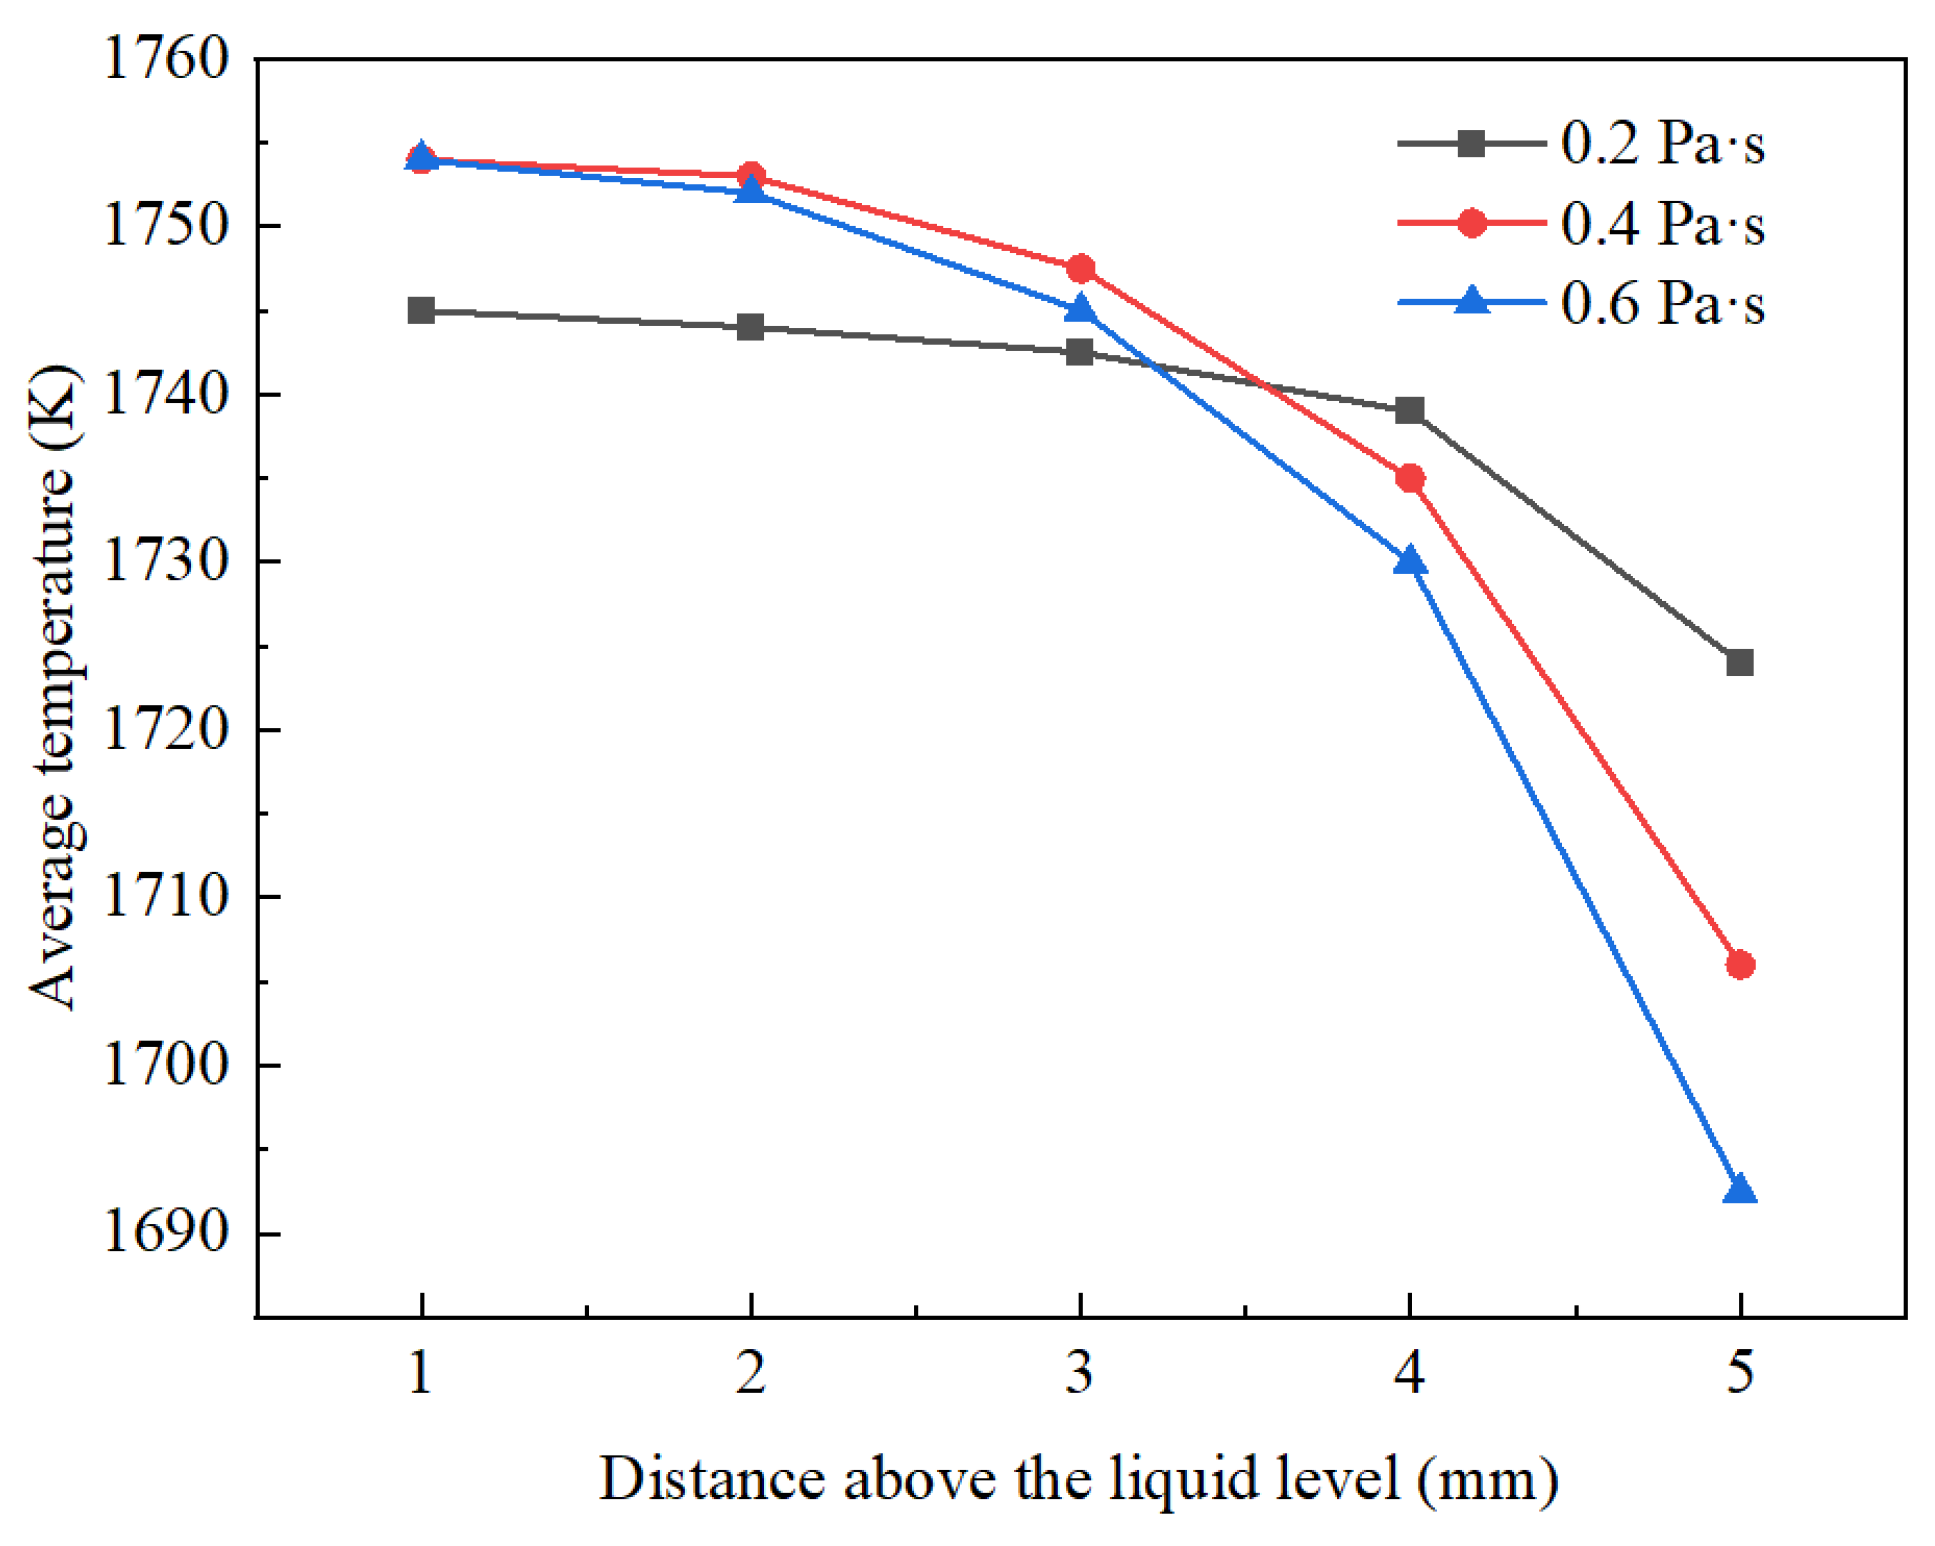
3.2.1. Effect of Protective Slag Viscosity on the Slag Layer

Figure 11 illustrates the velocity distribution within the slag layer (1–5 mm) at varying protective slag viscosities. As shown in the figure, the effect of protective slag viscosity on the location of the velocity distribution within the slag layer is relatively minor. With an increase in the viscosity of the protective slag, both the flow velocity and fluctuations of the slag at the same height gradually decrease. As the slag layer height increases from the liquid surface, the flow velocity of the slag decreases accordingly.
Figure 12 depicts the effect of protective slag viscosity on the velocity of the slag layer. As indicated in the figure, the trend of the average velocity within the slag layer remains largely unchanged across varying protective slag viscosities. As the height of the slag layer increases from the liquid surface, the slag velocity decreases in a linear fashion. For each 1 mm increase in height, the velocity decreases by an average of 0.0015 m·s−1. As the protective slag viscosity increases, the flow velocity of the slag at the same height gradually decreases. For every 0.2 Pa·s increase in viscosity, the velocity decreases by an average of 0.003 m·s−1.
Figure 13 illustrates the temperature distribution within the slag layer (1–5 mm) at varying protective slag viscosities. As shown in the figure, the viscosity of the protective slag significantly influences the temperature distribution within the slag layer. As the height of the slag layer increases from the liquid surface, the temperature gradient within the slag layer varies with different viscosities. The slag layers with viscosities of 0.2 Pa·s, 0.4 Pa·s, and 0.6 Pa·s display distinct temperature stratification at heights of 5 mm, 3 mm, and 1 mm, respectively. With an increase in the viscosity of the protective slag, the temperature distribution at the same height becomes increasingly uneven.
Figure 14 depicts the effect of protective slag viscosity on the temperature of the slag layer. As seen in the figure, the trend of the average temperature within the slag layer varies with different viscosities. As the height of the slag layer increases from the liquid surface, the temperature of the slag gradually decreases. When the distance from the liquid surface does not exceed 3 mm, the slag temperature is lowest at a viscosity of 0.2 Pa·s and highest at a viscosity of 0.4 Pa·s. When the distance from the liquid surface exceeds 4 mm, the slag temperature decreases as the viscosity of the protective slag increases. In conclusion, when the viscosity is between 0.2 and 0.4 Pa·s, the flow and heat transfer performance of the protective slag is more efficient.

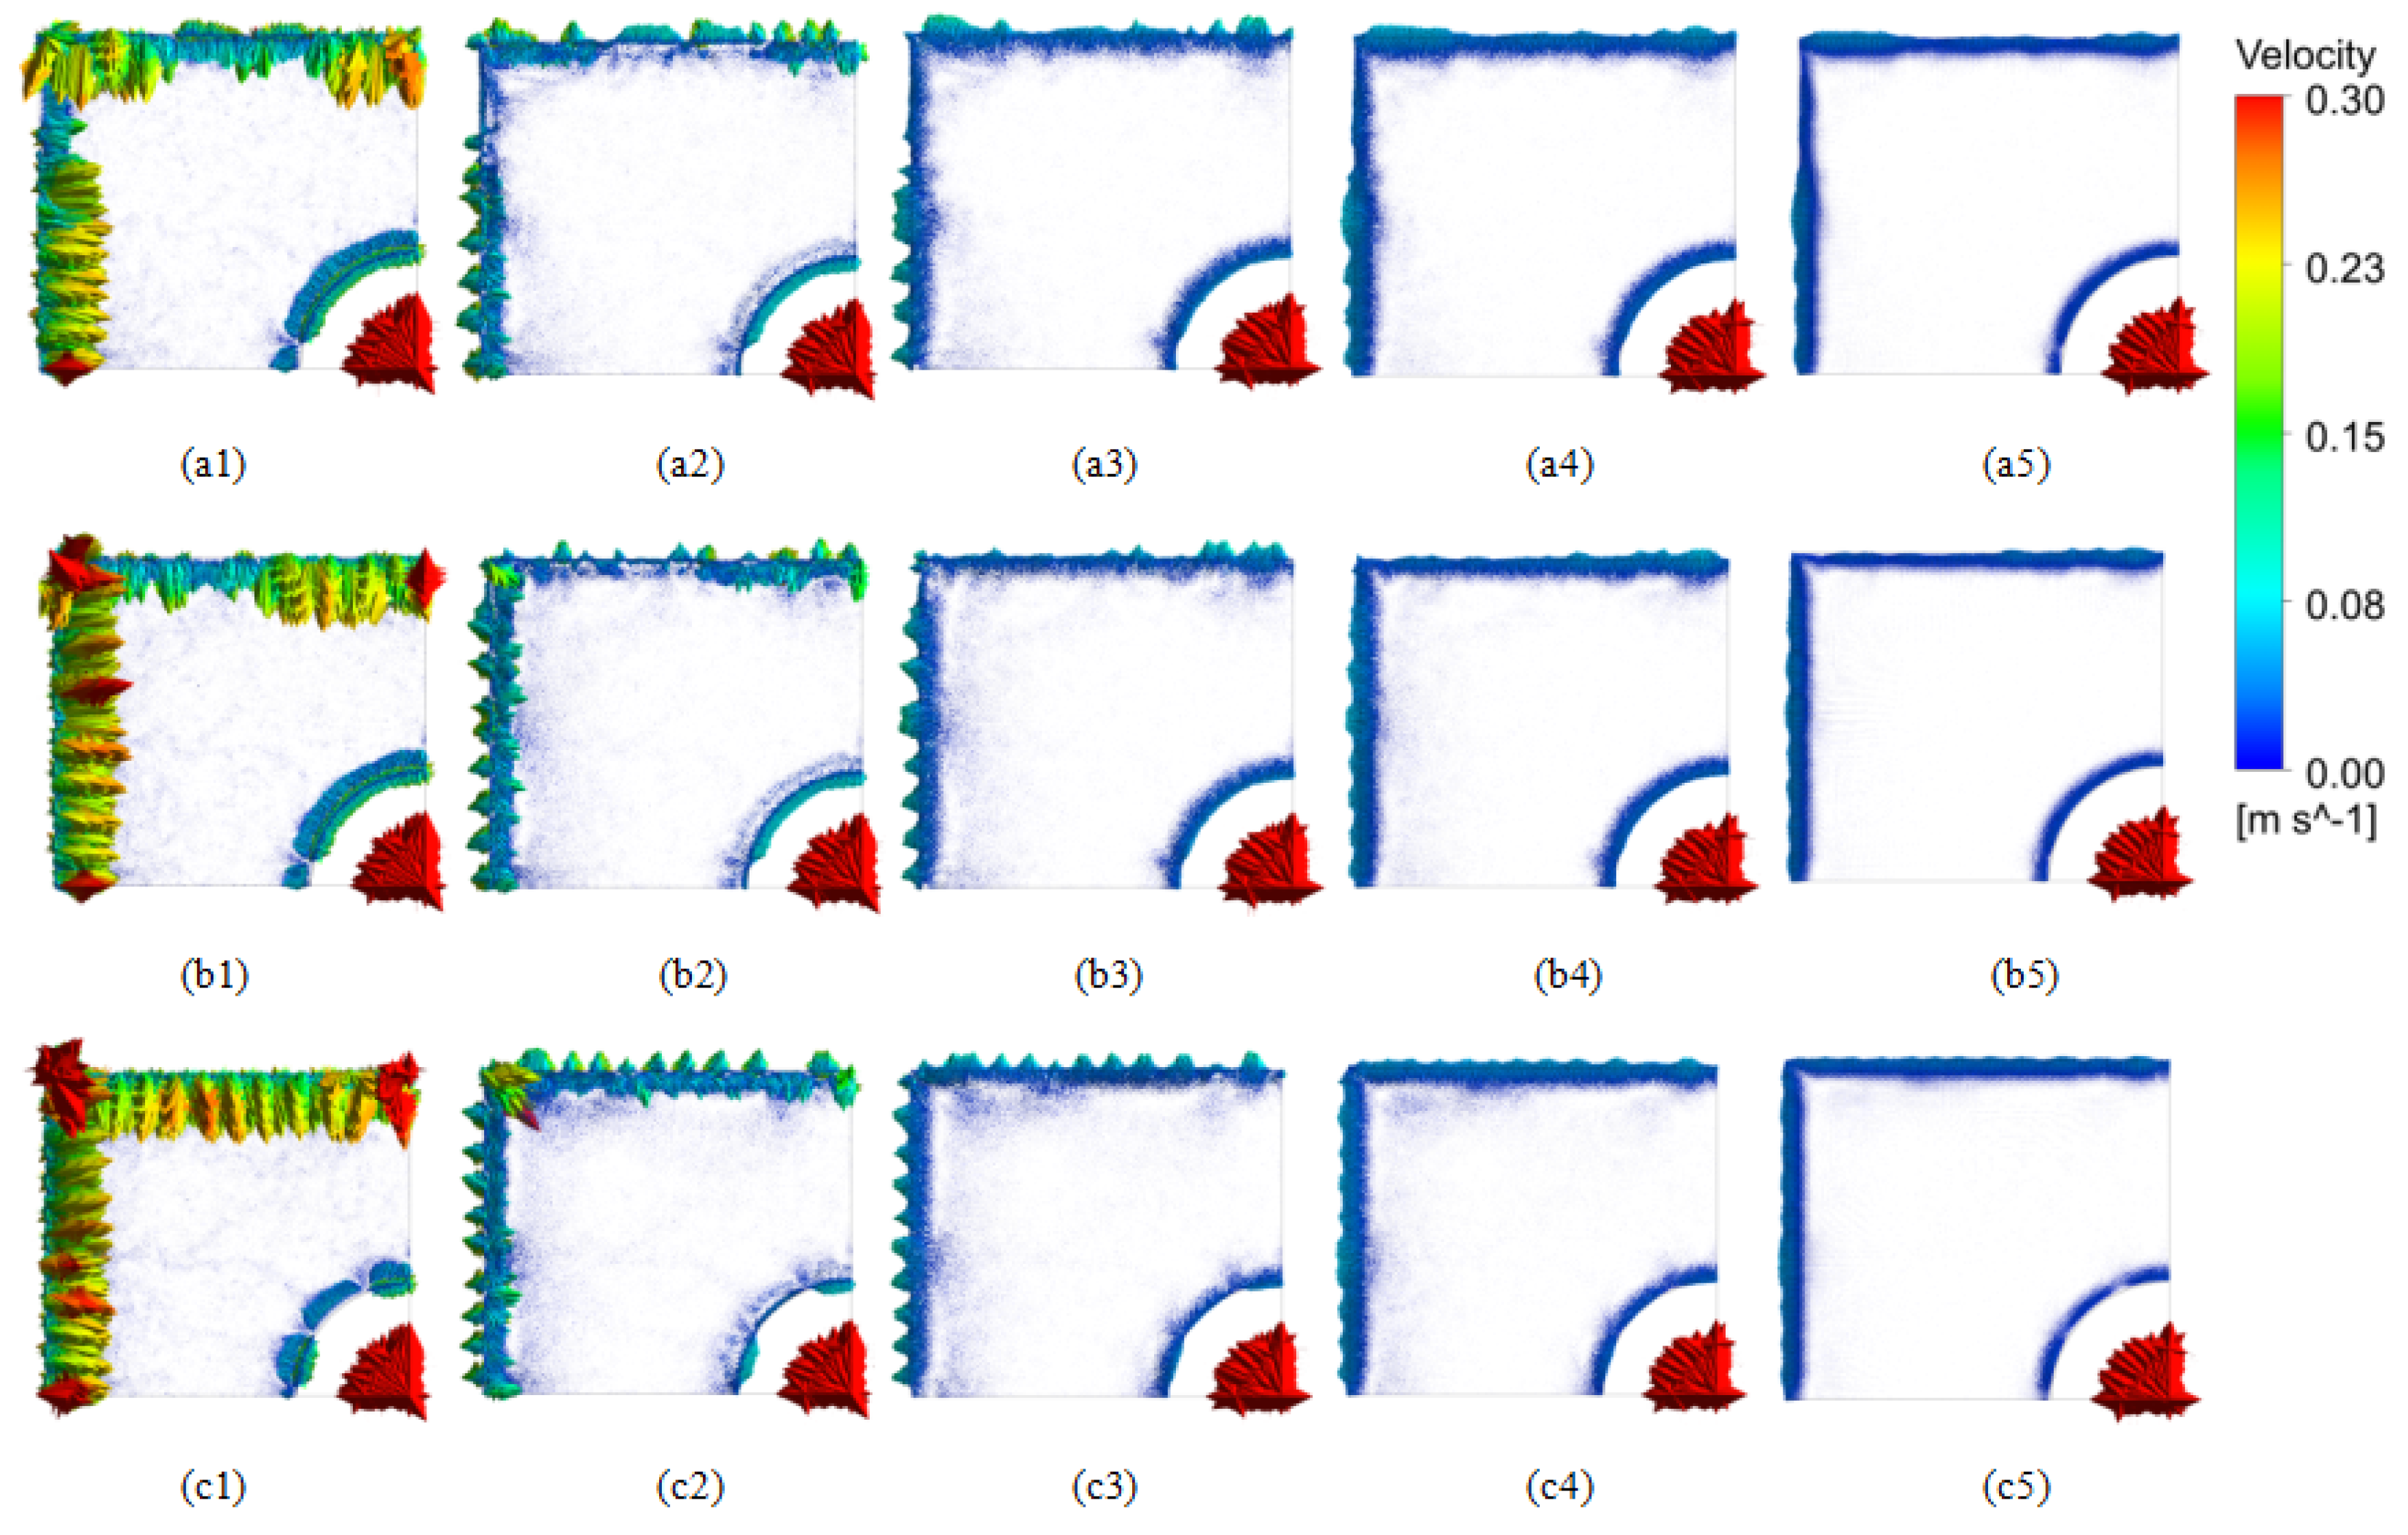
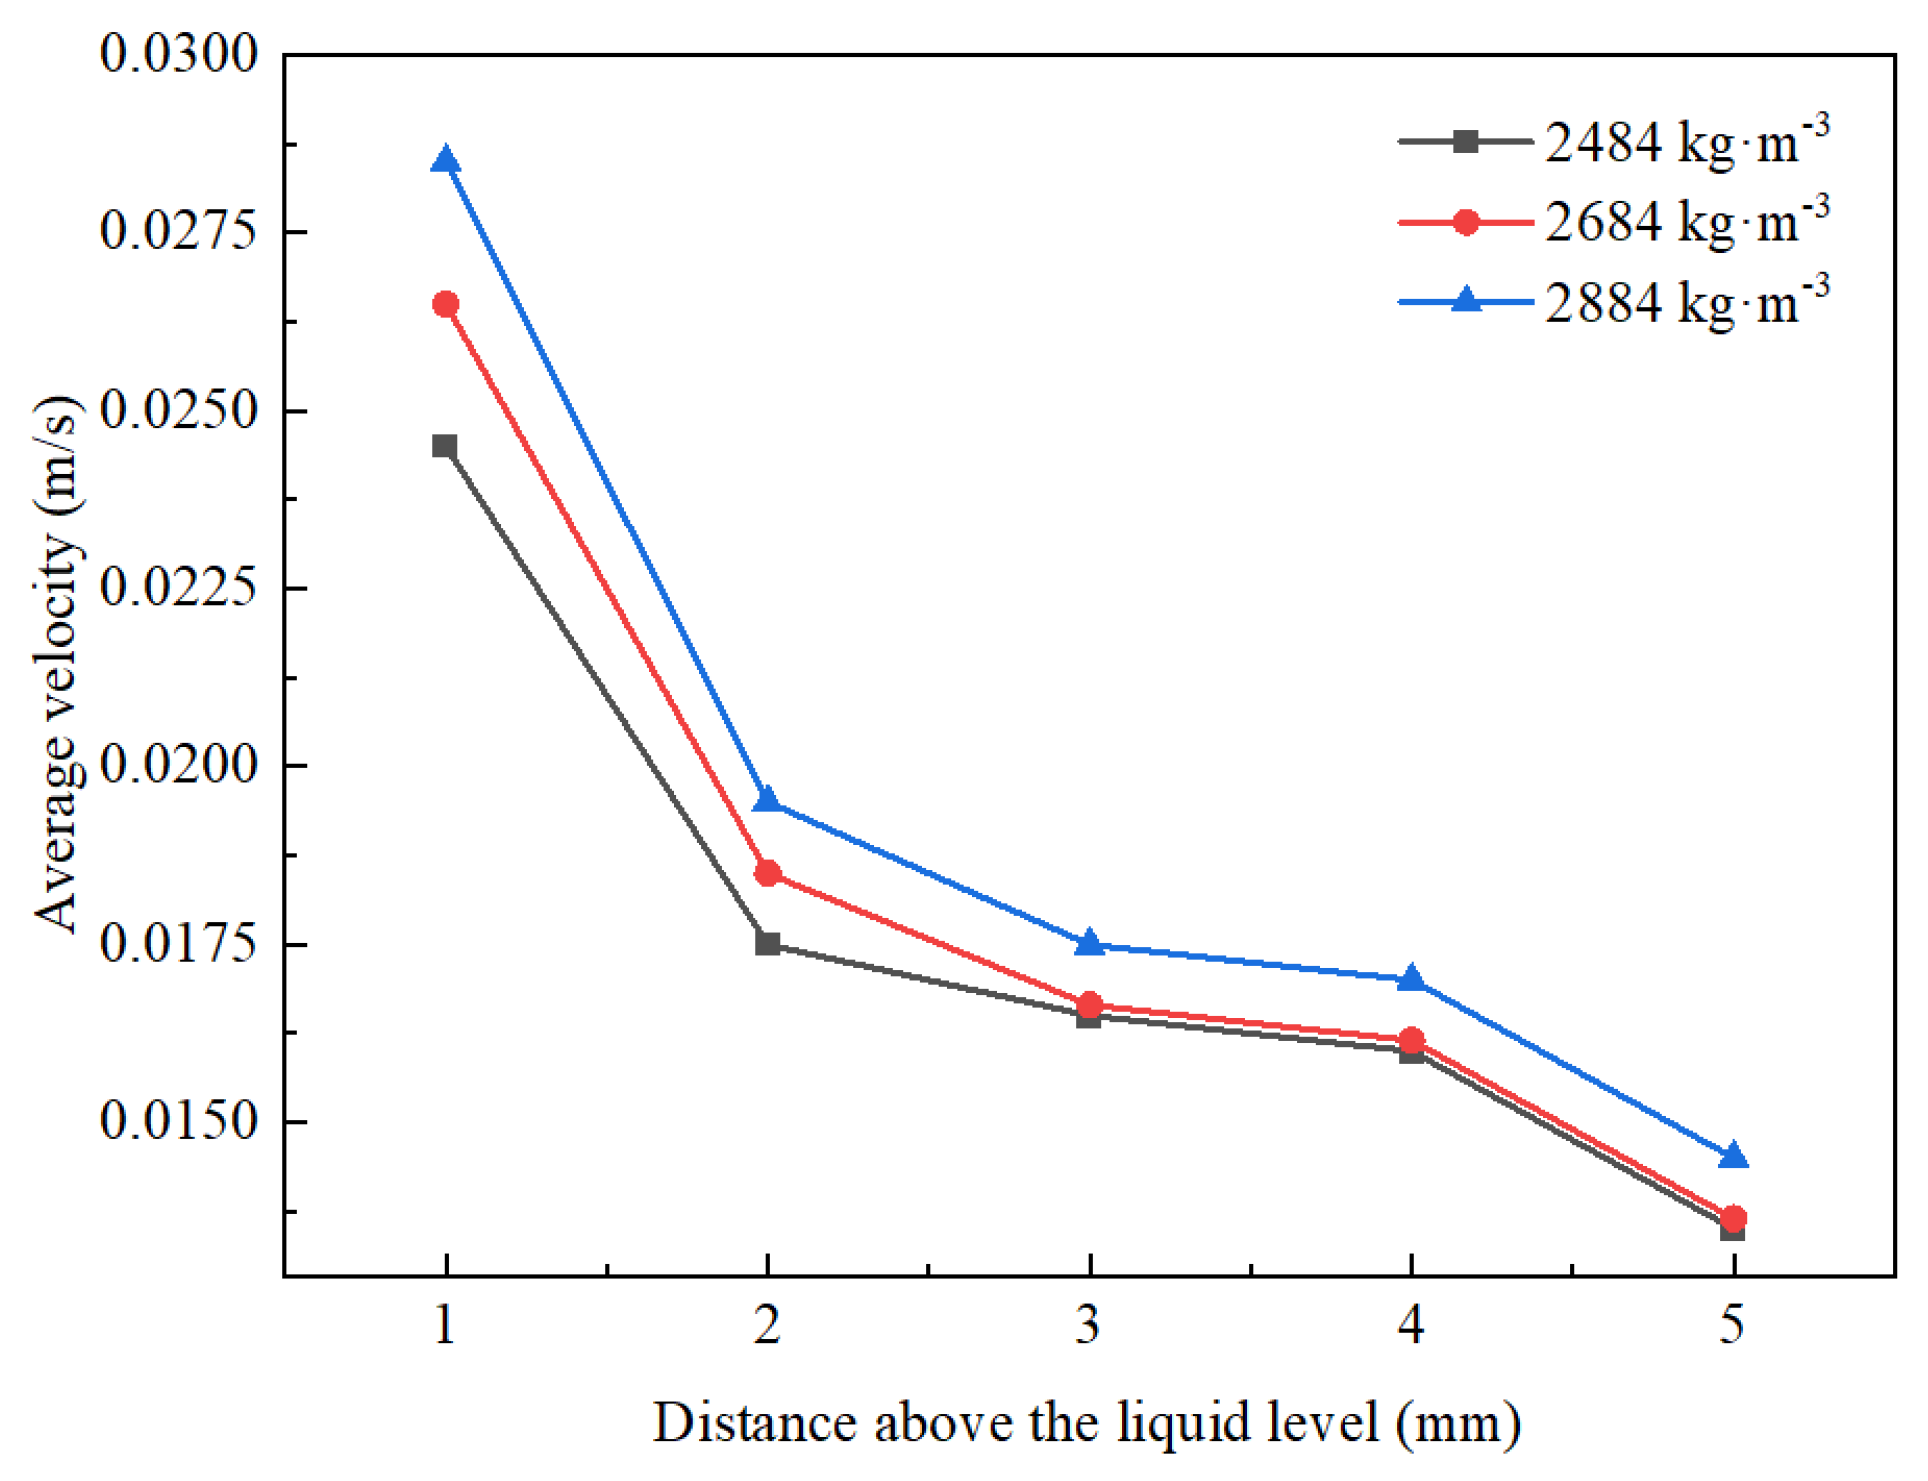
3.2.2. The Effect of Protective Slag Density on the Slag Layer

Figure 15 illustrates the velocity distribution within the slag layer (1–5 mm) at varying protective slag densities. As observed in the figure, the velocity distribution of the slag layer remains similar across different densities. As the density of the protective slag increases, both the flow velocity and the degree of fluctuation at the same height gradually rise. As the height of the slag layer increases from the liquid surface, the flow velocity of the slag decreases.
Figure 16 depicts the effect of protective slag density on the velocity of the slag layer. As observed in the figure, the trend of the average velocity of the slag layer remains relatively constant across different densities. With an increase in the density of the protective slag, the flow velocity at the same height gradually rises. As the distance from the liquid surface increases, the slag velocity progressively decreases. In particular, within the first 1 to 2 mm above the liquid surface, the velocity decreases more rapidly, while in the range of 2 to 5 mm above the liquid surface, the velocity decreases at a slower rate.
Figure 17 illustrates the temperature distribution of the slag layer within the 1–5 mm range at varying protective slag densities. As depicted in the figure, the temperature distribution of the slag layer across different protective slag densities is relatively similar, with the slag temperature gradually decreasing as the protective slag density increases. As the slag moves further away from the liquid surface, the slag temperature continues to decrease. The temperature stratification within the slag layer remains largely unchanged under different protective slag densities.
Figure 18 illustrates the effect of protective slag density on the temperature of the slag layer. As shown in the figure, the trend of the average temperature change within the slag layer is essentially consistent across different protective slag densities. As the protective slag density increases, the slag temperature gradually decreases, and with the increasing distance from the liquid surface, the slag temperature continues to decline. When the distance from the liquid surface is less than or equal to 3 mm, the temperature decreases more gradually; however, beyond 3 mm, the temperature decreases at a faster rate.
The flow inertia within the crystallizer and the static pressure exerted on the liquid surface vary with different protective slag densities, influencing the morphology, flow behavior, and stability of the molten steel surface. When the protective slag density ranges from 2484 to 2684 kg·m−3, the flow and heat transfer behavior of the slag layer is more efficient and rational.

4. Conclusions

1.
Reducing the drawing speed to 0.35–0.45 m·min−1 more effectively reduces the impact velocity, impact depth, surface velocity, and temperature gradient while improving the uniformity of the liquid surface temperature. This helps prevent slag entrainment at the liquid surface, inadequate slag flow and melting, as well as uneven solidification of the shell. To some extent, this also leads to a more uniform and finer internal structure in large billets of special steel;
2.
The upward movement of argon bubbles disrupts the upper recirculation zone of the molten steel. As the argon injection increases, it directly alters the recirculation trajectory of the molten steel, lowering the liquid surface temperature and increasing the risk of slag entrainment. In the continuous casting process of large billets of special steel, a smaller or even no argon flow is more beneficial for maintaining proper flow and heat transfer at the liquid surface;
3.
A higher viscosity of the protective slag increases its flow resistance, resulting in an uneven temperature distribution within the slag layer and potentially causing dead zones and stratification. Lower viscosity enhances the fluidity of molten protective slag and its convective heat transfer performance; however, it also results in weaker resistance to shear deformation, which can lead to larger fluctuations on the molten steel surface and increase slag entrainment. Protective slag viscosity between 0.2 and 0.4 Pa·s ensures a more optimal flow and heat transfer within the crystallizer;
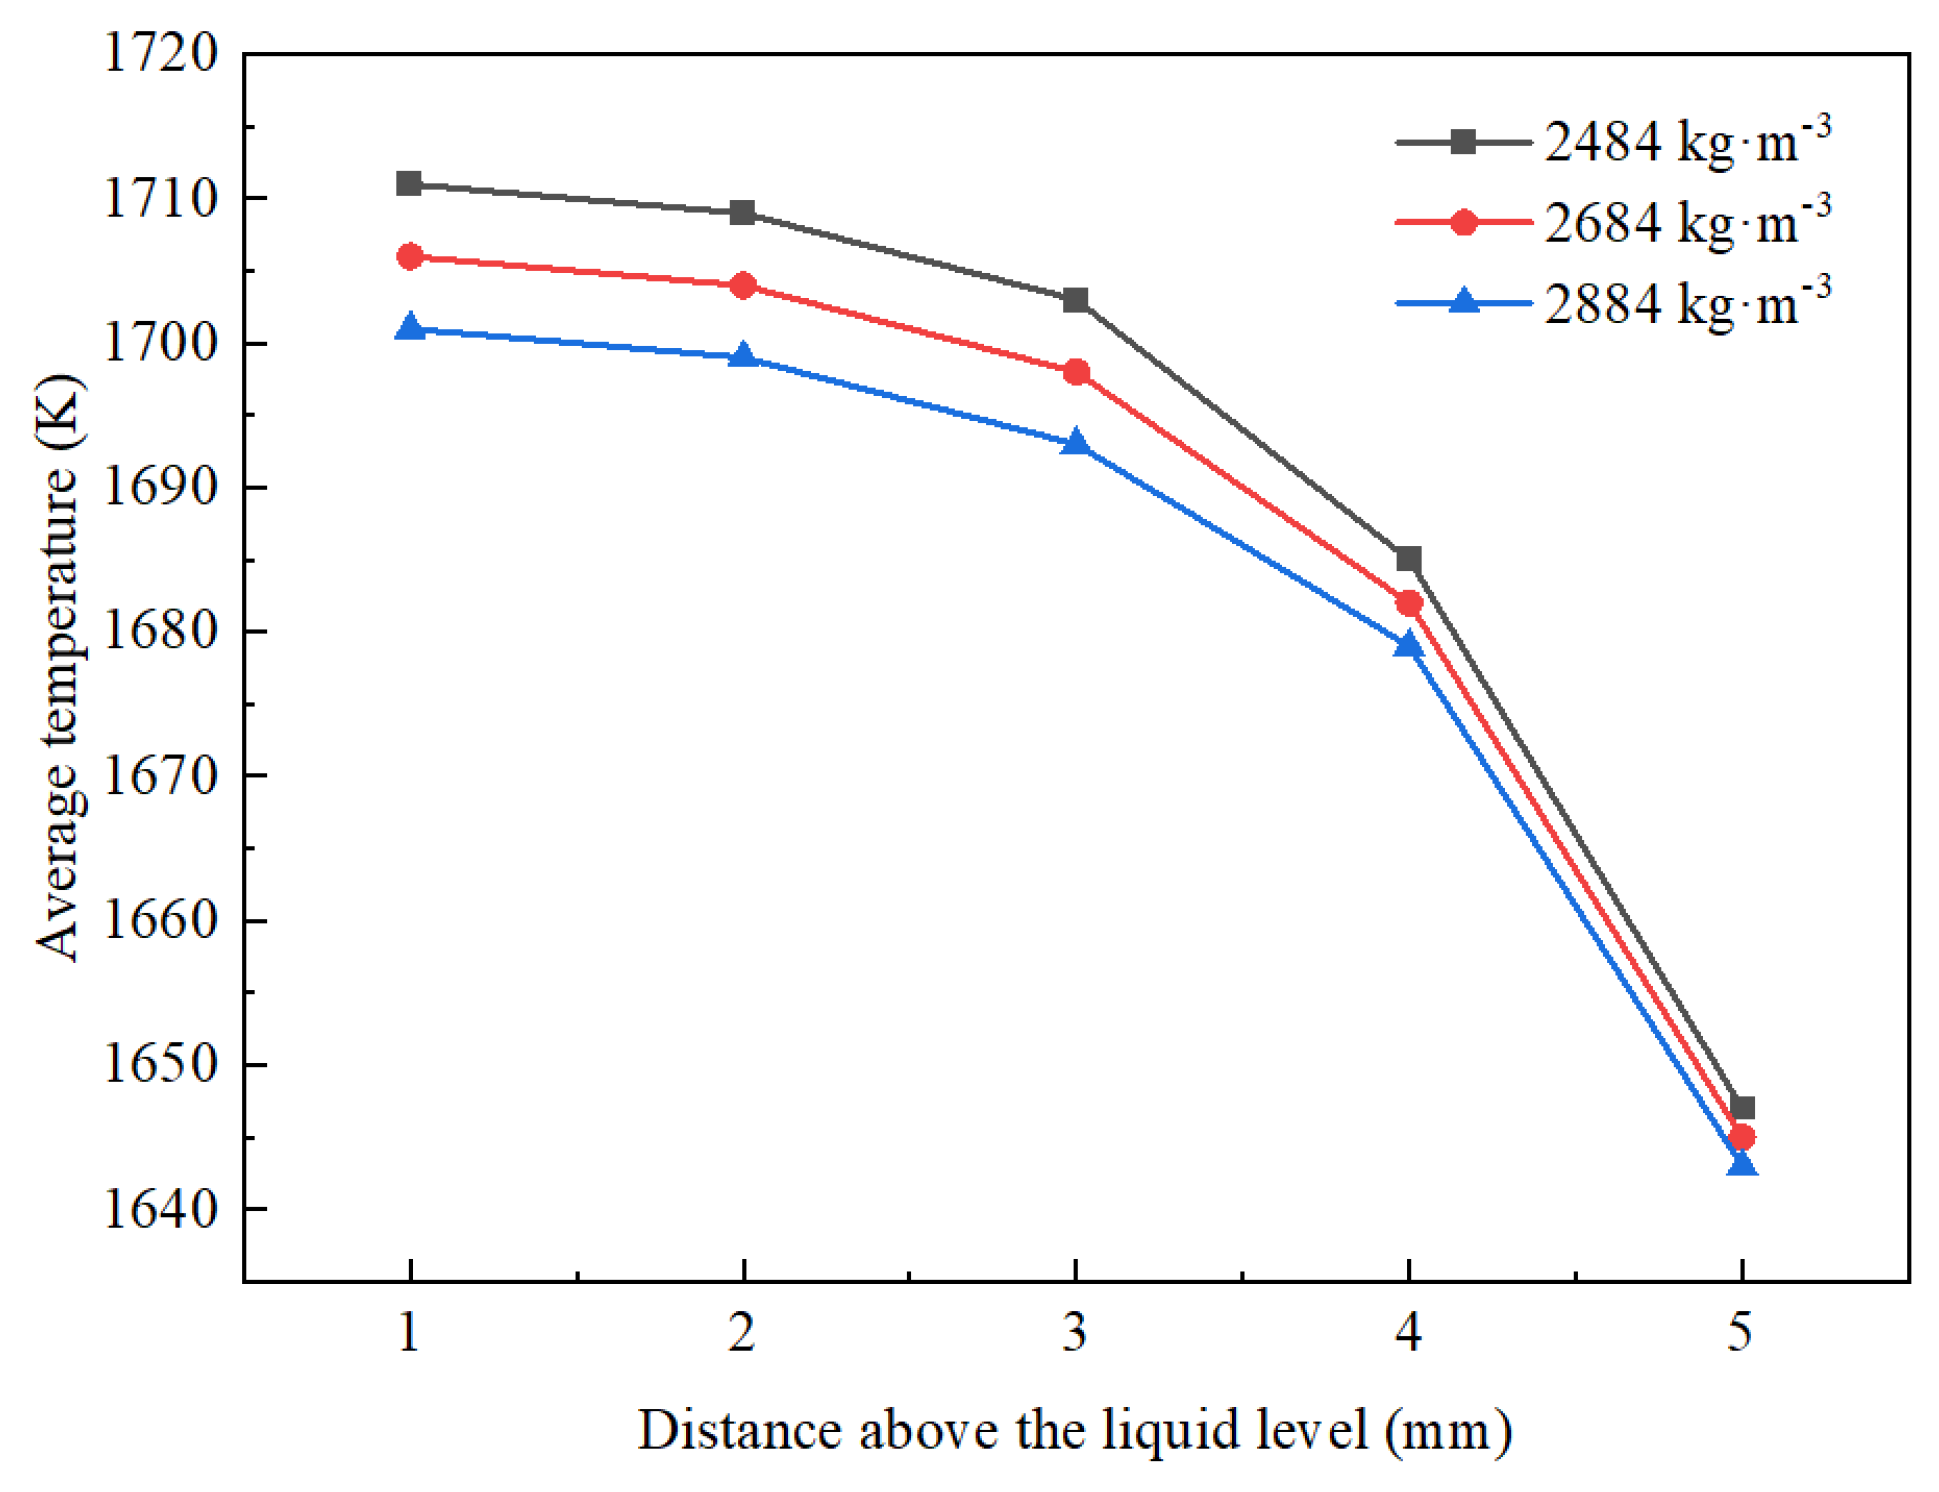
4.
Protective slags with different densities exhibit varying flow inertias in the crystallizer and exert different static pressures on the molten steel surface, thereby influencing the morphology, flow state, and stability of the molten steel surface. This also impacts the temperature gradient within the slag layer and the rate of heat transfer. Protective slags with densities ranging from 2484 to 2684 kg·m−3 exhibit better flow and heat transfer performance.

Author Contributions

Conceptualization, Z.D., C.W., X.W. and P.X.; methodology, Z.D., C.W. and X.W.; software, C.W. and X.W.; validation, Z.D., P.X. and L.Z.; formal analysis, Z.D., P.X. and L.Z.; investigation, Z.D., P.X., L.Z. and S.W.; resources, L.Z. and S.W.; data curation, Z.D., C.W. and P.X.; writing—original draft preparation, Z.D., C.W. and X.W.; writing—review and editing, P.X., L.Z. and S.W.; visualization, Z.D., C.W. and X.W.; supervision, L.Z. and S.W.; project administration, P.X. and L.Z. All authors have read and agreed to the published version of the manuscript.

Funding

This research was supported by the National Key Fund Projects of China (No. U21A20114), the National Natural Science Foundation of China (No. 24461002D), the Hebei Provincial Science and Technology Programme of China (No. 23561007D), and the Hebei Province natural science Foundation key project (No. E2022208019).

Data Availability Statement

The data presented in this study are available on request from the corresponding author. The data are not publicly available due to privacy restrictions.

Acknowledgments

The author acknowledges the HBIS Company Limited and Steel Laboratory of Hebei Province in this study. Their generous sponsorship and technical support provided crucial resources for experiments, significantly advancing the progress and outcomes of the research.

Conflicts of Interest

Author Zhijun Ding was employed by the company HBIS Group ShiSteel Company, Xin Wang was employed by the company Jiangyou Changcheng Special Steel Co., Ltd. of Panggang Group. The remaining authors declare that the research was conducted in the absence of any commercial or financial relationships that could be construed as a potential conflict of interest.

References

  1. Liu, Q.; Qu, Z.; Chen, F.; Liu, X.; Wang, G. Review of the Development of an Unbonded Flexible Riser: New Material, Types of Layers, and Cross-Sectional Mechanical Properties. Materials 2024, 17, 2560. [Google Scholar] [CrossRef] [PubMed]
  2. Zhang, Z.; Wang, D.; Liu, G.; Qian, Y.; Xu, Y.; Xiang, D. Surface Modification of 42CrMo Steels: A Review from Wear and Corrosion Resistance. Coatings 2024, 14, 337. [Google Scholar] [CrossRef]
  3. Dolzhenko, A.; Tikhonova, M.; Kaibyshev, R.; Belyakov, A. Microstructures and Mechanical Properties of Steels and Alloys Subjected to Large-Strain Cold-to-Warm Deformation. Metals 2022, 12, 454. [Google Scholar] [CrossRef]
  4. Zaitsev, A.; Arutyunyan, N. Low-Carbon Ti-Mo Microalloyed Hot Rolled Steels: Special Features of the Formation of the Structural State and Mechanical Properties. Metals 2021, 11, 1584. [Google Scholar] [CrossRef]
  5. Kozłowska, A.; Grzegorczyk, B.; Morawiec, M.; Grajcar, A. Explanation of the PLC Effect in Advanced High-Strength Medium-Mn Steels. A Review. Materials 2019, 12, 4175. [Google Scholar] [CrossRef]
  6. Yang, L. China steelmaking technology progress in the 13th five-year plan and prospection. Iron Steel 2022, 57, 1–10. [Google Scholar] [CrossRef]
  7. Ohno, H.; Fukushima, Y.; Matsubae, K.; Nakajima, K.; Nagasaka, T. Revealing final destination of special steel materials with input-output-based material flow analysis. ISIJ Int. 2017, 57, 193–199. [Google Scholar] [CrossRef]
  8. Bjorhovde, R. Performance and design issues for high strength steel in structures. Adv. Struct. Eng. 2010, 13, 403–411. [Google Scholar] [CrossRef]
  9. Xia, S.; Wang, P.; Tang, Q.; Li, W.; Hu, K.; Zhang, J. Solidified end characteristics and center quality control of bearing steel bloom. Iron Steel 2024, 59, 99–110. [Google Scholar] [CrossRef]
  10. Lan, P.; Su, C.; Ai, H. Solidification Structure and Segregation in Billet Continuous Casting Under High Casting Speed for Alloyed Steel. Metall. Mater. Trans. B 2024, 55, 5093–5109. [Google Scholar] [CrossRef]
  11. Fredriksson, H. On the solidification of steel ingots and continuously cast steel billets and slabs. Can. Metall. Q. 1991, 30, 235–244. [Google Scholar] [CrossRef]
  12. Ma, F.; Liu, Q.; Zhang, J.; Wang, C.; Sun, J.; Li, M. Influence of jet characteristics nozzle on penetration behavior to vapor film in secondary cooling zones of continuous casting. Iron Steel 2022, 57, 101–109. [Google Scholar] [CrossRef]
  13. Yuan, Z.; Zhu, L.; Wang, X.; Wang, B.; Zhang, Y. Shear-thinning property of mold flux for thin slab continuous casting with high casting speed. Iron Steel 2022, 57, 97–108. [Google Scholar] [CrossRef]
  14. Liu, W.; Ren, L. Influence of outlet angle for submerged entry nozzle on fluid flow in a wide slab casting mold. Iron Steel 2022, 57, 83–92. [Google Scholar] [CrossRef]
  15. Hu, W.; Ji, C.; Zhu, M. Numerical simulation of continuous casting round blooms with different solidification end reduction strategies. Metall. Mater. Trans. B 2021, 52, 4130–4140. [Google Scholar] [CrossRef]
  16. Liu, H.; Chen, Y.; Qiu, H.; Wang, Z. Numerical simulation of coupled fluid flow and solidification in a curved round bloom continuous caster with a combined rotary electromagnetic stirring. Ironmak. Steelmak. 2022, 49, 506–521. [Google Scholar] [CrossRef]
  17. Qiu, D.; Zhang, Z.; Li, X.; Lv, M.; Mi, X.; Xi, X. Numerical Simulation of the Flow Field in an Ultrahigh-Speed Continuous Casting Billet Mold. Metals 2023, 13, 964. [Google Scholar] [CrossRef]
  18. An, H.; Bao, Y.; Wang, M.; Zhao, L. Effects of electromagnetic stirring on fluid flow and temperature distribution in billet continuous casting mould and solidification structure of 55SiCr. Metall. Res. Technol. 2018, 115, 103. [Google Scholar] [CrossRef]
  19. Yang, J.; Chen, D.; Long, M.; Duan, H. Transient flow and mold flux behavior during ultra-high speed continuous casting of billet. J. Mater. Res. Technol. 2020, 9, 3984–3993. [Google Scholar] [CrossRef]
  20. Yang, J.; Chen, D.; Qin, F.; Long, M.; Duan, H. Melting and Flowing Behavior of Mold Flux in a Continuous Casting Billet Mold for Ultra-High Speed. Metals 2020, 10, 1165. [Google Scholar] [CrossRef]
  21. Vakhrushev, A.; Kharicha, A.; Wu, M.; Ludwig, A.; Tang, Y.; Hackl, G.; Nitzl, G.; Watzinger, J.; Bohacek, J. On Modelling Parasitic Solidification Due to Heat Loss at Submerged Entry Nozzle Region of Continuous Casting Mold. Metals 2021, 11, 1375. [Google Scholar] [CrossRef]
  22. Ma, J.C.; Sun, H.Z.; Wang, X.B.; Lv, X. Numerical simulation of billet continuous casting solidification based on the measurement of shell thickness and surface temperature. Appl. Mech. Mater. 2011, 80, 81–85. [Google Scholar] [CrossRef]
  23. Yang, J.; Xie, Z.; Meng, H.; Hu, Z.; Liu, W.; Ji, Z. A three dimensional real-time heat transfer model for continuous casting blooms. ISIJ Int. 2023, 63, 1360–1372. [Google Scholar] [CrossRef]
  24. Fang, Q.; Ni, H.; Zhang, H.; Lv, Z. The Effects of a Submerged Entry Nozzle on Flow and Initial Solidification in a Continuous Casting Bloom Mold with Electromagnetic Stirring. Metals 2017, 7, 146. [Google Scholar] [CrossRef]
  25. Ren, B.Z.; Chen, D.F.; Wang, H.D.; Long, M.; Han, Z. Numerical simulation of fluid flow and solidification in bloom continuous casting mould with electromagnetic stirring. Ironmak. Steelmak. 2015, 42, 401–408. [Google Scholar] [CrossRef]
  26. Hirt, C.W.; Nichols, B.D. Volume of fluid (VOF) method for the dynamics of free boundaries. J. Comput. Phys. 1981, 39, 201–225. [Google Scholar] [CrossRef]
  27. Hrenya, C.M.; Bolio, E.J.; Chakrabarti, D.; Sinclair, J.L. Comparison of low Reynolds number k-ϵ turbulence models in predicting fully developed pipe flow. Chem. Eng. Sci. 1995, 50, 1923–1941. [Google Scholar] [CrossRef]
  28. Chattopadhyay, K.; Isac, M.; Guthrie, R.I.L. Considerations in using the discrete phase model (DPM). Steel Res. Int. 2019, 82, 1287–1289. [Google Scholar] [CrossRef]
  29. Mingtao, X.; Min, C. Numerical Simulation for Two-Phase Flow, Heat Transfer, and Inclusion Transport in Bloom Mold Considering the Effects of Argon Gas Injection and Mold Electromagnetic Stirring. Steel Res. Int. 2022, 93, 2100848. [Google Scholar] [CrossRef]
Figure 1. Computing domain and meshing.
Crystals 15 00388 g001
Figure 2. Velocity distribution of symmetric plane (narrow plane and wide plane) at different casting speeds. (a1,a2) 0.35 m·min−1. (b1,b2) 0.45 m·min−1. (c1,c2) 0.55 m·min−1. (d1,d2) 0.65 m·min−1. (e1,e2) 0.75 m·min−1.
Crystals 15 00388 g002
Figure 3. Surface velocity distribution of liquid steel at different casting speeds. (a) 0.35 m·min−1. (b) 0.45 m·min−1. (c) 0.55 m·min−1. (d) 0.65 m·min−1. (e) 0.75 m·min−1.
Crystals 15 00388 g003
Figure 4. Temperature distribution of symmetric plane (narrow surface and wide surface) at different casting speeds. (a) 0.35 m·min−1. (b) 0.45 m·min−1. (c) 0.55 m·min−1. (d) 0.65 m·min−1. (e) 0.75 m·min−1.
Crystals 15 00388 g004
Figure 5. Temperature distribution of liquid steel surface at different casting speeds. (a) 0.35 m·min−1. (b) 0.45 m·min−1. (c) 0.55 m·min−1. (d) 0.65 m·min−1. (e) 0.75 m·min−1.
Crystals 15 00388 g005
Figure 6. Argon bubble distribution at different amounts of argon blowing. (a) 0.50 L·min−1. (b) 0.75 L·min−1. (c) 1.00 L·min−1.
Crystals 15 00388 g006
Figure 7. Velocity distribution of symmetric plane (narrow surface and wide surface) at different argon blowing quantities. (a1,a2) 0.50 L·min−1. (b1,b2) 0.75 L·min−1. (c1,c2) 1.00 L·min−1.
Crystals 15 00388 g007
Figure 8. Surface velocity distribution of liquid steel at different argon blowing quantities. (a) 0.50 L·min−1. (b) 0.75 L·min−1. (c) 1.00 L·min−1.
Crystals 15 00388 g008
Figure 9. Temperature distribution of symmetric plane (narrow surface and wide surface) at different argon blowing quantities. (a) 0.50 L·min−1. (b) 0.75 L·min−1. (c) 1.00 L·min−1.
Crystals 15 00388 g009
Figure 10. Temperature distribution of liquid steel surface at different argon blowing quantities. (a) 0.50 L·min−1. (b) 0.75 L·min−1. (c) 1.00 L·min−1.
Crystals 15 00388 g010
Figure 11. Velocity distribution of liquid slag layer at different viscosity levels of mold powders (different heights). (a1a5) Corresponding to 1–5 mm at 0.2 Pa·s. (b1b5) Corresponding to 1–5 mm at 0.4 Pa·s. (c1c5) Corresponding to 1–5 mm at 0.6 Pa·s.
Crystals 15 00388 g011
Figure 12. Effect of viscosity of mold powder on velocity of liquid slag layer.
Crystals 15 00388 g012
Figure 13. Temperature distribution of liquid slag layer at different viscosity levels of mold powders (different heights). (a1a5) Corresponding to 1–5 mm at 0.2 Pa·s. (b1b5) Corresponding to 1–5 mm at 0.4 Pa·s. (c1c5) Corresponding to 1–5 mm at 0.6 Pa·s.
Crystals 15 00388 g013
Figure 14. Effect of viscosity of mold powder on temperature of liquid slag layer.
Crystals 15 00388 g014
Figure 15. Velocity distribution of liquid slag layer at different density of mold powders (different heights). (a1a5) Corresponding to 1–5 mm at 2484 kg·m−3. (b1b5) Corresponding to 1–5 mm at 2684 kg·m−3. (c1c5) Corresponding to 1–5 mm at 2884 kg·m−3.
Crystals 15 00388 g015
Figure 16. Effect of density of mold powder on velocity of liquid slag layer.
Crystals 15 00388 g016
Figure 17. Temperature distribution of liquid slag layer at different density levels of mold powders (different heights). (a1a5) Corresponding to 1–5 mm at 2484 kg·m−3. (b1b5) Corresponding to 1–5 mm at 2684 kg·m−3. (c1c5) Corresponding to 1–5 mm at 2884 kg·m−3.
Crystals 15 00388 g017
Figure 18. Effect of density of mold powder on temperature of liquid slag layer.
Crystals 15 00388 g018
Table 1. Process parameters.
Parameter NameParameter Value
Steel GradeSFQ590
Casting Speed (m·min−1)0.35, 0.45, 0.55, 0.65, 0.75
Billet Cross-sectional Dimensions (mm)300 × 340
Nozzle Inner Diameter (mm)48
Nozzle Outer Diameter (mm)105
Casting Temperature (K)1793
Slag Layer Thickness (mm)6
Argon Flow Rate (L·min−1)0.50, 0.75, 1.00
Protective Slag Viscosity (Pa·s)0.2, 0.4, 0.6
Protective Slag Density (kg·m−3)2484, 2684, 2784, 2884
Crystallizer Electromagnetic StirringNone
Table 2. Steel liquid composition parameters (mass fraction).
CSiMnPSCrNiMoAlVTi
0.380.61.4500.0480.180.1200.0150.130.02
Table 3. Steel liquid physical property parameters.
Parameter NameParameter Value
Density (kg·m−3)6.913
Viscosity (Pa·s)0.006
Thermal Conductivity (W·m−1·K−1)34
Specific Heat Capacity (J·kg−1·K−1)821
Liquidus Temperature (K)1762
Disclaimer/Publisher’s Note: The statements, opinions and data contained in all publications are solely those of the individual author(s) and contributor(s) and not of MDPI and/or the editor(s). MDPI and/or the editor(s) disclaim responsibility for any injury to people or property resulting from any ideas, methods, instructions or products referred to in the content.

