Abstract
Stacking fault energy (SFE) is a critical property governing deformation mechanisms and influencing the mechanical behavior of materials. This work presents a unified framework for understanding and predicting SFE based solely on an electronic structure representation. By integrating density of states (DOS) spectral data, dimensionality reduction techniques, and machine learning models, it was found that the SFE behavior is indeed represented within the electronic structure and that this information can be used to accelerate the prediction of SFE. In the first part of this study, we established quantitative relationships between electronic structure and microstructural features, linking chemistry to mechanical properties. Using principal component analysis (PCA) and uniform manifold approximation and projection (UMAP), we identified key features from high-resolution vector representation of DOS data and explored their correlation with SFE. The second part of this work focuses on the predictive modeling of SFE, where a machine learning model trained on UMAP-reduced features achieved high accuracy (R2 = 0.86, MAE = 15.46 mJ/m2). To bridge length scales, we extended this methodology to predict SFE in alloy systems, leveraging single-element data to inform multi-element alloy design. We illustrate this approach with Cu-Zn alloys, where the framework enabled rapid screening of compositional space while capturing complex electronic structure interactions. The proposed framework accelerates alloy design by reducing reliance on costly experiments and ab initio calculations.
1. Introduction
Stacking faults (SFs) are planar defects that form within crystalline materials during plastic deformation, often resulting from the splitting of a perfect dislocation into two partial dislocations [1]. Stacking fault energy (SFE) is a key property that governs deformation mechanisms and influences the material’s mechanical behavior. In face-centered cubic (FCC) materials, low-to-medium SFEs facilitate deformation via transformation-induced plasticity (TRIP) or twinning-induced plasticity (TWIP), whereas high SFE promotes dislocation slip [2]. While the concept of stable stacking faults is most directly applicable to FCC and hexagonal close-packed (HCP) structures [3], related planar fault energies also matter in other crystal types [4]. Importantly, SFE is not a fixed property. It varies with temperature [5], applied stress [6], and alloying additions [7], allowing for intentional tuning of deformation mechanisms and optimization of material properties.
SFE quantifies the energy cost to introduce a planar defect into a crystal. It is defined as the excess energy per unit area associated with the presence of the fault compared to the perfect lattice. Mathematically, it is expressed as
where is the total energy of a crystal containing the stacking fault, is the energy of the perfect crystal with the same number of atoms and dimensions, and A is the area of the fault plane.
Given the pivotal role of SFE in guiding deformation behavior and alloy design, accurately predicting SFE is essential for accelerating materials discovery and engineering. However, achieving reliable SFE predictions requires moving beyond simplistic assumptions and macroscale descriptors to more multifaceted approaches. Existing approaches for modeling SFE include both computational methods, such as ab initio calculations based on density functional theory (DFT) [8] and empirical or semi-empirical models derived from elemental properties [9]. Traditional empirical models often rely on descriptors like atomic radii, electronegativities, and alloy composition [10], but these macroscopic features frequently fail to capture the detailed electronic interactions that underlie SFE behavior. Dimensionality reduction techniques, like principal component analysis (PCA) or autoencoders, are often applied to condense high-resolution vector representation of density of states (DOS) data into a lower-dimensional space while preserving critical variability. Subsequently, regression methods (e.g., Gaussian process regression, random forests, or gradient boosting) are employed to map these reduced-dimensionality descriptors to SFE values, often achieving improved accuracy over simpler elemental property–based models [11,12,13].
Stacking fault energy is intrinsically linked to the local electronic environment. Unlike elemental properties (atomic radius, electronegativity, etc.), which provide broad, average information, the density of states and electron configuration details capture how electrons are distributed among various orbitals and energy levels, directly influencing bonding and the formation energies of planar defects [14,15]. DOS describes the number of electronic states per unit energy at each energy level E. Variations in DOS near Fermi level EF are particularly important, as they determine how easily electrons can be reconfigured under deformation. By applying PCA, uniform manifold approximation and projection (UMAP), or other dimensionality reduction techniques to the DOS data, it is possible to condense these high-dimensional descriptors into a low-dimensional representation that still captures key variations in the electronic structure. These reduced sets of features can then be connected to SFE through linear or nonlinear regression models. Machine learning models based on the features from the electronic DOS achieve high fidelity in predicting stacking fault energies [16,17,18,19]. Harris et al. [20] identified a direct link between SFE and specific aspects of the electronic structure, such as the presence of vacant electronic states. Similarly, investigations of Ni-based alloys established a relationship between DOS and intrinsic stacking fault energy (ISF) [21]. Changes in electron concentration, as demonstrated in ZnS, ZnTe, and CdTe, can lower the energy barriers for slip and twinning, thereby influencing SFE [22].
Recent work in materials informatics has increasingly turned toward graph-based and deep learning approaches. Graph neural networks (GNNs) have been used to capture atomic interactions directly from structure, enabling accurate predictions for formation energy, defect behavior, and phase stability [23,24,25]. Other studies have applied deep neural networks to charge density maps or DOS-derived features to model thermodynamic and mechanical properties [26,27]. While these approaches are powerful, they often require large datasets and offer limited interpretability. Our framework provides a complementary strategy by leveraging DOS-based descriptors with physically meaningful PCA/UMAP feature extraction, designed for transparency and applicability in data-scarce regimes.
In this study, we used DOS data to correlate with and predict SFE, leveraging features derived from the application of dimensionality reduction techniques on DOS. We have previously developed techniques where ML is used to extract features in density of states curves from electronic structure calculations, which are then used to rapidly reconstruct and simulate DOS curves for modifications in those alloys (such as composition and defects). We have previously shown how, through informatics, one can model spectral patterns related to crystal structure, chemistry, and properties that can be extracted from the DOS curve [28,29,30]. This accelerates the parameterization of new empirical potentials and creates a new linkage between electronic length scale and atomic length scale.
Earlier studies have used simple elemental descriptors such as atomic radius, valence electron concentration, and electronegativity to train machine learning models for stacking fault energy prediction. While these approaches offer fast predictions, they often fail to capture the complex role of electronic structure, particularly in multicomponent alloys. More recent works have utilized charge density–based models or rule-of-mixture approximations derived from elemental properties, but these introduce assumptions about homogeneity and transferability [16]. In contrast, our framework leverages the full DOS as input—a feature directly derived from first-principles electronic structure calculations—enabling a more physically informed and generalizable model.
We build on prior work and develop a methodological strategy that uses DOS spectral data to predict the SFE of unknown alloys. In addition to aiming to accurately predict SFE, the study aimed to improve our understanding of the interaction between electronic and microstructural scales by creating a model that quantitatively links DOS spectral data and SFE. This paper also addresses the challenge of isolating the role of planar defects and their characteristics on the properties of a material.
2. Methodology
2.1. Data Preprocessing and Feature Extraction
The DOS data used in this study were generated from ab initio calculations performed with the Vienna ab initio simulation package [1,2] with projector augmented plane-wave pseudopotentials [3] and the Perdew, Burke, and Ernzerhof (GGA-PBE) generalized gradient approximation [4]. A convergence criterion in the total energy was defined with a 500 eV kinetic energy cutoff and a (15 15 15) k-point mesh.
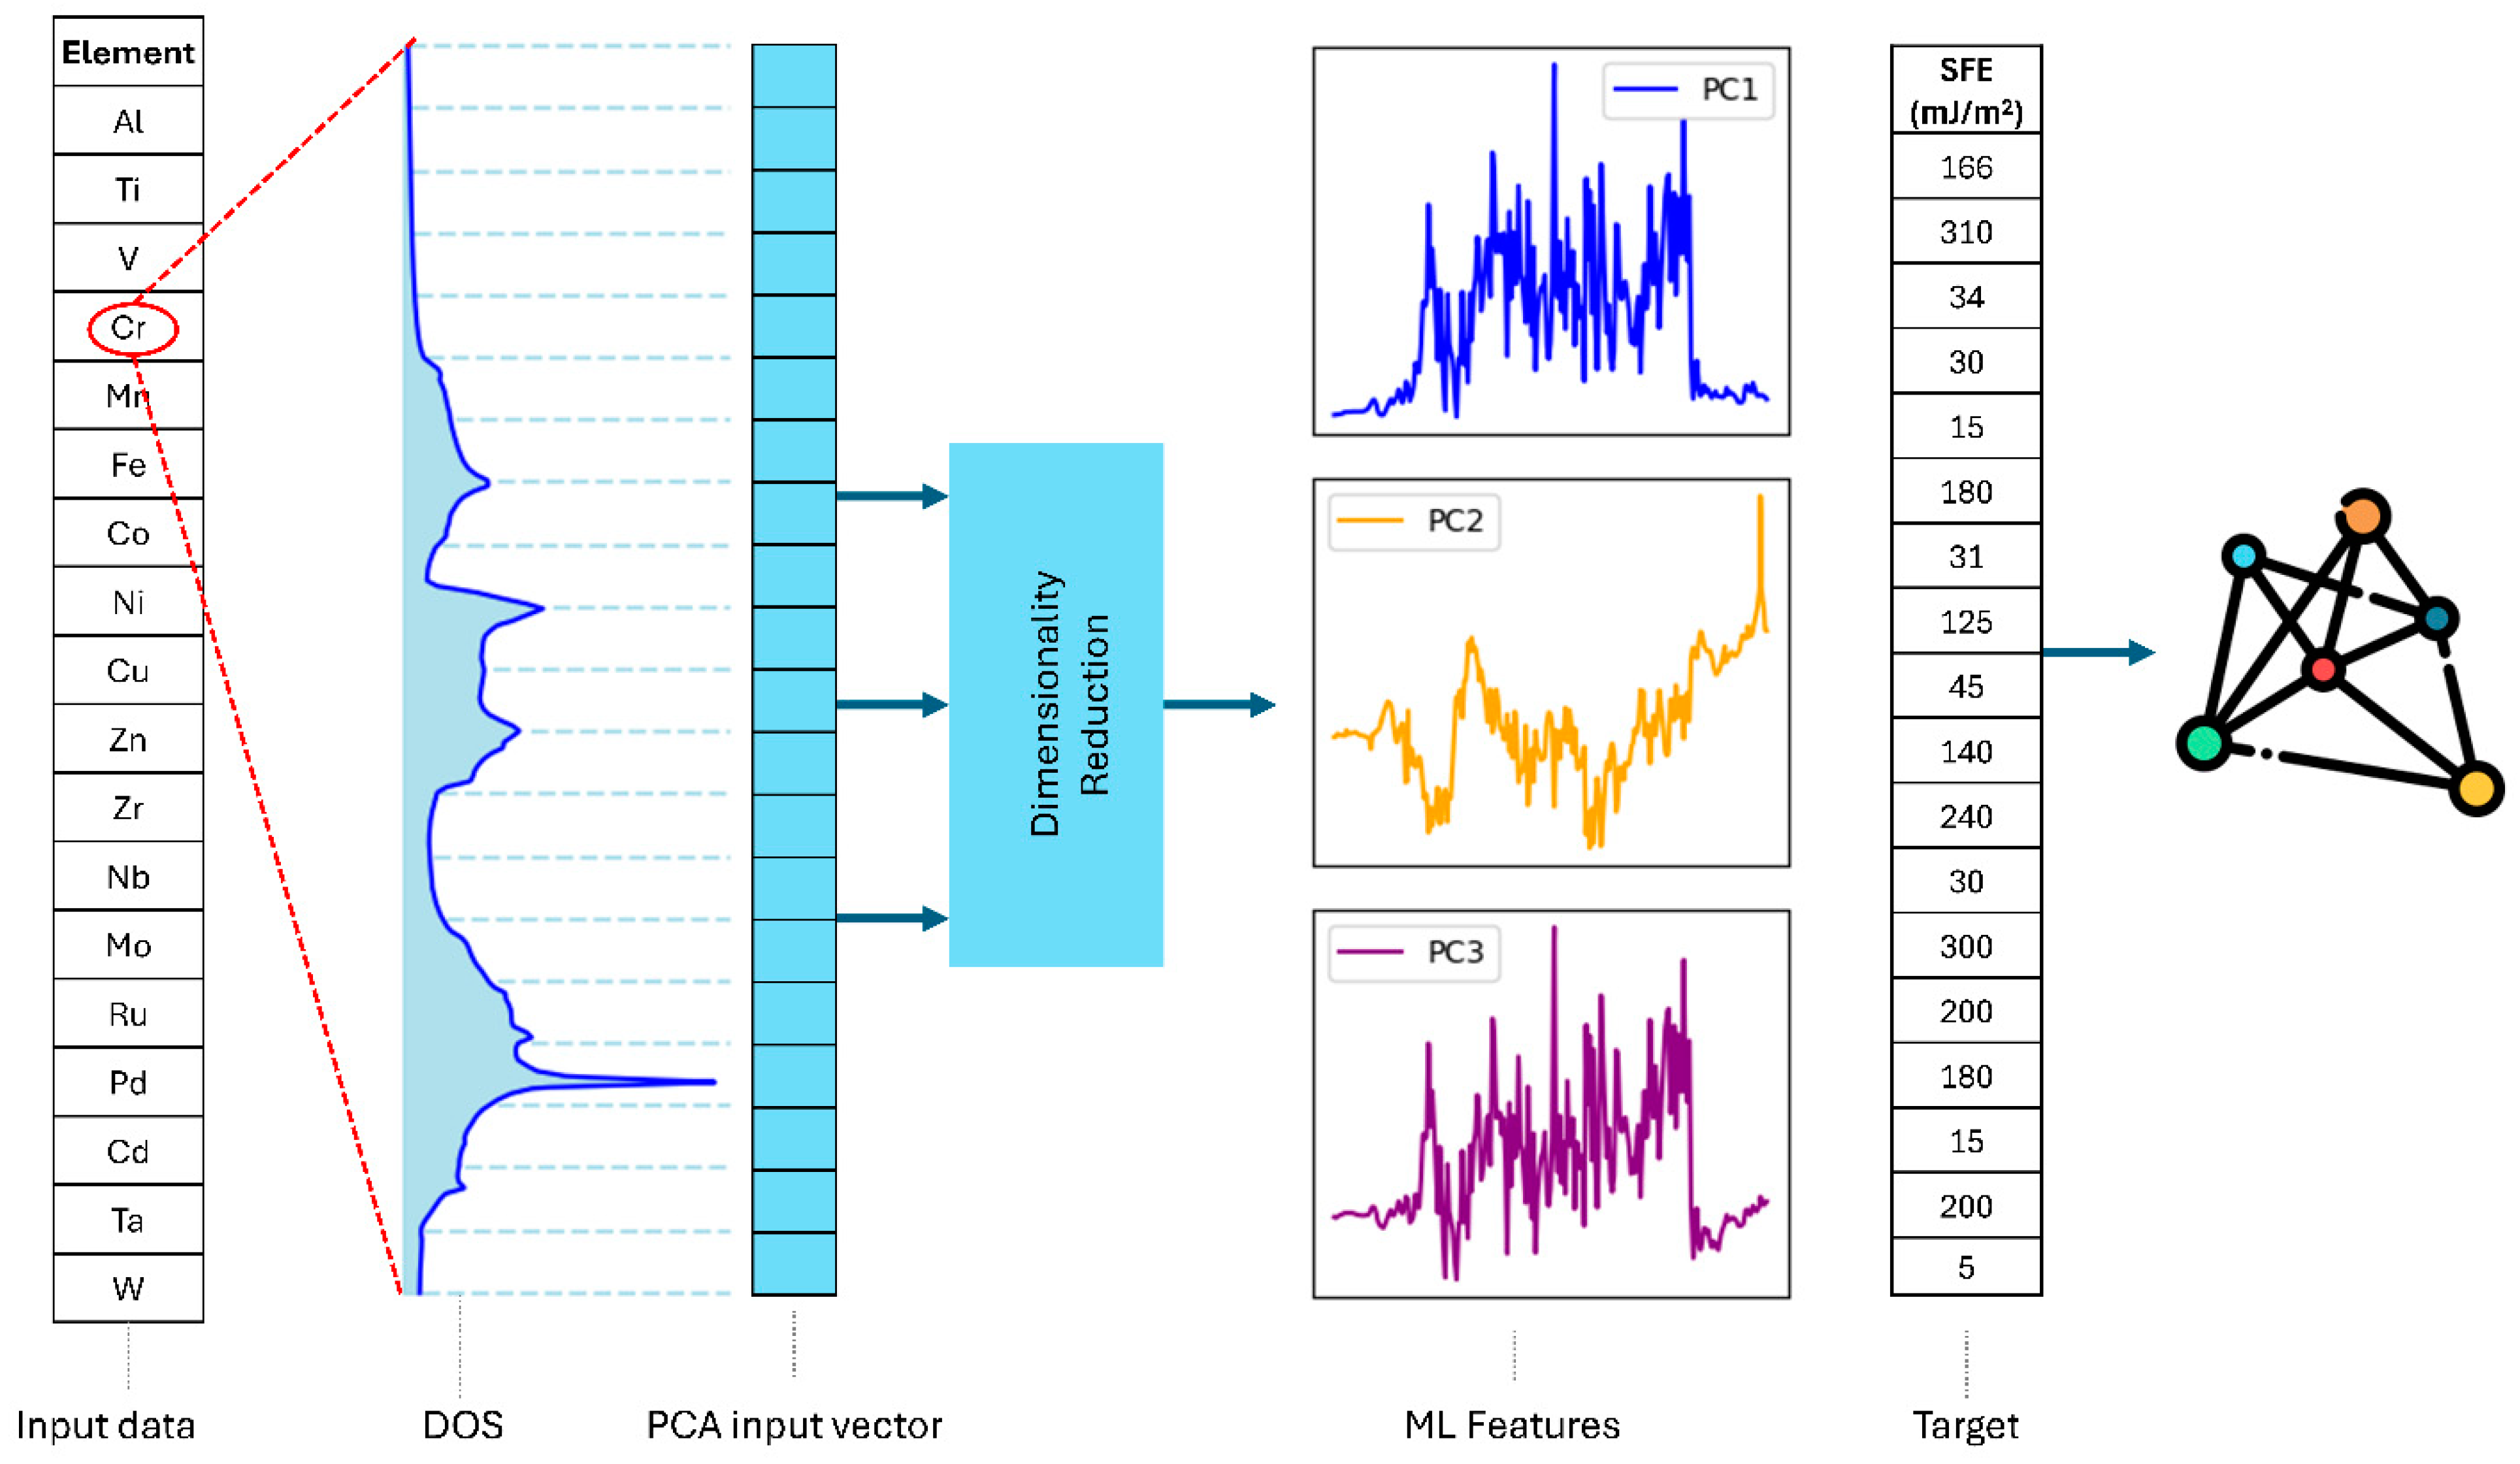
Figure 1 illustrates the workflow for the prediction of SFE from DOS data using dimensionality reduction and machine learning (ML). The raw DOS data for each material were interpolated onto a common uniform energy grid consisting of 190 energy values E1, E2…E190, spanning a fixed range around the Fermi energy. Each DOS curve was then represented as a row vector in a matrix X∈Rn×m, where n is the number of materials (12) and m is the number of sampled energy points (190):
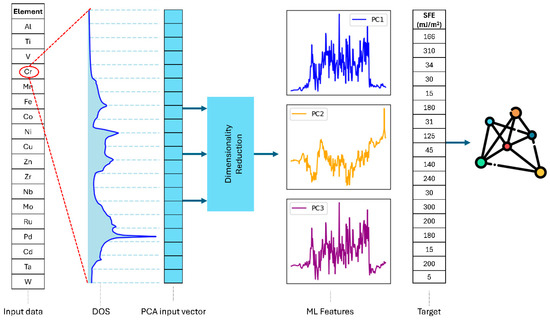
Figure 1.
Workflow for predicting stacking fault energy (SFE) from density of states (DOS) data. A dimensionality reduction method was applied to reduce the dimensionality of the DOS data. The curves labeled PC1–PC3 represent principal component analysis (PCA) loading vectors, showing the spectral patterns that explain the largest variance in the DOS dataset. These reduced components served as features for subsequent analysis and machine learning (ML) models, which predicted SFE values by correlating the reduced-dimensional DOS representation with SFE. The rightmost panel visualizes the ML analysis results.
Prior to applying PCA or UMAP, each material’s DOS curve xi∈Rm was mean centered by subtracting the average across all m energy points. This normalization ensured that the dimensionality reduction captures relative spectral variations rather than absolute magnitudes. The mean was computed over the energy grid and was independent of the Fermi energy.
Dimensionality reduction was subsequently applied to reduce the dimensionality of DOS data, which captured the most significant variations in the DOS. The reduced dimensions then served as features for ML models and subsequent analysis.
2.2. Dimensionality Reduction Techniques
The original density of states data consisted of approximately 10,000 energy values, forming a high-dimensional feature space. While the DOS is fundamentally a scalar function DOS(E), for ML purposes we treat each discretized DOS curve as a vector in a high-dimensional feature space, where the number of dimensions corresponds to the number of sampled energy points (e.g., 10,000). Thus, the term ‘dimension’ throughout this section refers to the number of features per DOS sample, not to the physical dimensionality of the DOS function itself. We applied PCA [31] and UMAP [32,33,34] to project the data onto a lower-dimensional space while retaining the most relevant information.
PCA is a classification method which projects the spatial data onto a set of principal components (PCs) and maps the data on a dimensionally reduced space. The reduction in dimensionality makes trends and correlations which are ‘hidden’ in the data become easily visualized and described in PC space. Beyond our previous work in analyzing DOS spectra, we have also applied PCA to other spectral data types [35,36]. PCA identifies directions (PCs) of maximum variance by computing the covariance matrix of the data and performing eigenvalue decomposition:
where is the mean centered data matrix, is the covariance matrix, and are eigenvectors representing the principal axes. Retaining only a few principal components reduces dimensionality while preserving the major variance in the dataset. Uses of PCA for studying other types of properties and complete interpretation of results are provided elsewhere [31,37,38,39]. The PCs capturing the most information are associated with the largest eigenvalues of the covariance matrix and their corresponding eigenvectors. The original data were decomposed into two matrices of interest: the scores and loadings. The loadings represented the eigenvectors of the covariance matrix and indicated how each energy point contributes to a given principal component. Since DOS was sampled across an energy axis, these loadings appeared as energy-dependent spectral patterns and were plotted as functions of energy (e.g., Figure 1 and Figure 2b). In contrast, the scores were the coordinates of each DOS sample (i.e., defect configuration or alloy composition) in the reduced PCA space. They w scalar values that describe how strongly a sample projects onto each principal component, as shown in Figure 2a,c.
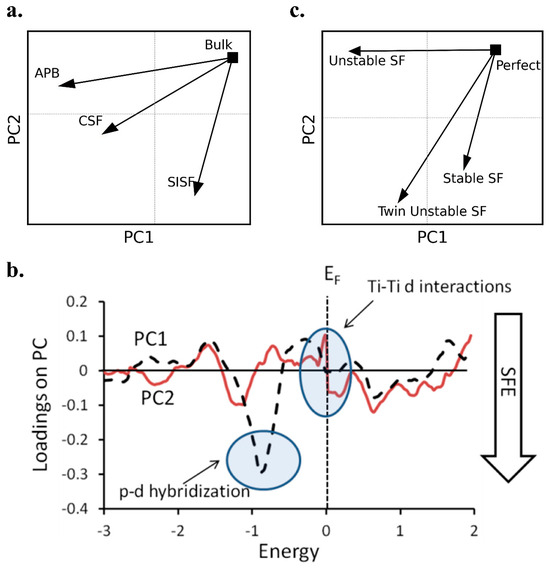
Figure 2.
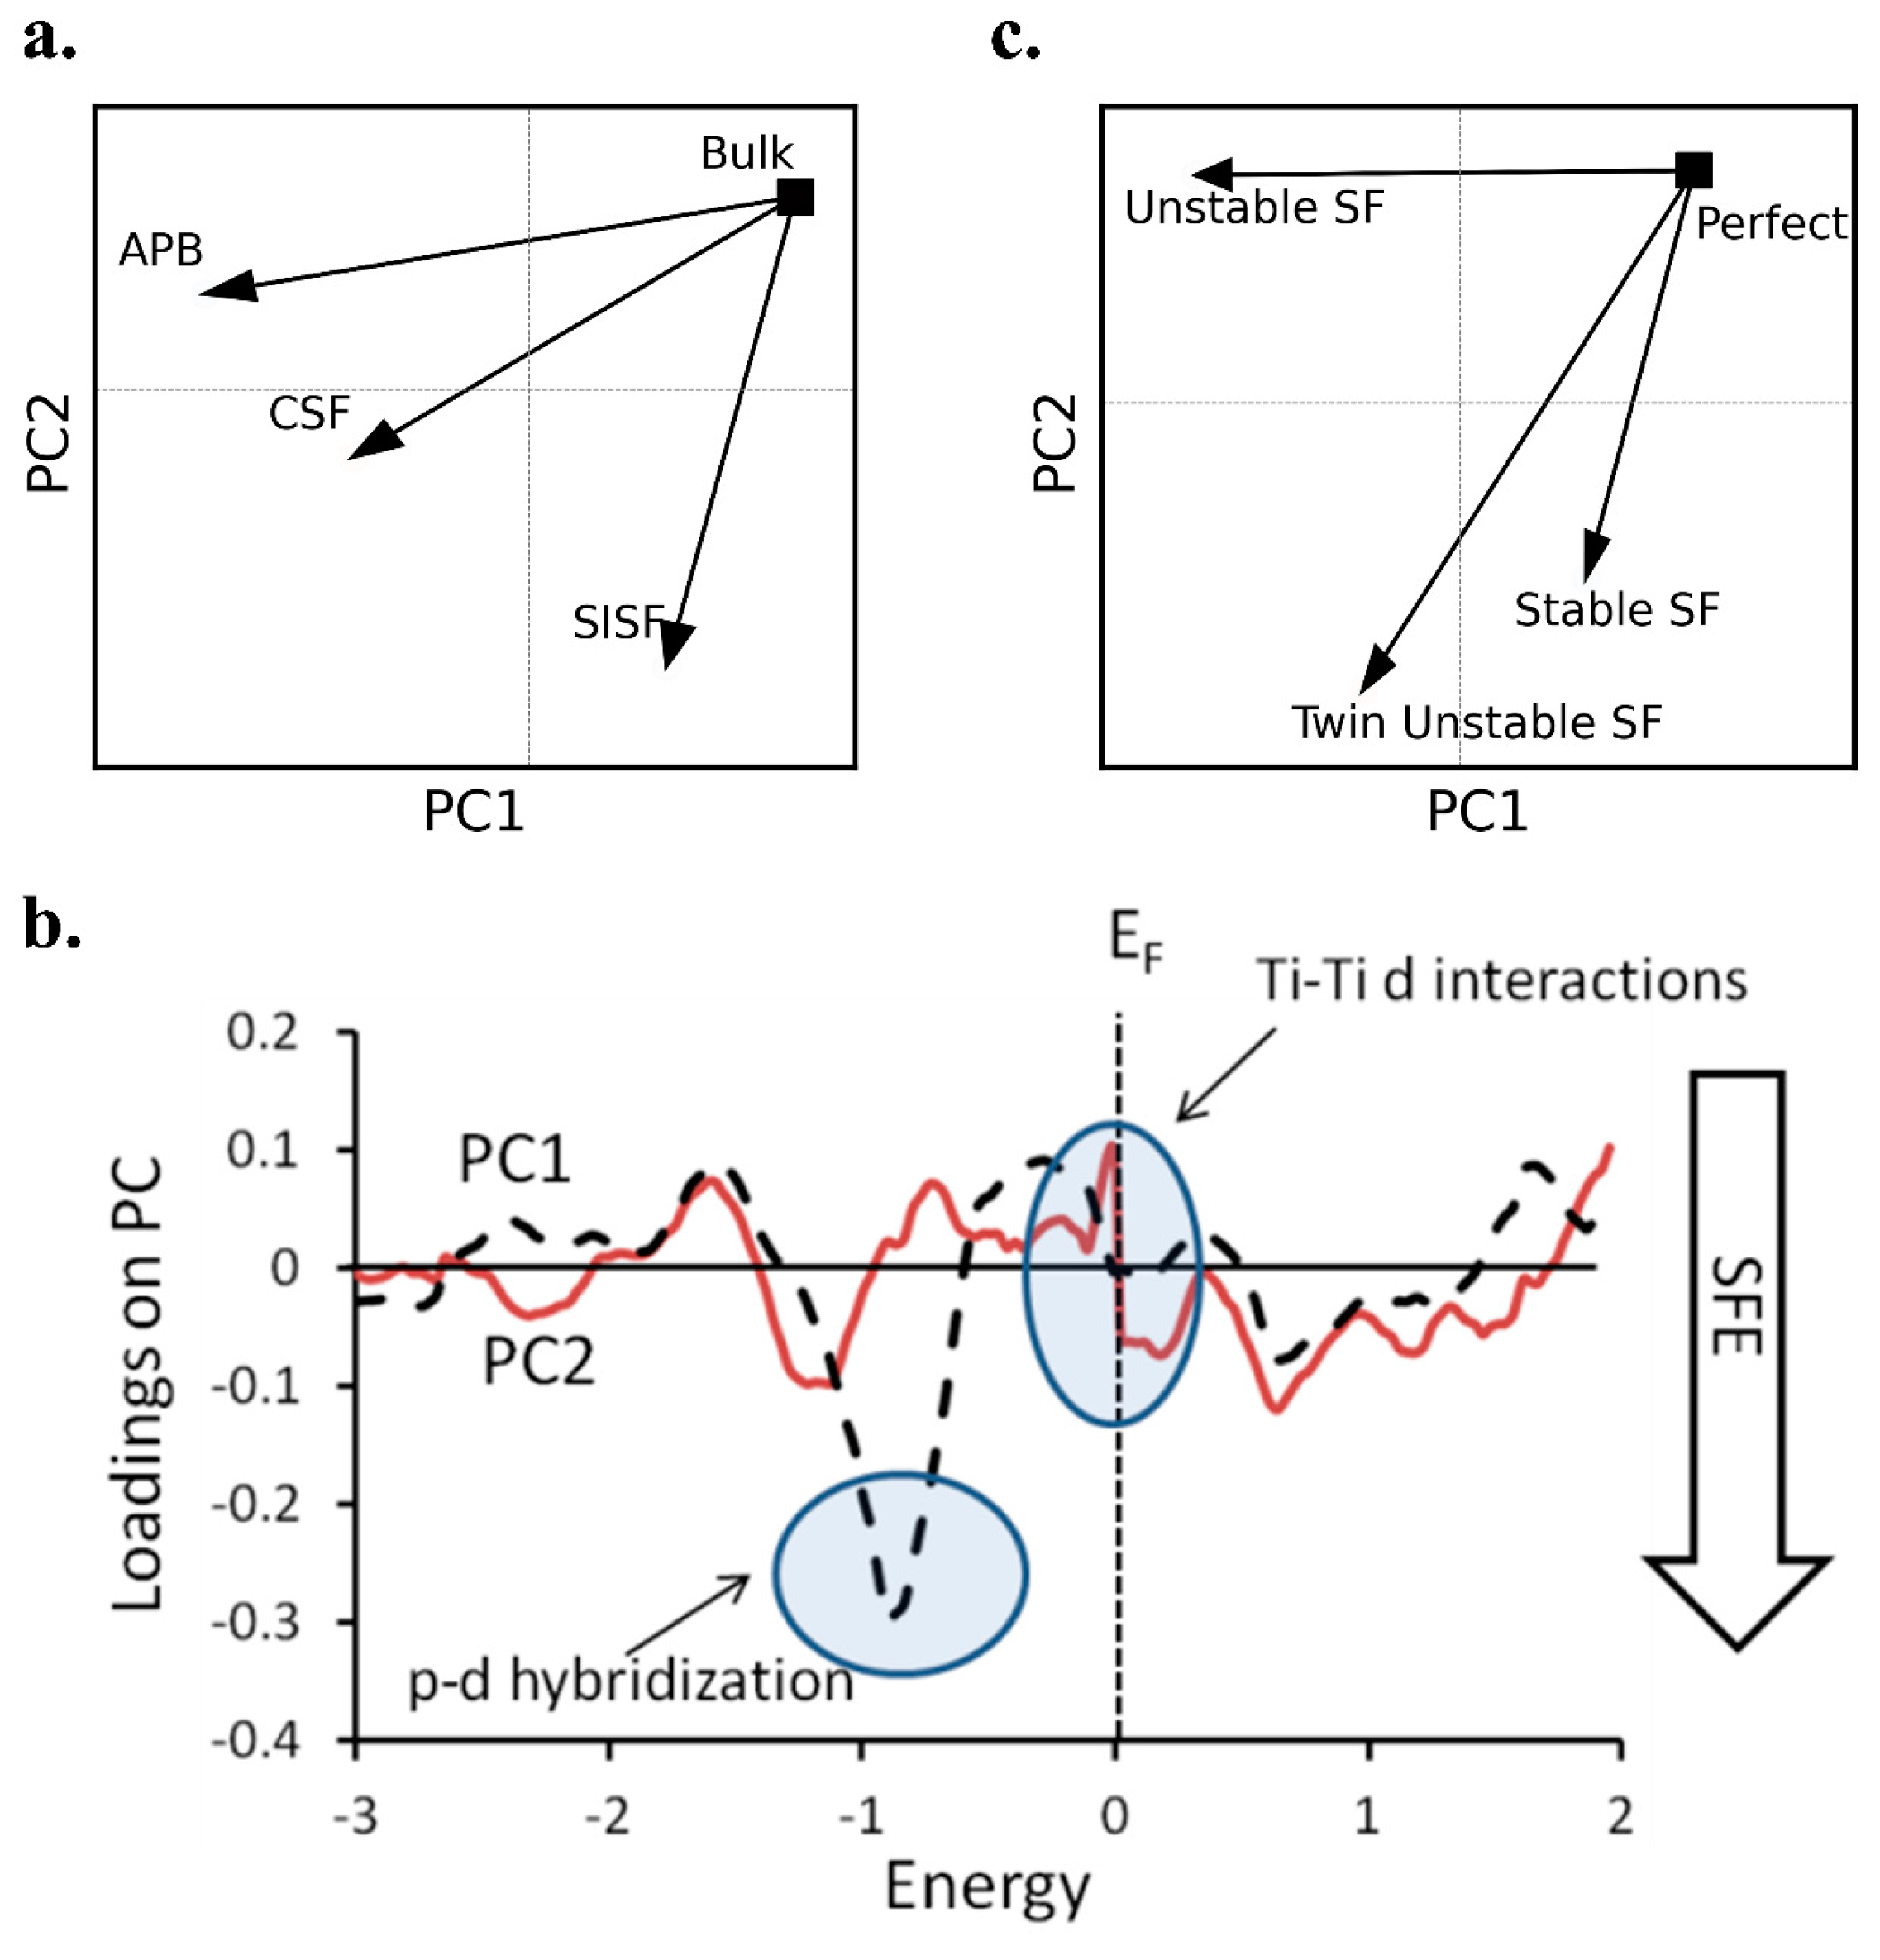
PCA results showing the correlation between planar defects and the density of states in Ti-Al alloys. (a) PCA score plot for different planar fault types (anti-phase boundary—APB, complex stacking fault—CSF, and superlattice intrinsic stacking fault—SISF) relative to the bulk crystal. (b) loading spectra for the first two PCs from the analysis of TiAl. PC1 is related to both APBs and stacking faults, as it differentiates APBs by direction and also differentiates CSF and SISF. PC2 separates stacking faults from the bulk, with stacking faults having negative PC2 values. Based on this determination, the features in the loading spectra with the largest negative PC values lead to a larger effect from planar faults. Two regions in the loading spectra are highlighted: the region of PC1 at −0.9 eV is important because it has the highest magnitude loading value of any energy, while the region near the EF is important because it is a region of high fluctuation. (c) PCA score plot for stable, unstable, and twin unstable stacking faults relative to the perfect crystal, with trajectories indicating the magnitude and direction of DOS evolution. The magnitude reflects the degree of deviation from the perfect crystal, and the direction differentiates fault types based on their electronic impact.
UMAP constructed a high-dimensional neighbor graph and then optimized low-dimensional embedding to maintain local similarities. The quality of the embedding was assessed by minimizing a cross-entropy cost function:
The high-resolution vector representation of DOS data points was converted into fuzzy topological graphs using the pairwise probabilities which encode the likelihood of observing data point in the local neighborhood of :
Similarly, the low-dimensional embeddings were optimized by minimizing the cross-entropy between and the corresponding low-dimensional similarities , where
UMAP embedding minimized the loss:
3. Results and Discussion
3.1. Role of Planar Faults on DOS
Planar defects impact the mechanical, electrical, thermal, and optical properties of a material. Correlating the nature of the defect with material properties is very difficult due to multiple considerations such as defect type, orientation, and the impact of crystal chemistry on defect properties. The addition of alloying elements generally has a significant impact in lowering the SFE of the system and also changes the electronic properties of the material. Following our developed data mining approach, we could map the systems in terms of stacking faults based on an electronic structure input. The results from the analysis confirmed the conclusions from previous studies, while further explaining the deformation mechanisms.
In this section, we correlate the influence of planar faults, alloy chemistry, and structure. A summary of the planar defects considered in this study is provided in Table 1. We considered DOS curves which were calculated as a function of planar faults for Ti-Al alloys, with these curves available in the literature [40,41]. Wu et al. calculated the total and partial DOS of an L12-Al alloy for a perfect crystal structure, with the introduction of a stable stacking fault, an unstable stacking fault, and twin stacking faults, to study the activity of slip and deformation twinning [40]. For this structure, the fault on the {111} plane between two partials can be either an anti-phase boundary in the <110> direction or an intrinsic stacking fault along the <112> direction [42], which is what is considered here. Analysis of Ti-Al in the L10 structure allowed us to correlate crystal structure and defect energies.

Table 1.
Planar defects considered in this study.
To analyze the DOS spectra, a dimensionality reduction approach, PCA, was applied [43,44,45,46]. This integration of informatics with electronic structure calculations can provide a new level of information on the deformation mechanism for these systems, which we otherwise could not uncover.
The analysis of the L10-TiAl is for a bulk crystal, APBs in {111} and {100} planes, a complex stacking fault (CSF), and a superlattice intrinsic stacking fault (SISF). PCA was applied to these datasets. The scores classify the conditions (different planar faults), while the loadings classify the responses, which for this analysis means the importance of the DOS at each energy value. The numbers contained within the input matrix are then the intensity values at each energy, with the rows being different conditions. For typical PCA results, the loadings mathematically define the PCs, while the scores plot the original dataset in the new axis system. However, in this case (“spectral PCA”), the loadings spectra define the most important patterns within the DOS spectra, while the scores’ values are the weighting of the contributions of those patterns to the original DOS spectra. Therefore, using PCA, the ‘hidden’ patterns within the DOS spectra and the correlation between effects of planar faults can be defined.
By mapping the planar faults in the same axis system as the perfect crystal (bulk), differences in the systems based on their DOS curves are identified, even though in many cases these differences are very subtle. The score plot of the analysis is shown in Figure 2a. Axis PC1 (first PC) differentiates the impact of stacking faults on the DOS, as well as the direction of the APB. PC2 differentiates the impact of APBs and stacking faults on the DOS curve. The corresponding loadings spectra are shown in Figure 2b. These curves define how the differences in the PC map are reflected in the DOS spectra. For example, in PC1 we identified a large inverse peak at approximately −0.9 eV. Therefore, systems with defects that have relatively low DOS values at this energy will have characteristics more similar to a perfect crystal. For the eigenspectra associated with PC2, large changes at the Fermi energy (EF) were found. Therefore, controlling the properties due to stacking faults versus APBs was based on examining the DOS at EF.
Visual interpretation of the DOS curves led to some conclusions based on p-d hybridization [41]. For APB (100), a sharp p-d peak at −0.9 eV was seen, SISF showed reduced p-d hybridization, and APB (111) and CSF showed some p-d hybridization. Also, changes at the EF represented Ti-Ti d interactions across the fault plane. PCA analysis of this data also identified the most important regions of the DOS curve as energies at −0.9 eV and just below the EF. By including this analysis, another level of interpretation was possible, while visual interpretation of the data required analyzing the charge density.
As APB (100) has the most negative PC1 value, it showed the most variation in p-d hybridization, while DOS change due to CSF also showed significant variation. Introduction of APB in the {111} plane and SISF showed fewer signs of p-d hybridization. From the loadings of PC2, we identified that this axis was largely dictated by changes in the DOS just below EF, and also at approximately −1.1 eV, with a broader peak than for PC1. The change in PC2 with stacking fault addition agrees with the conclusion that the change near EF is due to interactions across the fault. The change in DOS was most significant for the introduction of SISF. We concluded that the Ti-Ti d interaction was more significant across the fault of an SISF as opposed to CSF. Therefore, interpretation of the PCA results provides greater understanding of the deformation mechanism due to planar faults.
Four different fault conditions were assessed: no stacking faults (perfect crystal), stable stacking faults, unstable stacking faults, and twin unstable stacking faults. Both the total and partial DOS curves were considered. The results of this analysis are presented in Figure 2c. From visual analysis of the DOS curves, the conclusion was that the introduction of a stacking fault leads to strong p-d hybridization between Ti and Al. This conclusion agreed with the informatics analysis, where the systems with planar faults could be completely separated from the bulk system based on a mapping of only the Al p-orbital and Ti d-orbital.
In the map from the total DOS, we found significant differences between perfect crystal/stable stacking faults and unstable stacking faults. That is, the stability of the stacking fault had a large impact in defining how much the electronic structure changes. The SFE difference between stable and unstable stacking faults was related to the ductile-to-brittle transition, so therefore the difference in SFE with stacking fault stability impacts deformation of the material, and we have shown here that it impacts the electronic properties as well.
By analyzing the partial DOS, we were able to understand the mechanism by which stacking faults alter the electronic structure. In the results from partial DOS, the perfect crystal was very different from all of the systems with stacking faults (as shown by perfect having a negative PC value, while the others had positive PC values). However, the stability of the stacking fault alters the Al p-orbital (as seen by stable faults having a positive PC value and unstable and twin unstable faults having negative PC values). Therefore, we can better understand the reasons for the differences seen in the analysis of the total DOS spectra. The introduction of stacking faults altered the electronic d-orbital, while changing the stability of the stacking fault impacted the electronic p-orbital.
3.2. Prediction of SFE Using DOS Spectra
3.2.1. Data Collection and Preparation
In this section and those that follow, all SFE values refer to intrinsic stacking fault (ISF) energy. The model was trained using literature-reported ISF values corresponding to the most stable stacking fault configuration. SFE values were obtained from the published literature [47,48], and DOS data for the relevant compositions were generated using ab initio calculations, as described earlier. As illustrated in Figure 1, we employed dimensionality reduction techniques—PCA and UMAP—to map the high-resolution vector representation of DOS space onto lower-dimensional representations. While UMAP-based features consistently yield higher prediction accuracy, PCA is well known for its interpretability. Consequently, UMAP was chosen to optimize prediction performance, and PCA was utilized to gain insights into the underlying electronic structure effects. It should be noted that the data size utilized was relatively small, thereby introducing high uncertainty and an increased potential of overfitting. The size of the data was one of the motivators for utilizing PCA and UMAP, to avoid over-parameterization of the data. Additionally, modeling across different regression methods and with various cross-validations were carried out to ensure sufficient robustness.
3.2.2. Regression Model Optimization and Feature Selection
We initially evaluated a broad range of regression models to account for different learning paradigms and ensure robust performance. The models included linear methods, ensemble approaches (e.g., random forest, gradient boosting), support vector machines, and neural network–based regressors. Given the small dataset size, model selection emphasized balancing predictive performance and generalization to prevent overfitting. After initial screening using default hyperparameters, we shortlisted random forest, extra trees, gradient boosting, AdaBoost, decision tree, and k-neighbors regressor as the most promising candidates based on their R2 and mean absolute error (MAE) performance. Hyperparameter optimization was then conducted for these selected models to refine their performance, as default hyperparameters often fail to exploit the full potential of the models, particularly for small datasets. For example, tree-based models require tuning parameters like the number of estimators and tree depth to balance bias and variance, while k-neighbors regressor requires careful selection of the number of neighbors and weighting schemes. Through systematic grid search, the optimal hyperparameters for each model were identified by directly evaluating performance, improving predictive accuracy.
3.2.3. Performance Metrics for Model Evaluation
To assess the predictive performance of our model, we employed two commonly used error metrics: the coefficient of determination () and the MAE. The metric, defined as
quantifies how much of the variance in the target property y is explained by the model’s predictions, which is the mean of the observed values, and is the number of data points. A value of closer to 1 indicates better predictive accuracy. The MAE, given by
measures the average magnitude of prediction errors. Unlike the squared errors in , the MAE treats all residuals equally, offering straightforward interpretation of the average absolute difference between predicted and actual values.
3.2.4. SFE Prediction Using Random Forest
As described previously, we evaluated several regression models in combination with different dimensionality reduction techniques to predict the SFE. Among the tested models, the Random Forest regressor, trained on UMAP-reduced DOS features, delivered the best overall performance, as shown in Table 2. Given the small dataset (12 elements total, with 8 used for training and 4 reserved for testing), careful model selection and hyperparameter tuning were essential to prevent overfitting. Random forest algorithms are well-known for their robustness and efficiency in settings with limited data [49]. In this study, the training set comprised Mo, W, Cu, Pd, Cd, Co, Ru, and Ti, while the test set included Zn, Zr, Ni, and Ta. Table 2 presents the predictive accuracy of various regression models, each paired with UMAP or PCA as a dimensionality reduction step. The random forest model combined with UMAP achieved an R2 of 0.86 and an MAE of 15.46 mJ/m2, indicating that UMAP effectively retains critical DOS features related to SFE. By contrast, other model-reduction combinations yielded lower R2 values and higher MAE scores, reflecting reduced predictive fidelity.
Table 2.
Performance comparison of various regression models combined with dimensionality reduction techniques (UMAP and PCA) in predicting stacking fault energy. The R2 and MAE test results are reported for each model, with higher R2 and lower MAE values indicating better predictive performance.
Figure 3 illustrates the strong agreement between predicted and experimentally measured SFE values, with data points clustering near the ideal line. The R2 values of 0.861 for training and 0.856 for testing confirm that the uniform manifold approximation and projection (UMAP)-based approach, coupled with a random forest model, effectively captures the underlying relationship between electronic structure and SFE.
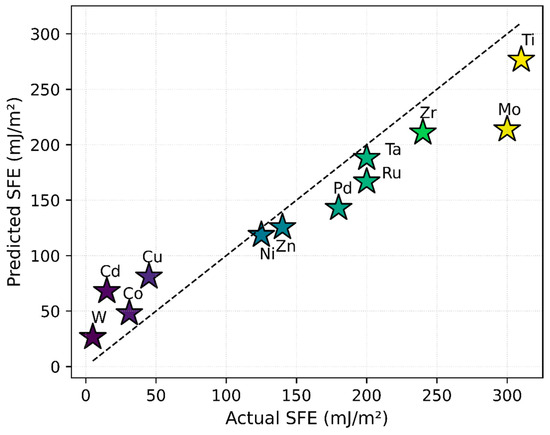
Figure 3.
Comparison of predicted versus experimentally measured SFE for the 12 elemental materials, using UMAP-reduced DOS features as input to the regression model. The dashed line represents the ideal one-to-one correlation. All SFE values shown refer to intrinsic stacking faults. The close proximity of most data points to this line indicates that the model captures the underlying electronic structure–SFE relationship.
Furthermore, the model demonstrates higher confidence in predictions for elements with low-to-medium SFE, a trend influenced by their stronger representation in the training dataset. In contrast, a relative paucity of high-SFE data points constrains the model’s predictive confidence at the upper end of the SFE range. This is likely due to underrepresentation of high-SFE elements in the training data.
Compared to descriptor-based models (e.g., those using atomic size or thermodynamic properties), our DOS-based approach provides better alignment with the underlying physics. For example, Linda et al. showed that using DOS-derived d-band features significantly improves predictions of SFE and GSFE trends in FCC metals and alloys [16]. Our work builds on this idea by using the full DOS spectrum, reduced via PCA or UMAP, to capture energy-dependent electronic variations related to fault formation.
Our next objective was to apply the insights gained from the DOS, dimensionality reduction techniques, and trained random forest model to alloy design. This strategy will enable more efficient exploration of the vast chemical composition space, reducing reliance on costly and time-consuming experimental or ab initio approaches [50]. As a first step, we investigated how the addition of different elements influences the SFE and then quantify these effects numerically. For initial validation, we selected Cu–Zn alloys, as their experimentally measured SFE values are well documented in the literature [47,51].
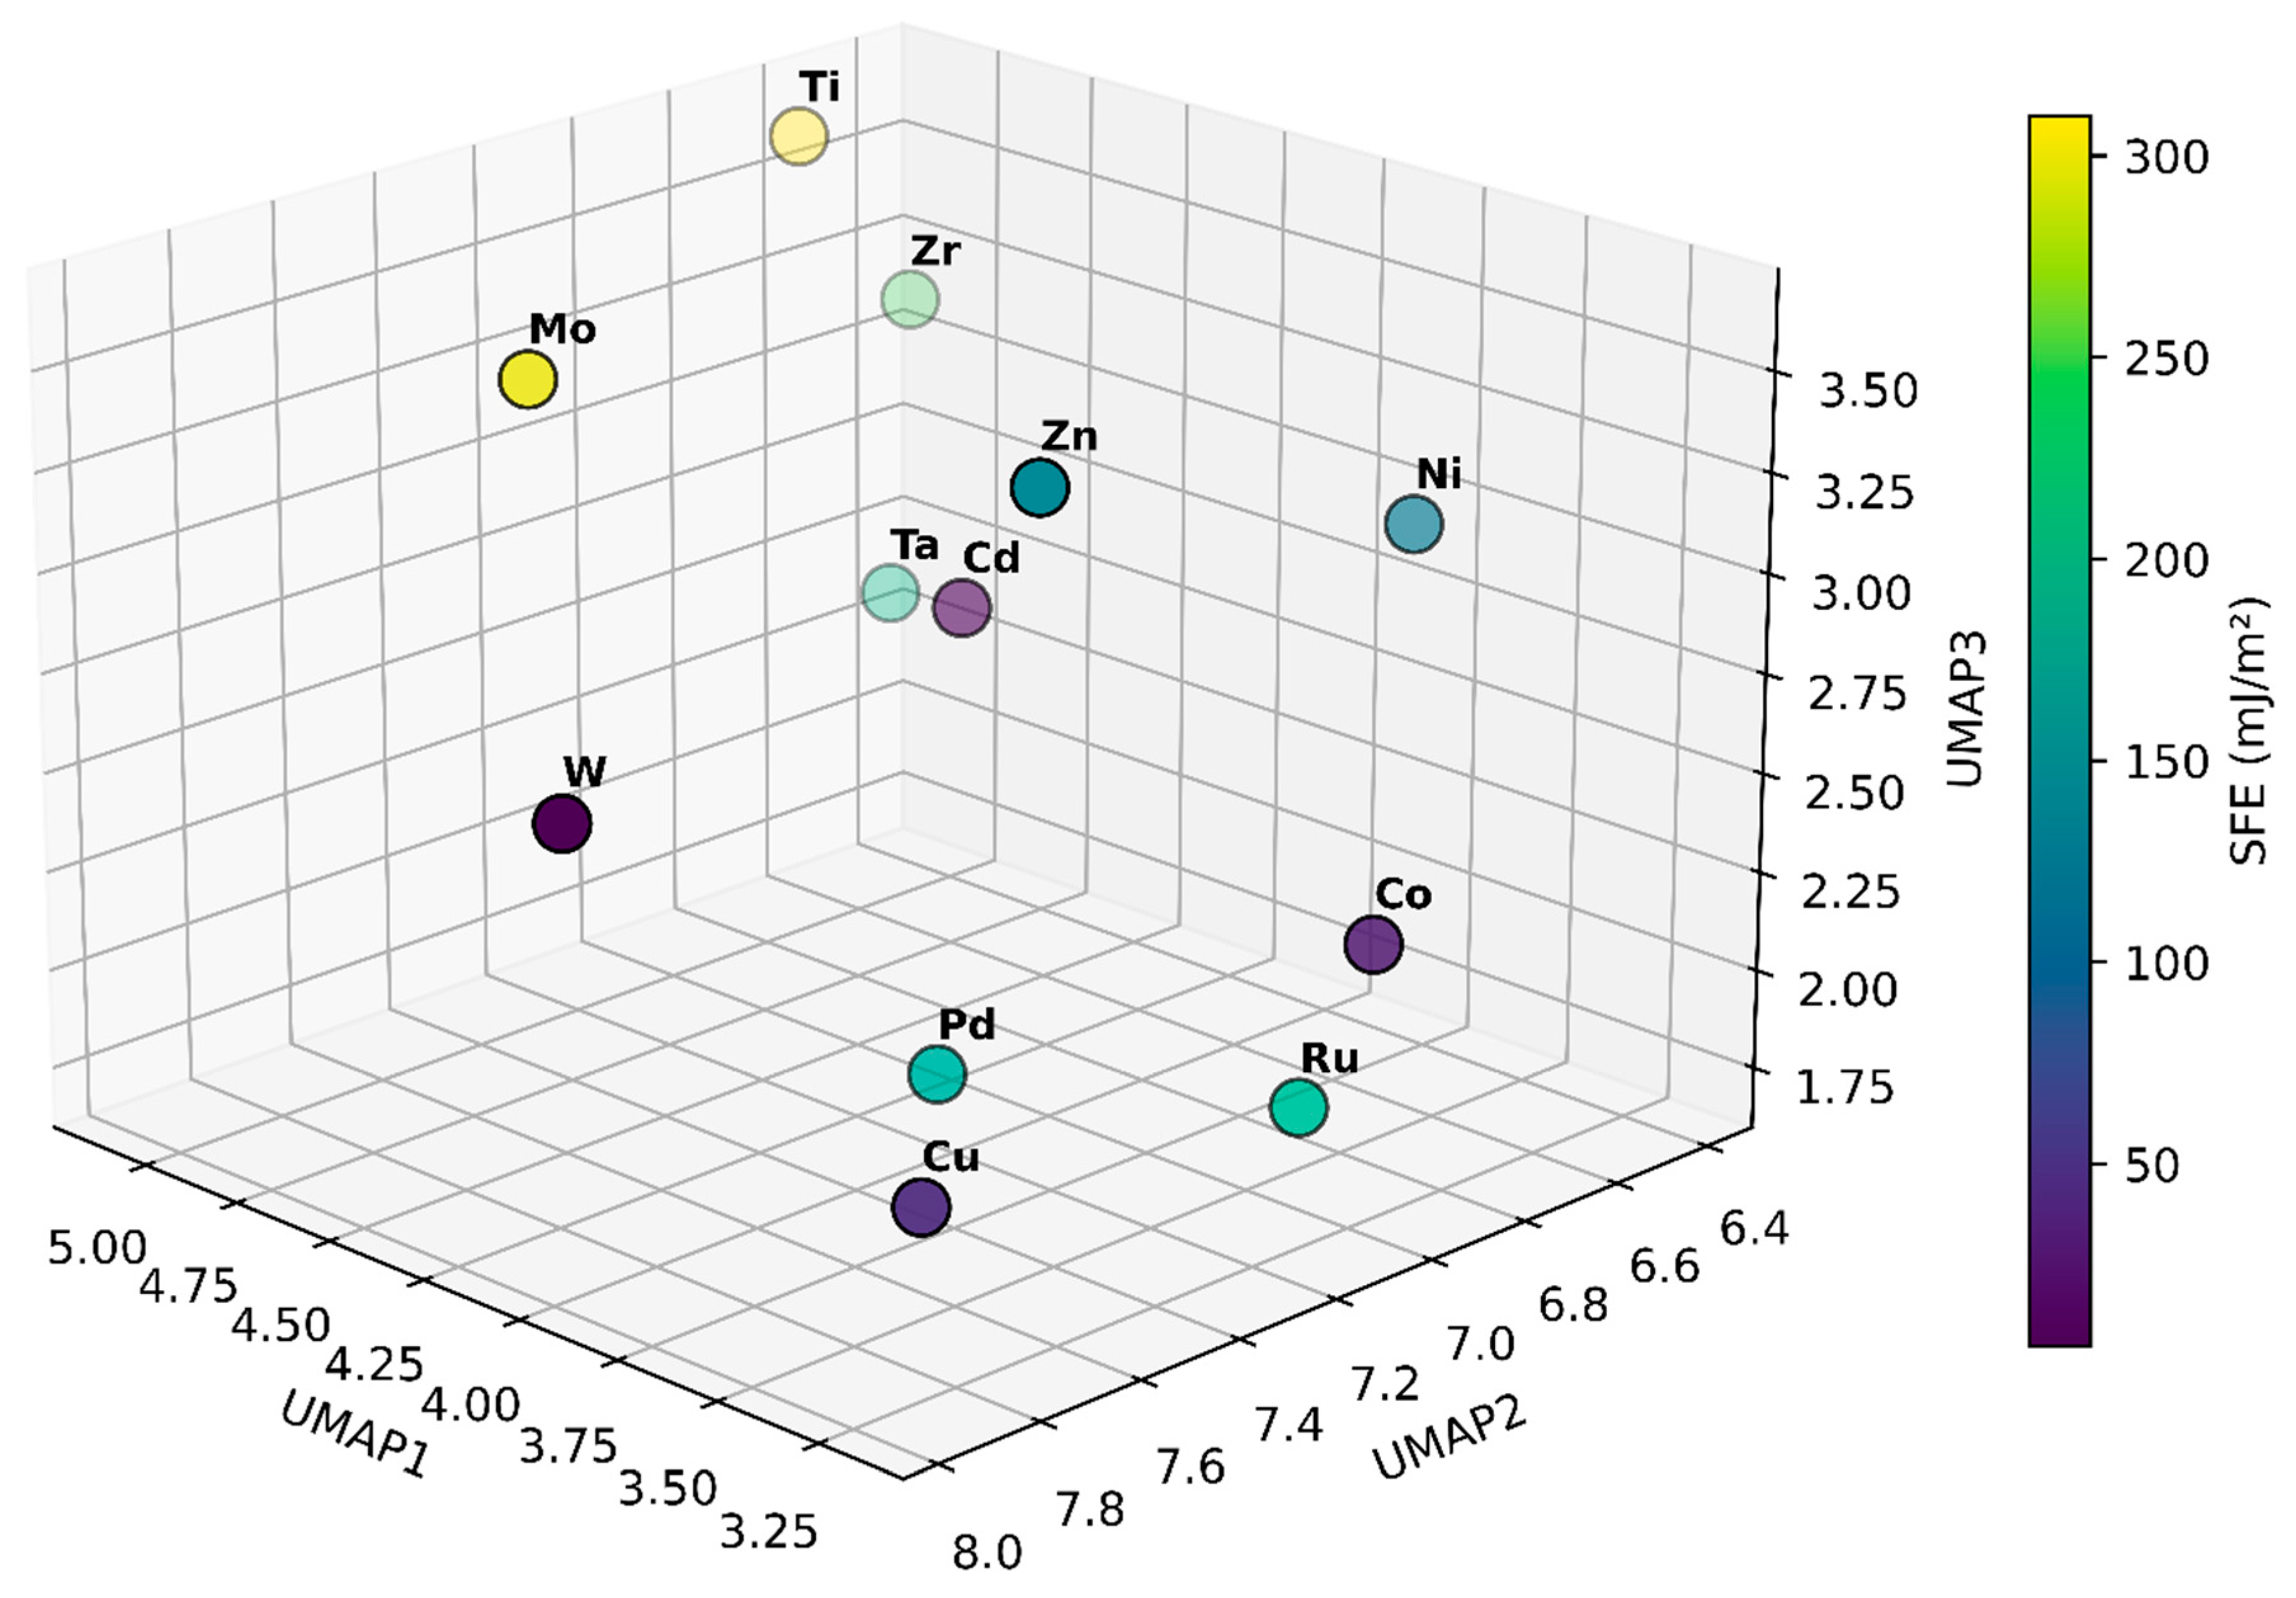
Figure 4 presents the 12 elements projected into a three-dimensional space derived from UMAP embedding of their density of states data. Each point corresponds to an element, with its position determined solely by electronic structure similarities captured in the DOS and the color scale indicating the experimentally measured stacking fault energy. Elements with lower SFE appear in dark purple, while those with higher SFE are shown in bright yellow. This can guide alloy design by helping quickly identify which elements have DOS profiles that could lead to higher or lower SFE. By understanding how electronic structure patterns correlate with SFE in this reduced-dimensional space, we can more efficiently select and tailor alloy compositions to achieve desired mechanical properties.
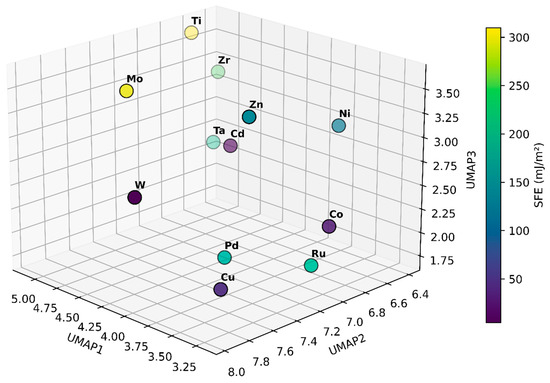
Figure 4.
Three-dimensional UMAP embedding of the DOS data for 12 elemental materials, with each point representing one element. The coordinates (UMAP1, UMAP2, UMAP3) capture underlying electronic structure similarities, while the color scale indicates the experimentally measured stacking fault energy. Elements positioned closer together share comparable DOS features, providing a visual map that links electronic structure characteristics to SFE.
Consider the example of Cu and Zn to illustrate how this visualization can inform alloy design decisions. In the UMAP representation, pure Cu appears in a region associated with a relatively low SFE (45 mJ/m2), while Zn is positioned in a part of the plot where the SFE is higher (140 mJ/m2). At first glance, one might expect that adding Zn to Cu would raise the SFE, given Zn’s higher baseline value. However, the benefit of this DOS-based visualization is that it captures subtle, non-linear interactions between the electronic structures of alloying elements. In practice, incorporating small amounts of Zn into Cu shifts the DOS in a way that results in lower SFE values than pure Cu [47,51]. This outcome, counterintuitive when considering only the elemental SFEs, becomes more understandable when viewing the elements in a common DOS landscape. The UMAP embedding shows that, while Zn differs electronically from Cu, their combined DOS may fall into a region that better stabilizes stacking faults.
3.3. Transitioning from Single Elements to Binary Alloys: SFE Mapping
As discussed earlier, principal component loadings reflect how individual data points in the original, high-dimensional space (the DOS in this case) contribute to the transformed, lower-dimensional PCA space. By applying PCA to the DOS data, we isolate the most significant patterns in the electronic structure, which we then relate to the SFE through a linear regression model. Mathematically, this relationship can be expressed as:
where the coefficients are obtained from linear regression, and the PC scores are derived from the PCA of the DOS spectra. For the first five principal components, the coefficients are: Coeff1 = −166.51, Coeff2 = −57.83, Coeff3 = 198.64, Coeff4 = −90.82, and Coeff5 = 15.24. These values indicate how each PC influences SFE. In particular, PC3 and PC5 positively contribute to the SFE, while PC1, PC2, and PC4 contribute negatively, with PC1 and PC4 having stronger negative effects than PC2.
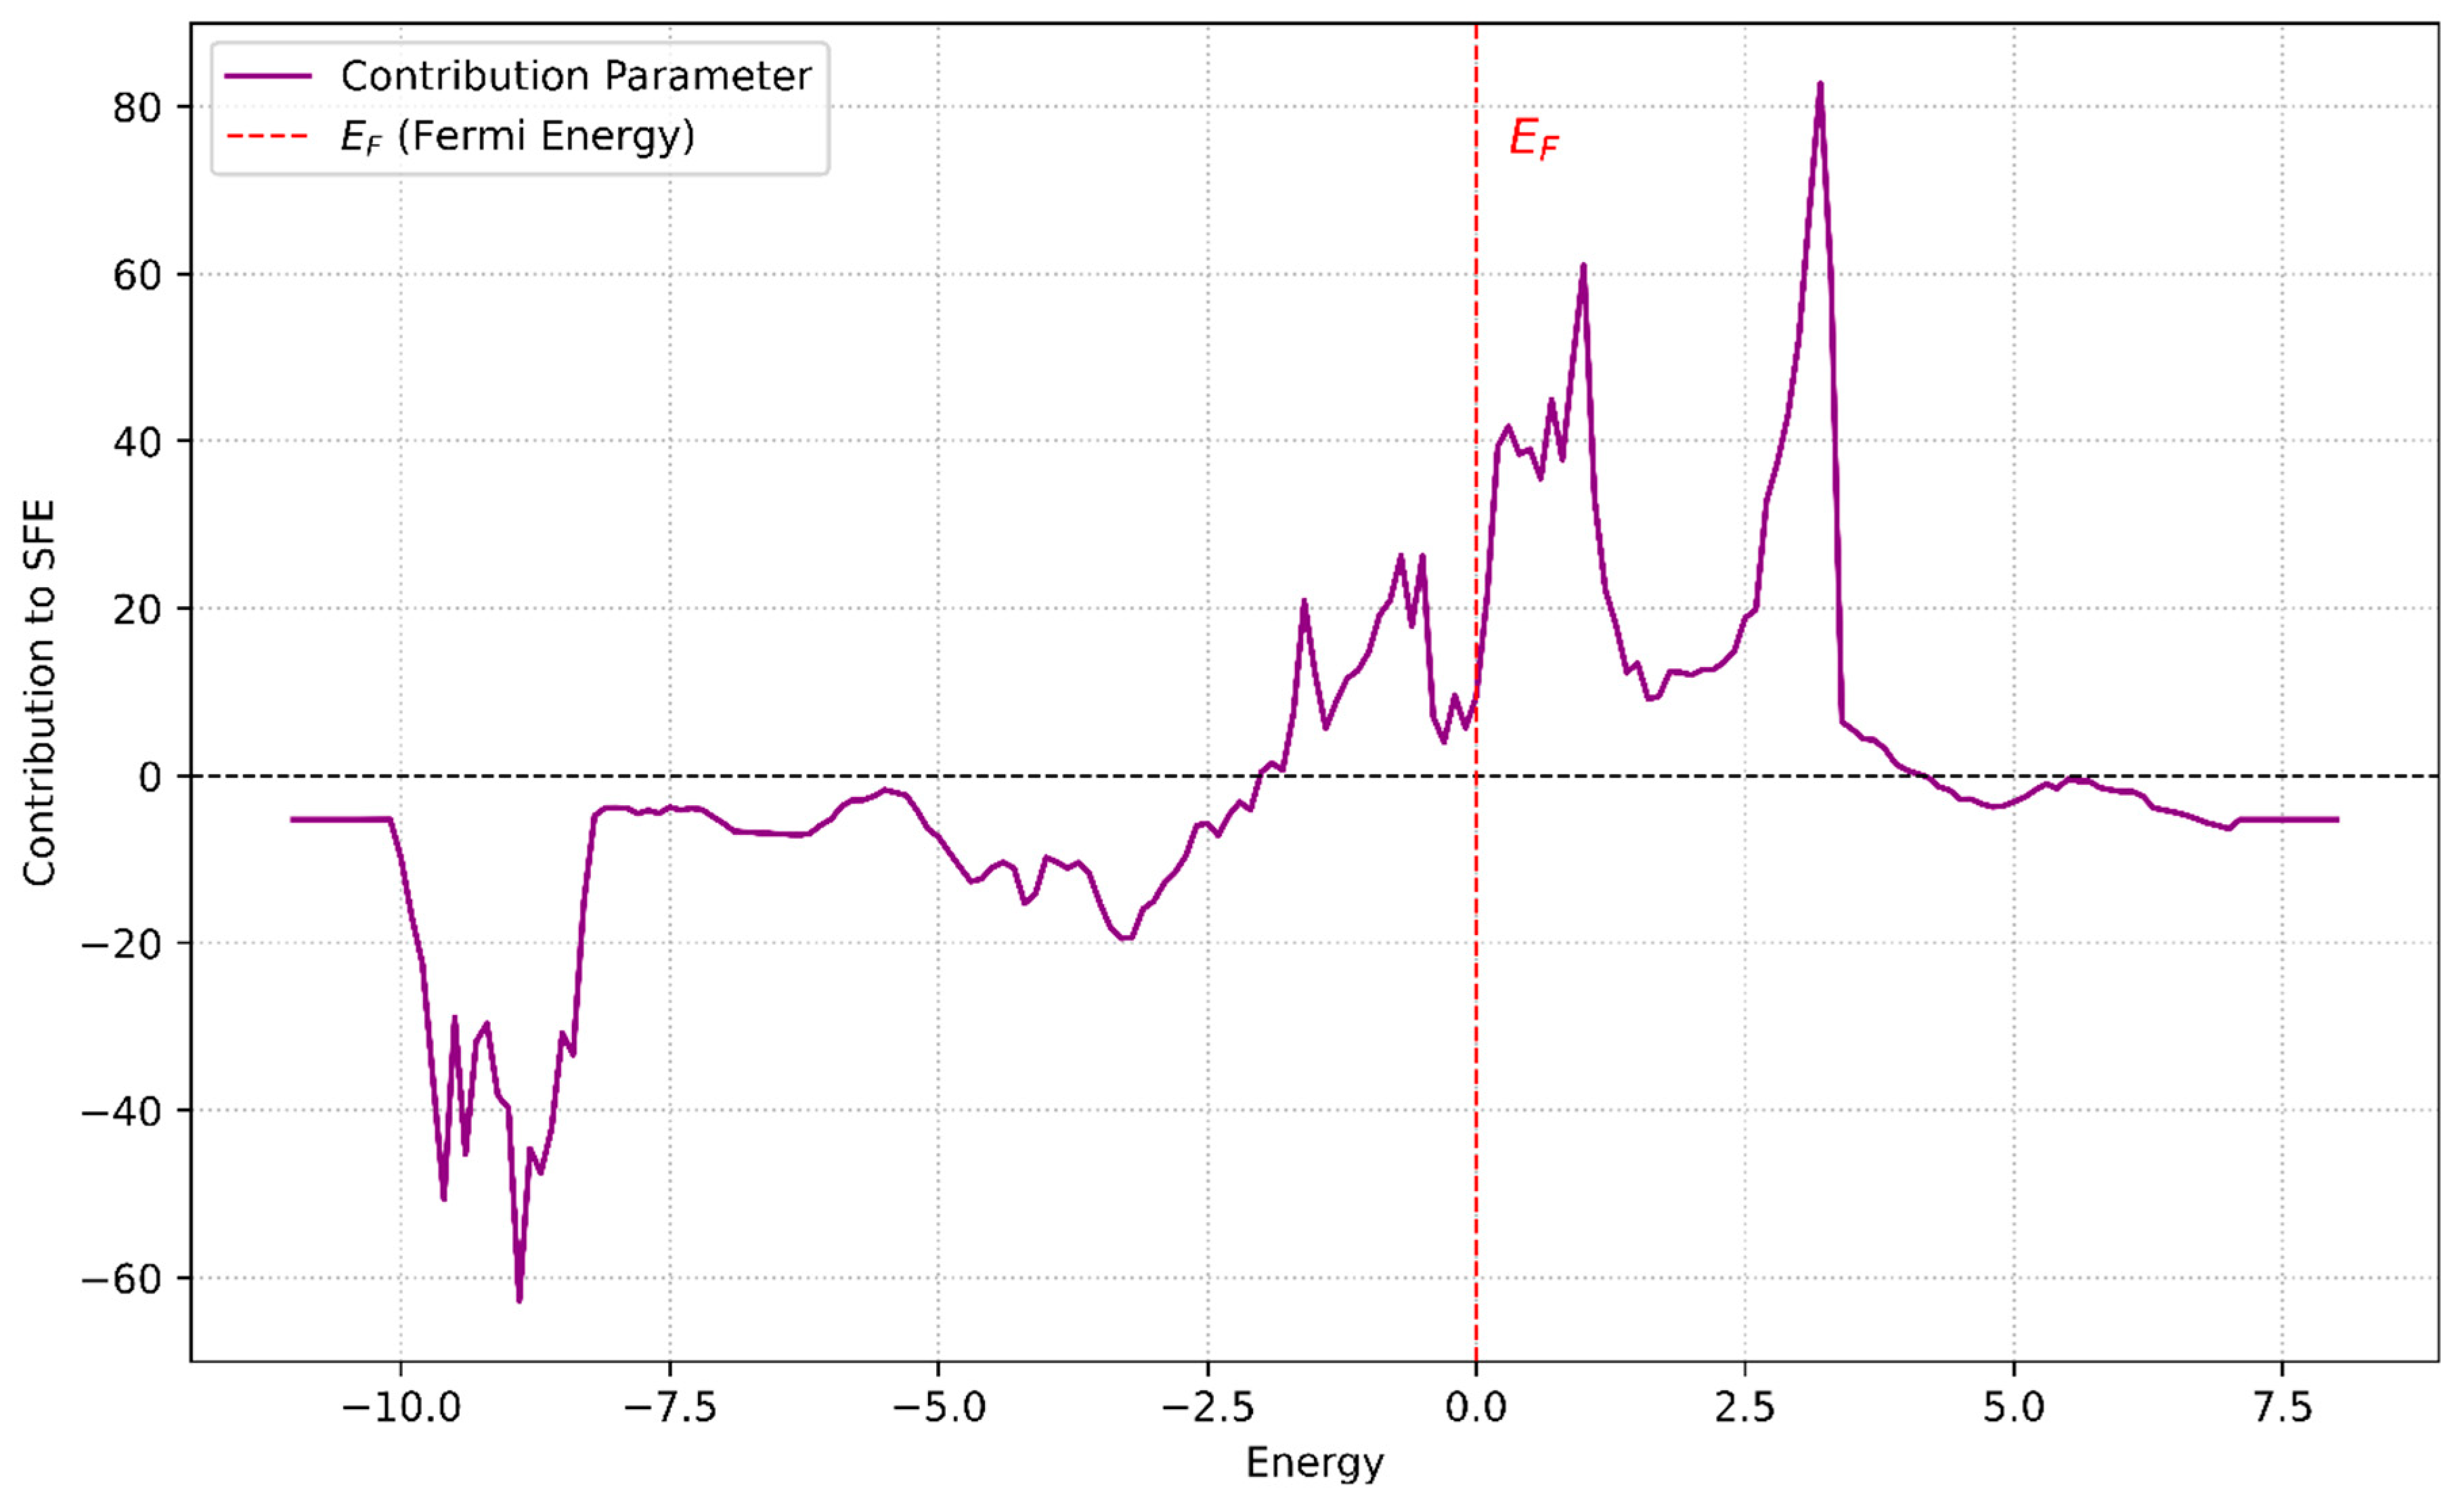
The signs and magnitudes of the regression coefficients can be used to interpret how energy regions in the DOS influence SFE. For example, PC1 and PC4 contribute negatively to SFE, which corresponds to spectral regions around −5 eV to −2 eV. In contrast, PC3 and PC5 contribute positively and are associated with features near and above the Fermi level (0 to +4 eV). Thus, a material whose DOS emphasizes energy levels in the negative-contributing region will tend to have a lower SFE. Figure 5 illustrates the ‘contribution parameter’ as a function of energy (eV), which effectively maps these PC influences back onto the energy axis of the DOS. The contribution parameter was calculated by multiplying each principal component’s loadings by its respective linear regression coefficient and then summing these products to determine the overall influence of different energy ranges on the SFE. From the figure, three main energy regions can be discerned:
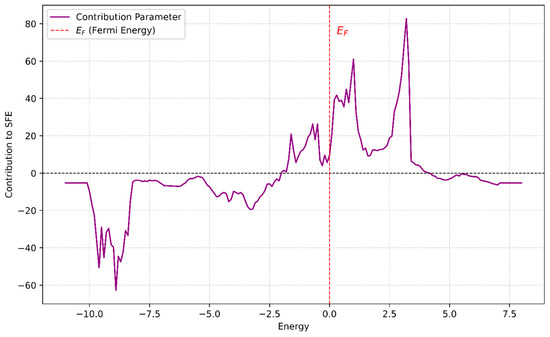
Figure 5.
Energy-dependent contribution parameter connecting the DOS to the SFE. The plot illustrates the contributions of energy levels (derived via PCA) to SFE, calculated as a weighted sum of the PC loadings and their respective regression coefficients. The vertically dashed red line at E = 0 represents the Fermi energy. Positive contributions, particularly around E ≈ 3, correspond to stabilizing effects that enhance SFE, while negative contributions, such as those at E < −2, signify destabilizing effects that reduce SFE.
(1) −10 eV to −8.2 eV: Strong negative contribution to SFE. Electronic states in this range, if emphasized, would lower the SFE. (2) −5.4 eV to −2 eV: Mild negative contribution. States in this region moderately decrease the SFE (3) −2.0 eV to 4.0 eV: Positive contribution. Here, the electronic states would increase the SFE.
These insights are applied to analyze the effect of alloying on SFE. For example, pure Cu has an SFE of about 45 mJ/m2, and Zn’s DOS is predominantly located in the −5 to −2 eV range (a region shown to reduce SFE). Consequently, adding Zn to Cu lowers the SFE. Indeed, when 10%, 20%, and 30% Zn are introduced, the SFE decreases to approximately 35, 18, and 14 mJ/m2, respectively. This demonstrates how the identified energy-dependent contributions can guide understanding and predicting the impact of compositional changes on SFE.
3.3.1. SFE Prediction in Cu-Zn Binary Alloys
Predicting the SFE of Cu-Zn alloys directly from first principles can be computationally expensive, particularly when exploring a wide compositional space. To address this challenge, we approximated the alloy’s density of states using a weighted linear combination of DOS profiles for the constituent pure elements. Specifically, if an alloy is composed of Cu and Zn with mole fractions and the alloy DOS can be approximated as:
Although this approach does not capture all the subtleties of alloying—such as local chemical ordering, lattice distortions, or complex hybridization effects—it provides a reasonable first-order estimate of the electronic structure near the Fermi level. Future work will incorporate the fully calculated alloy DOS and assess the added amount of information in that representation. Once we had the estimated DOS of the alloys from the elemental DOS, we applied the UMAP model, trained earlier on the DOS of the elements, and reduced the dimensionality in the DOS of the alloys. Then, using the trained random forest model, we predicted the SFE of the elements:
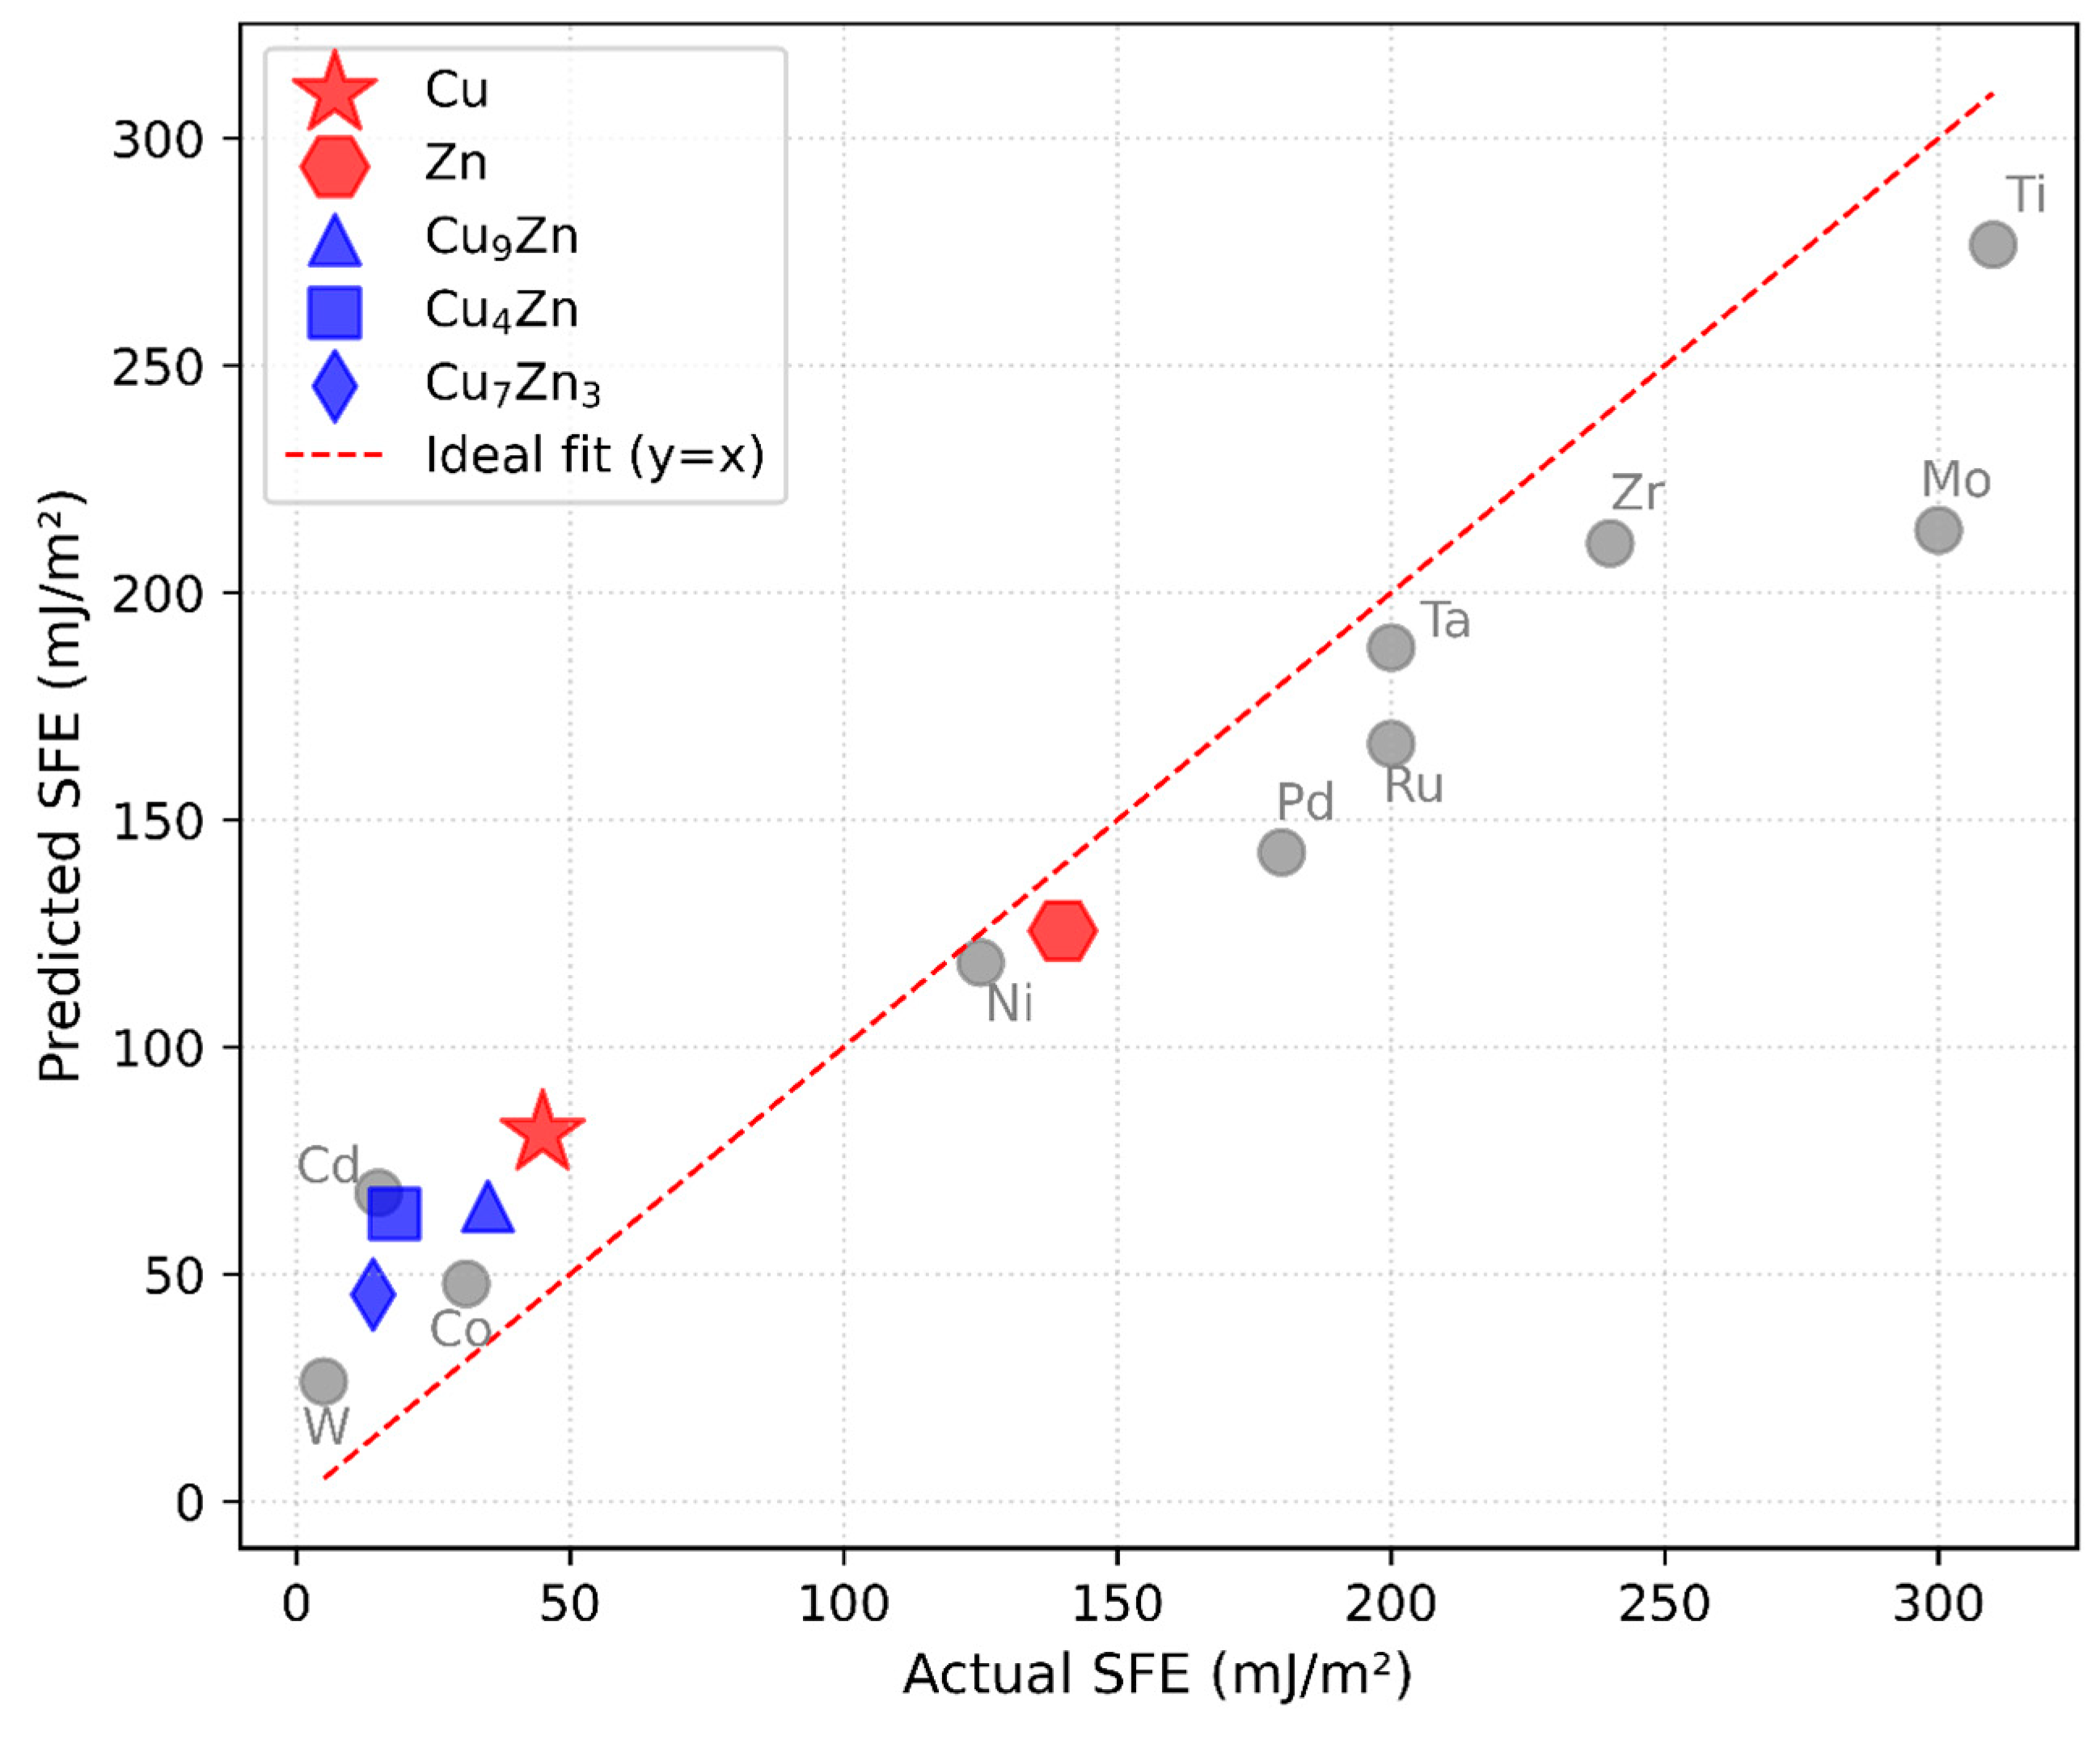
where f is the nonlinear function learned by a regression model. The complex non-linear relationship between DOS and SFE is captured by the regression model. The function refers to a trained random forest regression model that maps UMAP-reduced DOS features to predict SFE values. While is not analytically defined, the model file, preprocessing steps, and example usage code are provided in our GitHub repository mentioned in this manuscript. After predicting the SFE, correction factors derived from elemental scaling considerations were applied. This step compensated for systematic biases introduced by the linear DOS approximation. Figure 6 presents the comparison between experimentally measured SFEs and those predicted by our DOS-based machine learning approach for a set of Cu-Zn alloys. The data points for pure Cu, Zn, and intermediate compositions (Cu9Zn, Cu4Zn, and Cu7Zn3) are plotted against the line y = x, representing ideal agreement. The results show that, despite the simplifying assumptions, our predictions aligned reasonably well with experimental measurements for most Cu-Zn compositions. Notably, compositions with higher Zn content, which are expected to lower the SFE, exhibit predicted values that closely tracked their experimental counterparts. Figure 6 and Figure 7 likewise correspond to intrinsic SFE predictions. Differentiation between stable, unstable, or twin-related stacking faults is beyond the current scope and will be explored in future work with more diverse training data.
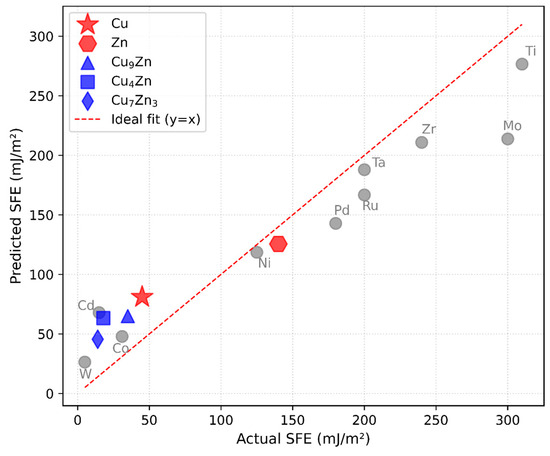
Figure 6.
Comparison of predicted versus experimentally measured stacking fault energies for elemental Cu and Zn and for Cu-Zn alloys with various compositions. The red dashed line represents the ideal one-to-one correspondence. Most data points lie close to the diagonal, indicating that the model, despite using simplified DOS approximations and correction factors, effectively captures the compositional influence on SFE.
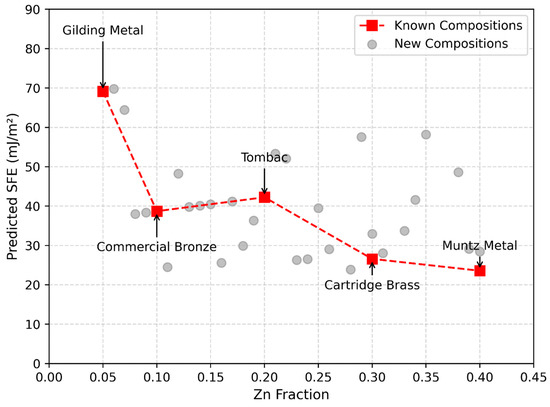
Figure 7.
Relationship between Zn fraction and predicted stacking fault energy for Cu-Zn alloys, generated using the density of states–based prediction model. As the Zn fraction increased, the SFE decreased, consistent with experimental trends for known alloys such as gilding metal, commercial bronze, tombac, cartridge brass, and Muntz metal.
3.3.2. Designing Binary Alloys with Tailored Mechanical Properties
The machine learning model, developed using DOS data for pure elements, can be extended to binary alloys by approximating the alloy’s DOS as a weighted linear combination of the DOS profiles of the constituent pure elements based on their mole fractions. This approximation allows predicting the SFE of binary alloys, which would otherwise require complex computational methods or experimental validation. The Cu-Zn alloy system is well-studied, and the mechanical properties of alloys with varying Zn concentrations are extensively documented [52,53,54]. We utilized this established knowledge as a validation example, showcasing how the proposed methodology can be extended to design new alloys with estimated SFE and mechanical properties. Specifically, we used the ML model, trained on density of states data of pure elements, to predict the SFE of binary alloys by approximating their DOS through a weighted linear combination of the DOS profiles of the constituent elements.
The predicted SFE values for Cu-Zn alloys with Zn concentrations ranging from 5% to 40% followed a decreasing trend with increasing Zn content (Figure 7). This trend was consistent with known experimental observations, indicating that our approach provided accurate SFE estimates without requiring direct computational or experimental determination of alloy SFE. For unknown alloy systems, where direct experimental data may be unavailable or limited, this approach offers a viable alternative for estimating SFE.
Since SFE correlates closely with mechanical properties—such as strength, ductility, and strain-hardening behavior—predicting SFE can provide valuable insights into the potential mechanical performance of new alloys. For example, in an unknown binary alloy system (A-B), by varying the concentration of element B in element A and applying the same weighted DOS combination approach, it would be possible to estimate how SFE changes with composition. This information can guide alloy design by selecting compositions likely to exhibit desirable mechanical properties for specific applications, such as high strength or enhanced formability.
Although this study demonstrated the framework using Cu-Zn binary alloys, the same methodology is extensible to ternary and quaternary alloys. If the DOS for a multicomponent alloy can be approximated or calculated, the model can directly predict the corresponding SFE. Future work will focus on expanding the dataset to include multicomponent systems and evaluating performance under more complex configurations. Furthermore, this methodology allows for rapid screening of alloy compositions. Instead of relying on resource-intensive computational simulations or experiments, researchers can quickly generate approximate DOS profiles for a large number of binary or even ternary alloys, predict their SFE, and narrow down promising candidates for further experimental validation. Such an approach could be especially useful for novel alloy systems, including those containing less conventional elements or high-entropy alloys where experimental data is sparse.
4. Conclusions
In this paper, we applied an informatics analysis to the DOS of Al alloys with planar faults and demonstrated a data-driven framework for predicting stacking fault energy and gaining insight into the electronic-structure origins of this critical mechanical property. The purpose of this work was to understand the mechanism of deformation of these materials in terms of variation in the DOS spectra. The primary interpretation of the spectra from visual examination was that the change in DOS spectra with planar faults was due to p-d hybridization, for both the L10-Al3Sc and L12-TiAl alloys. Our analysis captured these conclusions, but by applying an informatics analysis to the data, other conclusions became evident. For the Ti-Al system, the variance in DOS between different types of faults (anti-phase boundaries and stacking faults) was due to d-orbital interactions at the fault and also a broadening of the peak at the energies corresponding to p-d hybridization. The impact of the fault plane was described, with the p-d hybridization being much stronger for anti-phase boundaries in the {100} plane instead of the {111} plane. For the Al-Sc system, we were able to better identify the deformation mechanism resulting from p-d hybridization. The change in DOS due to the addition of planar faults was primarily due to the change in the partial DOS of Sc, while the change in DOS due to fault stability was reflected in the partial DOS of Al. These interpretations allow us to better understand the deformation mechanisms resulting from planar faults in terms of chemistry, structure, and defects, and how these impact the properties of a material.
In the second part of this study, we developed a predictive framework to estimate stacking fault energy using density of states spectral data, dimensionality reduction techniques, and machine learning models. By employing principal component analysis and uniform manifold approximation and projection, we extracted key features from high-resolution vector representation of DOS data, which were subsequently used as input for regression models. Among these models, the random forest regressor, coupled with UMAP-reduced features, demonstrated the highest predictive accuracy, achieving R2 = 0.86 and a mean absolute error of 15.46 mJ/m2. The methodology was further extended to alloy systems, using Cu-Zn binary alloys as a case study. We approximated the DOS of alloys through a linear combination of elemental DOS profiles and used the trained random forest model to predict their SFEs. Despite the simplifications involved, including the neglect of local chemical ordering and lattice distortions, the model captured key trends in alloy SFE. The predictions aligned well with experimentally measured values. This establishes a quantitative link between electronic structure and mechanical properties, providing a scalable and efficient tool for alloy design. By integrating this framework with prior methodologies that connect defects and microstructure, we bridge multiple length scales, offering insights into how chemistry influences both electronic and mechanical behaviors.
This study simplifies alloy electronic structure by approximating the DOS as a linear superposition of elemental DOS, which may neglect local hybridization and lattice relaxation. Additionally, the small dataset size limits generalizability, and the model currently does not account for temperature or mechanical stress effects. Future work will address these limitations through expanded datasets, DFT-calculated alloy DOS, and inclusion of thermomechanical descriptors.
Author Contributions
M.T.I. performed the analysis. S.R.B. conceptualized the idea. All authors have read and agreed to the published version of the manuscript.
Funding
This research was funded by the U.S. Department of Defense through the Collaborative Agreement Number 2024053-143006.
Data Availability Statement
The datasets generated and analyzed during the current study, along with the code used for data processing and model development, are available in the GitHub repository: https://github.com/tohid-1222/SFE_prediction/ (accessed on 22 April 2025).
Acknowledgments
This report is the property of the National Center of Manufacturing Sciences (NCMS) prepared through the Collaborative Agreement Number 2024053-143006. Although the effort and this report is/was sponsored by the U.S. Department of Defense, the content of the report does not necessarily reflect the position or policy of the Government; no official endorsement should be inferred. Neither NCMS, nor anyone acting on behalf of NCMS makes any warranty or representation, express or implied, with respect to the accuracy, completeness, or usefulness of the information contained in this report, or that the use of any information, apparatus, method, or process disclosed in this report will not infringe privately-owned rights, or assumes any liability with respect to the use of, or for damages resulting from the use of, any information, apparatus, method, or process disclosed in this report.
Conflicts of Interest
The authors declare no competing interests.
Abbreviations
| SFE | Stacking Fault Energy |
| DOS | Density of States |
| PCA | Principal Component Analysis |
| UMAP | Uniform Manifold Approximation and Projection |
| ML | Machine Learning |
| APB | Anti-Phase Boundary |
| CSF | Complex Stacking Fault |
| SISF | Superlattice Intrinsic Stacking Fault |
| ISF | Intrinsic Stacking Fault |
| USF | Unstable Stacking Fault |
| PDOS | Partial Density of States |
| EF | Fermi Energy |
| MAE | Mean Absolute Error |
| R2 | Coefficient of Determination |
| RF | Random Forest |
| DFT | Density Functional Theory |
| GGA | Generalized Gradient Approximation |
| PAW | Projector Augmented Wave |
| L10 | Tetragonal Intermetallic Structure |
| L12 | Cubic Ordered Intermetallic Structure |
References
- Perez, N. Crystal Defects. In Materials Science: Theory and Engineering; Perez, N., Ed.; Springer Nature: Switzerland, Cham, 2024; pp. 207–263. [Google Scholar] [CrossRef]
- Li, P.; Li, S.X.; Wang, Z.G.; Zhang, Z.F. Fundamental factors on formation mechanism of dislocation arrangements in cyclically deformed fcc single crystals. Prog. Mater. Sci. 2011, 56, 328–377. [Google Scholar] [CrossRef]
- Schönecker, S.; Li, W.; Vitos, L.; Li, X. Effect of strain on generalized stacking fault energies and plastic deformation modes in fcc-hcp polymorphic high-entropy alloys: A first-principles investigation. Phys. Rev. Mater. 2021, 5, 075004. [Google Scholar] [CrossRef]
- Vítek, V. Multilayer stacking faults and twins on {211} planes in B.C.C. metals. Scr. Metall. 1970, 4, 725–732. [Google Scholar] [CrossRef]
- Ericsson, T. The temperature and concentration dependence of the stacking fault energy in the Co-Ni system. Acta Metall. 1966, 14, 853–865. [Google Scholar] [CrossRef]
- Andric, P.; Yin, B.; Curtin, W.A. Stress-dependence of generalized stacking fault energies. J. Mech. Phys. Solids 2019, 122, 262–279. [Google Scholar] [CrossRef]
- Shang, S.L.; Zacherl, C.L.; Fang, H.Z.; Wang, Y.; Du, Y.; Liu, Z.K. Effects of alloying element and temperature on the stacking fault energies of dilute Ni-base superalloys. J. Phys. Condens. Matter 2012, 24, 505403. [Google Scholar] [CrossRef] [PubMed]
- Zhang, J.; Dou, Y.; Liu, G.; Guo, Z. First-principles study of stacking fault energies in Mg-based binary alloys. Comput. Mater. Sci. 2013, 79, 564–569. [Google Scholar] [CrossRef]
- Li, R.; Lu, S.; Kim, D.; Schönecker, S.; Zhao, J.; Kwon, S.K.; Vitos, L. Stacking fault energy of face-centered cubic metals: Thermodynamic and ab initio approaches. J. Phys. Condens. Matter 2016, 28, 395001. [Google Scholar] [CrossRef]
- Arora, G.; Kamrava, S.; Tahmasebi, P.; Aidhy, D.S. Charge-density based convolutional neural networks for stacking fault energy prediction in concentrated alloys. Materialia 2022, 26, 101620. [Google Scholar] [CrossRef]
- Li, X.; Chen, K.; Wang, C.; Zhuo, T.; Li, H.; Wu, Y.; Lei, X.; Li, M.; Chen, B.; Chai, B. Correlation analysis of materials properties by machine learning: Illustrated with stacking fault energy from first-principles calculations in dilute fcc-based alloys. J. Phys. Condens. Matter 2021, 33, 295702. [Google Scholar]
- Chaudhary, N.; Abu-Odeh, A.; Karaman, I.; Arróyave, R. A data-driven machine learning approach to predicting stacking faulting energy in austenitic steels. J. Mater. Sci. 2017, 52, 11048–11076. [Google Scholar] [CrossRef]
- Wang, T.; Zhang, K.; Thé, J.; Yu, H. Accurate prediction of band gap of materials using stacking machine learning model. Comput. Mater. Sci. 2022, 201, 110899. [Google Scholar] [CrossRef]
- Wu, T.; Gao, R.; Tang, X.; Chu, Z.; Ye, B.; Yuan, Z. Deformation mechanism of L12-type multicomponent intermetallics: The generalized stacking fault energy and chemical bonds. Mater. Des. 2023, 228, 111824. [Google Scholar]
- Ikeda, Y.; Körmann, F. Impact of N on the Stacking Fault Energy and Phase Stability of FCC CrMnFeCoNi: An Ab Initio Study. J. Phase Equilib. Diffus. 2021, 42, 551–560. [Google Scholar] [CrossRef]
- Linda, A.; Akhtar Md, F.; Pathak, S.; Bhowmick, S. Accelerating the prediction of stacking fault energy by combining ab initio calculations and machine learning. Phys. Rev. B 2024, 109, 214102. [Google Scholar] [CrossRef]
- Stange, H.; Brunken, S.; Hempel, H.; Rodriguez-Alvarez, H.; Schäfer, N.; Greiner, D.; Scheu, A.; Lauche, J.; Kaufmann, C.A.; Unold, T.; et al. Effect of Na presence during CuInSe2 growth on stacking fault annihilation and electronic properties. Appl. Phys. Lett. 2015, 107, 152103. [Google Scholar] [CrossRef]
- Mapping the Relationship Among Composition, Stacking Fault Energy and Ductility in Nb Alloys: A First-Principles Study—ScienceDirect. Available online: https://www-sciencedirect-com.gate.lib.buffalo.edu/science/article/pii/S1359645417309722 (accessed on 22 March 2025).
- Liu, J.; Zou, H.; Deng, F.; Liu, Y.; Li, W.; Xu, J.; Liu, S.; Wu, Q.; Zhang, X.; Weng, F.; et al. The structural stability, mechanical properties and stacking fault energy of Al3Zr precipitates in Al-Cu-Zr alloys: HRTEM observations and first-principles calculations. J. Alloys Compd. 2024, 42, 1764–1776. [Google Scholar]
- Harris, I.R.; Dillamore, I.L.; Smallman, R.E.; Beeston, B.E.P. The Influence of D-Band Structure on Stacking-Fault Energy. Philos. Mag. 1966, 14, 325–333. [Google Scholar] [CrossRef]
- Kumar, K.; Sankarasubramanian, R.; Waghmareb, U. Influence of dilute solute substitutions in Ni on its generalized stacking fault energies and ductility. Comput. Mater. Sci. 2018, 150, 424–431. [Google Scholar] [CrossRef]
- Shen, Y.; Wang, H.; An, Q. Modified Generalized-Stacking-Fault Energy Surface of II-VI Ionic Crystals from Excess Electrons and Holes. ACS Appl. Electron. Mater. 2019, 2, 56–65. [Google Scholar] [CrossRef]
- Xie, T.; Grossman, J.C. Crystal Graph Convolutional Neural Networks for an Accurate and Interpretable Prediction of Material Properties. Phys. Rev. Lett. 2018, 120, 145301. [Google Scholar] [CrossRef] [PubMed]
- Park, C.W.; Wolverton, C. Developing an improved crystal graph convolutional neural network framework for accelerated materials discovery. Phys. Rev. Mater. 2020, 4, 063801. [Google Scholar] [CrossRef]
- Réau, M.; Renaud, N.; Xue, L.C.; Bonvin, A.M.J.J. DeepRank-GNN: A graph neural network framework to learn patterns in protein–protein interfaces. Bioinformatics 2023, 39, btac759. [Google Scholar] [CrossRef]
- Dunn, A.; Wang, Q.; Ganose, A.; Dopp, D.; Jain, A. Benchmarking materials property prediction methods: The Matbench test set and Automatminer reference algorithm. npj Comput. Mater. 2020, 6, 138. [Google Scholar] [CrossRef]
- Shlomi, J.; Battaglia, P.; Vlimant, J.-R. Graph neural networks in particle physics. Mach. Learn. Sci. Technol. 2020, 2, 021001. [Google Scholar] [CrossRef]
- Broderick, S.R.; Rajan, K. Eigenvalue decomposition of spectral features in density of states curves. EPL 2011, 95, 57005. [Google Scholar] [CrossRef]
- Broderick, S.R.; Aourag, H.; Rajan, K. Classification of Oxide Compounds through Data-Mining Density of States Spectra. J. Am. Ceram. Soc. 2011, 94, 2974–2980. [Google Scholar] [CrossRef]
- Broderick, S.R.; Aourag, H.; Rajan, K. Data mining density of states spectra for crystal structure classification: An inverse problem approach. Stat. Anal. Data Min. ASA Data Sci. J. 2009, 1, 353–360. [Google Scholar] [CrossRef]
- Greenacre, M.; Groenen, P.J.; Hastie, T.; d’Enza, A.I.; Markos, A.; Tuzhilina, E. Principal component analysis. Nat. Rev. Methods Primers 2022, 2, 100. [Google Scholar] [CrossRef]
- Kývala, L.; Montero de Hijes, P.; Dellago, C. Unsupervised identification of crystal defects from atomistic potential descriptors. npj Comput. Mater. 2025, 11, 50. [Google Scholar] [CrossRef]
- Murata, T.; Saito, N.; Koyama, E.; Phuong, T.N.T.; Misawa, R.; Yokomizo, S.; Mato, T.; Takada, Y.; Hirose, S.; Katsura, Y. Data-driven analysis and visualization of dielectric properties curated from scientific literature. Sci. Technol. Adv. Mater. Methods 2025, 2485018. [Google Scholar] [CrossRef]
- Rahimi, M.; Mehrpanah, A.; Mouchani, P.; Rahimi, E.; Salaudeen, S.A. Optimizing Methane Uptake on N/O Functionalized Graphene via DFT, Machine Learning, and Uniform Manifold Approximation and Projection (UMAP) Techniques. Ind. Eng. Chem. Res. 2024, 63, 18940–18956. [Google Scholar] [CrossRef]
- Broderick, S.R.; Nowers, J.R.; Narasimhan, B.; Rajan, K. Tracking Chemical Processing Pathways in Combinatorial Polymer Libraries via Data Mining. J. Comb. Chem. 2010, 12, 270–277. [Google Scholar] [CrossRef] [PubMed]
- Broderick, S.R.; Suh, C.; Provine, J.; Roper, C.S.; Maboudian, R.; Howe, R.T.; Rajan, K. Application of principal component analysis to a full profile correlative analysis of FTIR spectra. Surf. Interface Anal. 2012, 44, 365–371. [Google Scholar] [CrossRef]
- Xu, P.; Ji, X.; Li, M.; Lu, W. Small data machine learning in materials science. npj Comput. Mater. 2023, 9, 42. [Google Scholar] [CrossRef]
- Kurita, T. Principal Component Analysis (PCA). In Computer Vision: A Reference Guide; Ikeuchi, K., Ed.; Springer International Publishing: Cham, Switzerland, 2021; pp. 1013–1016. [Google Scholar] [CrossRef]
- Saidi, F.; Khetari, S.; Yahia, I.S.; Zahran, H.Y.; Hidouri, T.; Ameur, N. The use of principal component analysis (PCA) and partial least square (PLS) for designing new hard inverse perovskites materials. Comput. Condens. Matter 2022, 31, e00667. [Google Scholar] [CrossRef]
- Wu, J.; Wen, L.; Tang, B.-Y.; Peng, L.; Ding, W.-J. Generalized planner fault energies, twinning and ductility of L12 type Al3Sc and Al3Mg. Solid. State Sci. 2011, 13, 120–125. [Google Scholar] [CrossRef]
- Woodward, C.; MacLaren, J.M.; Rao, S. Electronic structure of planar faults in TiAl. J. Mater. Res. 1992, 7, 1735–1750. [Google Scholar] [CrossRef]
- Fukunaga, K.; Shouji, T.; Miura, Y. Temperature dependence of dislocation structure of L12–Al3Sc. Mater. Sci. Eng. A 1997, 239–240, 202–205. [Google Scholar] [CrossRef]
- Daffertshofer, A.; Lamoth, C.J.C.; Meijer, O.G.; Beek, P.J. PCA in studying coordination and variability: A tutorial. Clin. Biomech. 2004, 19, 415–428. [Google Scholar] [CrossRef]
- Eriksson, L.; Byrne, T.; Johansson, E.; Trygg, J.; Vikström, C. Multi- and Megavariate Data Analysis Basic Principles and Applications; Umetrics Academy: Umeå, Sweden, 2013. [Google Scholar]
- Berthiaux, H.; Mosorov, V.; Tomczak, L.; Gatumel, C.; Demeyre, J.F. Principal component analysis for characterising homogeneity in powder mixing using image processing techniques. Chem. Eng. Process. Process Intensif. 2006, 45, 397–403. [Google Scholar] [CrossRef]
- Suh, C.; Rajagopalan, A.; Li, X.; Rajan, K. The application of Principal Component Analysis to materials science data. Data Sci. J. 2002, 1, 19–26. [Google Scholar] [CrossRef]
- Edalati, K.; Akama, D.; Nishio, A.; Lee, S.; Yonenaga, Y.; Cubero-Sesin, J.M.; Horita, Z. Influence of dislocation–solute atom interactions and stacking fault energy on grain size of single-phase alloys after severe plastic deformation using high-pressure torsion. Acta Mater. 2014, 69, 68–77. [Google Scholar] [CrossRef]
- Hirth, J.P.; Lothe, J.; Mura, T. Theory of Dislocations. J. Appl. Mech. 1983, 50, 476–477. [Google Scholar] [CrossRef]
- Islam, M.T.; Liu, Q.; Broderick, S. Machine Learning Accelerated Design of High-Temperature Ternary and Quaternary Nitride Superconductors. Appl. Sci. 2024, 14, 9196. [Google Scholar] [CrossRef]
- Bang, K.; Yeo, B.C.; Kim, D.; Han, S.S.; Lee, H.M. Accelerated mapping of electronic density of states patterns of metallic nanoparticles via machine-learning. Sci. Rep. 2021, 11, 11604. [Google Scholar] [CrossRef]
- Edalati, K.; Horita, Z. High-pressure torsion of pure metals: Influence of atomic bond parameters and stacking fault energy on grain size and correlation with hardness. Acta Mater. 2011, 59, 6831–6836. [Google Scholar] [CrossRef]
- Xu, X.; Zhu, W.; Yuan, M.; Liang, C.; Deng, Y. The effect of Zn content on the microstructure and mechanical properties of the Al-mg-Si alloy. Mater. Charact. 2023, 198, 112714. [Google Scholar] [CrossRef]
- Jang, H.W.; Hong, J.-W. Influence of Zinc Content on the Mechanical Behaviors of Cu-Zn Alloys by Molecular Dynamics. Materials 2020, 13, 2062. [Google Scholar] [CrossRef]
- Hong, H.L.; Wang, Q.; Dong, C.; Liaw, P.K. Understanding the Cu-Zn brass alloys using a short-range-order cluster model: Significance of specific compositions of industrial alloys. Sci. Rep. 2014, 4, 7065. [Google Scholar] [CrossRef]


Disclaimer/Publisher’s Note: The statements, opinions and data contained in all publications are solely those of the individual author(s) and contributor(s) and not of MDPI and/or the editor(s). MDPI and/or the editor(s) disclaim responsibility for any injury to people or property resulting from any ideas, methods, instructions or products referred to in the content. |
© 2025 by the authors. Licensee MDPI, Basel, Switzerland. This article is an open access article distributed under the terms and conditions of the Creative Commons Attribution (CC BY) license (https://creativecommons.org/licenses/by/4.0/).