Article

Tailoring Al-Doped ZnO Nanoparticles via Scalable High-Energy Ball Milling–Solid-State Reaction: Structural, Optical, and Dielectric Insights for Light-Activated Antimicrobial Defense Against Medical Device Pathogens

1
Department of Physics, College of Science, Imam Abdulrahman Bin Faisal University, P.O. Box 1982, Dammam 31441, Saudi Arabia
2
Basic & Applied Scientific Research Center (BASRC), Imam Abdulrahman Bin Faisal University, P.O. Box 1982, Dammam 31441, Saudi Arabia
3
Department of Physics, College of Science, Jouf University, Sakaka P.O. Box 2014, Saudi Arabia
4
Department of Biology, College of Science, Imam Abdulrahman Bin Faisal University, P.O. Box 1982, Dammam 31441, Saudi Arabia
5
Department of Chemistry, College of Science, Imam Abdulrahman Bin Faisal University, P.O. Box 1982, Dammam 31441, Saudi Arabia
*
Author to whom correspondence should be addressed.
Crystals 2025, 15(5), 397; https://doi.org/10.3390/cryst15050397
Submission received: 19 March 2025 / Revised: 12 April 2025 / Accepted: 18 April 2025 / Published: 24 April 2025

Abstract

:
This study reports the synthesis of aluminum-doped ZnO nanoparticles (Al-ZnO NPs) via a top-down mechanochemical solid-state reaction (SSR) approach using high-energy ball milling (HEBM) as a rapid, controllable, and efficient method. Al-ZnO samples were characterized using X-ray diffraction (XRD), Fourier-transform infrared spectroscopy (FT-IR), transmission electron microscopy (TEM), scanning electron microscopy (SEM), energy-dispersive spectroscopy (EDS), and UV-Vis diffuse reflectance spectroscopy. Significantly, the band gap decreased by 0.215 eV when transitioning from pure ZnO to 9 wt.% Al-doped ZnO (Al-ZnO9). TEM analysis showed that after 4 h of milling at 1000 rpm, the particle size was reduced to 59 nm, exhibiting a spherical morphology crucial for enhanced bioactivity. The antimicrobial properties of the Al-ZnO NPs were evaluated using the well diffusion method against various pathogenic microorganisms, with a particular focus on Staph. aureus ATCC 29213 and Staph. epidermidis ATCC 12228, given their clinical significance as common pathogens in infections related to medical implants and prosthetics. Al-ZnO9 demonstrated superior antibacterial performance, producing inhibition zones of 13 mm and 15 mm against Staph. aureus and Staph. epidermidis, respectively. Moreover, exposure to visible light further amplified the antimicrobial activity. This research underscores the potential for the scalable production of Al-ZnO NPs, presenting a promising solution for addressing infections linked to implanted medical devices.

1. Introduction

Bacteria and fungi have evolved into highly adaptable species throughout the history of life on Earth. Undoubtedly, the discovery of antibiotics and antifungals stands as one of the most groundbreaking achievements of the 20th century. However, the rise of antibiotic and antifungal resistance has left few effective antimicrobial agents available today. The misuse and overuse of these agents have significantly contributed to the development of resistance [1]. Additionally, microorganisms can acquire resistance through genetic mutations or by exchanging DNA or gene fragments with viruses [2]. Various mechanisms drive antibiotic resistance, including the production of aminoglycoside-modifying enzymes and β-lactamases [3]. The emergence of resistant pathogenic microorganisms has led to prolonged infection periods and increased mortality rates in the modern era. Despite these pressing challenges, pharmaceutical companies face significant hurdles in developing new treatments. As a result, there is an urgent need for novel antimicrobial substances. According to a recent World Health Organization (WHO) report, multidrug-resistant pathogens such as Klebsiella pneumoniae, Pseudomonas aeruginosa, Escherichia coli, Acinetobacter spp., Serratia spp., and Proteus spp. are among the most critical threats to global health [4]. Bloodstream infections and pneumonia caused by them are serious and often fatal [5]. The report urged the development sector and scientific research to help the pharmaceutical industry search for efficient therapeutic agents.
In terms of targeting ability, nanoparticles (NPs) are highly effective antimicrobial agents. Since they have a high surface area to mass ratio, are extremely small, and exhibit improved chemical and physical reaction activity as they are unable to attach to specific receptors, they inhibit the growth of bacteria/fungi-resistant strains simultaneously through a variety of biomolecular mechanisms. Due to this, NPs act differently compared to traditional antibiotics and antifungals [6].
Different metal oxide semiconductors have been studied for their ability to selectively overcome microbial species in vitro and in vivo, such as ZnS, CdS, and zinc oxide (ZnO) [7]. Furthermore, they hold great promise for applications in different fields, including electronic devices, solar cells, chemical and biosensors, laser technology, components of armor, light-emitting diodes, waveguide packaging films, parts of automobiles, super-absorbents, drug delivery, catalysts, and disease detection [8,9]. Among many metal oxides, ZnO is “generally recognized as safe” (GRAS) by the Food and Drug Administration (FDA) [10]. ZnO emerges as a prevalent n-type semiconductor with a band gap of approximately 3.3 eV, coupled with a substantial exciton binding energy of 60 meV and efficient charge transportation capabilities [11]. ZnO NPs have attracted significant interest due to their fascinating physical properties, especially in biomedical applications. Their uses are wide-ranging, encompassing areas such as drug delivery [12], antibacterial activity [13], bio-labeling [14], and bio-sensing [15]. Beyond biomedical applications, ZnO NPs are also involved in water oxidation processes and aid in the mineralization of environmental pollutants [16].
Enhancing light absorption is a common strategy for improving antibacterial activity. In this regard, many strategies have been employed, including doping with suitable elements [17], sensitization with quantum dots [18], hydrogen treatments [19], and coupling with other narrow-band-gap semiconductor oxides and sulfides [20]. As a result of the production of oxygen vacancies, all of the main drawbacks of ZnO are improved. One of the key doping elements utilized in the context of ZnO is aluminum (Al). This intentional introduction of Al atoms into the ZnO host lattice can influence its electronic structure, optical properties, and overall performance. For example, Jaballah et al. [21] demonstrated the significant influence of adding Al to ZnO on enhancing sensing performance toward H2 and CO gas. In addition, Al-doped ZnO nanosheets were used to fabricate a flexible pH sensor [22]. By doping Al into ZnO nanosheets, the sensitivity of the device improved significantly (50.2 mV/pH) compared to pure ZnO nanosheets (34.13 mV/pH) [23].
Aluminum-doped zinc oxide (Al-ZnO) NPs have been synthesized through various methods for microbial testing, including successive ionic layer adsorption and reaction (SILAR), spray pyrolysis, laser ablation, co-precipitation, and wet chemical processes. These techniques have been utilized to assess the antimicrobial activity of Al-ZnO NPs, typically evaluated using the agar diffusion method, as outlined in Table 1. However, these methods often involve time-consuming chemical processes, generating chemical waste, and yield limited quantities of NPs. In contrast, the solid-state reaction (SSR) approach, particularly when combined with the high-energy ball milling (HEBM) technique, offers a more sustainable alternative by minimizing toxicity and chemical waste. The HEBM-assisted SSR method relies on high-energy mechanochemical transformations between powdered materials in a solid-state environment to produce doped NPs. This method offers significant economic advantages for industrial scale-up, including (i) lower production costs compared to solution-based methods by eliminating solvents and reducing waste [24,25]; (ii) direct scalability using existing industrial ball milling equipment, with the technique recognized for its potential to produce tonnage quantities of materials [26]; and (iii) applicability in high-value markets such as medical applications, consistent with the growing demand for advanced materials in healthcare sectors [27]. Therefore, this approach reduces pollution while enabling the rapid and scalable synthesis of doped ZnO at optimized speeds and times [28,29].
Despite the considerable research on doped ZnO for antimicrobial applications, it is essential to note that critical parameters, specifically the testing conditions (liquid vs. solid media) and light exposure, can significantly influence microbial inhibition. As shown in Table 1, these aspects have not been considered deeply. This study establishes a new paradigm in antimicrobial nanomaterial design through three key innovations. First, we use an HEBM-SSR synthesis approach that simultaneously achieves high Al doping (9 wt.%), controlled oxygen vacancies, and spherical nanoparticle morphology, a combination not previously demonstrated. Second, we introduce a comprehensive evaluation of how doping-induced electronic structure modifications interact with environmental conditions (media state, light exposure) to govern antimicrobial efficacy. Third, we pioneer a targeted antimicrobial strategy against medical-device-relevant pathogens, with a specific focus on Staph. epidermidis biofilm prevention.

2. Experimental Section

2.1. Synthesis

The base materials used were commercial ZnO powder (purity > 99.9%) and commercial aluminum oxide Al2O3 (purity of >99.9%). All reagent materials were purchased from Sigma Aldrich. The powders were mixed according to the stoichiometric amounts required for the SSR to achieve the desired doping concentrations. Al was added to commercial ZnO powder at different doping levels of 0, 3, 5, 7, and 9 wt.%.
The weight percentage of Al doping was calculated as follows:
wt . %   Al   Doping = m a s s   o f   A l 2 O 3 m a s s   o f   Z n O + m a s s   o f   A l 2 O 3 × 100
For reproducibility, the exact masses used for each sample are provided in Table 2. A fixed mass of 3 g ZnO was used for all samples, with Al2O3 added according to the target doping level.
To convert the weight percentage of Al2O3 into the atomic fraction x in AlxZn1xO, the following derivation can be applied:
x = M o l e s   o f   A l 3 + T o t a l   c a t i o n s = M o l e s   o f   A l 3 + M o l e s   o f   A l 3 + + M o l e s   o f   Z n 2 + = 2 × α 100 α × M Z n O M A l 2 O 3 1 + 2 × α 100 α × M Z n O M A l 2 O 3
α represents the weight percentage (wt.%) of Al2O3 in the starting mixture, while M Z n O and M A l 2 O 3 are the molar masses, respectively, of ZnO and Al2O3. During the SSR synthesis, each substitution of Zn2+ by Al3+ introduces a charge imbalance of +1. To maintain charge neutrality, one oxygen vacancy compensates for two Al3+ substitutions, as per the defect reaction:
2 A l Z n V O + 1 2 O 2 g  
where A l Z n   denotes Al3+ at Zn2+ site (+1 effective charge), and V O refers to the doubly charged oxygen vacancy (+2 effective charge). The oxygen vacancy percentage was derived as:
V O % = x 2 × 100
The calculated oxygen vacancy percentages for each sample are presented in Table 2.
Following this, the samples were compressed into pellets. Using MTI muffle furnaces operating at 100 °C/min, the pellets were placed into alumina crucibles, sintered in repeated thermal cycles between 600 and 1000 °C, and then ground. During each cycle, an intermediate and final milling process was employed to enhance the purity [37] and achieve the desired powder characteristics. An additional HEBM process was conducted for 4 h at a speed of 1000 rpm on a series of samples, primarily to achieve precise control over particle size and enhance the final product’s performance, while also evaluating the impact of HEBM on the solid-state reaction.

2.2. Measurements

The phase identification and quantification of the prepared powders were described using crystal structure X-ray diffraction (XRD) (PW 1390 Diffractometer, wavelength of copper K-alpha rays = 0.15406 nm, Philips). The microstructural properties were determined using SEM, a FEI Quanta 600 microscope combined with energy-dispersive X-ray (EDS, JEOL 5800LV), and TEM using the FEI Titan G2 TEM (FEI, Morgagni 268) operating at 80 kV. The absorption spectrum of samples was characterized using UV–visible diffuse reflectance spectroscopy (UV-vis DRS, Solid Spec). The samples were vacuum-dried and analyzed using IRAffinity-1S Fourier-transform infrared (FT-IR) spectroscopy (Shimadzu) in the wavenumber domain 4000–400 cm−1.
Complex impedance spectroscopy (CIS) and dielectric measurements were performed using a PalmSens 4 potentiostat/galvanostat (PalmSens BV, Houten, The Netherlands) in a two-electrode configuration. Measurements were conducted at 25 ± 1 °C under an ambient atmosphere with an applied AC amplitude of 100 mV across a frequency range from 1 Hz to 1 MHz. Sample pellets (10 mm diameter, 2.0 ± 0.2 mm thickness) were prepared via uniaxial pressing (Shimadzu pelletizer) and sandwiched between two fluorine-doped tin oxide (FTO) glass electrodes (7 Ω/sq, 1 × 1 cm2). Silver paste contacts were applied to minimize interfacial resistance. Data were acquired using PSTrace 5.8 software (PalmSens), with subsequent analysis conducted in ZView 3.5c (Scribner Associates) employing an equivalent circuit model to extract conductance and dielectric parameters. Three replicate measurements per sample confirmed reproducibility.

2.3. Screening for Antimicrobial Activity Tests

The prepared powder samples were evaluated for their antimicrobial activity in two states: (i) a solid form using 0.4 mg of the powder, and (ii) a liquid form at a concentration of 0.40 g/mL, obtained by sonicating 0.5 mg of the powder in 5 mL of dimethyl sulfoxide (DMSO) for 30 min to yield a final 40% concentration. The agar well diffusion technique was then employed to assess their antimicrobial efficacy against various pathogenic microorganisms [38]. In Table 3, we present microorganisms tested against the synthesized Al-ZnO NPs, including two Gram-negative bacteria, two Gram-positive bacteria, and two unicellular fungi species, along with their respective strain/ATCC numbers. All microorganisms were provided by King Fahd Hospital, Al Khobar, Saudi Arabia. In this study, the effect of light exposure on the antimicrobial performance of the Al-ZnO NPs was evaluated using a 40-watt visible light bulb, emitting in the spectral range of approximately 400–700 nm. The light source was positioned 40 cm away from the samples for a duration of 12 h. To guarantee consistent and uniform illumination across all samples, we ensured that a constant light intensity of approximately 1 W/m2 was maintained uniformly using a calibrated light meter.
The microbes were prepared from an overnight culture grown in nutrient broth medium, and the microbial growth was adjusted between 0.63 and 1.8 × 10⁸ CFU/mL, which represented the reading of 0.5–0.63 McFarland standards, using a DensiCHEK plus meter device from Biomerieux, France. Then, 0.5 mL from a pre-adjusted microbial inoculum was transferred individually to Petri plates using the pour plate method technique. Following this, 15 mL of permeated Mueller–Hinton agar media cooled to 50 °C was poured gently over the microbial inoculums; the plates were gently rotated to ensure that the microbial inoculums were well distributed with the media, and then the cultures were left at room temperature to solidify for 2–5 min. An 8 mm sterile cork-borer was used to punch six wells in each plate, which were filled separately with solid or suspended nanoparticles. Negative controls were loaded with DMSO for suspended nanoparticles or left blank for solid samples, and positive controls were expressed using antibiotic disks of clindamycin, gentamicin (10 µg), and nystatin (100 µg) for Gram-positive bacteria, Gram-negative bacteria, and fungi, respectively. The wells were filled with 50 μL of liquid, and 0.4 mg of the solid phase was transferred directly to each well. The plates were kept in the refrigerator for one hour to allow better diffusion of the chemicals in the agar media. The plates were incubated at 37 °C for 24 h; after the incubation, the clear area without microbial growth around the well was measured using a caliper.

2.4. Statistical Analyses

One-way analysis of variance (ANOVA), tracked using the Tukey–Kramer technique for post hoc analysis, was used to examine the data for statistical differences between Al-ZnO NPs and the antibiotic on the size of the inhibitory zones for all tested microorganisms. The results are presented in the tables as mean ± SD. When p < 0.05, the data were considered significant, with p < 0.001 indicating very high significance. The different superscript letters (a, b, c) indicate significant changes at p < 0.05 in the tables and figures of Section 3.3. The groupings sharing similar superscript letters are not significantly different. GraphPad Prism software (version 9, San Diego, CA, USA) was used to investigate the statistical analysis. Based on the results, the effects of doping concentration, nanoparticle state (liquid and solid), and type of microorganism are discussed.

3. Results and Discussion

3.1. Physical Characterizations

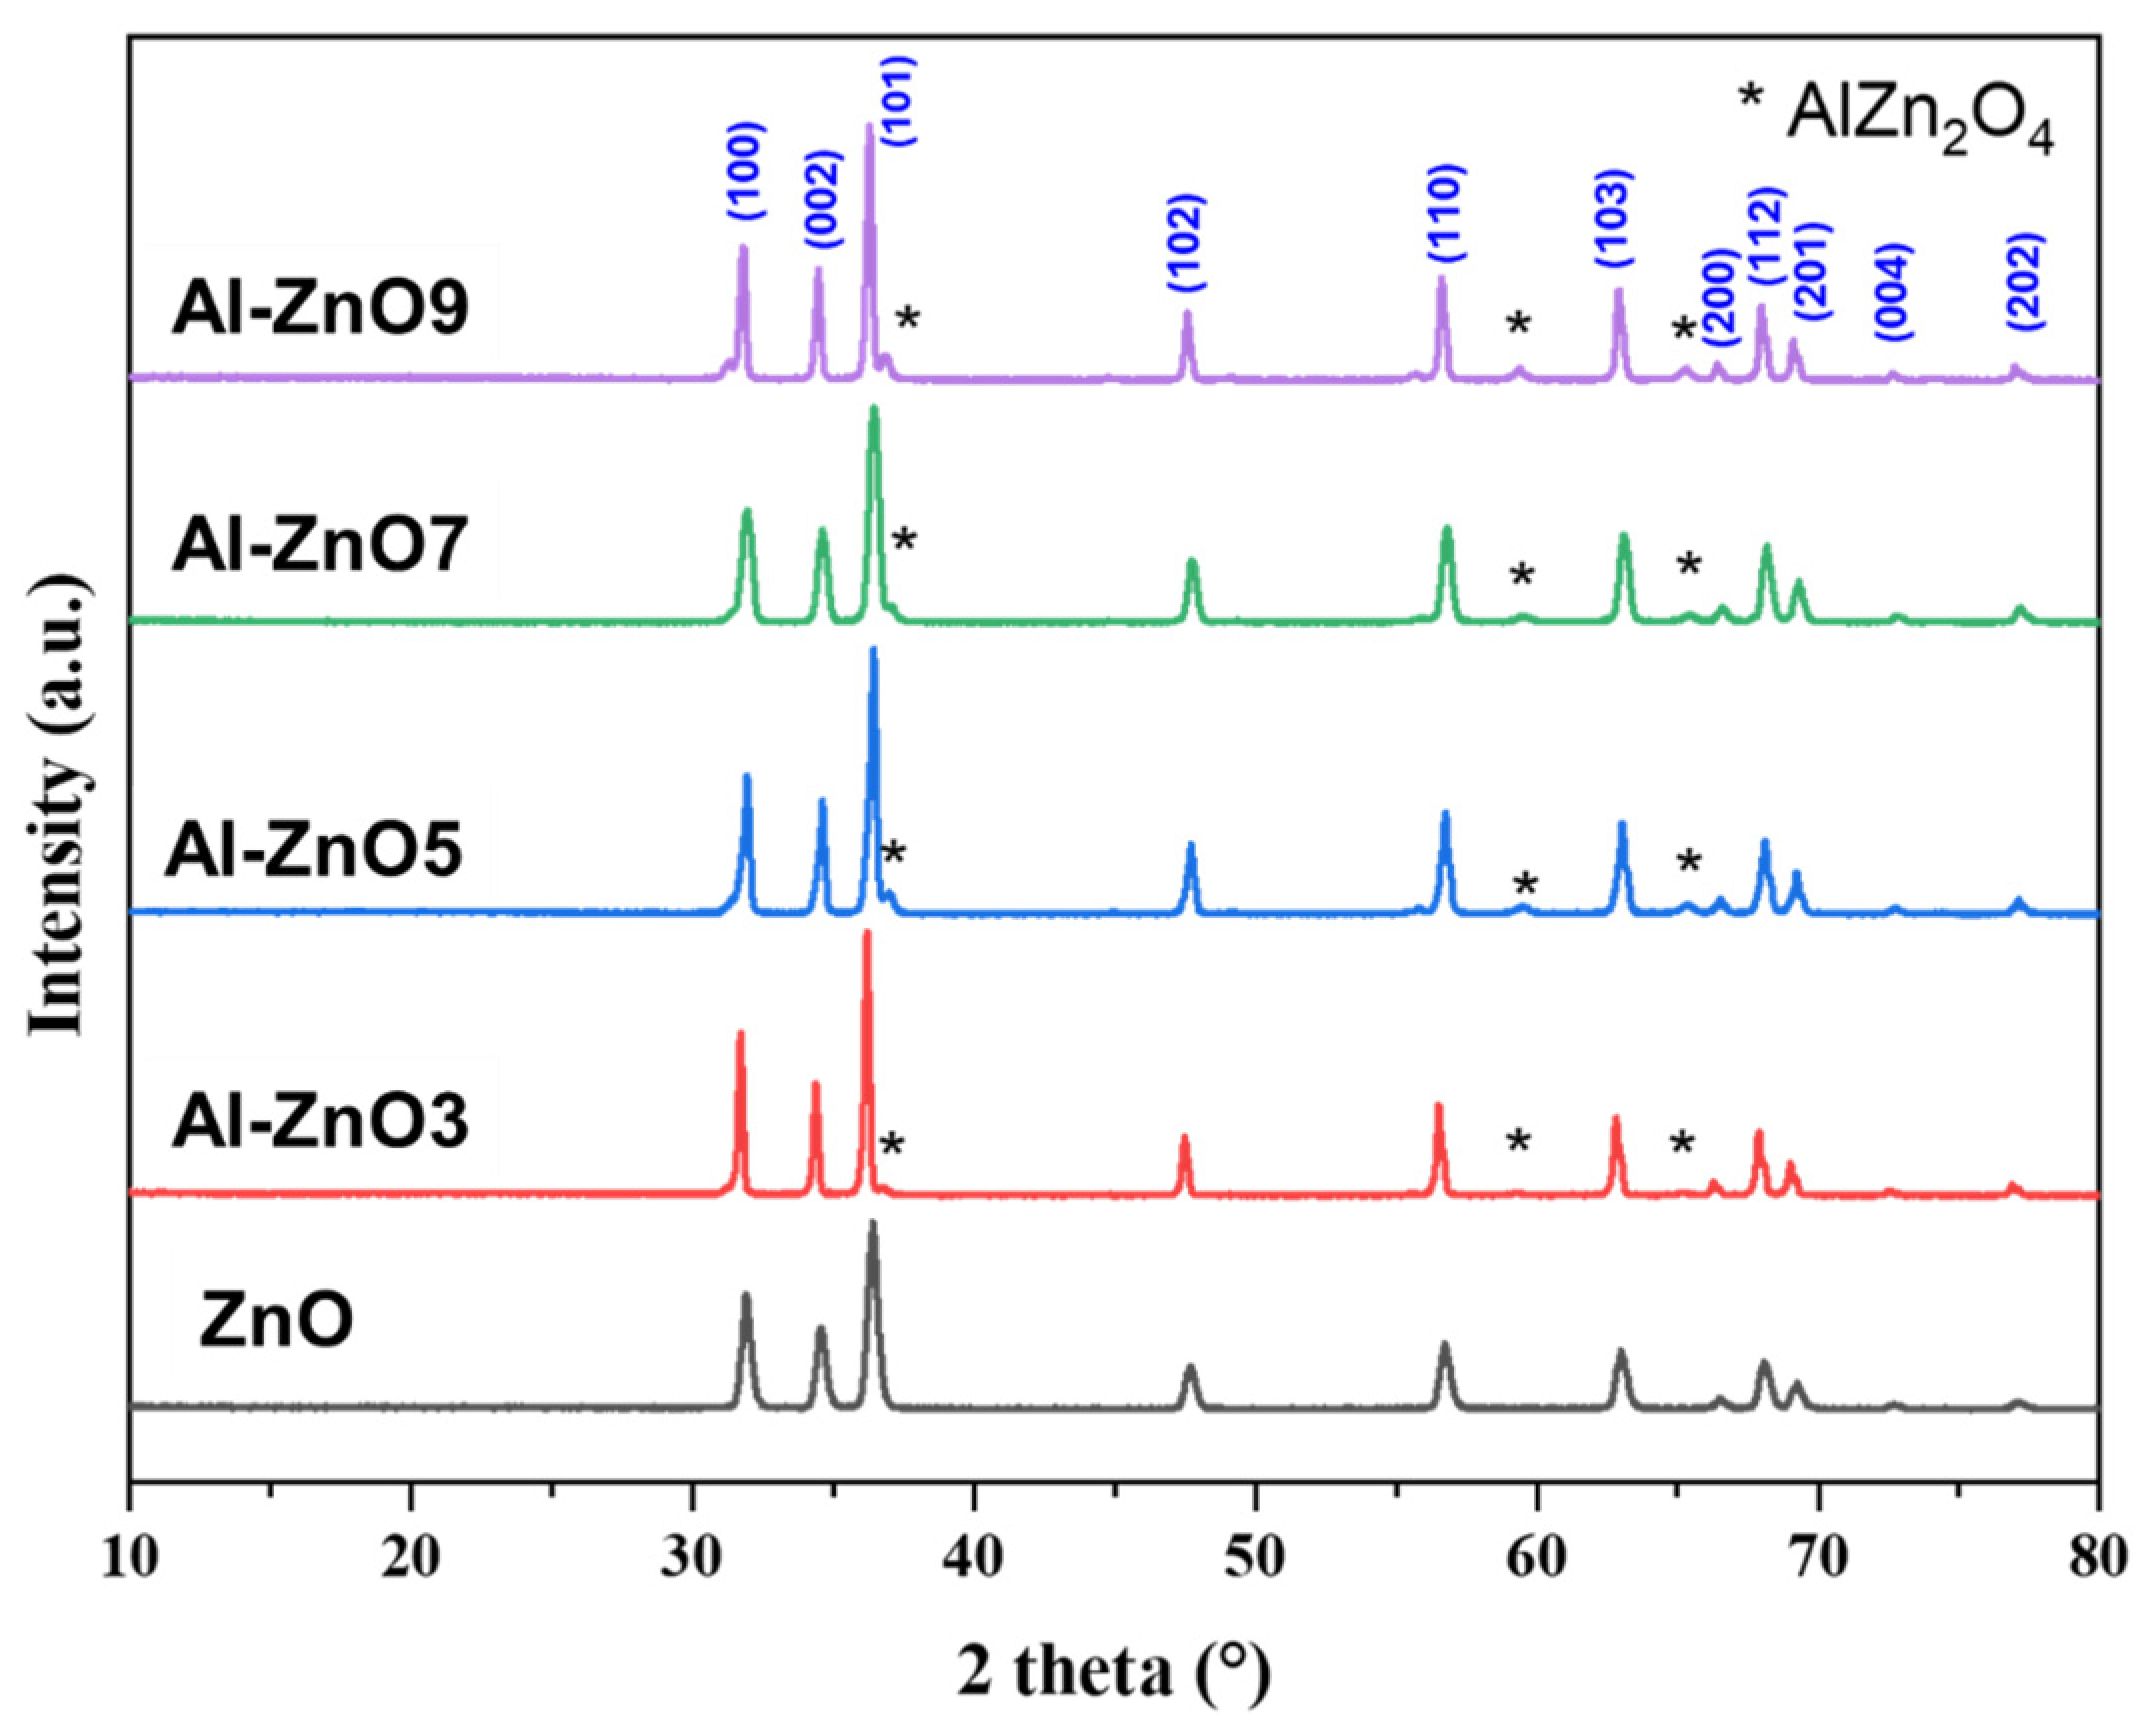
3.1.1. Results of X-Ray Diffraction Analysis

The XRD patterns of the samples compared to pure ZnO are given in Figure 1. The ZnO phase was easily identified in all samples and corresponded to the most thermodynamically stable structure: the hexagonal wurtzite form [39]. The addition of a high concentration of Al to the ZnO yields, after calcination, was a mixture of phase AlxZn1-xO and spinal phase AlZn2O4 (Figure 1). The composition of each sample (weight percent of each phase) was carried out via Rietveld refinement using the FullProf Suite [40] and shown in Table 4.
The results of the Rietveld refinement of the XRD pattern of the Al-ZnO9 sample are shown in Figure 2. The added amount of Al was used to form a solid solution with ZnO on the one hand and to react with ZnO to form AlZn2O4 on the other. One can observe that the weight percent of the AlZn2O4 phase in each sample increasds with the addition of the doping element. This can be explained by the better thermodynamic stability of Al-ZnO compared to ZnO [41].
The substitution of Zn with Al in ZnO NPs is evidenced by changes in the unit cell parameters, as shown in Figure 3a. The addition of Al to ZnO resulted in a decrease in the total unit cell volume, from 47.77 Å3 for pure ZnO to 47.58 Å3 when 9 wt.% of Al was added (Figure 3b). This reduction in unit cell volume demonstrates the successful incorporation of Al into the ZnO crystal lattice [42]. The radii of Al3+ and Zn2+ at the four coordination sites are 0.39 and 0.6 Ǻ, respectively [43]. According to the Hume–Rothery rules concerning the substitutional solid solution, ΔR × 100/R = 42%, and the difference in oxidation state and electronegativity leads to the weak solubility of the two cations (total substitution when ΔR × 100/R < 15%). This fact is further proof of the concurrent formation of a secondary phase and the AlxZn1−xO phase [44].
The peak broadening is due to both crystallite size and the strain ε induced in the powders due to crystal imperfections and distortion. The crystallite size and the strain ε were calculated using the Williamson–Hall equation, as follows:
β c o s θ = k λ D + 4 ε s i n θ
where k   = 0.89 is a constant; λ = 1.5406 ; θ and   β are the diffraction angle and the corresponding integrated full width at half-maximum FWHM (expressed in radians) or integral breadth of the observed peaks, respectively; and   ε is the strain of the sample. A plot is drawn with 4 s i n θ along the x-axis and β cosθ along the y-axis (Figure 4). The slope provides the micro-strain, whereas the mean particle size can be obtained from the intercept. According to the nature of the strain, the slope can be negative, positive, or horizontal. A negative slope indicates lattice compression, while a positive slope represents lattice expansion. A horizontal slope signifies a crystal free from any micro-strain. The average sizes calculated from the interception from Williamson–Hall, reported in Table 5, are comparable to those observed on the SEM images. Al-ZnO7 had the largest size and highest absolute strain value. According to Table 2, the increasing oxygen vacancy concentration with Al doping (up to 7.0% for Al-ZnO9) corroborates the observed lattice contraction and negative strain values, as vacancies accommodated the structural distortion induced by Al3+ substitution.

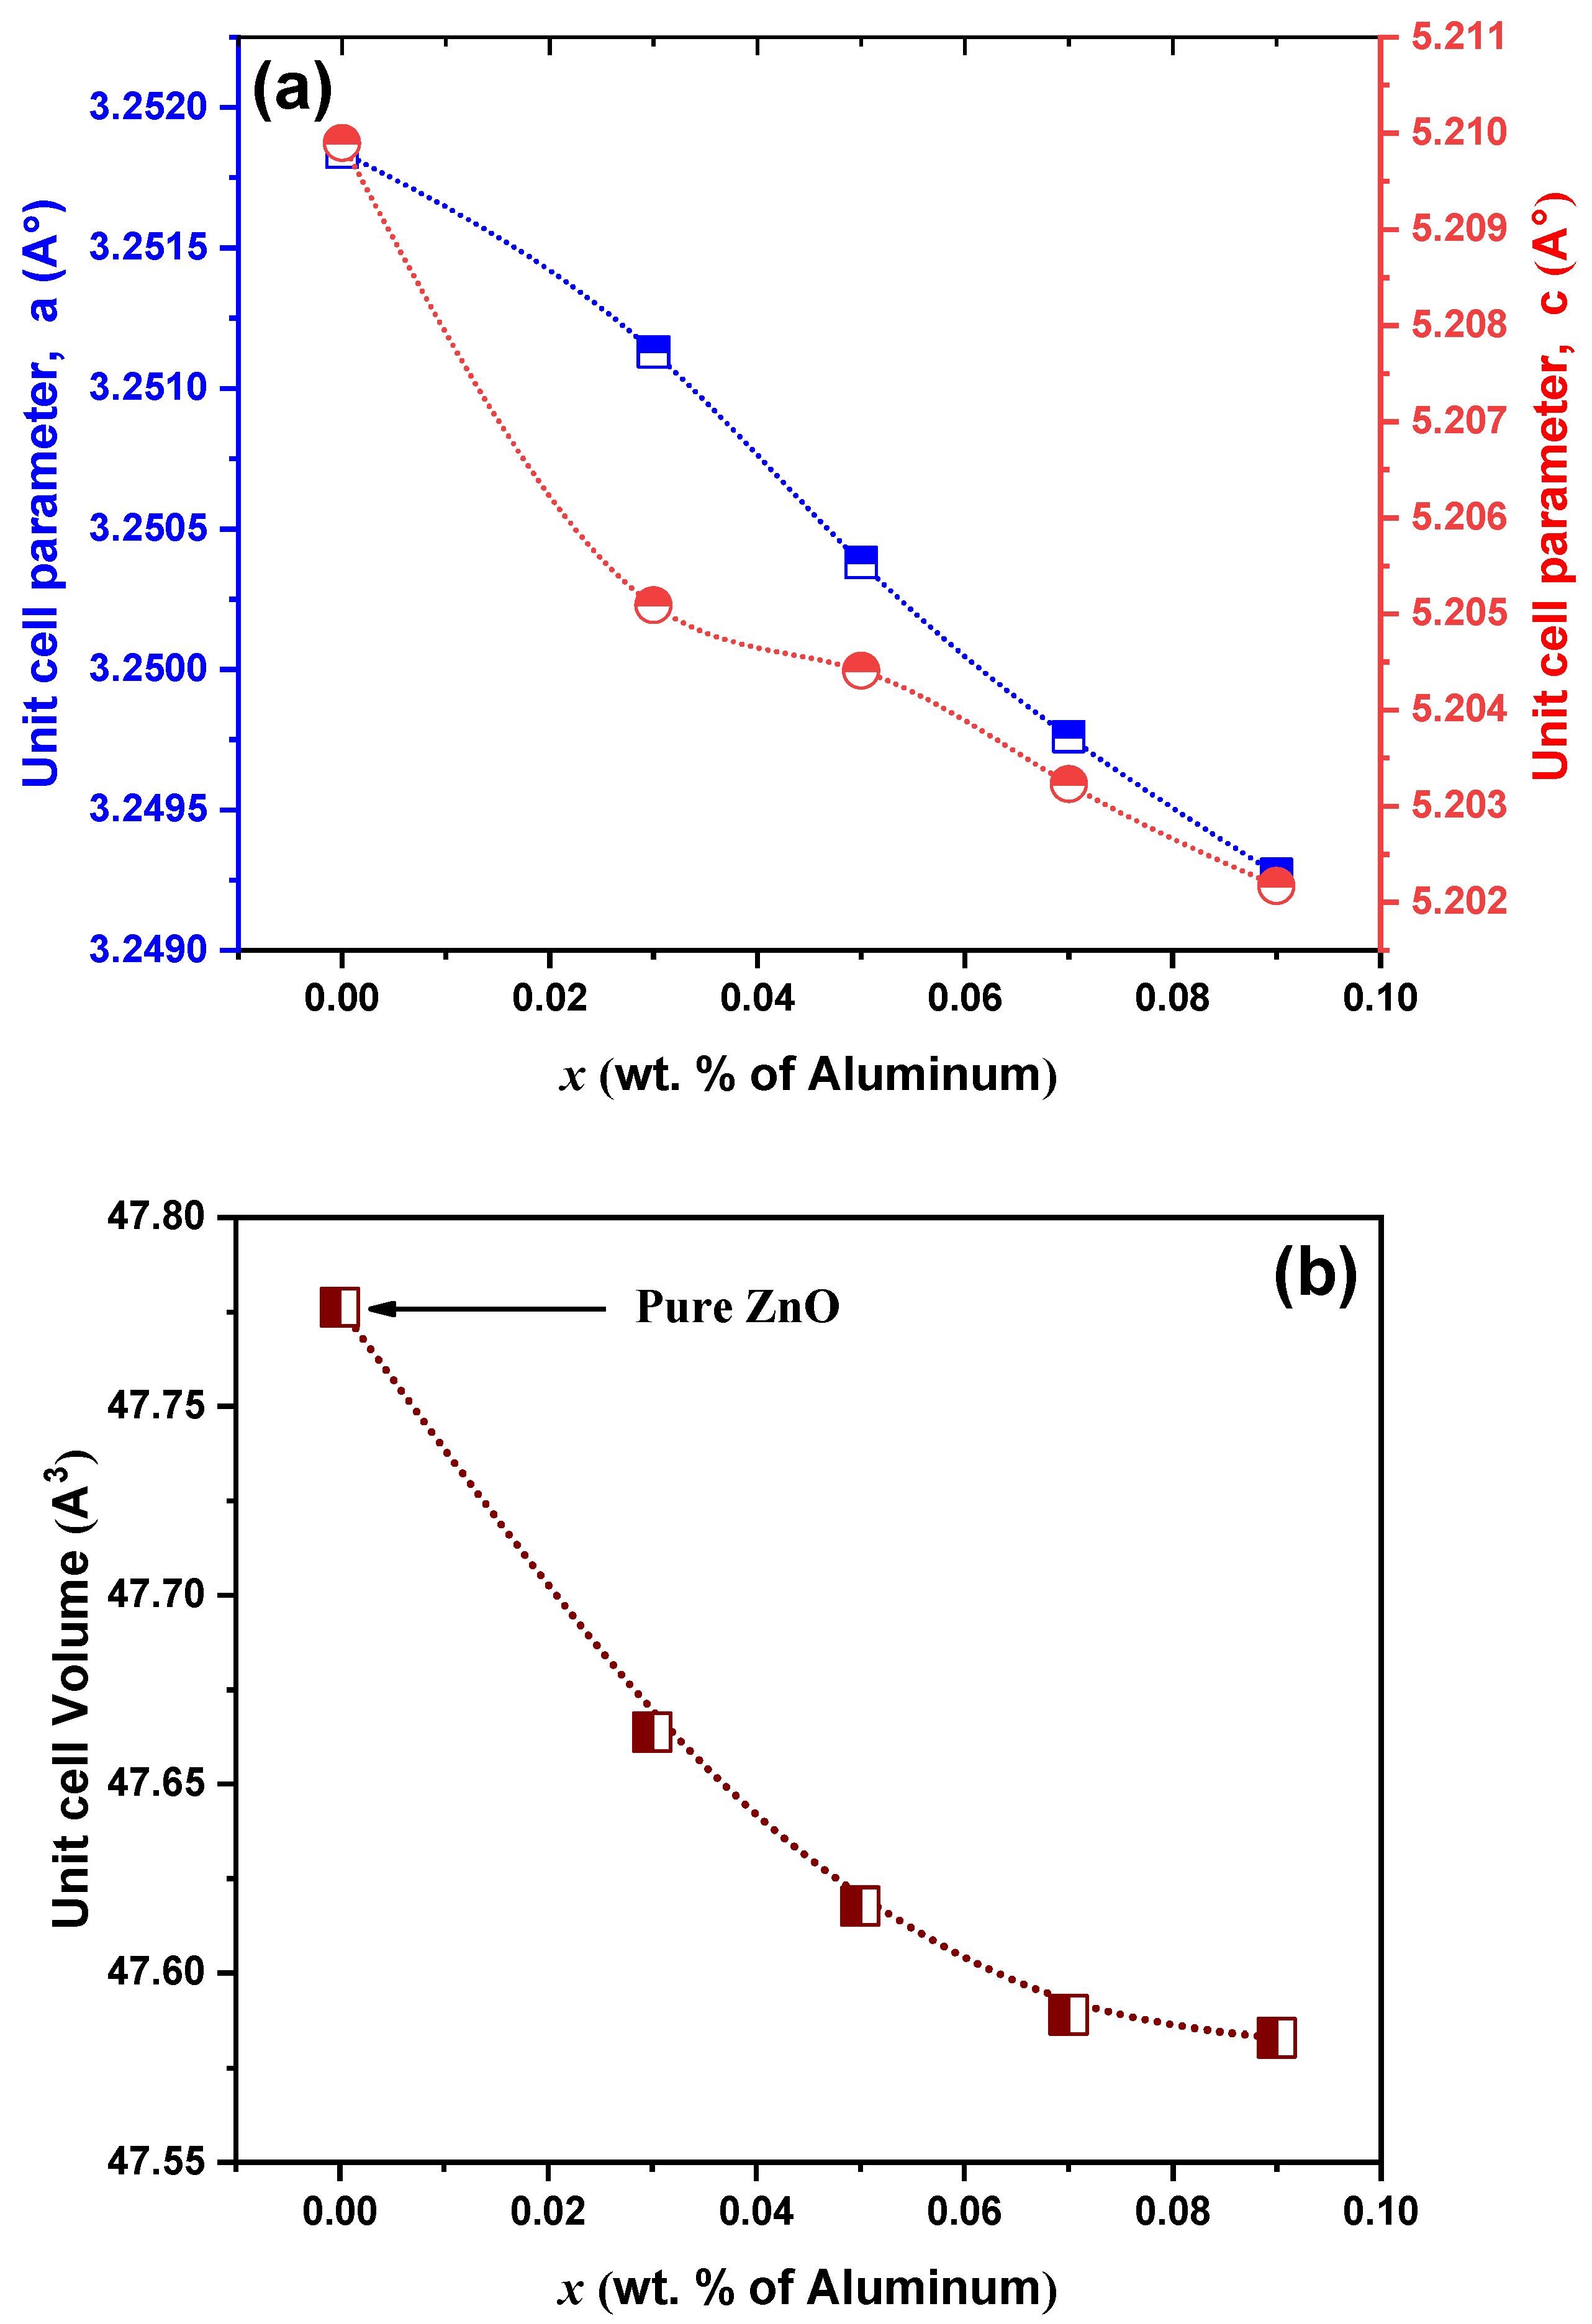
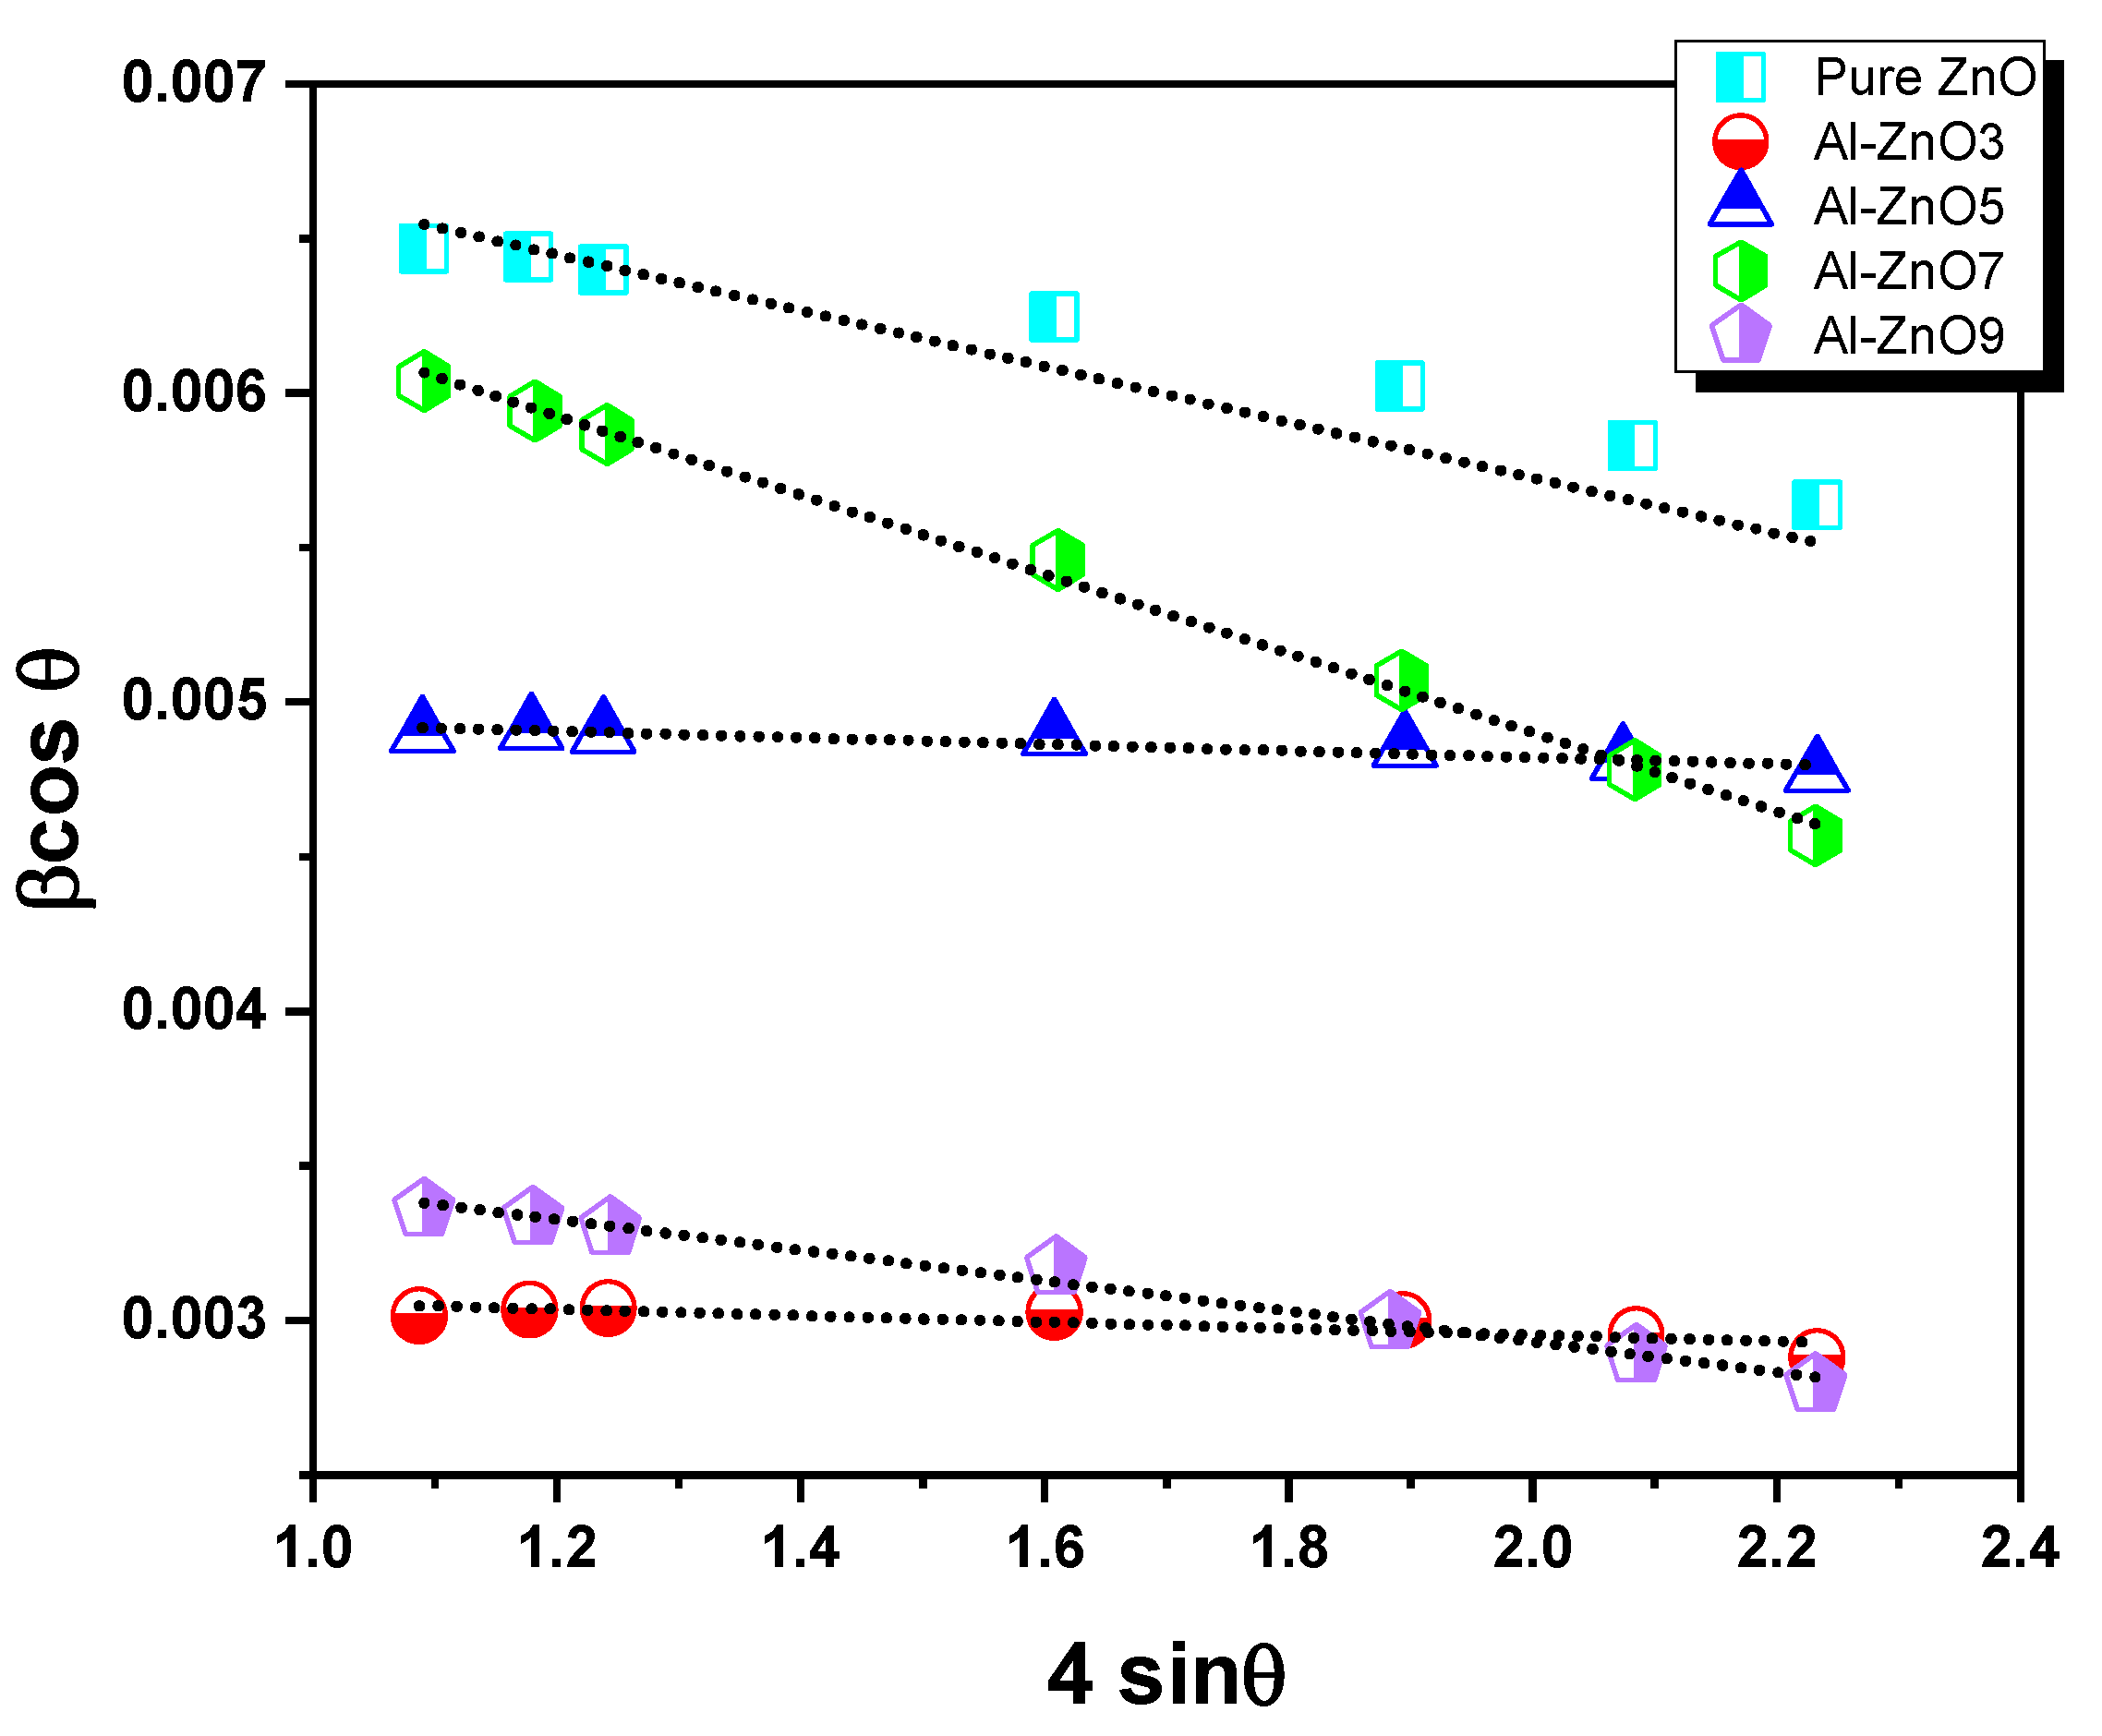
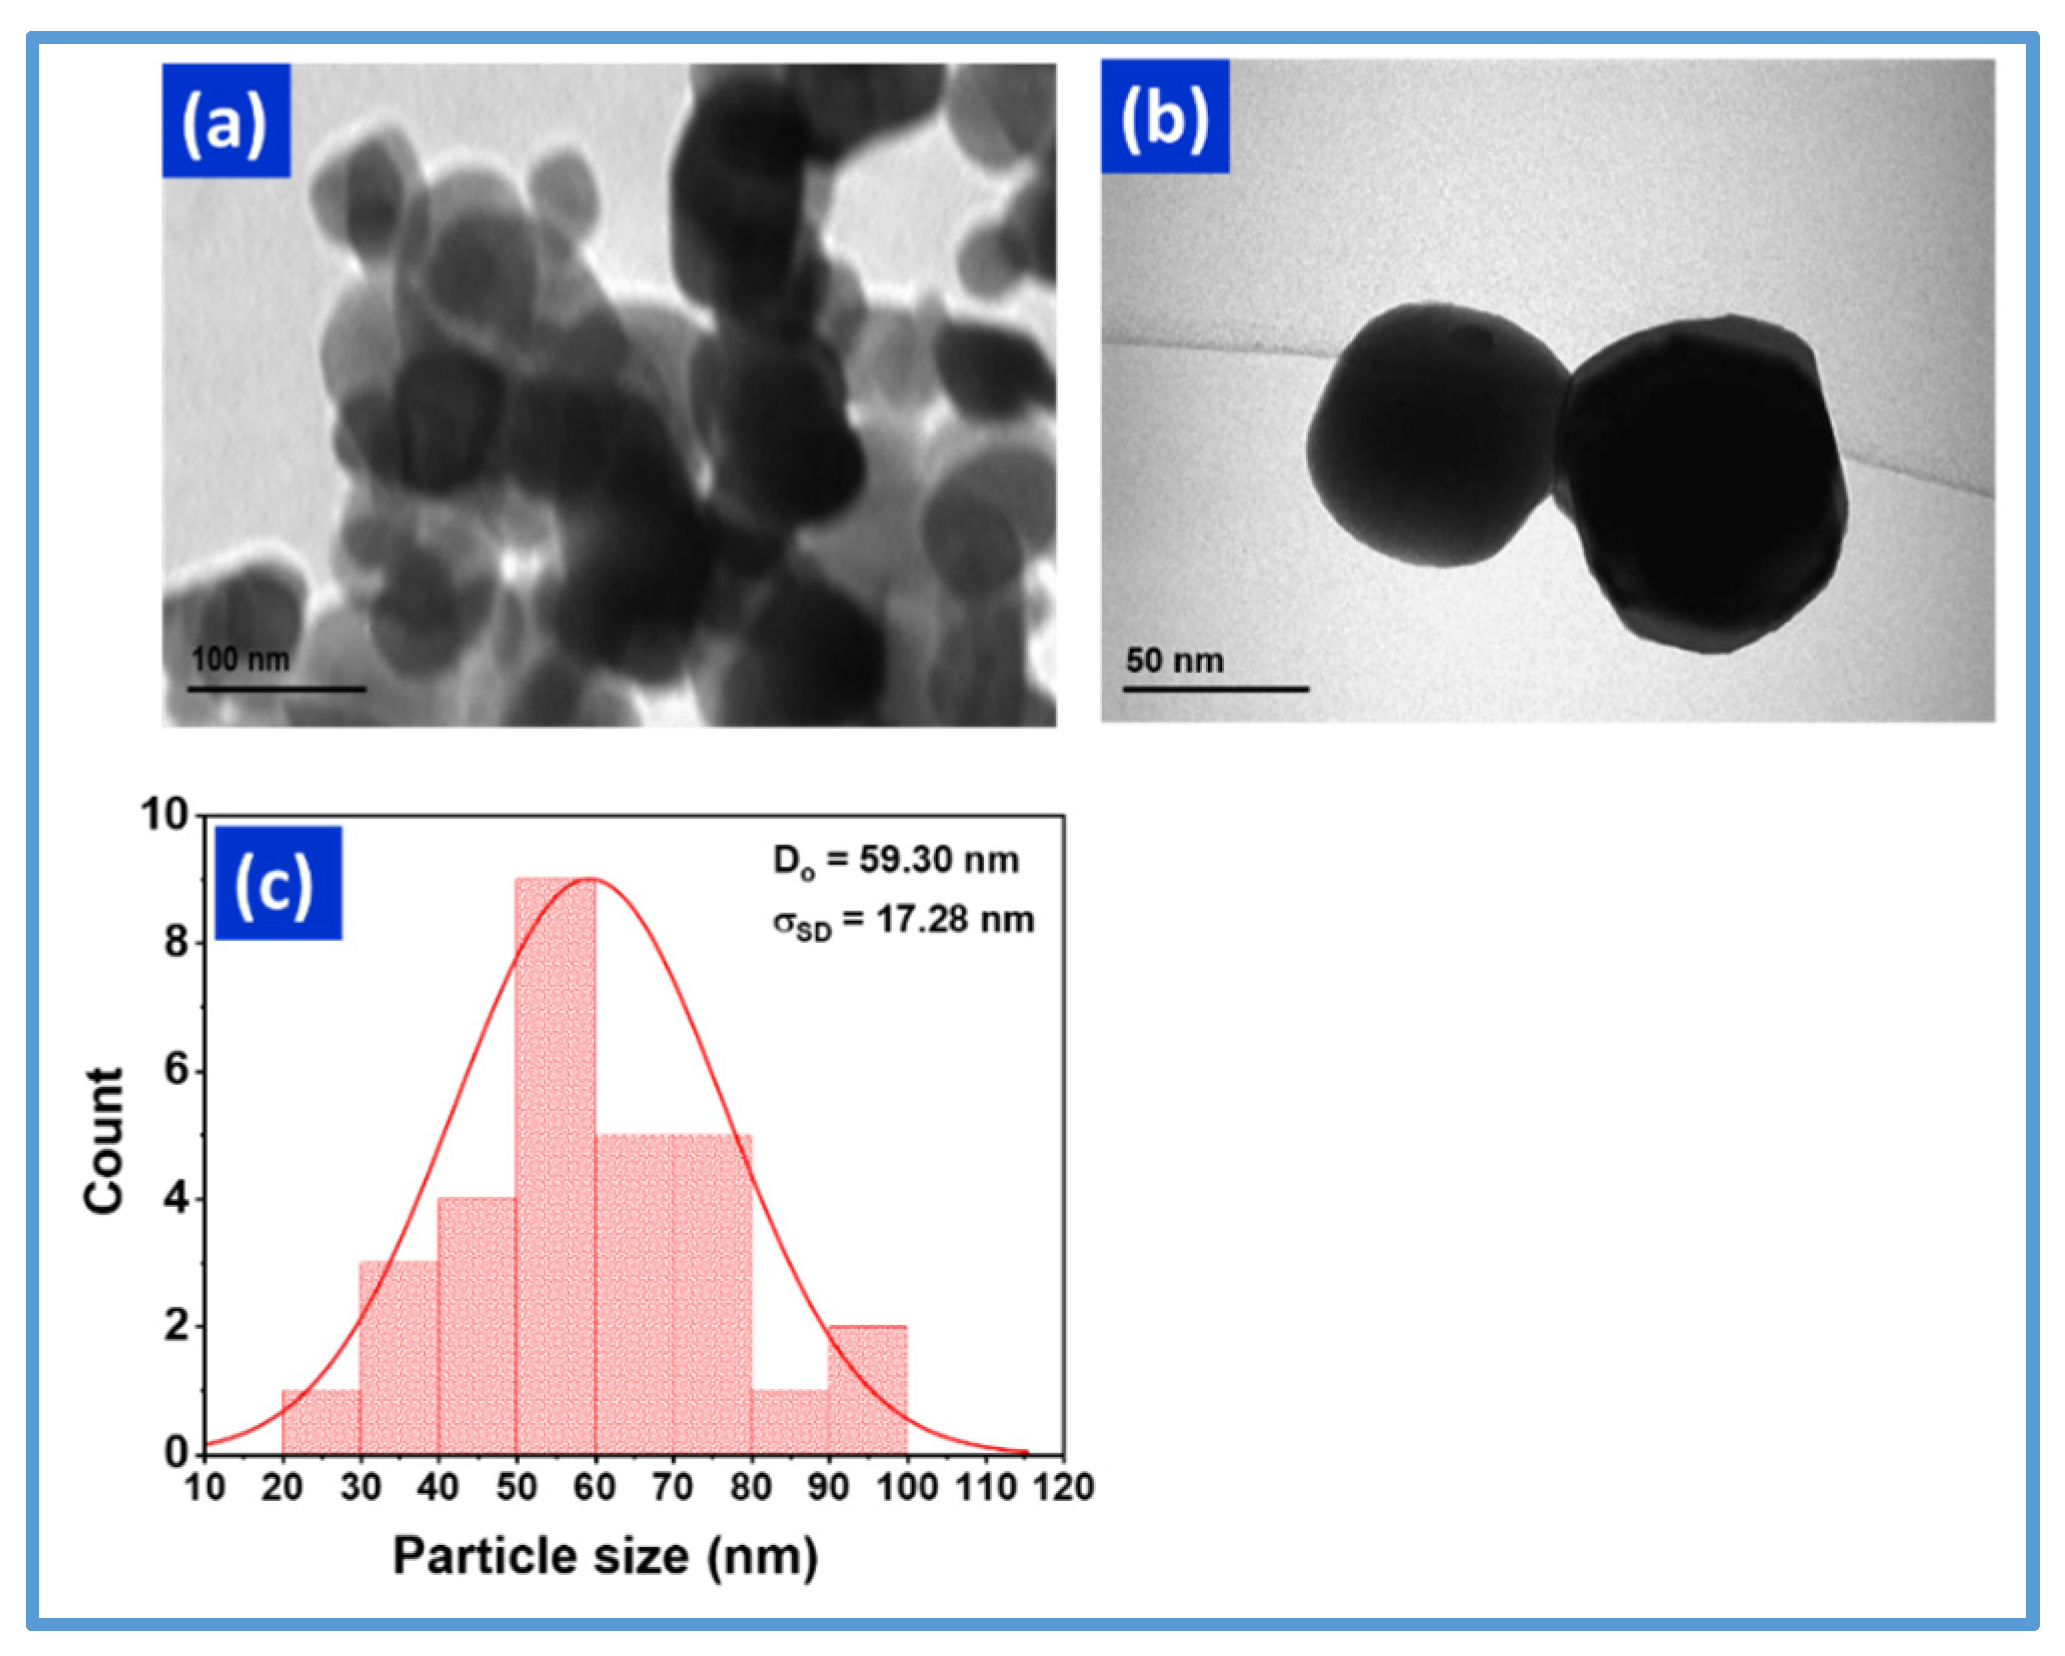
3.1.2. Structural and Microstructural Analysis

The structural and microstructural properties of the Al-ZnO samples were analyzed using SEM and TEM techniques. For comparison and to highlight the effect of high-speed ball milling during the solid-state synthesis process, the SEM results, presented in Figure 5, were measured before subjecting the materials to the final 4-h HEBM process. The SEM images revealed particle sizes ranging from approximately 837 nm to 725 nm, displaying a coarse morphology and random distribution. The SEM-resolved particles represent agglomerates of multiple nanocrystallites, as XRD-derived crystallite sizes (Table 5) were notably smaller. For instance, Al-ZnO9 particles (~725 nm pre-milling) consisted of ~19 nm crystallites, highlighting the polycrystalline nature of these aggregates. As the Al doping concentration increased (from 3 to 9 wt.%), the particles showed a slight reduction in size and a gradual shift toward a more spherical morphology. This indicates that Al doping plays a significant role in modifying the structural properties of the particles. These findings provide insight into the initial characteristics of the materials before milling, establishing a baseline for assessing the transformative effects of the HEBM process.
Figure 6 offers a comprehensive SEM morphological analysis of the Al-ZnO NPs after the final 4 h HEBM treatment. The micrographs illustrate the structural evolution resulting from milling, showcasing a distinct transition from coarse, irregular shapes to semi-spherical and more refined structures. Notably, the images demonstrate consistent particle size reduction across varying doping levels, underscoring the efficacy of HEBM in achieving uniformity and improving nanoparticle morphology for advanced applications.
The TEM images of the Al-ZnO7 sample, shown in Figure 7, serve as a representative example of nanocomposite samples after being subjected to a 4 h HEBM process. Figure 7a,b demonstrate that extended milling time led to a reduction in nanoparticle size and a transformation from non-homogeneous to spherical particles. The average nanoparticle size depicted in Figure 7c was determined using ImageJ software (version 1.54m), revealing an average size of 59 nm. The observed particles comprised smaller crystallites (Table 4), consistent with HEBM-induced fragmentation and defect formation, as noted in the XRD strain analysis.
The elemental analysis of the synthesized NPs performed using EDS spectroscopy (Figure 8) confirms the presence of zinc (Zn), Al, and oxygen (O) in the samples. The weight percentages of Al and Zn in the doped samples corresponded closely to the initial stoichiometric ratios of the starting materials. Additionally, the elemental mapping, presented in Figure 9, demonstrates a uniform distribution of these elements within the samples. O (dark green), Al (dark purple), and Zn (light red) were evenly dispersed, underscoring the homogeneity achieved during the synthesis process.

3.1.3. Fourier-Transform Infrared Analysis

Figure 10 shows the FT-IR spectra of the Al-ZnO NP samples in the 400–3800 cm−1 wavenumber range. The broad absorption band observed at 3132 and 3420 cm−1 indicates hydroxyl groups (O–H stretching vibration caused by trace amounts of water from air or hygroscopic KBr absorbed on defect sites of the particles) [45]. However, this absorption band did not appear in Al-ZnO3, which showed the lowest strain value.
Compared to the ZnO band, the O–H band shifted toward a lower frequency with increasing Al concentration in Al-ZnO composites. The same behavior has been observed by Ahammed et al. [46,47,48]. Indeed, the substitution of Al3+ into the ZnO lattice induces lattice strain and alters bond strength, leading to a downward IR shift attributed to changes in phonon dynamics [49]. The adsorbed H2O on ZnO (10 1 ¯ 0) was identified by the characteristic scissoring vibration mode at 1617 cm−1 as well as the strong hydrogen-bonding interactions with both neighboring H2O molecules and surface oxygen atoms. Absorption bands at 2341 cm−1 and the peak around 1400 cm−1 are indicative of the C-O functional group, which can be attributed to atmospheric CO2 [50,51].
The vibration band observed at 451 cm−1 is characteristic of stretching vibrations of Zn-O bonds [51]. Pure ZnO exhibits a sharp and intense absorption band at this frequency. This peak appeared for all Al-ZnO samples (Figure 10). However, the absorption band showed a slight broadening and shifting for the doped samples. This fact can be explained by the formation of Al-O bonds that stretch in the same regions [52]. There is a precursor band at 1517.9 cm−1, 1134 cm−1 and 829.4 cm−1, 680.8 cm−1, as confirmed by the peaks observed in [53,54,55,56,57]. As Al ions are incorporated into the Zn-O lattice, this type of band switching occurs toward the lower side. Here, the peak’s position and absorbance have changed due to doping. As a result, the bond strength with the doping element changed.

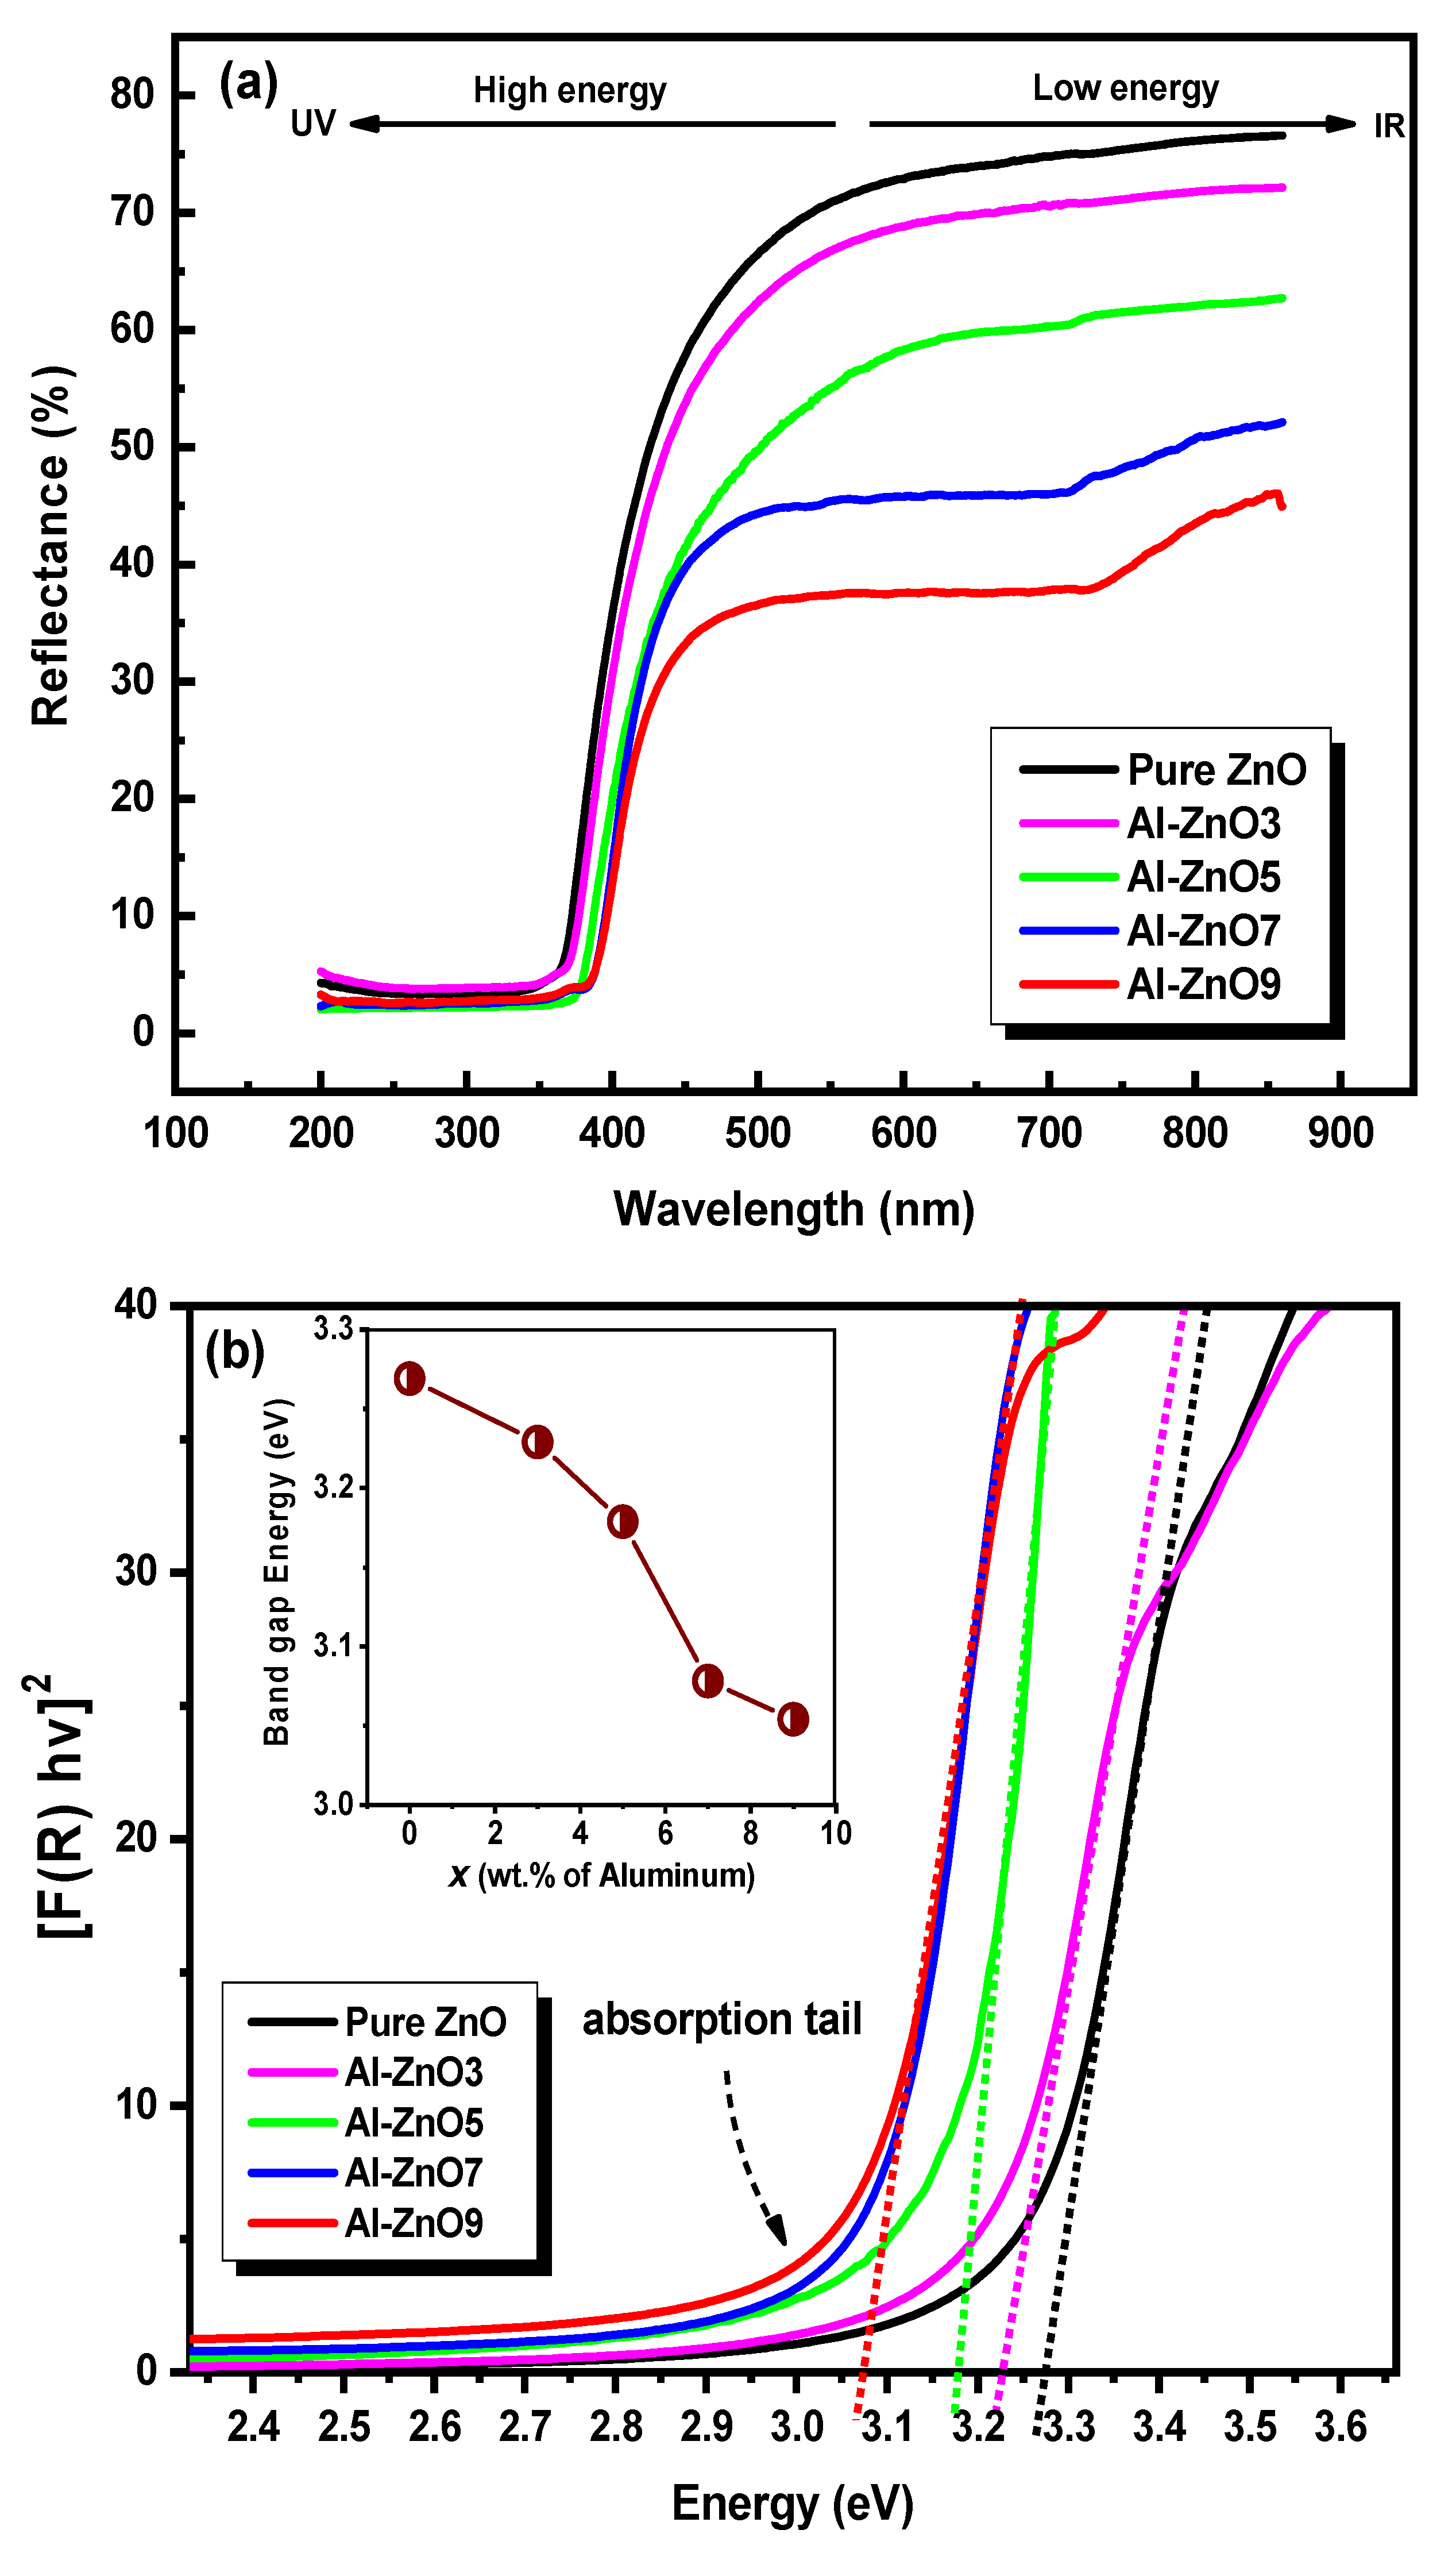
3.1.4. Absorption Spectrum of Samples

A UV-Vis DRS was employed to measure the band gap energy (Eg) and the optical properties of the composites. Figure 11a illustrates the UV-Vis-IR diffuse reflectance spectra of the prepared samples. In the visible region of the spectrum, the reflectance of all of the crystalline samples ranges from 37.5% to 75%. As the concentration of Al-dopant increases, the edge of the reflectance spectra red-shifts, leading to a decrease in the energy band gap of the resulting sample [56]. The largest reflection was seen in the undoped ZnO NPs, whereas the lowest reflection, around 37.5%, is seen in the 9-weight-percent Al-doped ZnO NPs. When Al-doping concentrations rose, the absorption band edge shifted toward longer wavelengths, indicating a considerable change in the crystallite sizes of the generated samples with strong excitonic absorption; Anandh et al. [30] reported the same phenomenon. The red shift of the absorption edge with increased aluminum content indicates that the corresponding band gap narrows when an electron transfers from the valence band to the conduction band during optical absorption [58]. The optical band gaps of all Al-ZnO nanostructure samples were calculated based on their absorption edges through Tauc’s relationship:
α = A ( h υ E g ) n / h υ
The symbols in this formula, including α, hν, A, and Eg, represent the absorption coefficient, photon energy, independent constant, and band gap energy, respectively. Additionally, the formula of the Kubelka–Munk model was used as follows:
F R = 1 R 2 2 R = α S
The symbols in this formula involving F ( R ) , R , and S represent the function of Kubelka–Munk, reflectance, and scattering coefficient, respectively. Since the S (scattering coefficient) is considered a constant, the two equations indicate that the F ( R ) can be used instead of α, and vice versa [59]. According to the Tauc approach, E g is determined by fitting a straight line across the region associated with the optical absorption edge (Figure 11b) [30,49,60]. As we moved from pure zinc oxide to the highest level of aluminum doping (Al-ZnO9), there was a noticeable decrease in the band gap (inset of Figure 11b). Specifically, the band gap decreased from 3.269 eV for pure ZnO to 3.054 eV for the composition with 9% Al doping. The significant lowering of the band gap energy can be attributed to the interaction of Al ions with the valence band and the conduction band of the ZnO host structure, leading to the formation of impurity states within the band structure. Indeed, the substitution of Zn2+ by Al3+ in the ZnO lattice induced compressive strain due to the smaller ionic radius of Al3+ compared to Zn2+, leading to lattice contraction and oxygen vacancy formation to maintain charge neutrality. These vacancies introduced donor states below the conduction band, narrowing the band gap through two main mechanisms: first, impurity state formation, which reduced the effective band gap energy, and second, the Burstein–Moss effect, where increased carrier concentration shifted the absorption edge. As shown, XRD analysis confirms this structural evolution, with rising Al doping (up to 9 wt.%) correlating to increased oxygen vacancy density (7.0%, Table 2) and negative lattice strain, while SEM/EDS reveals homogeneous Al distribution and reduced particle sizes that enhance defect-mediated charge transport. The direct correlation between Al doping, structural modification, and band gap reduction was unequivocally demonstrated through this multi-technique synergy, where lattice distortion and defect engineering collectively enabled the tunable optoelectronic properties of the Al-ZnO nanostructures.

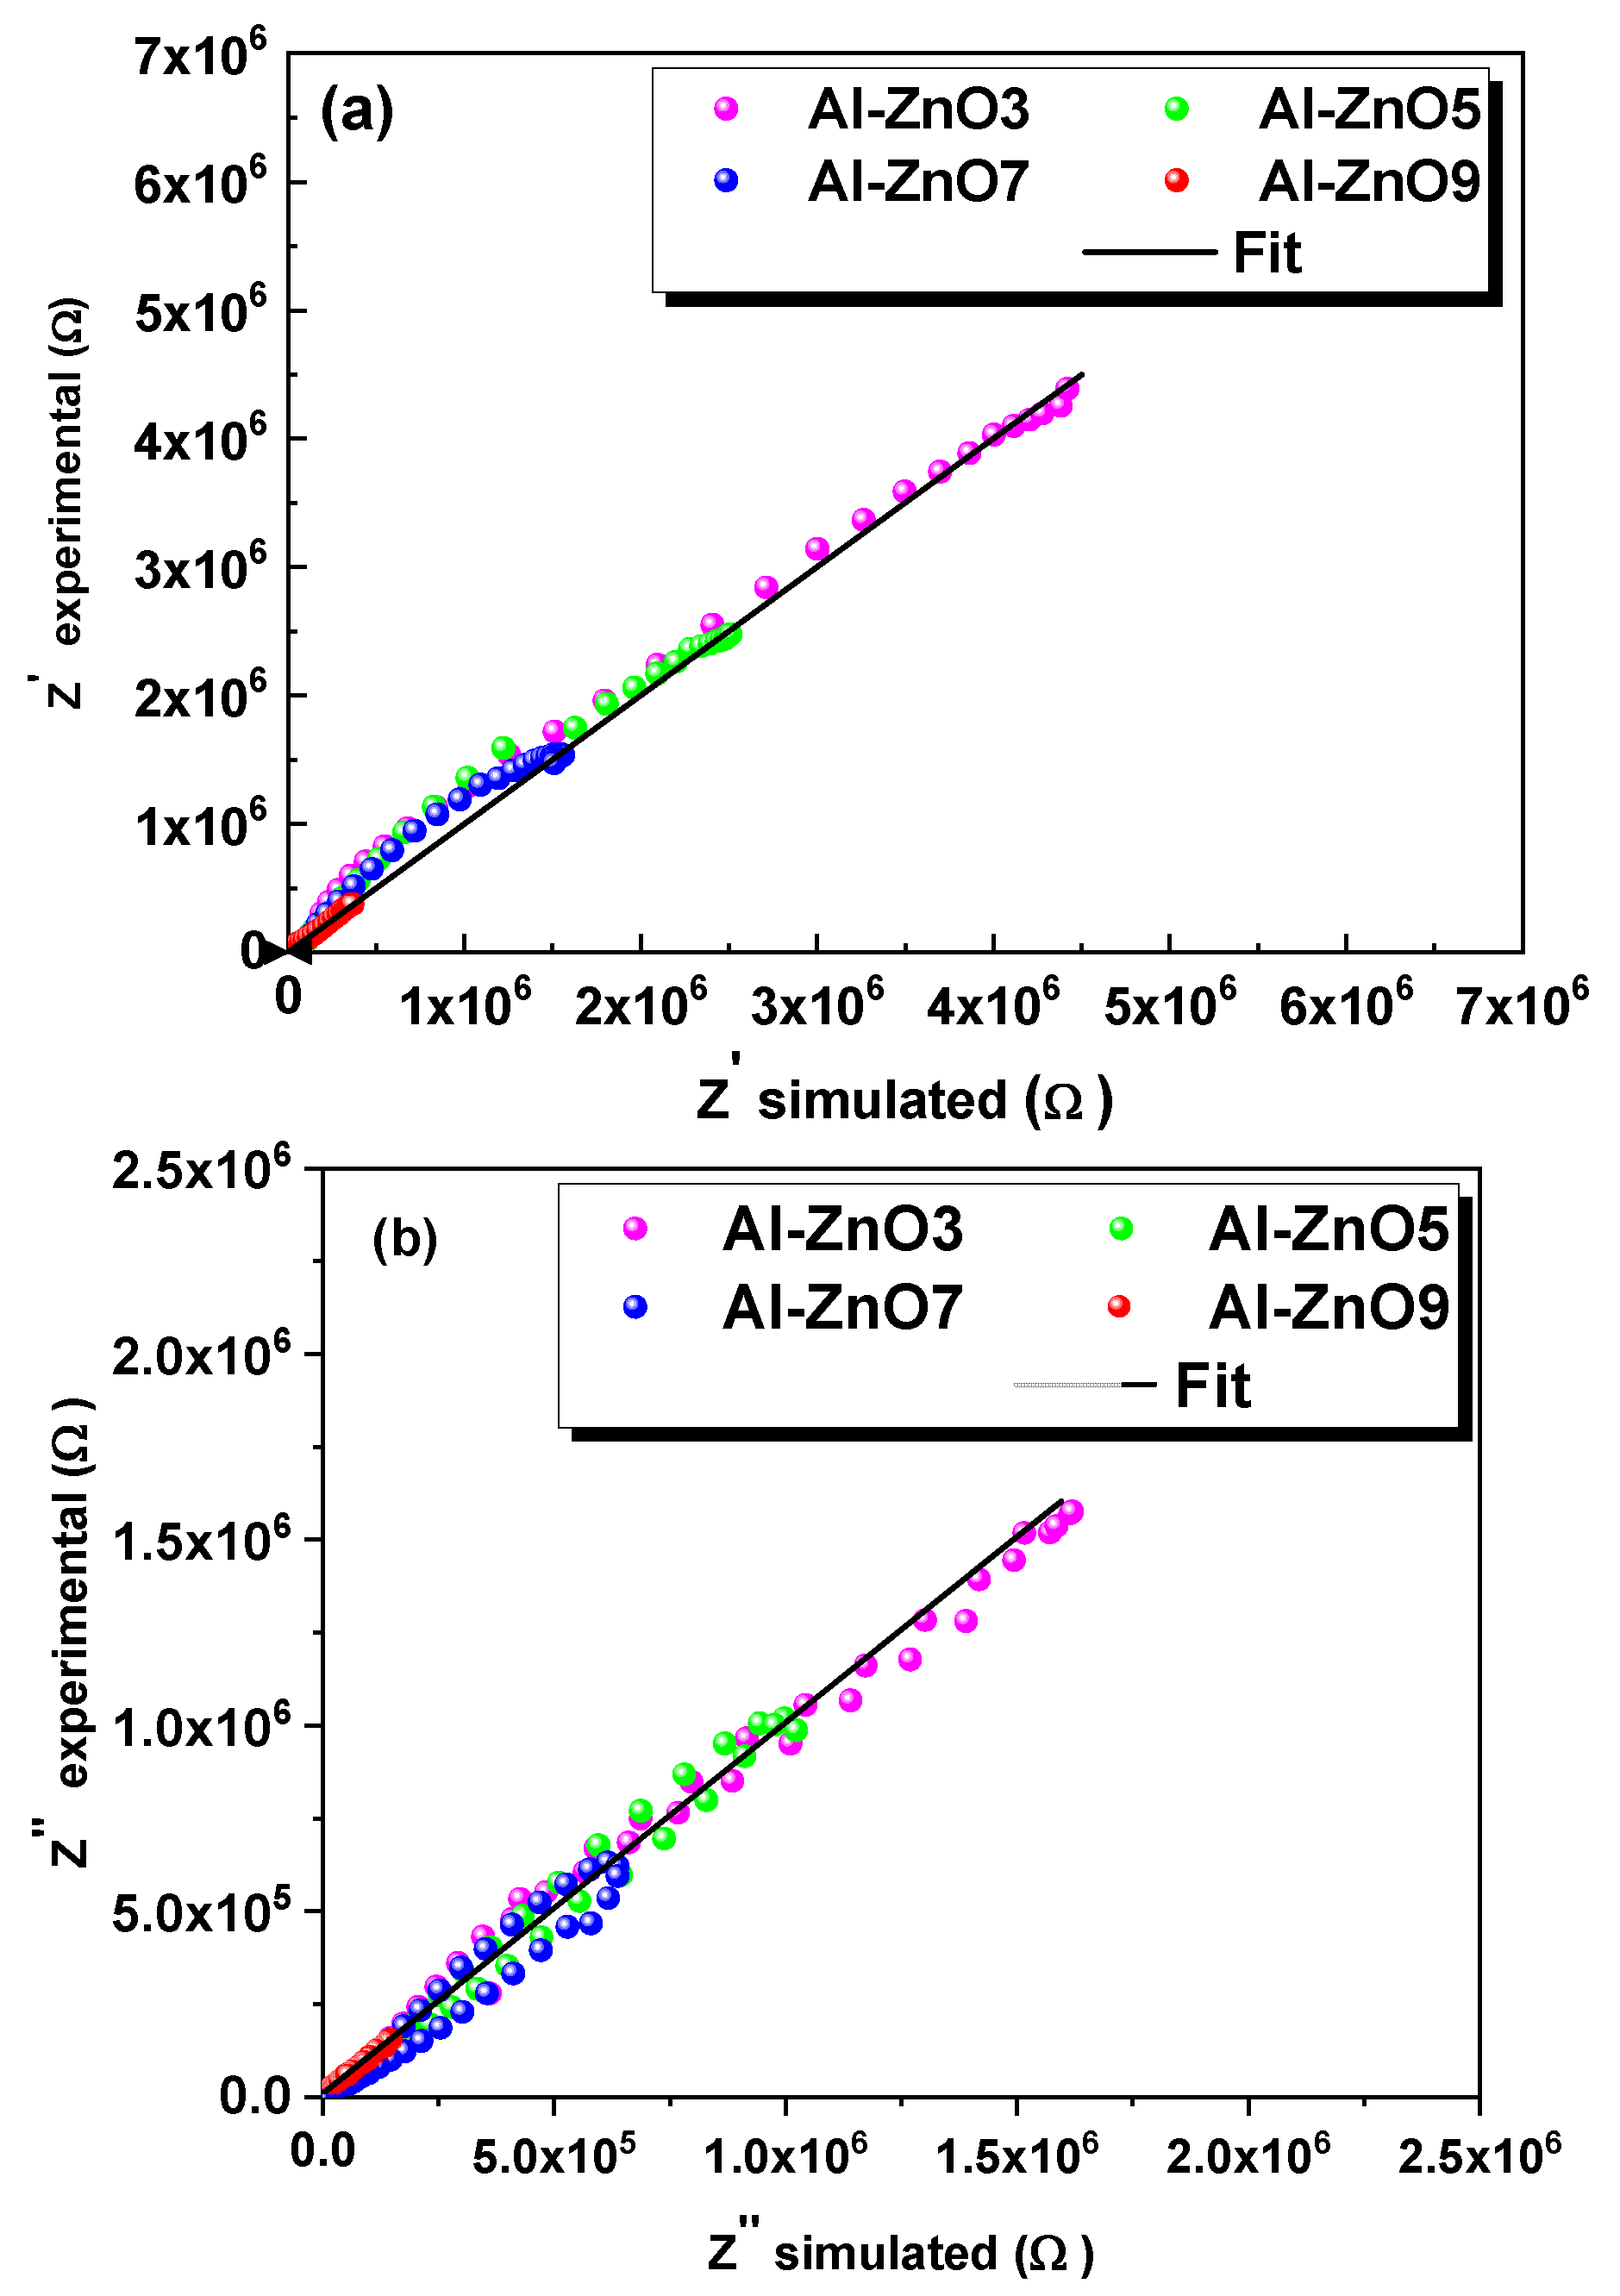
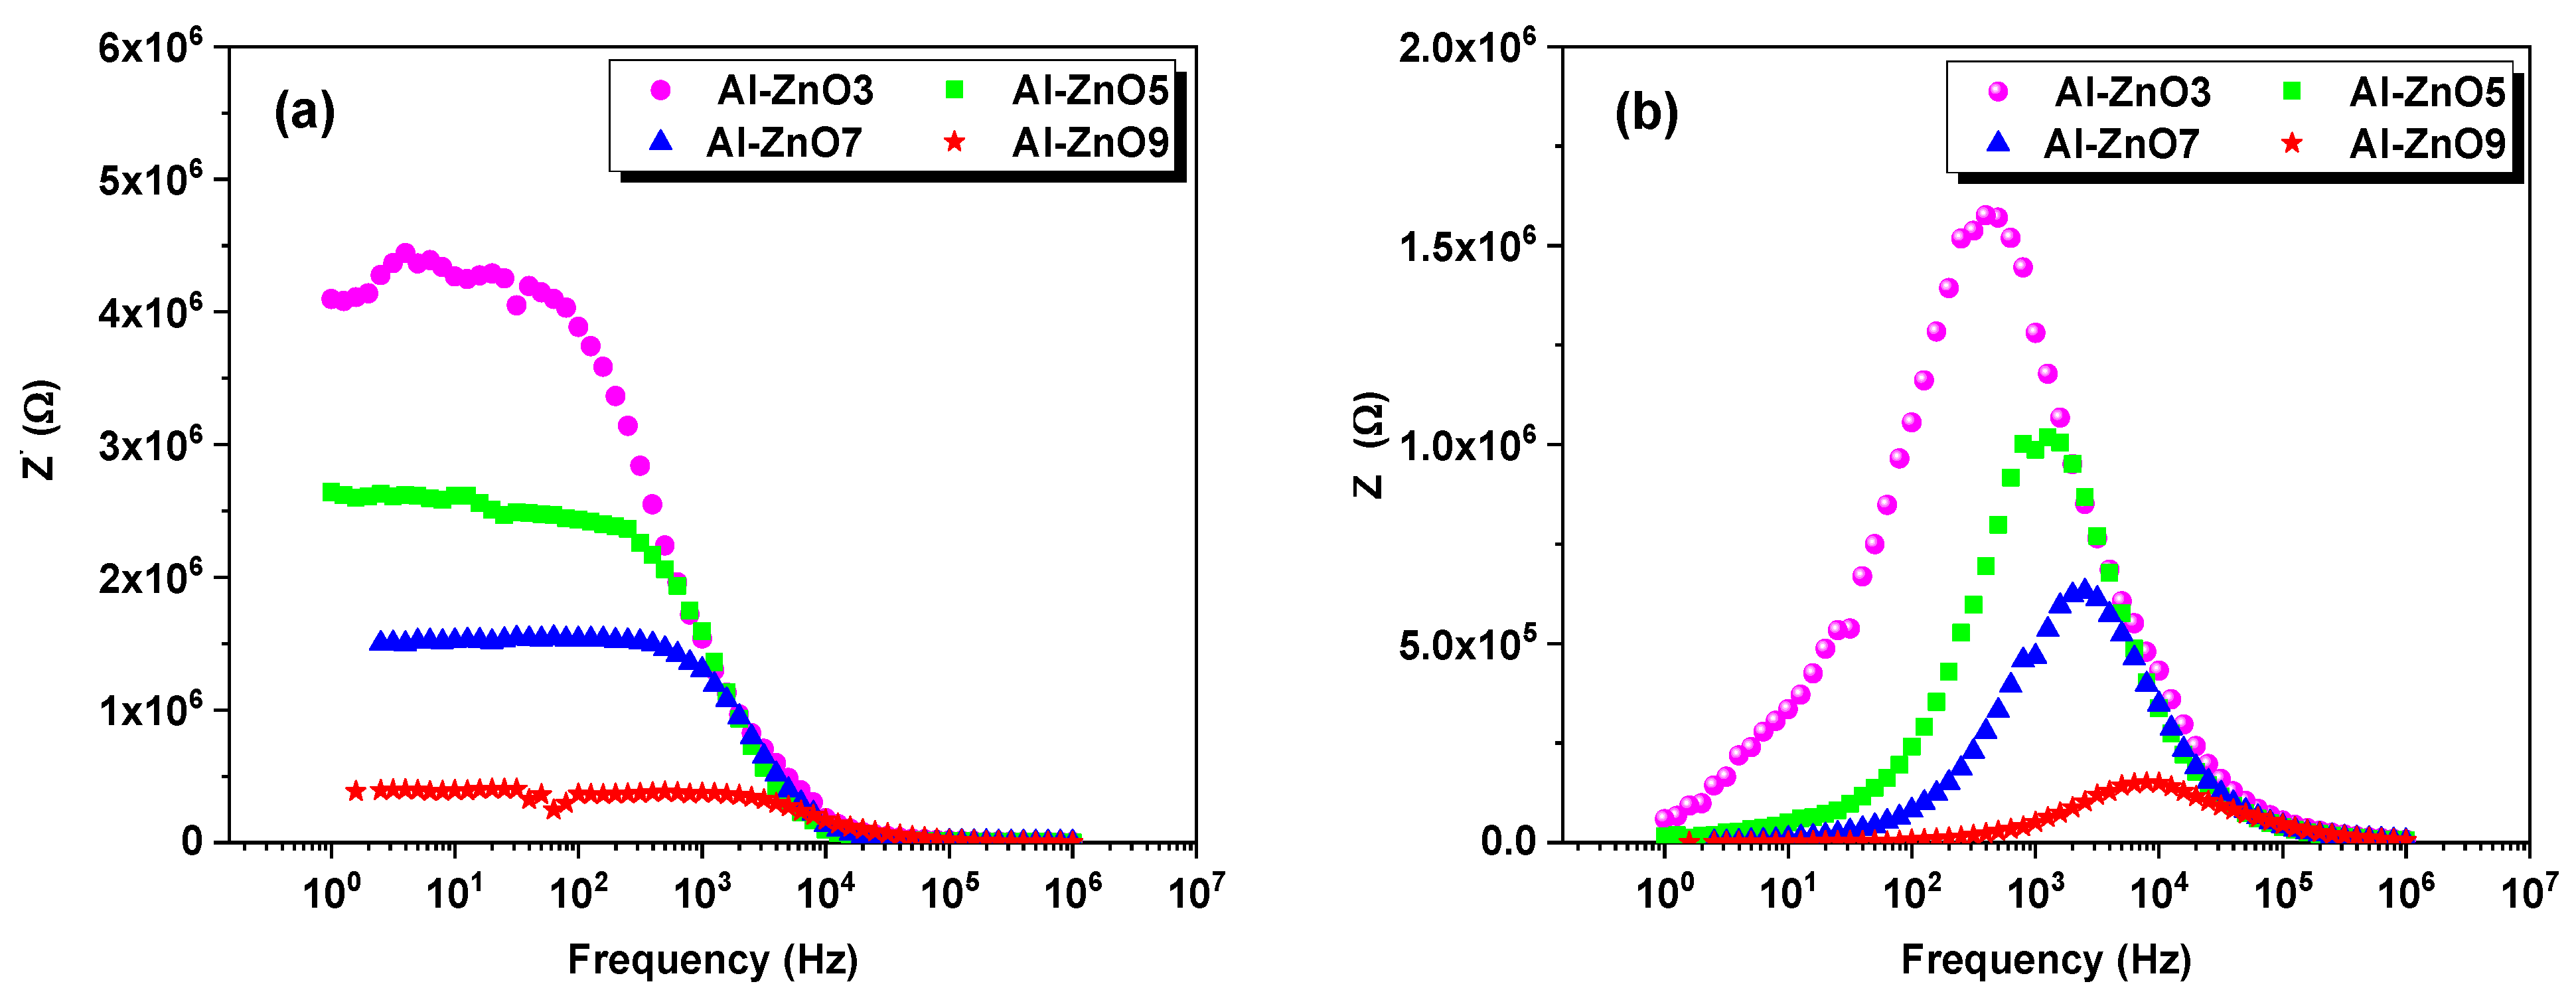
3.2. Dielectric and Electrical Properties

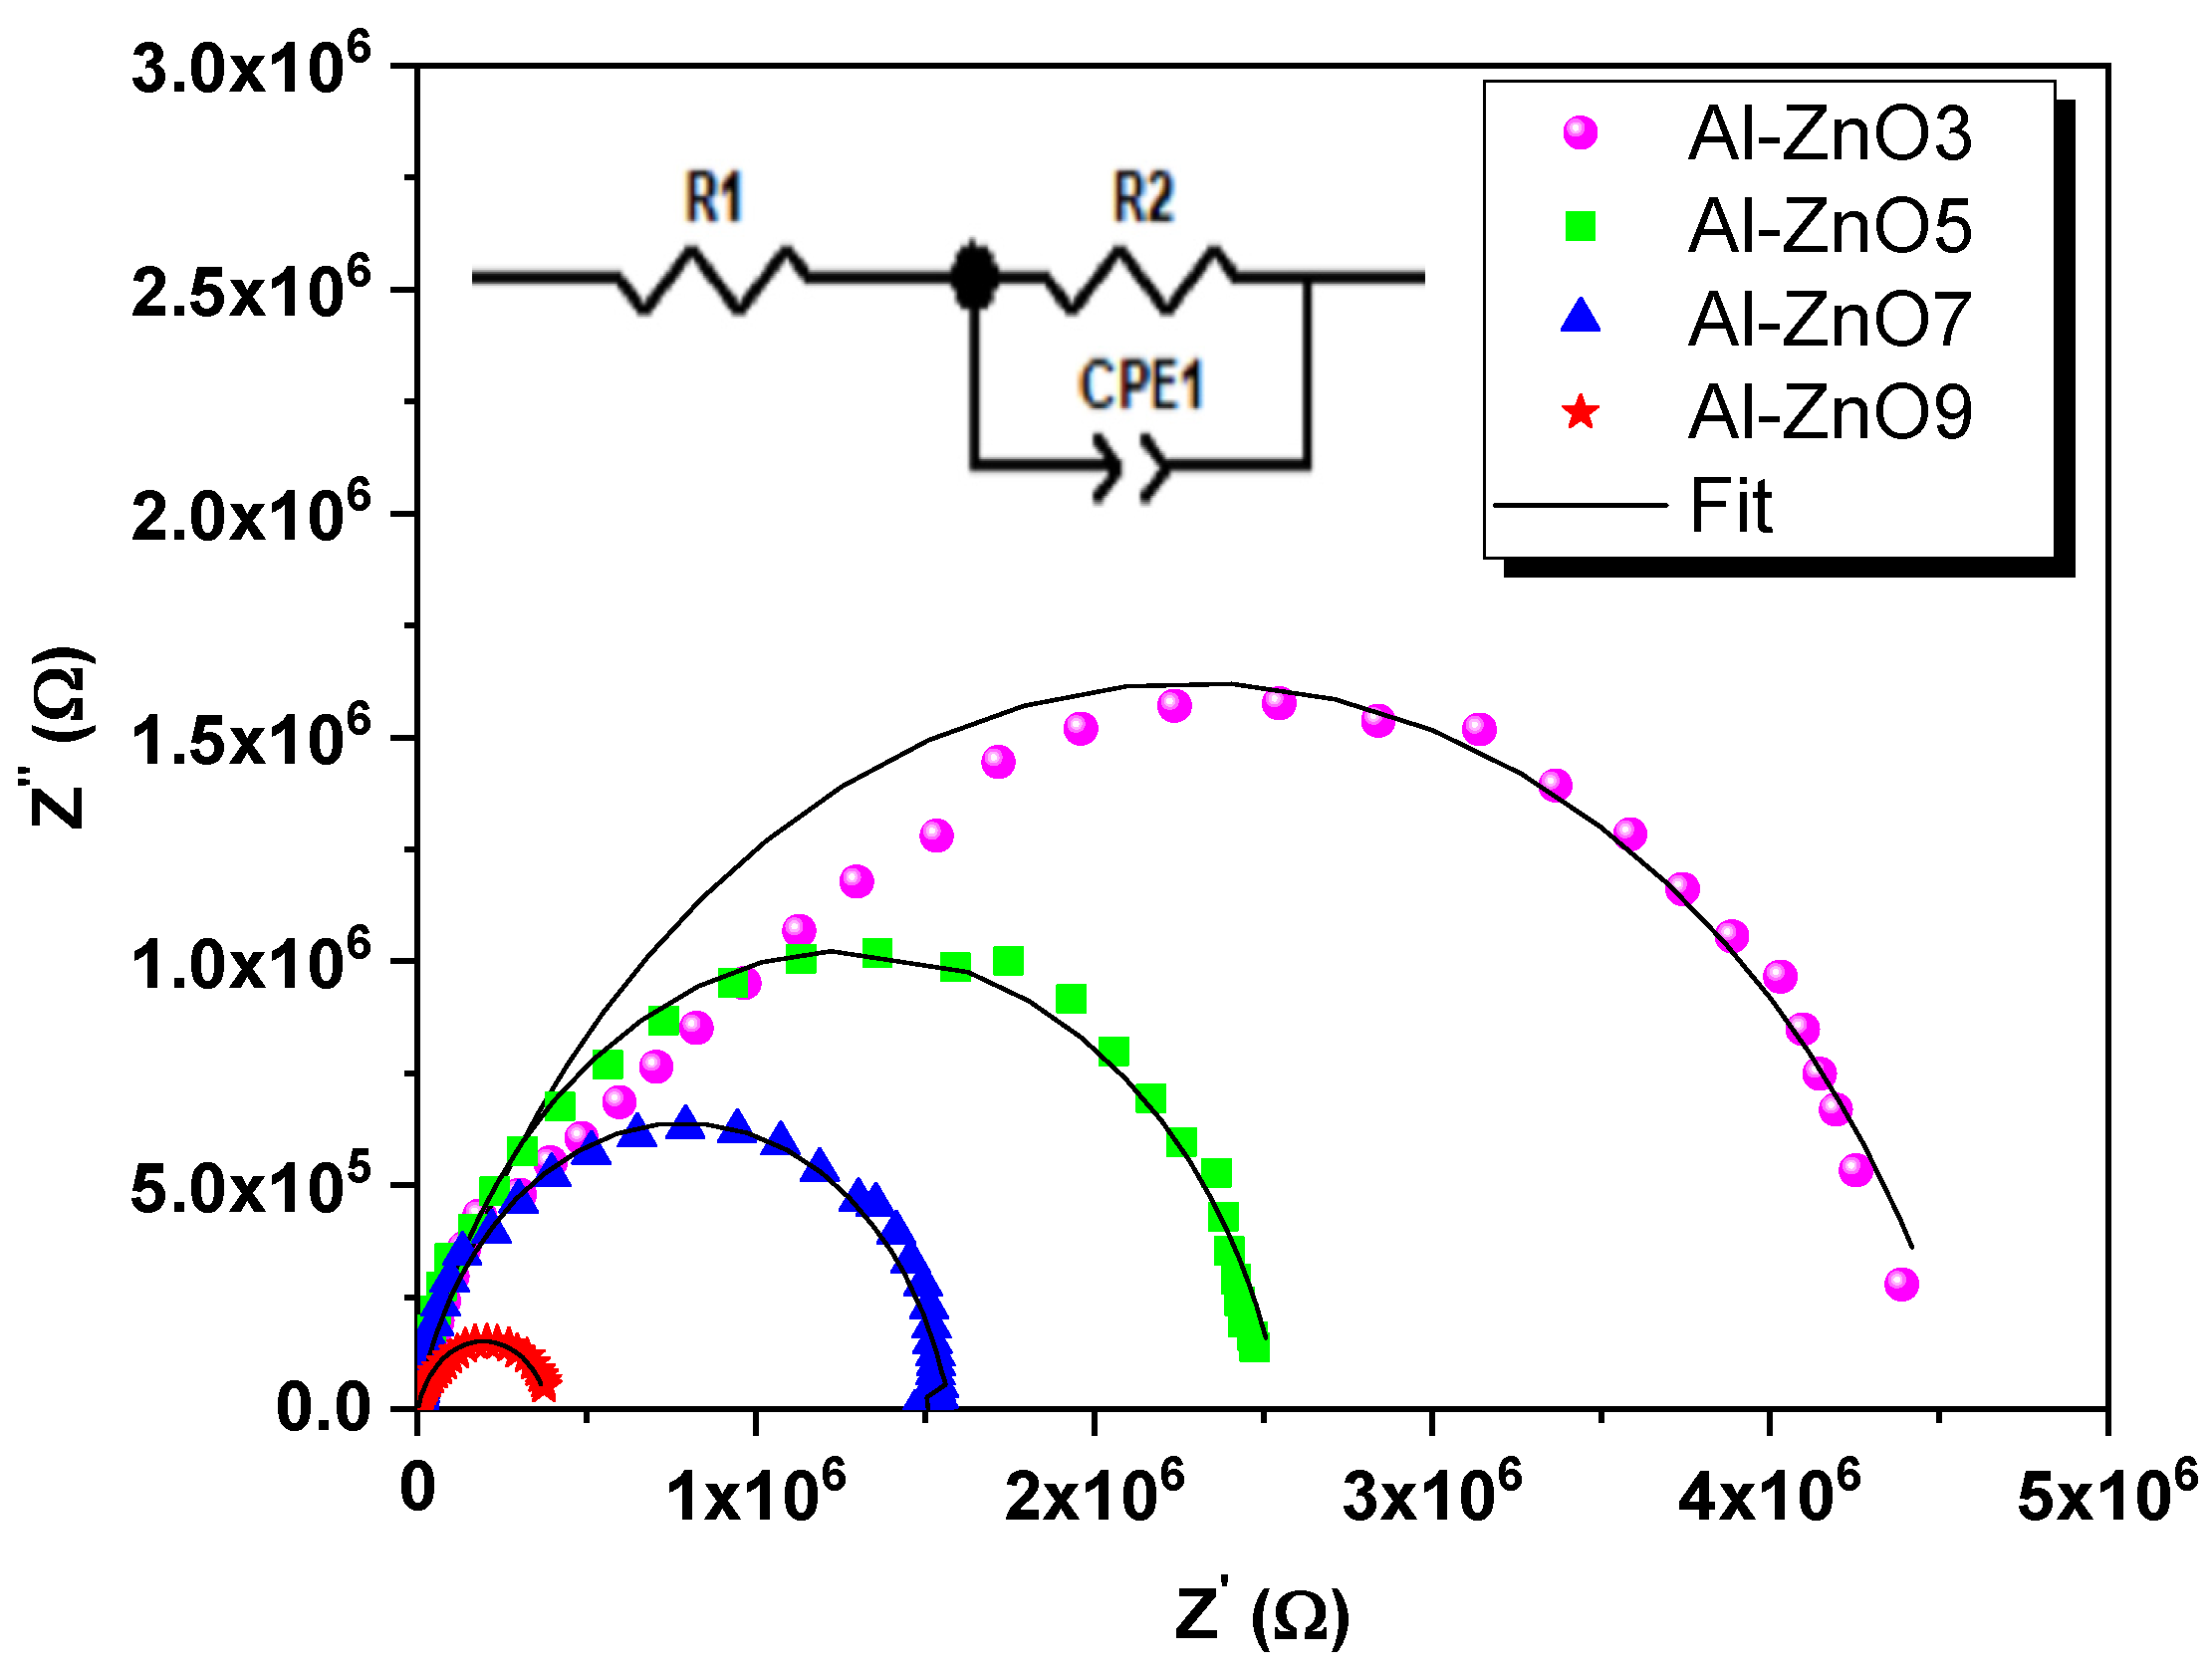
3.2.1. Electrical Analysis

The study of complex impedance spectroscopy is one of the most powerful methods for the investigation of nanocrystal materials’ electrical properties. Figure 12 depicts the complex impedance spectra Z″ against Z′ of the as-synthesized materials. After the substitution of Al ions in the ZnO host lattice, the impedance value decreased significantly. This reduction in impedance could be attributed to the increase in carrier concentration that happened when Al ions replaced zinc ions in the lattice structure. The Nyquist plots in this study exhibited semicircular arcs, with the centers of these semicircles notably positioned below the real axis, indicating highly depressed semicircles, demonstrating a relaxation that is not Debye-type [61,62]. The decentralization shown in the Nyquist diagram is attributed to the sample’s heterogeneity [63]. Furthermore, the arcs’ diameter decreased when the composition increased, indicating the semiconducting nature of the Al-ZnO samples [64,65]. Using ZView software, the Nyquist plots were fitted using an equivalent circuit configuration to further understand the relaxation process (inset of Figure 12). The equivalent circuit consists of a resistance (R1) connected in series with another cell that includes a parallel combination of a resistance (R2) and a constant phase element (CPE1). R1 corresponds to the bulk (grain) resistance of the Al-ZnO material, while R2 represents the grain boundary resistance, which is influenced by interfacial defects and charge trapping at the grain boundaries. The impedance of CPE1 is expressed as follows:
Z C P E = 1 C j ω α
where ω represents the angular frequency (rad s−1), and the C parameter denotes the capacitance value of the constant phase element (CPE). The CPE exponent α (0 < α < 1) reflects the distribution and micro-fractal nature of the interfacial phase. When α = 0, the CPE behaves as an ideal resistor, and when α = 1, it transforms into an ideal capacitor [66].
Considering the agreement between the computed and experimental lines, it seems that the electrical characteristics of the sample examined are sufficiently described by the proposed equivalent circuit. Table 6 displays the alterations in the composition of aluminum of the fitted parameters for the Al-ZnO samples. The observed 55% decrease in R1 and 91% reduction in R2 arose from synergistic effects between three key factors. First, the band gap narrowing enhanced charge carrier concentration by lowering the energy barrier for electron excitation, directly reducing bulk resistance. Moreover, the increased oxygen vacancy density promoted grain boundary conduction by acting as an electron donor while passivating interfacial defects, as evidenced by negative lattice strain values, thereby lowering R2. Furthermore, HEBM-induced morphological refinement, evidenced by reduced particle sizes and the development of spherical morphologies, minimized charge scattering pathways, further enhancing overall conductivity.
Based on the comparison of experimental Z′ and Z″ values at different compositions against simulations utilizing the corresponding circuit model’s fitted parameters, the choice of an equivalent circuit was justified, as illustrated in Figure 13a,b. In this case, the equivalent circuit was well suited to describe the electrical properties of the sample due to excellent superposition between the experimental and calculated data.
Figure 14a shows the modifications of the real part Z′ with the frequency for the Al-ZnO samples. As the frequency and composition increased, Z′ decreased gradually, reflecting the semiconductor behavior of the sample [67]. For all Al compositions, the point at which Z′ ceased to be dependent on frequency changed to operate in a higher frequency range. This indicates the presence of a frequency relaxation process within the sample, which is attributed to the accumulation of space charges at the grain boundaries [68]. The interconnected electronic, structural, and morphological optimizations collectively improved carrier mobility, as reflected in the frequency-dependent impedance behavior shown in Figure 14. The transition from grain-boundary-dominated conduction (low-frequency R2 effects) to bulk-dominated conduction (high-frequency R1 effects) confirms the semiconductor nature of Al-ZnO, where carrier transport evolved from vacancy-mediated hopping to band conduction. Similar behavior has been observed in other metal-doped ZnO nanocomposites [69]. Figure 14b illustrates the frequency dependence of the imaginary part of the complex impedance for Al-ZnO (Z″). The plot reveals a single maximum peak, Z″max, at a specific frequency referred to as the electrical relaxation frequency ( f m a x ). As the Al concentration increased, the peak position shifted toward higher frequencies, accompanied by a decrease in Z″ values. This reduction is believed to result from a decrease in the resistive part of the samples under investigation [67].

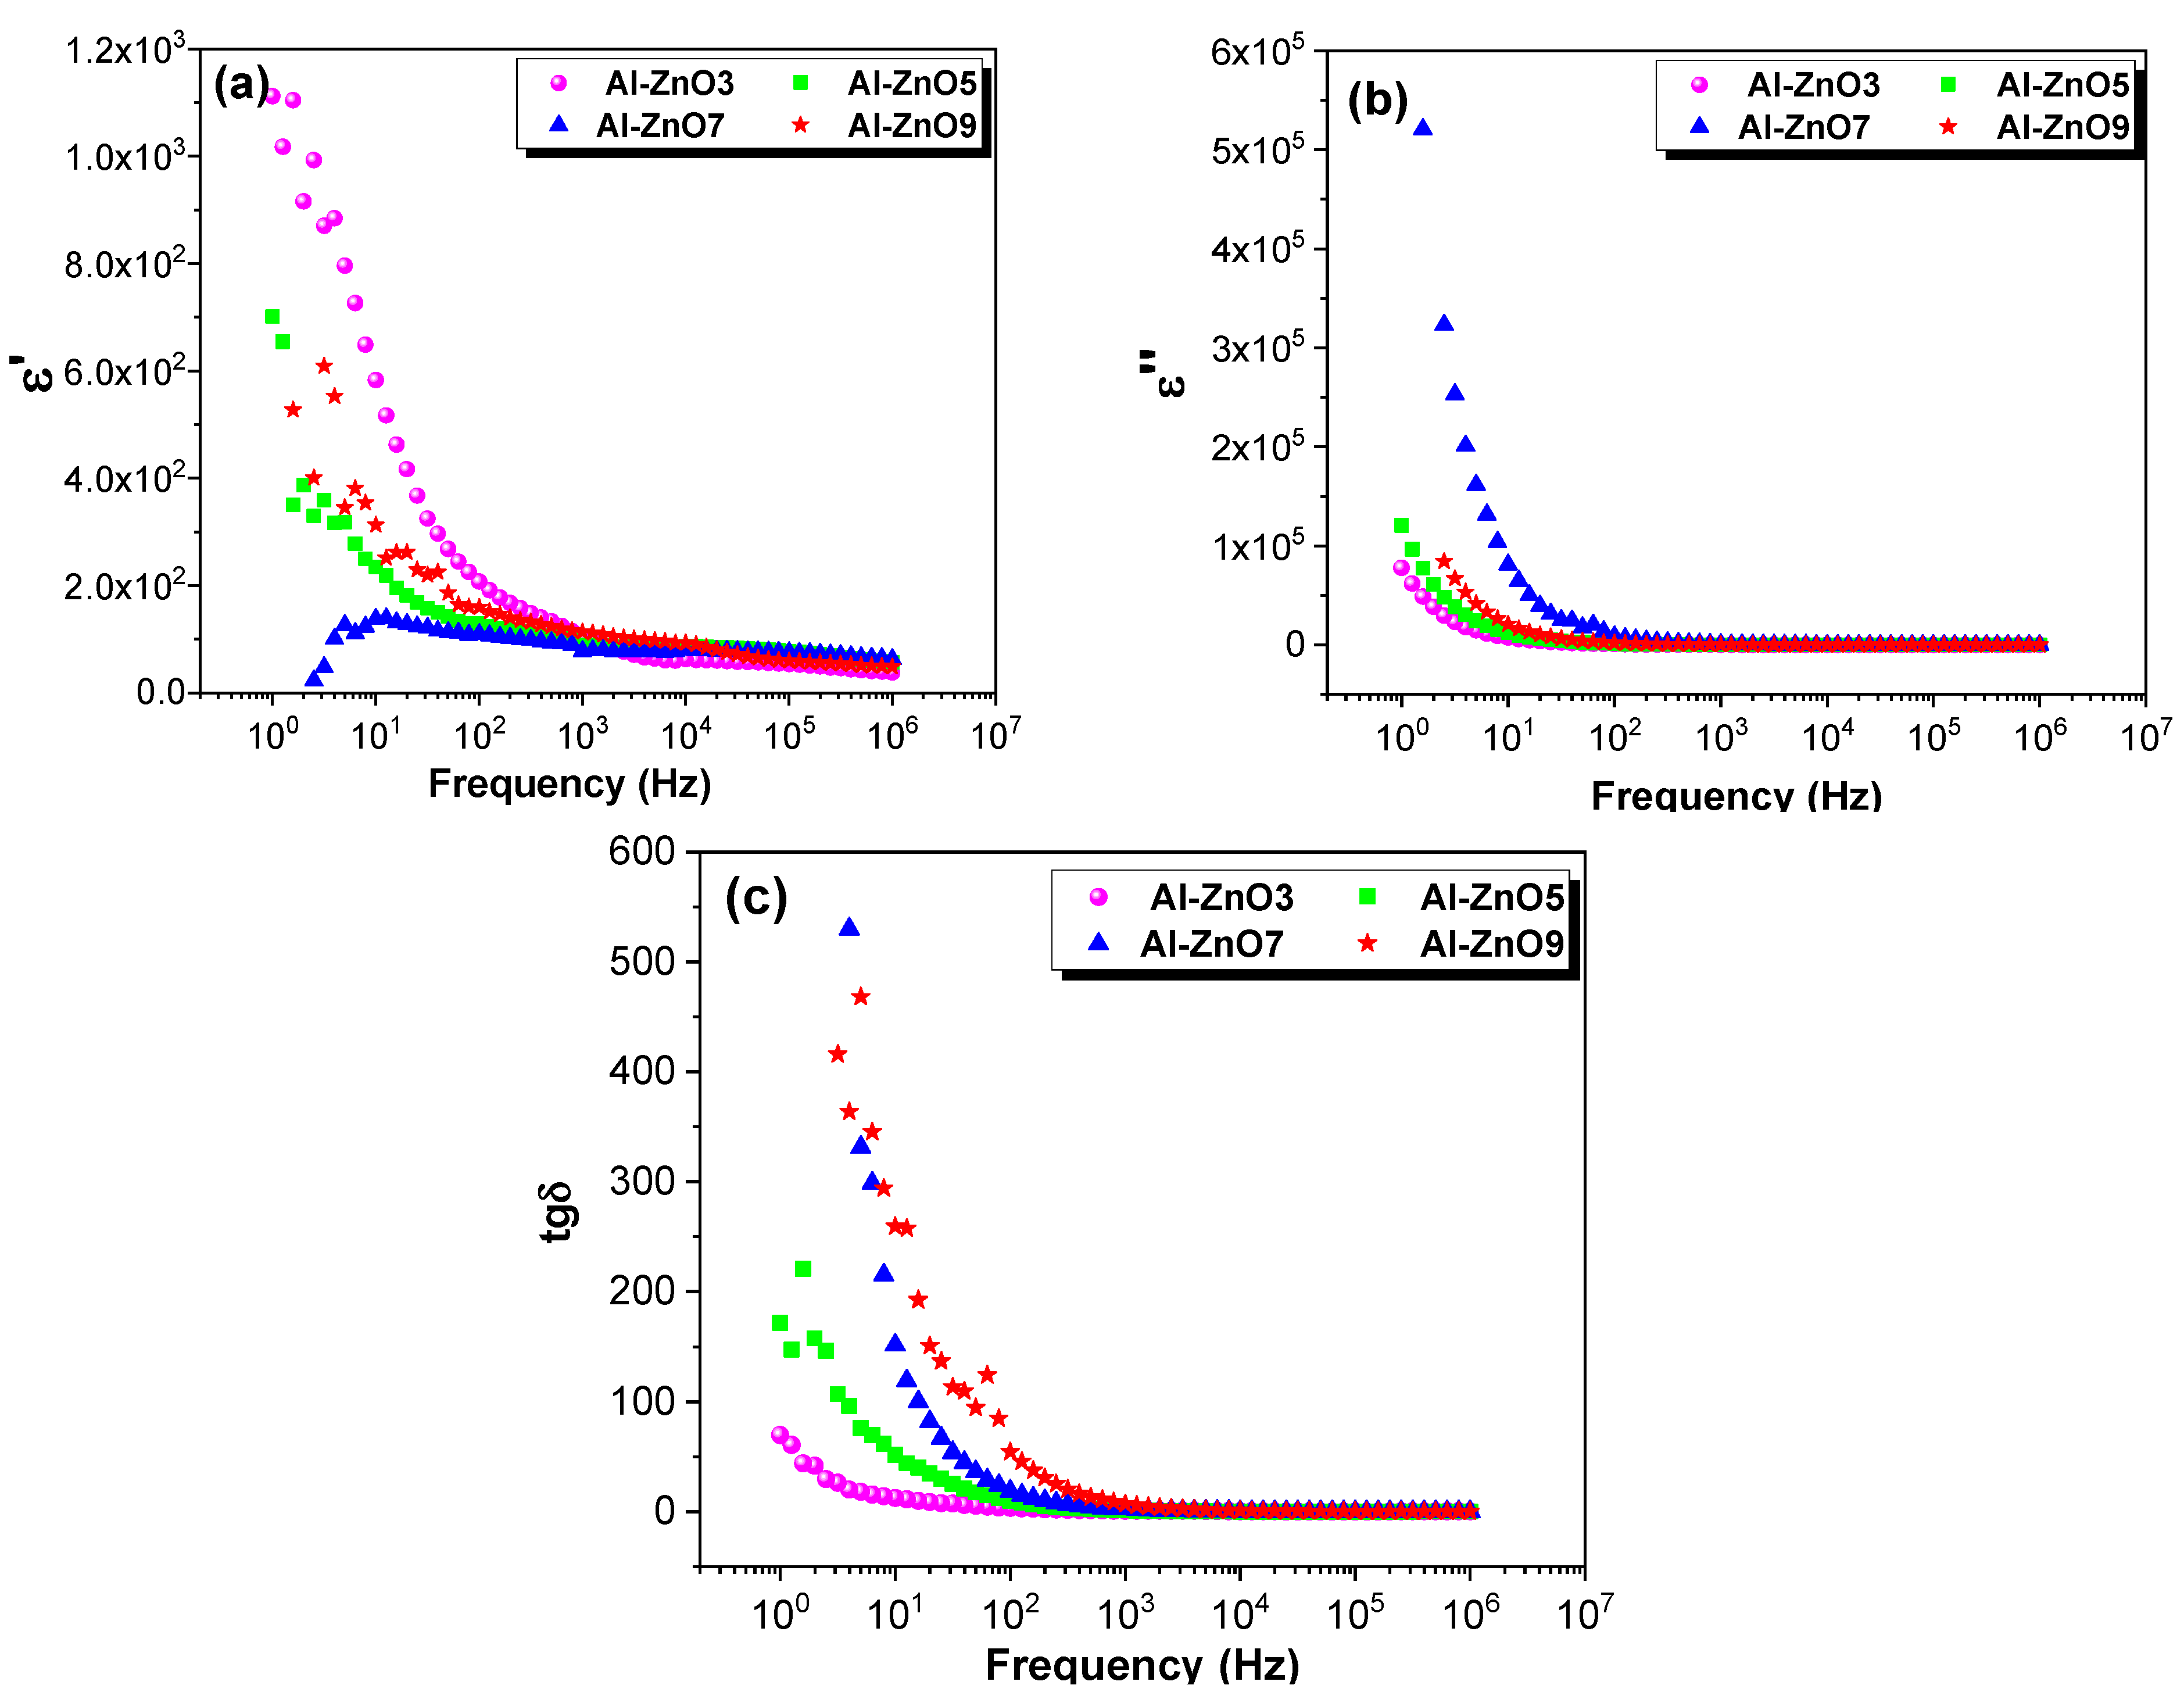
3.2.2. Dielectric Constant

A material’s dielectric responsiveness can be calculated using the following formula [70]:
ε * = ε + j ε  
ε = Z ω C 0 Z 2 + Z 2  
ε = Z ω C 0 Z 2 + Z 2
where ε and ε represent the real and imaginary components of the dielectric constant, respectively, and C0 denotes the vacuum capacitance of the cell. Figure 15a,b demonstrate that the dielectric constant of the sample increased as the frequency decreased, with this behavior becoming more pronounced at lower concentrations of the sample under investigation. This dielectric response is attributed to the polarization effect of the ZnO nanostructure [71,72]. In the low-frequency region, the dielectric behavior was primarily governed by space charge polarization. This non-monotonic trend arose from the competing effects of Al3+ doping: at low concentrations, substitutional Al3+ introduced oxygen vacancies that enhanced space charge polarization, increasing the dielectric response. However, at higher doping levels (e.g., Al-ZnO9), defect saturation and structural disorder suppressed polarization due to limited dipole alignment, while secondary phase formation (AlZn2O4, Figure 1) further restricted dielectric enhancement. Figure 15c illustrates the dielectric loss ( t g δ ) , as a function of frequency, calculated as follows:
t g δ = ε ε  
Dielectric loss quantifies the energy dissipated in the dielectric medium, arising from domain wall resonance and crystal lattice defects [73]. The loss declined rapidly at low and mid-frequencies, remaining steady at high frequencies. The increased dielectric loss at lower frequencies aligned with the oxygen vacancy concentrations (Table 2), where enhanced defect density promoted ionic hopping and space charge polarization [74]. Reduced losses at higher frequencies reflect diminished vacancy-mediated conduction [74].

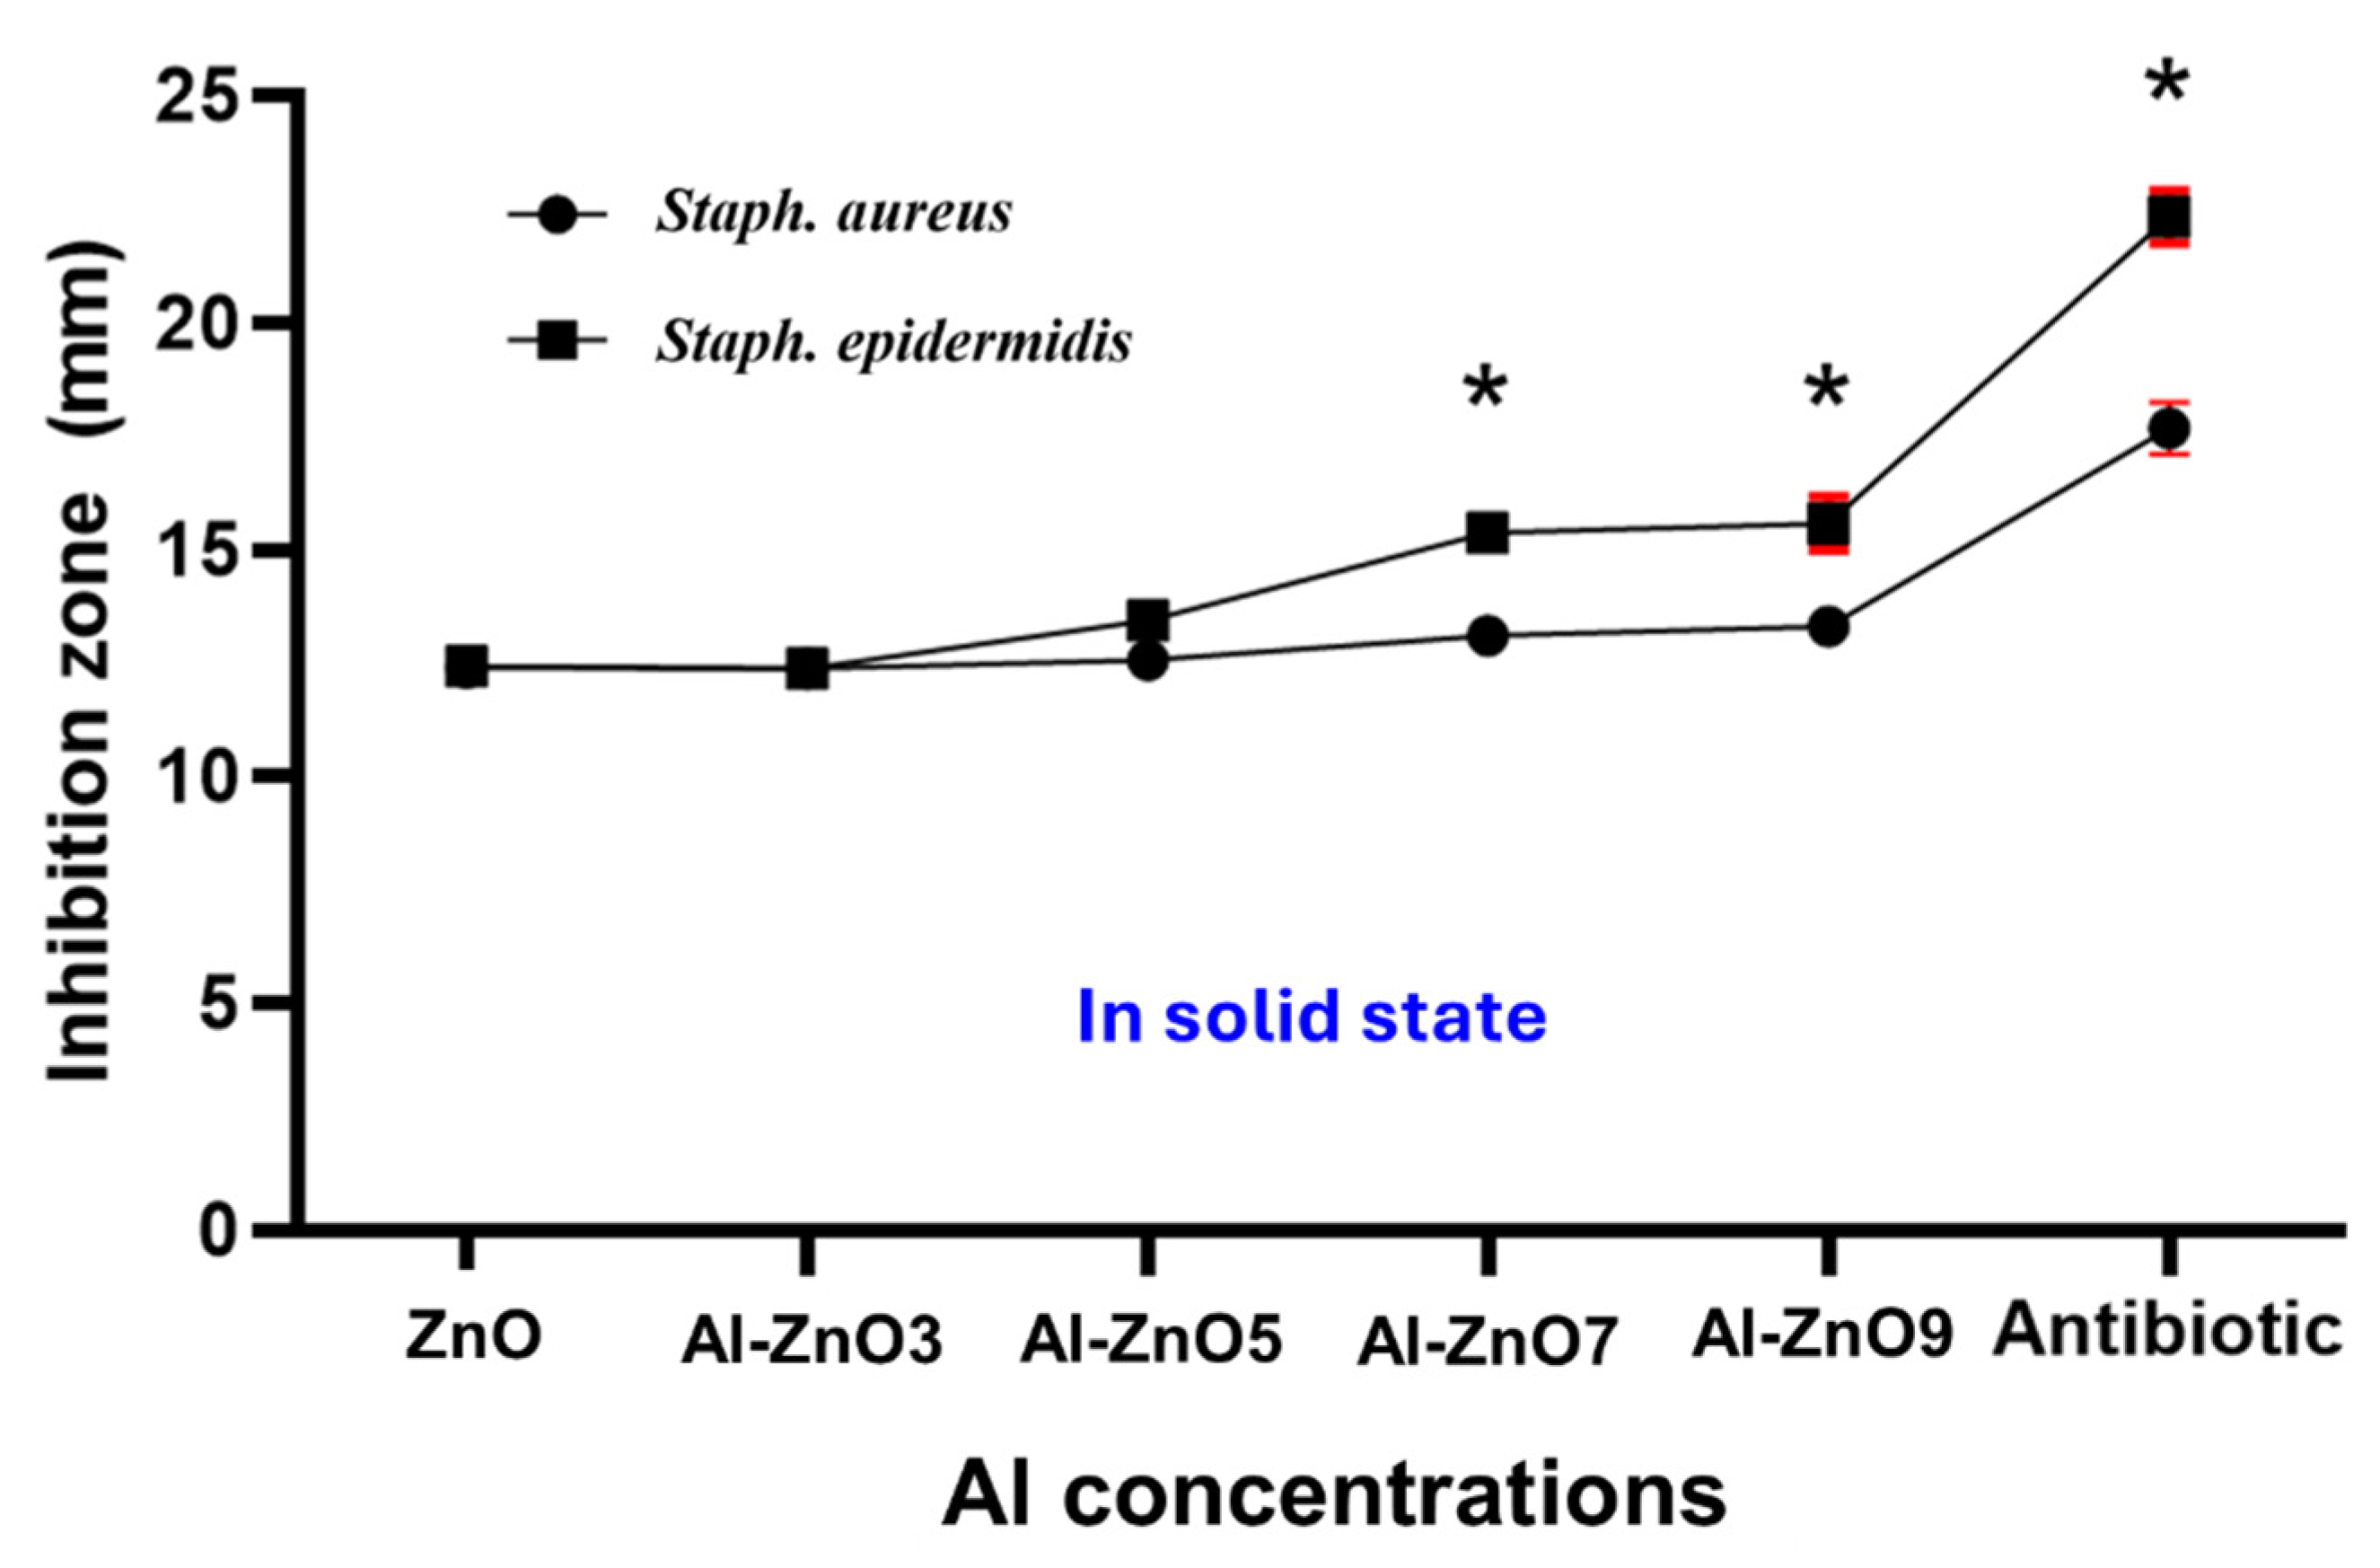
3.3. Screening for Antimicrobial Activity

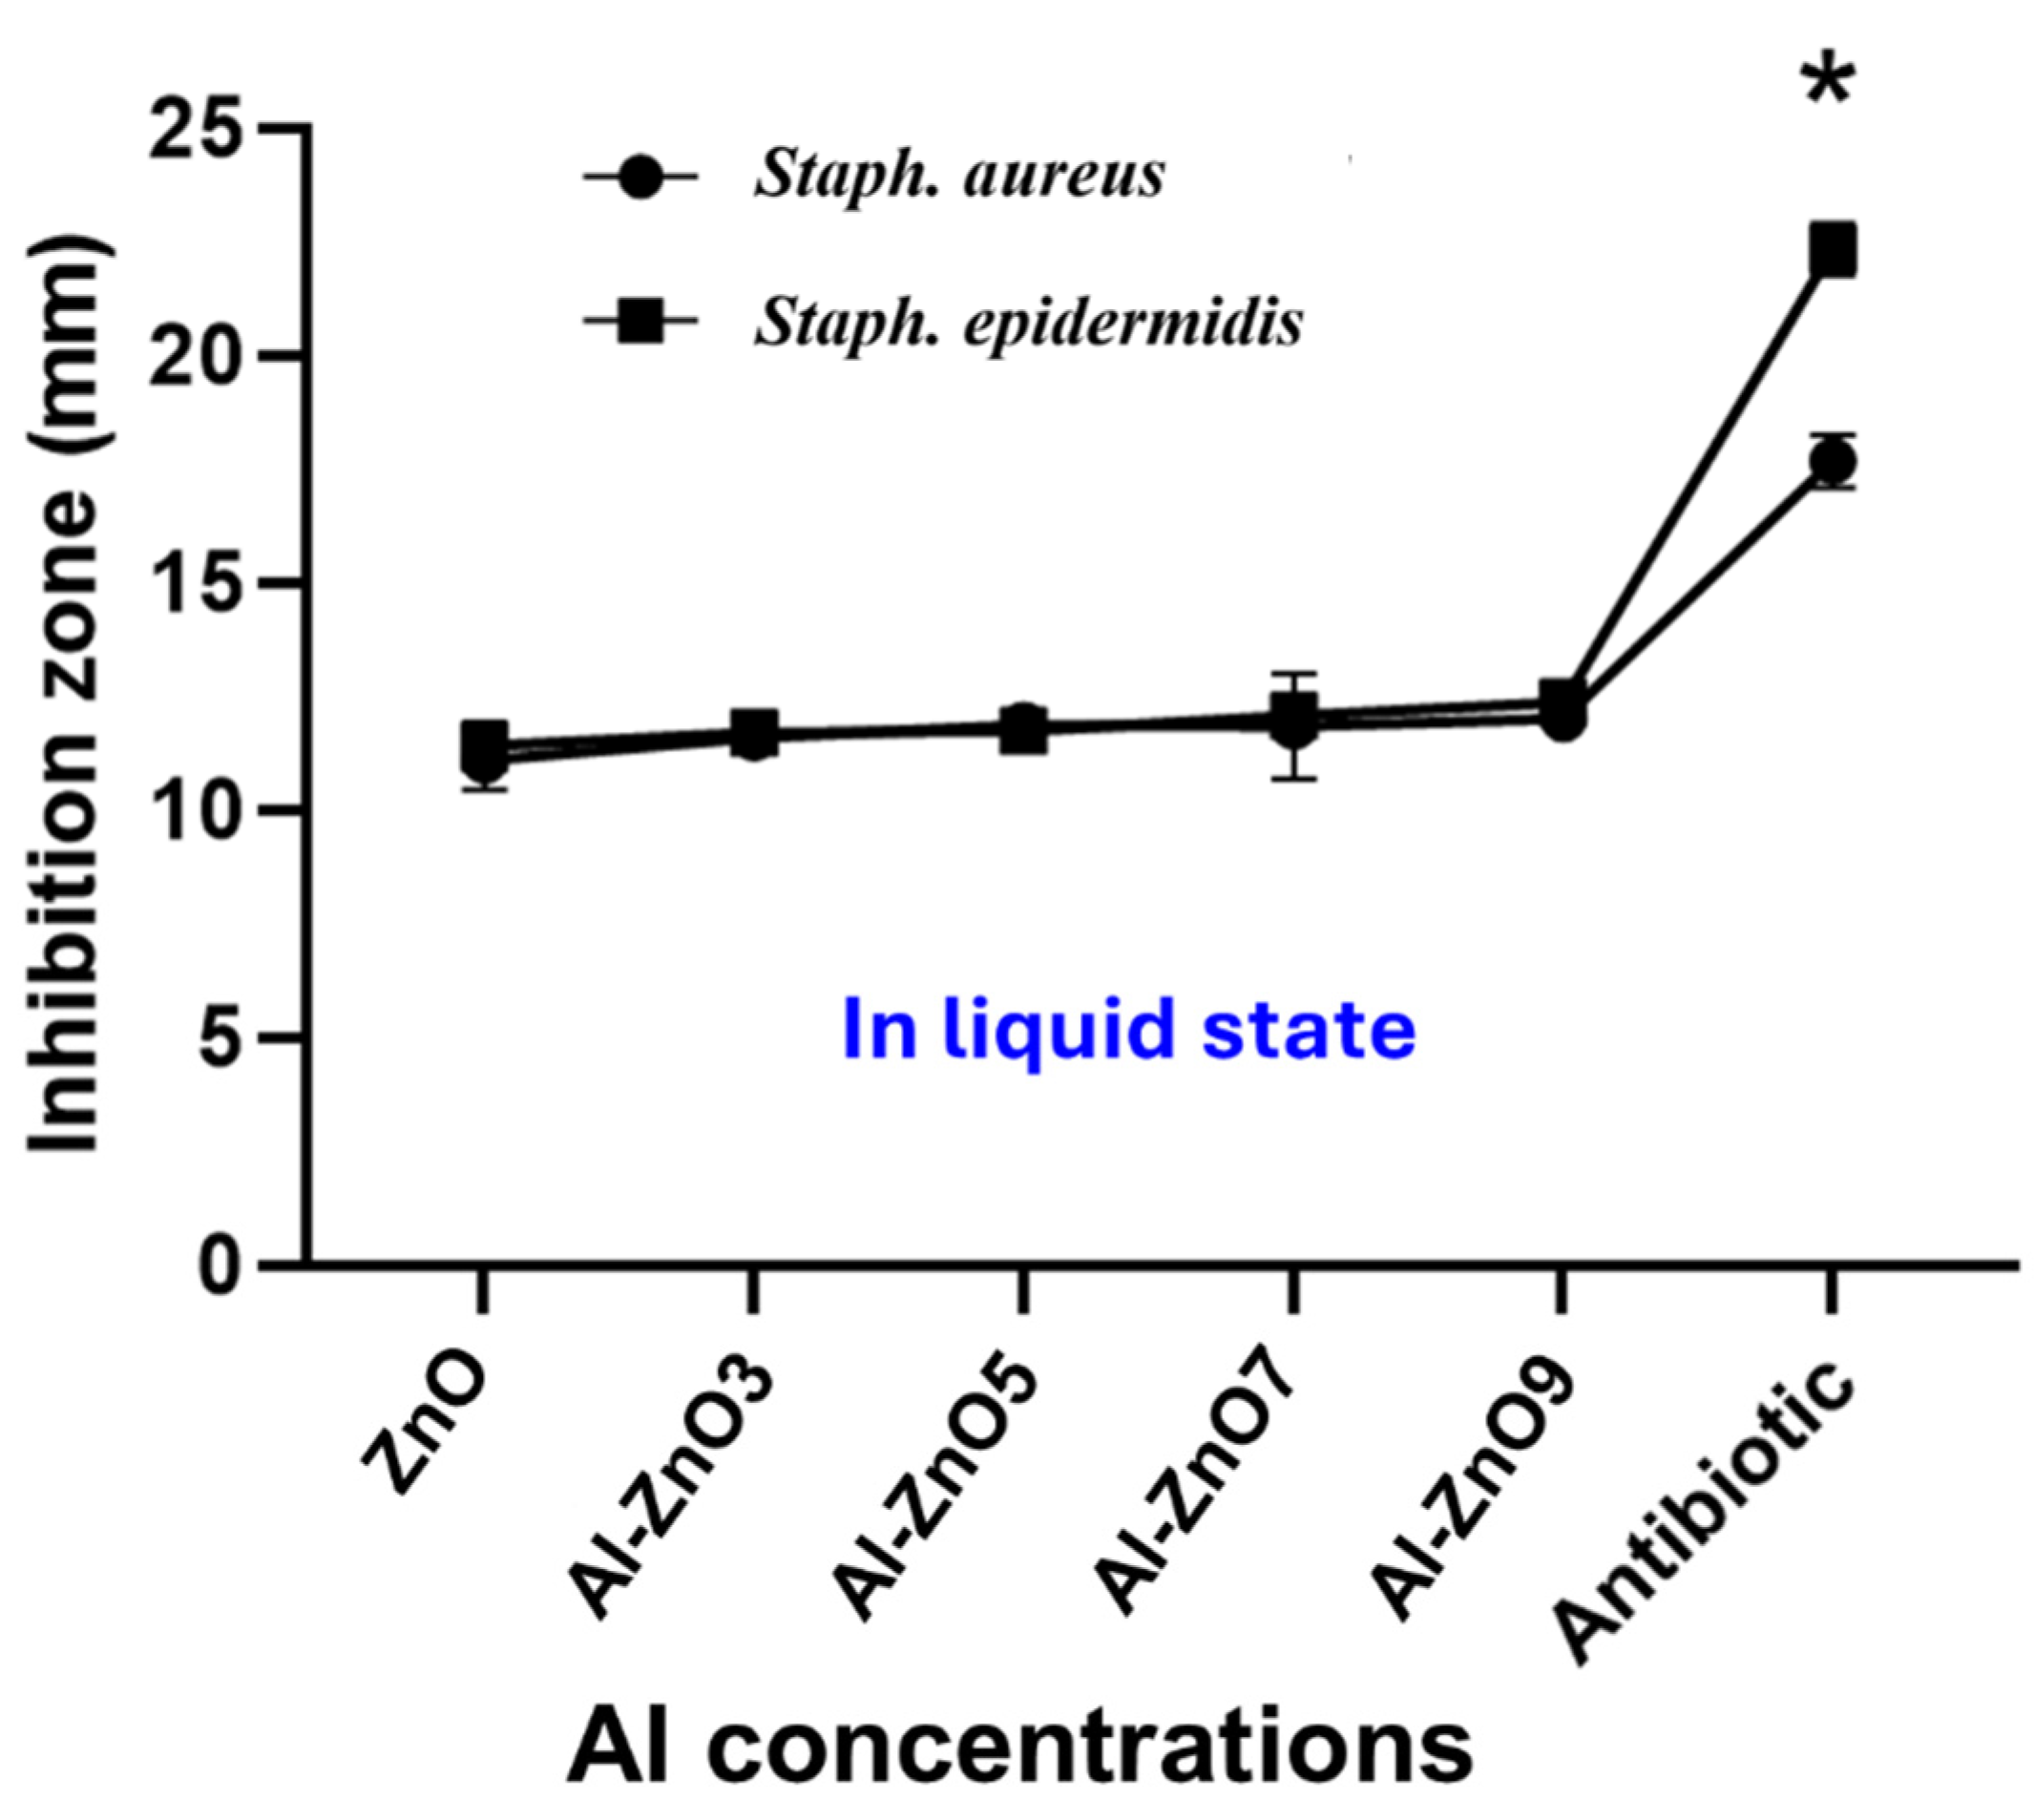
3.3.1. First Phase of Microbial Study: Doping Concentration, Microorganism Type, and Culture Medium State Parameters

To determine the most effective culture medium and assess the influence of HEBM in the solid-state reaction route, a two-phase experimental approach was designed to evaluate the antimicrobial activity of Al-ZnO samples under different conditions. In the initial phase of the microbial study, Al-ZnO samples with varying doping concentrations, which had not undergone the final 4 h HEBM process, were tested against four bacterial strains and two Candida species. The antimicrobial performance in this series was evaluated in two culture media states: (i) a solid medium and (ii) a liquid suspension. Based on the best results obtained from the first series, selected concentrations of Al-ZnO NP samples that had undergone the extended 4 h HEBM process were subjected to a second series of microbial tests. This second series used the same microorganism panel but focused on investigating the effects of particle size and environmental conditions (light and dark) on antimicrobial activity. The concentrations of the media, preparations, and detailed procedures are provided in the experimental section. This comprehensive study, as illustrated in the schematic diagram (Figure 16), evaluated the influence of doping concentration, particle size, culture media, and environmental factors on the antimicrobial performance of synthesized Al-ZnO materials.
The first phase of antimicrobial testing, summarized in Table 7, provided significant insights into the antimicrobial performance of Al-ZnO samples that were not subjected to the additional final 4 h HEBM process. Notably, no inhibition zones were observed for Gram-negative bacteria (E. coli and K. oxytoca) or fungal strains (C. tropicalis and C. albicans) across all samples, regardless of the doping concentration or medium state. This lack of antimicrobial activity of larger Al-ZnO particles (~750 nm, as shown by particle size distribution in Figure 6) against Gram-negative bacteria and fungi can be attributed to the structural complexity and resistance mechanisms of their cell walls. Gram-negative bacteria, including E. coli and K. oxytoca, possess an outer membrane composed of lipopolysaccharides, phospholipids, and proteins, which acts as a barrier, reducing NP permeability to the inner peptidoglycan layer and cytoplasmic membrane [75]. Additionally, the limited surface area and reactivity of larger particles hinder their ability to interact effectively with these microorganisms [76]. Furthermore, the absence of teichoic acids in Gram-negative bacteria results in fewer negative surface charges, weakening the electrostatic interactions necessary for nanoparticle attachment and penetration [77]. Similarly, fungal cell walls in fungi (C. tropicalis and C. albicans), composed of chitin, β-glucans, and mannoproteins, are protected by an outer mannoprotein layer rich in mannose residues, which prevents electrostatic nanoparticle attachment and penetration [78]. In contrast, Gram-positive bacteria (Staph. aureus and Staph. epidermidis), with their thick peptidoglycan layer and highly negatively charged surfaces due to teichoic acids, facilitate stronger electrostatic interactions with Al-ZnO particles, enabling even larger particles to adhere and exert antimicrobial effects [79]. These findings align with studies by Sirelkhatim et al. [17], which emphasized the role of cell wall composition in determining microbial susceptibility to ZnO particles.
In contrast, noticeable inhibition zones were observed for Gram-positive bacteria, indicating a selective antimicrobial effect that varied with doping concentration and medium state. In solid media, the inhibition zones increased from 12.37 ± 0.24 mm (Al-ZnO3) to 13.3 ± 0.15 mm (Al-ZnO9) for Staph. aureus and from 12.37 ± 0.20 mm (Al-ZnO3) to 15.57 ± 0.35 mm (Al-ZnO9) for Staph. epidermidis, demonstrating a consistent improvement with higher Al content. A similar trend was observed in liquid media, though the inhibition zones were smaller, ranging from 11.6 ± 0.12 mm to 12.0 ± 0.001 mm for Staph. aureus and from 11.7 ± 0.17 mm to 12.37 ± 0.19 mm for Staph. epidermidis. These results suggest that Al doping enhances the antimicrobial activity of ZnO by potentially altering its electronic structure and increasing the generation of reactive oxygen species (ROS), which play a critical role in bacterial membrane disruption [80]. While these findings indicate a positive correlation between doping concentration and antimicrobial efficacy, the variation between solid and liquid media underscores the need for further analysis to fully understand the role of medium state in influencing nanoparticle activity. Conducting an ANOVA analysis followed by the Tukey–Kramer post hoc test would provide a more comprehensive understanding of the combined effects of medium state and doping concentration on antimicrobial performance.
Statistical evaluations of the antibacterial activity of Al-ZnO samples in the solid-state medium are shown respectively in Table 8 and Figure 17. The results reveal a statistically significant difference in inhibition zones between pure ZnO and Al-doped ZnO against Staph. aureus, with the most pronounced effects observed at 7 wt.% and 9 wt.% Al doping. Both Al-ZnO7 and Al-ZnO9 exhibited the largest inhibition zones, highlighting the enhanced antibacterial activity at higher doping levels. These findings align with a recent study by Khashan et al. [33], which demonstrated that higher Al doping concentrations improve the antibacterial efficacy of ZnO, particularly against Staph. aureus. However, standard antibiotics still demonstrated superior efficacy compared to all Al-ZnO samples. For Staph. epidermidis, significant differences were observed between pure ZnO and samples doped at 5 wt.% and 7 wt.%, with Al-ZnO7 showing the most substantial improvement. Interestingly, Al-ZnO9 did not exhibit a significant difference compared to pure ZnO and lower doping levels for Staph. epidermidis. These results emphasize the critical role of Al doping in enhancing the antibacterial performance of ZnO, with Al-ZnO7 and Al-ZnO9 demonstrating the most significant improvements. The higher sensitivity of Staph. epidermidis to doped ZnO further supports the potential of Al doping for optimizing antibacterial treatments in the solid state.
The statistical analysis in Table 9 and Figure 18 evaluates the antibacterial effects of Al-ZnO powders in the liquid state. The reference antibiotic consistently produced the largest inhibition zones for both Staph. aureus and Staph. epidermidis, underscoring its superior efficacy. For Al-ZnO samples, the inhibition zones for both bacteria showed no significant variation across doping concentrations, suggesting that Al doping has a lesser influence on antibacterial activity in the liquid state compared to the solid state. This could have been due to particle dispersion in the liquid medium, which reduced localized concentrations and limited interaction with bacterial cells. Interestingly, Staph. epidermidis exhibited slightly larger inhibition zones than Staph. aureus across all concentrations, indicating higher susceptibility to Al-ZnO powders in the liquid state. However, the significant difference in inhibition zones, induced by the reference antibiotic between Staph. epidermidis and Staph. aureus, highlights the varying responses of these bacteria to antibacterial agents in liquid media.
The observed enhanced antimicrobial efficacy of Al-ZnO samples in solid media compared to liquid media can be attributed to several factors. In solid media, particles remain localized at the site of application, leading to higher local concentrations and prolonged exposure of microorganisms to the antimicrobial agent. This localization facilitates more effective interactions between particles and microbial cells, resulting in more pronounced inhibition zones. In contrast, in liquid media, particles are dispersed throughout the medium, leading to a dilution effect and a reduced effective concentration. Additionally, particle aggregation or settling in liquid media further diminishes their availability and uniformity, reducing antimicrobial efficacy. These findings align with studies by Zhang et al. [81] and Raffi et al. [82], which emphasize the stability and localized interactions of nanoparticles in solid media, supporting the enhanced antimicrobial performance observed in this study.

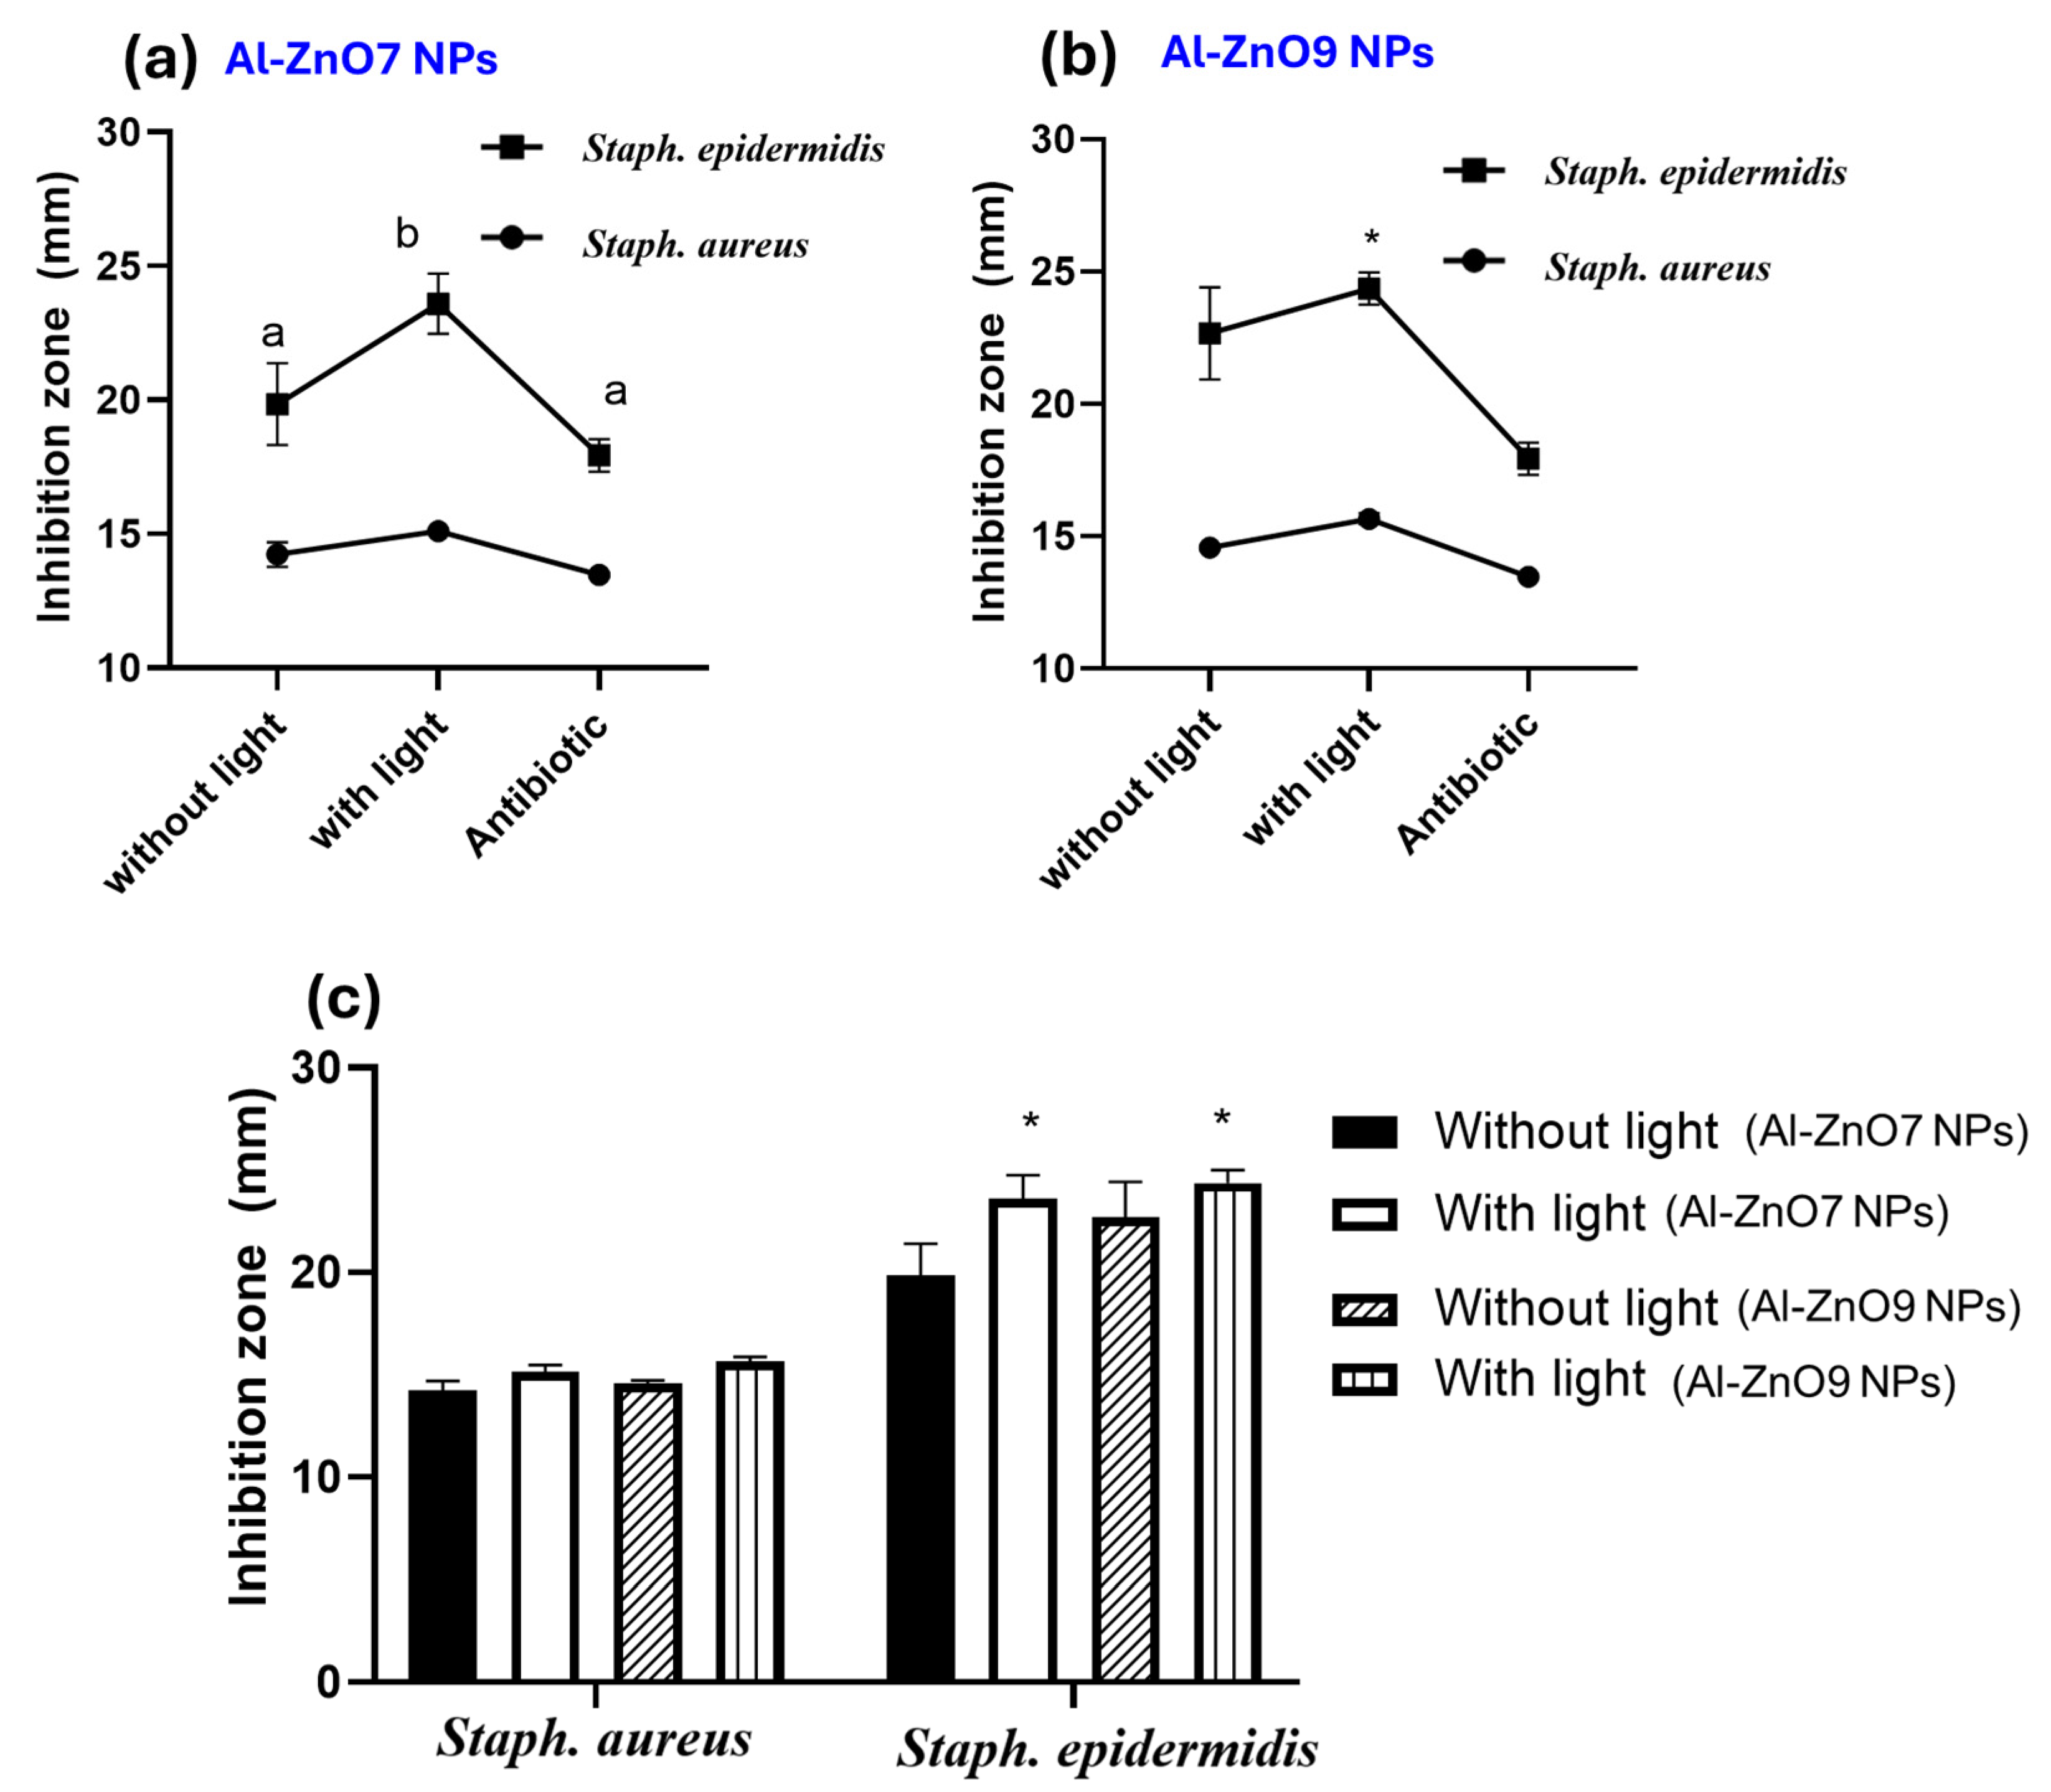
3.3.2. Second Phase of Microbial Study: Particle Size, Microorganism Type, and Exposure to Light/Dark Parameters

Building on the findings from the first phase, the second phase of microbial testing focused on the best-performing Al-ZnO concentrations (7 wt.% and 9 wt.%) and evaluated the impact of particle size reduction through HEBM, as well as light/dark exposure, on antimicrobial activity. The experiments were conducted in the solid-state medium, which demonstrated superior performance in the first phase. As shown in Table 10, Al-ZnO samples subjected to HEBM, resulting in reduced particle sizes, consistently exhibited enhanced antimicrobial activity compared to unmilled samples. For Gram-negative bacteria (E. coli and K. oxytoca), which showed no activity with unmilled samples, inhibition zones of up to 11.3 mm and 12.5 mm, respectively, were observed after milling. For Gram-positive bacteria, particle size reduction also led to improved activity, with Staph. aureus showing an increase in inhibition zones by approximately 1 mm after milling, and Staph. epidermidis showing the most pronounced improvement (up to a 7 mm increase in inhibition zones). The greater susceptibility of Gram-positive bacteria was likely due to their simpler cell wall structure, which facilitates nanoparticle attachment and reactive oxygen species (ROS)-mediated disruption. A study by Qayyum et al. [83] reported that nanoparticles with smaller sizes generate higher levels of ROS upon interaction with bacterial cells, causing oxidative damage to the cell membrane and intracellular components and leading to bacterial death. Similarly, Lahiri et al. [84] highlighted that reduced particle size improves antimicrobial performance by enabling nanoparticles to penetrate bacterial membranes more effectively. This penetration disrupts membrane integrity, causing the leakage of cellular contents and eventual cell death.
Light exposure significantly enhanced the antimicrobial activity of the Al-ZnO samples, likely due to the photocatalytic properties of ZnO, which generate ROS under light exposure. This phenomenon has been documented in various studies, including the work by Abou Zeid et al. [85]. For Gram-negative bacteria, light exposure increased inhibition zones by approximately 1 mm compared to dark conditions. For Gram-positive bacteria, the effect was more pronounced, with Staph. epidermidis exhibiting the largest improvement (up to a 4 mm increase under light). For fungi (C. tropicalis and C. albicans), milled samples demonstrated significant inhibition under light exposure, with C. albicans showing inhibition zones of up to 24.5 mm. These findings underscore the critical role of light in enhancing the antimicrobial potential of Al-ZnO, particularly against fungal strains.
One-way ANOVA (Figure 19) revealed that both Al-ZnO7 and Al-ZnO9 exhibited significantly larger inhibition zones under light exposure compared to dark conditions, with Staph. epidermidis showing a more pronounced response than Staph. aureus (p < 0.05). This indicates that the antimicrobial efficacy of the nanoparticles is highly responsive to light, particularly for Staph. epidermidis, which appears more susceptible to ROS-mediated damage. In contrast, Staph. aureus showed comparatively smaller inhibition zones under light conditions, potentially due to its thicker peptidoglycan layer and robust antioxidant defense mechanisms, such as catalase, superoxide dismutase, and staphyloxanthin, which neutralize ROS [86,87].
The observed enhancement under light conditions reflects the photocatalytic behavior of ZnO NPs, where light exposure activates surface reactions that generate ROS, such as hydroxyl radicals, superoxide ions, and singlet oxygen [88]. These ROS disrupt bacterial membranes, inactivate critical enzymes, and damage nucleic acids, ultimately inhibiting bacterial growth. As shown in Figure 19c, Al-ZnO9 exhibited the highest antimicrobial efficacy under light exposure, correlating with a significant reduction in its band gap. DRS analysis revealed a decrease in the band gap from 3.269 eV for pure ZnO to 3.054 eV for the 9% Al-doped composition, a reduction of 0.215 eV. This band gap narrowing enhances photoactivity by facilitating electron excitation under light irradiation, thereby boosting ROS generation and antimicrobial performance. These findings underscore the role of band gap reduction in enhancing the light-driven antimicrobial properties of Al-ZnO, particularly at higher doping levels.

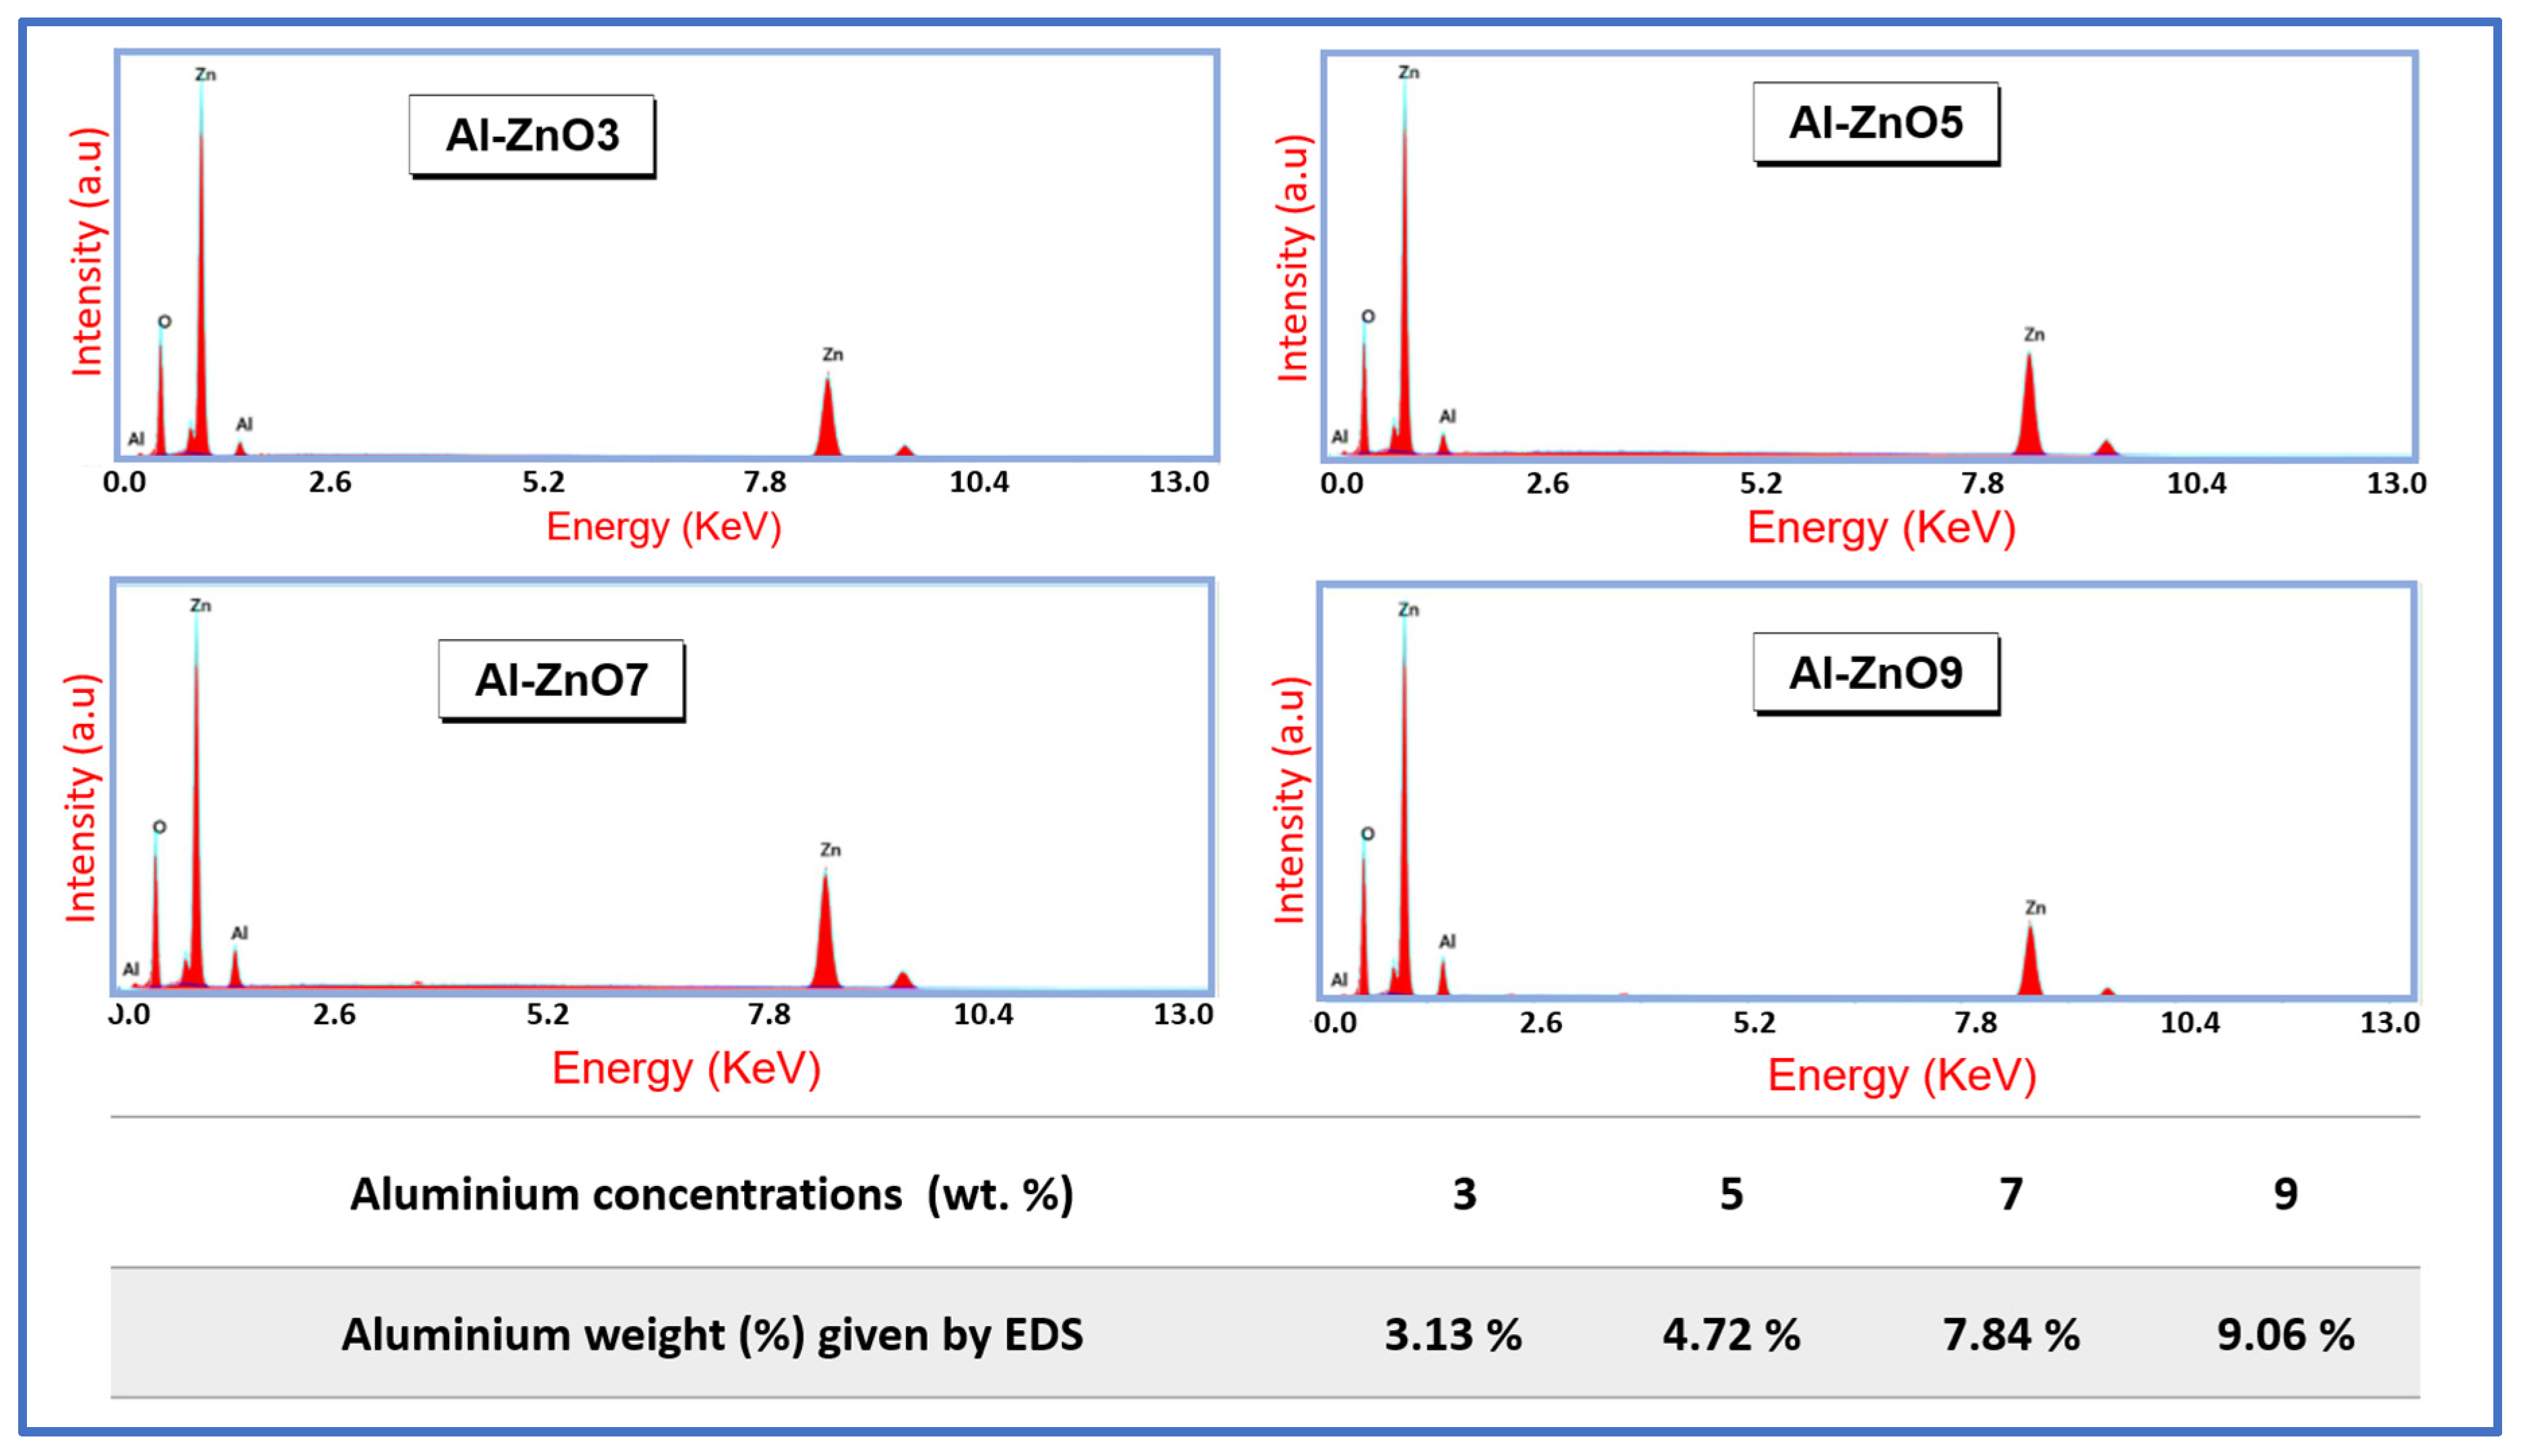
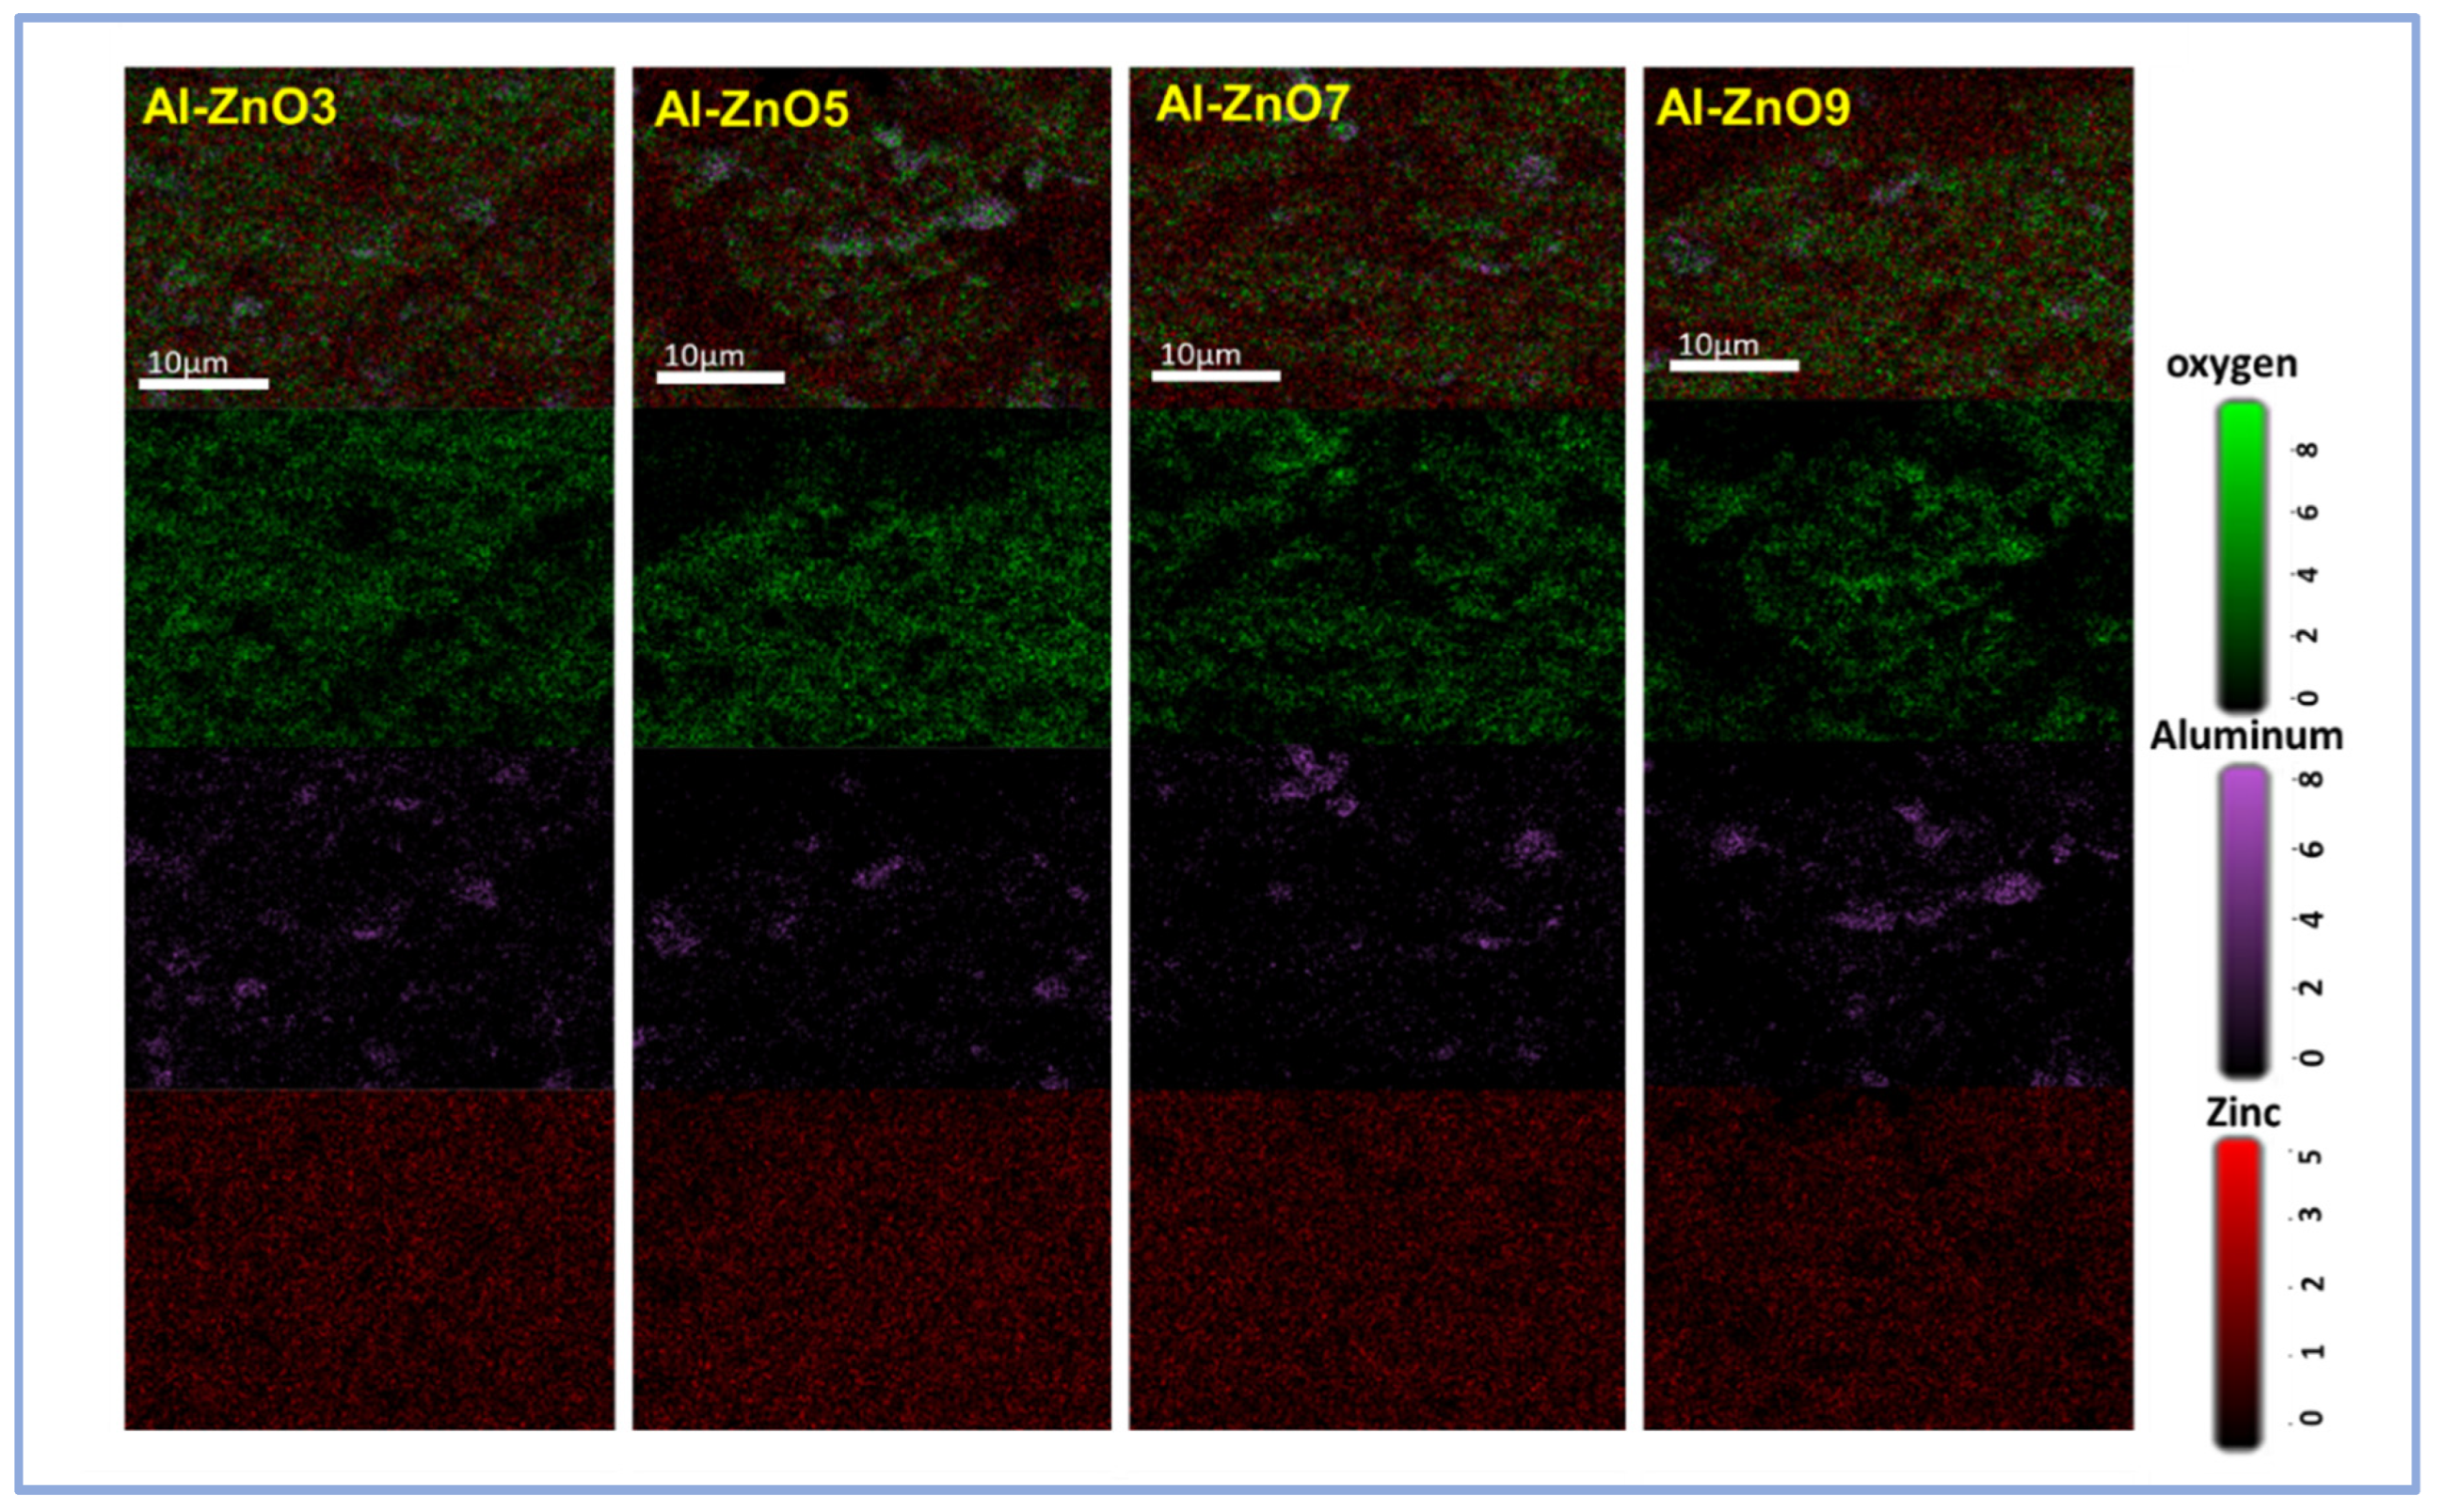
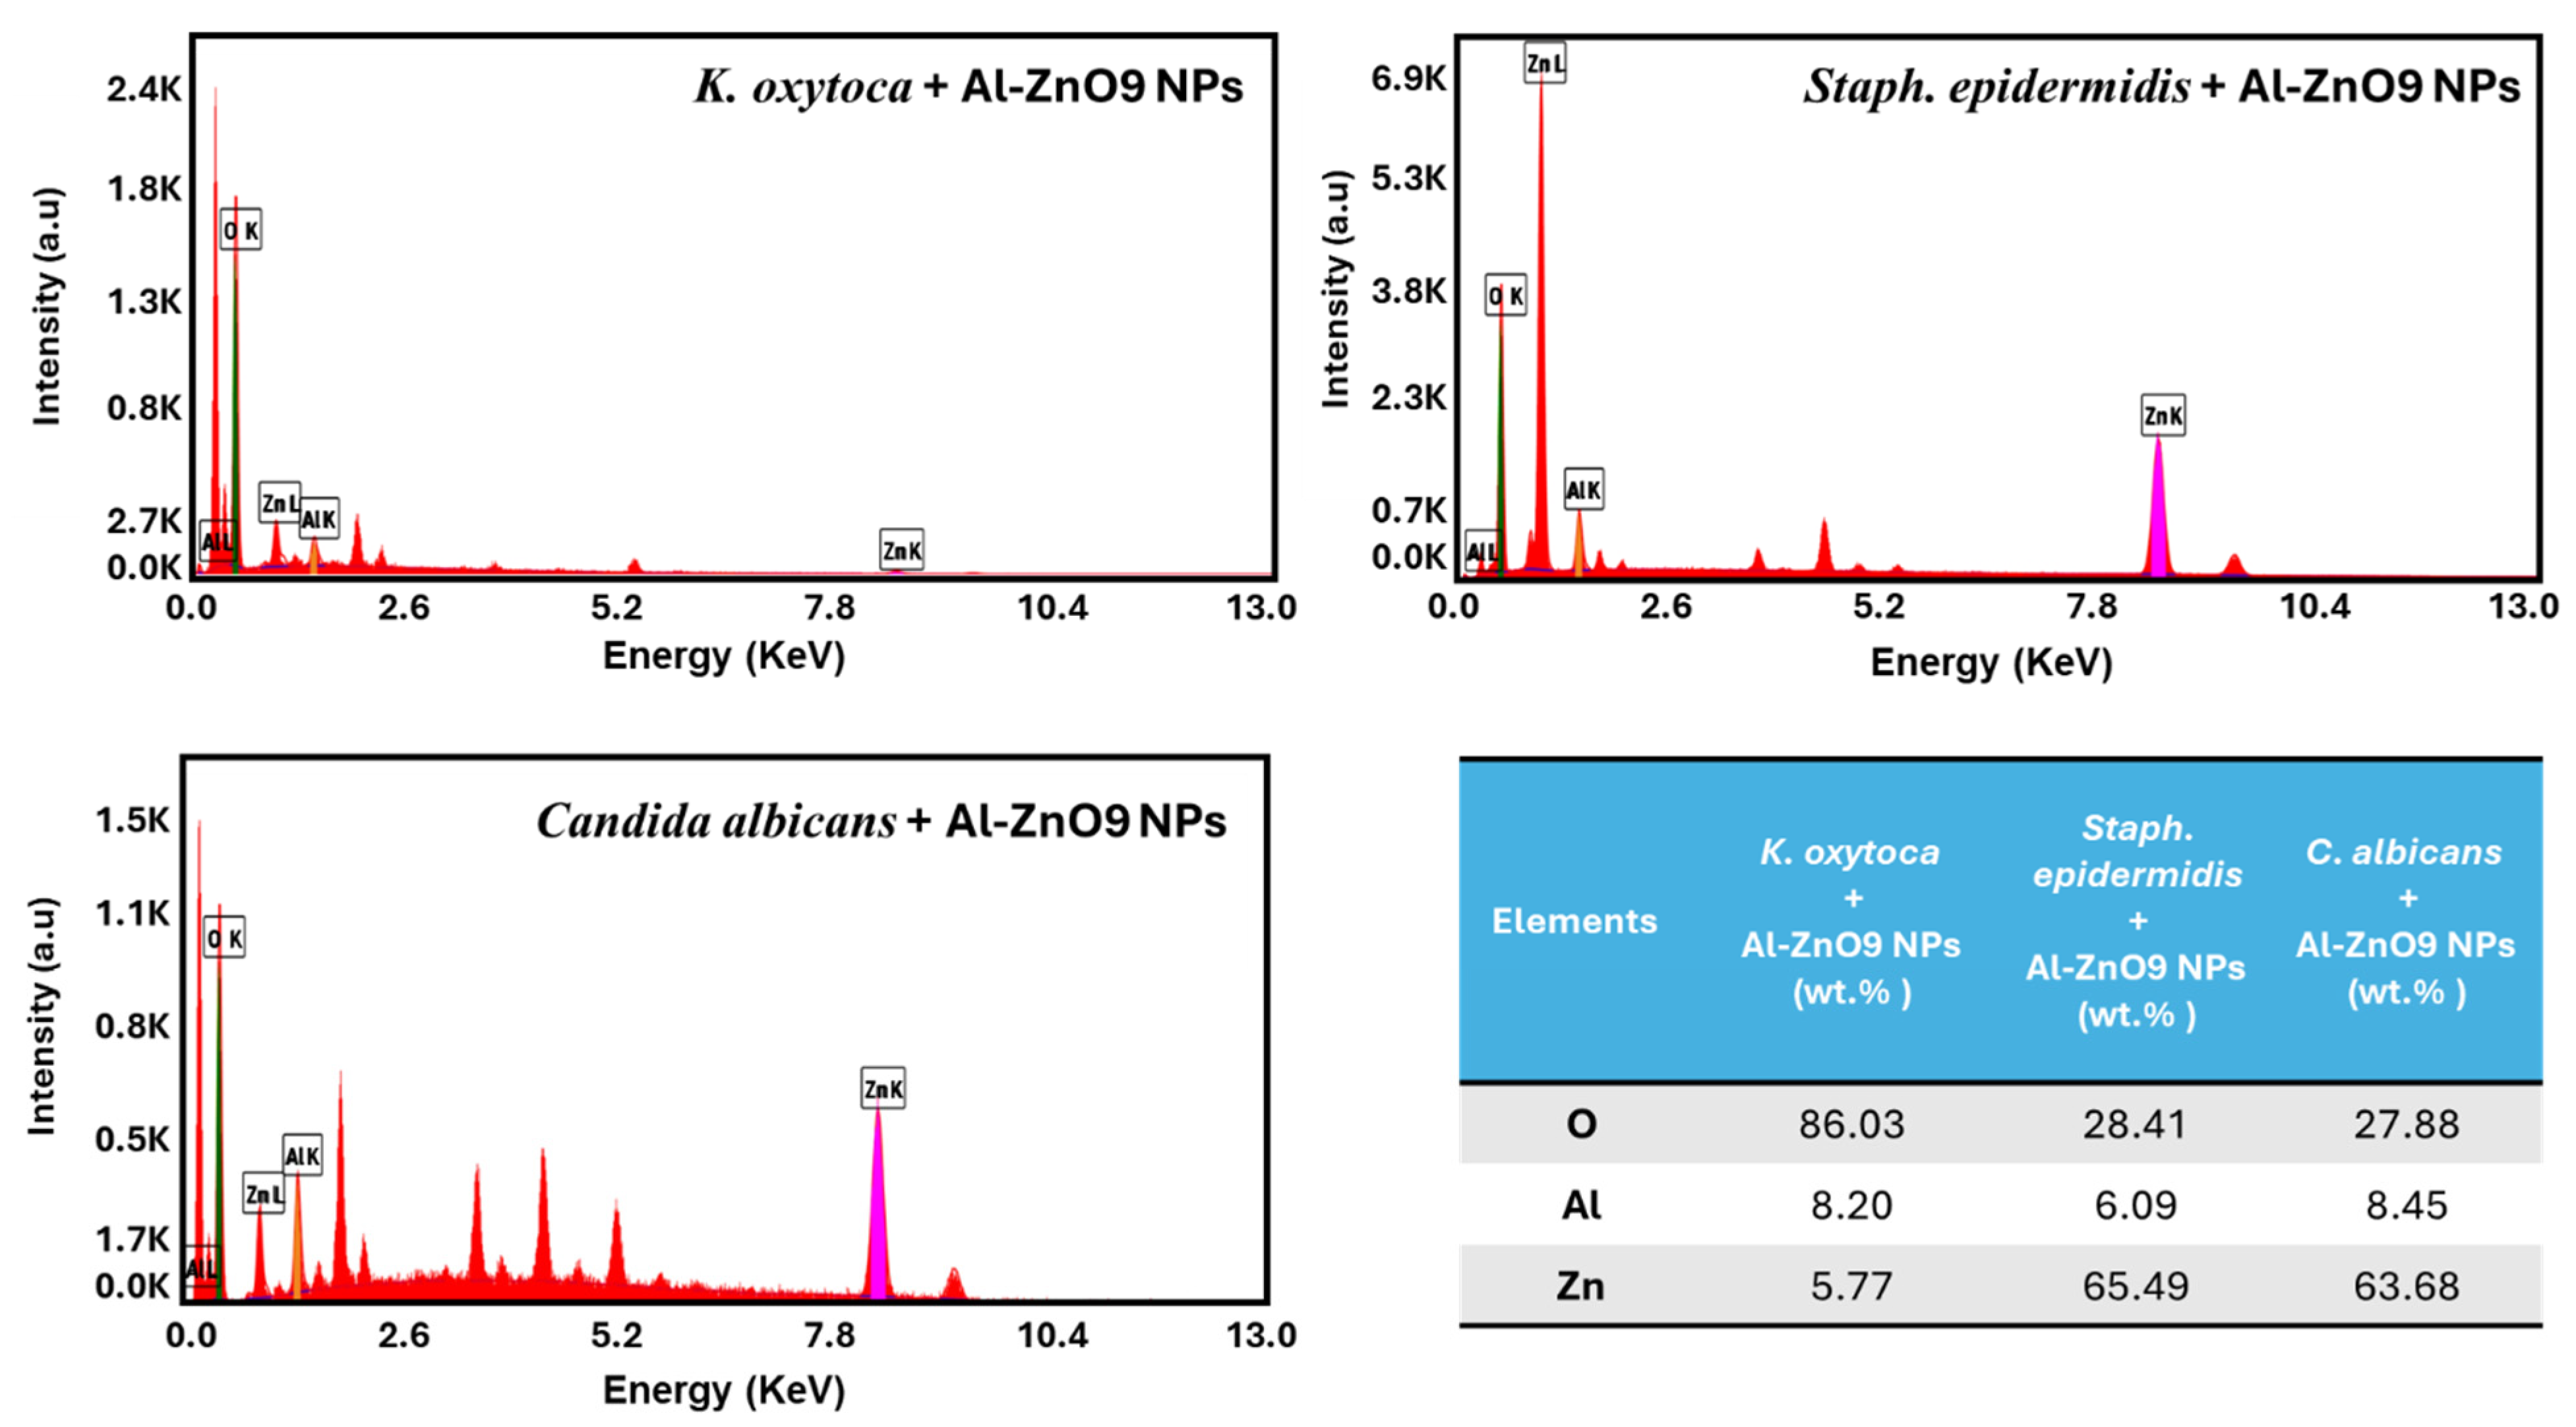
3.3.3. SEM and EDS Results

To further investigate the antimicrobial mechanisms, SEM and EDS analyses were performed on selected Gram-positive bacteria (Staph. epidermidis), Gram-negative (K. oxytoca) bacteria, and fungi (C. albicans) for Al-ZnO9 NP samples under light exposure.
The EDS analysis of K. oxytoca revealed high levels of oxygen on the surface of the bacterial cells, indicative of ROS accumulation (Figure 20). This aligns with the ROS-mediated damage mechanism discussed earlier, where light exposure enhances ROS generation, leading to oxidative stress on bacterial membranes. SEM micrographs further demonstrated significant morphological changes in K. oxytoca cells, including malformation (red arrowheads, Figure 21a–c) and the induction of protective exopolysaccharides (EPSs, white arrowheads). The production of EPSs suggests a bacterial stress response, as cells attempt to shield themselves from ROS damage. However, the structural disruption observed indicates limited success, explaining the relatively minor enhancement of antimicrobial activity for K. oxytoca under light exposure, as shown in Table 10.
For Staph. epidermidis, the EDS analysis confirmed a high accumulation of Zn on the bacterial surface, correlating with the enhanced inhibition zones observed in the light conditions. The SEM images (green arrowheads) revealed swollen and less intact bacterial cells, indicating severe structural damage likely caused by the Zn-mediated disruption of cellular membranes and ROS activity (Figure 21d–f). The dual effect of Zn accumulation and ROS generation highlights the efficacy of Al-ZnO9 under photocatalytic activation, especially against Gram-positive bacteria, which were shown to be more susceptible in previous discussions.
In the case of C. albicans, EDS analysis showed a significant accumulation of both ROS and Zn on the cell surfaces. The SEM micrographs (orange arrowheads) depicted morphological transformations from rod-shaped to spherical cells, with some cells exhibiting invaginations (blue arrowheads) (Figure 21g–i). These structural alterations align with the hypothesis that Zn plays a critical role in destabilizing fungal cell walls, which are composed of chitin and glucans, making them vulnerable to ROS-mediated oxidative stress. This behavior supports the results from inhibition tests where C. albicans demonstrated high susceptibility under light conditions.
The antimicrobial potential of Al-ZnO NPs in this study can be attributed to the interplay of three primary mechanisms: ROS generation [89], electrostatic interactions with bacterial cell membranes [90], and the release of free metal ions [91]. These mechanisms, illustrated in Figure 22, act synergistically to disrupt bacterial cells, and their cumulative effects explain the enhanced antimicrobial activity observed, particularly under light exposure. The results strongly align with the literature, which highlights these mechanisms as universal modes of action for metal oxide nanoparticles [92].
Under light exposure, Al-ZnO NPs generate ROS such as singlet oxygen, superoxide radicals, hydrogen peroxide, and hydroxyl radicals, which induce oxidative stress by damaging bacterial membranes, denaturing proteins, and disrupting DNA integrity [93]. This ROS-mediated damage, particularly effective against Gram-positive bacteria such as Staph. epidermidis, is enhanced by the nanoparticles’ electronic excitation and high conductivity, which destabilize the bacterial membrane charges. Simultaneously, the release of Zn2+ and Al3+ ions disrupts metabolic processes by oxidizing thiol groups in enzymes and damaging the cytoplasmic membrane, as confirmed by EDS analysis showing significant Zn and Al accumulation on bacterial surfaces. The superior performance of Al-ZnO in solid media highlights the role of localized interactions and optimized ion dissolution, aligning with prior studies emphasizing the importance of medium conditions. These findings, combined with the scalability of the synthesis method and enhanced efficacy under light, position Al-ZnO NPs as promising photo-responsive antimicrobial agents for addressing challenges such as antibiotic resistance and biofilm-associated infections. Their potential applications include medical device coatings, sterilization technologies, and other clinical settings where effective antimicrobial solutions are urgently needed [94].

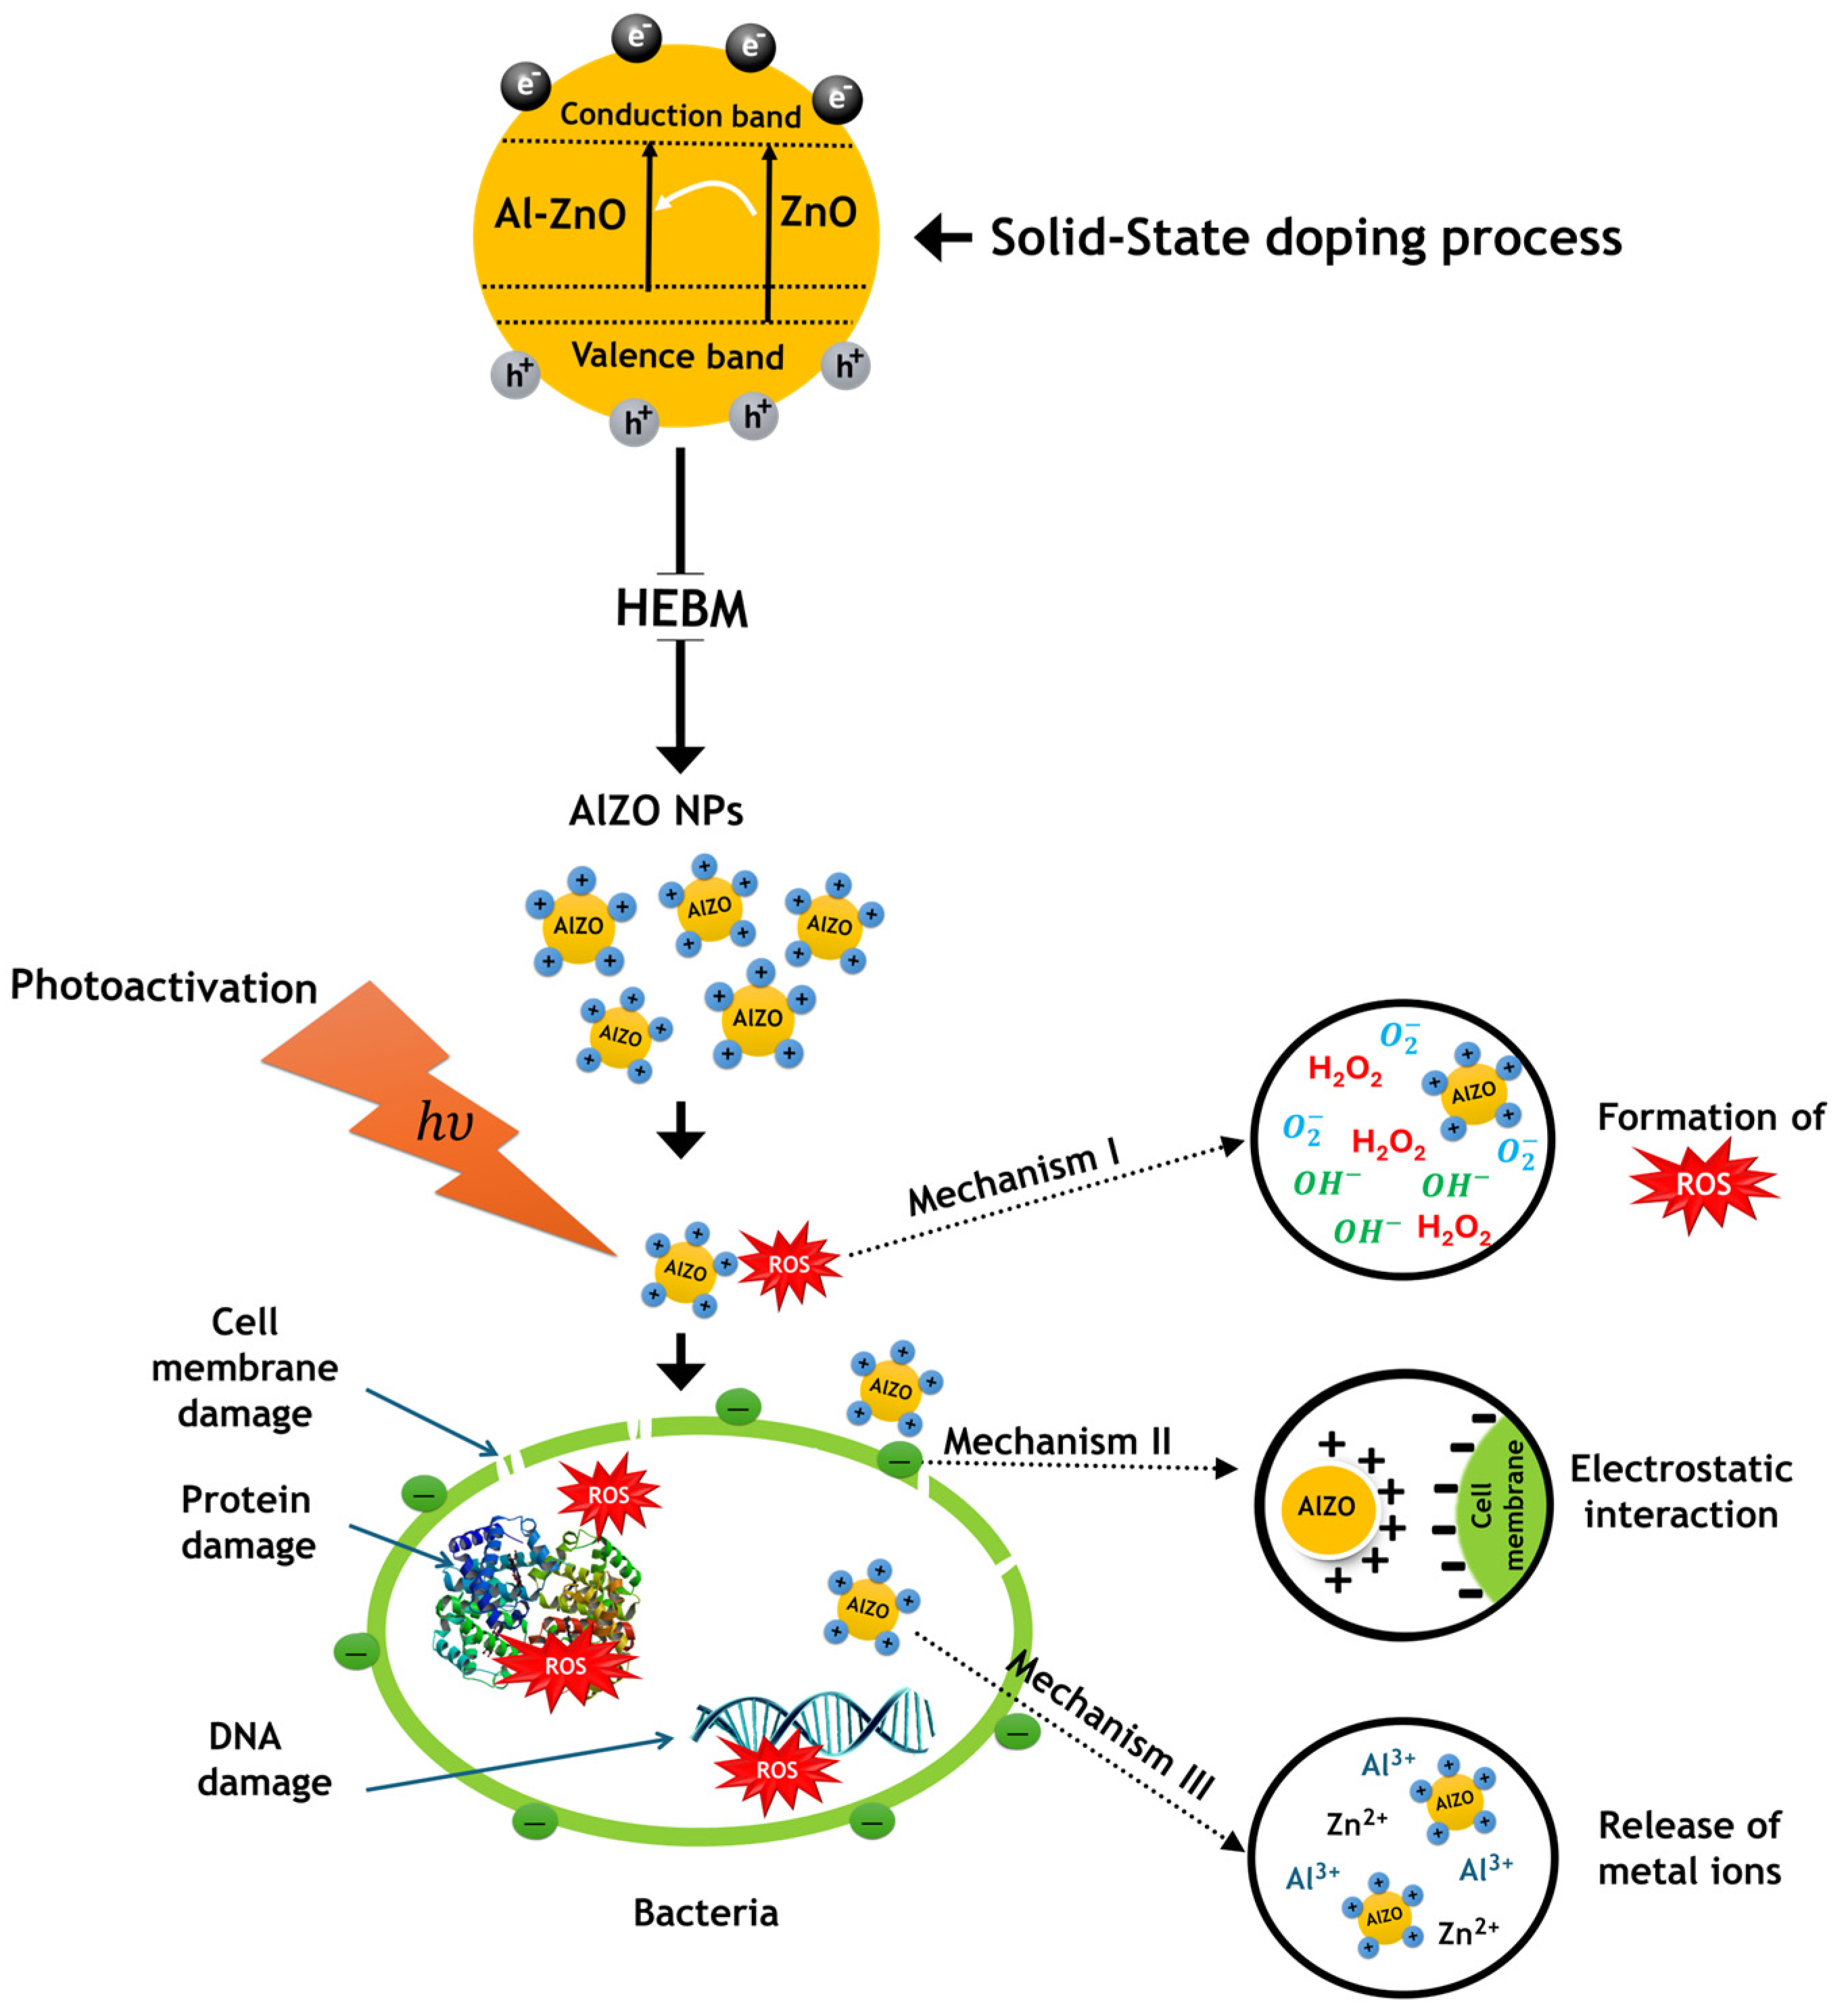
3.4. Elucidating the Relationship Between Physical Properties and Antimicrobial Efficacy via ROS Generation

The enhanced antibacterial performance of Al-ZnO NPs against Gram-positive bacteria, particularly under light exposure and in the solid phase, arose from synergistic interactions between their structural, optical, and dielectric properties. Electrochemical impedance spectroscopy revealed a progressive reduction in impedance with increasing Al doping (Table 6), attributed to the elevated carrier concentration resulting from Al3+ substitution at Zn2+ sites. This substitution introduced oxygen vacancies (Table 2), which acted as electron donors, enhancing charge transport and facilitating electron–hole pair separation under light irradiation. The reduced impedance (e.g., R2 decreased from 4.58 × 10⁶ Ω for Al-ZnO3 to 3.9 × 10⁵ Ω for Al-ZnO9) correlated with improved conductivity, enabling efficient electron transfer to the adsorbed oxygen molecules on the nanoparticle surface. This process generated ROS, including superoxide radicals (O2−) and hydroxyl radicals (OH), which disrupted bacterial membranes and intracellular components.
The narrowing of the band gap from 3.269 eV (pure ZnO) to 3.054 eV (Al-ZnO9) (Figure 11b) further amplified ROS production under visible light. A smaller band gap lowered the energy threshold for electron excitation, allowing visible light (400–700 nm) to activate photocatalytic reactions. The increased oxygen vacancy concentration (up to 7.0% for Al-ZnO9, Table 2) created mid-gap states that trapped electrons, prolonging hole lifetimes and enhancing ROS generation. These vacancies also served as adsorption sites for H2O and O2, critical precursors for ROS formation.
The medium state (solid vs. liquid) significantly influenced ROS efficacy. In solid media, localized nanoparticle concentration ensured sustained ROS generation at the microbial interface, directly damaging the thick peptidoglycan layer of Gram-positive bacteria (Staph. aureus, Staph. epidermidis). Their negatively charged teichoic acids further promoted electrostatic interactions with positively charged Al-ZnO surfaces, enhancing particle adhesion and ROS delivery. Conversely, in liquid media, nanoparticle dispersion reduced localized ROS concentration, while aggregation or sedimentation limited microbial contact, explaining the smaller inhibition zones observed.
Light exposure amplified these effects by activating ZnO’s photocatalytic behavior. For instance, Al-ZnO9 exhibited a 4 mm increase in inhibition zones for Staph. epidermidis under light (Table 10), as ROS production surged due to the band gap narrowing and vacancy-mediated charge separation. EDS analysis confirmed Zn accumulation on bacterial surfaces (Figure 20), while SEM revealed membrane distortion and EPS production (Figure 21), consistent with ROS-induced oxidative stress.
In summary, the interplay of Al doping (reducing the band gap, increasing carriers/vacancies), medium state (localizing ROS in solids), and light activation (enhancing photocatalysis) synergistically elevated ROS generation, driving the superior antibacterial efficacy of Al-ZnO NPs against Gram-positive pathogens.

4. Conclusions

In this study, Al-doped zinc oxide nanoparticles (Al-ZnO NPs) were successfully synthesized using the SSR method combined with HEBM and thoroughly characterized using XRD, SEM, EDS, TEM, FT-IR, and UV-Vis DRS techniques. The XRD analysis confirmed the predominant presence of ZnO phases, along with minor AlZn2O4 phases, with Rietveld refinement providing quantitative phase analysis. The incorporation of aluminum ions into the ZnO lattice significantly enhanced the semiconductor properties, as demonstrated by reduced impedance in dielectric and impedance spectroscopy studies.
Antimicrobial investigations revealed that the physical state of Al-ZnO NPs plays a critical role in their efficacy. The solid-state form exhibited superior antibacterial activity, particularly against Gram-positive bacteria such as Staph. aureus and Staph. epidermidis, compared to the liquid state. Light exposure further enhanced this activity, attributed to the photocatalytic generation of ROS, which effectively damage bacterial membranes and intracellular components. The reduction in particle size achieved through HEBM also contributed to improved antimicrobial performance, as smaller particles provided an increased surface area and enhanced interaction with ROS.
These findings underscore the importance of light activation, medium state, and particle size in optimizing the antibacterial performance of Al-ZnO NPs. Additionally, the rapid and scalable synthesis approach highlights the potential of Al-ZnO NPs for applications in antimicrobial coatings, medical devices, wound care, and sterilization technologies. The results not only advance our understanding of the structural, physical, and functional properties of Al-ZnO NPs, but also pave the way for their utilization in addressing challenges such as antibiotic resistance and biofilm-associated infections.

Author Contributions

This study was conducted by all listed authors. All authors have read and agreed to the published version of the manuscript.

Funding

This research received no external funding.

Informed Consent Statement

Not applicable.

Data Availability Statement

The data that support the findings of this study are available from the corresponding author upon reasonable request.

Acknowledgments

The authors gratefully acknowledge the use of the services and facilities at the Basic and Applied Scientific Research Center (BASRC) at Imam Abdulrahman bin Faisal University (IAU). The authors would like to thank Ahmed Alsayyah, Reem AlJindan, and Nouf Alromaihi at King Fahd Hospital, Al Khobar, Kingdom of Saudi Arabia, for providing us with the microorganisms for testing.

Conflicts of Interest

The authors declare no competing interests.

References

  1. Llor, C.; Bjerrum, L. Antimicrobial resistance: Risk associated with antibiotic overuse and initiatives to reduce the problem. Ther. Adv. Drug Saf. 2014, 5, 229. [Google Scholar] [CrossRef] [PubMed]
  2. Hawkey, P.M. The origins and molecular basis of antibiotic resistance. BMJ Br. Med. J. 1998, 317, 657. [Google Scholar] [CrossRef]
  3. Malaikozhundan, B.; Mohandoss, S.; Krishnamoorthi, R.; Bharathi, P.V.; Palanisamy, S.; Vinodhini, J. Enhanced bactericidal, antibiofilm and antioxidative response of Lawsonia inermis leaf extract synthesized ZnO NPs loaded with commercial antibiotic. Bioprocess. Biosyst. Eng. 2024, 47, 1241–1257. [Google Scholar] [CrossRef] [PubMed]
  4. Prioritization of Pathogens to Guide Discovery, Research and Development of New Antibiotics for Drug-Resistant Bacterial Infections, Including Tuberculosis, (n.d.). Available online: https://www.who.int/publications/i/item/WHO-EMP-IAU-2017.12 (accessed on 1 August 2023).
  5. Franco-Paredes, C. Bloodstream Infections. In Core Concepts in Clinical Infectious Diseases (CCCID); Elsevier: Amsterdam, The Netherlands, 2016; pp. 9–15. [Google Scholar] [CrossRef]
  6. Sharmin, S.; Rahaman, M.M.; Sarkar, C.; Atolani, O.; Islam, M.T.; Adeyemi, O.S. Nanoparticles as antimicrobial and antiviral agents: A literature-based perspective study. Heliyon 2021, 7, e06456. [Google Scholar] [CrossRef] [PubMed]
  7. Jacob, J.M.; Lens, P.N.L.; Balakrishnan, R.M. Microbial synthesis of chalcogenide semiconductor nanoparticles: A review. Microb. Biotechnol. 2016, 9, 11–21. [Google Scholar] [CrossRef]
  8. Manasreh, O. Introduction to Nanomaterials and Devices; John Wiley & Sons: Hoboken, NJ, USA, 2012; p. 466. Available online: https://books.google.com/books/about/Introduction_to_Nanomaterials_and_Device.html?id=v5srD63HPMMC (accessed on 3 February 2024).
  9. Mhetre, H.V.; Kanse, Y.K.; Patil, S.S. Nanomaterials: Applications in Electronics. Int. J. Adv. Eng. Nano Technol. 2021, 4, 7–19. [Google Scholar] [CrossRef]
  10. Nguyen, L.; Kho, R.; Bae, W.; Mehra, K. Glutathione as a matrix for the synthesis of CdS nanocrystallites. Chemosphere 1999, 38, 155–173. [Google Scholar] [CrossRef]
  11. Bawendi, M.G.; Steigerwald, M.L.; Brus, L.E. The Quantum Mechanics of Larger Semiconductor Clusters (“Quantum Dots”), Annu. Rev. Phys. Chem. 1990, 41, 477–496. [Google Scholar] [CrossRef]
  12. Sahoo, R.K.; Rani, S.; Kumar, V.; Gupta, U. Zinc oxide nanoparticles for bioimaging and drug delivery. Nanostructured Zinc Oxide: Synthesis. Prop. Appl. 2021, 483–509. [Google Scholar] [CrossRef]
  13. Gudkov, S.V.; Burmistrov, D.E.; Serov, D.A.; Rebezov, M.B.; Semenova, A.A.; Lisitsyn, A.B. A Mini Review of Antibacterial Properties of ZnO Nanoparticles. Front. Phys. 2021, 9, 641481. [Google Scholar] [CrossRef]
  14. De La Rosa, E.; Yacaman, M.; Sun, L.; Downer, M.C.; Torres, L.A.D.; Salas, P. Second-harmonic imaging of ZnO nanoparticles. In Proceedings of the Conference on Lasers and Electro-Optics, Baltimore, MD, USA, 6–11 May 2007; Available online: https://opg.optica.org/abstract.cfm?uri=CLEO-2007-CTuA2 (accessed on 17 April 2025).
  15. Yoffe, A.D. Low-dimensional systems: Quantum size effects and electronic properties of semiconductor microcrystallites (zero-dimensional systems) and some quasi-two-dimensional systems. Adv. Phys. 2010, 51, 799–890. [Google Scholar] [CrossRef]
  16. Habashi, F. A short history of hydrometallurgy. Hydrometallurgy 2005, 79, 15–22. [Google Scholar] [CrossRef]
  17. Sirelkhatim, A.; Mahmud, S.; Seeni, A.; Kaus, N.H.M.; Ann, L.C.; Bakhori, S.K.M.; Hasan, H.; Mohamad, D. Review on Zinc Oxide Nanoparticles: Antibacterial Activity and Toxicity Mechanism. Nanomicro. Lett. 2015, 7, 219. [Google Scholar] [CrossRef] [PubMed]
  18. Putri, N.A.; Dwiputra, M.A.; Winata, S.M.; Isnaeni; Ginting, R.T.; Nugroho, F.A.A.; Fauzia, V. MoSe 2 Quantum Dots Enhance the Performance of ZnO Nanostructure-Based UV Photodetectors. ACS Appl. Nano Mater. 2024, 7, 3835–3842. [Google Scholar] [CrossRef]
  19. Qi, K.; Cheng, B.; Yu, J.; Ho, W. Review on the improvement of the photocatalytic and antibacterial activities of ZnO. J. Alloys Compd. 2017, 727, 792–820. [Google Scholar] [CrossRef]
  20. Murray, C.B.; Norris, D.J.; Bawendi, M.G. Synthesis and Characterization of Nearly Monodisperse CdE (E = S, Se, Te) Semiconductor Nanocrystallites. J. Am. Chem. Soc. 1993, 115, 8706–8715. [Google Scholar] [CrossRef]
  21. Jaballah, S.; Alaskar, Y.; Alshunaifi, I.; Ghiloufi, I.; Neri, G.; Bouzidi, C.; Dahman, H.; El Mir, L. Effect of Al and Mg Doping on Reducing Gases Detection of ZnO Nanoparticles. Chemosensors 2021, 9, 300. [Google Scholar] [CrossRef]
  22. Tsai, Y.T.; Chang, S.J.; Ji, L.W.; Hsiao, Y.J.; Tang, I.T. Fast Detection and Flexible Microfluidic pH Sensors Based on Al-Doped ZnO Nanosheets with a Novel Morphology. ACS Omega 2019, 4, 19847. [Google Scholar] [CrossRef]
  23. Yoon, D.H.; Choi, G.M. Microstructure and CO gas sensing properties of porous ZnO produced by starch addition. Sens. Actuators. B Chem. 1997, 45, 251–257. [Google Scholar] [CrossRef]
  24. Liu, W.; Zhi, H.; Yu, X. Recent progress in phosphorus based anode materials for lithium/sodium ion batteries. Energy Storage Mater. 2019, 16, 290–322. [Google Scholar] [CrossRef]
  25. Li, L.; Xu, C.; Chen, C.; Wang, Y.; Jiao, L.; Yuan, H. Sodium alanate system for efficient hydrogen storage. Int. J. Hydrogen Energy 2013, 38, 8798–8812. [Google Scholar] [CrossRef]
  26. Massoudi, I.; Hamdi, R.; Ababutain, I.; Alhussain, E.; Kharma, A. HSBM-Produced Zinc Oxide Nanoparticles: Physical Properties and Evaluation of Their Antimicrobial Activity against Human Pathogens. Scientifica 2022, 2022, 9989282. [Google Scholar] [CrossRef] [PubMed]
  27. Salah, N.; Habib, S.S.; Khan, Z.H.; Memic, A.; Azam, A.; Alarfaj, E.; Zahed, N.; Al-Hamedi, S. High-energy ball milling technique for ZnO nanoparticles as antibacterial material. Int. J. Nanomed. 2011, 6, 863–869. [Google Scholar] [CrossRef]
  28. Dudina, D.V.; Bokhonov, B.B. Materials Development Using High-Energy Ball Milling: A Review Dedicated to the Memory of M.A. Korchagin. J. Compos. Sci. 2022, 6, 188. [Google Scholar] [CrossRef]
  29. Rane, A.V.; Kanny, K.; Abitha, V.K.; Thomas, S. Methods for Synthesis of Nanoparticles and Fabrication of Nanocomposites. In Synthesis of Inorganic Nanomaterials: Advances and Key Technologies; Elsevier: Amsterdam, The Netherlands, 2018; pp. 121–139. [Google Scholar] [CrossRef]
  30. Anandh, B.A.; Sakthivel, R.; Ganesh, A.S.; Subramani, S.; Rajamanickam, A.T. Impact of aluminium on ZnO thin films for antimicrobial activity. Asian J. Chem. 2021, 33, 2393–2399. [Google Scholar] [CrossRef]
  31. Ali, D.; Butt, M.Z.; Muneer, I.; Bashir, F.; Hanif, M.; Khan, T.M.; Abbasi, S.A. Synthesis, characterization and antibacterial performance of transparent c-axis oriented Al doped ZnO thin films. Surf. Interfaces 2021, 27, 101452. [Google Scholar] [CrossRef]
  32. Vijayaraj, C.; Nedunchezhian, G.; Sozhaveni, S. Antibacterial Activity, Structural, Optical And Morphological Properties Of Al Doped Zno Nanoparticles Synthesized By Sol-Gel Method. Int. J. Sci. Technol. Res. 2020, 9, 2. Available online: www.ijstr.org (accessed on 17 April 2025).
  33. Khashan, K.S.; Sulaiman, G.M.; Hussain, S.A.; Marzoog, T.R.; Jabir, M.S. Synthesis, Characterization and Evaluation of Anti-bacterial, Anti-parasitic and Anti-cancer Activities of Aluminum-Doped Zinc Oxide Nanoparticles. J. Inorg. Organomet. Polym. Mater. 2020, 30, 3677–3693. [Google Scholar] [CrossRef]
  34. Chidhambaram, N. Augmented antibacterial efficacies of the aluminium doped ZnO nanoparticles against four pathogenic bacteria. Mater. Res. Express 2019, 6, 075061. [Google Scholar] [CrossRef]
  35. Saxena, V.; Pandey, L.M. Synthesis, characterization and antibacterial activity of aluminum doped zinc oxide. Mater. Today Proc. 2019, 18, 1388–1400. [Google Scholar] [CrossRef]
  36. Brintha, S.R.; Ajitha, M. Synthesis, Structural and Antibacterial Activity of Aluminium and Nickel Doped ZnO Nanoparticles by Sol-gel Method. Asian J. Chem. Sci. 2016, 1, 1–9. [Google Scholar] [CrossRef]
  37. Wirunchit, S.; Gansa, P.; Koetniyom, W. Synthesis of ZnO nanoparticles by Ball-milling process for biological applications. Mater. Today Proc. 2021, 47, 3554–3559. [Google Scholar] [CrossRef]
  38. Hossain, T.J. Methods for screening and evaluation of antimicrobial activity: A review of protocols, advantages, and limitations. Eur. J. Microbiol. Immunol. 2024, 14, 97. [Google Scholar] [CrossRef]
  39. Li, N.; Yadav, S.K.; Wang, J.; Liu, X.Y.; Misra, A. Growth and Stress-induced Transformation of Zinc blende AlN Layers in Al-AlN-TiN Multilayers. Sci. Rep. 2015, 5, 18554. [Google Scholar] [CrossRef]
  40. Rodriguez-Carvajal, J. Fullprof A Program for Rietveld Refinement and Pattern Matching Analysis. In Proceedings of the Abstract of the Satellite Meeting on Powder Diffraction of the XV Congress of the IUCr, Toulouse, France, 16–19 July 1990; p. 127. Available online: https://www.scirp.org/reference/ReferencesPapers?ReferenceID=868636 (accessed on 10 April 2025).
  41. Jantrasee, S.; Moontragoon, P.; Pinitsoontorn, S. Thermoelectric properties of Al-doped ZnO: Experiment and simulation. J. Semicond. 2016, 37, 092002. [Google Scholar] [CrossRef]
  42. Gherab, K.; Al-Douri, Y.; Voon, C.H.; Hashim, U.; Ameri, M.; Bouhemadou, A. Aluminium nanoparticles size effect on the optical and structural properties of ZnO nanostructures synthesized by spin-coating technique. Results Phys. 2017, 7, 1190–1197. [Google Scholar] [CrossRef]
  43. Dwibedi, D.; Murugesan, C.; Leskes, M.; Barpanda, P. Role of annealing temperature on cation ordering in hydrothermally prepared zinc aluminate (ZnAl2O4) spinel. Mater. Res. Bull. 2018, 98, 219–224. [Google Scholar] [CrossRef]
  44. Ghrib, T.; Ali, A.B.; Ercan, F.; Mhareb, M.H.A.; Al-muteliq, S.Y.; Ercan, I.; Kaygili, O.; Hamad, M.K.; Sfina, N.; Mhiri, M.; et al. Structural, optical, photoluminescence and radiation-shielding investigation of magnesium doped barium zirconate (BaZrO3) ceramics. Radiat. Phys. Chem. 2024, 223, 111976. [Google Scholar] [CrossRef]
  45. Noei, H.; Qiu, H.; Wang, Y.; Löffler, E.; Wöll, C.; Muhler, M. The identification of hydroxyl groups on ZnO nanoparticles by infrared spectroscopy. Phys. Chem. Chem. Phys. 2008, 10, 7092–7097. [Google Scholar] [CrossRef]
  46. Ahammed, N.; Hassan, M.D.S.; Hassan, M. Effects of aluminum (Al) incorporation on structural, optical and thermal properties of ZnO nanoparticles. Mater. Sci.-Pol. 2018, 36, 419–426. [Google Scholar] [CrossRef]
  47. Ajala, F.; Hamrouni, A.; Houas, A.; Lachheb, H.; Megna, B.; Palmisano, L.; Parrino, F. The influence of Al doping on the photocatalytic activity of nanostructured ZnO: The role of adsorbed water. Appl. Surf. Sci. 2018, 445, 376–382. [Google Scholar] [CrossRef]
  48. Baradaran, M.; Ghodsi, F.E. Highly efficient visible photocatalytic degradation of MB organic dye by heteromorphic ZnO/AZO/ZnO nanocatalysts: Effect of AZO thickness. J. Solgel. Sci. Technol. 2019, 92, 25–39. [Google Scholar] [CrossRef]
  49. Chen, K.J.; Fang, T.H.; Hung, F.Y.; Ji, L.W.; Chang, S.J.; Young, S.J.; Hsiao, Y.J. The crystallization and physical properties of Al-doped ZnO nanoparticles. Appl. Surf. Sci. 2008, 254, 5791–5795. [Google Scholar] [CrossRef]
  50. Himabindu, B.; Devi, N.S.M.P.L.; Nagaraju, P.; Kanth, B.R. A nanostructured Al-doped ZnO as an ultra-sensitive room-temperature ammonia gas sensor. J. Mater. Sci. Mater. Electron. 2023, 34, 1014. [Google Scholar] [CrossRef]
  51. Srinatha, N.; Kumar, K.J.R.; Kumar, M.R.S.; Pattar, K.V.; Madhu, A.; Angadi, B. Combustion synthesis of Al-doped ZnO nanoparticles using a new fuel and the study of its structural, micro-structural and optical properties. Appl. Nanosci. 2021, 11, 1197–1209. [Google Scholar] [CrossRef]
  52. Mouzaia, F.; Djouadi, D.; Chelouche, A.; Hammiche, L.; Touam, T. Structural and optical investigations of pure and Al-doped ZnO nano-aerogels: Effects of supercritical organic solvent. Appl. Phys. A Mater. Sci. Process 2019, 125, 637. [Google Scholar] [CrossRef]
  53. Sankar Ganesh, R.; Navaneethan, M.; Mani, G.K.; Ponnusamy, S.; Tsuchiya, K.; Muthamizhchelvan, C.; Kawasaki, S.; Hayakawa, Y. Influence of Al doping on the structural, morphological, optical, and gas sensing properties of ZnO nanorods. J. Alloys Compd. 2017, 698, 555–564. [Google Scholar] [CrossRef]
  54. Vadivel, M.; Babu, R.R.; Ramamurthi, K. Studies on the Structural, Optical and Magnetic Properties of Al doped ZnO Nanoparticles. Int. J. Chem. Tech. Res. 2014, 7, 1206–1211. [Google Scholar]
  55. Vanaja, A.; Ramaraju, G.V.; Rao, K.S. Structural and optical investigation of Al doped ZnO nanoparticles synthesized by Sol-gel process. Indian J. Sci. Technol. 2016, 9, 1–6. [Google Scholar] [CrossRef]
  56. Kim, K.H.; Umakoshi, T.; Abe, Y.; Kawamura, M.; Kiba, T. Morphological properties of Al-doped ZnO nano/microstructures. Superlattices Microstruct. 2016, 91, 188–192. [Google Scholar] [CrossRef]
  57. Mallika, A.N.; Ramachandrareddy, A.; Sowribabu, K.; Reddy, K.V. Synthesis and optical characterization of aluminum doped ZnO nanoparticles. Ceram. Int. 2014, 40, 12171–12177. [Google Scholar] [CrossRef]
  58. Khan, M.A.M.; Kumar, S.; Khan, M.N.; Ahamed, M.; Al Dwayyan, A.S. Microstructure and blueshift in optical band gap of nanocrystalline Al xZn1-xO thin films. J. Lumin. 2014, 155, 275–281. [Google Scholar] [CrossRef]
  59. Akhtar, M.J.; Alhadlaq, H.A.; Alshamsan, A.; Khan, M.A.M.; Ahamed, M. Aluminum doping tunes band gap energy level as well as oxidative stress-mediated cytotoxicity of ZnO nanoparticles in MCF-7 cells. Sci. Rep. 2015, 5, 13876. [Google Scholar] [CrossRef] [PubMed]
  60. Ambedkar, A.K.; Singh, M.; Kumar, V.; Kumar, V.; Singh, B.P.; Kumar, A.; Gautam, Y.K. Structural, optical and thermoelectric properties of Al-doped ZnO thin films prepared by spray pyrolysis. Surf. Interfaces 2020, 19, 100504. [Google Scholar] [CrossRef]
  61. Manohar, A.; Krishnamoorthi, C.; Naidu, K.C.B.; Narasaiah, B.P. Dielectric, Magnetic Hyperthermia and Photocatalytic Properties of Mg.Zn.FeO Nanocrystals. IEEE Trans. Magn. 2020, 56, 1–7. [Google Scholar] [CrossRef]
  62. Jebli, M.; Rayssi, C.; Dhahri, J.; Khirouni, K. Investigation of electrical properties and conduction mechanism using CBH model of Ba0.97La0.02Ti1−xNb4x/5O3 (x = 0.00 and 0.02) compounds. ApPhA 2020, 126, 109. [Google Scholar] [CrossRef]
  63. Chtourou, R.; Louati, B.; Guidara, K. Structural and ac conductivity studies of sodium tetralead triphosphate compound. J. Alloys Compd. 2018, 732, 286–292. [Google Scholar] [CrossRef]
  64. Nasser, R.; Othmen, W.B.H.; Elhouichet, H. Effect of Sb doping on the electrical and dielectric properties of ZnO nanocrystals. Ceram. Int. 2019, 45, 8000–8007. [Google Scholar] [CrossRef]
  65. Larbi, T.; Ouni, B.; Boukachem, A.; Boubaker, K.; Amlouk, M. Electrical measurements of dielectric properties of molybdenum-doped zinc oxide thin films. Mater. Sci. Semicond. Process 2014, 22, 50–58. [Google Scholar] [CrossRef]
  66. Rhimi, T.; Toumi, M.; Khirouni, K.; Guermazi, S. AC conductivity, electric modulus analysis of KLi(H2PO4)2 compound. J. Alloys Compd. 2017, 714, 546–552. [Google Scholar] [CrossRef]
  67. Salah, M.; Azizi, S.; Boukhachem, A.; Khaldi, C.; Amlouk, M.; Lamloumi, J.; Salah, M.; Azizi, S.; Boukhachem, A.; Khaldi, C.; et al. Rietveld refinement of X-ray diffraction, impedance spectroscopy and dielectric relaxation of Li-doped ZnO-sprayed thin films. ApPhA 2019, 125, 615. [Google Scholar] [CrossRef]
  68. Jebli, M.; Rayssi, C.; Hamdaoui, N.; Rabaoui, S.; Dhahri, J.; Henda, M.B.; Shaarany, I. Effect of Nb-doping on the structural and electrical properties of Ba0.97La0.02Ti1−xNb4x/5O3 ceramics at room temperature synthesized by molten-salt method. J. Alloys Compd. 2019, 784, 204–212. [Google Scholar] [CrossRef]
  69. Selvi, K.T.; Mangai, K.A.; Priya, M.; Sagadevan, S. Investigation of the dielectric and impedance properties of ZnO/MgO nanocomposite. Phys. B Condens. Matter 2020, 594, 412355. [Google Scholar] [CrossRef]
  70. Kaur, D.; Bharti, A.; Sharma, T.; Madhu, C. Dielectric Properties of ZnO-Based Nanocomposites and Their Potential Applications. Int. J. Opt. 2021, 2021, 9950202. [Google Scholar] [CrossRef]
  71. Mujahid, M. Synthesis, characterization and electrical properties of visible-light-driven Pt-ZnO/CNT. Bull. Mater. Sci. 2015, 38, 995–1001. [Google Scholar] [CrossRef]
  72. Kilinç, N.; Arda, L.; Öztürk, S.; Öztürk, Z.Z. Structure and electrical properties of Mg-doped ZnO nanoparticles. Cryst. Res. Technol. 2010, 45, 529–538. [Google Scholar] [CrossRef]
  73. Naik, C.C.; Salker, A.V. Tailoring magnetic and dielectric properties of Co0.9Cu0.1Fe2O4 with substitution of small fractions of Gd3+ ions. J. Mater. Sci. Mater. Electron. 2018, 29, 5380–5390. [Google Scholar] [CrossRef]
  74. Tabib, A.; Sdiri, N.; Elhouichet, H.; Férid, M. Investigations on electrical conductivity and dielectric properties of Na doped ZnO synthesized from sol gel method. J. Alloys Compd. C 2015, 622, 687–694. [Google Scholar] [CrossRef]
  75. Horne, J.E.; Brockwell, D.J.; Radford, S.E. Role of the lipid bilayer in outer membrane protein folding in Gram-negative bacteria. J. Biol. Chem. 2020, 295, 10340. [Google Scholar] [CrossRef]
  76. Lee, N.Y.; Ko, W.C.; Hsueh, P.R. Nanoparticles in the Treatment of Infections Caused by Multidrug-Resistant Organisms. Front. Pharmacol. 2019, 10, 1153. [Google Scholar] [CrossRef]
  77. Sarwar, A.; Katas, H.; Samsudin, S.N.; Zin, N.M. Regioselective sequential modification of chitosan via azide-alkyne click reaction: Synthesis, characterization, and antimicrobial activity of chitosan derivatives and nanoparticles. PLoS ONE 2015, 10, e0123084. [Google Scholar] [CrossRef]
  78. Garcia-Rubio, R.; de Oliveira, H.C.; Rivera, J.; Trevijano-Contador, N. The Fungal Cell Wall: Candida, Cryptococcus, and Aspergillus Species. Front. Microbiol. 2020, 10, 2993. [Google Scholar] [CrossRef] [PubMed]
  79. Singh, R.; Smitha, M.S.; Singh, S.P. The role of nanotechnology in combating multi-drug resistant bacteria. J. Nanosci. Nanotechnol. 2014, 14, 4745–4756. [Google Scholar] [CrossRef]
  80. Jan, T.; Azmat, S.; Rahman, A.U.; Ilyas, S.Z.; Mehmood, A. Experimental and DFT study of Al doped ZnO nanoparticles with enhanced antibacterial activity. Ceram. Int. 2022, 48, 20838–20847. [Google Scholar] [CrossRef]
  81. Zhang, X.; Hou, X.; Ma, L.; Shi, Y.; Zhang, D.; Qu, K. Analytical methods for assessing antimicrobial activity of nanomaterials in complex media: Advances, challenges, and perspectives. J. Nanobiotechnol. 2023, 21, 97. [Google Scholar] [CrossRef]
  82. Raffi, M.; Mehrwan, S.; Bhatti, T.M.; Akhter, J.I.; Hameed, A.; Yawar, W.; Hasan, M.M.U. Investigations into the antibacterial behavior of copper nanoparticles against Escherichia coli. Ann. Microbiol. 2010, 60, 75–80. [Google Scholar] [CrossRef]
  83. Qayyum, S.; Oves, M.; Khan, A.U. Obliteration of bacterial growth and biofilm through ROS generation by facilely synthesized green silver nanoparticles. PLoS ONE 2017, 12, e0181363. [Google Scholar] [CrossRef] [PubMed]
  84. Lahiri, D.; Nag, M.; Sheikh, H.I.; Sarkar, T.; Edinur, H.A.; Pati, S.; Ray, R.R. Microbiologically-Synthesized Nanoparticles and Their Role in Silencing the Biofilm Signaling Cascade. Front. Microbiol. 2021, 12, 636588. [Google Scholar] [CrossRef]
  85. Zeid, S.A.; Perez, A.; Bastide, S.; Le Pivert, M.; Rossano, S.; Remita, H.; Hautière, N.; Leprince-Wang, Y. Antibacterial and Photocatalytic Properties of ZnO Nanostructure Decorated Coatings. Coatings 2023, 14, 41. [Google Scholar] [CrossRef]
  86. Rigby, K.M.; DeLeo, F.R. Neutrophils in innate host defense against Staphylococcus aureus infections. Semin. Immunopathol. 2011, 34, 237–259. [Google Scholar] [CrossRef]
  87. Mandell, G.L. Catalase, superoxide dismutase, and virulence of Staphylococcus aureus. In vitro and in vivo studies with emphasis on staphylococcal--leukocyte interaction. J. Clin. Investig. 1975, 55, 561–566. [Google Scholar] [CrossRef]
  88. Lipovsky, A.; Tzitrinovich, Z.; Friedmann, H.; Applerot, G.; Gedanken, A.; Lubart, R. EPR study of visible light-induced ros generation by nanoparticles of ZnO. J. Phys. Chem. C 2009, 113, 15997–16001. [Google Scholar] [CrossRef]
  89. Yu, Z.; Li, Q.; Wang, J.; Yu, Y.; Wang, Y.; Zhou, Q.; Li, P. Reactive Oxygen Species-Related Nanoparticle Toxicity in the Biomedical Field. Nanoscale Res. Lett. 2020, 15, 115. [Google Scholar] [CrossRef] [PubMed]
  90. Leung, Y.H.; Ng, A.M.C.; Xu, X.; Shen, Z.; Gethings, L.A.; Wong, M.T.; Chan, C.M.N.; Guo, M.Y.; Ng, Y.H.; Djurišic, A.B.; et al. Mechanisms of antibacterial activity of MgO: Non-ROS mediated toxicity of MgO nanoparticles towards Escherichia coli. Small 2014, 10, 1171–1183. [Google Scholar] [CrossRef]
  91. Mendes, C.R.; Dilarri, G.; Forsan, C.F.; de Moraes Ruy Sapata, V.; Lopes, P.R.M.; de Moraes, P.B.; Montagnolli, R.N.; Ferreira, H.; Bidoia, E.D. Antibacterial action and target mechanisms of zinc oxide nanoparticles against bacterial pathogens. Sci. Rep. 2022, 12, 2658. [Google Scholar] [CrossRef]
  92. Wang, L.; Hu, C.; Shao, L. The antimicrobial activity of nanoparticles: Present situation and prospects for the future. Int. J. Nanomed. 2017, 12, 1227–1249. [Google Scholar] [CrossRef] [PubMed]
  93. Agarwal, H.; Menon, S.; Kumar, S.V.; Rajeshkumar, S. Mechanistic study on antibacterial action of zinc oxide nanoparticles synthesized using green route. Chem. Biol. Interact. 2018, 286, 60–70. [Google Scholar] [CrossRef]
  94. Jiang, L.; Loo, S.C.J. Intelligent Nanoparticle-Based Dressings for Bacterial Wound Infections. ACS Appl. Bio Mater. 2021, 4, 3849–3862. [Google Scholar] [CrossRef]
Figure 1. Patterns of powder X-ray diffraction of nanocrystalline Al-ZnO compared to pure ZnO. The secondary phase AlZn2O4 is marked by asterisks.
Crystals 15 00397 g001
Figure 2. Rietveld refinement of the XRD pattern of Al-ZnO9 sample.
Crystals 15 00397 g002
Figure 3. (a) Lattice parameters and (b) unit cell volume of samples as a function of aluminum loading. x refers to the % of aluminum loading in the AlZO samples.
Crystals 15 00397 g003
Figure 4. Williamson–Hall plot of pure ZnO and Al-ZnO nanocrystalline samples.
Crystals 15 00397 g004
Figure 5. SEM images and histograms of the particle size distribution for SEM morphological analysis of (a) Al-ZnO, (b) Al-ZnO5, (c) Al-ZnO7, and (d) Al-ZnO9 samples obtained before the final 4 h HEBM process.
Crystals 15 00397 g005
Figure 6. SEM morphological analysis of (a) Al-ZnO, (b) Al-ZnO5, (c) Al-ZnO7, and (d) Al-ZnO9 NPs obtained after performing the final 4 h HEBM process.
Crystals 15 00397 g006
Figure 7. (a) TEM micrographs of Al-ZnO7 NPs after milling for 4 h, (b) magnified TEM images with a scale of 50 nm, and (c) histogram of the particle size distribution for Al-ZnO7 NPs.
Crystals 15 00397 g007
Figure 8. Pattern of the selected area for EDS analysis of Al-doped ZnO nanocomposite samples.
Crystals 15 00397 g008
Figure 9. EDS mapping analysis of Al-ZnO nanocomposite samples.
Crystals 15 00397 g009
Figure 10. FT-IR spectra of the Al-ZnO samples in the 400–3800 cm−1 wavenumber range.
Crystals 15 00397 g010
Figure 11. (a) Diffuse reflectance curves of the Al-ZnO samples; (b) Kubelka–Munk (K–M) function of the Al-ZnO samples.
Crystals 15 00397 g011
Figure 12. Complex impedance spectra (Nyquist plot) of Al-ZnO samples. The inset presents the equivalent circuit for all samples.
Crystals 15 00397 g012
Figure 13. Comparison between the simulated and experimental values of the real part Z′ (a) and the imaginary part Z″ (b) of the Al-ZnO samples.
Crystals 15 00397 g013
Figure 14. Variation in the real part of the impedance Z’ with frequencies at various Al concentrations for the Al-ZnO samples (a) and variation in the imaginary part of the impedance Z″ with frequencies at various Al concentrations for the Al-ZnO samples (b).
Crystals 15 00397 g014
Figure 15. (a) Frequency dependence of the dielectric constant’s real part, (b) the imaginary part of the Al-ZnO samples at different aluminum concentrations, and (c) frequency dependence of the dielectric loss of the Al-ZnO samples at different aluminum concentrations.
Crystals 15 00397 g015
Figure 16. Schematic of the two-phase experimental process evaluating the antimicrobial activity of Al-ZnO samples under varying conditions.
Crystals 15 00397 g016
Figure 17. Statistical analysis of the antibacterial effect of different concentrations of ZnO doped with Al in the solid state against Gram-positive bacteria (Staph. aureus ATCC 29213 and Staph. epidermidis ATCC 12228). The asterisks (*) indicate statistically significant differences (p < 0.05).
Crystals 15 00397 g017
Figure 18. Statistical analysis of the antibacterial effect of different concentrations of ZnO doped with Al in the liquid state against Gram-positive bacteria (Staph. aureus ATCC 29213 and Staph. epidermidis ATCC 12228). The asterisks (*) indicate statistically significant differences (p < 0.05).
Crystals 15 00397 g018
Figure 19. Statistical analysis of the effect of light exposure on the inhibition zones for Staph. aureus ATCC 29213 and Staph. epidermidis ATCC 12228 using (a) Al-ZnO7 and (b) Al-ZnO9 nanoparticles (NPs) as antimicrobial agents in a solid medium, compared with antibiotic control. Panel (c) summarizes the inhibition zones for both strains under different conditions (with and without exposure to light) for Al-ZnO7 and Al-ZnO9. The asterisks (*) indicate statistically significant differences (p < 0.05) between the light and non-light conditions.
Crystals 15 00397 g019
Figure 20. EDS analysis of the surface of treated microbes.
Crystals 15 00397 g020
Figure 21. SEM micrographs of microbes treated with Al-ZnO9. Panels (ac) represent K. oxytoca, panels (df) represent Staph. epidermidis, and panels (gi) represent C. albicans. The left panels (a,d,g) represent the controls, while the other panels represent the treated cells.
Crystals 15 00397 g021
Figure 22. Proposed antibacterial mechanisms of Al-ZnO NPs, encompassing direct interaction with the bacterial cell membrane, ROS generation, and the release of free metal ions. The overall antibacterial effect of Al-ZnO NPs is likely due to a synergistic combination of these mechanisms. AlZO in the schematic refers to Al-doped ZnO NPs.
Crystals 15 00397 g022
Table 1. Synthesis methods used and the corresponding tested microorganisms.
YearReferenceSynthesis
Method
Doping
Concentration
MicrobesType of Tested MicrobesStudied Parameters
2022Anandh et al. [30]SILAR technique1 wt.%
3 wt.%
5 wt.%
Escherichia coli
Staphylococcus aureus
Aspergillus niger
Gram-negative bacterium
Gram-positive bacterium
A filamentous fungus
Doping
concentration
Type of microbe
2021Ali et al. [31]Spray pyrolysis technique0 wt.%
0.5 wt.%
1.25 wt.%
2.25 wt.%
7.5 wt.%
Escherichia coliGram-negative bacteriumDoping concentration
2020Vijayaraj et al. [32]Sol–gel method1 wt.%
2 wt.%
3 wt.%
4 wt.%
Escherichia coli
Staphylococcus aureus
Aspergillus flavus
Aspergillus niger
Gram-negative bacterium
Gram-positive bacterium
A filamentous fungus
Doping concentration
Type of microbe
2020Khashan et al. [33]Laser ablation method0.2 wt.%
0.27 wt.%
0.33 wt.%
0.42 wt.%
Escherichia coli
Staphylococcus aureus
Gram-negative bacterium
Gram-positive bacterium
Doping concentration
Type of microbe
2019Chidhambaram et al.
[34]
Wet chemical route1 wt.%
3 wt.%
5 wt.%
Escherichia coli
Proteus mirabilis
Enterococcus faecalis
Staphylococcus aureus
Gram-negative bacterium
Gram-positive bacterium
Doping concentration
Type of microbe
2019Saxena et al. [35]Co-precipitation method15 wt.%Escherichia coli
Enterococcus hirae
Gram-negative bacterium
Gram-positive bacterium
Type of microbe
2016Brintha et al. [36]Sol–gel method7 wt.%Escherichia coli
Klebsiella pneumoniae
Bacillus cereus
Staphylococcus aureus
Gram-negative bacterium
Gram-positive bacterium
Doping elements
Type of microbe
Table 2. Masses of ZnO and Al2O3 used for the synthesis of the Al-doped ZnO NPs samples, with derived atomic fraction ( x ) and oxygen vacancy ( V O ) percentages.
Sample CodeDo ping LevelMass of Al2O3 (g)wt.% Al DopingAtomic Fraction (x) Oxygen   Vacancy   ( V O )
Al-ZnO33 wt.% Al0.0928 3 % 0.052.5%
Al-ZnO55 wt.% Al0.1579 5 % 0.084.0%
Al-ZnO77 wt.% Al0.2258 7 % 0.115.5%
Al-ZnO99 wt.% Al0.2967 9 % 0.147.0%
Table 3. Microorganisms tested against Al-ZnO nanoparticles with their strain/ATCC numbers.
TypeMicroorganismStrain/ATCC Number
Gram-negative bacteriaEscherichia coli (E. coli)ATCC 25922
Klebsiella oxytoca (K. oxytoca)ATCC 700324
Gram-positive bacteriaStaphylococcus aureus (Staph. aureus)ATCC 25923
Staphylococcus epidermidis (Staph. epidermidis)ATCC 12228
FungiCandida tropicalis (C. tropicalis)ATCC 13803
Candida albicans (C. albicans)ATCC 14053
Table 4. Fractional composition of phases from Rietveld refinement.
SampleZnO (wt.%)ZnAl2O4 (wt.%)
ZnO1000
Al-ZnO398.51.5
Al-ZnO597.22.8
Al-ZnO795.84.2
Al-ZnO994.15.9
Table 5. Crystallite size strain of the nanocrystalline powder samples.
SampleCrystallite Size (nm)Strain
ZnO38−5.01 × 10⁻⁴
Al-ZnO3291.10 × 10−4
Al-ZnO520−1.35 × 10⁻⁴
Al-ZnO747−9.79 × 10⁻⁴
Al-ZnO919−7.08 × 10⁻⁴
Table 6. Extracted parameters of the equivalent circuit for the Al-ZnO samples.
Sample R 1   ( Ω ) R 2   ( Ω )C (F)A
Al-ZnO34054.58 × 1064.4 × 10−100.784
Al-ZnO53002.54 × 1062.52 × 10−100.85
Al-ZnO72101.58 × 1062.29 × 10−100.855
Al-ZnO91803.9 × 1052.127 × 10−100.86
Table 7. Mean inhibition zones (mm) of ZnO and Al-ZnO samples (not subjected to the additional long milling process) against various microorganisms in solid and liquid media, expressed as mean ± SD.
Tested MicroorganismsMean of the Inhibition Area in mm of the Six Nanoparticles in Solid and Liquid State ± SD
ZnOAl-ZnO3Al-ZnO5Al-ZnO7Al-ZnO9Positive Control *
SolidLiquidSolidLiquidSolidLiquidSolidLiquidSolidLiquid
Gram-Negative Bacteria
E. coli000000000016.7 ± 0.58
K. oxytoca000000000016.3 ± 0.58
Gram-Positive Bacteria
Staph. aureus12.4 ± 0.111.1 ± 0.3812.37 ± 0.2411.6 ± 0.1212.57 ± 0.0711.87 ± 0.0913.1 ± 0.111.83 ± 0.6613.3 ± 0.1512.0 ± 0.00117.67 ± 0.33
Staph. epidermidis12.43 ± 0.1211.4 ± 0.3112.37 ± 0.2011.7 ± 0.1713.43 ± 0.2311.73 ± 0.1515.37 ± 0.0912.07 ± 0.0715.57 ± 0.3512.37 ± 0.1922.33 ± 0.33
Fungi
C. tropicalis000000000014.3 ± 0.58
C. albicans000000000015.0 ± 1.0
* Positive control; gentamicin for Gram-negative bacteria, clindamycin 10 µg for Gram-positive bacteria, and nystatin (100 µg) for Candida spp. All negative controls (DMSO) exhibited zero inhibition zones.
Table 8. Statistical analysis of the antibacterial effect of different concentrations of ZnO doped with Al in the solid state against Gram-positive bacteria (Staph. aureus ATCC 29213 and Staph. epidermidis ATCC 12228).
MicroorganismZnOAl-ZnO3Al-ZnO5Al-ZnO7Al-ZnO9Reference Antibiotics
Staph. aureus12.4 ± 0.1 a12.37 ± 0.24 a12.57 ± 0.07 a13.1 ± 0.1 b13.3 ± 0.15 b17.67 ± 0.33 d
Staph. epidermidis12.43 ± 0.12 a12.37 ± 0.20 ab13.43 ± 0.23 b15.37 ± 0.09 c15.57 ± 0.35 abc22.33 ± 0.33 d
The different superscript letters mean a significant difference at p < 0.05.
Table 9. Statistical analysis of the antibacterial effect of different concentrations of ZnO doped with Al in the liquid state against Gram-positive bacteria (Staph. aureus ATCC 29213 and Staph. epidermidis ATCC 12228).
MicroorganismZnOAl-ZnO3Al-ZnO5Al-ZnO7Al-ZnO9Reference Antibiotics
Staph. aureus11.1 ± 0.38 a11.6 ± 0.12 a11.87 ± 0.09 a11.83 ± 0.66 a12.0 ± 0.001 a17.67 ± 0.33 b
Staph. epidermidis11.4 ± 0.31 a11.7 ± 0.17 a11.73 ± 0.15 a12.07 ± 0.07 a12.37 ± 0.19 a22.33 ± 0.33 b
The different superscript letters mean a significant difference at p < 0.05.
Table 10. Antimicrobial activity of Al-ZnO NP samples at 7 wt.% and 9 wt.% concentrations, subjected to 4 h HEBM, tested under solid-state conditions with light and dark exposure. Results are expressed as inhibition zone diameters (mm).
Tested MicroorganismsMeasurement of the Inhibition Area in mm Using Well Diffusion Method ± SD
In DarkUnder Light
Not Subjected to Additional HEBMSubjected to Additional HEBMPositive ControlNot Subjected to Additional HEBMSubjected to Additional HEBMPositive Control
Al-ZnO7Al-ZnO9Al-ZnO7Al-ZnO9Al-ZnO7Al-ZnO9Al-ZnO7Al-ZnO9
Gram-Negative Bacteria
E. coli0011.03 ± 0.2511.3 ± 0.4511.6 ± 0.320012.7 ± 0.612.7 ± 0.212.3 ± 0.3
K. oxytoca0012.5 ± 0.213.2 ± 0.2815 ± 1.090013.1 ± 0.2613.8 ± 0.215.03 ± 0.06
Gram-Positive Bacteria
Staph. aureus13.1 ± 0.1713.3 ± 0.2614.2 ± 0.4614.7 ± 0.1513.4 ± 1.0213.7 ± 0.1713.9 ± 0.2615.1 ± 0.3615.7 ± 0.213.5 ± 0.057
Staph. epidermidis15.3 ± 0.1515.6 ± 0.619.9 ± 1.522.7 ± 1.717.7 ± 0.2520.0 ± 0.5018.5 ± 0.423.6 ± 1.124.4 ± 0.6117.9 ± 0.60
Fungi
C. tropicalis000018.3 ± 0.58000021 ± 1.73
C. albicans000020 ± 221.6 ± 1.6522.9 ± 0.724.1 ± 0.524.5 ± 0.260
Disclaimer/Publisher’s Note: The statements, opinions and data contained in all publications are solely those of the individual author(s) and contributor(s) and not of MDPI and/or the editor(s). MDPI and/or the editor(s) disclaim responsibility for any injury to people or property resulting from any ideas, methods, instructions or products referred to in the content.

