Theory of Photoinduced Phase Transitions in Molecular Conductors: Interplay Between Correlated Electrons, Lattice Phonons and Molecular Vibrations

Abstract
:
1. Introduction
 , pressure
  , constituent elements, etc. In order to pursue further possibilities of organic conductors, the feasibility of manipulating the electronic phases on designed spatial and temporal scales is important. Phase transitions are induced in equilibrium by the variation of parameters such as and . They can be photoinduced, under nonequilibrium environment, on different time scales ranging from femtoseconds to nanoseconds., , and constituent elements [1,2,3]. Furthermore, in quasi-two-dimensional molecular conductors, molecular arrangements are continuously changed from squares to triangles, namely, geometric frustration is tuned to modify the phase diagram itself [4,5].
 -(BEDT-TTF)2RbZn(SCN)4 and α-(BEDT-TTF)2I3[BEDT-TTF=bis(ethylenedithio)tetrathiafulvalene] both show a horizontal-stripe pattern and are quite similar. Their photoinduced dynamics are, however, quite different. It is shown that their slightly different crystal structures make the effects of electron-lattice couplings quite different, because the way by which the charge order is stabilized is different, in spite of the fact that the charge order is basically stabilized by Coulomb interactions. At an early stage, collective motion of electron transfers is observed and it interferes with molecular vibrations; (3) The Mott insulator phase in
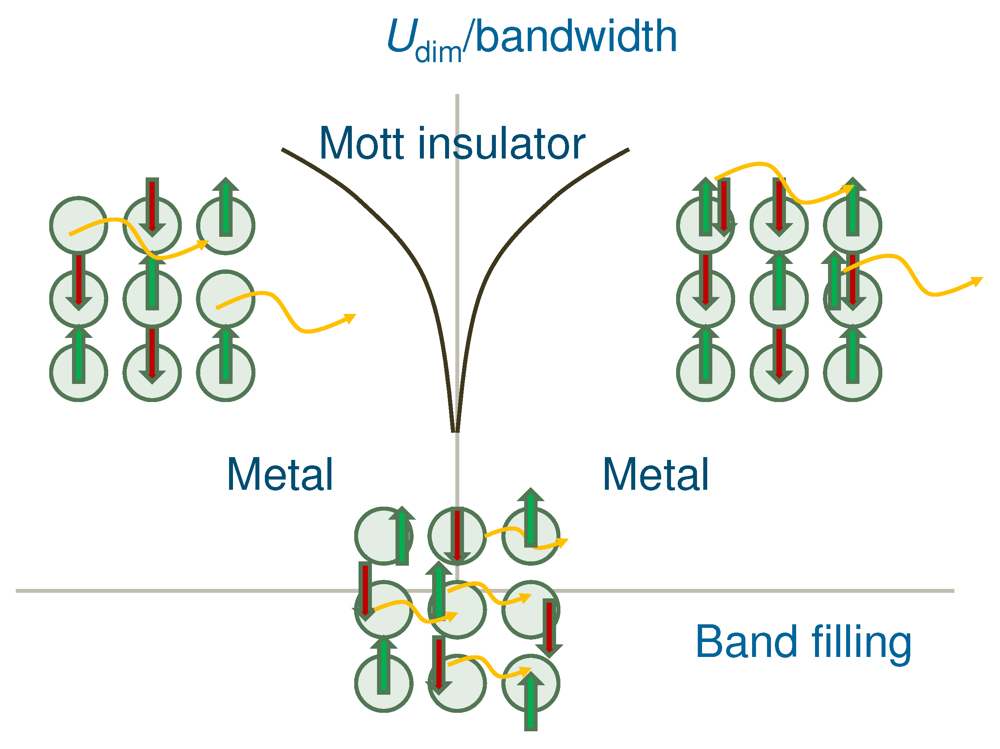
  -(d-BEDT-TTF)2Cu[N(CN)2]Br can be converted into a metallic phase by photoexcitation. In general, this transition is induced by the weakening of effective interaction relative to the bandwidth or the introduction of carriers away from half filling. Both transition pathways are realized by tuning the energy of photoexcitation, using intradimer and interdimer charge-transfer excitations in the dimer-Mott insulator phase.
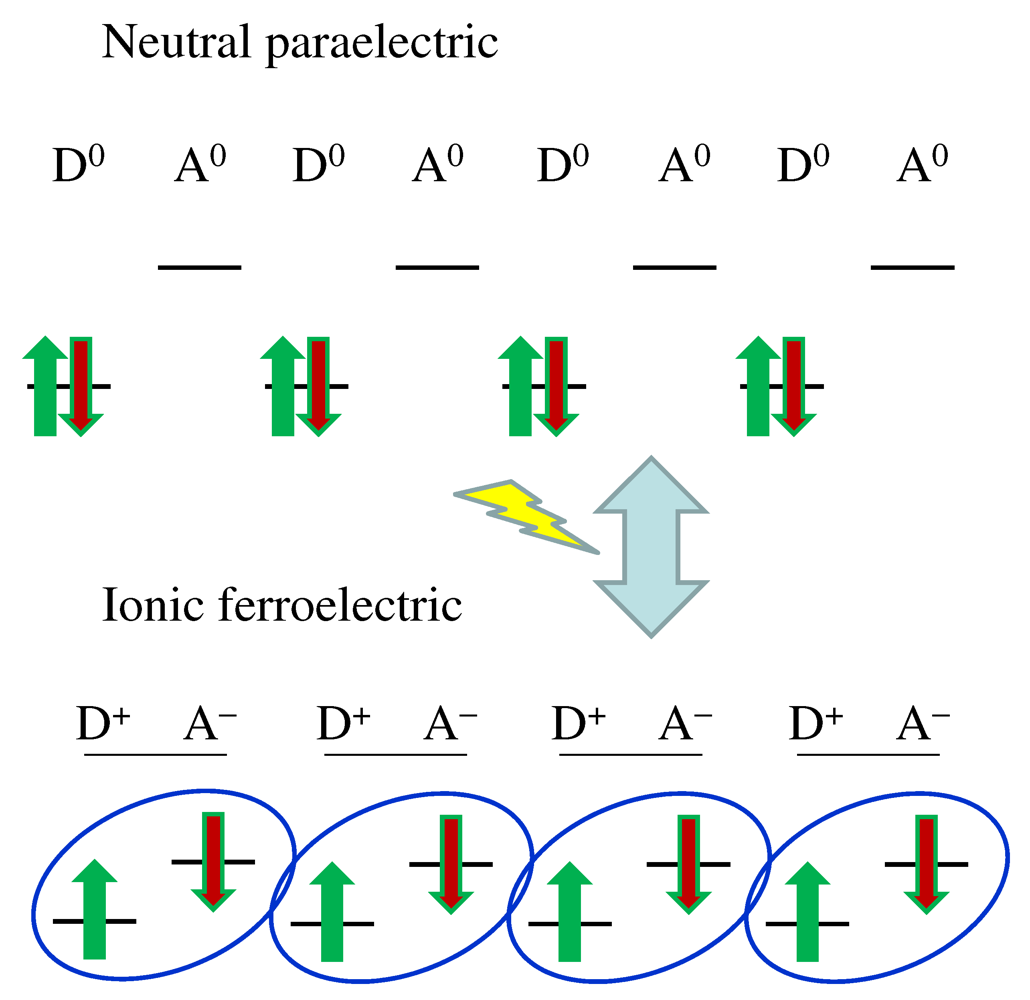
2. Neutral-Ionic Transition in TTF-CA

 creates an electron with spin
  at site j,
  =
=  , and
, and  =
=  . The parameter
  denotes the transfer integral on a regular lattice, Δ the site energy difference between neighboring orbitals when molecular distortions are absent,
  the on-site repulsion strength, and
  the nearest-neighbor repulsion strength. The lattice displacement
  at site j modulates the transfer integral between the
  th and jth orbitals and that between the jth and
  th orbitals with the coefficient
  . The displacement
  in the
  th mode on the jth molecule modulates the site energy with the coefficient
  . The quantities
  and
and  are the time derivatives of and , respectively. The parameters
  and
and  are their elastic coefficients, and
  and
and  are their bare phonon energies, respectively. = 0.17, = 1.5, and = 0.6; we vary Δ around the boundary between the neutral and ionic phases shown in Figure 1.
 and
and  . The displacements are scaled using a = = 1. For simplicity, we set
  . As for phonons, we take one mode for the donor molecule and two modes for the acceptor molecule in addition to the lattice phonon mode, and use parameters that approximately reproduce the experimentally observed phonon energies [27]: = 0.013,
  = 0.040,
  = 0.055, and
  = 0.12. Donor and acceptor molecules are specified by odd and even j’s, respectively. For simplicity, we set
  =
=  .
.
 for a pulse of an oscillating electric field is given by
 is the excitation energy,
  is the pulse width, and
  is the electric field amplitude. The time-dependent Schrödinger equation for the exact many-electron wave function on the chain of
  = 12 sites with periodic boundary condition is numerically solved by expanding the exponential evolution operator with a time slice
  = 0.02 eV-1to the 15th order and by checking the conservation of the norm [13]. The initial state is set in the electronic ground state. The classical equations for the lattice and molecular displacements are solved by the leapfrog method, where the forces are derived from the Hellmann-Feynman theorem.
 and
and  .
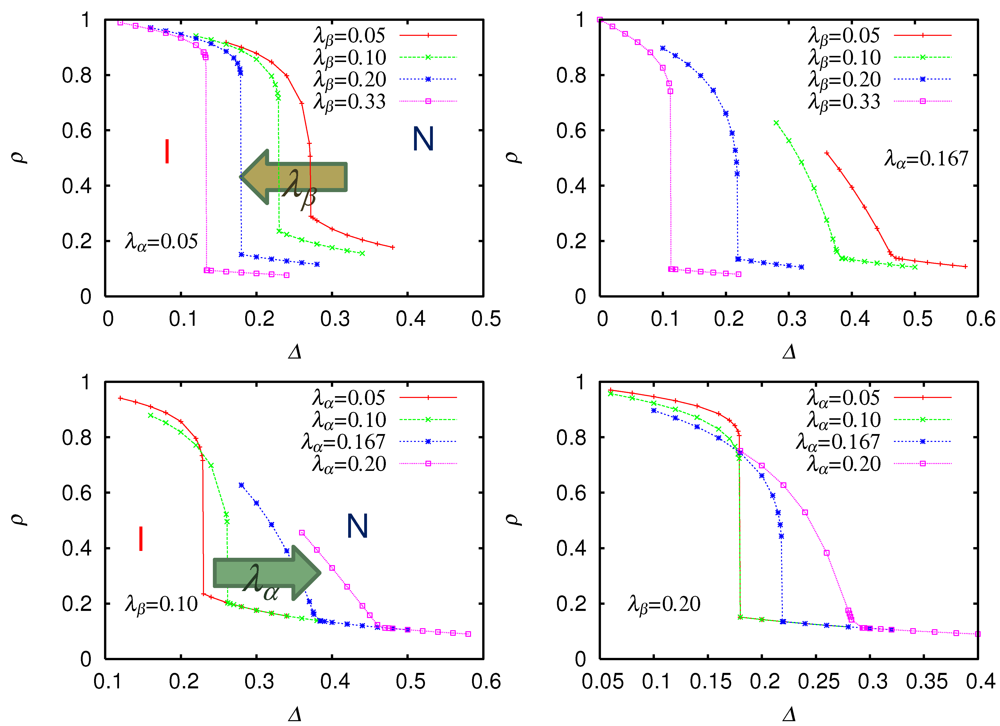
.  as a function of site energy difference Δ for weak Peierls coupling = 0.05 (upper left), strong Peierls coupling = 0.167 (upper right), weak Holstein coupling = 0.10 (lower left), and strong Holstein coupling = 0.20 (lower right). From [28]. Reproduced with permission from JPSJ.
as a function of site energy difference Δ for weak Peierls coupling = 0.05 (upper left), strong Peierls coupling = 0.167 (upper right), weak Holstein coupling = 0.10 (lower left), and strong Holstein coupling = 0.20 (lower right). From [28]. Reproduced with permission from JPSJ.
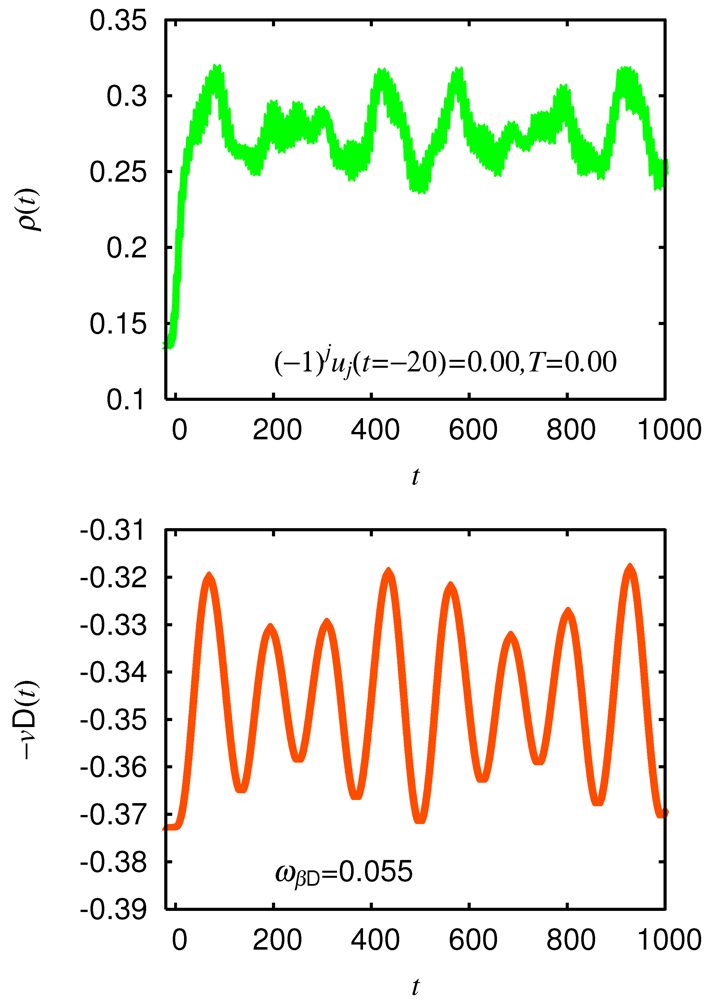
as a function of site energy difference Δ for weak Peierls coupling = 0.05 (upper left), strong Peierls coupling = 0.167 (upper right), weak Holstein coupling = 0.10 (lower left), and strong Holstein coupling = 0.20 (lower right). From [28]. Reproduced with permission from JPSJ.  increases, the neutral phase is stabilized, and the discontinuity in ionicity is enlarged, by increasing (decreasing) the ionicity in the ionic (neutral) phase on the small-Δ (large-Δ) side of the phase boundary. As a consequence, in order for the ionic phase to be a typical Mott insulator with nearly one electron per site, should be so large that the neutral phase is sufficiently stabilized. It is evident that, as increases, the ionic phase is stabilized, and the discontinuity at the transition is suppressed. A finite is necessary for dimerization and the three-dimensional ferroelectric order with a broken inversion symmetry. Both and are large in TTF-CA. and a large , the neutral phase near the phase boundary is photoexcited with an energy just above the optical gap. The time evolution of the ionicity
  during and after photoexcitation is plotted in Figure 3. In this particular case, the phase boundary is located between Δ = 0.218 (ionic) and Δ = 0.219 (neutral), and we use Δ = 0.219. For comparison, the displacement on the donor molecule
  is also shown. (upper) and displacement with bare energy
  = 0.055 (lower) during and after charge-transfer photoexcitation of neutral phase using = 0.65, = 10, and = 1.4 in case of strong Peierls and Holstein couplings = 0.167 and = 0.20 From [28]. Reproduced with permission from JPSJ.
(upper) and displacement with bare energy = 0.055 (lower) during and after charge-transfer photoexcitation of neutral phase using = 0.65, = 10, and = 1.4 in case of strong Peierls and Holstein couplings = 0.167 and = 0.20 From [28]. Reproduced with permission from JPSJ.
= 0.055 (lower) during and after charge-transfer photoexcitation of neutral phase using = 0.65, = 10, and = 1.4 in case of strong Peierls and Holstein couplings = 0.167 and = 0.20 From [28]. Reproduced with permission from JPSJ.
(upper) and displacement with bare energy = 0.055 (lower) during and after charge-transfer photoexcitation of neutral phase using = 0.65, = 10, and = 1.4 in case of strong Peierls and Holstein couplings = 0.167 and = 0.20 From [28]. Reproduced with permission from JPSJ.  increases, the electron density increases for the acceptor molecule and decreases for the donor molecule, so that the displacement increases at the acceptor molecule and decreases at the donor molecule. Thus, basically behaves as
  times the cosine function. The ionicity receives a positive feedback from molecular displacements and oscillates in the same phase with them. This—cosine behavior is consistent with the experimental observation [27].
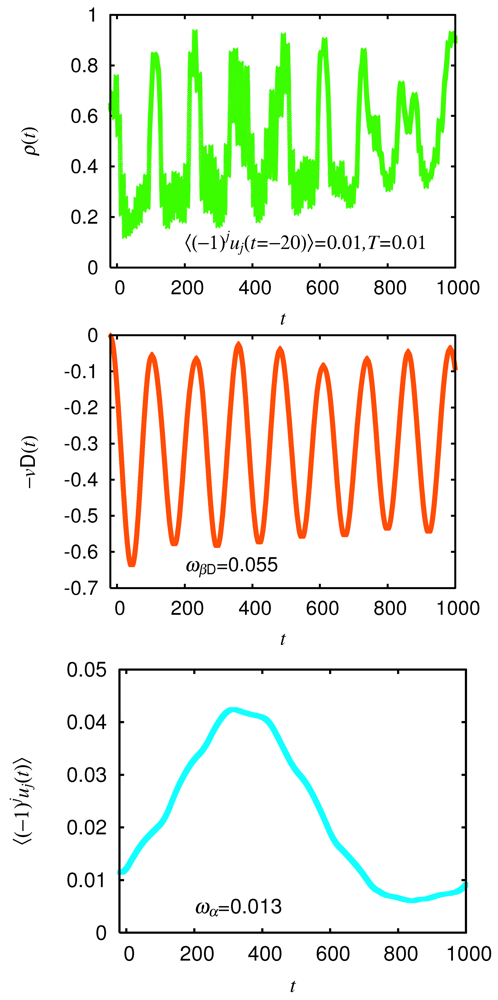
 = 0.01, which is much smaller than = 0.058 of the ground state on the ionic side of the phase boundary. In addition, we need to introduce random numbers according to the Boltzmann distribution at a finite temperature of = 0.01 eV in , , , and of the initial state. Figure 4 shows the transient ionicity , the displacement on the donor molecule , and the spatially averaged dimerization
  in such a case. (upper), displacement with bare energy = 0.055 (middle), and dimerization with bare energy = 0.013 (lower) after setting initial dimerization
  , adding random numbers ( = 0.01) to phonon variables as explained in text, and charge-transfer photoexcitation of neutral phase using = 0.65, = 10, and = 4.2 in case of strong Peierls and Holstein couplings = 0.167 and = 0.20 From [28]. Reproduced with permission from JPSJ.
(upper), displacement with bare energy = 0.055 (middle), and dimerization with bare energy = 0.013 (lower) after setting initial dimerization , adding random numbers ( = 0.01) to phonon variables as explained in text, and charge-transfer photoexcitation of neutral phase using = 0.65, = 10, and = 4.2 in case of strong Peierls and Holstein couplings = 0.167 and = 0.20 From [28]. Reproduced with permission from JPSJ.
, adding random numbers ( = 0.01) to phonon variables as explained in text, and charge-transfer photoexcitation of neutral phase using = 0.65, = 10, and = 4.2 in case of strong Peierls and Holstein couplings = 0.167 and = 0.20 From [28]. Reproduced with permission from JPSJ.
(upper), displacement with bare energy = 0.055 (middle), and dimerization with bare energy = 0.013 (lower) after setting initial dimerization , adding random numbers ( = 0.01) to phonon variables as explained in text, and charge-transfer photoexcitation of neutral phase using = 0.65, = 10, and = 4.2 in case of strong Peierls and Holstein couplings = 0.167 and = 0.20 From [28]. Reproduced with permission from JPSJ.  rapidly increases with and oscillates like times the cosine function. Thus, receives a positive feedback from
  already at an early stage as well as from . The amplitude of the -oscillation is indeed larger than that without initial dimerization.
 3. Melting of Charge Order in ![Crystals 02 00056 i004]() -Type and α-Type BEDT-TTF Salts
-Type and α-Type BEDT-TTF Salts

 creates an electron with spin at site i,
  =
=  , and
, and  =
=  . The quantity
  denotes the intermolecular phonon’s displacement,
  denotes its time derivative, and
  creates a quantum phonon of energy
  , and
, and  is the electron-molecular-vibration coupling strength. The other notations are standard and are introduced in [21]. For instance,
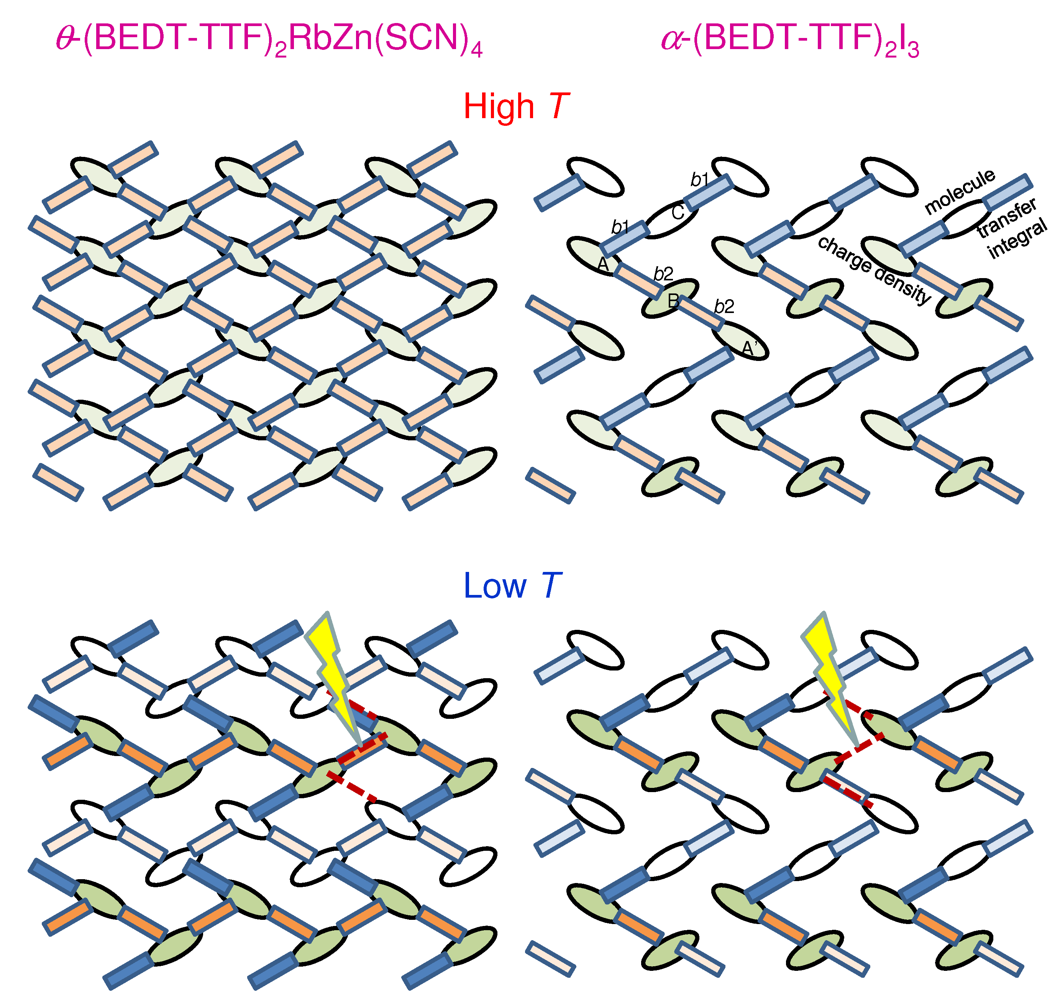
  denotes the transfer integral for the bond between the neighboring ith and jth sites. Schematic illustrations of the high- and low-temperature, electronic and lattice structures of the conduction layers in the - and α-type salts are shown in Figure 5. -(BEDT-TTF)2RbZn(SCN)4(left) and α-(BEDT-TTF)2I3(right) at high temperatures (upper) and at low temperatures (lower). The dashed lines in the lower panels indicate local photoexcitations used in the Hartree-Fock calculations.
-(BEDT-TTF)2RbZn(SCN)4(left) and α-(BEDT-TTF)2I3(right) at high temperatures (upper) and at low temperatures (lower). The dashed lines in the lower panels indicate local photoexcitations used in the Hartree-Fock calculations.
denotes the transfer integral for the bond between the neighboring ith and jth sites. Schematic illustrations of the high- and low-temperature, electronic and lattice structures of the conduction layers in the - and α-type salts are shown in Figure 5. -(BEDT-TTF)2RbZn(SCN)4(left) and α-(BEDT-TTF)2I3(right) at high temperatures (upper) and at low temperatures (lower). The dashed lines in the lower panels indicate local photoexcitations used in the Hartree-Fock calculations.
-(BEDT-TTF)2RbZn(SCN)4(left) and α-(BEDT-TTF)2I3(right) at high temperatures (upper) and at low temperatures (lower). The dashed lines in the lower panels indicate local photoexcitations used in the Hartree-Fock calculations.  = 12 ×12), we employ the Hartree-Fock approximation for the electronic states and use the parameter values in [20], the results of which are consistent with those for small systems ( = 12) with exact many-electron wave functions ( = 0) [21]. When we use exact many-electron-phonon wave functions (
  ), we use smaller systems ( = 8) and the parameter values in [21,22]. Periodic boundary conditions are imposed on all of them. Photoexcitation is introduced in a similar manner to that in the previous section. The time evolution of the wave function and the lattice displacements is obtained by the method described in the previous section.-(BEDT-TTF)2RbZn(SCN)4 and α-(BEDT-TTF)2I3 [19]. For this purpose, we ignore the electron-molecular-vibration coupling by setting = 0 for the moment and use large systems ( = 12 × 12). It is already clarified that the mechanisms for stabilizing the charge orders by lattice distortions are different in these two salts [20]. In -(BEDT-TTF)2RbZn(SCN)4, the whole charge-rich (charge-poor) stripe is stabilized by strengthening (weakening) the horizontally connected bonds, as schematically shown in Figure 5. In α-(BEDT-TTF)2I3, the metallic phase without lattice distortion at high temperatures already possesses a charge-rich site B and a charge-poor site C from the kinetic origin. At low temperatures, the charge-rich site A and the charge-poor site A’ bridged by the site B are locally stabilized by lattice distortion. Thus, local photoexcitations would easily weaken the charge order in the latter salt, while the charge order in the former salt would be robust.
 ,
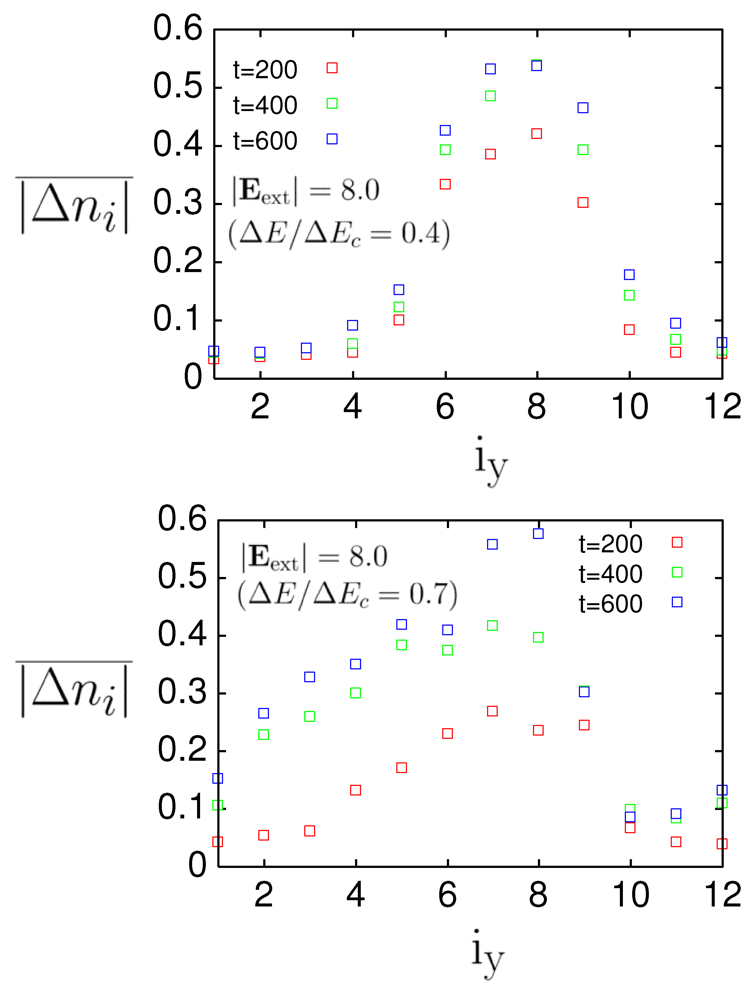
,  ) = (7.5, 7), (7.5, 7.5), and (7.5, 8)] that connect four sites within a unit cell. Figure 6 shows, in the parenthesis, the ratio
  , where
  is the increment in the total energy per site after local photoexcitation, and
  is the critical increment above which the charge order is completely melted by global photoexcitation. dependence of
  at
at  = 200, 400, and 600 for photoexcitation
  =
=  = 8.0 along stripes, = 0.4, and = 236 in case of -(BEDT-TTF)2RbZn(SCN)4 (upper) and α-(BEDT-TTF)2I3 (lower), where is coordinate along
  -axis (upper) and
  -axis (lower) From [20]. Reproduced with permission from JPSJ.
dependence of at = 200, 400, and 600 for photoexcitation = = 8.0 along stripes, = 0.4, and = 236 in case of -(BEDT-TTF)2RbZn(SCN)4 (upper) and α-(BEDT-TTF)2I3 (lower), where is coordinate along -axis (upper) and -axis (lower) From [20]. Reproduced with permission from JPSJ.
-axis (lower) From [20]. Reproduced with permission from JPSJ.
dependence of at = 200, 400, and 600 for photoexcitation = = 8.0 along stripes, = 0.4, and = 236 in case of -(BEDT-TTF)2RbZn(SCN)4 (upper) and α-(BEDT-TTF)2I3 (lower), where is coordinate along -axis (upper) and -axis (lower) From [20]. Reproduced with permission from JPSJ.  = 0 and those at = 200, 400, and 600 are averaged over the direction parallel to the stripes and denoted by :
 is the wave function at time ,
  = 12 is the number of sites along the axis parallel to the stripes, and ( ) is the coordinate parallel (perpendicular) to the stripes. It gives a measure of how the photoinduced domain grows in the direction perpendicular to the stripes. In -(BEDT-TTF)2RbZn(SCN)4, the photoinduced domain remains localized near the place of photoexcitation, and hardly grows to the direction perpendicular to the stripes. This property prevents from becoming large. For α-(BEDT-TTF)2I3, the photoinduced domain expands to the perpendicular direction. This result suggests that a macroscopic domain is much more easily created in the latter salt than in the former salt.
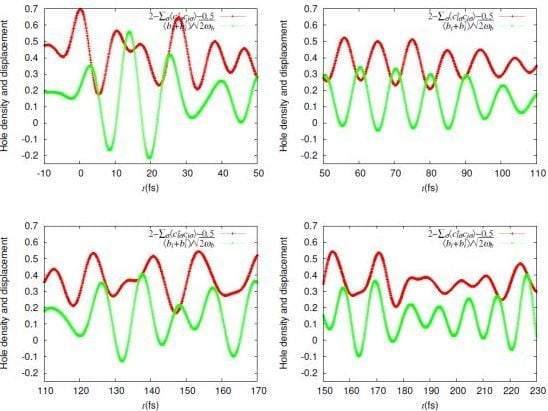
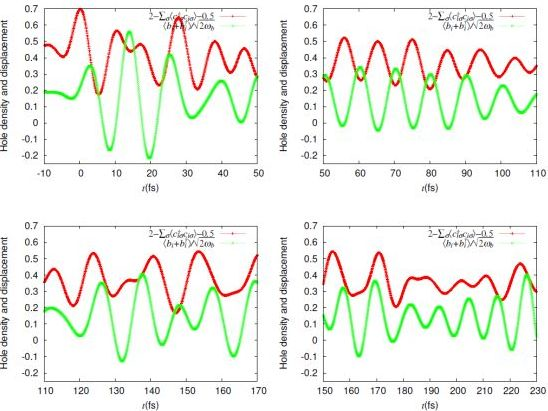
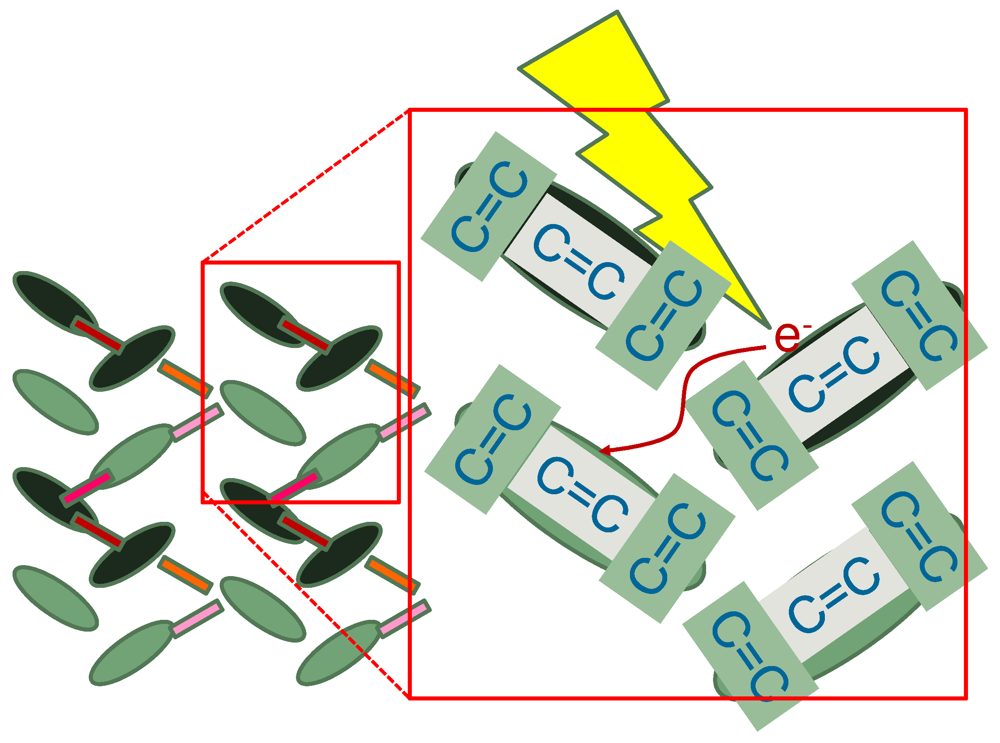
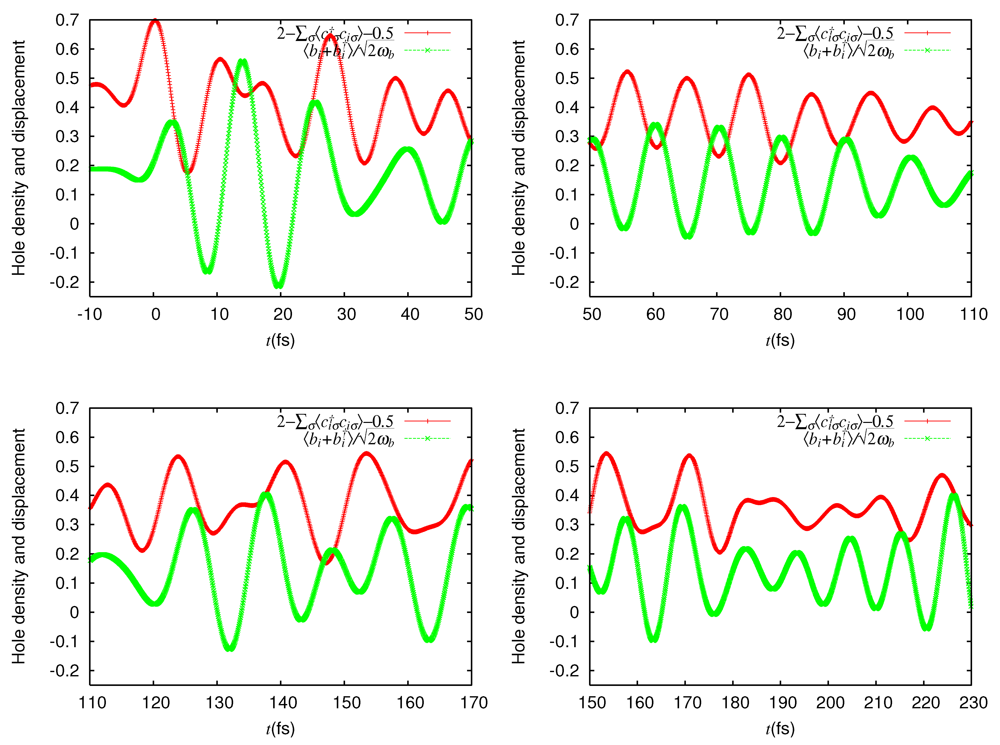
 = 0.0625 eV) and a large bare energy for the molecular vibration ( = 0.36 eV), which is comparable with the charge-transfer excitation energy in small systems ( = 8).
 (red) and molecular displacement
  (green) at molecule i = A during and after photoexcitation = 1 along stripes, = 0.35, and = 5 fs in case of α-(BEDT-TTF)2I3 [22].
(red) and molecular displacement (green) at molecule i = A during and after photoexcitation = 1 along stripes, = 0.35, and = 5 fs in case of α-(BEDT-TTF)2I3 [22].
(green) at molecule i = A during and after photoexcitation = 1 along stripes, = 0.35, and = 5 fs in case of α-(BEDT-TTF)2I3 [22].
(red) and molecular displacement (green) at molecule i = A during and after photoexcitation = 1 along stripes, = 0.35, and = 5 fs in case of α-(BEDT-TTF)2I3 [22].  = 5 fs is applied to the system around = 0. It directly oscillates the hole density. Then, it forces the molecular displacement to oscillate indirectly through the electron-molecular vibration coupling. The sign of the displacement is so chosen that it becomes large (small) when the hole density is large (small) in equilibrium. Thus, they are initially in phase.-type and α-type BEDT-TTF salts. On the time scale of lattice phonons, the different dynamics in these salts manifest the way by which the charge order is stabilized by lattice phonons is different in these salts. The charge order in the -type salt is robust, while that in the a-type salt is fragile. On the time scale of molecular vibrations, i.e., at an early stage, the charge dynamics and the vibrational dynamics interfere with each other. To reproduce the interference pattern theoretically, the quantum nature of molecular vibrations must be properly taken into account.
 4. Mott-Insulator-to-Metal Transition in ![Crystals 02 00056 i009]() -Type BEDT-TTF Salts
-Type BEDT-TTF Salts
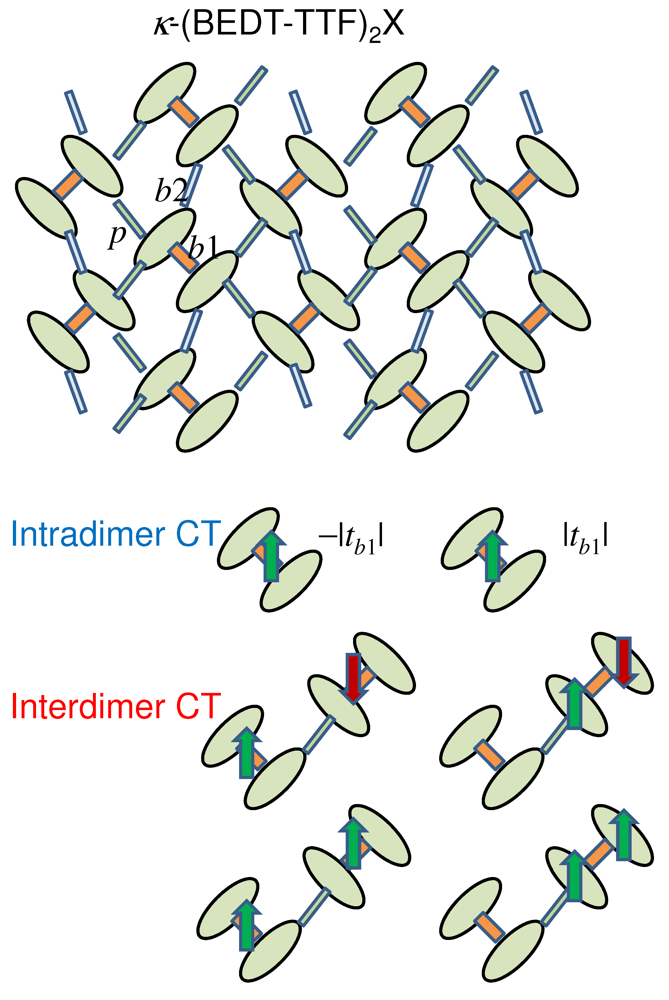
 -(BEDT-TTF)2X with intradimer and interdimer charge-transfer excitation processes.
-(BEDT-TTF)2X with intradimer and interdimer charge-transfer excitation processes.
-(BEDT-TTF)2X with intradimer and interdimer charge-transfer excitation processes. 
 creates an electron with spin at site i, = , and = . The operator
  creates a quantum phonon of energy
  , and
, and  is the electron-phonon coupling strength. The other notations are standard and are introduced in [16]. For instance, the intersite Coulomb repulsion
  is assumed to be
  for the neighboring sites i and j at
  and
and  . For simplicity, we consider only one mode for the creation operators , which modulate the intradimer transfer integrals
  . Thus, we have =
  and =
and =  . We take a high phonon energy = 0.05 and a strong electron-phonon coupling = 0.06 to make the intradimer and interdimer charge-transfer (CT) bands overlap to a large extent. We use exact many-electron-phonon wave functions on small systems ( = 8) with periodic boundary condition and with the number of phonons restricted to a maximum of three at any
  bond, and the parameter values in [16]. Photoexcitation is introduced in a similar manner to that in the previous sections. The time evolution of the wave function is obtained by the method described in the previous sections.
 is evaluated from the energies of the lowest one- and two-hole states for an isolated dimer with a transfer integral , on-site and intersite
  repulsion strengths on the molecular bases. It is given by
 through the relation
  . Owing to the molecular degrees of freedom inside a dimer, there are intradimer and interdimer CT excitations, as schematically shown in Figure 10. The force applied to the displacement depends linearly on the photoinduced difference in the expectation value
  between sites i and jinside the dimer. It is analytically shown that this difference is insensitive to the photoexcitation energy (i.e., whether charge is transferred inside a dimer or between dimers) [16]. As a consequence, any photoexcitation reduces , reduces the magnitude of the intradimer transfer (
  ), and weakens the effective on-site repulsion . in a direct manner, we calculate the expectation value of the displacement
  as a function of time after photoexcitation. Its maximum decrement,
  , gives the maximum decrement in ,
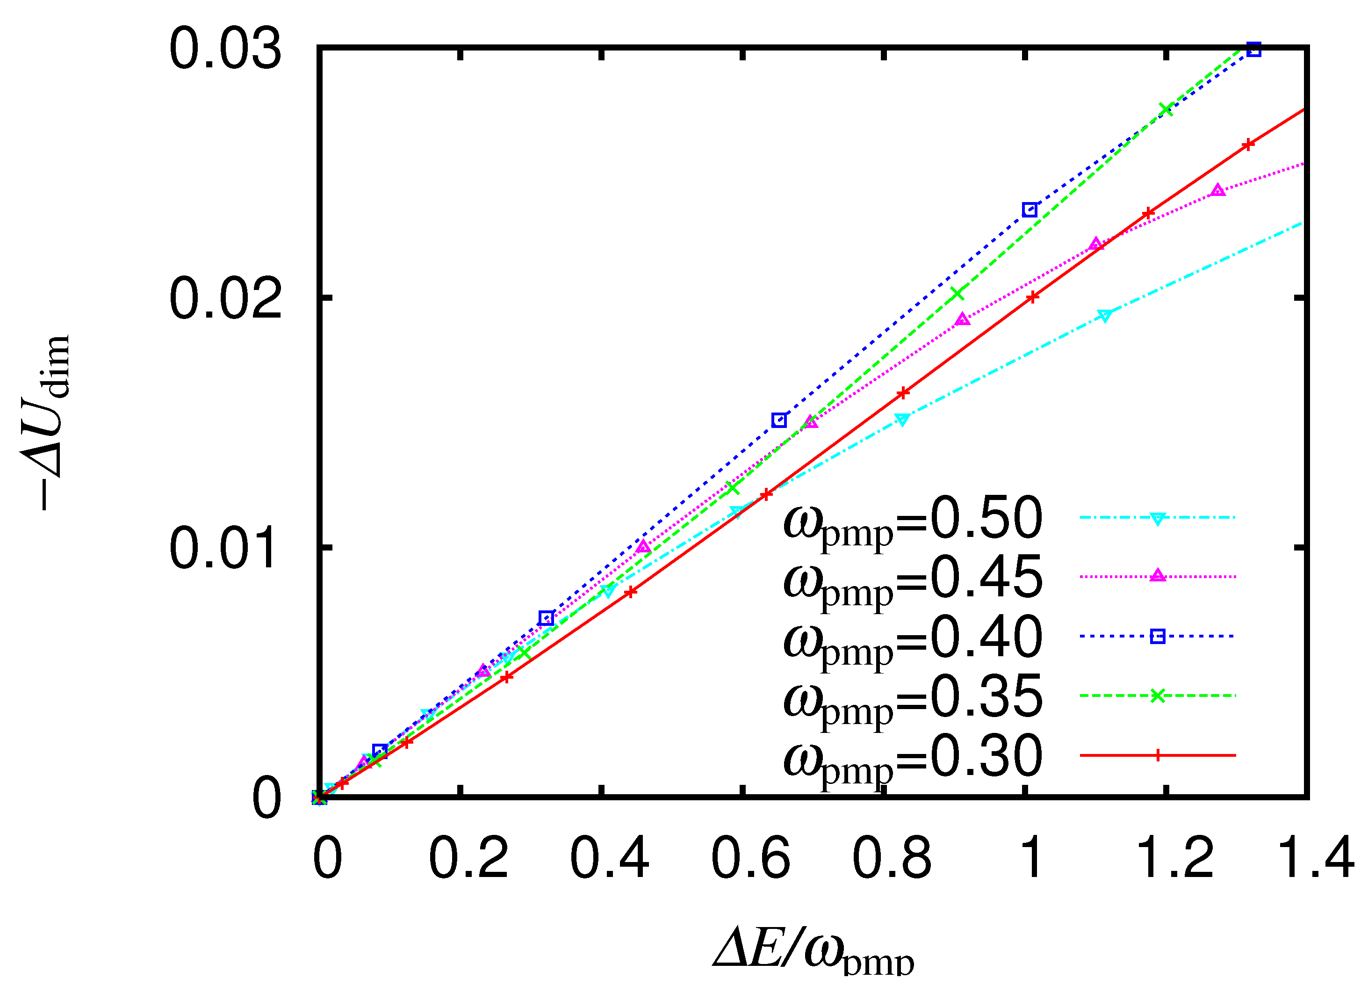
  through Equation (8). We vary the electric field amplitude and calculate the increment in the total energy divided by , which corresponds to the number of absorbed photons. We show in Figure 11 as a function of
  for different ., as a function of the number of absorbed photons , for different From [16]. Reproduced with permission from JPSJ.
, as a function of the number of absorbed photons , for different From [16]. Reproduced with permission from JPSJ.
for different ., as a function of the number of absorbed photons , for different From [16]. Reproduced with permission from JPSJ.
, as a function of the number of absorbed photons , for different From [16]. Reproduced with permission from JPSJ.  to is almost independent of the excitation energy at least in the range of
  , which covers the intradimer and interdimer CT excitations. The effective on-site repulsion is therefore confirmed to be weakened to a similar extent irrespective of whether charge is transferred mainly within a dimer or mainly between dimers.
 is known to be proportional to the spectral weight obtained by the integration of the conductivity over
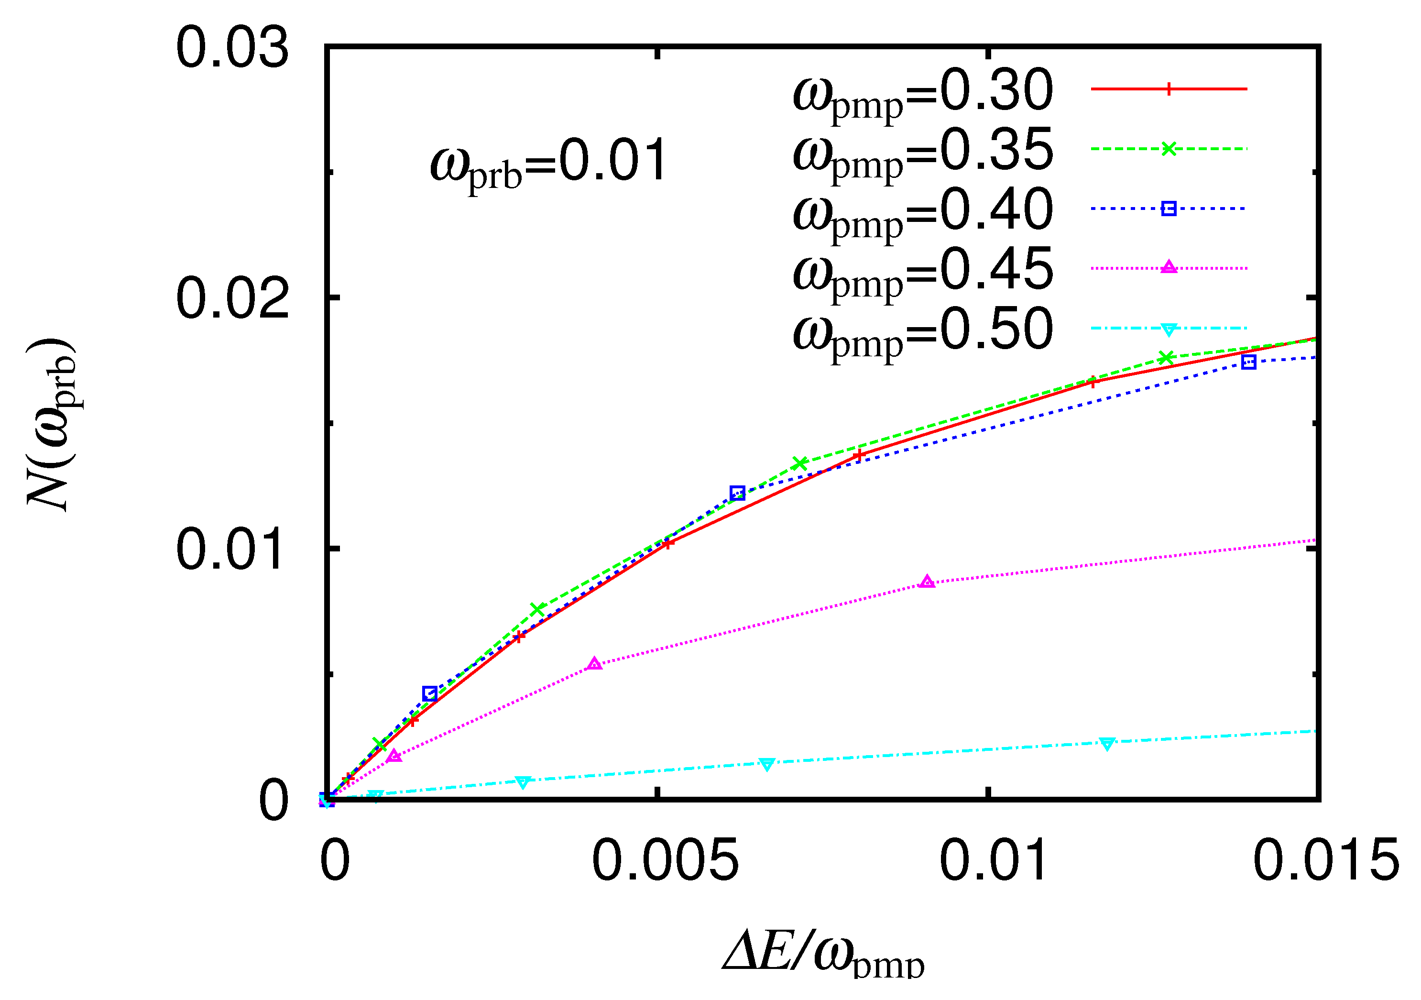
  below the charge gap. We calculate the increment in the conductivity
  , where
 a peak-broadening parameter set at 0.005, and
  . It is averaged over
  ,
,  , and integrated over ,
  is set at 0.01, which is well below the charge gap of 0.18 in the ground state. Although the quantity
  increases with for any , its rate depends largely on . For any below the charge gap, increases rapidly for = 0.3, 0.35, and 0.4 and very slowly for = 0.5. For = 0.3, 0.35, and 0.4, the rates are close to each other. The number of carriers involved in the low-energy optical excitations is increased efficiently by
  , but it is negligibly increased for = 0.5.,
  , as a function of the number of absorbed photons , for different From [16]. Reproduced with permission from JPSJ.
, , as a function of the number of absorbed photons , for different From [16]. Reproduced with permission from JPSJ.
, as a function of the number of absorbed photons , for different From [16]. Reproduced with permission from JPSJ.
, , as a function of the number of absorbed photons , for different From [16]. Reproduced with permission from JPSJ.  near 0.3 have low excitation energies and are regarded as delocalized. These excitations are characterized as interdimer CT excitations. Although any CT excitation weakens , it requires lattice motion and a long time. Consequently, if a Mott-insulator-to-metal transition is induced, it is mainly through the introduction of carriers. A photoexcitation with = 0.5 introduces a negligible number of carriers. As a consequence, if a Mott-insulator-to-metal transition is induced, it is mainly through the weakening of . This excitation is characterized as an intradimer CT excitation.
5. Conclusions
Acknowledgements
References
- Jérome, D. The physics of organic superconductors. Science 1991, 252, 1509–1514. [Google Scholar]
- Kishine, J.; Yonemitsu, K. Dimensional crossovers and phase transitions in strongly correlated low-dimensional electron systems: Renormalization-group study. Int. J. Mod. Phys. B 2002, 16, 711–771. [Google Scholar] [CrossRef]
- Itoi, M.; Araki, C.; Hedo, M.; Uwatoko, Y.; Nakamura, T. Anomalously wide superconducting phase of one-dimensional organic conductor (TMTTF)2SbF6. J. Phys. Soc. Jpn. 2008, 77. [Google Scholar] [CrossRef]
- Kagawa, F.; Itou, T.; Miyagawa, K.; Kanoda, K. Magnetic-field-induced Mott transition in a quasi-two-dimensional organic conductor. Phys. Rev.Lett. 2004, 93, 127001:1–127001:4. [Google Scholar]
- Kurosaki, Y.; Shimizu, Y.; Miyagawa, K.; Kanoda, K.; Saito, G. Mott transition from a spin liquid to a Fermi liquid in the spin-frustrated organic conductor κ-(ET)2Cu2(CN)3. Phys. Rev. Lett. 2005, 95, 177001:1–177001:4. [Google Scholar]
- Yonemitsu, K.; Nasu, K. Theory of photoinduced phase transitions. J. Phys. Soc. Jpn. 2006, 75. [Google Scholar] [CrossRef]
- Yonemitsu, K.; Nasu, K. Theory of photoinduced phase transitions in itinerant electron systems. Phys. Rep. 2008, 465, 1–60. [Google Scholar] [CrossRef]
- Yonemitsu, K. Theory of Photoinduced Phase Transitions in Quasi-One-Dimensional Organic Conductors. In Molecular Electronic and Related Materials—Control and Probe with Light; Naito, T., Ed.; Transworld Research Network: Trivandrum, India, 2010; pp. 305–320. [Google Scholar]
- Iwai, S.; Ono, M.; Maeda, A.; Matsuzaki, H.; Kishida, H.; Okamoto, H.; Tokura, Y. Ultrafast optical switching to a metallic state by photoinduced Mott transition in a halogen-bridged nickel-chain compound. Phys. Rev. Lett. 2003, 91, 057401:1–057401:4. [Google Scholar]
- Maeshima, N.; Yonemitsu, K. Photoinduced metallic properties of one-dimensional strongly correlated electron systems. J. Phys. Soc. Jpn. 2005, 74, 2671:1–2671:4. [Google Scholar]
- Okamoto, H.; Matsuzaki, H.; Wakabayashi, T.; Takahashi, Y.; Hasegawa, T. Photoinduced metallic state mediated by spin-charge separation in a one-dimensional organic Mott insulator. Phys.Rev. Lett. 2007, 98, 037401:1–037401:4. [Google Scholar]
- Uemura, H.; Matsuzaki, H.; Takahashi, Y.; Hasegawa, T.; Okamoto, H. Ultrafast charge dynamics in one-dimensional organic Mott insulators. J. Phys. Soc. Jpn. 2008, 77. [Google Scholar] [CrossRef]
- Yonemitsu, K.; Maeshima, N. Coupling-dependent rate of energy transfer from photoexcited Mott insulators to lattice vibrations. Phys. Rev. B 2009, 79, 125118:1–125118:6. [Google Scholar]
- Segawa, M.; Takahashi, A.; Gomi, H.; Aihara, M. Auger recombination of photogenerated charges in one-dimensional Mott insulators. J. Phys. Soc. Jpn. 2011, 80, 084721:1–084721:10. [Google Scholar]
- Kawakami, Y.; Iwai, S.; Fukatsu, T.; Miura, M.; Yoneyama, N.; Sasaki, T.; Kobayashi, N. Optical modulation of effective on-site Coulomb energy for the Mott transition in an organic dimer insulator. Phys. Rev. Lett. 2009, 103, 066403:1–066403:4. [Google Scholar]
- Yonemitsu, K.; Miyashita, S.; Maeshima, N. Photoexcitation-energy-dependent transition pathways from a dimer Mott insulator to a metal. J. Phys. Soc. Jpn. 2011, 80, 084710:1–084710:14. [Google Scholar]
- Chollet, M.; Guerin, L.; Uchida, N.; Fukaya, S.; Shimoda, H.; Ishikawa, T.; Matsuda, K.; Hasegawa, T.; Ota, A.; Yamochi, H.; Saito, G.; Tazaki, R.; Adachi, S.; Koshihara, S. Gigantic photoresponse in 1/4-filled-band organic salt (EDO-TTF)2PF6. Science 2005, 307, 86–89. [Google Scholar]
- Onda, K.; Ogihara, S.; Yonemitsu, K.; Maeshima, N.; Ishikawa, T.; Okimoto, Y.; Shao, X.; Nakano, Y.; Yamochi, H.; Saito, G.; Koshihara, S. Photoinduced change in the charge order pattern in the quarter-filled organic conductor (EDO-TTF)2PF6 with a strong electron-phonon interaction. Phys. Rev. Lett. 2008, 101, 067403:1–067403:4. [Google Scholar]
- Iwai, S.; Yamamoto, K.; Kashiwazaki, A.; Hiramatsu, F.; Nakaya, H.; Kawakami, Y.; Yakushi, K.; Okamoto, H.; Mori, H.; Nishio, Y. Photoinduced melting of a stripe-type charge-order and metallic domain formation in a layered BEDT-TTF-based organic salt. Phys. Rev. Lett. 2007, 98, 097402:1–097402:4. [Google Scholar]
- Tanaka, Y.; Yonemitsu, K. Growth dynamics of photoinduced domains in two-dimensional charge-ordered conductors depending on stabilization mechanisms. J. Phys. Soc. Jpn. 2010, 79, 024712:1–024712:9. [Google Scholar]
- Miyashita, S.; Tanaka, Y.; Iwai, S.; Yonemitsu, K. Charge, lattice, and spin dynamics in photoinduced phase transitions from charge-ordered insulator to metal in quasi-two-dimensional organic conductors. J. Phys. Soc. Jpn. 2010, 79, 034708:1–034708:10. [Google Scholar]
- Kawakami, Y.; Fukatsu, T.; Sakurai, Y.; Unno, H.; Itoh, H.; Iwai, S.; Sasaki, T.; Yamamoto, K.; Yakushi, K.; Yonemitsu, K. Early-stage dynamics of light-matter interaction leading to the insulator-to-metal transition in a charge ordered organic crystal. Phys. Rev. Lett. 2010, 105, 246402:1–246402:4. [Google Scholar]
- Matsuzaki, H.; Matsuoka, T.; Kishida, H.; Takizawa, K.; Miyasaka, H.; Sugiura, K.; Yamashita, M.; Okamoto, H. Novel optical and magnetic bistability and photoinduced transition in a one-dimensional halogen-bridged binuclear Pt complex. Phys. Rev. Lett. 2003, 90, 046401:1–046401:4. [Google Scholar]
- Yonemitsu, K.; Miyashita, N. Coherence recovery and photoinduced phase transitions in one-dimensional halogen-bridged binuclear platinum complexes. Phys. Rev. B 2003, 68, 075113:1–075113:9. [Google Scholar]
- Okamoto, H.; Ishige, Y.; Tanaka, S.; Kishida, H.; Iwai, S.; Tokura, Y. Photoinduced phase transition in tetrathiafulvalene-p-chloranil observed in femtosecond reflection spectroscopy. Phys. Rev. B 2004, 70, 165202:1–165202:18. [Google Scholar]
- Yonemitsu, K. Interchain coupling effects on photoinduced phase transitions between neutral and ionic phases in an extended Hubbard model with alternating potentials and an electron-lattice coupling. Phys. Rev. B 2006, 73, 155120:1–155120:7. [Google Scholar]
- Uemura, H.; Okamoto, H. Direct detection of the ultrafast response of charges and molecules in the photoinduced neutral-to-ionic transition of the organic tetrathiafulvalene-p-chloranil solid. Phys. Rev. Lett. 2010, 105, 258302:1–258302:4. [Google Scholar]
- Yonemitsu, K. Effects of lattice and molecular phonons on photoinduced neutral-to-ionic transition dynamics in tetrathiafulvalene-p-chloranil. J. Phys. Soc. Jpn. 2011, 80, 084707:1–084707:9. [Google Scholar]
- Okamoto, H.; Ikegami, K.; Wakabayashi, T.; Ishige, Y.; Togo, J.; Kishida, H.; Matsuzaki, H. Ultrafast photoinduced melting of a spin-Peierls phase in an organic charge-transfer compound, K-tetracyanoquinodimethane. Phys. Rev. Lett. 2006, 96, 037405:1–037405:4. [Google Scholar]
- Maeshima, N.; Yonemitsu, K. Dynamics of photoexcited states in one-dimensional dimerized Mott insulators. Phys. Rev. B 2006, 74, 155105:1–155105:11. [Google Scholar]
- Maeshima, N.; Yonemitsu, K. Charge-transfer excitations in one-dimensional dimerized Mott insulators. J. Phys. Soc. Jpn. 2007, 76, 074713:1–074713:6. [Google Scholar]
- Maeshima, N.; Yonemitsu, K. Polaronic states with spin-charge-coupled excitation in a one-dimensional dimerized Mott insulator K-TCNQ. J. Phys. Soc. Jpn. 2008, 77, 074713:1–074713:6. [Google Scholar]
- Inoue, H.; Yonemitsu, K. Relaxation process in the photoinduced neutral-ionic paraelectric-ferroelectric phase transition in tetrathiafulvalene-p-chloranil. Phys. Rev. B 2007, 75, 235125:1–235125:13. [Google Scholar]
- Nagaosa, N. Theory of neutral-ionic transition in organic crystals. III. Effect of the electron-lattice interaction. J. Phys. Soc. Jpn. 1986, 55. [Google Scholar] [CrossRef]
- Iizuka-Sakano, T.; Toyozawa, Y. The role of long-range Coulomb interaction in the neutral-to-ionic transition of quasi-one-dimensional charge transfer compounds. J. Phys. Soc. Jpn. 1996, 65. [Google Scholar] [CrossRef]
- del Freo, L.; Painelli, A.; Soos, Z.G. Giant infrared intensity of the Peierls mode at the neutral-ionic phase transition. Phys.Rev. Lett. 2002, 89, 027402:1–027402:4. [Google Scholar]
- Yonemitsu, K. Lattice and magnetic instabilities near the neutral-ionic phase transition of the one-dimensional extended Hubbard model with alternating potentials in the thermodynamic limit. Phys. Rev. B 2002, 65, 205105:1–205105:8. [Google Scholar]
- Yonemitsu, K. Phase transition in a one-dimensional extended Peierls-Hubbard model with a pulse of oscillating electric field: II. Linear behavior in neutral-to-ionic transition. J. Phys. Soc. Jpn. 2004, 73, 2879:1–2879:17. [Google Scholar]
- Iwai, S.; Tanaka, S.; Fujinuma, K.; Kishida, H.; Okamoto, H.; Tokura, Y. Ultrafast optical switching from an ionic to a neutral state in tetrathiafulvalene-p-chloranil (TTF-CA) observed in femtosecond reflection spectroscopy. Phys. Rev. Lett. 2002, 88, 057402:1–057402:4. [Google Scholar]
- Takahashi, T.; Nogami, Y.; Yakushi, K. Charge ordering in organic conductors. J. Phys. Soc. Jpn. 2006, 75. [Google Scholar] [CrossRef]
- Seo, H.; Merino, J.; Yoshioka, H.; Ogata, M. Theoretical aspects of charge ordering in molecular conductors. J. Phys. Soc.Jpn. 2006, 75, 051009:1–051009:21. [Google Scholar]
- Tanaka, Y.; Yonemitsu, K. Charge order with structural distortion in organic conductors: Comparison between θ-(ET)2RbZn(SCN)4 and α-(ET)2I3. J. Phys. Soc. Jpn. 2008, 77, 034708:1–034708:10. [Google Scholar]
- Miyashita, S.; Yonemitsu, K. Spin and charge fluctuations and lattice effects on charge ordering in α-(BEDT-TTF)2I3. J. Phys. Soc. Jpn. 2008, 77. [Google Scholar] [CrossRef]
- Nishioka, K.; Yonemitsu, K. Theory of photoinduced melting of charge order in Et2Me2Sb[Pd(dmit)2]2. Phys. Status Solidi C 2012, in press.. [Google Scholar]
© 2012 by the authors; licensee MDPI, Basel, Switzerland. This article is an open-access article distributed under the terms and conditions of the Creative Commons Attribution license (http://creativecommons.org/licenses/by/3.0/).
Share and Cite
Yonemitsu, K. Theory of Photoinduced Phase Transitions in Molecular Conductors: Interplay Between Correlated Electrons, Lattice Phonons and Molecular Vibrations. Crystals 2012, 2, 56-77. https://doi.org/10.3390/cryst2010056
Yonemitsu K. Theory of Photoinduced Phase Transitions in Molecular Conductors: Interplay Between Correlated Electrons, Lattice Phonons and Molecular Vibrations. Crystals. 2012; 2(1):56-77. https://doi.org/10.3390/cryst2010056
Chicago/Turabian StyleYonemitsu, Kenji. 2012. "Theory of Photoinduced Phase Transitions in Molecular Conductors: Interplay Between Correlated Electrons, Lattice Phonons and Molecular Vibrations" Crystals 2, no. 1: 56-77. https://doi.org/10.3390/cryst2010056