
Role of Water Molecules to the Electronic States of M-DNA

Department of Physics, Tokyo Metropolitan University, Hachioji, Tokyo 192-0397, Japan
*
Authors to whom correspondence should be addressed.
Crystals 2015, 5(4), 475-490; https://doi.org/10.3390/cryst5040475
Submission received: 20 September 2015
/
Revised: 6 October 2015
/
Accepted: 10 October 2015
/
Published: 20 October 2015
(This article belongs to the Special Issue High Spin Molecules)
Abstract
:Various kinds of roles of the water molecules in the electronic states of the complexes of metal ions (M) and deoxyribonucleic acid (DNA) are reviewed. Divalent metal ions M like Fe, Mn, Zn and so on, form Metal-DNA complexes (M-DNA) with each metal ion between the bases of a base pair of DNA. The electronic states of the complexes depend on the species of ions in M-DNA. Metal ions in Fe-DNA and Mn-DNA possess 3d magnetic moments, but those in Zn-DNA do not. Interestingly, the magnetic property of the complexes, especially the magnetic interaction between the metal ions, is dominated by water molecules in the complexes. In Fe-DNA, the water molecules play a role of ligands for the iron ions, which controls the spin states of Fe3+, whereas they govern the magnetic interaction between the Mn2+ ions in Mn-DNA. In contrast, Zn-DNA has no 3d magnetic moment, but the water molecules dominate the bonding states of the Zn ions and the magnetic states of the Zn-DNA system.
1. Introduction
The electrical and magnetic properties of deoxyribonucleic acid (DNA) have attracted much interest in recent years because of their scientific interest and potential applications to self-assembled nanostructures and nanowires for nanoelectronics [1,2,3,4,5,6]. However, it has been known that the electronic states of DNA are semiconducting with the optical energy gap of ≈ 4 eV [7,8].
In 1993, Lee et al. reported that the divalent metal ions—Zn2+, Co2+ and Ni2+—bind to duplex DNA at pHs above 8 and cause a conformational change, i.e., a metal DNA complexes, M-DNA [9,10]. They understood that the metal ions substitute the imino protons of the base pairs of DNA, which is based on missing NMR signals of the hydrogen bonds of DNA base pairs. In 2001, Rakitin et al. reported that the electronic states of thus obtained Zn-DNA is metallic in the meaning that the semiconducting threshold voltage of ≈ 0.2 V observed in DNA without metal ions goes to zero in Zn-DNA [11]. In 2007, Omerzu et al. found a red-shift of the peak position by ≈ 0.1 eV in optical absorption of Zn-DNA [7].
In 2005, Mizoguchi et al. reported that the other divalent metal ions such as Mn2+, Fe2+ in addition to Zn2+ are also inserted between two complementary Watson-Crick base pairs in a simple aqueous solution of DNA and MCl2 [8,12,13,14,15,16,17,18,19]. These ions possess magnetic 3d electrons, which could play a valuable role as a probe for the electronic states of M-DNA. It was found that the electronic states of the complexes prepared in the aqueous solutions depend on the sample preparation procedures. Especially, the electronic states of Zn-DNA markedly depend on the drying procedure, which changes not only the water content, but also the bonding states of Zn and DNA bases [18]. In 2014, the UV/Vis absorption of M-DNA was thoroughly studied and unveiled the effect of M-DNA formation, for example, the formation mechanism of Fe-DNA with Fe3+ synthesized from FeCl2 and DNA [8].
In this report, we review the magnetic states of M-DNA, which are markedly affected by the water molecules in the system. It is known that the number of water molecules populated within DNA duplex depends on the relative humidity and temperature, and reaches 20 water molecules per base pair at most [20]. The water molecules in the living cells are important not only to isolate hydrophobic bases carrying life information from outside by surrounding hydrophilic DNA backbones, but also to dominate the electronic states of the metal ions of M-DNA.
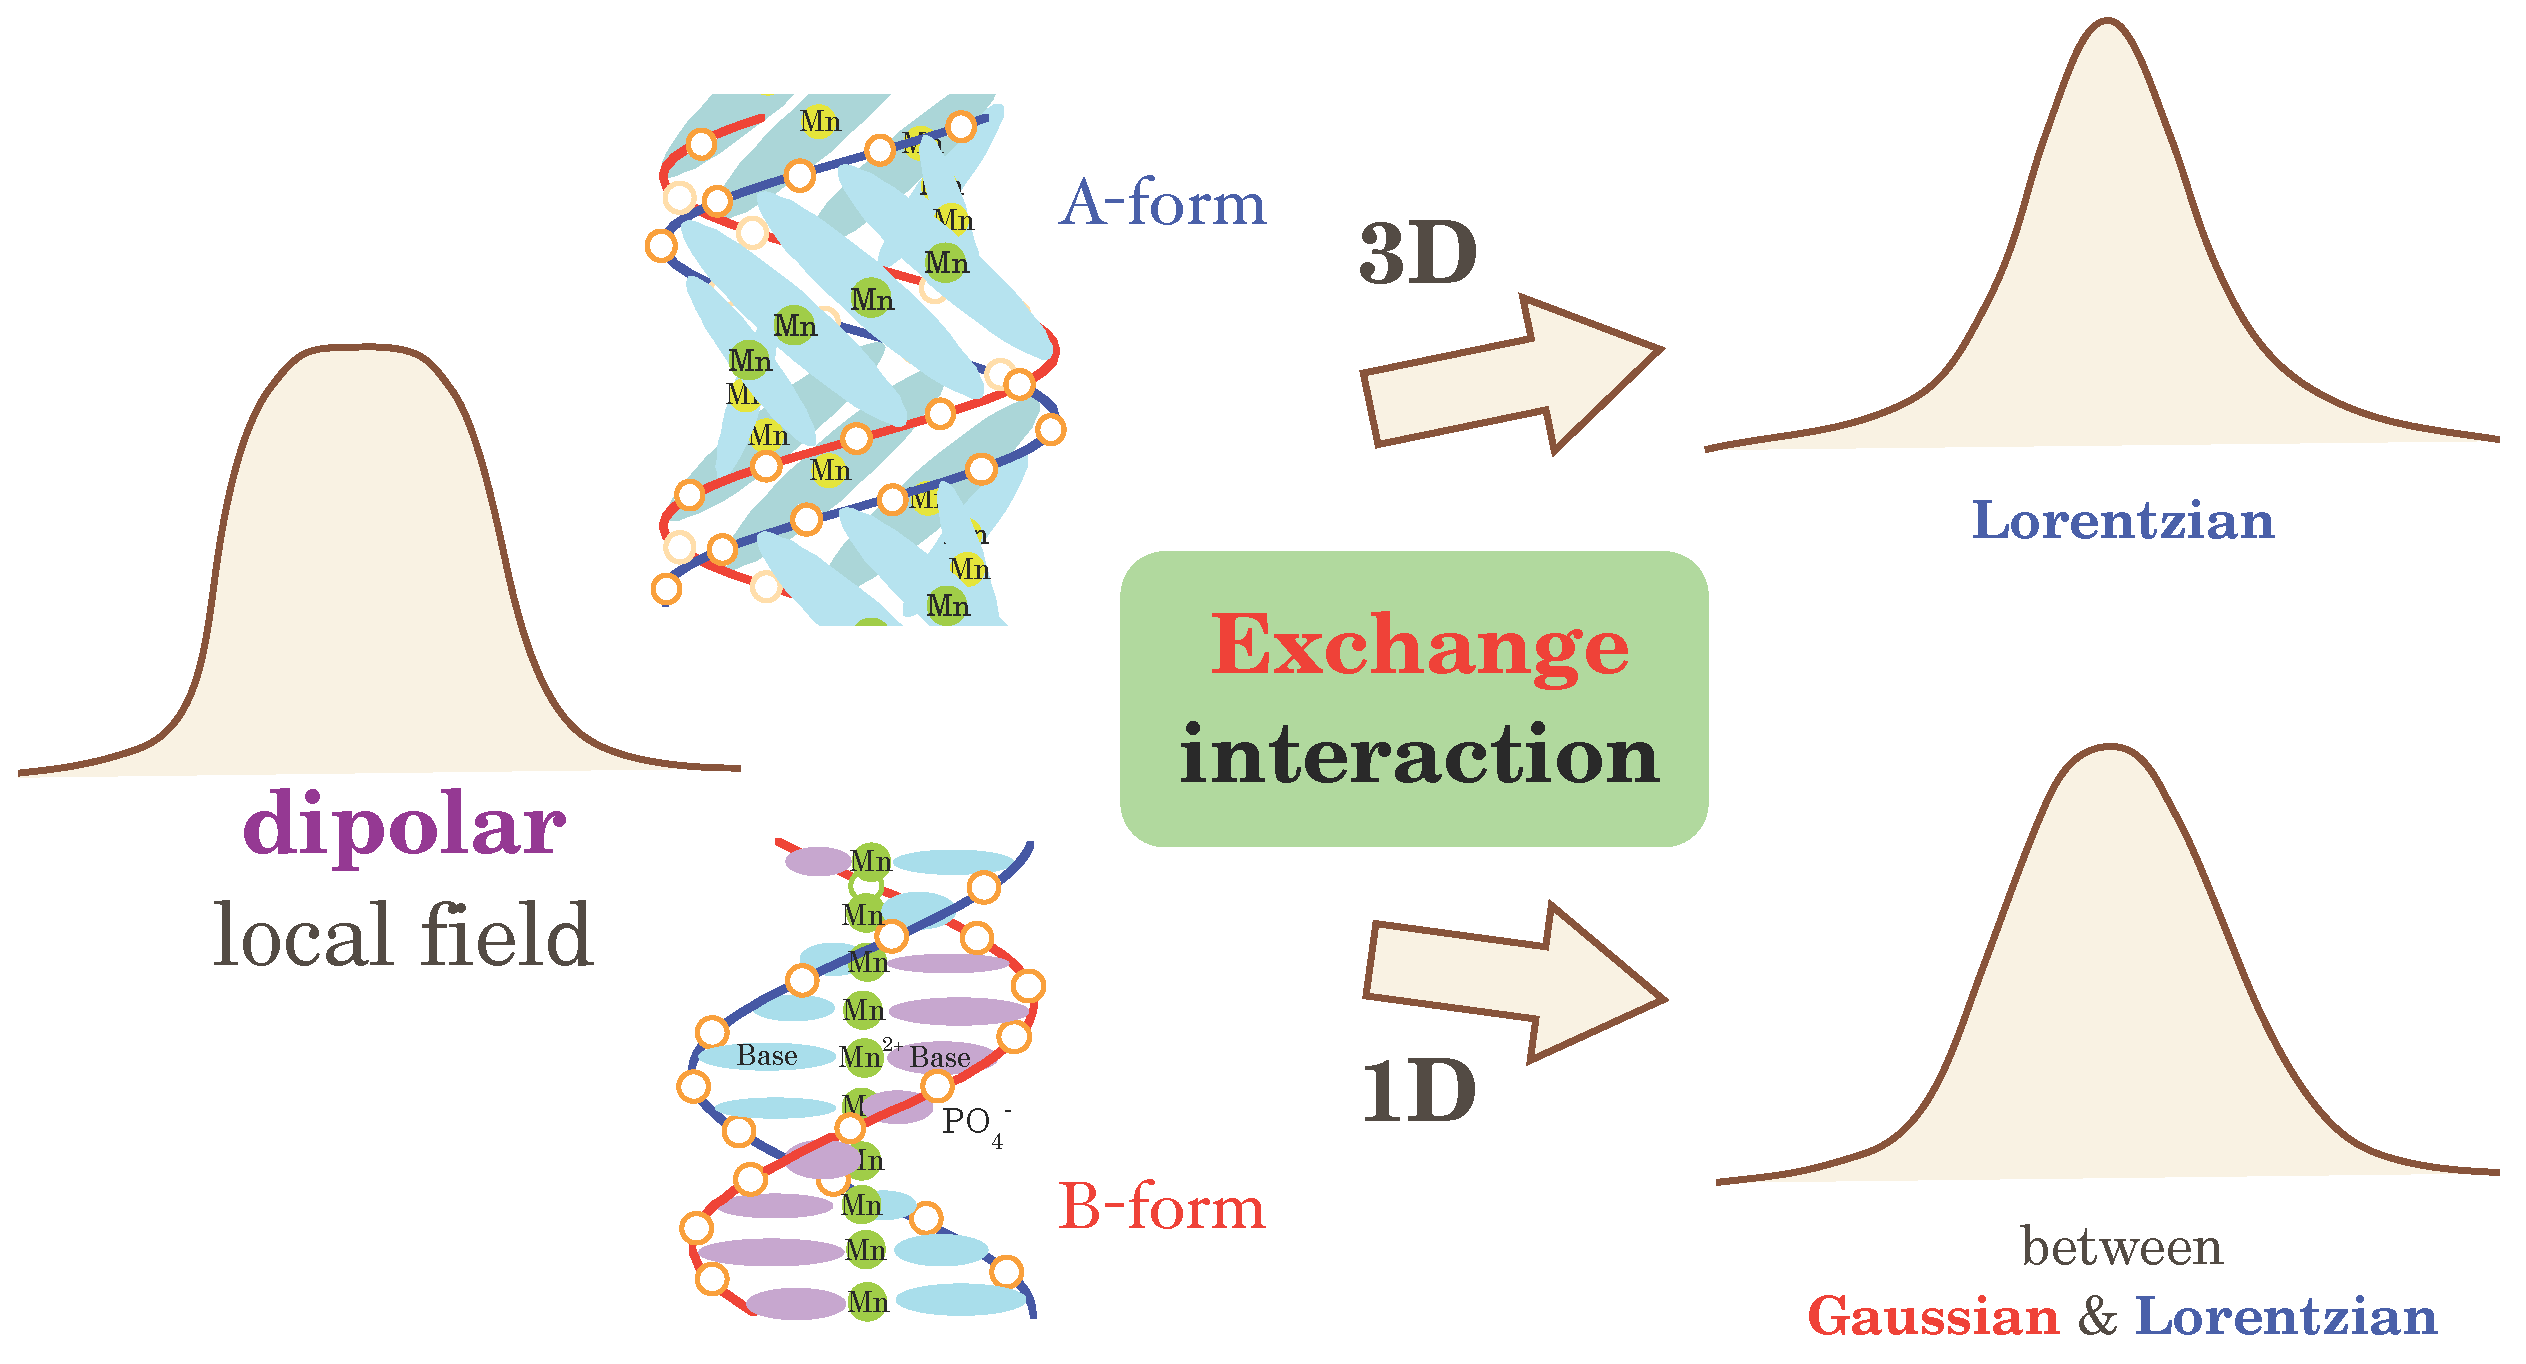
In Mn-DNA, Mn2+ ions—S-state ions—provide strong ESR signal with typically 50 mT of linewidth around g = 2, whose lineshape changes depending on two isomeric structures of DNA—B-form and A-form—as schematically described in Figure 1 [17]. B-form is stabilized in aqueous solutions like living cells and the Mn2+ ions form a nearly straight linear chain. In contrast, A-form appears in dried circumstances and the Mn2+ ions form a spiral one-dimensional (1D) chain, which governs the dimensionality of the exchange interaction between the Mn2+ ions. On the other hand, in an aqueous solution of Mn-DNA, in which random tumbling motion of DNA molecules invalidates the electron-electron dipolar interaction, ESR signal loses the broad dipolar width and shows a six hyperfine split spectrum caused by the nuclear spin of a Mn nucleus. However, it is usually considered that the isotropic exchange interaction between the Mn ions cannot be invalidated by the tumbling motion of DNA molecules. Then, the exchange interaction between the Mn ions should be invalidated because of the dynamic motion of the water molecules around them [21]. The electronic states of the Fe3+ ions in Fe-DNA are also dominated by the water molecules around them as ligands [19]. The bonding state and magnetic interaction in Zn-DNA show various features with the water content in the system from nonmagnetic state to Pauli paramagnetism [18]. These examples demonstrate the importance of water molecules in the magnetic interaction between the metal ions of M-DNA.
Figure 1.
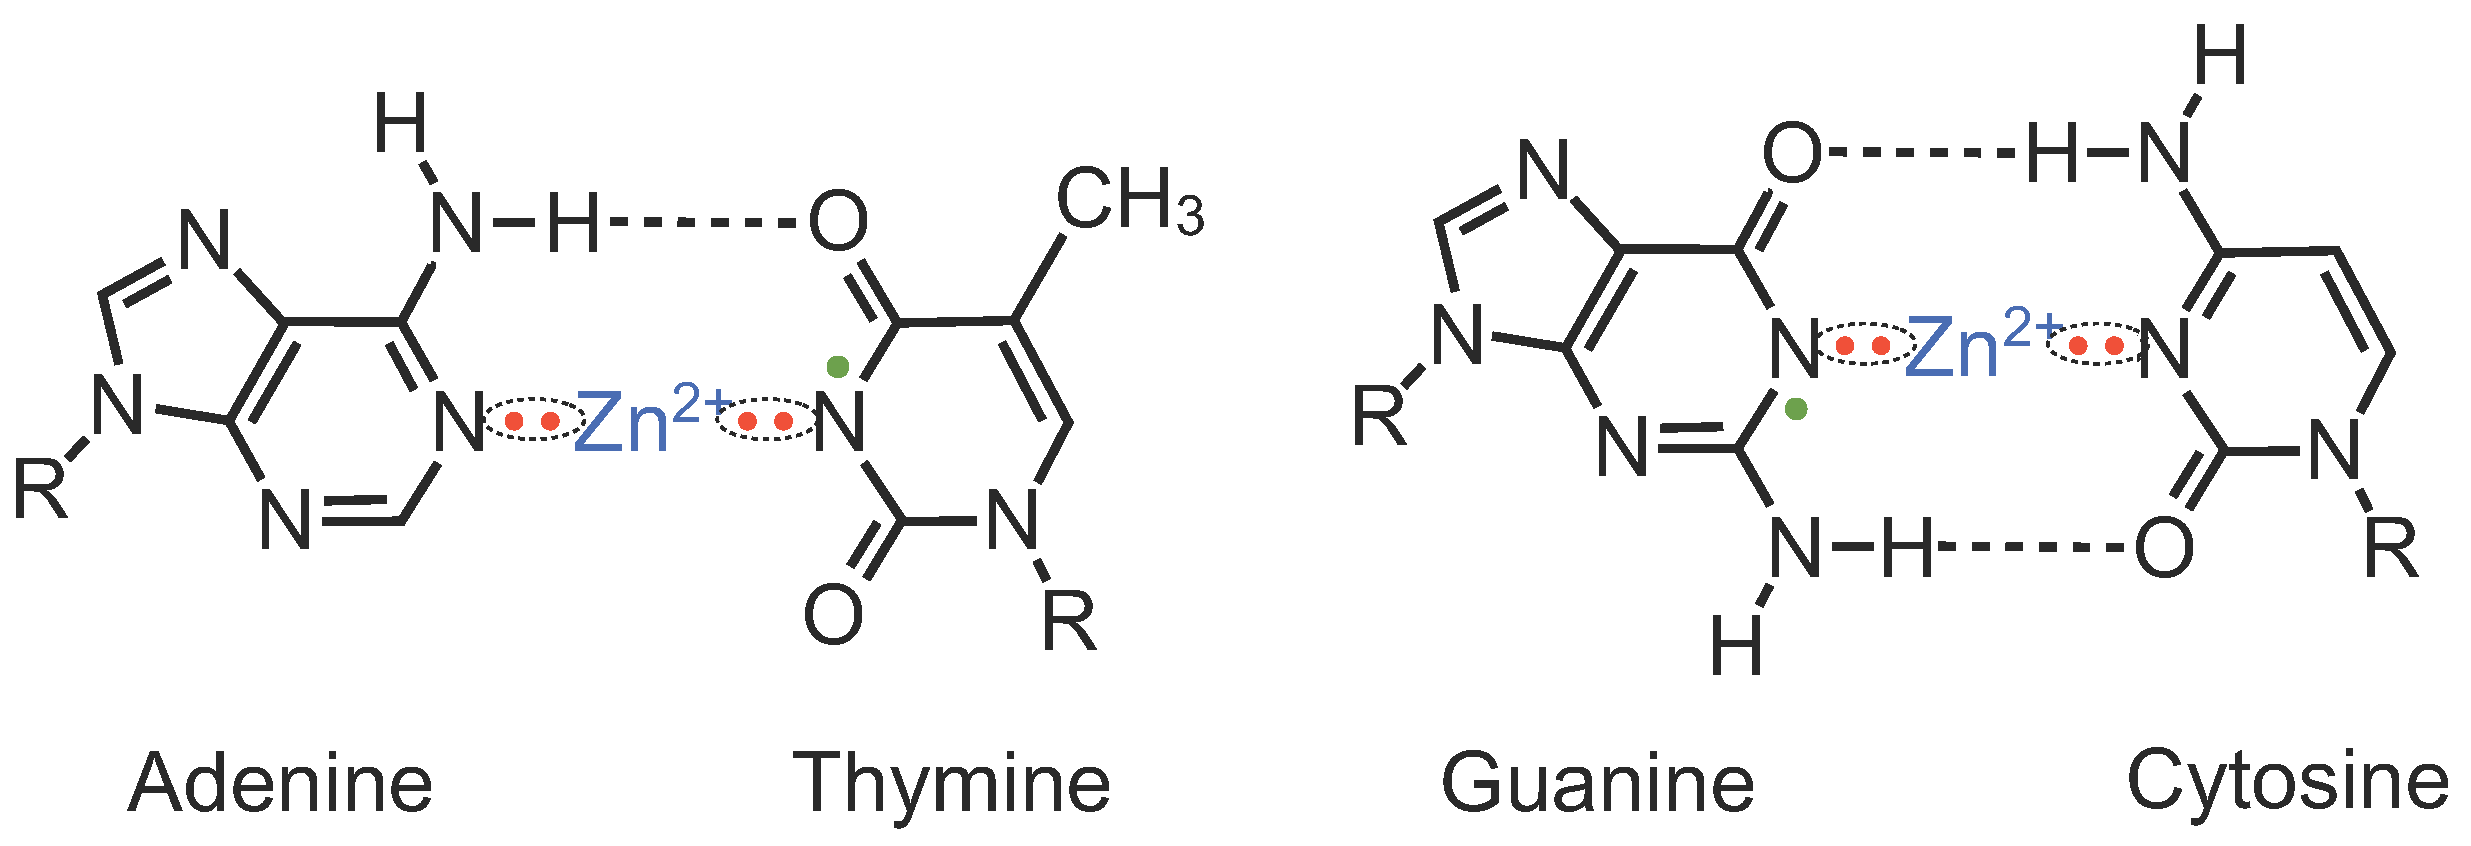
Schematic structures of (A) B-form and (B) A-form of Mn-DNA. Ellipsoids represent bases or base pairs. In the B-form, the Mn ions occupy the center axis of the double helix, whereas they form a coil in the A-form Mn-DNA (Reused from Ref. [13]). (C) The model structure of thymine–M–adenine (T–M–A) of M-DNA prepared by the ethanol precipitation method. A guanine–M–cytosine (G–M–C) unit also has a similar structure. Metal ions are hydrated by water molecules and form ionic coupling with two phosphate anions in DNA backbones (Reused from Ref. [17]).
Figure 1.
Schematic structures of (A) B-form and (B) A-form of Mn-DNA. Ellipsoids represent bases or base pairs. In the B-form, the Mn ions occupy the center axis of the double helix, whereas they form a coil in the A-form Mn-DNA (Reused from Ref. [13]). (C) The model structure of thymine–M–adenine (T–M–A) of M-DNA prepared by the ethanol precipitation method. A guanine–M–cytosine (G–M–C) unit also has a similar structure. Metal ions are hydrated by water molecules and form ionic coupling with two phosphate anions in DNA backbones (Reused from Ref. [17]).

2. Experimental Section
M-DNA is prepared with an aqueous solution of 2 mM DNA (salmon sperm DNA, hereafter, called B-DNA) supplied by three different sources—Wako Pure Chemical Industries, Ltd., the Ogata Materials Science Lab. and Sigma-Aldrich—and 20 mM MCl2 purchased from Wako Pure Chemicals and Sigma-Aldrich. Excess cold ethanol at −20 °C is poured into the transparent aqueous solution of DNA and MCl2, resulting in a transparent precipitate of M-DNA. The residual MCl2 in the obtained precipitate is washed out thoroughly with an excess amount of pure ethanol, in which DNA is insoluble. Thus, we obtained a pure M-DNA film without MCl2 or any other buffer materials. Since the divalent metal ions substitute for Na ions in the source DNA, Na ions are also absent in thus obtained M-DNAs. Except for Fe-DNA, all the M-DNA films are soluble in water.
Fe-DNA is synthesized in a mixture solution of DNA and FeCl2, in which Fe2+ transforms to Fe3+ by donating an electron to the bases of a base pair. The Fe3+ ions are hydrated by water molecules, which prevents the Fe ions from forming covalent bonds with the nitrogen atoms of the bases. Strong ionic bonds between Fe3+ and the transferred charge of the base pair in addition to the phosphate anions reinforce the binding of the duplex, and the binding between the neighboring duplexes by the reinforced electric dipole moments. Only Fe-DNA films are insoluble in water because of such reinforcements.
For the preparation of freeze-dried FD-Zn-DNA, an aqueous solution of Zn-DNA was dripped into a flask at liquid nitrogen temperature and frozen instantly. The flask was immersed in a low-temperature bath down to −15 °C and evacuated with a cold trap for several days to a week. The final product—completely dehydrated FD-Zn-DNA—has a white-colored, polystyrene form.
Samples for the measurements with a SQUID (superconducting quantum interference device) susceptometer and ESR were sealed in quartz tubes with He gas for thermal exchange.
3. Results and Discussion
This review is based on several published results on M-DNA [8,12,14,15,16,17,18,19]. Since the role of water molecules on the electronic states and magnetic interaction is characteristic of each metal ion, the following three sections treat Fe-DNA, Mn-DNA and Zn-DNA.
3.1. Fe-DNA
Fe-DNA is a characteristic complex in M-DNAs [8,13,14,15,16,17,19]. The source materials of Fe-DNA are a transparent aqueous solution of DNA and light greenish FeCl2, whereas Fe-DNA films show characteristic ocher color of FeCl3, as shown in Figure 2, which suggests the presence of Fe3+ in Fe-DNA as a result of a charge transfer from Fe2+ to DNA bases. XAFS (X-ray absorption fine structure) study also supports the valence state of Fe3+ in Fe-DNA [19]. The formation rate of Fe-DNA with Fe3+ depends on the species of base pairs—adenine–thymine or guanine–cytosine—as demonstrated by the UV/Vis absorption study [8]. Since Fe3+ with five d electrons like Mn2+ has (high-spin) or (low-spin) without the electron orbital moment, ESR signals of both Fe-DNA and B-form Mn-DNA are expected to appear around g = 2, as actually found in Figure 3A [13,14,16,19]. The B-form Mn-DNA has an ESR lineshape characteristic of 1D spin correlation of the exchange interaction between Lorentzian and Gaussian [17]. In contrast, Fe-DNA shows long tails more than ±0.1 T, which is attributable to the presence of three ESR components, as demonstrated in Figure 3B [19]. The corresponding multiplicity of the spin species also observed in the magnetization curve of Fe-DNA at 2 K, as shown in Figure 4. These observations suggest that both of the high-spin and the low-spin states of Fe3+ coexist in Fe-DNA. The ratio of the spin number N of the high-spin–the low-spin states is 1–3.35 on average. On the other hand, since the magnetization is proportional to N × S, the ratio of the saturation magnetization is 1–0.67.
The spin state of Fe3+ depends on local symmetry and magnitude of the crystal field around the Fe ion in Fe-DNA, in which water molecules surely play some role. As shown in Figure 1C, it was confirmed that the metal ions in M-DNA are hydrated by several water molecules and located between the bases of a base pair with ionic bonds to the negatively charged DNA [8,17]. An octahedral ligand field with six water molecules around the Fe3+ ions in Fe-DNA provides the high-spin state and a square planer ligand field with four water molecules does the low-spin state. Actually, the number of water molecules in Fe-DNA was controlled by evacuation. Complete evacuation at 300 K reduces the number ratio of the high-spin state–the low-spin state down to 1–5.67 from 1–3.35 [19], consistent with the above consideration.
Figure 2.
(A) FeCl3; (B) FeCl2; and (C) Fe-DNA. (Reused from Ref. [15]).
Figure 2.
(A) FeCl3; (B) FeCl2; and (C) Fe-DNA. (Reused from Ref. [15]).

Figure 3.
(A) An ESR spectrum of Fe-DNA taken at Q-band (≈ 35 GHz, 1.21 T corresponds to g = 2), together with a Mn-DNA spectrum; (B) A simulation of the ESR spectrum of Fe-DNA at room temperature with three Lorentzians—linewidths of 189 mT (dash-dotted line), 54 mT (dotted line) and 20 mT (dashed line)—. The broad and the medium signals are assigned to the high-spin state, and the low-spin one, of Fe3+, respectively. Since the π electrons are delocalized along the base stacking of the double helix, the ESR spectrum should be narrower than those of Fe3+.

Figure 4.
Magnetization curves of Fe-DNA at 2 K (the black dots). The dashed curves represent trial fittings, as a sum of the following supposed contributions. (A) Double Brillouin functions fitting of the high-spin state of with θ = 0 K and the low-spin state of with θ = −2.3 K of Fe3+ ions, and (B) Three Brillouin functions of the π electrons with θ = −45 K transferred from Fe2+ into the bases, in addition to with θ = 0 K and with θ = −2.7 K of Fe3+ ions.

In summary, the spin state of Fe3+ in Fe-DNA is determined by the coordination number of water molecules. Fe3+ has the high-spin state with six coordinated water molecules and the low-spin state with four water molecules.
3.2. Mn-DNA
Mn ESR spectra in Mn-DNA are shown in Figure 5A, demonstrating characteristics of the magnetic interaction in each form of Mn-DNA. A dominant magnetic interaction between the Mn ions in Mn-DNA depends on a sample form—A-form films, B-form films or B-form solutions—. In the film forms, the electronic dipolar interaction dominates the magnetism. In contrast, hyperfine split spectra of Mn ESR were observed in a solution form of Mn-DNA [17]. Tumbling motion of Mn-DNA molecules in solution invalidates the dipolar broadening, but does not necessarily invalidate the isotropic exchange interaction, which provides exchange narrowing and then, wipes out the hyperfine splitting. Thus, some additional consideration should be required for the interaction between the Mn ions in Mn-DNA solutions. Each situation is discussed in the following sections.
Figure 5.
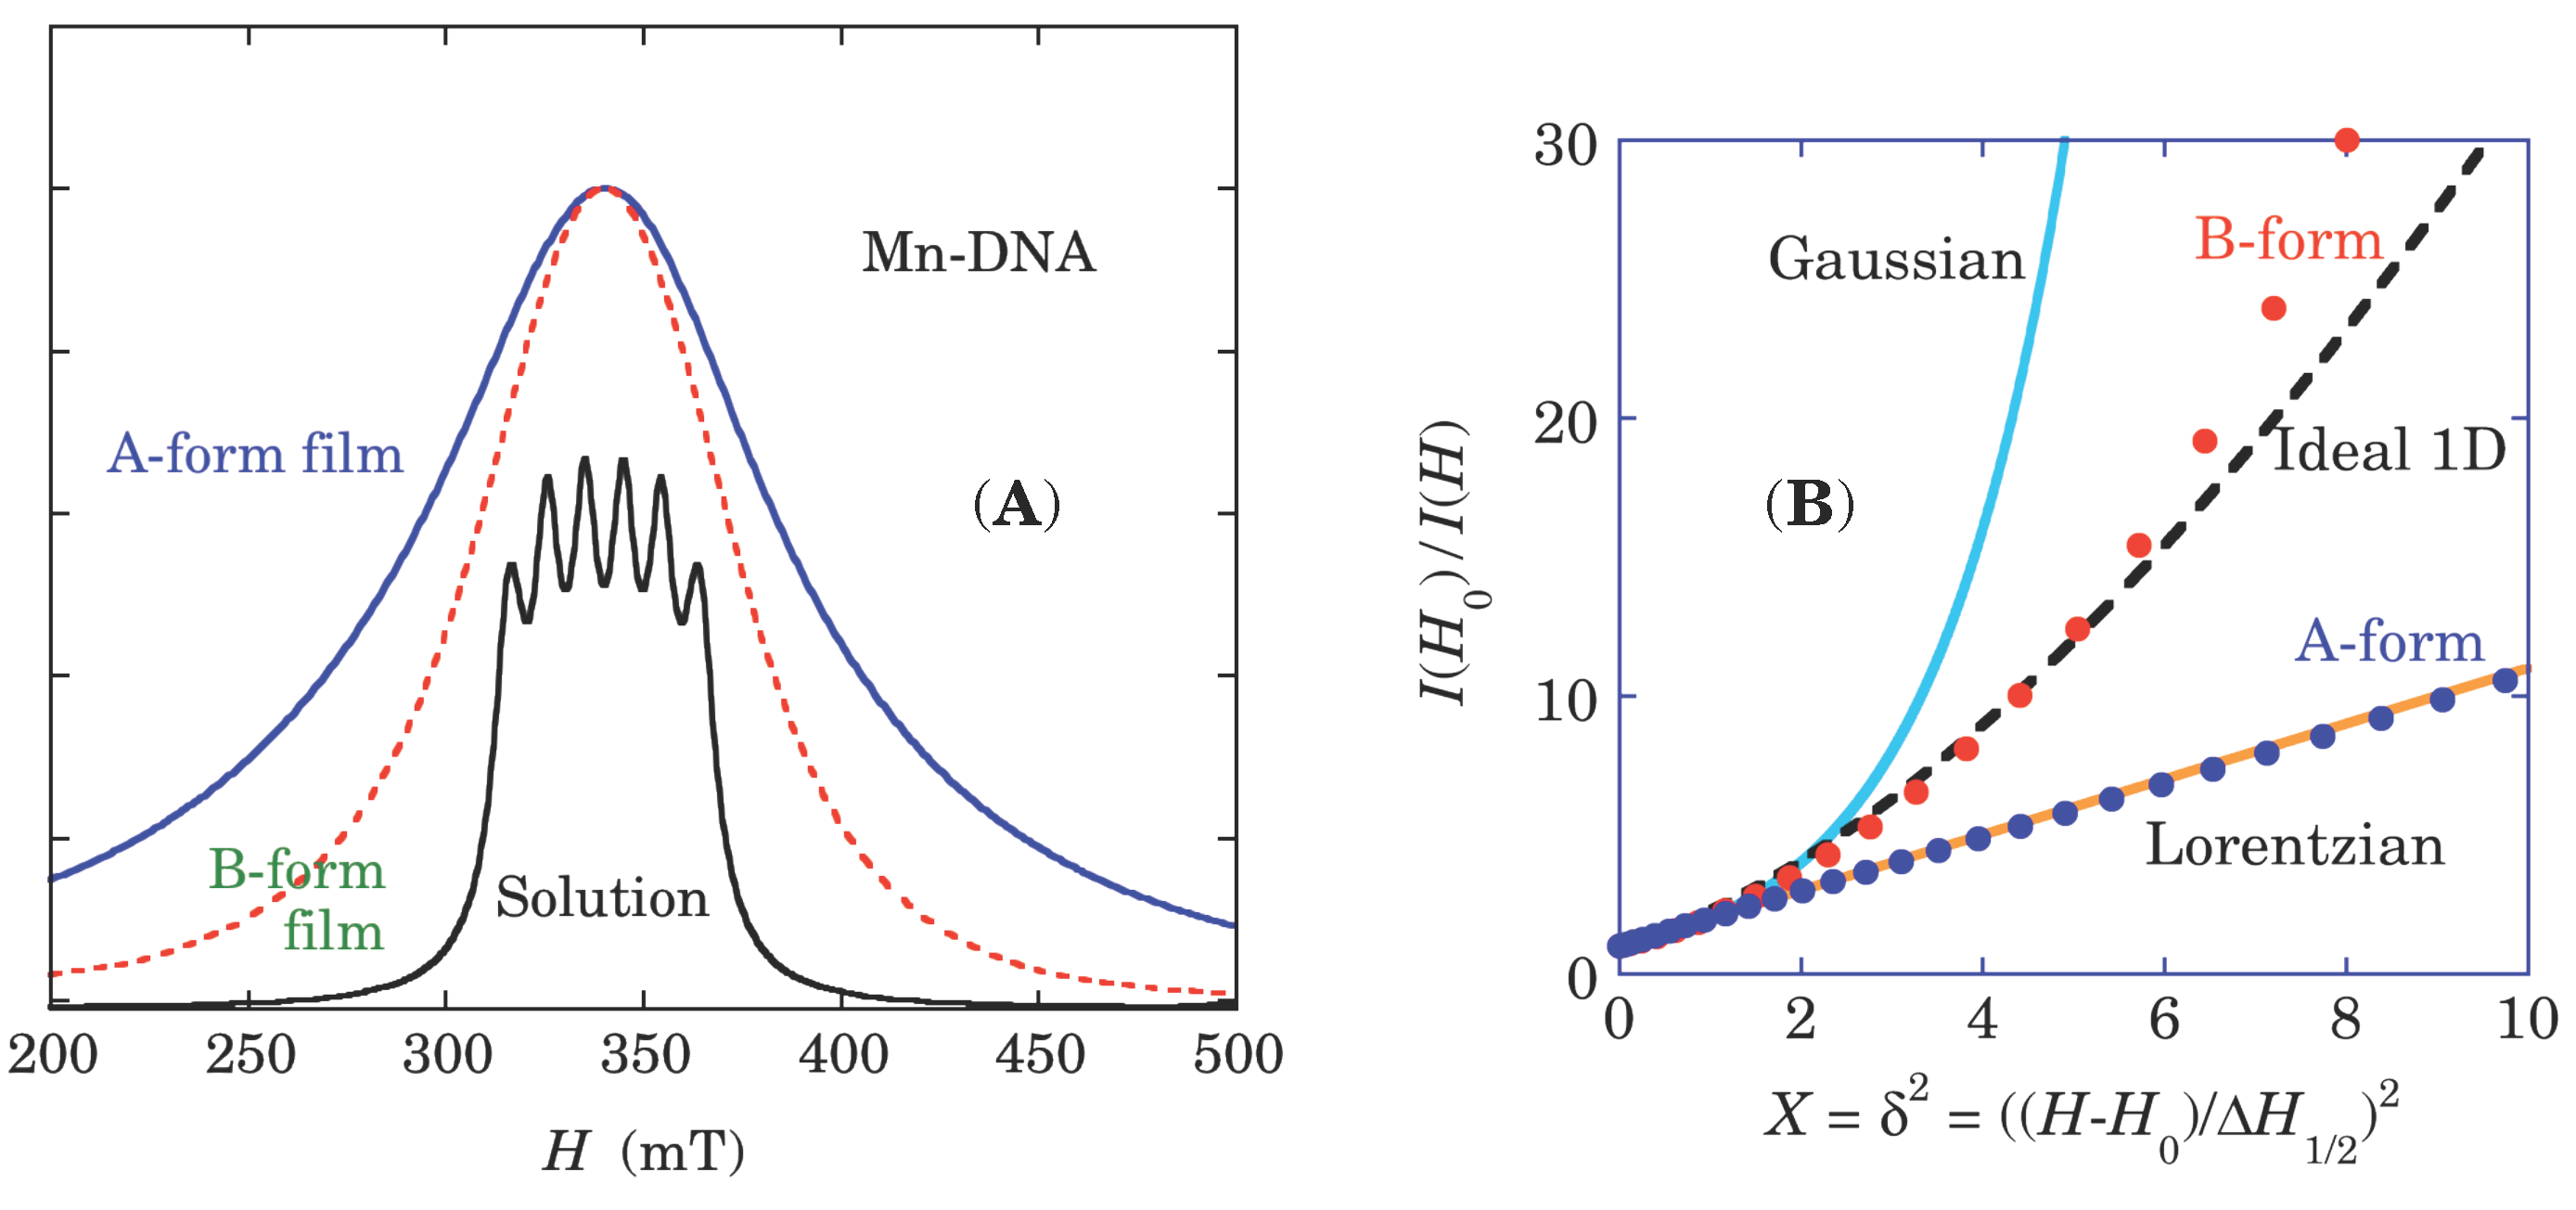
(A) ESR absorption spectra of A-form and B-form films, and B-form in solution of Mn-DNA at X-band (Reused from Ref. [17]). (B) The characteristic figure to analyze ESR lineshapes of the Mn-DNA films. The abscissa is a square of the magnetic field deviation from the resonance center H0 normalized by the half width at half height of the absorption spectrum. The ordinate is the inverse signal intensity I(H) normalized by the center height I(H0) (Reused from Ref. [13]).
Figure 5.
(A) ESR absorption spectra of A-form and B-form films, and B-form in solution of Mn-DNA at X-band (Reused from Ref. [17]). (B) The characteristic figure to analyze ESR lineshapes of the Mn-DNA films. The abscissa is a square of the magnetic field deviation from the resonance center H0 normalized by the half width at half height of the absorption spectrum. The ordinate is the inverse signal intensity I(H) normalized by the center height I(H0) (Reused from Ref. [13]).

3.2.1. Mn-DNA Films
The ESR linewidth of Mn-DNA films is consistent with the electronic dipolar broadening and the exchange interaction between the neighboring Mn ions [12]. The lineshapes of Mn ESR in Figure 5A show the marked difference between the A-form and the B-form films. Figure 5B shows a special figure to analyze ESR lineshapes of the Mn-DNA films. The straight line corresponds to a Lorentzian lineshape and the exponential line does to a Gaussian lineshape. The lineshape of the A-form Mn-DNA has Lorentzian and that of the B-form is well reproduced by the ideal 1D correlation of the exchange interaction [22]. These observations are consistent with the structural difference between the two isomeric forms—A-form and B-form. Figure 6 schematically describes the difference between the exchange narrowing in the A-form and the B-form Mn-DNA. Interestingly, the A-form Mn-DNA transformed from the B-form Mn-DNA by evacuation is not transformed back to the B-form Mn-DNA by only the humidity control, suggesting a stable form of the A-form Mn-DNA. Only dissolution of the A-form Mn-DNA in water recovers B-form [22,23].
As described in Figure 6, the exchange interaction is 3D in A-form with the intra- and the inter-DNA interactions, whereas in B-form, only the intra-DNA interaction between the ions with separation of ≈ 0.34 nm along a 1D ion chain is dominant, which is isolated by 2 nm from the neighboring chains. The magnetic properties of Mn-DNA reflect this difference [13]. Figure 7A compares the temperature dependence of the ESR linewidth in Mn-DNA. In the B-form Mn-DNA, negligible enhancement of the ESR linewidth is observed at low temperatures because of the 1D nature of the magnetic interaction. In contrast in the A-form Mn-DNA, the 3D magnetic interaction enhances the ESR linewidth with decreasing temperature below 50 K, which is ascribed to the increasing critical fluctuation of the Mn electron spins with approaching a critical temperature of a magnetic phase transition [24]. Figure 7B demonstrates the heat capacity of the A-form Mn-DNA with the peak of some magnetic ordering of the Mn ions around 0.4 K. The magnetic state below 0.4 K could be a spin-glass state or an antiferromagnetic state. Thus, this system is a good platform to investigate the magnetic properties with 1D and 3D electronic states.
Figure 6.
ESR lineshapes are caused by a dipolar field with Gaussian or box type form [23]. In the 1D systems like B-form, ESR spectra are incompletely averaged by the exchange interaction within a 1D array, which gives lineshape between Gaussian and Lorentzian [22], whereas ESR spectra are homogeneously averaged over the 3D systems like A-form by the exchange interaction, resulting in Lorentzian lineshape.


3.2.2. Mn-DNA Solution
There are two interesting points in the spectrum of the Mn-DNA solution in Figure 5A. One is the separation of the hyperfine splittings and the other is the reason why the hyperfine split spectrum survives even with isotropic exchange interaction.
Firstly, in the Mn-DNA solution, the separation A0 between the two center peaks of the six hyperfine spectra in Figure 5A is 9.62 mT [17,19]. It is known that A0 reflects the bonding nature of Mn2+ ions [25]. Table 1 shows an example of the observed A0 of Mn2+ ions embedded in the calcium halides and chalcogenides [25]. The ionicity is a measure of the bonding nature between the ionic bond and the covalent bond. Comparing the observed value of 9.62 mT of the Mn-DNA solution with Table 1, the ionic nature of the Mn2+ ions in Mn-DNA is suggested, giving rise to the model of M-DNA in Figure 1C.

| Host | CaF2 | CaO | CaCl2 | CaS |
|---|---|---|---|---|
| A0 (mT) for Mn2+ | 10.1 | 9.18 | 9.11 | 8.11 |
| Degree of ionicity | 0.90 | 0.80 | 0.79 | 0.68 |
Secondly, consider why the hyperfine interaction survived in the Mn-DNA solution. Rapid tumbling motion of Mn-DNA wipes out the electron-electron dipolar interaction, but cannot do the isotropic exchange interaction. Thus, there must be something to interrupt the isotropic exchange interaction in the solution. It is known that the hydrogen bond contributes to the superexchange interaction between the magnetic ions [21]. On the basis of the Curie–Weiss temperature of −2 K in the A-form Mn-DNA and −0.8 K in the B-form Mn-DNA, the exchange interaction in Mn-DNA depends on the isomeric form, although the separation between the Mn ions in the A-form Mn-DNA is similar to that in the B-form Mn-DNA [17]. Thus, it is suggested that the water molecules in Mn-DNA also contribute to the superexchange interaction. However, in the Mn-DNA solutions, the superexchange interaction averages negligibly small dynamically by the rapid motion of the water molecules in and out of the DNA duplex, giving rise to the survived hyperfine split spectra. On the other hand, in the Mn-DNA films with almost immobile water molecules in the DNA duplex, the hyperfine splitting is completely wiped out by the strong static exchange interaction in both isomers. With the Curie–Weiss temperatures, ωexch = 2kB/ℏ ≈ 2.6 × 10¹¹ s−1 (≈ 1.5 T) in the A-form Mn-DNA and 0.8kB/ℏ ≈ 1.1 × 10¹¹ s−1 (≈ 0.6 T) in the B-form Mn-DNA, which are much larger than the hyperfine strength ωhf = 1.8 × 10⁹ s−1 (0.01 T).
3.3. Zn-DNA
It has been reported that the electronic states of Zn-DNA prepared at pHs above 8 are metallic with Pauli like paramagnetic susceptibility [11,26]. However, Zn-DNA prepared with the ethanol precipitation method from aqueous solutions of DNA and MCl2 described in Section 2 did not necessarily agrees with such conclusion [19]. A systematic study of Zn-DNA under the control of water content in the system has revealed important roles of the water molecules in a Zn-DNA duplex [18,19]. The roles of the water molecules are arranged below.
- (1)
- In a step of synthesis with aqueous solutions, the metal ions in M-DNA are hydrated by water molecules, which prevent the metal ions from forming covalent bonds with the nitrogens of the bases of a base pair, resulting in the ionic bonds of the metal ions with the phosphate anions of DNA backbones.
- (2)
- In drying procedure of Zn-DNA after ethanol precipitation, complete evacuation of the water molecules from Zn-DNA by freeze-drying procedure promotes covalent bonding of the metal ions with the nitrogens of the bases in place of the imino hydrogen atoms of guanine and thymine bases, which generates a π spin system in the DNA bases, as shown in Figure 8.
- (3)
- The π electron system of the freeze-dried Zn-DNA (FD-Zn-DNA) has a band width of ≈ 0.24 eV and the electronic states of the π electrons are governed by the water molecules in the FD-Zn-DNA duplex.
- (4)
- FD-Zn-DNA without water molecules is nonmagnetic (Only the Zn-DNA diamagnetism is observed.) because of the charge ordering (CO) ground state as a result of the off-site Coulomb energy V between the neighboring base–M–base molecules, which is larger than the on-site Coulomb energy U. This is based on the size of A–Zn–T and G–Zn–C molecules of ≈ 1.5 nm, which is much larger than the distance of ≈ 0.34 nm between the molecules.
- (5)
- FD-Zn-DNA with water molecules shows Pauli paramagnetism because of a suppression of CO ground state with the decreased off-site Coulomb energy V, which is caused by the screening effect of the hydrating water molecules on the π electron charges of A–Zn–T and G–Zn–C molecules.
Figure 8.
A model of the electronic states of A–Zn–T and G–Zn–C molecules of FD-Zn-DNA. All the hydrated water molecules are removed by the freeze-drying procedure from the structure shown in Figure 1C. Zn ions prefer to form configurational bonds in place of the imino hydrogen atoms of the guanine and thymine bases. Note that the adenine and cytosine bases have no imino protons. As a result, one unpaired electron on the nitrogen atom provides spin per base pair (bp) (Reused from Ref. [18]).

3.3.1. FD-Zn-DNA
Samples are prepared by the ethanol precipitation method from aqueous solutions of DNA and ZnCl2. The characteristic aspects of the samples are (1) high purity Zn-DNA without any residual salts, (2) ionic bonding of hydrated Zn2+ ions with phosphate anions of DNA backbones. The physical properties of the samples are almost the same as those of B-DNA, such as diamagnetism + nonlinear paramagnetism of magnetic impurities and UV/Vis absorption spectra [8,18,19]. With elimination of almost all the water molecules from Zn-DNA by the freeze-drying procedure, FD-Zn-DNA is obtained with the Zn2+ ions covalently bonded to the nitrogen atoms of bases. The electronic states of FD-Zn-DNA are sensitive to water molecules, which is quite different from Zn-DNA.
Figure 9 shows the magnetization curves of B-DNA, Zn-DNA and FD-Zn-DNAs. On the basis of a systematic study with the freeze-drying procedure in B-DNA and Zn-DNAs, it has been concluded that the paramagnetic contributions with saturation in all the samples of this figure are caused by the impurities in B-DNA and Zn-DNAs [18,19], which behave like ferromagnetism or superparamagnetism under the dried conditions. Strong ESR signals at X-band were also observed in the freeze-dried systems of B-DNA and Zn-DNA with the intensity independent of temperature down to 10 K, which is consistent with the ferromagnetic systems.
Figure 9.
Magnetization per unit containing one base pair of B-DNA and various Zn-DNAs at 100 K [18]. Open diamonds represent the diamagnetism of as-received salmon DNA (B-DNA). Closed circles show the magnetization of Zn-DNA dried in air (“Air”) with diamagnetism of Zn-DNA and small paramagnetism. FD-Zn-A and FD-Zn-B represent the magnetization of two different batches of the freeze dried Zn-DNA with much larger nonlinear paramagnetism than that of the Zn-DNA dried in air. The solid straight lines on FD-Zn-A is almost parallel to the diamagnetism of B-DNA. In contrast, the baseline of FD-Zn-B represented by the dashed line clearly contains the additional linearly increasing paramagnetism with the magnetic field B over the diamagnetism of B-DNA (Reused from Ref. [18]).

In contrast, the paramagnetism proportional to the applied magnetic field, as observed in the base line of FD-Zn-B, was ascribed to the nature of the π spin system of FD-Zn-DNA with some water molecules. Figure 10 shows the evolution of the experimental steps of FD-Zn-DNAs with the sample names of FD-Zn-A and FD-Zn-B. Details are as follows.
- (1)
- Figure 10A shows the magnetization of FD-Zn-A under the evacuated condition, in which the diamagnetism of Zn-DNA and the saturating magnetization of the impurities are observed.
- (2)
- Figure 10B describes the magnetization of FD-Zn-B, a different batch from FD-Zn-A, with a little more water molecules than FD-Zn-A, in which the small paramagnetism of the π spin system proportional to the magnetic field and the saturating one of impurity with a weaker amplitude than that of FD-Zn-A case, in addition to the diamagnetism of Zn-DNA, are found.
- (3)
- With additional water molecules in FD-Zn-B in Figure 10C, the increased paramagnetism of the π spin system and further suppression of the impurity magnetization are observed.
- (4)
- Figure 10D shows that much more water molecules suppress almost of the saturating impurity magnetization. Only the π spin paramagnetism and the Zn-DNA diamagnetism remains.
Figure 10.
Magnetization curves of FD-Zn-DNA at 300 K. (A) FD-Zn-A and (B) FD-Zn-B are prepared from the same source materials but belong to different freeze-drying batches. (C) FD-Zn-B1 was FD-Zn-B exposed to an “air+humidity” condition to introduce water molecules into the sample. (D) FD-Zn-B2 was further exposed to the same condition. The solid straight lines in the above panels represent the baselines and the saturation lines of nonlinear magnetization. The dotted lines describe the diamagnetism of Zn-DNA. (Reused from Ref. [18].)

Figure 11 shows the temperature dependence of the paramagnetism of the π spin system. The solid curve represents the Curie–Weiss law with the Weiss temperature of 820 K, which fails to reproduce the data. The possible interpretation is the Pauli paramagnetism of the highly correlated π spin system with a narrow electron band width, where N(EF) = 12.4 states/eV is the density of states at the Fermi energy with χpara = 4.0 × 10⁻⁴ emu/mol-bp. Since FD-Zn-DNA has A-form with 3D band, the π band width is estimated to be 0.24 eV with the 3D free electron model. The mechanism of the transformation from the nonmagnetic state to the Pauli paramagnetism is discussed in the next section.
Figure 11.
Temperature dependence of the paramagnetic susceptibility χpara of FD-Zn-B2, which was obtained by subtracting the diamagnetism of Zn-DNA, the oxygen contamination, and the small nonlinear paramagnetism shown in Figure 10D from the SQUID susceptibility data. The solid curve represents the least-squares fit to the Curie–Weiss law, which is in poor agreement with the data (Reused from Ref. [18].).

3.3.2. Nature of FD-Zn-DNA
As discussed in the previous section, the new paramagnetic species are generated by the freeze-drying procedure applied to Zn-DNA. Anomalous magnetic behavior of the new spin system is found that the dehydrated FD-Zn-DNA is nonmagnetic, whereas Pauli paramagnetism is carried by the spin system of FD-Zn-DNA with water molecules. Since it is not a rational assumption that the newly appeared π spin system is generated simply by the addition of the water molecules to FD-Zn-DNA, we proposed a model, as shown in Figure 8, that the freeze-dried Zn-DNA carries the π electron system, which is just generated by the freeze-drying procedure. The water molecules between the metal ion and the nitrogen atoms of the bases of a base pair prevent the metal ion from forming covalent bonds with the nitrogen atoms. The freeze-drying removes such water molecules and helps for the metal ion to form configurational covalent bonds in place of the imino hydrogen atom with one electron in guanine or thymine, which makes the number of electrons of a base–Zn–base molecule odd, that is, the π spin system is generated. Then, the freeze-drying to achieve complete evacuation of the water molecules from Zn-DNA would be a critical condition to generate the π electron spin system. Simple evacuation of Zn-DNA at 300 K did not help to attain the π spin system generation, but the freeze-drying made it possible. One reason is that the freezing invalidates molecular motion and rearrangement of the water molecules in the Zn-DNA duplex, which provides spatial path ways for the water molecules to escape from the duplex.
Thus, it is suggested that the possible mechanisms of the nonmagnetic behavior in the dehydrated FD-Zn-DNA are some singlet and nonmagnetic ground states like a special configuration of antiferromagnetism (AF) or spin density wave (SDW), spin Peierls (SP), charge density wave (CDW), or charge ordering (CO). Since the present sample is in powder form, there is no possibility of the special configuration of AF or SDW with the magnetic field parallel to the spontaneous magnetization. The Peierls instability of the DNA systems concerning on SP or CDW seems to be implausible because of the sizable structural disorder inherent in DNA. The last candidate is the CO state, in which the off-site Coulomb energy V is a crucial parameter other than the on-site Coulomb energy U. From the value of the estimated U and V by Starikov [27], V is comparable to or larger than U in AT-AT and GC-GC pairs, which suggests the strong possibility of the CO state in the dehydrated FD-Zn-DNA. Since the π electrons would delocalize over each base–Zn–base molecule to reduce their kinetic energy, the fact that the molecular size more than 1.5 nm of base–Zn–base is much larger than the separation of ≈ 0.34 nm between the neighboring base–Zn–base molecules would cause the condition V>U. Thus, the π electrons prefer the alternate double occupancy instead of the single occupancy of every A–Zn–T or G–Zn–C molecule, by paying a cost of U in place of V, resulting in the insulating CO state with the repetition (... 0 : −2e : 0 : −2e : 0 ...) along the direction of the DNA duplex.
The present model for the nonmagnetic state of the dehydrated FD-Zn-DNA is consistent with the Pauli paramagnetism of the hydrated FD-Zn-DNA. The water molecules play an important role in reducing the off-site Coulomb energy V between the π electrons of the neighboring base–Zn–base molecules. The electronic charges of the π electrons of base–Zn–base molecules are strongly screened by the surrounding water molecules with the large dielectric constant of ≈ 80. As a result, the off-site Coulomb energy V is suppressed by the water molecules, but the on-site Coulomb energy U is not affected. Then, the new condition V<U is realized in the hydrated FD-Zn-DNA, which revives the metallic π electron band with the Pauli paramagnetism from the nonmagnetic and insulating CO ground state with the alternate double occupancy of the π electrons. Finally, the present model for FD-Zn-DNA describes successfully the intrinsic part of the anomalous magnetic behavior, which demonstrates the important role of the water molecules with the screening effect as a determining factor of the magnetic property in the metal ion-DNA complexes.
4. Conclusions
The electronic states and the magnetic property of M-DNAs with M = Fe, Mn and Zn are reviewed. From the viewpoints of DNA structures and controlling water molecules, the magnetic data are analyzed to obtain characteristic features of each species of the metal ions in the DNA systems. In Fe-DNA, the water molecules dominate the spin state of Fe3+.
In Mn-DNA, the water molecules govern the magnetic interaction between the neighboring Mn ions via dimensionality of the Mn ion network through the structural change between 3D in A-form and 1D in B-form, and via dynamical control of the superexchange interaction by the water molecules.
In Zn-DNA, the presence of water molecules governs the electronic states of the metal ions—ionic bond or covalent bond—. The freeze-drying procedure promotes the covalent bond between the metal ions and the nitrogen atoms of bases, in place of the imino hydrogen, accompanied with the generation of the new π electron system on the G–Zn–C and A–Zn–T molecules. The electronic states of FD-Zn-DNA with the covalent bonds are also dominated by the water molecules through their screening effect on the π charges of the large sized molecules of G–Zn–C and A–Zn–T. FD-Zn-DNA without water molecules shows the CO nonmagnetic state, which transforms into the Pauli paramagnetic state with the screening agent of water molecules.
Finally, it was demonstrated that the metal ions in the DNA systems show variety of features controlled by the water molecules in the systems, which are valuable to investigate further and apply the ideas and consideration to the other systems and applications, for example, a possibility of spin transport switching with M-DNA complexes by water molecules.
Acknowledgments
The present review is based on the large contribution by many graduate and undergraduate students from 2002 to 2013 at Tokyo Metropolitan University. The authors, Kenji Mizoguchi and Hirokazu Sakamoto, would like to express their sincere thanks to them. One of the authors (Kenji Mizoguchi) thanks Naoya Ogata (the Ogata Materials Science Lab.) for kindly providing us salmon-sperm DNA. This work was supported by the Joint Studies Program (2004-2006, 2009-2010) of the Institute for Molecular Science. This work was also supported by MEXT KAKENHI on Priority Area (17067015), and by JSPS KAKENHI (C) (22540371).
Author Contributions
Kenji Mizoguchi planned the research, analyzed the data and prepared the manuscript. Hirokazu Sakamoto organized the experimental setups, collected the data, discussed interpretations of the results with Kenji Mizoguchi and read the manuscript critically.
Conflicts of Interest
The authors declare no conflict of interest.
References
- Fink, H.W.; Schönenberger, C. Electrical conduction through DNA molecules. Nature 1999, 398, 407–410. [Google Scholar] [CrossRef] [PubMed]
- De Pablo, P.J.; Moreno-Herrero, F.; Colchero, J.; Gómez Herrero, J.; Herrero, P.; Baró, A.M.; Ordejón, P.; Soler, J.M.; Artacho, E. Charge transport in DNA. Phys. Rev. Lett. 2000, 85, 4992–4995. [Google Scholar] [CrossRef] [PubMed]
- Porath, D.; Bezryadin, A.; Vries, S.D.; Dekker, C. Direct measurement of electrical transport through DNA molecules. Nature 2000, 403, 635–638. [Google Scholar] [CrossRef] [PubMed]
- Tran, P.; Alavi, B.; Gruner, G. Charge transport along the λ-DNA double Helix. Phys. Rev. Lett. 2000, 85, 1564–1567. [Google Scholar] [CrossRef] [PubMed]
- Kasumov, A.Y.; Kociak, M.; Guéron, S.; Reulet, B.; Volkov, V.T.; Klinov, D.V.; Bouchiat, H. Proximity-induced superconductivity in DNA. Science 2001, 291, 280–282. [Google Scholar] [CrossRef] [PubMed]
- Zhang, Y.; Austin, R.H.; Kraeft, J.; Cox, E.C.; Ong, N.P. Insulating behavior of λ-DNA on the micron scale. Phys. Rev. Lett. 2002, 89. [Google Scholar] [CrossRef]
- Omerzu, A.; Mihailović, D.; Anželak, B.; Turel, I. Optical spectra of wet and dry M-DNA. Phys. Rev. B 2007, 75. [Google Scholar] [CrossRef]
- Tsuburaya, M.; Sakamoto, H.; Mizoguchi, K. Electronic states of DNA and M-DNA studied by optical absorption. Phys. Rev. E 2014, 89. [Google Scholar] [CrossRef]
- Lee, J.S.; Latimer, L.J.P.; Reid, R.S. A cooperative conformational change in duplex DNA induced by Zn2+ and other divalent metal ions. Biochem. Cell Biol. 1993, 71, 162–168. [Google Scholar] [CrossRef] [PubMed]
- Wood, D.O.; Dinsmore, M.J.; Bare, G.A.; Lee, J.S. M-DNA is stabilised in G·C tracts or by incorporation of 5-fluorouracil. Nucleic Acids Res. 2002, 30, 2244–2250. [Google Scholar] [CrossRef] [PubMed]
- Rakitin, A.; Aich, P.; Papadopoulos, C.; Kobzar, Y.; Vedeneev, A.S.; Lee, J.S.; Xu, J.M. Metallic Conduction through Engineered DNA: DNA nanoelectronic building blocks. Phys. Rev. Lett. 2001, 86, 3670–3673. [Google Scholar] [CrossRef] [PubMed]
- Mizoguchi, K.; Tanaka, S.; Ogawa, T.; Shiobara, N.; Sakamoto, H. Magnetic study of the electronic states in B-DNA and M-DNA doped with metal ions. Phys. Rev. B 2005, 72. [Google Scholar] [CrossRef]
- Mizoguchi, K.; Tanaka, S.; Ojima, M.; Sano, S.; Nagatori, M.; Sakamoto, H.; Yonezawa, Y.; Aoki, Y.; Sato, H.; Furukawa, K.; et al. AF-like Ground State of Mn-DNA and Charge Transfer from Fe to Base-π-Band in Fe-DNA. J. Phys. Soc. Jpn. 2007, 76. [Google Scholar] [CrossRef]
- Mizoguchi, K. Physical properties of natural DNA and metal ion inserted M-DNA. Proc. SPIE 2008, 7040. [Google Scholar] [CrossRef]
- Mizoguchi, K. Electronic states of M-DNA incorporated with divalent metal ions. Proc. SPIE 2010, 7765. [Google Scholar] [CrossRef]
- Mizoguchi, K. Metal incorporated M-DNA: Structure, magnetism, optical absorption. Proc. SPIE 2011, 8103. [Google Scholar] [CrossRef]
- Nagatori, M.; Ojima, M.; Ibuki, Y.; Sakamoto, H.; Mizoguchi, K. Electronic states of metal ions incorporated in Mn-DNA. J. Phys. Soc. Jpn. 2011, 80. [Google Scholar] [CrossRef]
- Kumeta, T.; Sakamoto, H.; Mizoguchi, K. Freeze-dried Zn-DNA: Magnetism dominated by water molecules. J. Phys. Soc. Jpn. 2014, 83. [Google Scholar] [CrossRef]
- Mizoguchi, K.; Sakamoto, H. DNA Engineering: Properties and Applications; PanStanford Publishing: Singapore, 2015; in press. [Google Scholar]
- Falk, M.; Poole, A.G.; Goymour, C.G. Infrared Study of the water in the hydration shell of DNA. Can. J. Chem. 1970, 48, 1536–1542. [Google Scholar] [CrossRef]
- O’neal, K.R.; Brinzari, T.V.; Wright, J.B.; Ma, C.; Giri, S.; Schlueter, J.A.; Wang, Q.; Jena, P.; Liu, Z.; Musfeldt, J.L. Pressure-Induced Magnetic Crossover Driven by Hydrogen Bonding in CuF2(H2O)2 (3-chloropyridine). Sci. Rep. 2014, 4. [Google Scholar] [CrossRef] [PubMed]
- Hennessy, M.J.; Mcelwee, C.D.; Richards, P.M. ESR lineshape and anisotropic exchange couplings. Phys. Rev. B 1973, 7, 930–947. [Google Scholar] [CrossRef]
- Abragam, A. The Principles of Nuclear Magnetism; Oxford University Press: Oxford, UK, 1961. [Google Scholar]
- Mori, H.; Kawasaki, K. Antiferromagnetic resonance absorption. Progr. Theor. Phys. 1962, 28, 971–987. [Google Scholar] [CrossRef]
- Zhitomirskii, A.N. Relationship between the degree of ionic character of a bond and the EPR hyperfine coupling constant for monotypal binary crystals doped with manganese. J. Struct. Chem. 1968, 9, 532–535. [Google Scholar] [CrossRef]
- Omerzu, A.; Anželak, B.; Turel, I.; Štrancar, J.; Potočnik, A.; Arčon, D.; Arčon, I.; Mihailović, D.; Matsui, H. Strong Correlations in Highly Electron-Doped Zn(II)-DNA Complexes. Phys. Rev. Lett. 2010, 104. [Google Scholar] [CrossRef]
- Starikov, E.B. Role of electron correlations in deoxyribonucleic acid duplexes: Is an extended Hubbard Hamiltonian a good model in this case? Philos. Mag. Lett. 2003, 83, 699–708. [Google Scholar] [CrossRef]
© 2015 by the authors; licensee MDPI, Basel, Switzerland. This article is an open access article distributed under the terms and conditions of the Creative Commons Attribution license (http://creativecommons.org/licenses/by/4.0/).
Share and Cite
MDPI and ACS Style
Mizoguchi, K.; Sakamoto, H. Role of Water Molecules to the Electronic States of M-DNA. Crystals 2015, 5, 475-490. https://doi.org/10.3390/cryst5040475
AMA Style
Mizoguchi K, Sakamoto H. Role of Water Molecules to the Electronic States of M-DNA. Crystals. 2015; 5(4):475-490. https://doi.org/10.3390/cryst5040475
Chicago/Turabian StyleMizoguchi, Kenji, and Hirokazu Sakamoto. 2015. "Role of Water Molecules to the Electronic States of M-DNA" Crystals 5, no. 4: 475-490. https://doi.org/10.3390/cryst5040475