1. Introduction
The interactions between a material surface and surrounding biological environments plays a crucial role in many biomedical device and tissue engineering applications [
1,
2]. Factors such as the elasticity and porosity of the material as well as the surface topography and surface chemistry have been shown to play important roles in guiding cell fate. To control biointerfacial interactions through surface chemistry many sophisticated surface modification strategies have been developed. These approaches include the fabrication of polymeric coatings to prevent biofouling, such as the grafting of poly(ethylene glycol) [
3,
4,
5], polyacrylamide [
6,
7,
8], poly(
N-hydroxy methacrylamide) [
9] and poly(
N-hydroxy acrylamide) [
10] or zwitterionic polymer coatings [
11,
12], amongst others. Through the simultaneous or subsequent immobilisation of bioactive signals such as peptides onto these non-fouling backgrounds it is possible to generate surfaces capable of directing specific cellular responses such as attachment and proliferation. However, it remains challenging with such approaches to incorporate multiple signals into the coatings and the precise lateral locality of these signals cannot be readily controlled. In order to generate surface patterns with distinct chemical regions many approaches have been put forward such as dip-pen nanolithography and polymer pen nanolithography [
13], UV photolithography [
14] and e-beam lithography [
15], which can assist in the formation of chemical patterns through, e.g., selective removal of a top layer exposing the underlying material, to name a few. However, currently available techniques for chemical surface patterning normally require specialised equipment and are not suitable for the high throughput fabrication of patterns.
In addition to surface chemistry, the topography of a surface at the micron and sub-micron length scale has been shown to influence the cellular response and, with respect to stem cells, differentiation [
16,
17,
18,
19,
20]. For example, mesenchymal stem cells (MSCs) cultured on surfaces defined by a square arrangement of nanopits with a diameter of 120 nm and a depth of 100 nm, where the distance between pit centres was 300 nm, experienced a down regulation of canonical and metabolic signalling. This in turn led to a reduced change in phenotype, whereas MSCs cultured on substrates where the pits had up to 50 nm offset in
X and
Y direction, hence disrupting the symmetry of surface features, experienced osteogenic differentiation [
16]. While it is obvious at this point in time that sophisticated control over the surface topography can provide better control over the biological response to material surfaces, most approaches available today to generate surface structures at the relevant sizes are costly and not suitable for high throughput approaches. However, for the efficient screening of multiple factors influencing the cellular response, high throughput methods are a promising candidate and have proven themselves in related fields, such as the development of novel drugs. Furthermore, it remains difficult to simultaneously alter surface chemistry as well as topography.
Colloidal crystal assemblies represent a promising platform to modify surfaces by simultaneously altering surface chemistry and topography. More importantly, binary colloidal assemblies are capable of producing highly ordered structures, which can be readily controlled by the particle size, size ratio of the particles and number of small particles with respect to large particles. This approach has mostly only been used for the manufacture of masks to generate surface patterns when combined with other deposition methods and subsequent removal of the particles [
21,
22,
23,
24]. However, binary colloidal assemblies have recently also been proposed as cell culture substrates [
25]. Due to their versatility and cost efficiency many methods have been proposed for the fabrication of colloidal crystal assemblies. These include the assembly of particles at the water/air interface and subsequent transfer to a support material [
26], vertical deposition [
27,
28], spin coating [
29,
30], template-assisted self-assembly [
31] and evaporation induced self-assembly on flat substrates [
25,
32]. Among these, solvent evaporation remains a popular choice due to lack of need for specialised equipment. In this approach, a suspension containing the colloidal particles is drop cast into a confined surface area and the suspension medium is evaporated either at room temperature or at slightly elevated temperatures. Colloidal crystal assemblies have already been used to generate binary patterns of biomolecules with high spatial resolution whilst remaining a cost efficient technique [
33].
In the current study a mathematical algorithm to quantitatively determine the degree of uniformity within binary colloidal assemblies was developed. The degree of uniformity is an essential quality control measure for these assemblies, and an important factor when comparing results between experiments, batches or studies. The degree of uniformity is also of particular importance in biomedical applications where it has been shown that, not only the presence of bioactive signals and the spacing between them, but also the degree of uniformity with which they are presented, plays a crucial role in guiding the cellular response [
34,
35].
We believe that the methodology presented here will find broad application in the field of colloidal assemblies to quantitatively describe the integrity and quality of assemblies.
2. Results
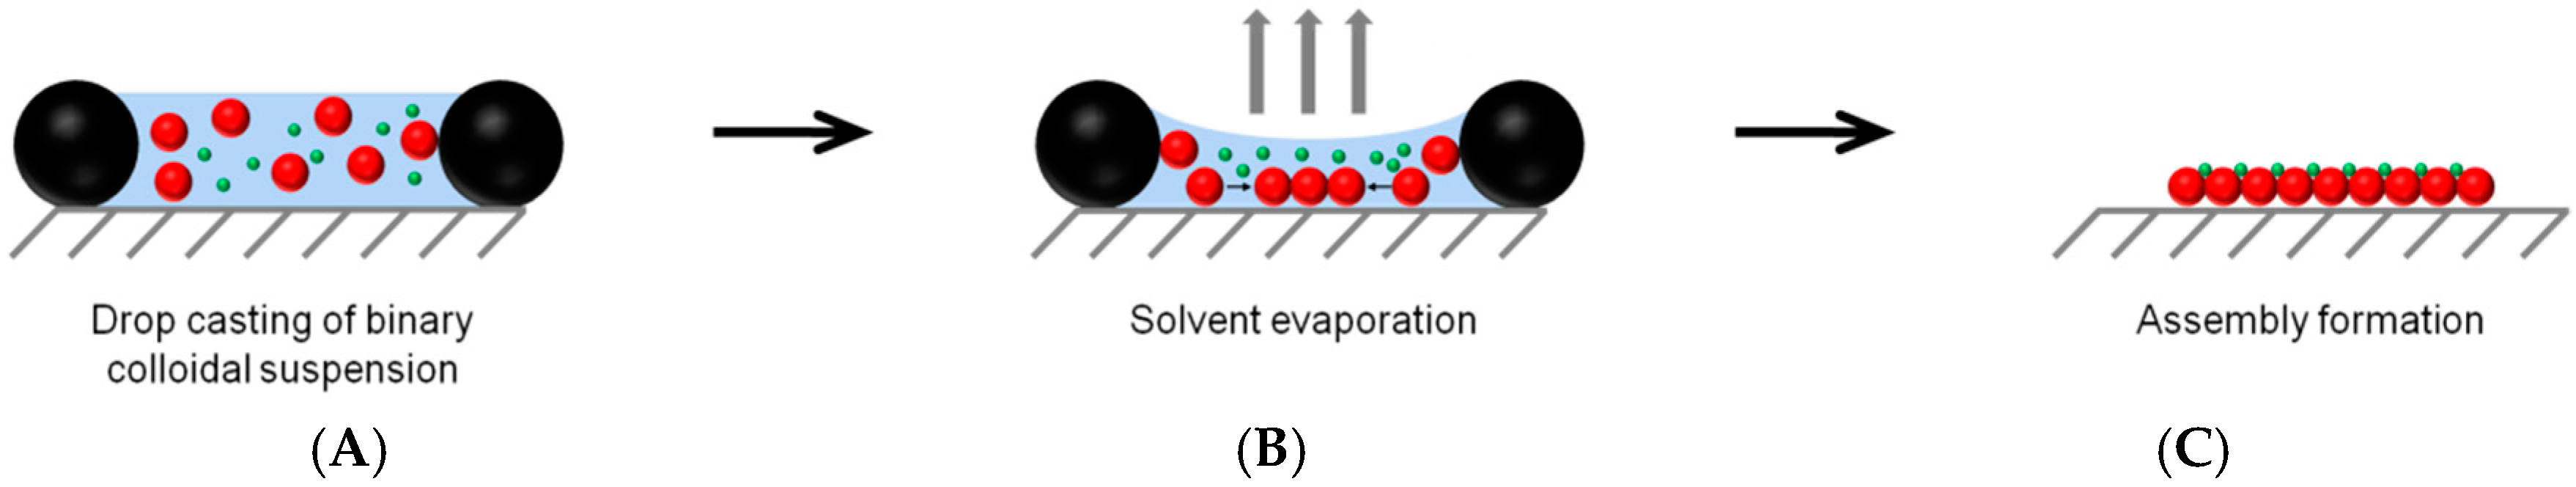
Surface topography and chemistry at high lateral resolution are of great importance to govern the cellular response towards a material. In this context, the formation of highly ordered binary colloidal crystals (BCC) represents a promising way to generate surface features with different surface chemistries at sub-micron resolution. The ease of fabrication over large surface areas as well as the comparatively inexpensive experimental equipment required further contributes to the increasing use of colloidal assemblies in the field of biomedical research. The assembly process is schematically shown in
Figure 1. Initially, a binary colloidal suspension is drop-cast onto a hydrophilic substrate where the available surface area is confined by a rubber O-ring. Upon evaporation of the suspension media the particles begin to settle and finally form a colloidal crystal arrangement. The factors influencing the formation of highly ordered BCCs were recently described in more detail [
25].
Until today, the uniformity within BCCs has not been described quantitatively, making it hard to compare different BCCs with one another.
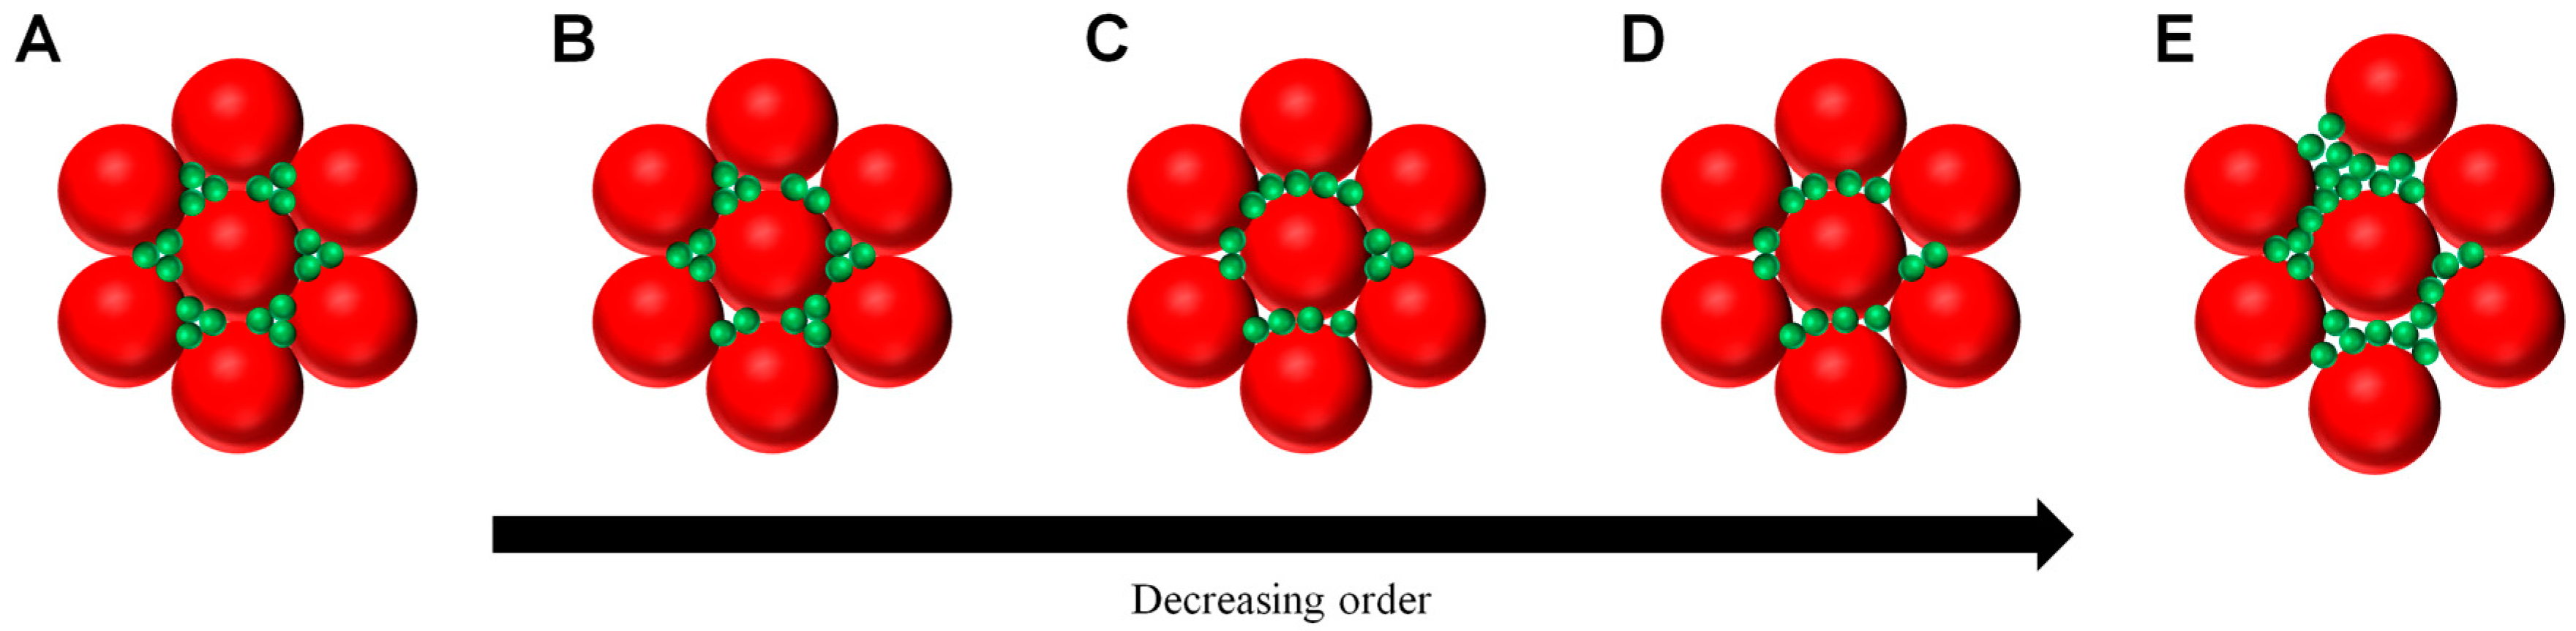
Figure 2 schematically depicts the different degrees of uniformity that can be found in binary crystal assemblies. Whereas
Figure 2A shows a completely homogeneous arrangement of small particles in the interstitial spaces of the large particles more displacements of small particles is observed in
Figure 2B,C.
Figure 2D shows a completely random placement of particles around the central large particle which still form a highly ordered hexagonally close packed (hcp) structure. A completely disordered structure is shown in
Figure 2E with displacement of the large particles occurring.
Defect areas in colloidal crystal assemblies of single particles as well as binary systems occur frequently towards the edges of the assembly and if the evaporation rate of the suspension medium is not controlled adequately. Such defects in BCCs can range from unequal placement of small particles in the interstitial spaces and even to the presence of areas without assembly formation. It is of great importance for a range of applications to determine the extend of such defects quantitatively to control the qualtity of the formed colloidal crystal assembly.
In order to quantitatively assess the degree of homogeneity within the BCCs we developed a software program utilizing image processing methods primarily based on the Circle Hough Transform and distance calculations. Briefly, the software calculates the number of small particles located around each of the large particles. Those areas of the image where a high number of small particles are located around each large particle are classified as highly uniform, while those particles with fewer smaller particles surrounding it are classified as either partially ordered or disordered. It needs to be mentioned here that the developed software can also be applied to determine the uniformity within single particle colloidal crystals.
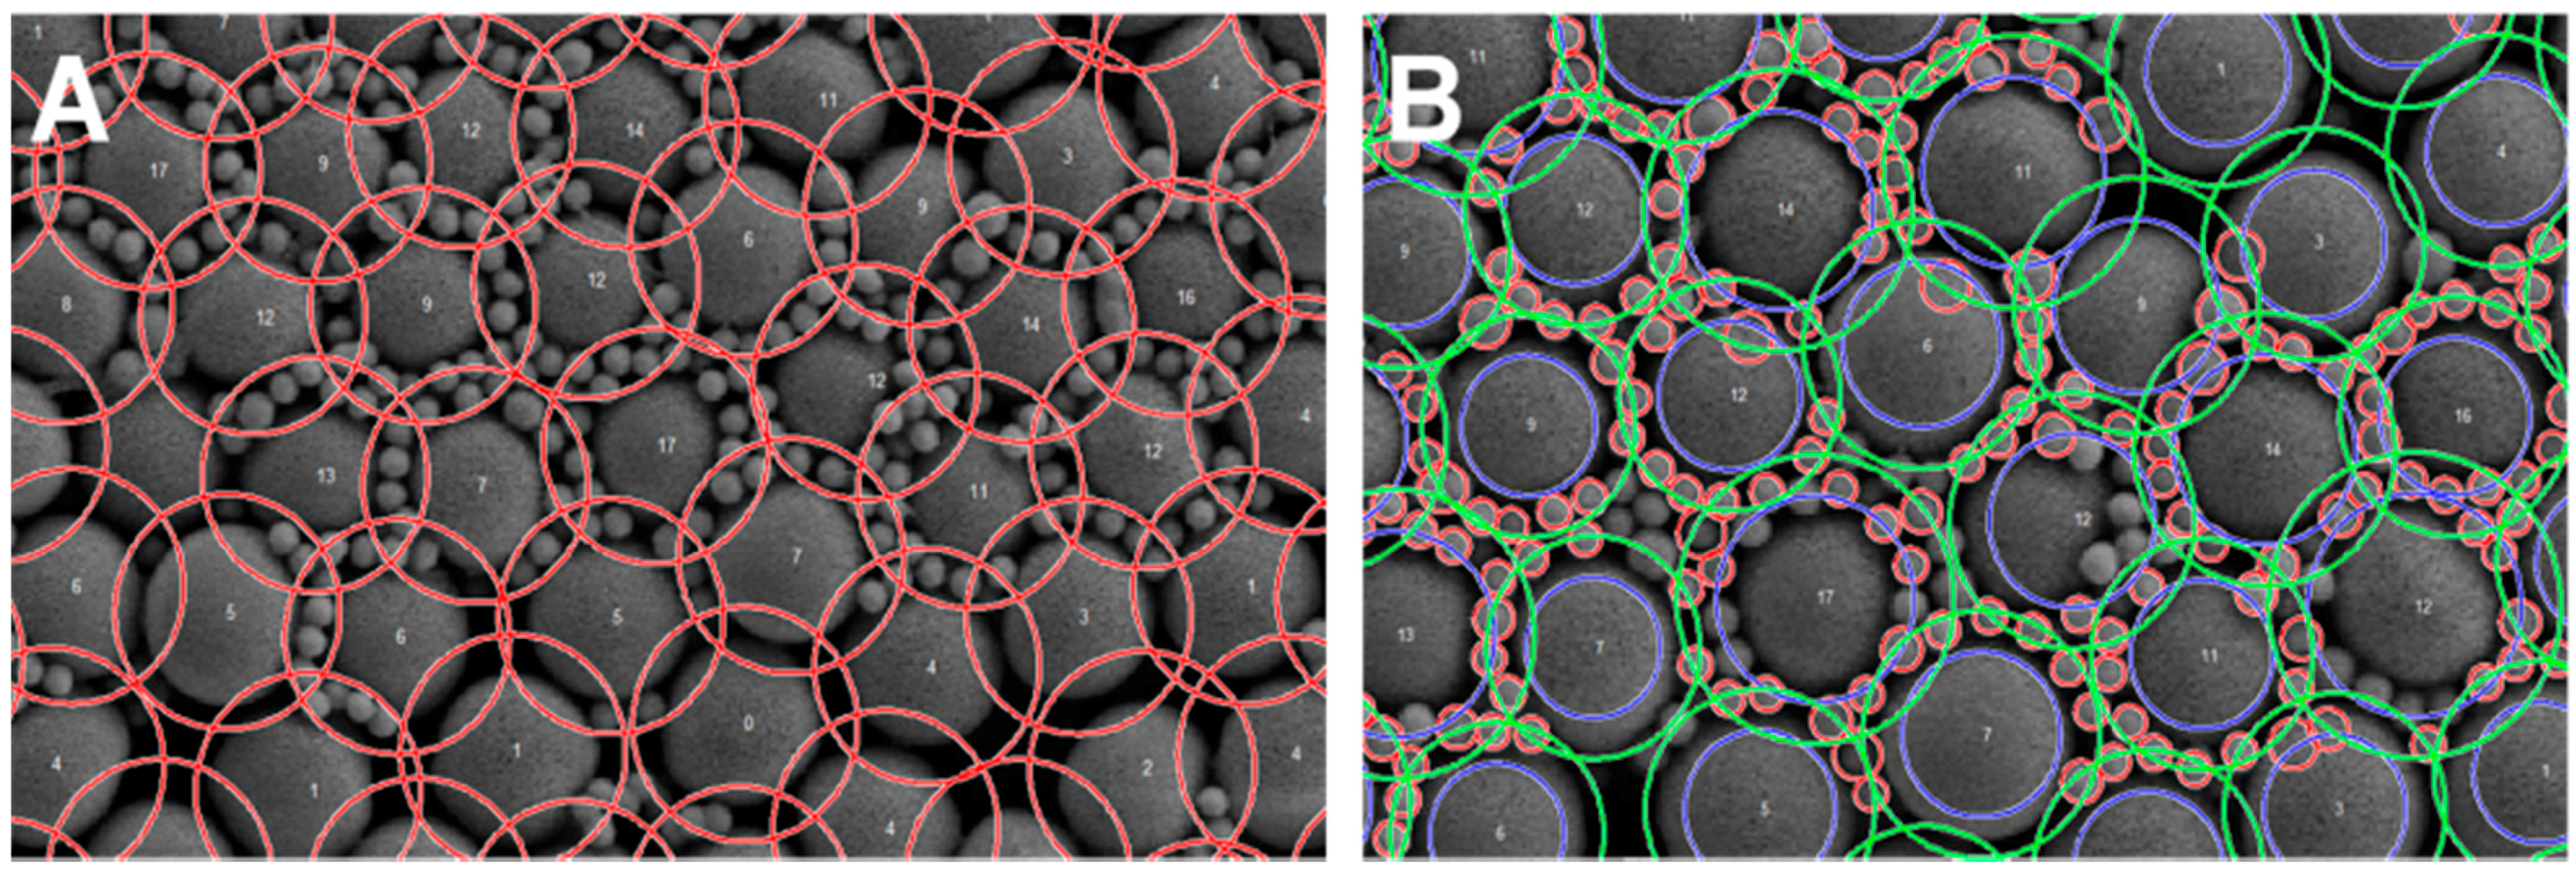
The software detects the centres of large and small particles within images of the BCC using the Circular Hough Transform. An annulus region is then located around each of the large particles representing the area where “neighbouring” small particles would expect to be located in a highly uniform BCC. The dimensions of the annulus region are dependent on the size of the large particles. This ensures that a range of particle sizes can be accommodated by the software. The distance of the centres of all small particles in the image to the large particles are calculated and those that fall within the range represented by the annulus dimensions are identified. The annulus region can be seen in
Figure 3B with the blue circle representing the inner diameter of the annulus and the green circle the outer diameter. Those particles that have been identified as lying within this annulus are circled in red. It is then a simple mathematical operation to count the number of small particles lying within this annulus to determine the degree of uniformity (highly uniform, partially uniform or disordered) of the area around the large particle.
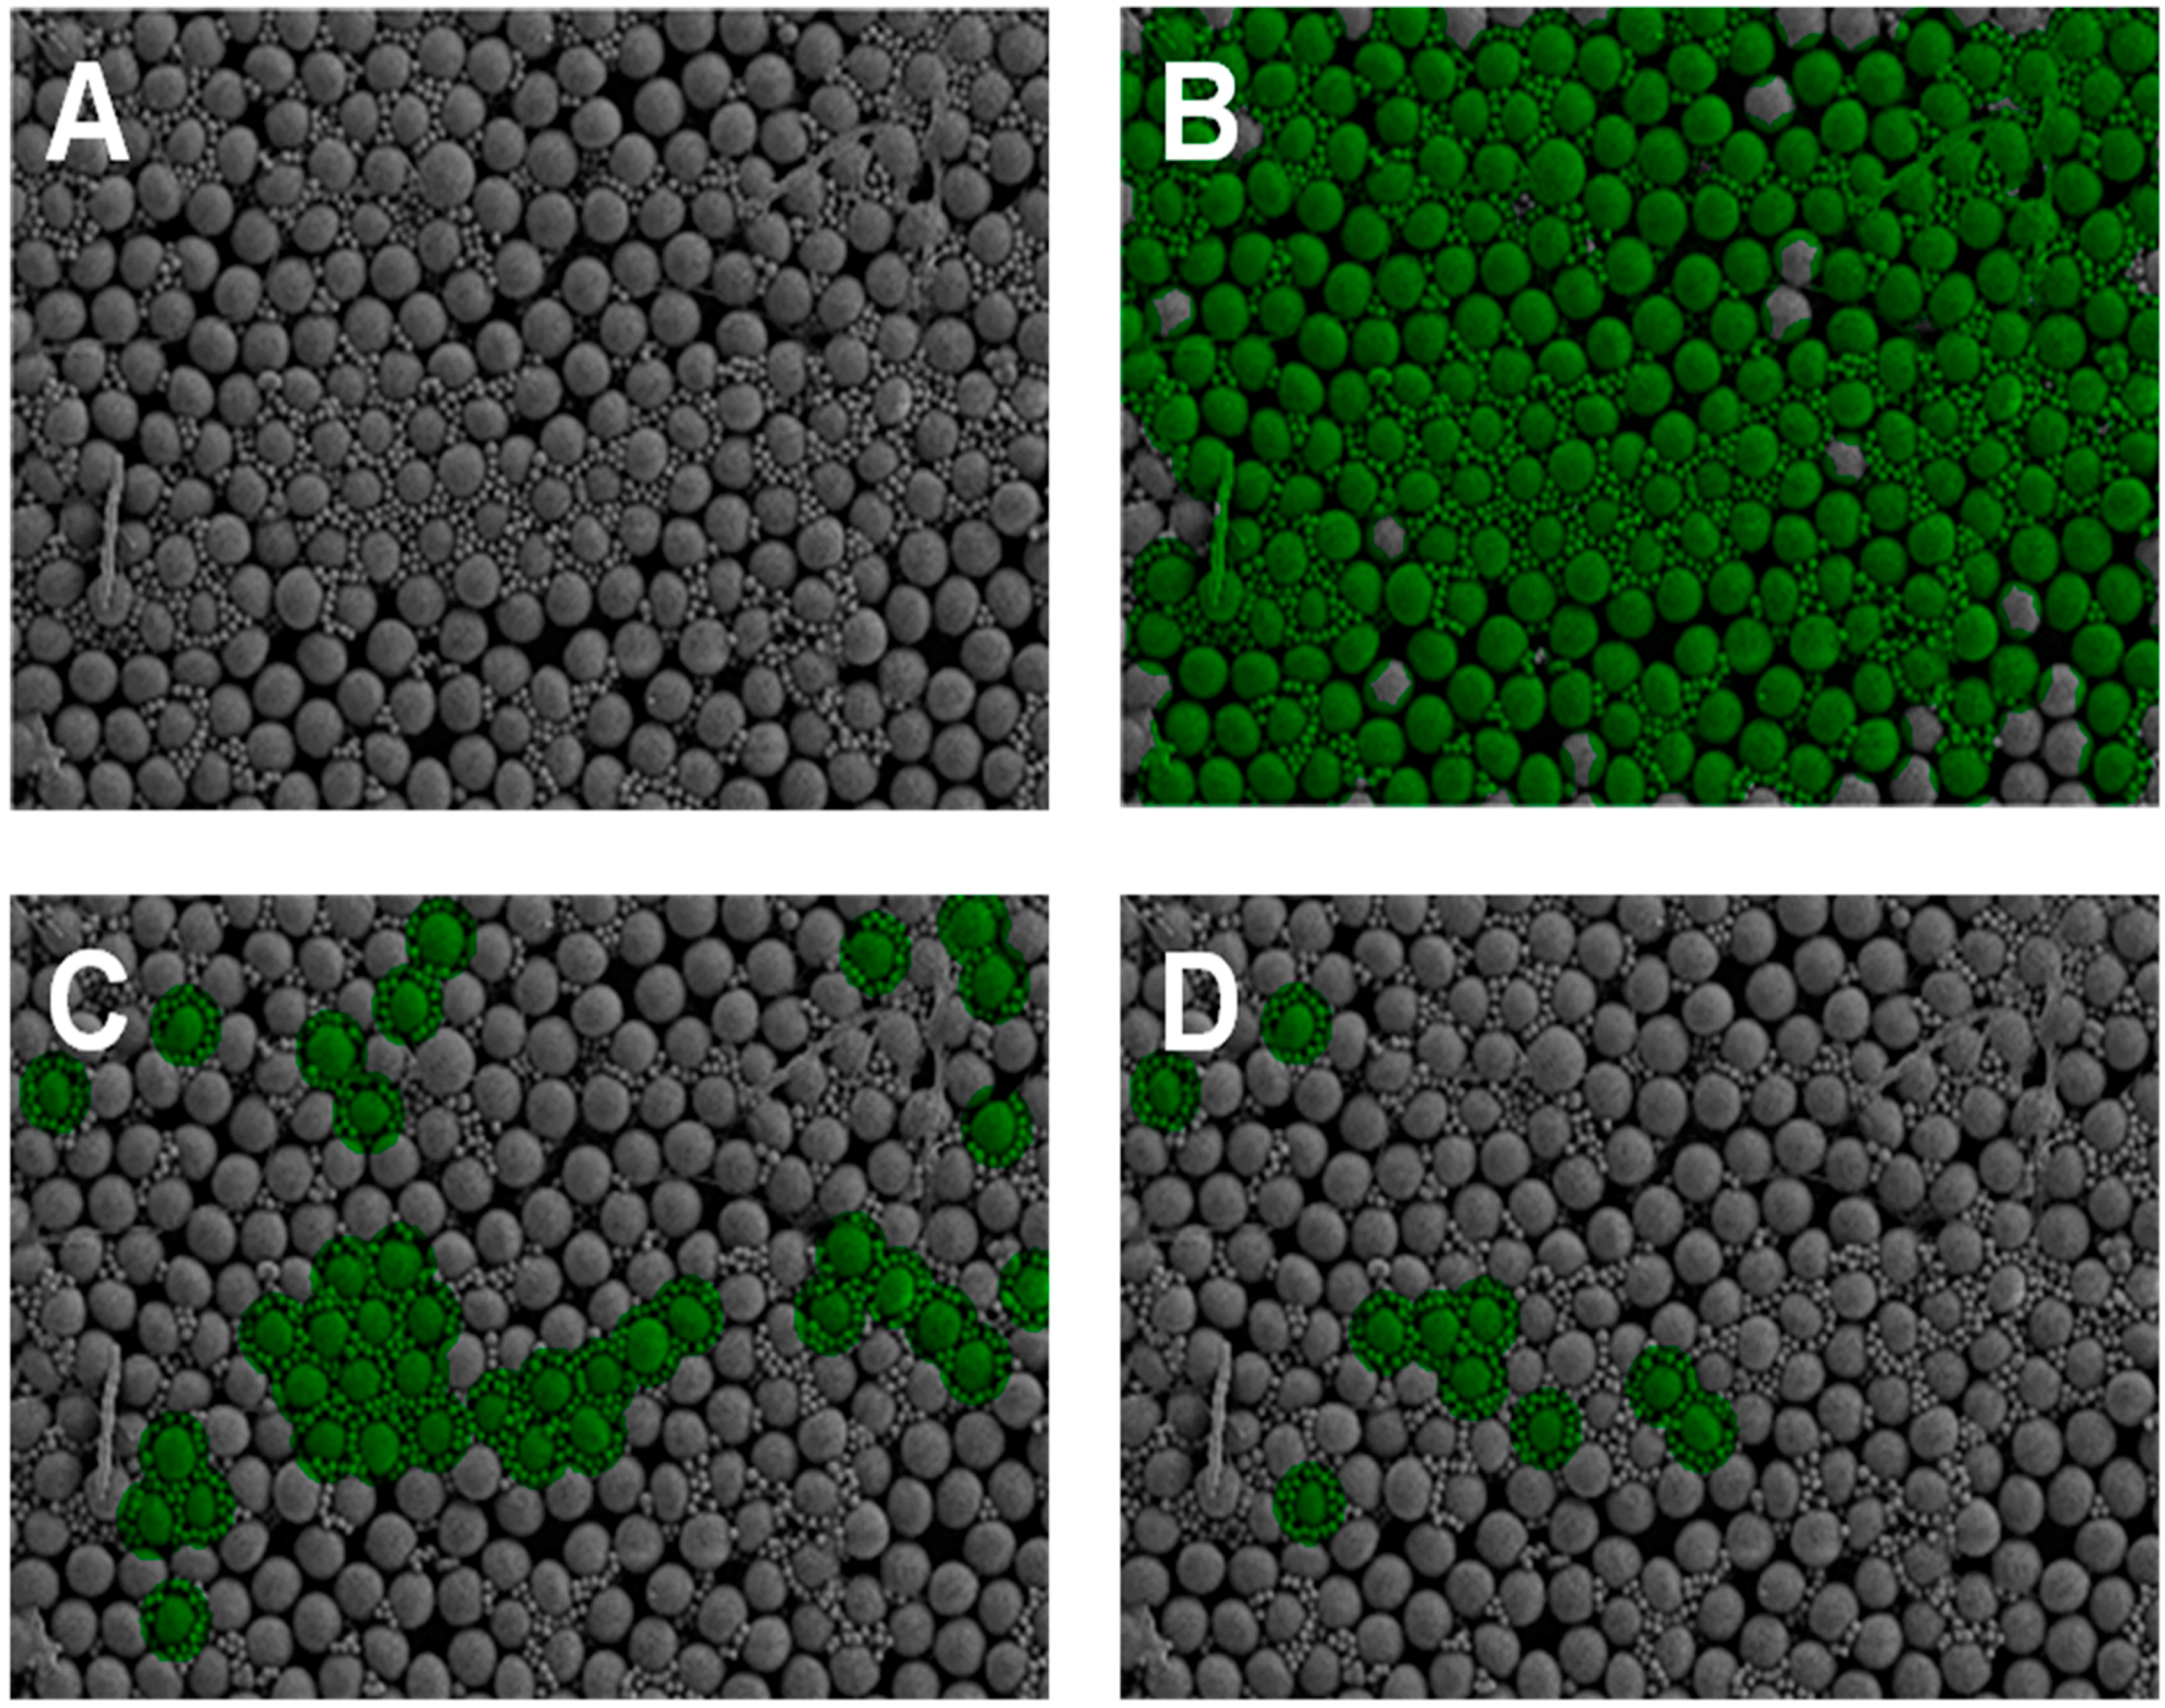
Subsequently, the program was applied to selected SEM images of a BCC of 2 µm carboxylated polystyrene (PS-COOH) particles and 0.4 µm poly(methyl methacrylate) (PMMA) particles. The selected image showed areas with high homogeneity, partially uniform areas as well as a large proportion of disordered areas. The original SEM image is shown in
Figure 4A. In
Figure 4B the green areas represent every large particle that is surrounded by zero or more small particles. Therefore, the green areas indicate the total percentage of covered surface area that is detected by the software. In
Figure 4B it can be seen that a small proportion of the image remains uncoloured. This is due to the large particles not being identified by the Circular Hough Transform. There are three reasons for this. The first is due to the particles being of a non-circular nature, making it unlikely that the Circular Hough Transform will identify them. The second is those particles located close to the edge of the image, in these areas there is not enough information for the Hough Transform to identify the particles. Finally contaminant matter in the images can cause the Circular Hough Transform to fail again due to the non-circular nature of the data provided to the Circular Hough Transform.
This method of classifying the contents of the image is suitable for any grey scale image with circular particles provided that the image is in focus and that the smallest particles have sufficient resolution. Specifically the edges of the particles must be sharp for the Circular Hough Transform to identify them. The algorithm accuracy is limited for particles with radii smaller than five pixels. The specific software developed for this work identifies the large particles and those that lie in close proximity to it; therefore, it is suitable for hexagonal, square and mixed assemblies. At this stage the software is limited to identifying only circular particles.
Areas where any large particle was surrounded by eight or more small particles is shown in green in
Figure 4C. This includes partially uniform areas where any large particle is surrounded by eight, nine, ten or eleven particles as well as highly uniform areas where large particles are surrounded by twelve or more small particles. Lastly, as shown in green in
Figure 4D, highly uniform areas were identified where every large particle was surrounded by twelve or more small particles within the annulus of interest.
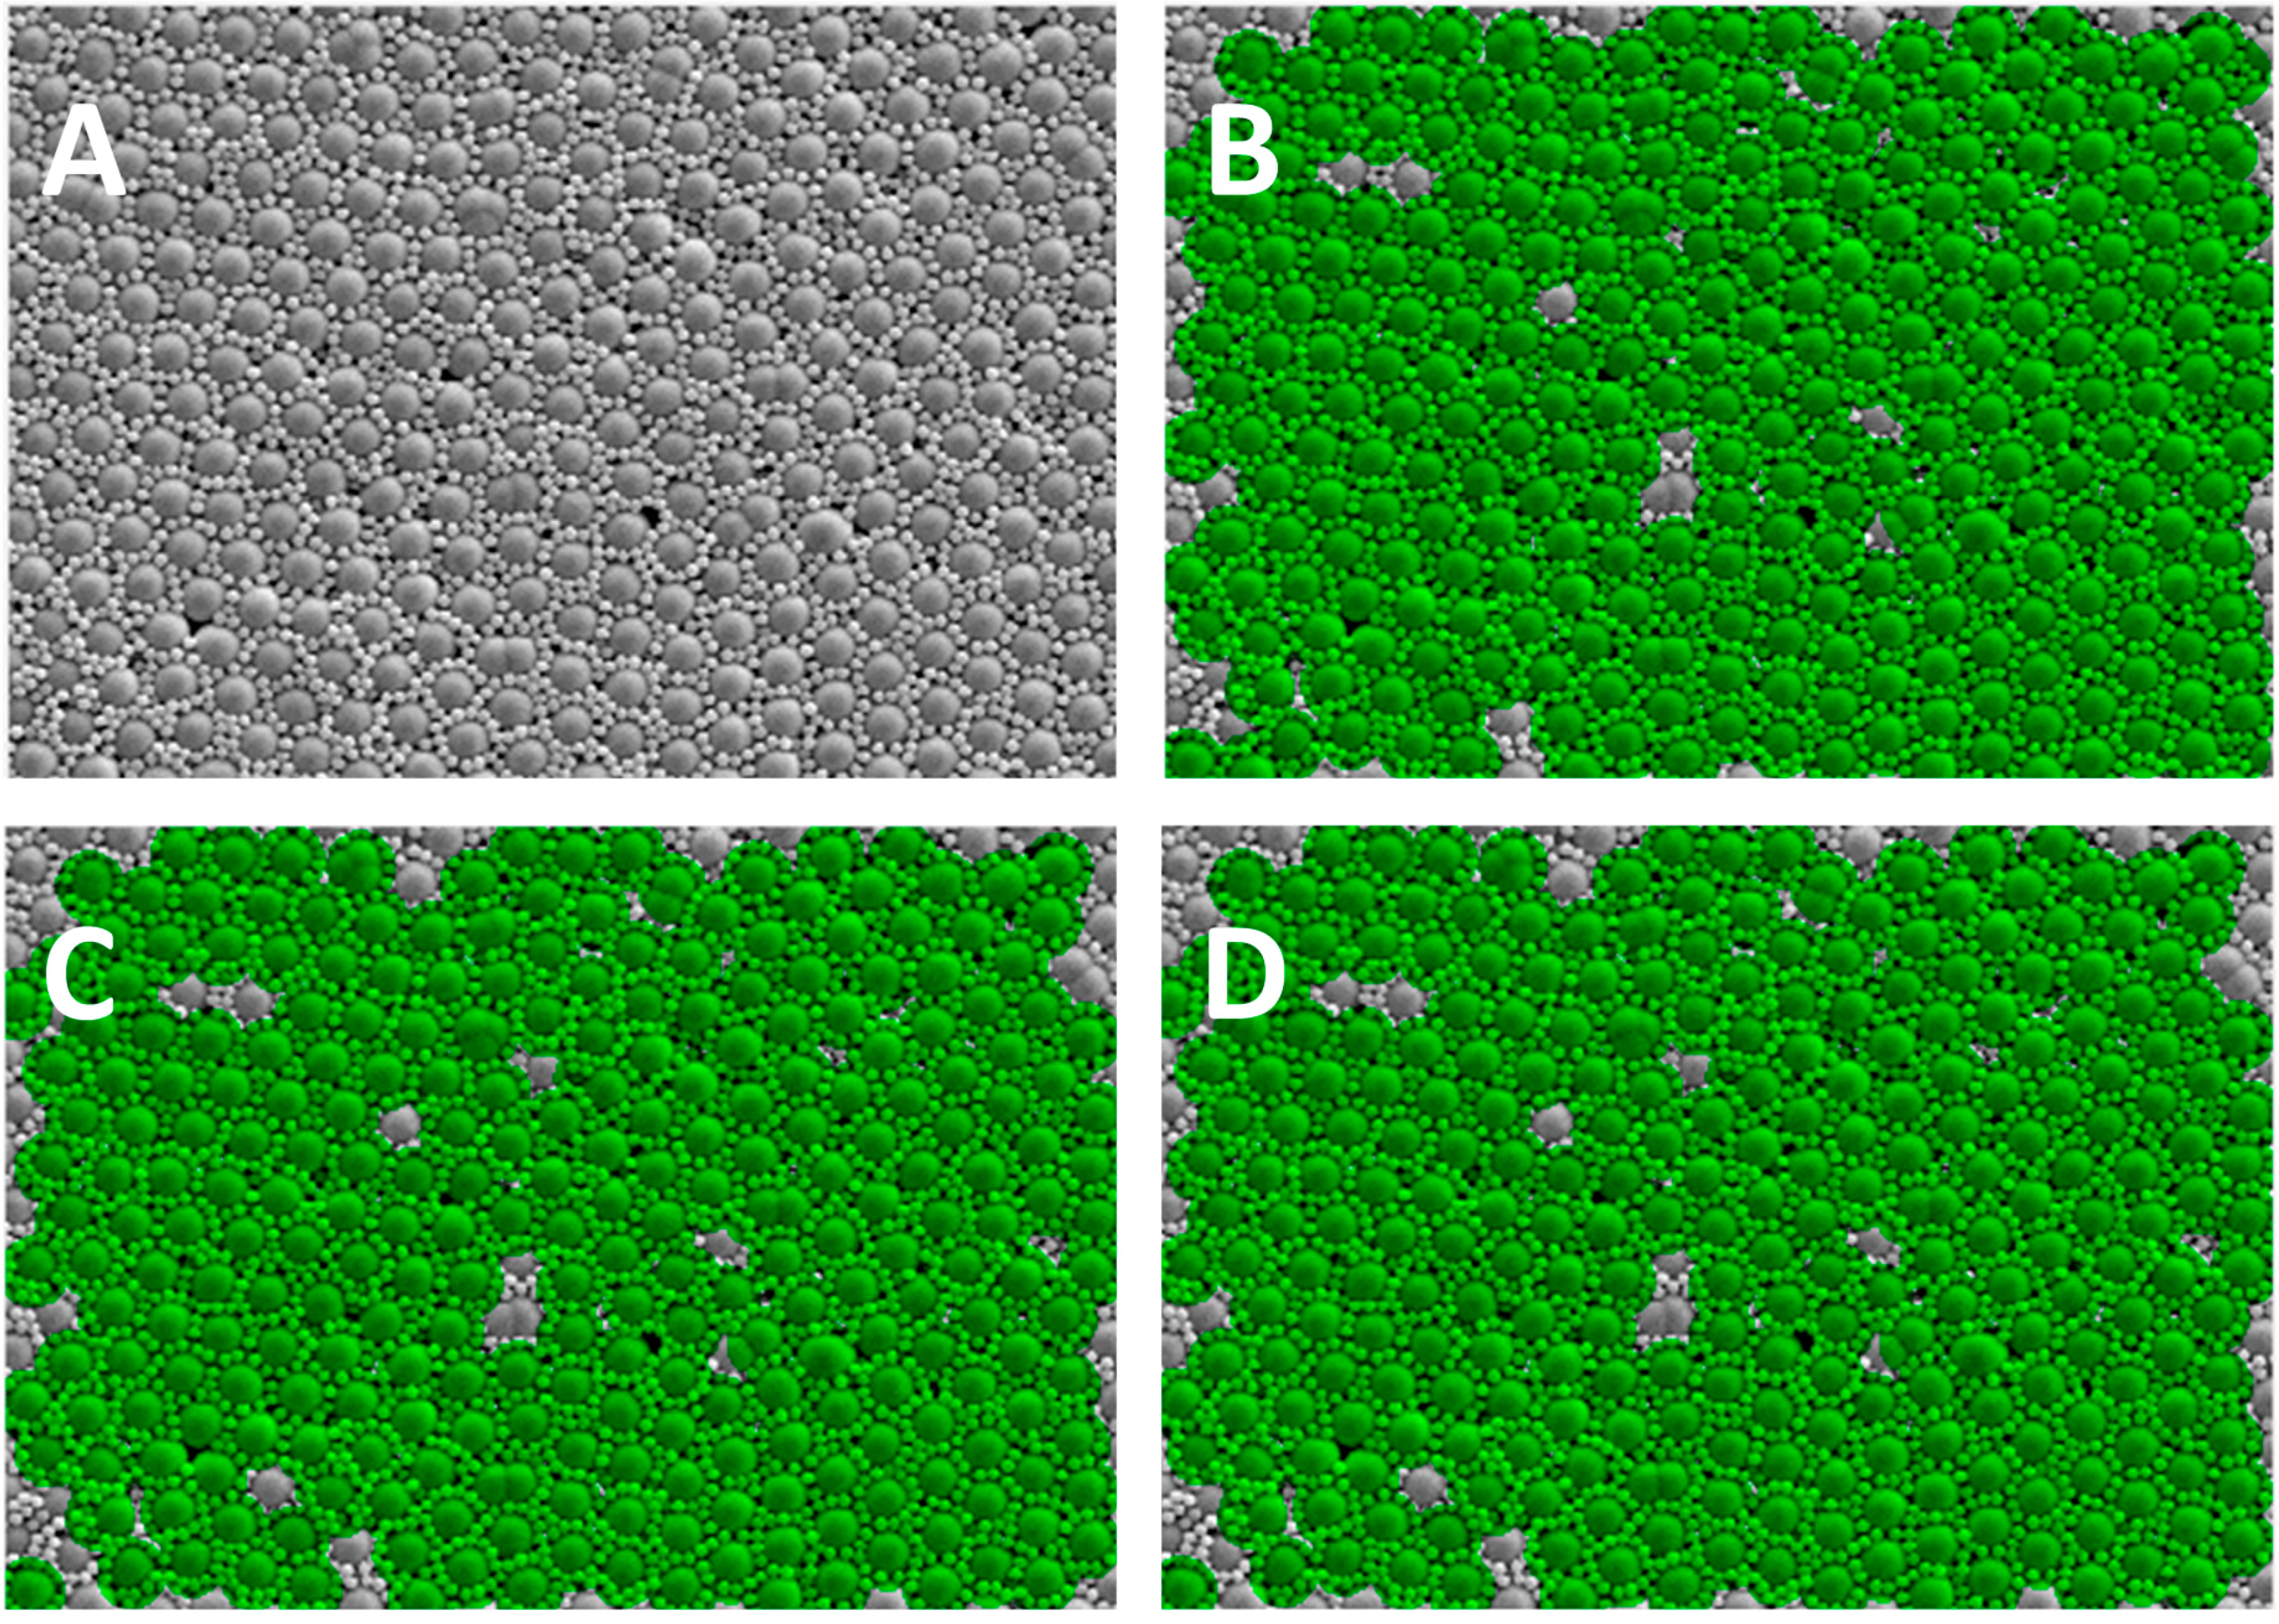
A representative SEM image of a binary colloidal crystal assembly of 2 µm silica (SiO
2) particles and 510 nm PS-COOH particles is shown in
Figure 5A. Initial screening with the newly developed software to determine the total detected surface area is shown in green in
Figure 5B. The green areas represent the sum of disordered, partially uniform and highly uniform regions and indicate the total surface area that is detected by the software. Irregularities in the spherical shape of the particles due to manufacturing processes or on the edges of the image cause the software to not detect these particles. Therefore, the total area of disordered, partially uniform, and highly uniform regions can further be set to 100% total surface area and the percentages of disordered, partially uniform, and highly uniform regions have to be set in relation to the total detectable surface area. In the example shown in
Figure 5, 92% of the total surface area is detected as being composed of disordered, partially uniform, and highly uniform regions.
Figure 5C shows in green the regions that are either partially or highly uniform as 90% and
Figure 5D only shows highly uniform regions (12 or more particles surrounding any large particle) as 90%. Close inspection of the images reveals that the difference between the highly uniform (
Figure 4D) and disordered regions (
Figure 4B) is located close to the border of the image where the amount of data available to the Circular Hough Transform is limited. Therefore, these regions can be discounted and it can be ascertained that all of the surface area is composed of a highly uniform structure.
To further confirm the applicability of the software to different binary colloidal assemblies with different particle diameters and at different magnifications, the software was applied to other respective SEM images. The obtained degrees of uniformity within these BCCs are given in
Table 1 together with the diameters and surface functionalities of the particles used. The corresponding SEM images before and after processing are shown in
Figure 6. It is worthwhile mentioning that at high magnifications as shown in
Figure 6E,F the contribution of particles at the edge of the image to the total image area increases. Therefore, even though a highly uniform structure is evident, the degree of uniformity determined by the software is somewhat reduced. Again, particles that do not show perfectly spherical shape cannot be detected. This obstacle can be overcome by analysing the image with different thresholds for uniform, disordered and highly uniform arrangements. For example, if an initial analysis is performed to quantify the area percentage where each large particle is surrounded by 0 or more small particles, the obtained value for this quantification can subsequently be used as the total detectable area and set to 100%. All following quantifications have then to be put in relation to that area.
3. Materials and Methods
3.1. Substrate Material
Silicon wafers (M.M.R.C. Pty Ltd., Malvern, Australia), cut into 1 cm x 1 cm squares, were used as substrate materials for colloidal assemblies. Prior to use, samples were cleaned by washing in a surfactant solution (2% RBS® liquid detergent concentrate, 2% ethanol, 96% ultrapure MilliQTM water (v/v)(Millipore Corporation, Billerica, MA, USA) for 60 min in a sonication bath followed by 10 rinses with MilliQTM water and drying in a laminar flow cabinet. Immediately prior to use they were UV/ozone treated for 30 min using a UV/ozone ProCleanerTM (Bioforce Nanoscience, Ames, IA, USA).
3.2. Particles
Particles used in this study were carboxylated polystyrene (PS-COOH) (2 µm diameter, Invitrogen, Grand Island, NY, USA, 4% (w/v)), non-functionalised silica (SiO2) (2.01 µm diameter, Bangs Laboratories, Fisher, IN, USA, 9.8% (w/v)), carboxyl-functionalised PS (0.51 µm diameter, Bangs Laboratories, Fisher, IN, USA, 10.12% (w/v)), and non-functionalised poly(methyl methacrylate) (PMMA) (0.4 µm diameter, Bangs Laboratories, Fisher, IN, USA, 10% (w/v)). Unless stated otherwise they were used as received.
3.3. Formation of Binary Colloidal Assemblies (BCCs)
Prior to use, all particle suspensions were sonicated for 30 min followed by vortexing for 15 s. Subsequently, the required volumes were taken from the stock solution and transferred into 1.5 mL Eppendorf tubes. For single colloidal assemblies they were now diluted with MilliQTM water whereas for binary combinations the second particle suspension was added prior to diluting to the final concentration. Subsequently, the colloidal suspensions were vortexed for 30 s. Following this, the suspensions were drop cast onto the area encircled by the rubber O-ring (diameter 1 cm) in a custom-built reaction chamber. Briefly, the chamber was defined by a length of 15 cm and width of 10 cm and accommodated a total of 20 spaces for substrate placement. Each space was defined by a diameter of 1 cm. Between the two plates of the chamber a rubber O-ring with an inner diameter of 1 cm was fixed at each space to seal prior to drop casting of the colloidal suspension. The assembly process was achieved through evaporation induced self-assembly at room temperature over a period of 24 h.
3.4. Scanning Electron Microscopy (SEM)
Prior to imaging, the samples were mounted on an aluminium stub with double-sided conductive carbon tape. Samples were then iridium coated using a Polaron SC5750 sputter coater (Quorum Technologies Ltd., Laughton, UK). The resulting conductive layer had a thickness of approximately 1 nm. Imaging was performed using a Zeiss Merlin Gemini®2 FESEM (Zeiss, Oberkochen, Germany) with an accelerating voltage of 5 kV. The working distance was set to 5 mm.
3.5. Software Development
The degree of uniformity (high, partial or disordered) of the BCCs was determined by establishing how many small particles surrounded each of the larger particles. The larger the number of small particles the more uniform the BCC structure. A software algorithm was developed in Matlab (The Mathworks, Inc., Natick, MA, USA) with variables that can be adjusted to suit the particular BCC configuration (e.g., the size of the particles and number of small particles that constitutes a highly uniform or partially uniform system). The software implementation used in this work is available upon request from Dr. Michelle Dunn,
[email protected].
The software relies on image processing methods. The first step is to identify all of the particles in the image using the Circular Hough Transform. This transform reliably finds circular shapes in images within a specified range of diameters, returning the position of the centre of the circle in the image and the calculate diameter. Several parameters are used to adjust the output to suit the specific input image. The range of allowable diameters can be adjusted for both the small and large particles to allow for different particle diameters and magnifications. The amount of contrast in different images can be accounted for by adjusting the sensitivity and threshold parameters of the Circular Hough Transform.
Once the centres and diameters of all the particles are known an annulus region is defined around each of the large particles. Small particles that lie within this annulus are identified as being neighbouring particles. The inner and outer diameters of the annulus are specified by the user to allow for different small particle sizes and different particle size ratios. The number of particles lying within the annulus region was determined by calculating the distance between all the large and small particles and then counting those that fall within the specified range of the annulus.
The degree of uniformity of each of the large particles can be determined by using a threshold set by the user. If the number of neighbouring particles is greater than the highly uniform threshold then the particle is considered highly uniform. The large particle can also be classified as partially uniform or disordered using the appropriate threshold. To determine the percentage of the image that is classified as highly uniform, the area that is covered by highly uniform particles and their corresponding annuli is measured and divided by the total area of the image.


