Abstract
The organic and mineral components in two coals and resulting high-temperature ashes with high silicon content were characterized by second-derivative infrared spectroscopy, Raman spectroscopy, and X-ray diffraction (XRD). The infrared spectra of raw coals show weak organic functional groups bands but strong kaolinite bands because of the relatively high silicates content. In contrast, the Raman spectra of raw coals show strong disordered carbon bands but no mineral bands since Raman spectroscopy is highly sensitive to carbonaceous phases. The overlapping bands of mineral components (e.g., calcite, feldspar, and muscovite) were successfully resolved by the method of second-derivative infrared spectroscopy. The results of infrared spectra indicate the presence of metakaolinite in coal ashes, suggesting the thermal transformation of kaolinite during ashing. Intense quartz bands were shown in both infrared and Raman spectra of coal ashes. In addition, Raman spectra of coal ashes show a very strong characteristic band of anatase (149 cm−1), although the titanium oxides content is very low. Combined use of second-derivative infrared spectroscopy and Raman spectroscopy provides valuable insight into the analyses of mineralogical composition. The XRD results generally agree with those of FTIR and Raman spectroscopic analyses.
1. Introduction
The characterization of coals is complicated because of mineralogical and chemical heterogeneity of the raw materials and compositional and structural changes resulting from heat treatment. Since the thermochemical conversion of coal is particularly significant in power generation, the characterization of organic and mineral components in raw coals and products of coal conversion has received considerable attention over the past few decades [1,2]. Fourier transform infrared (FTIR) spectroscopy is one of the most important techniques available for the analysis of both organic and inorganic components in a coal. Organic functional groups such as OH, aromatic C–H, aliphatic C–H, C–O, and C=C have been found in the coal structure using FTIR [3,4,5,6]. The abundance of chemical functional groups in coals or coal chars has been quantitatively determined based on the ratios of absorption peak areas [7,8].
In addition to organic components, minerals can be identified by FTIR spectroscopy since they usually produce characteristic absorption bands in the fingerprint region (1500–400 cm−1) [5]. Moreover, the difficulty of low crystallinity in X-ray diffraction (XRD) analysis can be overcome by spectroscopic techniques such as FTIR. The minerals in ash residues prepared by low-temperature ashing below 150 °C were effectively analyzed by FTIR spectroscopy because the influence of organic matter was excluded [9,10]. The infrared spectral subtraction between the raw samples and acid-washed ones has also been successfully used to identify minerals in coals and coal chars [11,12]. The absorption band positions of kaolinite were found to change significantly with heat treatment temperature due to mineral transformation [13] and strong Si–O stretching vibration bands were observed over the range of 1100–950 cm−1 [13,14]. A mixture composed of organic and inorganic matter tends to produce complex infrared spectra because of the presence of overlapping bands. Certain components are obscured by others, thus yielding the overlapping bands. The resolution enhancement method, especially the second-derivative spectroscopy has been effectively used to resolve the overlapping bands in the study of the organic functional groups in coals and more detailed information on organic components has been gained [15,16]. Absorption bands of minerals overlap more easily than those of organic matter since the former locate at relatively low frequencies and in relatively narrow spectral range. However, the identification of the mineralogical composition of raw coals and resulting coal ashes by second-derivative infrared spectroscopy has not yet been systematically studied.
Another particularly useful analytical tool for the identification of organic and mineral matter is Raman spectroscopy. Non-destructive detection, easy sample preparation, rapid analysis, and high spatial resolution are the significant advantages of Raman spectroscopy. Raman spectroscopy is commonly utilized to characterize the carbonaceous structure of heterogeneous materials including coal and biomass. Two prominent carbon bands, i.e., D and G bands (near 1350 and 1590 cm−1, respectively) are often observed in the Raman spectra of coal and biomass [17]. Quantitative parameters of the carbonaceous structure can be gained by further curve-fitting using multiple individual peaks [17,18,19]. Variations of the carbon structure of biomass char during steam gasification by FT-Raman spectroscopy has been reported [20]. A good dependence of combustion reactivity on the Raman band area ratios has been revealed in reference [17] and the correlation between ignition temperature of coals and Raman spectral parameters has been further demonstrated [21].
Raman spectroscopy has also been employed in the identification of a variety of minerals, including crystalline and amorphous phases [22,23]. Minerals especially the iron oxides produce strong Raman bands [24]. In addition to iron oxides, the occurrence of quartz and calcite in power plant fly ashes has also been revealed by Raman spectroscopy [25]. Moreover, the Raman spectroscopic studies were shown to be complementary to FTIR spectroscopic analyses. Although a number of studies [21,23,24,25] have been conducted on the Raman spectra of coals or coal ashes separately, very little research has been carried out on the Raman spectra of raw coals and resulting coal ashes. Furthermore, Raman spectral changes from raw coals to resulting coal ashes have not yet been reported.
The purpose of this investigation is to identify the organic and mineral components of coals and resulting high-temperature ashes by second-derivative infrared spectroscopy and Raman spectroscopy. The second-derivative infrared spectroscopy was conducted to thoroughly analyze the mineralogical composition of the coals and coal ashes based on the interpretation of original and overlapping bands. The component changes from coals to coal ashes were also addressed by infrared and Raman spectroscopic analyses. Mineral phases with low crystallinity or low content in coal ashes were successfully identified by combined use of FTIR and Raman spectroscopy techniques.
2. Materials and Methods
2.1. Coal Samples
Two coals from Dananhu No. 1 and No. 2 mines (named coal A and coal B, respectively), Xinjiang Autonomous Region, China, were selected in this research. The samples were crushed and sieved to a size range of 106–150 μm. Proximate and ultimate analyses of coals were performed and the results are presented in Table 1.

Table 1.
Proximate and ultimate analyses of test coals.
2.2. Ash Samples Preparation
The coals were slowly heated to 815 °C and kept at this temperature for 1 h in a muffle furnace to produce high-temperature ash following a standard (GB/T212-2008). Ash composition was examined by X-ray fluorescence spectroscopy (XRF) using a Panalytical Axios spectrometer. The ash composition listed in Table 2 indicates that Si is abundant in both coal ashes.
Table 2.
Chemical composition of high-temperature ashes (wt %).
2.3. Characterization of Organic and Inorganic Components in Coals and Coal Ashes
Nicolet iS 10 infrared spectrometer was used to examine the organic groups and mineralogical composition of coals and coal ashes in the region of 4000–400 cm−1. Infrared spectra were collected using a deuterated triglycine sulfate (DTGS) detector, an Ever-Globar IR source, and a KBr beam splitter. Each sample was performed by sixty-four scans and the resolution was 4 cm−1. The KBr pellet method was employed for measurement. The data were subjected to baseline correction using OMNIC 9.2 software for comparison. The second-derivative infrared spectra were determined to resolve the overlapping absorption bands.
Raman spectra of coals and coal ashes were performed on a LabRAM Aramis Raman spectrometer equipped with a 532 nm laser, a 50× objective, a 1800 lines/mm optical grating spectrometer, and a 460 mm focal length. The lateral and depth spatial resolution were 2 µm and 4 µm, respectively. The exposure time of ten seconds and accumulation of nine scans were performed on each sample. The incident laser power on the coal and coal ash particles was about 2 and 20 mW, respectively. The laser energy can be altered by filters to avoid the thermal decomposition of particles. To examine the carbonaceous structure of coals and minerals in coal ashes, scans in the spectral range of 800–2000 cm−1 and 100–1500 cm−1 were conducted on the particles of coals and coal ashes, respectively. Raman spectra were recorded on at least three points for each sample to reduce the heterogeneity of the sample. Typical measurements of three points were presented in the study. Data collection was performed using Labspec 5 software and further baseline correction was carried out for better comparison. Positive identification of the mineral components of coal ashes has been made by the comparison of measured spectra to the reference spectra in literature and the RRUFF database [26].
A D/max 2550 X-ray diffractometer with Cu Kα radiation was employed to collect the X-ray diffraction (XRD) data for coals and coal ashes. The powder samples were prepared by grinding and were placed on flat plastic for XRD analysis. The XRD analysis was operated at 40 kV and 30 mA. The XRD data were obtained in the range of 5–80° (2θ) at a scanning rate of 5° min−1. The crystalline mineral phrases were interpreted by Jade 6.5 software through searching and matching the standard diffraction data.
3. Results and Discussion
3.1. FTIR of Coals and Coal Ashes
Figure 1 and Figure 2 show the FTIR spectra including the second-derivative spectra of coals and coal ashes, respectively. The assignment of absorption bands of organic and mineral components of coals and coal ashes was identified and summarized in Table 3. The second-derivative infrared spectra display some additional bands, which were associated with the components obscured in the original spectra. The original spectra of coals show organic functional groups containing C and H. The bands near 1606 cm−1 was assigned to aromatic C=C ring stretching vibration [27] (Figure 1a). The absorption bands at 2921 and 2851 cm−1 were related to asymmetric and symmetric aliphatic –CH2 groups, respectively [27]. The infrared spectra of coals show the absence of oxygen-containing functional groups (1800–1000 cm−1) and aromatic structures (900–700 cm−1) due to the relatively high mineral matter content, which were consistent with the literature [28]. The absorption spectra of coal ashes (Figure 2a) were significantly different from those of coals (Figure 1a), suggesting that organic and mineral components in coals changed dramatically after burning at 815 °C. Moreover, the spectra of coal ashes show the absence of organic functional groups, indicating the burnout of organic components.
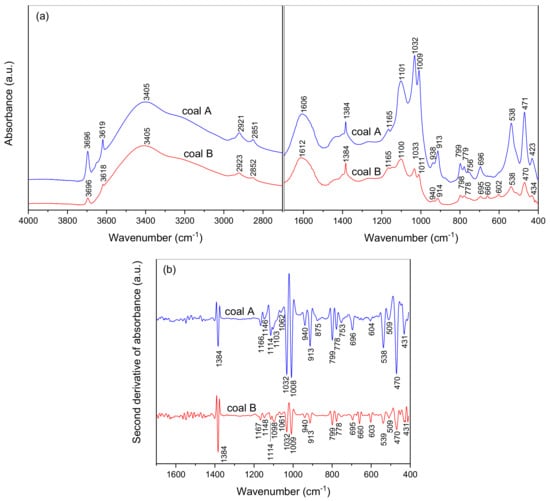
Figure 1.
FTIR spectra of coals: (a) Original spectra and (b) second-derivative spectra.
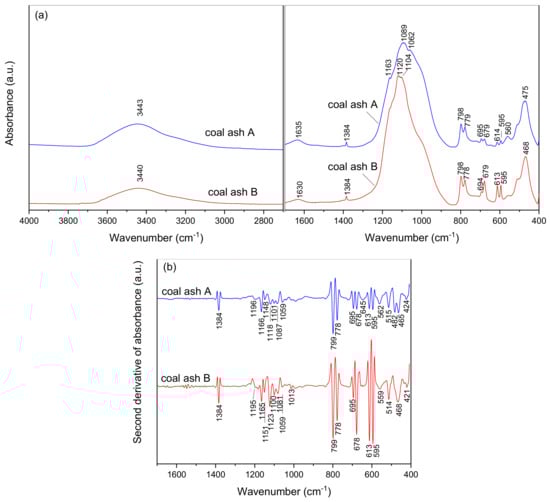
Figure 2.
FTIR spectra of coal ashes: (a) Original spectra and (b) second-derivative spectra.
Table 3.
FTIR bands of organic and mineral matter in coals and coal ashes.
The OH stretching mode of adsorbed H2O produced a broad band near 3405 cm−1 (Figure 1). The band near 1632 cm−1 (see Figure 2) was related to OH bending vibration of adsorbed H2O [10,13]. Strong absorption bands of mineral matter were observed in the spectra of coals and coal ashes. Figure 1 indicates that kaolinite was abundant in raw coals. The sharp doublet at 3696 and 3619 cm−1 was easily recognized as kaolinite from the spectra of coals. Other characteristic absorption bands for kaolinite occur at 1101, 1032, 1009, 938, 913, 756, 696, 538, 470, and 431 cm−1 [29]. A group of absorption peaks of OH stretching for kaolinite usually appear over the range 3700–3500 cm−1. The peaks at 3696 and 3619 cm−1 were associated with the stretching mode of inner surface OH and inner OH groups, respectively. The peaks at 938 and 913 cm−1 were related to the Al–OH bending mode (inner surface and inner OH groups, respectively). The presence of four OH bands (3696, 3669, 3652, and 3619 cm−1) usually corresponds to well-crystallized kaolinite [30]. The coals in this study, however, only show the bands at 3696 and 3619 cm−1 but the bands at 3669 and 3652 cm−1 were absent, indicating the poor crystalline structure of kaolinite. Si–O stretching and bending absorption bands of kaolinite occur over the range of 1300–400 cm−1. The peak around 1101 cm−1 corresponded to perpendicular Si–O stretching vibration [29]. The peaks near 1032 and 1009 cm−1 were derived from in-plane Si–O stretching modes and the former was the most intense kaolinite band. The bands near 756 and 696 cm−1 were both associated with perpendicular Si–O vibration. Al–O–Si and Si–O–Si bending vibrations produced the bands at 538 and 470 cm−1, respectively. The peak at 431 cm−1 corresponded to Si–O deformation vibration.
Infrared spectroscopy was sensitive to clay mineral structure during heat treatment. Figure 2 shows the absence of OH bands of kaolinite (3696, 3619, 938, and 913 cm−1) and the presence of a new metakaolinite band (560 cm−1), indicating that kaolinite undergoes thermal transformation up to 815 °C [31]. Previous study [32] shows that the dehydroxylation of kaolinite and destruction of crystal lattice occurred once the heat treatment temperature was up to 550 °C. The Al–O–Si bending band shifted from 538 cm−1 (Figure 1) to 560 cm−1 (Figure 2), suggesting the distortion in tetrahedral and octahedral layers and the production of metakaolinite upon heat treatment. The occurrence of metakaolinite in coal ashes was also supported by our previous work [33]. The absorption peak at 1196 cm−1 was associated with amorphous SiO2 derived from the thermal transformation of clay mineral [34].
The presence of quartz was readily identified by the characteristic absorption bands at 1165, 799, 779, 696, 509, and 465 cm−1 [35], as shown in Figure 1 and Figure 2. The shoulder band near 1165 cm−1 arose from asymmetric Si–O stretching vibration. The doublet at 799 and 779 cm−1 was derived from symmetric Si–O stretching mode [14]. The weak peak at 696 cm−1 was associated with symmetric Si–O bending mode. Asymmetric Si–O bending and Si–O–Si stretching vibration produced the peaks at 509 and 465 cm−1, respectively. The strongest band of quartz in coal ashes could be found around 1089 cm−1, corresponding to Si–O stretching vibration. The absorption bands of quartz in coal ashes were much more intense than those in coals due to the crystallization of amorphous SiO2 and the thermal transformation of clay minerals.
The presence of calcite in coals can be identified from the overlapping band at 875 cm−1 (Figure 1b), corresponding to asymmetric CO32− deformation vibration [36]. The absorption bands at 1146, 1114, and 604 cm−1 in Figure 1 indicate the occurrence of gypsum. The peaks near 1146 and 1114 cm−1 arose from asymmetric stretching vibrations of SO42−. The peak at 604 cm−1 was attributed to SO42− bending vibration. The peaks at 1151, 1118, 679, 614, and 595 cm−1 in Figure 2 show the occurrence of anhydrite. The peaks near 1151 and 1118 cm−1 also arose from asymmetric SO42− stretching vibrations. The peaks at 679, 614, and 595 cm−1 corresponded to SO42− bending modes [37]. Note that the bands at 1118 and 614 cm−1 of anhydrite were derived from the bands at 1114 and 604 cm−1 of gypsum, respectively, due to the frequency shift upon heat treatment. In addition, Figure 2 shows the absence of calcite. Therefore, the occurrence of anhydrite in coal ash is attributed to the thermal transformation of gypsum and sulfation of CaO.
The presence of muscovite was evidenced by the peaks around 1062 and 482 cm−1, arising from Si–O stretching and Si–O–Si bending modes, respectively. The Mg3OH bending vibration produced a weak peak at 660 cm−1 and corresponded to saponite [38] (Figure 1a). The bands at 645 and 424 cm−1 (see Figure 2) indicate the occurrence of alkali feldspars in coal ashes and were assigned to a tetrahedral ring and O–Si(Al)–O stretching vibrations, respectively [39]. A weak peak around 1384 cm−1 was due to nitrate, which was probably derived from the interaction of NO2 with carbonates during coal combustion [9,40] or the impurity in KBr pellet. The presence of hematite commonly found in coal ash was not detected by FTIR in this study because the ionic bonds of hematite did not produce the change of dipole moment [14]. It was virtually impossible to identify all the mineral phases present in these coals and coal ashes by FTIR due to many overlapping bands.
3.2. Raman Spectra of Coals and Coal Ashes
Figure 3 presents the Raman bands of coals. Although the infrared spectra show marked absorption bands of minerals in coals (see Figure 1), the Raman spectra of coals indicate intense bands of disordered carbon but no bands of mineral matter. This is because Raman spectroscopy is very sensitive to carbonaceous materials, the unburned carbon in coal ash can even be readily detected [25,33]. The prominent carbon bands near 1350 and 1590 cm−1 are D and G bands, respectively. The original Raman spectra of coals were resolved into five peaks according to the literature [17], i.e., four Lorentzian peaks (D4, D1, G, and D2 bands) and one Gaussian peak (D3 band). Initial peak positions were defined at 1150, 1350, 1520, 1590, and 1620 cm−1 for D4, D1, D3, G, and D2 bands, respectively. The band positions and ratio of peak areas (ID1/IG, ID1/IAll, and IG/IAll) are given in Table 4. The five individual peaks in Figure 3 were associated with different carbonaceous structure and detailed interpretation can be found in the literature [17]. The value of ID1/IG is usually related to the degree of order and the lower value of ID1/IG denotes the more ordered structure [17]. Thus, Table 4 shows that the degree of order of coal A was slightly higher than that of coal B.
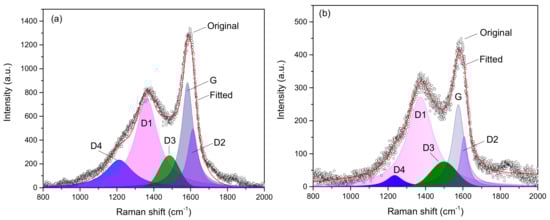
Figure 3.
Raman spectra of coal samples: (a) Coal A and (b) coal B.
Table 4.
Peak parameters of Raman spectra of coals.
Figure 4 presents the Raman spectra of minerals in coal ashes. Raman spectra of coal ashes show marked mineral bands but no carbon band, indicating that the carbon in raw coals was completely burned out. This was consistent with the FTIR result. A very strong band around 148 cm−1 revealed the occurrence of anatase, although the titanium oxides content of coal ash was very low (see Table 2). Low content of anatase was also observed in the kaolinite [41] and in high-calcium coal ashes [33] by Raman spectroscopy. The anatase showed other medium and weak bands at 199, 400, 517, and 642 cm−1. The bands at 148, 199, and 642 cm−1 were associated with Eg modes. The peak at 517 cm−1 arose from A1g mode (Ti–O stretching vibration). The peak around 400 cm−1 was related to the B1g mode [42]. Note that the presence of anatase in coal ashes was not identified by the FTIR technique probably due to its detection limit.
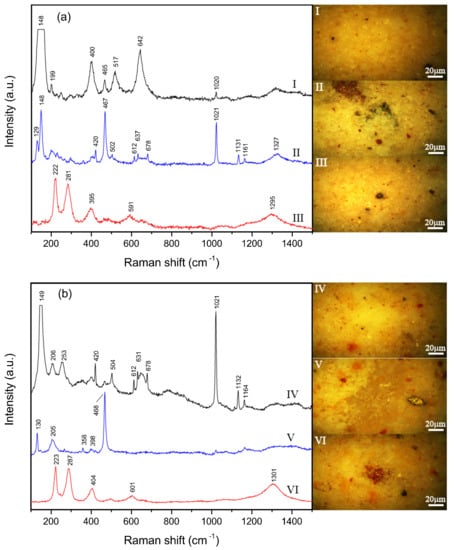
Figure 4.
Typical Raman spectra and micrograph for coal ashes: (a) Coal ash A and (b) coal ash B. Typical components are: I—anatase, quartz, and anhydrite; II—quartz, anatase, and anhydrite; III—hematite; IV—anatase, quartz, and anhydrite; V—quartz; and VI—hematite.
The presence of anhydrite was evidenced by the characteristic bands at 420, 502, 612, 631, 678, 1021, 1132, and 1164 cm−1. The bands at 612, 631, and 678 cm−1 were assigned to asymmetric SO42− bending vibration [37]. The relatively intense peak at 1021 cm−1 was the main Raman mode of anhydrite and was attributed to symmetric SO42− stretching vibration. A doublet at 420 and 502 cm−1 arose from symmetric SO42− bending modes [43]. The peaks at 1132 and 1164 cm−1 were associated with asymmetric SO42− stretching vibration. Note that the Raman bands around 612 and 678 cm−1 also appeared in the infrared spectra (around 614 and 679 cm−1, see Figure 2) for anhydrite, indicating that the two bands were both Raman-active and infrared-active.
The presence of quartz was revealed by the strong band around 467 cm−1 together with the medium to weak bands at 130, 205, and 358 cm−1. The peak near 467 cm−1 corresponded to the symmetric Si–O stretching mode of quartz and was also active to FTIR (see Figure 2). The bands at 130, 205, and 358 cm−1 arose from the lattice modes of quartz [26]. The Raman spectra of coal ashes (Table 5) did not show the occurrence of muscovite and feldspars because the phyllosilicates and clay minerals generally show very weak Raman signals [44]. The hematite bands were clearly visible at 222, 281, 395, 591, and 1295 cm−1 for coal ash A and 223, 287, 404, 601, and 1301 cm−1 for coal ash B. The peak near 222 cm−1 was related to symmetric Fe–O stretching mode. The bands near 281, 395 and 591 cm−1 were derived from symmetric Fe–O bending mode. The broad peak around 1295 cm−1 was associated with two-magnon scattering [45]. Raman spectroscopy could therefore easily identify the presence of hematite in coal ashes as compared to the FTIR technique.
Table 5.
Raman bands of minerals in coal ashes.
3.3. XRD of Coals and Coal Ashes
The XRD results of coals and coal ashes and patterns of standard diffraction data are shown in Figure 5. Due to relatively abundant mineral matter in raw coals, the diffraction peaks of crystalline carbon such as (002) peak were obscured by the mineral peaks. The mineral components in coal A were primarily quartz, calcite, kaolinite, siderite, and muscovite. The main minerals in coal B were quartz, gypsum, kaolinite, and muscovite. The broad diffraction feature in the low-angle region in Figure 5a,c suggests the presence of amorphous clay minerals in raw coals. The occurrence of anhydrite in coal ash A was due to the decomposition of CaCO3 and the reaction between newly formed lime and sulfur oxides released from organic sulfur combustion. The presence of anhydrite in coal ash B accounted for the partial dehydration of gypsum and further dehydration of bassanite upon heat treatment [46]. These results were consistent with FTIR analyses, as described above. The structure of muscovite changed progressively and continuously with temperatures [47]. A previous study [48] shows that the destruction of muscovite lattices occurs at 940–980 °C. Thus, the muscovite remains in both coal ashes. Figure 5 shows the disappearance of kaolinite in both coal ashes, which agreed well with the results of FTIR. Figure 5b,d did not show the diffraction peaks of metakaolinite due to its low crystallinity, which is supported by the literature [34]. The XRD analyses were generally consistent with the results of FTIR and Raman spectra.
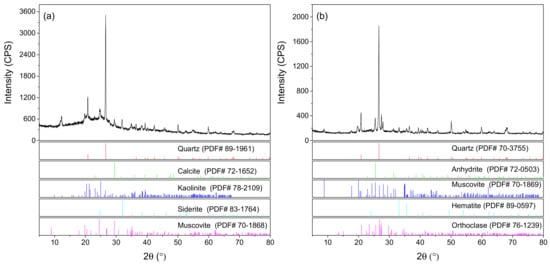
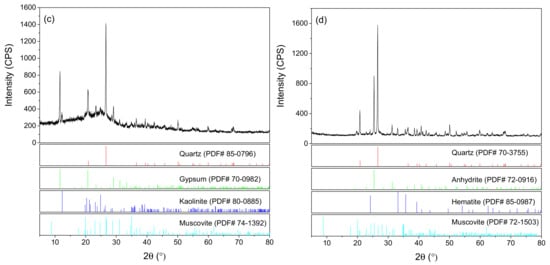
Figure 5.
XRD patterns for coals and coal ashes: (a) Coal A, (b) coal ash A, (c) coal B, and (d) coal ash B.
4. Conclusions
FTIR, Raman spectroscopy, and XRD are complimentary for the identification of minerals in coals and coal ashes. The infrared spectra of raw coals showed intense absorption bands of kaolinite and weak bands of organic functional groups because of relatively high silicates content of the coals. The second-derivative infrared spectra clearly showed separated individual bands and thus present detailed mineral components of the coals and coal ashes. Comparison of the infrared spectra of coals and coal ashes demonstrated the thermal transformation of minerals such as kaolinite, calcite, and gypsum. Raman spectra of raw coals showed intense carbon peaks but no mineral matter peaks. Results of the Raman spectra indicated the occurrence of anatase, quartz, anhydrite, and hematite in the coal ashes. The XRD analyses of mineral composition of coals and coal ashes generally agreed with the results of infrared and Raman spectra.
Author Contributions
Y.Y. designed the experiments and wrote the manuscript. H.Y. and Z.W. performed the analysis of infrared spectra. C.Q. and H.T. participated the analysis of Raman spectra. W.Z. reviewed the paper. Z.H. and L.F. prepared the samples.
Funding
This research was funded by the National Natural Science Foundation of China (Grant No. 51206012), Open Fund of Innovation Platform of Hunan Provincial Education Department, China (Grant No. 17K002), International Cooperation Project of Double-First Class (Grant No. 2019IC16), Open Fund of Key Laboratory of Renewable Energy Electric-Technology of Hunan Province (Grant No. 2018ZNDL002), Natural Science Foundation of Hunan Province, China (2018JJ3552), and the Cooperation Project between the State Scholarship Fund and Hunan Provincial Education Department, China.
Acknowledgments
We are grateful to Houtao Chen at State Grid Hunan Electric Power Corporation Research Institute for the supply of test coal samples.
Conflicts of Interest
The authors declare no conflict of interest.
References
- Gupta, R. Advanced coal characterization: A review. Energy Fuels 2007, 21, 451–460. [Google Scholar] [CrossRef]
- Vassilev, S.V.; Vassileva, C.G. Methods for characterization of composition of fly ashes from coal-fired power stations: A critical overview. Energy Fuels 2005, 19, 1084–1098. [Google Scholar] [CrossRef]
- Baysal, M.; Yürüm, A.; Yıldız, B.; Yürüm, Y. Structure of some western Anatolia coals investigated by FTIR, Raman, 13C solid state NMR spectroscopy and X-ray diffraction. Int. J. Coal Geol. 2016, 163, 166–176. [Google Scholar] [CrossRef]
- Zhang, K.; Li, Y.; Wang, Z.; Li, Q.; Whiddon, R.; He, Y.; Cen, K. Pyrolysis behavior of a typical Chinese sub-bituminous Zhundong coal from moderate to high temperatures. Fuel 2016, 185, 701–708. [Google Scholar] [CrossRef]
- Huan, X.; Tang, Y.G.; Xu, J.J.; Lan, C.Y.; Wang, S.Q. Structural characterization of graphenic material prepared from anthracites of different characteristics: A comparative analysis. Fuel Process. Technol. 2019, 183, 8–18. [Google Scholar] [CrossRef]
- Hu, J.; Chen, Y.; Qian, K.; Yang, Z.; Yang, H.; Li, Y.; Chen, H. Evolution of char structure during mengdong coal pyrolysis: Influence of temperature and K2CO3. Fuel Process. Technol. 2017, 159, 178–186. [Google Scholar] [CrossRef]
- Chen, Y.; Mastalerz, M.; Schimmelmann, A. Characterization of chemical functional groups in macerals across different coal ranks via Micro-FTIR spectroscopy. Int. J. Coal Geol. 2012, 104, 22–33. [Google Scholar] [CrossRef]
- Zhao, Y.; Liu, L.; Qiu, P.H.; Xie, X.; Chen, X.Y.; Lin, D.; Sun, S.Z. Impacts of chemical fractionation on Zhundong coal’s chemical structure and pyrolysis reactivity. Fuel Process. Technol. 2017, 155, 144–152. [Google Scholar] [CrossRef]
- Martínez-Tarazona, M.R.; Spears, D.A.; Palacios, J.; Martínez-Alonso, A.; Tascón, J.M.D. Mineral matter in coals of different rank from the Asturian Central basin. Fuel 1992, 71, 367–372. [Google Scholar] [CrossRef]
- Baruah, M.K.; Kotoky, P.; Borah, G.C. Distribution and nature of organic/mineral bound elements in Assam coals, India. Fuel 2003, 82, 1783–1791. [Google Scholar] [CrossRef]
- Ibarra, J.; Palacios, J.; de Andrés, A.M. Analysis of coal and char ashes and their ability for sulphur retention. Fuel 1989, 68, 861–867. [Google Scholar] [CrossRef]
- Painter, P.C.; Coleman, M.M.; Jenkins, R.G.; Whang, P.W.; Walker, P.L. Fourier Transform Infrared study of mineral matter in coal. A novel method for quantitative mineralogical analysis. Fuel 1978, 57, 337–344. [Google Scholar] [CrossRef]
- Mukherjee, S.; Srivastava, S. Minerals transformations in northeastern region coals of India on heat treatment. Energy Fuels 2006, 20, 1089–1096. [Google Scholar] [CrossRef]
- Mozgawa, W.; Król, M.; Dyczek, J.; Deja, J. Investigation of the coal fly ashes using IR spectroscopy. Spectrochim. Acta Part A 2014, 132, 889–894. [Google Scholar] [CrossRef] [PubMed]
- Ibarra, J.; Munoz, E.; Moliner, R. FTIR study of the evolution of coal structure during the coalification process. Org. Geochem. 1996, 24, 725–735. [Google Scholar] [CrossRef]
- Koch, A.; Krzton, A.; Finqueneisel, G.; Heintz, O.; Weber, J.V.; Zimny, T. A study of carbonaceous char oxidation in air by semi-quantitative FTIR spectroscopy. Fuel 1998, 77, 563–569. [Google Scholar] [CrossRef]
- Sheng, C. Char structure characterised by Raman spectroscopy and its correlations with combustion reactivity. Fuel 2007, 86, 2316–2324. [Google Scholar] [CrossRef]
- Chen, X.; Wu, H. Volatile-char interactions: Roles of in situ volatiles with distinctly-different chemistry in determining char structure and reactivity. Proc. Combust. Inst. 2019, 37, 2749–2755. [Google Scholar] [CrossRef]
- Li, X.; Hayashi, J.I.; Li, C.Z. FT-Raman spectroscopic study of the evolution of char structure during the pyrolysis of a Victorian brown coal. Fuel 2006, 85, 1700–1707. [Google Scholar] [CrossRef]
- Wu, H.; Yip, K.; Tian, F.; Xie, Z.; Li, C.Z. Evolution of char structure during the steam gasification of biochars produced from the pyrolysis of various mallee biomass components. Ind. Eng. Chem. Res. 2009, 48, 10431–10438. [Google Scholar] [CrossRef]
- Xu, J.; Tang, H.; Su, S.; Liu, J.; Xu, K.; Qian, K.; Wang, Y.; Zhou, Y.; Hu, S.; Zhang, A.; et al. A study of the relationships between coal structures and combustion characteristics: The insights from micro-Raman spectroscopy based on 32 kinds of Chinese coals. Appl. Energy 2018, 212, 46–56. [Google Scholar] [CrossRef]
- Vandenabeele, P.; Edwards, H.G.; Moens, L. A decade of Raman spectroscopy in art and archaeology. Chem. Rev. 2007, 107, 675–686. [Google Scholar] [CrossRef] [PubMed]
- Silva, L.; Sampaio, C.; Guedes, A.; de Vallejuelo, S.F.O.; Madariaga, J. Multianalytical approaches to the characterisation of minerals associated with coals and the diagnosis of their potential risk by using combined instrumental microspectroscopic techniques and thermodynamic speciation. Fuel 2012, 94, 52–63. [Google Scholar] [CrossRef]
- Valentim, B.; Shreya, N.; Paul, B.; Gomes, C.S.; Sant’Ovaia, H.; Guedes, A.; Ribeiro, J.; Flores, D.; Pinho, S.; Suárez-Ruiz, I. Characteristics of ferrospheres in fly ashes derived from Bokaro and Jharia (Jharkand, India) coals. Int. J. Coal Geol. 2016, 153, 52–74. [Google Scholar] [CrossRef]
- Guedes, A.; Valentim, B.; Prieto, A.C.; Sanz, A.; Flores, D.; Noronha, F. Characterization of fly ash from a power plant and surroundings by micro-Raman spectroscopy. Int. J. Coal Geol. 2008, 73, 359–370. [Google Scholar] [CrossRef]
- Lafuente, B.; Downs, R.T.; Yang, H.; Stone, N. The power of databases: The RRUFF project. In Highlights in Mineralogical Crystallography; Armbruster, T., Danisi, R.M., Eds.; W. De Gruyter: Berlin, Germany, 2015; pp. 1–30. [Google Scholar]
- Ibarra, J.; Moliner, R.; Bonet, A.J. FT-i.r. investigation on char formation during the early stages of coal pyrolysis. Fuel 1994, 73, 918–924. [Google Scholar] [CrossRef]
- Kumar, R.; Bansal, V.; Badhe, R.; Madhira, I.S.S.; Sugumaran, V.; Ahmed, S.; Christopher, J.; Patel, M.B.; Basu, B. Characterization of Indian origin oil shale using advanced analytical techniques. Fuel 2013, 113, 610–616. [Google Scholar] [CrossRef]
- Madejová, J.; Komadel, P. Baseline studies of the clay minerals society source clays: Infrared methods. Clays Clay Miner. 2001, 49, 410–432. [Google Scholar] [CrossRef]
- Saikia, N.; Bharali, D.; Sengupta, P.; Bordoloi, D.; Goswamee, R.; Saikia, P.; Borthakur, P. Characterization, beneficiation and utilization of a kaolinite clay from Assam, India. Appl. Clay Sci. 2003, 24, 93–103. [Google Scholar] [CrossRef]
- Shoval, S.; Beck, P. Thermo-FTIR spectroscopy analysis as a method of characterizing ancient ceramic technology. J. Therm. Anal. Calorim. 2005, 82, 609–616. [Google Scholar] [CrossRef]
- Fabbri, B.; Gualtieri, S.; Leonardi, C. Modifications induced by the thermal treatment of kaolin and determination of reactivity of metakaolin. Appl. Clay Sci. 2013, 73, 2–10. [Google Scholar] [CrossRef]
- Yin, Y.; Yin, J.; Zhang, W.; Tian, H.; Hu, Z.; Ruan, M.; Xu, H.; Liu, L.; Yan, X.; Chen, D. FT-IR and micro-Raman spectroscopic characterization of minerals in high-calcium coal ashes. J. Energy Inst. 2018, 91, 389–396. [Google Scholar] [CrossRef]
- Kakali, G.; Perraki, T.; Tsivilis, S.; Badogiannis, E. Thermal treatment of kaolin: The effect of mineralogy on the pozzolanic activity. Appl. Clay Sci. 2001, 20, 73–80. [Google Scholar] [CrossRef]
- Ramasamy, V.; Rajkumar, P.; Ponnusamy, V. Depth wise analysis of recently excavated Vellar river sediments through FTIR and XRD studies. Indian J. Phys. 2009, 83, 1295–1308. [Google Scholar] [CrossRef]
- De Benedetto, G.; Laviano, R.; Sabbatini, L.; Zambonin, P. Infrared spectroscopy in the mineralogical characterization of ancient pottery. J. Cult. Herit. 2002, 3, 177–186. [Google Scholar] [CrossRef]
- Makreski, P.; Jovanovski, G.; Dimitrovska, S. Minerals from Macedonia: XIV. Identification of some sulfate minerals by vibrational (infrared and Raman) spectroscopy. Vib. Spectrosc. 2005, 39, 229–239. [Google Scholar] [CrossRef]
- Madejová, J. FTIR techniques in clay mineral studies. Vib. Spectrosc. 2003, 31, 1–10. [Google Scholar] [CrossRef]
- Makreski, P.; Jovanovski, G.; Kaitner, B. Minerals from Macedonia. XXIV. Spectra-Structure characterization of tectosilicates. J. Mol. Struct. 2009, 924, 413–419. [Google Scholar] [CrossRef]
- Pusz, S.; Krztoń, A.; Komraus, J.; Martinez-Tarazona, M.; Martinez-Alonso, A.; Tascon, J. Interactions between organic matter and minerals in two bituminous coals of different rank. Int. J. Coal Geol. 1997, 33, 369–386. [Google Scholar] [CrossRef]
- Shoval, S.; Panczer, G.; Boudeulle, M. Study of the occurrence of titanium in kaolinites by micro-Raman spectroscopy. Opt. Mater. 2008, 30, 1699–1705. [Google Scholar] [CrossRef]
- Ohsaka, T.; Izumi, F.; Fujiki, Y. Raman spectrum of anatase, TiO2. J. Raman Spectrosc. 1978, 7, 321–324. [Google Scholar] [CrossRef]
- Antunes, V.; Candeias, A.; Oliveira, M.J.; Longelin, S.; Serrão, V.; Seruya, A.I.; Coroado, J.; Dias, L.; Mirão, J.; Carvalho, M.L. Characterization of gypsum and anhydrite ground layers in 15th and 16th centuries Portuguese paintings by Raman spectroscopy and other techniques. J. Raman Spectrosc. 2014, 45, 1026–1033. [Google Scholar] [CrossRef]
- Ayora-Cañada, M.; Domínguez-Arranz, A.; Dominguez-Vidal, A. Raman Microspectroscopic study of Iberian pottery from the La Vispesa archaeological site, Spain. J. Raman Spectrosc. 2012, 43, 317–322. [Google Scholar] [CrossRef]
- De Faria, D.; Venâncio Silva, S.; De Oliveira, M. Raman microspectroscopy of some iron oxides and oxyhydroxides. J. Raman Spectrosc. 1997, 28, 873–878. [Google Scholar] [CrossRef]
- Vassileva, C.G.; Vassilev, S.V. Behaviour of inorganic matter during heating of Bulgarian coals: 1. Lignites. Fuel Process. Technol. 2005, 86, 1297–1333. [Google Scholar] [CrossRef]
- Gridi-Bennadji, F.; Beneu, B.; Laval, J.-P.; Blanchart, P. Structural transformations of muscovite at high temperature by X-ray and neutron diffraction. Appl. Clay Sci. 2008, 38, 259–267. [Google Scholar] [CrossRef]
- Bryers, R.W. Fireside slagging, fouling, and high-temperature corrosion of heat-transfer surface due to impurities in steam-raising fuels. Prog. Energy Combust. Sci. 1996, 22, 29–120. [Google Scholar] [CrossRef]


© 2019 by the authors. Licensee MDPI, Basel, Switzerland. This article is an open access article distributed under the terms and conditions of the Creative Commons Attribution (CC BY) license (http://creativecommons.org/licenses/by/4.0/).