A Computational Study of Defects, Li-Ion Migration and Dopants in Li2ZnSiO4 Polymorphs

 and
and 
Abstract
:
1. Introduction
2. Computational Methods
3. Results
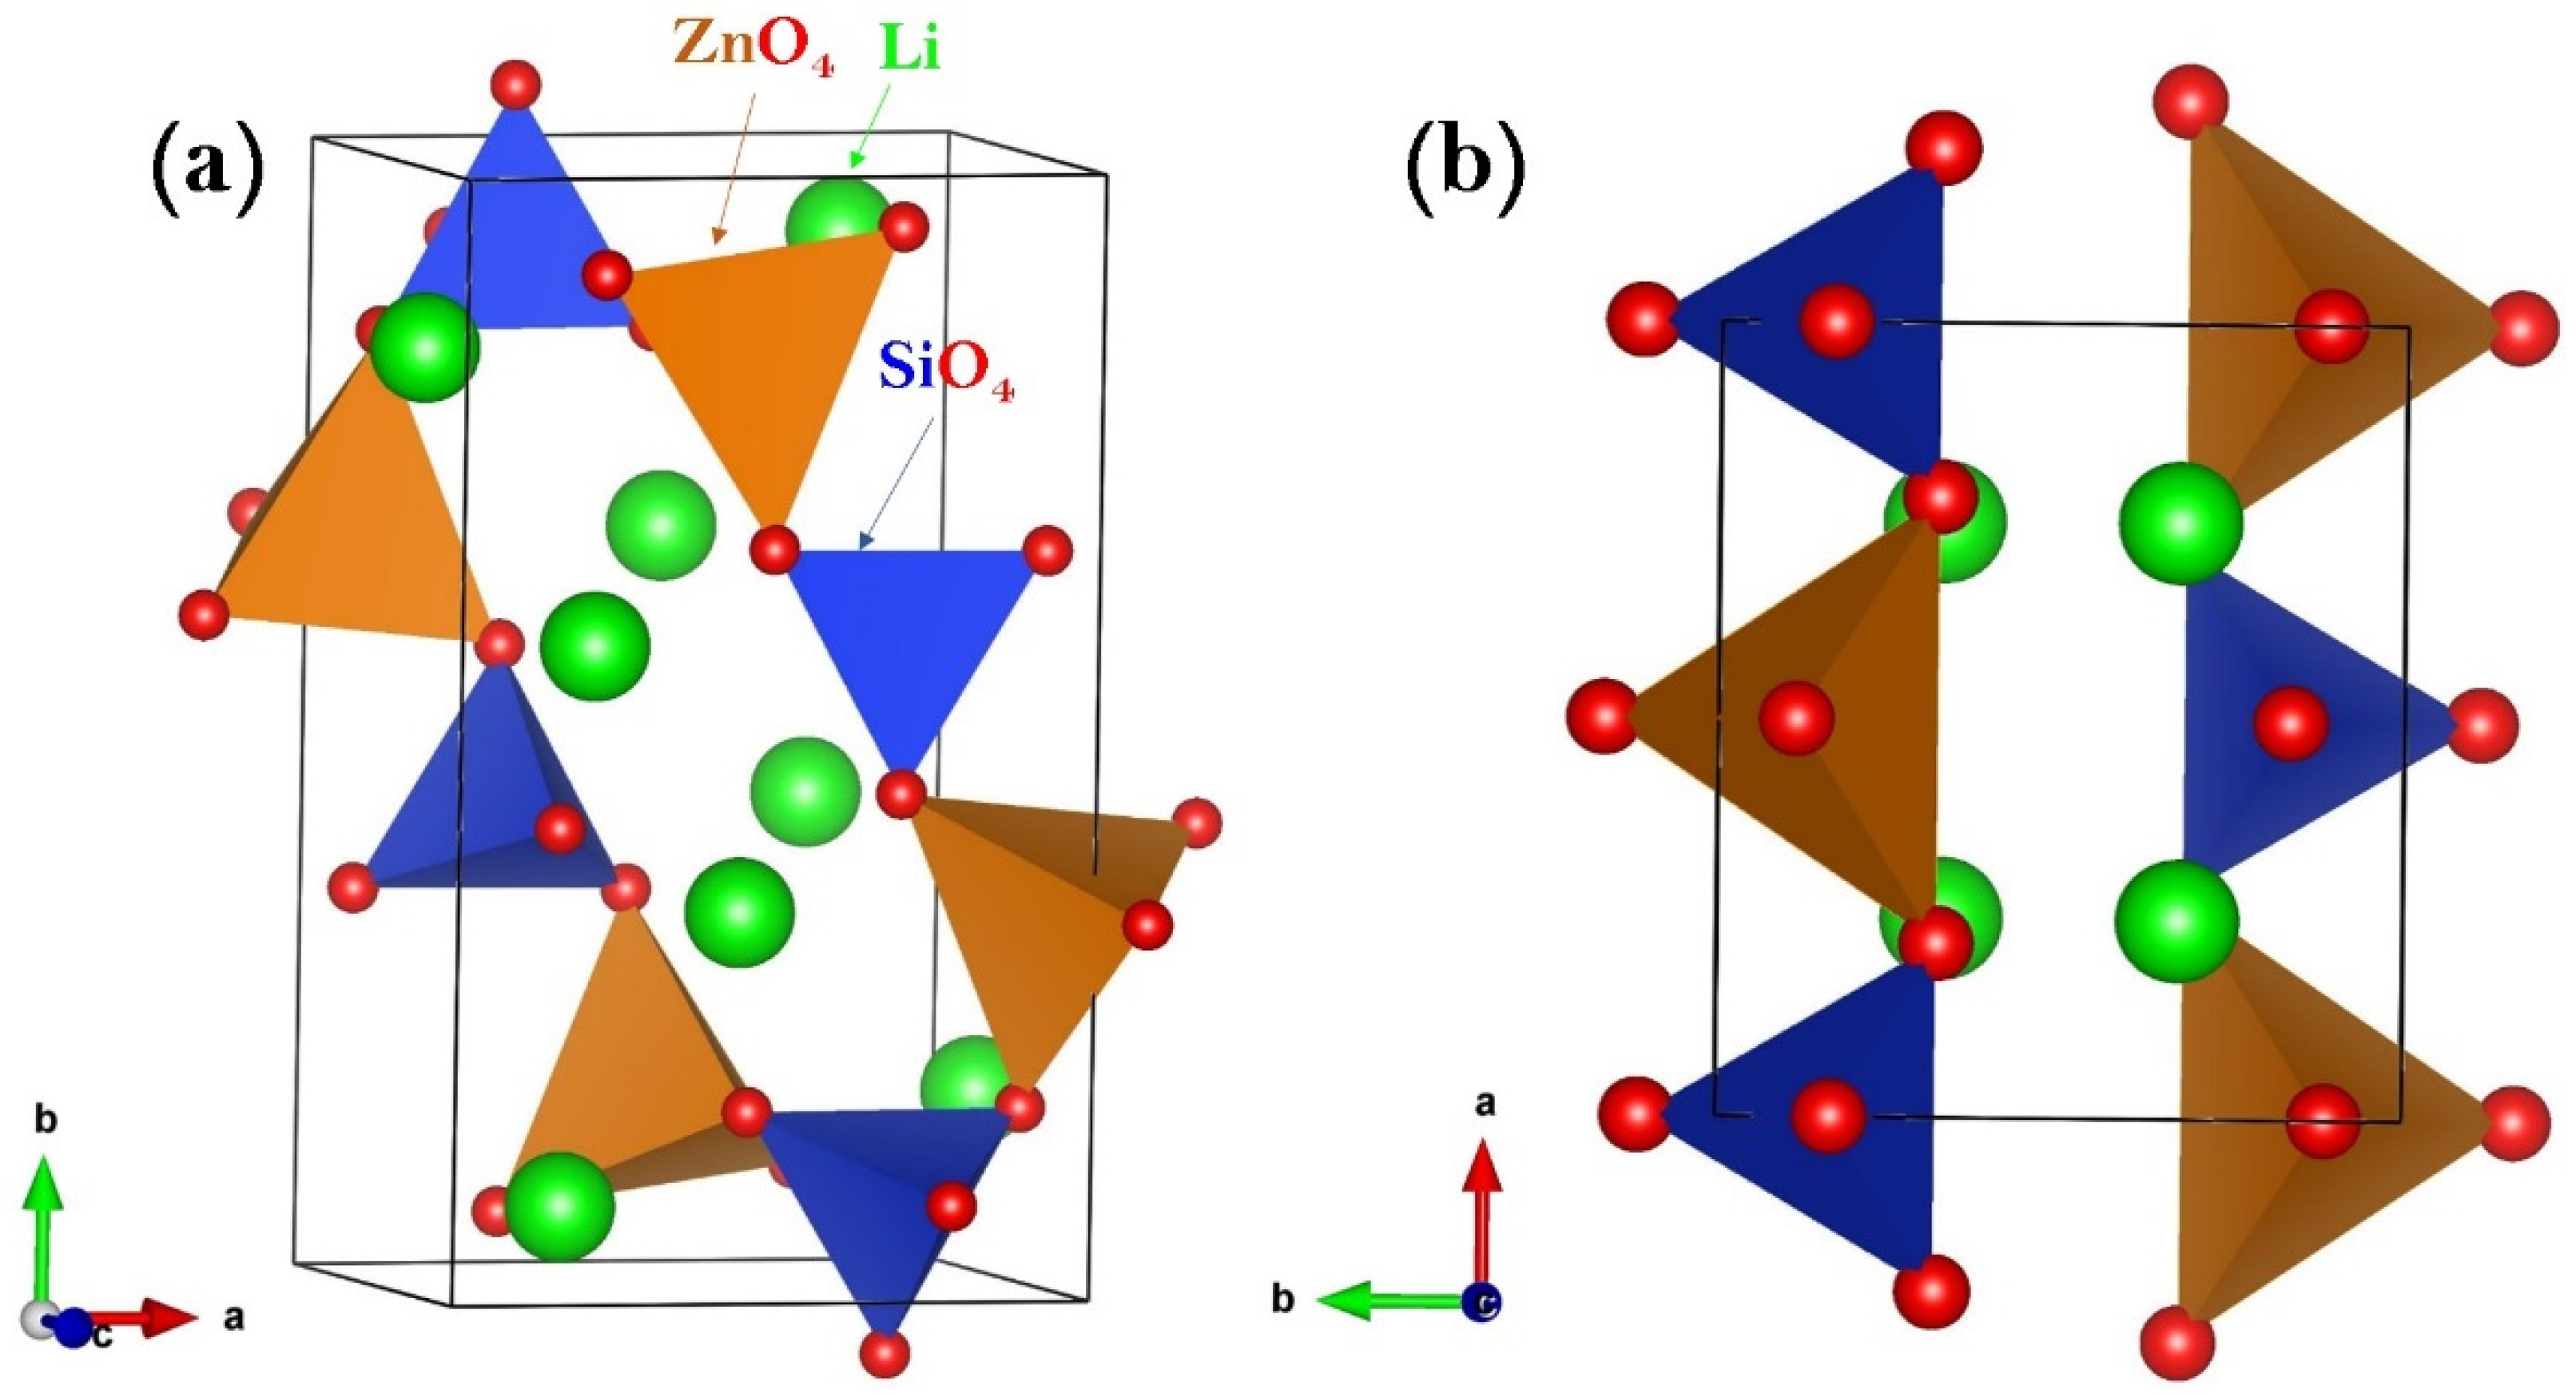
3.1. Li2ZnSiO4 Crystal Structures
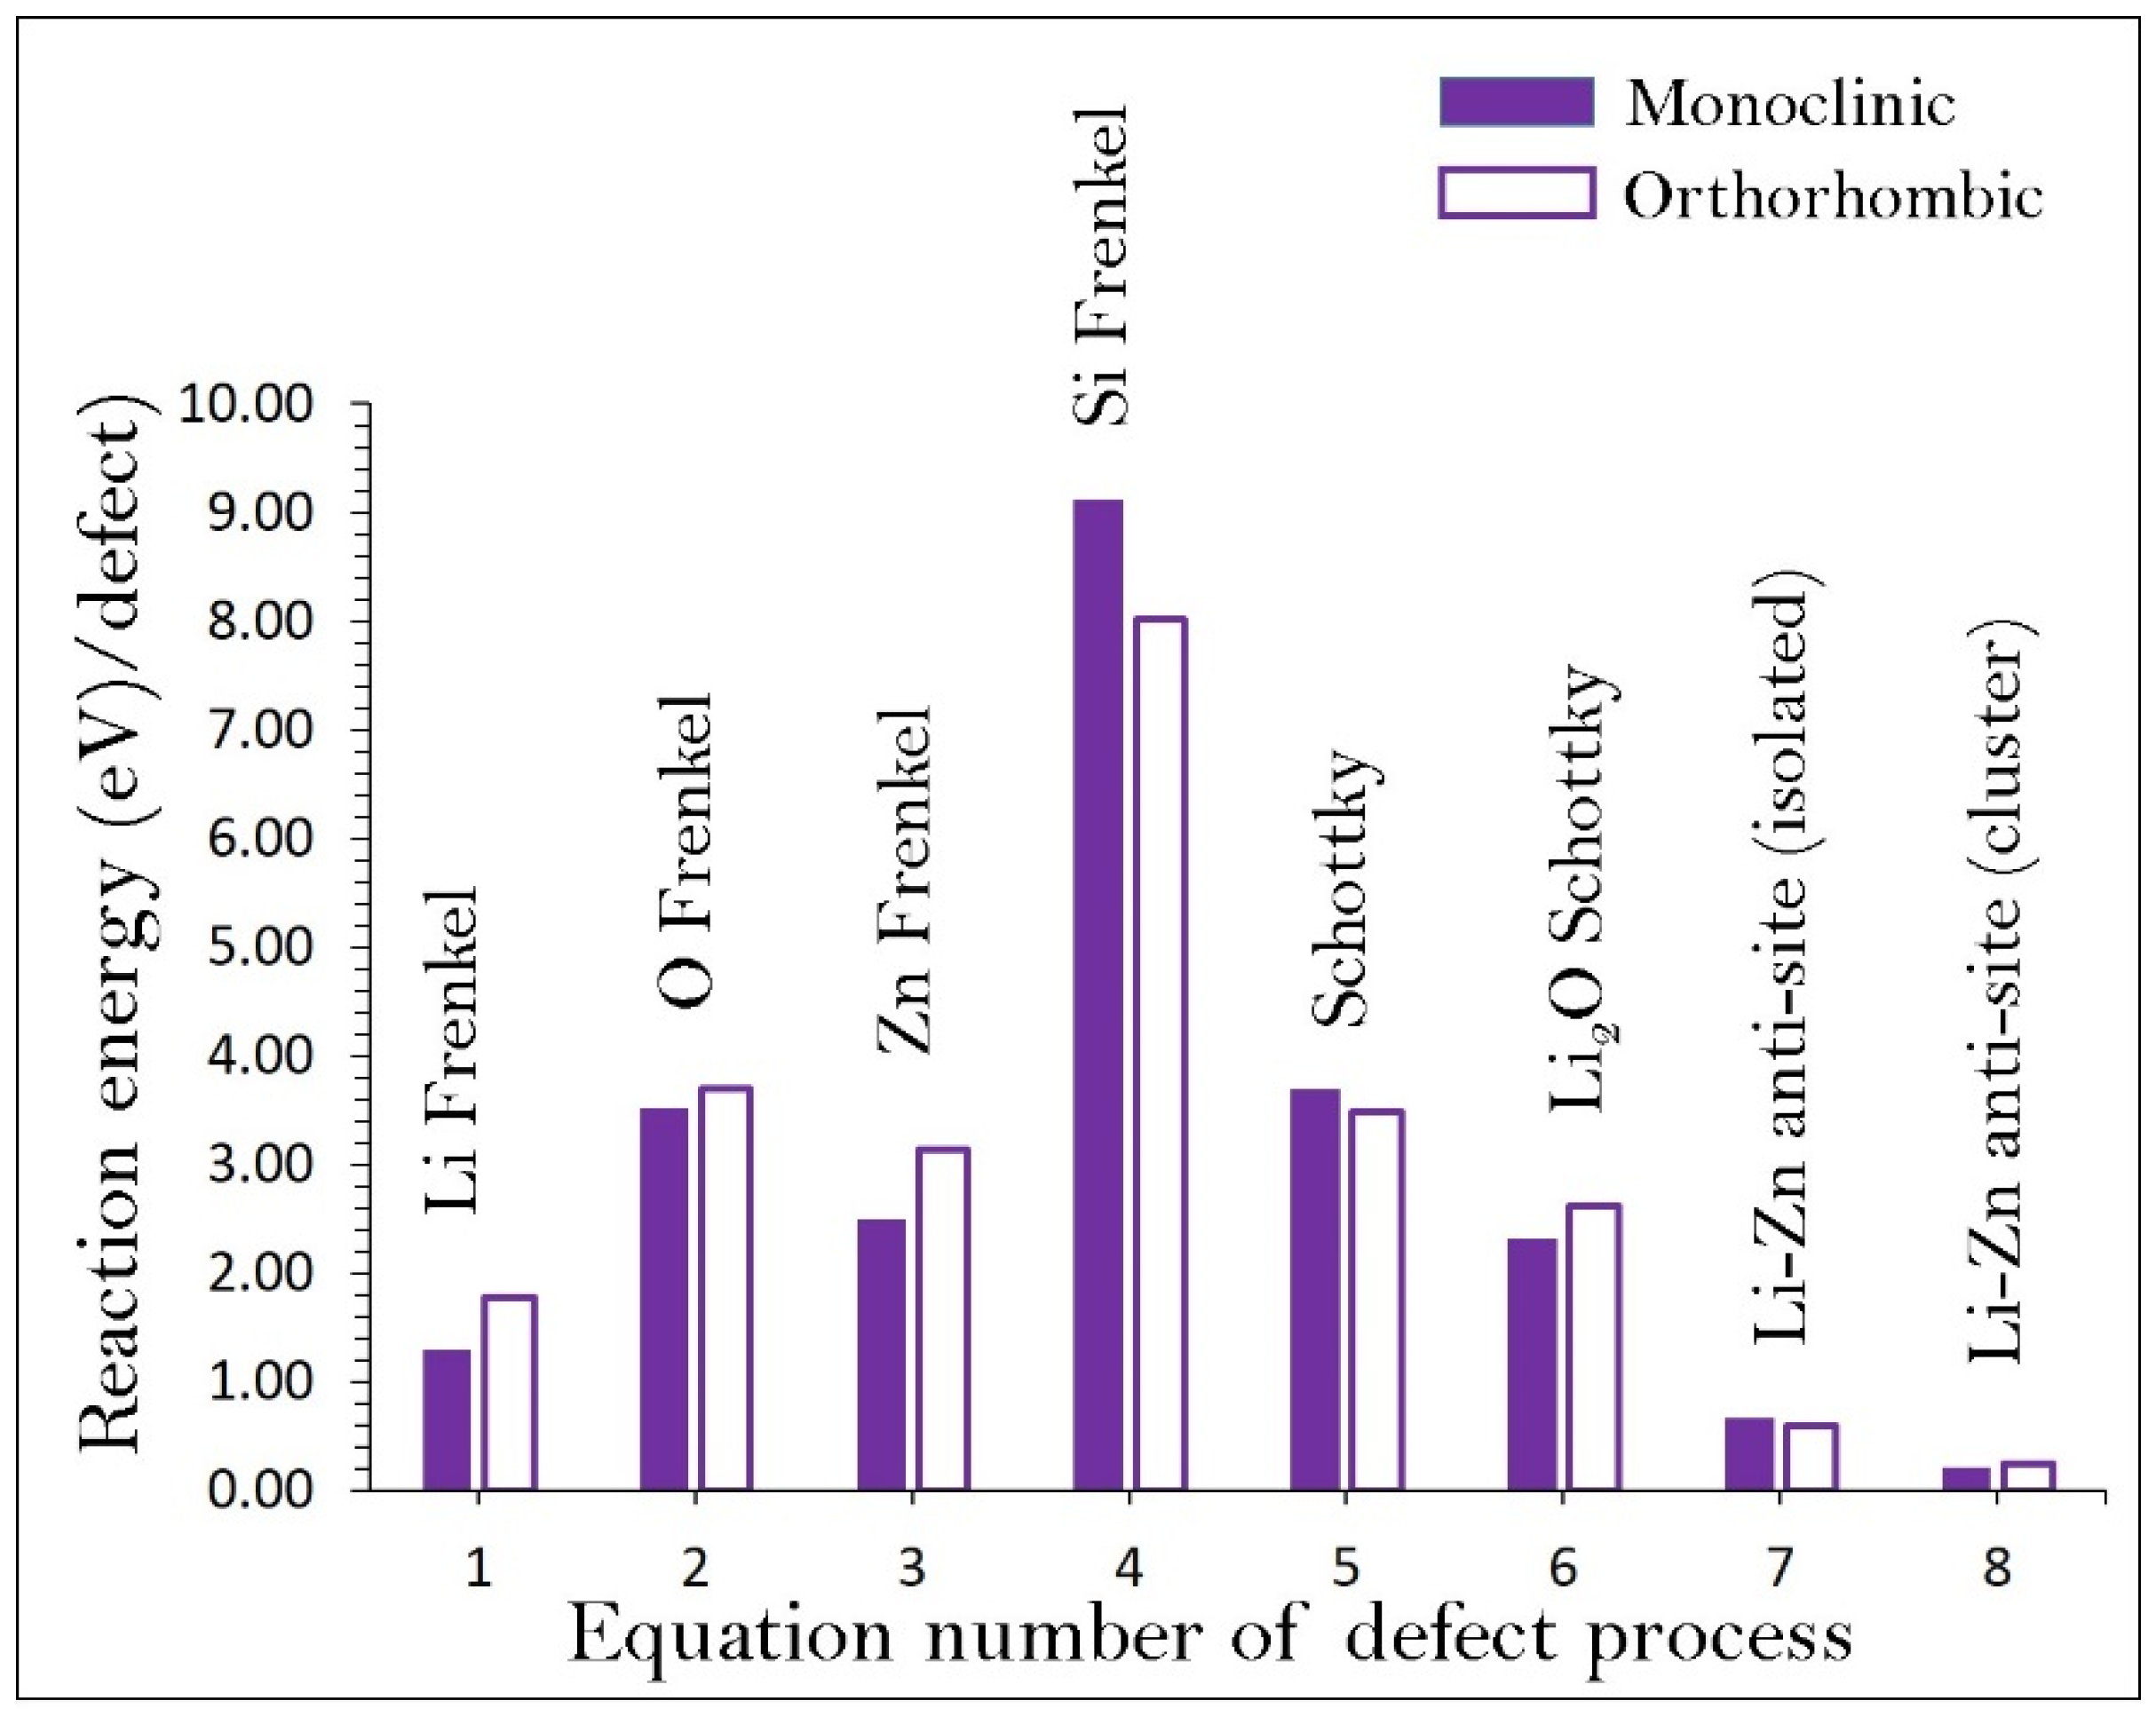
3.2. Intrinsic Defect Processes
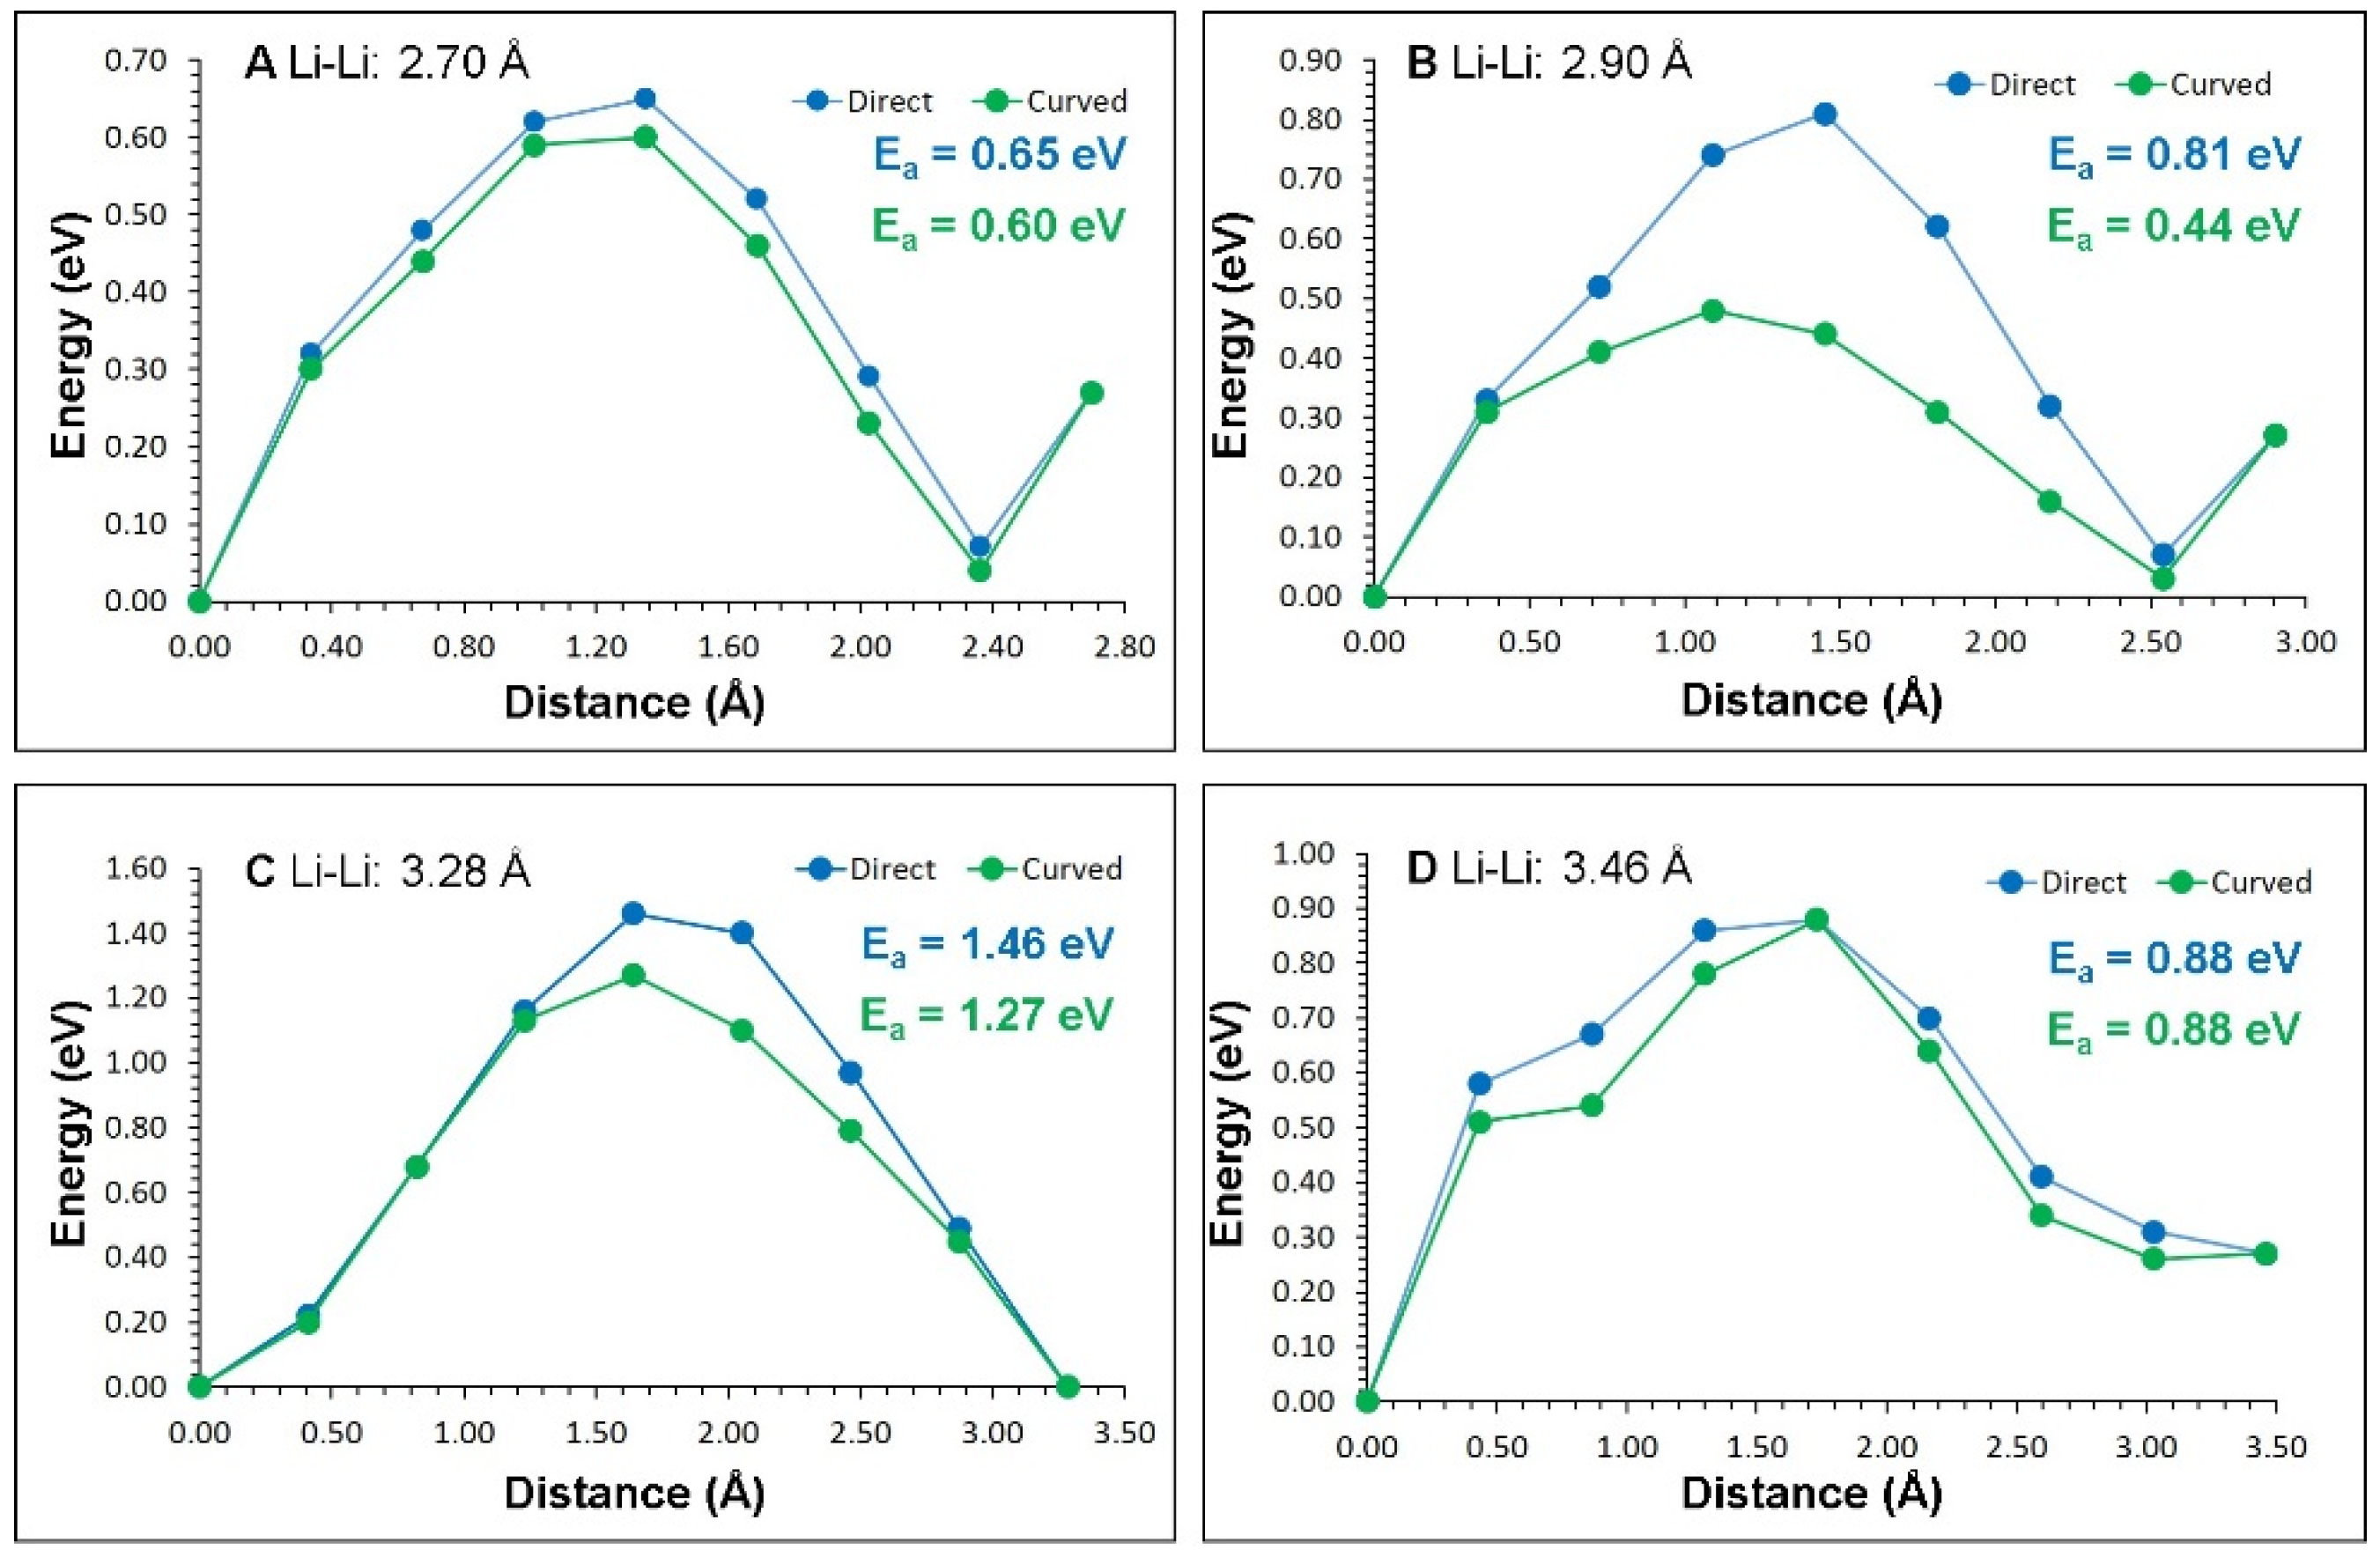
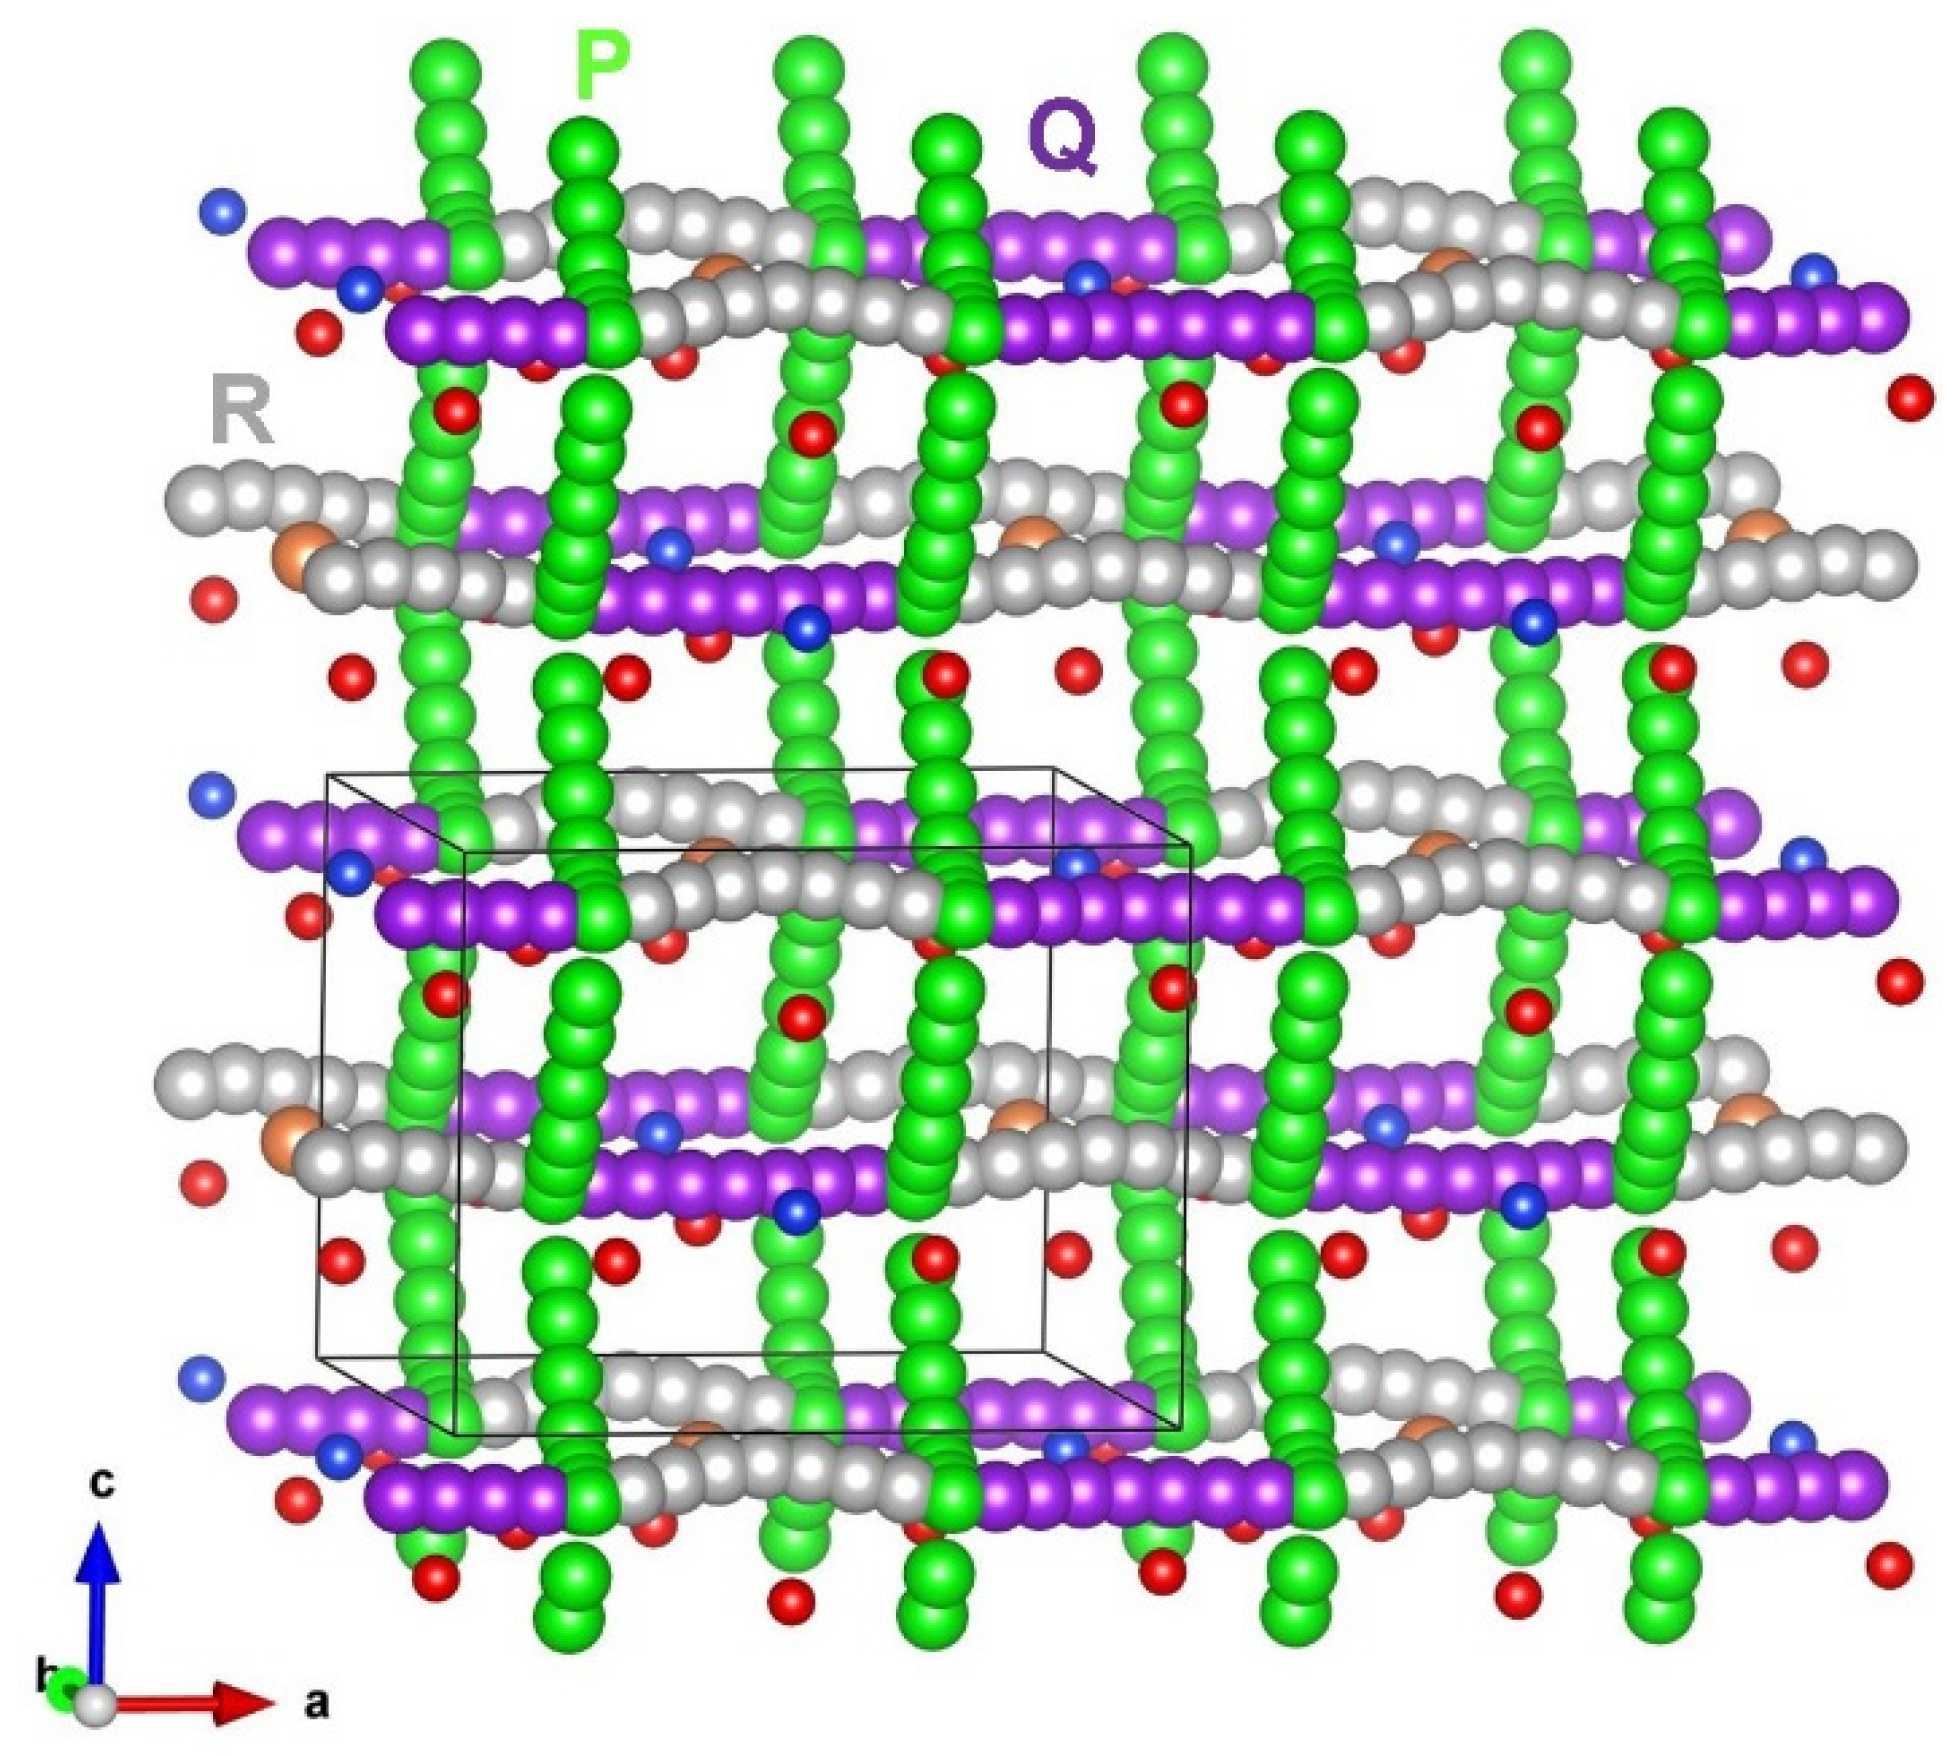
3.3. Lithium Ion Diffusion
3.4. Divalent Dopants
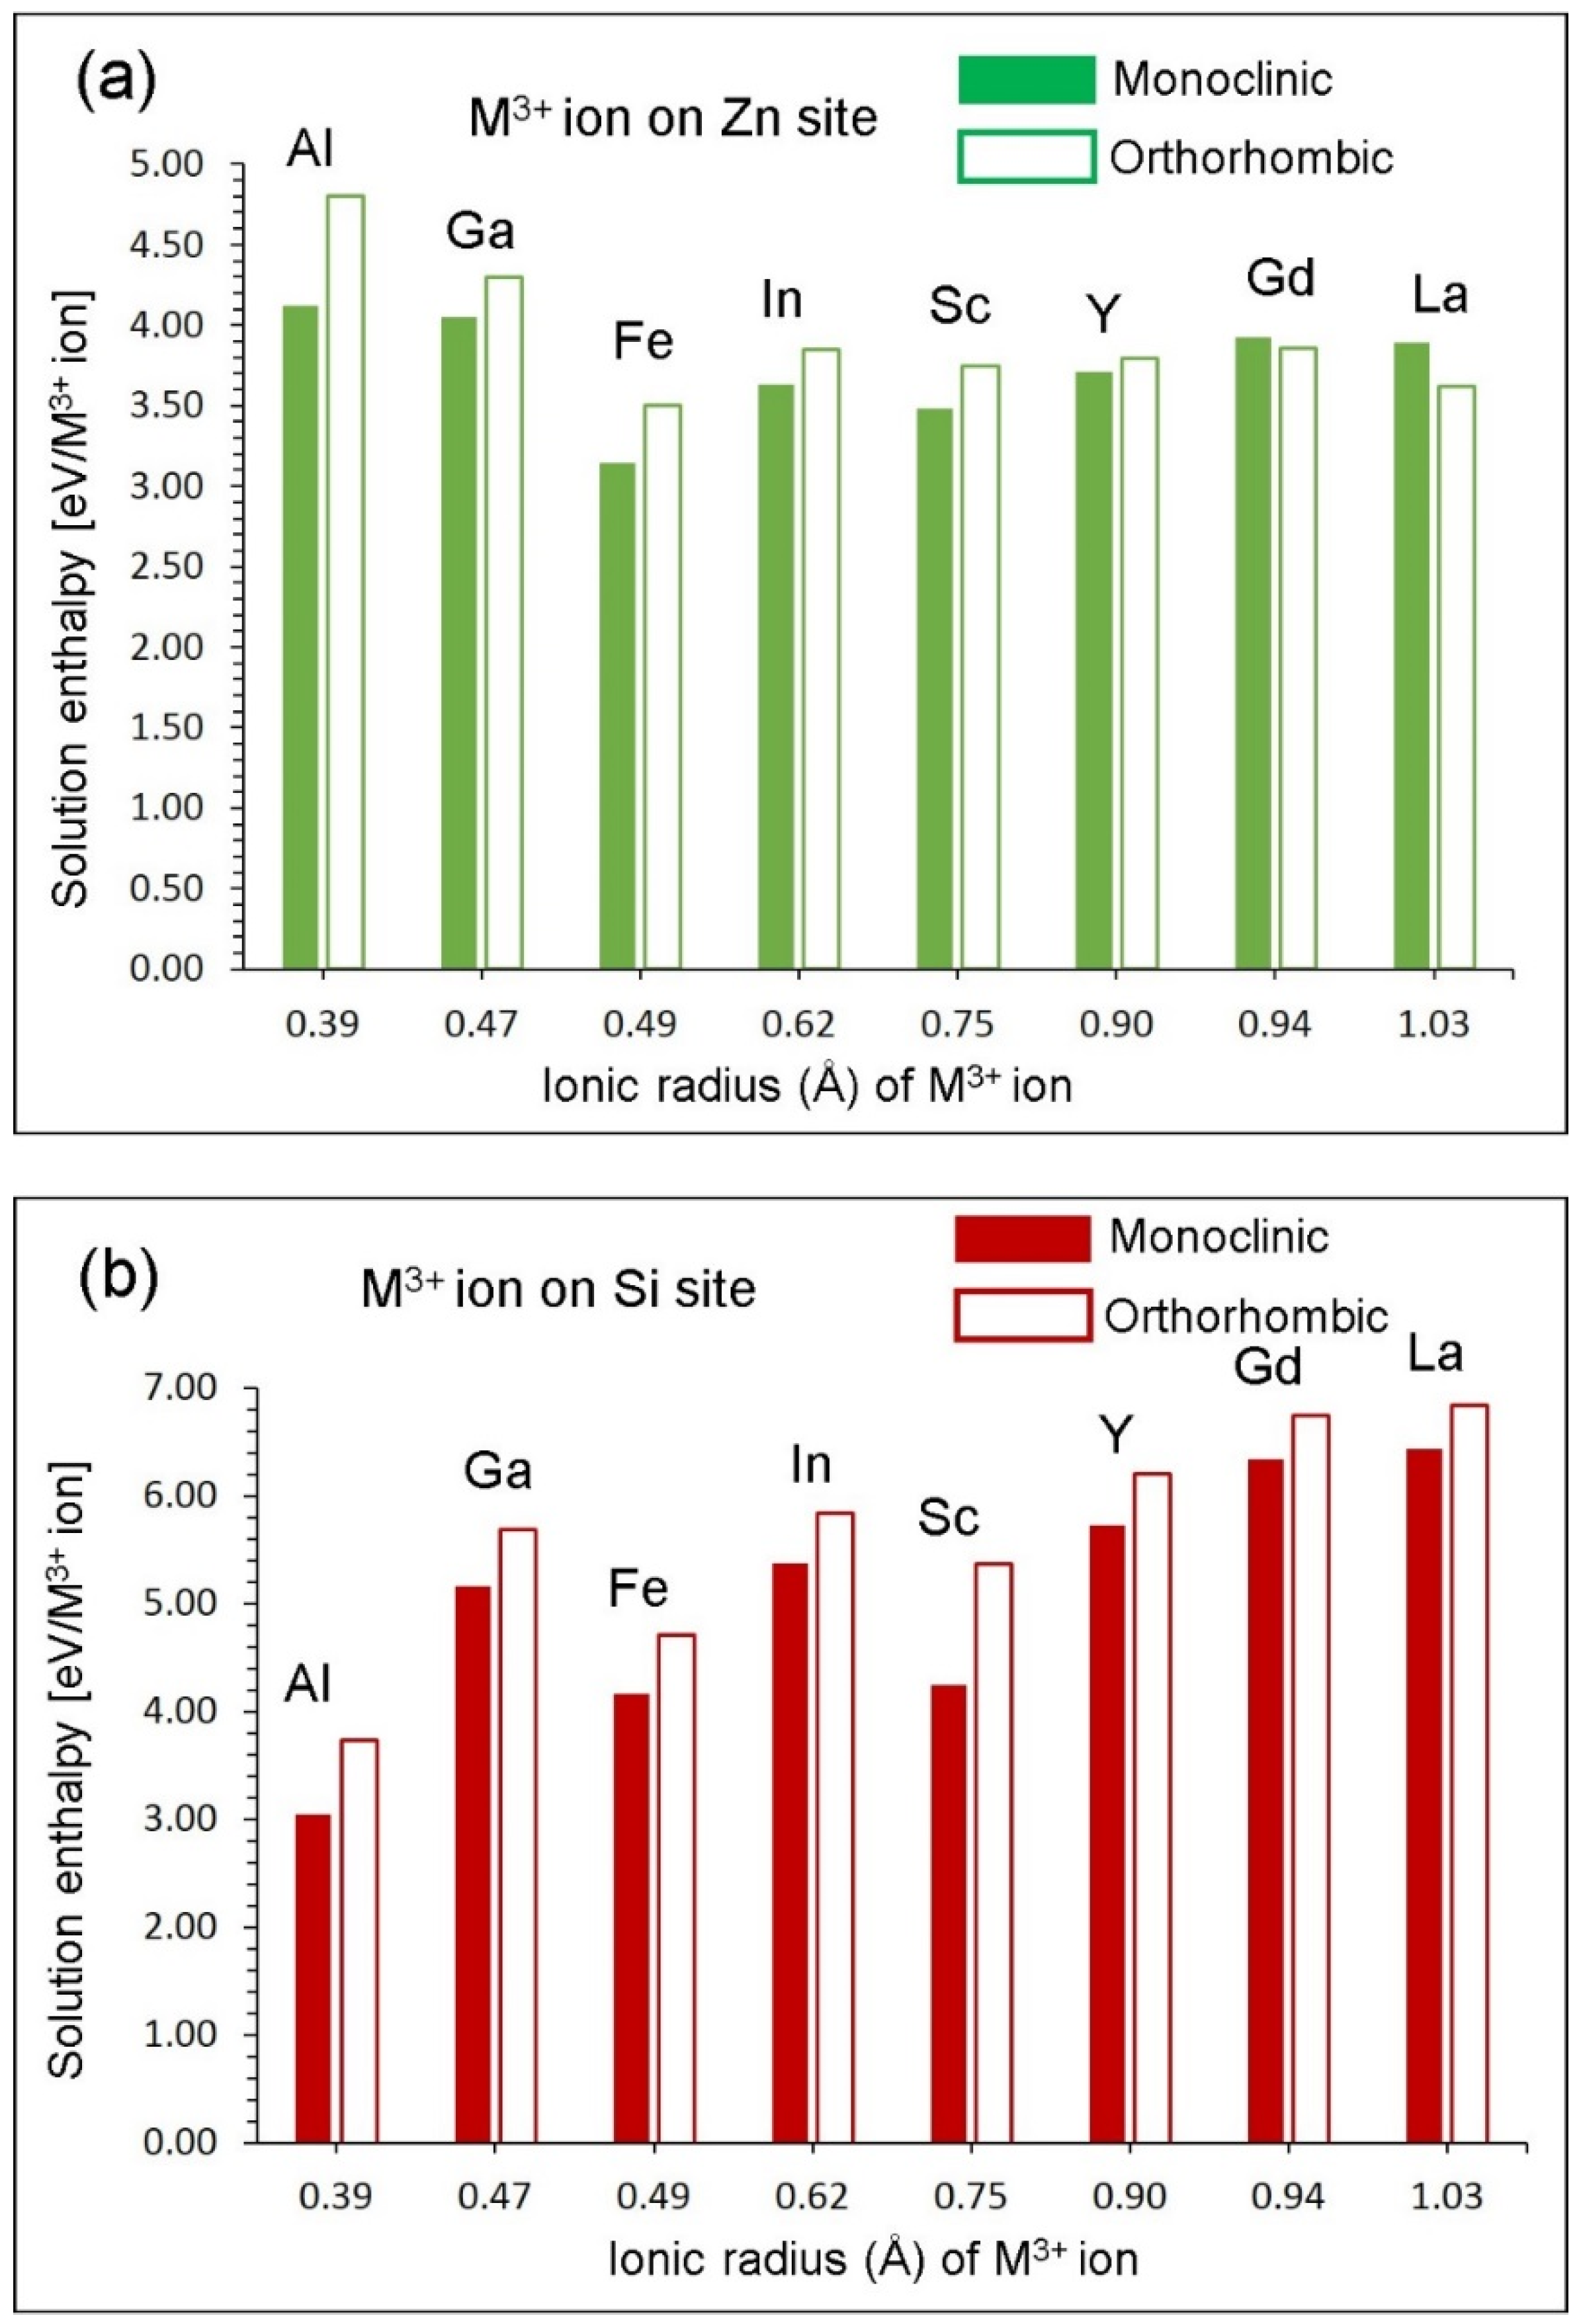
3.5. Trivalent Doping
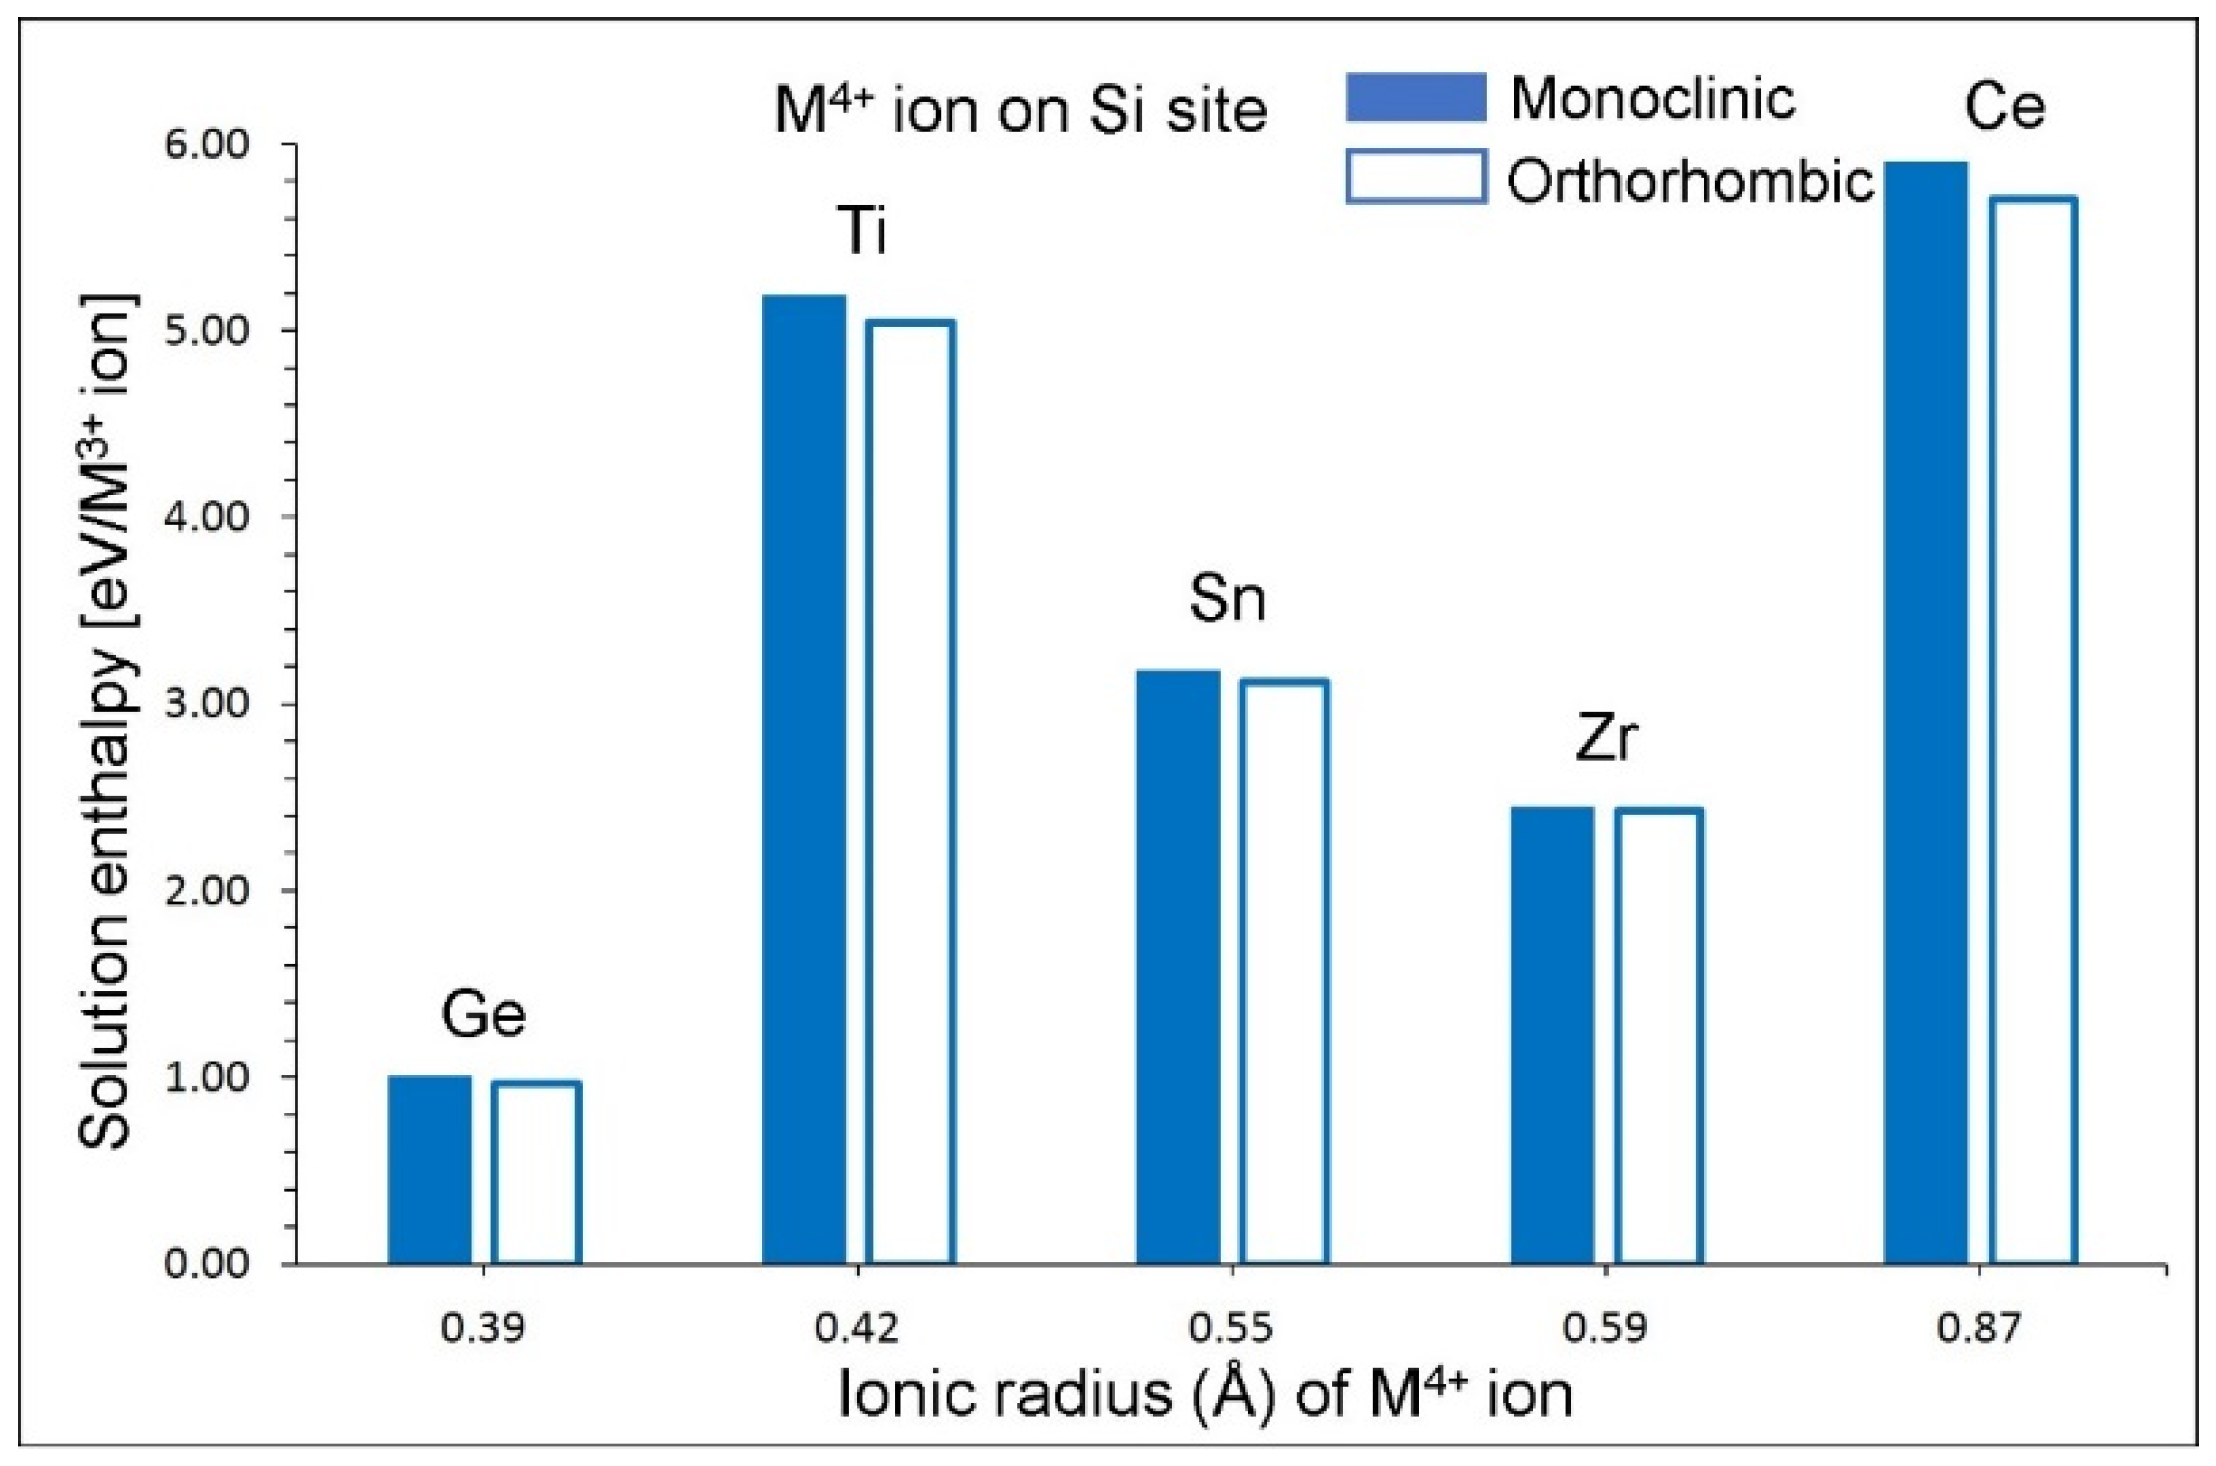
3.6. Tetravalent Doping
4. Conclusions
Supplementary Materials
Author Contributions
Funding
Acknowledgments
Conflicts of Interest
References
- Padhi, A.K.; Nanjundaswamy, K.S.; Goodenough, J.B. Phospho-olivines as Positive-Electrode Materials for Rechargeable Lithium Batteries. J. Electrochem. Soc. 1997, 144, 1188–1194. [Google Scholar]
- Goodenough, J.B.; Kim, Y. Challenges for Rechargeable Li Batteries. Chem. Mater. 2010, 22, 587–603. [Google Scholar]
- Yabuuchi, N.; Kubota, K.; Dahbi, M.; Komaba, S. Research Development on Sodium-Ion Batteries. Chem. Rev. 2014, 114, 11636–11682. [Google Scholar]
- Nytén, A.; Abouimrane, A.; Armand, M.; Gustafsson, T.; Thomas, J.O. Electrochemical performance of Li2FeSiO4 as a new Li-battery cathode material. Electrochem. Commun. 2005, 7, 156–160. [Google Scholar]
- Islam, M.S.; Fisher, C.A.J. Lithium and sodium battery cathode materials: computational insights into voltage, diffusion and nanostructural properties. Chem. Soc. Rev. 2014, 43, 185–204. [Google Scholar]
- Tarascon, J.M.; Armand, M. Issues and challenges facing rechargeable lithium batteries. Nature 2001, 414, 359. [Google Scholar]
- Hwang, J.-Y.; Myung, S.-T.; Sun, Y.-K. Sodium-ion batteries: Present and future. Chem. Soc. Rev. 2017, 46, 3529–3614. [Google Scholar]
- Masquelier, C.; Croguennec, L. Polyanionic (Phosphates, Silicates, Sulfates) Frameworks as Electrode Materials for Rechargeable Li (or Na) Batteries. Chem. Rev. 2013, 113, 6552–6591. [Google Scholar]
- Mao, M.; Gao, T.; Hou, S.; Wang, C. A critical review of cathodes for rechargeable Mg batteries. Chem. Soc. Rev. 2018, 47, 8804–8841. [Google Scholar]
- Jay, E.E.; Rushton, M.J.D.; Chroneos, A.; Grimes, R.W.; Kilner, J.A. Genetics of superionic conductivity in lithium lanthanum titanates. Phys. Chem. Chem. Phys. 2015, 17, 178–183. [Google Scholar]
- Kuganathan, N.; Tsoukalas, L.H.; Chroneos, A. Defects, dopants and Li-ion diffusion in Li2SiO3. Solid State Ionics 2019, 335, 61–66. [Google Scholar]
- Islam, M.S.; Dominko, R.; Masquelier, C.; Sirisopanaporn, C.; Armstrong, A.R.; Bruce, P.G. Silicate cathodes for lithium batteries: alternatives to phosphates? J. Mater. Chem. 2011, 21, 9811–9818. [Google Scholar] [Green Version]
- Bao, L.; Gao, W.; Su, Y.; Wang, Z.; Li, N.; Chen, S.; Wu, F. Progression of the silicate cathode materials used in lithium ion batteries. Chinese Sci. Bull. 2013, 58, 575–584. [Google Scholar]
- Ferrari, S.; Mozzati, M.C.; Lantieri, M.; Spina, G.; Capsoni, D.; Bini, M. New materials for Li-ion batteries: Synthesis and spectroscopic characterization of Li2(FeMnCo)SiO4 cathode materials. Sci. Rep. 2016, 6, 27896. [Google Scholar]
- Nytén, A.; Kamali, S.; Häggström, L.; Gustafsson, T.; Thomas, J.O. The lithium extraction/insertion mechanism in Li2FeSiO4. J. Mater. Chem. 2006, 16, 2266–2272. [Google Scholar]
- Nishimura, S.-i.; Hayase, S.; Kanno, R.; Yashima, M.; Nakayama, N.; Yamada, A. Structure of Li2FeSiO4. J. Am. Chem. Soc. 2008, 130, 13212–13213. [Google Scholar]
- Armstrong, A.R.; Kuganathan, N.; Islam, M.S.; Bruce, P.G. Structure and Lithium Transport Pathways in Li2FeSiO4 Cathodes for Lithium Batteries. J. Am. Chem. Soc. 2011, 133, 13031–13035. [Google Scholar]
- Dominko, R.; Bele, M.; Gaberšček, M.; Meden, A.; Remškar, M.; Jamnik, J. Structure and electrochemical performance of Li2MnSiO4 and Li2FeSiO4 as potential Li-battery cathode materials. Electrochem. Commun. 2006, 8, 217–222. [Google Scholar]
- Politaev, V.V.; Petrenko, A.A.; Nalbandyan, V.B.; Medvedev, B.S.; Shvetsova, E.S. Crystal structure, phase relations and electrochemical properties of monoclinic Li2MnSiO4. J. Solid State Chem. 2007, 180, 1045–1050. [Google Scholar]
- Dominko, R. Li2MSiO4 (M=Fe and/or Mn) cathode materials. J. Power Sources 2008, 184, 462–468. [Google Scholar]
- Girish, H.N.; Shao, G.Q. Advances in high-capacity Li2MSiO4 (M = Mn, Fe, Co, Ni, …) cathode materials for lithium-ion batteries. RSC Adv. 2015, 5, 98666–98686. [Google Scholar]
- Zhang, L.-L.; Duan, S.; Yang, X.-L.; Peng, G.; Liang, G.; Huang, Y.-H.; Jiang, Y.; Ni, S.-B.; Li, M. Reduced Graphene Oxide Modified Li2FeSiO4/C Composite with Enhanced Electrochemical Performance as Cathode Material for Lithium Ion Batteries. ACS Appl. Mater. Inter. 2013, 5, 12304–12309. [Google Scholar]
- Eames, C.; Armstrong, A.R.; Bruce, P.G.; Islam, M.S. Insights into Changes in Voltage and Structure of Li2FeSiO4 Polymorphs for Lithium-Ion Batteries. Chem. Mater. 2012, 24, 2155–2161. [Google Scholar]
- Liivat, A.; Thomas, J.O. Li-ion migration in Li2FeSiO4-related cathode materials: A DFT study. Solid State Ionics 2011, 192, 58–64. [Google Scholar]
- Kuganathan, N.; Islam, M.S. Li2MnSiO4 Lithium Battery Material: Atomic-Scale Study of Defects, Lithium Mobility, and Trivalent Dopants. Chem. Mater. 2009, 21, 5196–5202. [Google Scholar]
- Fisher, C.A.J.; Kuganathan, N.; Islam, M.S. Defect chemistry and lithium-ion migration in polymorphs of the cathode material Li2MnSiO4. J. Mater. Chem. A 2013, 1, 4207–4214. [Google Scholar]
- Adnan, S.B.R.S.; Mohamed, N.S. Conductivity and Dielectric Studies of Li2ZnSiO4 Ceramic Electrolyte Synthesized via Citrate Sol Gel Method. Int. J. Electrochem. Sci. 2012, 7, 9844–9858. [Google Scholar]
- Sivagami, I.N.; Prasanna, K.; Santhoshkumar, P.; Jo, Y.N.; Kang, S.H.; Kim, T.H.; Lee, C.W. Synthesis of Novel Lithium Metal Silicate and Its Application in Lithium Ion Batteries as a Potential Cathode Material. J. Nanosci. Nanotech. 2017, 17, 8061–8066. [Google Scholar]
- Zhuang, Y.; Teng, Y.; Luo, J.; Zhu, B.; Chi, Y.; Wu, E.; Zeng, H.; Qiu, J. Broadband optical amplification in silicate glass ceramics containing Li2ZnSiO4:Cr4+ nanocrystals. Appl. Phys. Lett. 2009, 95, 111913. [Google Scholar]
- Seymour, I.D.; Chroneos, A.; Kilner, J.A.; Grimes, R.W. Defect processes in orthorhombic LnBaCo2O5.5 double perovskites. Phys. Chem. Chem. Phys. 2011, 13, 15305–15310. [Google Scholar]
- Chiabrera, F.; Garbayo, I.; López-Conesa, L.; Martín, G.; Ruiz-Caridad, A.; Walls, M.; Ruiz-González, L.; Kordatos, A.; Núñez, M.; Morata, A.; et al. Engineering Transport in Manganites by Tuning Local Nonstoichiometry in Grain Boundaries. Adv. Mater. 2019, 31, 1805360. [Google Scholar]
- Islam, M.S.; Driscoll, D.J.; Fisher, C.A.J.; Slater, P.R. Atomic-Scale Investigation of Defects, Dopants, and Lithium Transport in the LiFePO4 Olivine-Type Battery Material. Chem. Mater. 2005, 17, 5085–5092. [Google Scholar]
- Fisher, C.A.J.; Hart Prieto, V.M.; Islam, M.S. Lithium Battery Materials LiMPO4 (M = Mn, Fe, Co, and Ni): Insights into Defect Association, Transport Mechanisms, and Doping Behavior. Chem. Mater. 2008, 20, 5907–5915. [Google Scholar]
- Treacher, J.C.; Wood, S.M.; Islam, M.S.; Kendrick, E. Na2CoSiO4 as a cathode material for sodium-ion batteries: structure, electrochemistry and diffusion pathways. Phys. Chem. Chem. Phys. 2016, 18, 32744–32752. [Google Scholar]
- Stokes, S.J.; Islam, M.S. Defect chemistry and proton-dopant association in BaZrO3 and BaPrO3. J. Mater. Chem. 2010, 20, 6258–6264. [Google Scholar]
- Kuganathan, N.; Chroneos, A. Defects, Dopants and Sodium Mobility in Na2MnSiO4. Sci. Rep. 2018, 8, 14669. [Google Scholar]
- Kuganathan, N.; Chroneos, A. Defects and dopant properties of Li3V2(PO4)3. Sci. Rep. 2019, 9, 333. [Google Scholar]
- Kuganathan, N.; Kordatos, A.; Chroneos, A. Defect Chemistry and Li-ion Diffusion in Li2RuO3. Sci. Rep. 2019, 9, 550. [Google Scholar]
- Gale, J.D.; Rohl, A.L. The General Utility Lattice Program (GULP). Mol. Simulat. 2003, 29, 291–341. [Google Scholar]
- Gale, J.D. GULP: A computer program for the symmetry-adapted simulation of solids. J. Chem. Soc. 1997, 93, 629–637. [Google Scholar]
- Mott, N.F.; Littleton, M.J. Conduction in polar crystals. I. Electrolytic conduction in solid salts. Trans. Faraday Soc. 1938, 34, 485–499. [Google Scholar]
- Varotsos, P. Comparison of models that interconnect point defect parameters in solids with bulk properties. J. Appl. Phys. 2007, 101, 123503. [Google Scholar]
- Varotsos, P. Defect volumes and the equation of state in α−PbF2. Phys. Rev. B 2007, 76, 092106. [Google Scholar]
- Chroneos, A.; Vovk, R.V. Modeling self-diffusion in UO2 and ThO2 by connecting point defect parameters with bulk properties. Solid State Ionics 2015, 274, 1–3. [Google Scholar]
- Cooper, M.W.D.; Grimes, R.W.; Fitzpatrick, M.E.; Chroneos, A. Modeling oxygen self-diffusion in UO2 under pressure. Solid State Ionics 2015, 282, 26–30. [Google Scholar]
- Sarlis, N.V.; Skordas, E.S. Interconnection of a thermodynamical model for point defect parameters in solids with the dynamical theory of diffusion. Solid State Ionics 2019, 335, 82–85. [Google Scholar]
- Varotsos, P. Point defect parameters in β-PbF2 revisited. Solid State Ionics 2008, 179, 438–441. [Google Scholar]
- Yamaguchi, H.; Akatsuka, K.; Setoguchi, M. Structure of dilithium zinc silicate [gamma]II-Li2ZnSiO4. Acta Crystallogr. Sec. B 1979, 35, 2678–2680. [Google Scholar]
- Kröger, F.A.; Vink, H.J. Relations between the Concentrations of Imperfections in Crystalline Solids. Seitz, F., Turnbull, D., Eds. Solid State Phys. 1956, 3, 307–435. [Google Scholar]
- Ensling, D.; Stjerndahl, M.; Nytén, A.; Gustafsson, T.; Thomas, J.O. A comparative XPS surface study of Li2FeSiO4/C cycled with LiTFSI- and LiPF6-based electrolytes. J. Mater. Chem. 2009, 19, 82–88. [Google Scholar]
- Liu, H.; Choe, M.-J.; Enrique, R.A.; Orvañanos, B.; Zhou, L.; Liu, T.; Thornton, K.; Grey, C.P. Effects of Antisite Defects on Li Diffusion in LiFePO4 Revealed by Li Isotope Exchange. J. Phys. Chem. C 2017, 121, 12025–12036. [Google Scholar]
- Kempaiah Devaraju, M.; Duc Truong, Q.; Hyodo, H.; Sasaki, Y.; Honma, I. Synthesis, characterization and observation of antisite defects in LiNiPO4 nanomaterials. Sci. Rep. 2015, 5, 11041. [Google Scholar]
- Nishimura, S.-i.; Kobayashi, G.; Ohoyama, K.; Kanno, R.; Yashima, M.; Yamada, A. Experimental visualization of lithium diffusion in LixFePO4. Nat. Mater. 2008, 7, 707. [Google Scholar]
- Kostopoulos, D.; Varotsos, P.; Mourikis, S. The Conductivity of Crystalline NaI. Can. J. Phys. 1975, 53, 1318–1320. [Google Scholar]
- Varotsos, P.; Miliotis, D. New aspects on the dielectric properties of the alkali halides with divalent impurities. J. Phys. Chem. Solids 1974, 35, 927–930. [Google Scholar]


| Monoclinic | |||
| Parameter | Calculation | Experiment [48] | |∆|(%) |
| a (Å) | 6.2275 | 6.2620 | 0.07 |
| b (Å) | 10.6507 | 10.6020 | 0.55 |
| c (Å) | 5.0293 | 5.0210 | 0.46 |
| α = γ (°) | 90.0 | 90.0 | 0.00 |
| β (°) | 90.47 | 90.51 | 0.05 |
| Orthorhombic | |||
| Parameter | Calculation | Initial [4] | |∆|(%) |
| a (Å) | 6.1894 | 6.2661 | 1.23 |
| b (Å) | 5.3366 | 5.3295 | 0.13 |
| c (Å) | 4.8934 | 5.0148 | 2.42 |
| α = β = γ (°) | 90.0 | 90.0 | 0.00 |
| Migration Path | Li-Li Separation (Å) | Activation Energy (eV) | |
|---|---|---|---|
| Direct | Curved | ||
| A | 2.70 | 0.65 | 0.60 |
| B | 2.90 | 0.81 | 0.44 |
| C | 3.28 | 1.46 | 1.27 |
| D | 3.46 | 0.88 | 0.88 |
| Long-Range Path | Overall Activation Energy (eV) |
|---|---|
| A→D→A→D | 0.88 |
| B→C→B→ C | 1.27 |
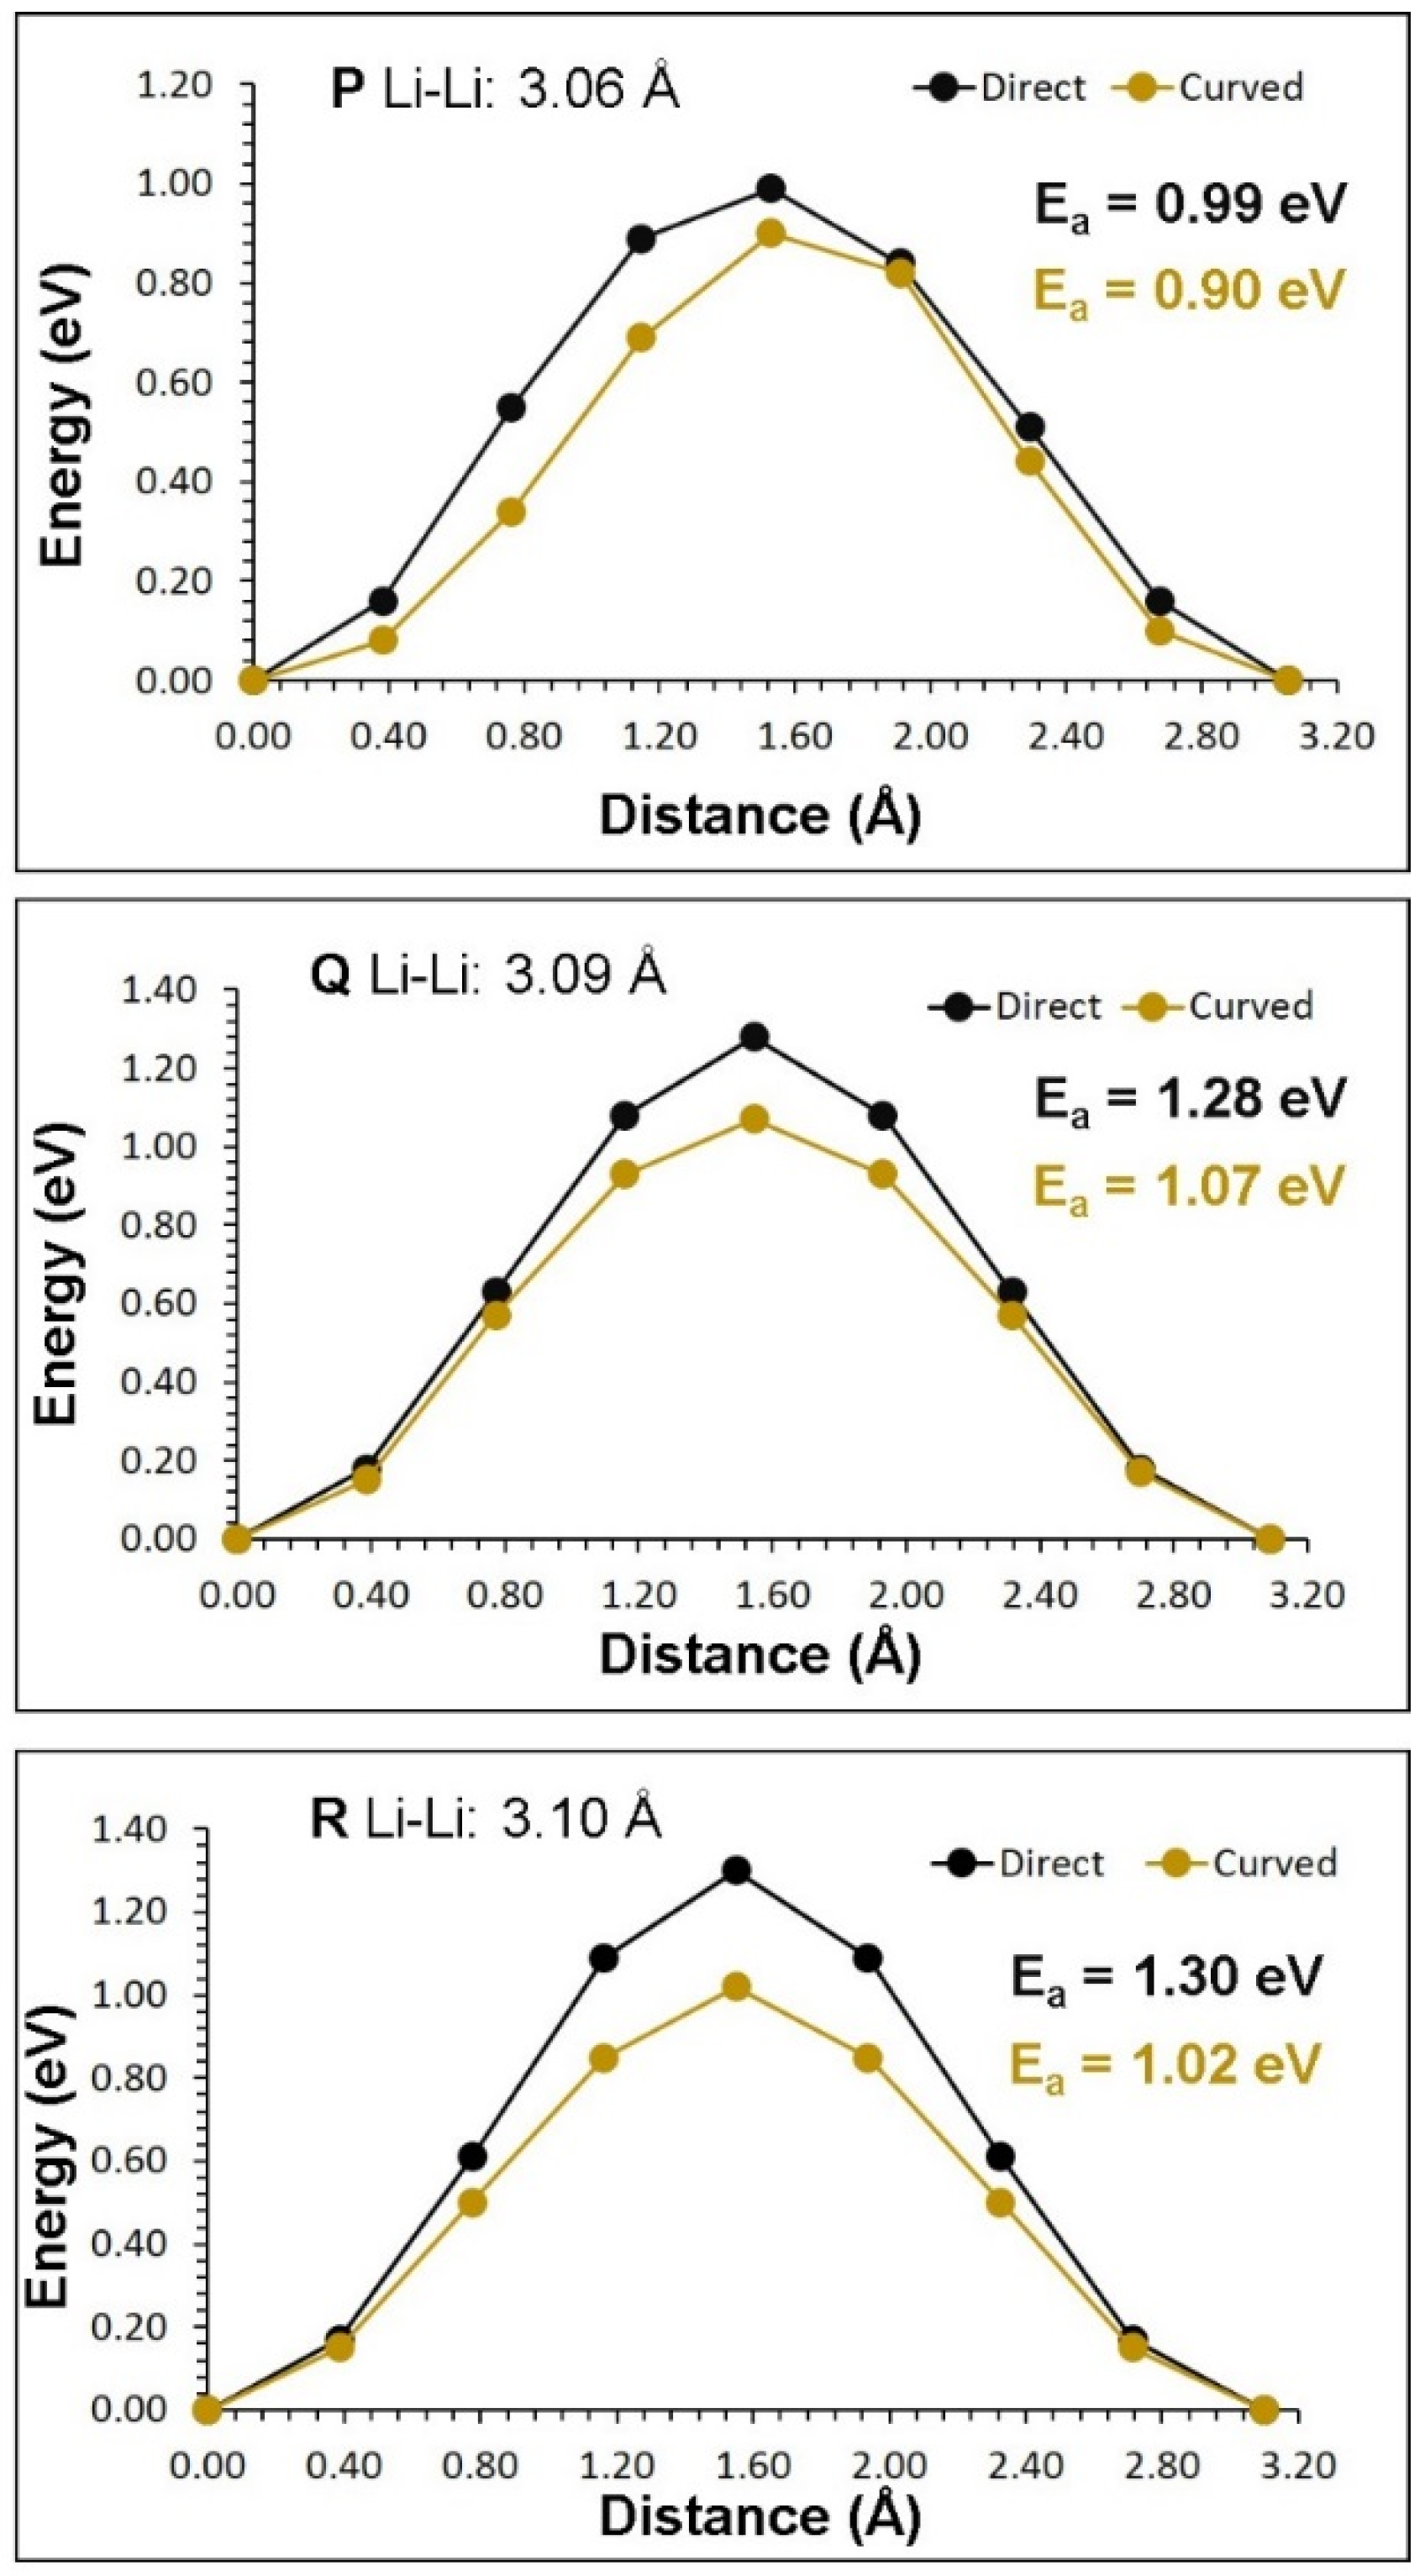
| Migration Path | Li-Li Separation (Å) | Activation Energy (eV) | |
|---|---|---|---|
| Direct | Curved | ||
| P | 3.06 | 0.99 | 0.90 |
| Q | 3.09 | 1.28 | 1.07 |
| R | 3.10 | 1.30 | 1.02 |
| Long-Range Path | Overall Activation Energy (eV) |
|---|---|
| P→P→P→P | 0.90 |
| Q→R→Q→ R | 1.07 |
© 2019 by the authors. Licensee MDPI, Basel, Switzerland. This article is an open access article distributed under the terms and conditions of the Creative Commons Attribution (CC BY) license (http://creativecommons.org/licenses/by/4.0/).
Share and Cite
Perera, D.; Ganeshalingam, S.; Kuganathan, N.; Chroneos, A. A Computational Study of Defects, Li-Ion Migration and Dopants in Li2ZnSiO4 Polymorphs. Crystals 2019, 9, 563. https://doi.org/10.3390/cryst9110563
Perera D, Ganeshalingam S, Kuganathan N, Chroneos A. A Computational Study of Defects, Li-Ion Migration and Dopants in Li2ZnSiO4 Polymorphs. Crystals. 2019; 9(11):563. https://doi.org/10.3390/cryst9110563
Chicago/Turabian StylePerera, Dilki, Sashikesh Ganeshalingam, Navaratnarajah Kuganathan, and Alexander Chroneos. 2019. "A Computational Study of Defects, Li-Ion Migration and Dopants in Li2ZnSiO4 Polymorphs" Crystals 9, no. 11: 563. https://doi.org/10.3390/cryst9110563