Article

A Computational Study of Defects, Li-Ion Migration and Dopants in Li2ZnSiO4 Polymorphs

by
Dilki Perera
1,
Sashikesh Ganeshalingam
1,
Navaratnarajah Kuganathan
2,3,* and
Alexander Chroneos
2,3
1
Department of Chemistry, University of Jaffna, Sir. Pon Ramanathan Road, Thirunelvely, Jaffna 40000, Srilanka
2
Department of Materials, Imperial College London, London SW7 2AZ, UK
3
Faculty of Engineering, Environment and Computing, Coventry University, Priory Street, Coventry CV1 5FB, UK
*
Author to whom correspondence should be addressed.
Crystals 2019, 9(11), 563; https://doi.org/10.3390/cryst9110563
Submission received: 15 October 2019 / Revised: 23 October 2019 / Accepted: 25 October 2019 / Published: 27 October 2019

Abstract

:
Lithium zinc silicate, Li2ZnSiO4, is a promising ceramic solid electrolyte material for Li-ion batteries. In this study, atomistic simulation techniques were employed to examine intrinsic defect processes; long range Li-ion migration paths, together with activation energies; and candidate substitutional dopants at the Zn and the Si sites in both monoclinic and orthorhombic Li2ZnSiO4 phases. The Li-Zn anti-site defect is the most energetically favourable defect in both phases, suggesting that a small amount of cation mixing would be observed. The Li Frenkel is the second lowest energy process. Long range Li-ion migration is observed in the ac plane in the monoclinic phase and the bc plane in the orthorhombic phase with activation energies of 0.88 eV and 0.90 eV, respectively, suggesting that Li-ion diffusivities in both phases are moderate. Furthermore, we show that Fe3+ is a promising dopant to increase Li vacancies required for vacancy-mediated Li-ion migration, and that Al3+ is the best dopant to introduce additional Li in the lattice required for increasing the capacity of this material. The favourable isovalent dopants are Fe2+ at the Zn site and Ge4+ at the Si site.

Graphical Abstract

1. Introduction

The Li-Ion battery (LIB) is recognized as one of the most promising clean energy devices replacing the current, non-renewable fossil fuels. The development of new electrode and electrolyte materials with excellent electrochemical performance, low costs, environmentally benign natures and high abundance of constituent elements is a key feature in designing a promising Li-ion battery. Significant research activity has been devoted to preparing new classes of materials in the past decade to design high capacity batteries [1,2,3,4,5,6,7,8,9,10].
Silicon based materials are of great interest for designing electrode or electrolyte materials, as silicon is relatively safe, abundant and cheap. Furthermore, strong Si–O bonds in SiO4 units provide great structural stability. A variety of silicate-based materials have been examined for use as cathode materials for LIBs either experimentally or theoretically [11,12,13,14].
Lithium metal silicates (Li2MSiO4 (M = Fe, Mn, Co, Ni and so on)) are a class of materials in the orthosilicate family [4,15,16,17,18,19,20,21]. These materials have gained the interest of the research community recently due to their good electrochemical performances and the existence of two Li per formula unit leading to the possibility of extracting more than one lithium. The theoretical capacity of silicate material is reported to be ca 166 mAh−1 with one Li removal and ca 300 mAh−1 for the two Li removal [22]. Nyten et al. [4] first reported the orthorhombic crystal structure of Li2FeSiO4 using X-ray diffraction. Thereafter, Nishimura et al. [16] synthesized a monoclinic structure of Li2FeSiO4 with their high-resolution X-ray diffraction and transmission electron microscopy. Both crystal structures have been well studied theoretically and their Li-ion conductivities explained [23,24]. After the discovery of Li2FeSiO4, other lithium metal silicates, such as Li2MnSiO4, were discovered [18,19,20]. There was a significant debate on the crystal of Li2MnSiO4. In particular, Dominko et al. [18] reported an orthorhombic structure (space group Pmn21) which is similar to the orthorhombic Li2FeSiO4 reported by Nyten et al. [4]. Politaev et al. [19] determined a monoclinic structure, which is isostructural with the structure reported by Nishimura et al. [16]. In previous studies [25,26], we examined defects and Li diffusion in polymorphs of Li2MnSiO4 theoretically.
Lithium zinc silicate, Li2ZnSiO4, was studied experimentally as a candidate material for electrolyte and cathode material for LIBs and transparent glass ceramic material for broadband fibre amplifiers [27,28,29]. Adnan et al. [27] synthesized monoclinic Li2ZnSiO4 ceramic powder using the sol gel method and determined the ionic conductivity at different temperatures. Recently, the orthorhombic structure of Li2ZnSiO4 was synthesized by Sivagami et al. [28] and examined for cathode material for LIBs, though the crystal structure details are not reported. An electrochemical study shows 133 mAhg−1 discharge capacity at C/10 rate, suggesting that this material is comparable to other orthosilicate materials.
The theoretical modelling of materials is an active area of research as it can provide useful information about the crystal structures, defects and diffusion properties. In this study, we used atomistic simulation techniques to model both monoclinic and orthorhombic phases of Li2ZnSiO4, and examine defects, Li-ion diffusion and dopant properties in both phases. In previous studies, a variety of oxide materials, including Li, Na and Mg ion battery materials have been modelled using this technique [30,31,32,33,34,35,36,37,38].

2. Computational Methods

Classical, pair-wise potential-based calculations as implemented in the GULP code (version 3.4.1) provided by Curtin University of Technology, Perth, Australia [39] were employed. Here, ionic interactions were modelled using long-range and short-range forces. Long-range ionic interactions are coulombic attractions and short-range forces include electron–electron repulsion and van der Waals interactions (attractive). Short-range repulsive forces were modelled using the Buckingham potentials (refer to Table S1). Geometry optimizations were carried out using the Broyden–Fletcher–Goldfarb–Shanno (BFGS) algorithm [40]. In all optimized structures, the gradient norm was less than 0.001 eV/Å. Point defects were modelled using the Mott–Littleton method [41]. This methodology constructs two spherical regions around the defects. In the inner region, ions are relaxed more accurately. Though the enthalpies calculated in the simulation at hand were anticipated to be overestimates, as the ions are treated as spherical shapes with full charge models and dilute limits, the trend in relative energies is consistent.
Thermodynamically, the defect parameters (for example migration and formation energies) may be defined through the comparison of the real (i.e., defective) crystal to an isochoric or isobaric ideal (i.e., non-defective) crystal. These defect formation parameters can be interconnected via thermodynamic relations [42,43]. The present calculations correspond to the isobaric parameters for both the migration and formation processes [44,45,46,47].

3. Results

3.1. Li2ZnSiO4 Crystal Structures

Two different crystal structures of Li2ZnSiO4 have been reported in the literature. The first structure reported by Yamaguchi et al. [48] crystallizes into a monoclinic phase (space group P21/n), as shown in the Figure 1a. Both Zn2+ and Si4+ form corner-sharing tetrahedral units (ZnO4 and SiO4) pointing in opposite directions. Sivagami et al. [28] reported the synthesis of orthorhombic structure of Li2ZnSiO4 (refer to Figure 1b) using a facile sol-gel technique. Although the X-ray diffraction study confirms the orthorhombic phase, crystal structure details, including lattice constants, are not available from that study.
In this study, we examined both monoclinic and orthorhombic polymorphs of Li2ZnSiO4. The initial structure of orthorhombic phase was taken from the orthorhombic Li2FeSiO4 crystal structure reported by Nyten et al. [4]. Full geometry optimization (both ions positions and lattice constants) was performed on both structures. Calculations reproduced the experimental lattice parameters of monoclinic Li2ZnSiO4 well (refer to Table 1), validating the choice of potential parameters selected. Initial and final lattice parameters of orthorhombic phase are also reported, and the difference in the lattice parameters is less than 2.5%. This information would help in the future experimental characterization of orthorhombic Li2ZnSiO4 crystal structure. The present calculations find that the monoclinic crystal structure is 100 meV/formula unit lower in energy than the orthorhombic phase, showing the stability of monoclinic phase over the orthorhombic phase.

3.2. Intrinsic Defect Processes

Isolated point defects (vacancies and interstitials) are necessary to calculate the defect formation energies and Li-ion diffusion. The Frenkel and Schottky defect reaction energies were calculated by combining the point defect energies. The anti-site defect energy was calculated in the forms of isolated and cluster. In the case of the isolated form, substitutional energies of Li at the Zn site and Zn at the Li site were calculated separately, and then they were combined. In the cluster form, both individual impurity defects were present in the same supercell. Kröger–Vink notation [49] is used to represent these defect reactions as shown in Equations (1)–(8). Li vacancy is denoted by V Li and this defect has a negative charge, as the removal of a Li+ ion introduces a negative charge in the lattice. The interstitial of Zn has a double positive charge and is denoted by Zn i . Li at the Zn site is denoted by Li Zn and this defect is negatively charged due to the sum of −2 charges introduced in the lattice by the Zn vacancy and +1 charge of Li. Superscript single dots and single apostrophes correspond to +1 and −1 charges, respectively.
Li   Frenkel :   Li Li X     V Li +   Li i ;
O   Frenkel :   O O X     V O +   O i ;
Zn   Frenkel :   V Zn X     V Zn + Zn i ;
Si   Frenkel :   V Si X     V Si +   Si i ;
Schottky : 2   Li Li   X + Zn Zn X   + Si Si X   + 4   O O X   2   V Li + V Zn +   V Si + 4   V O + Li 2 ZnSiO 4 ;
Li 2 O   Schottky : 2   Li Li X +   O O X     2   V Li + V O +   Li 2 O ;
Li / Zn   anti site   ( isolated ) :   Li Li X +   Zn Zn X   Li Zn + Zn Li ;
Li / Zn   anti site   ( cluster ) :   Li Li X +   Zn Zn X   { Li Zn : Zn Li } X .
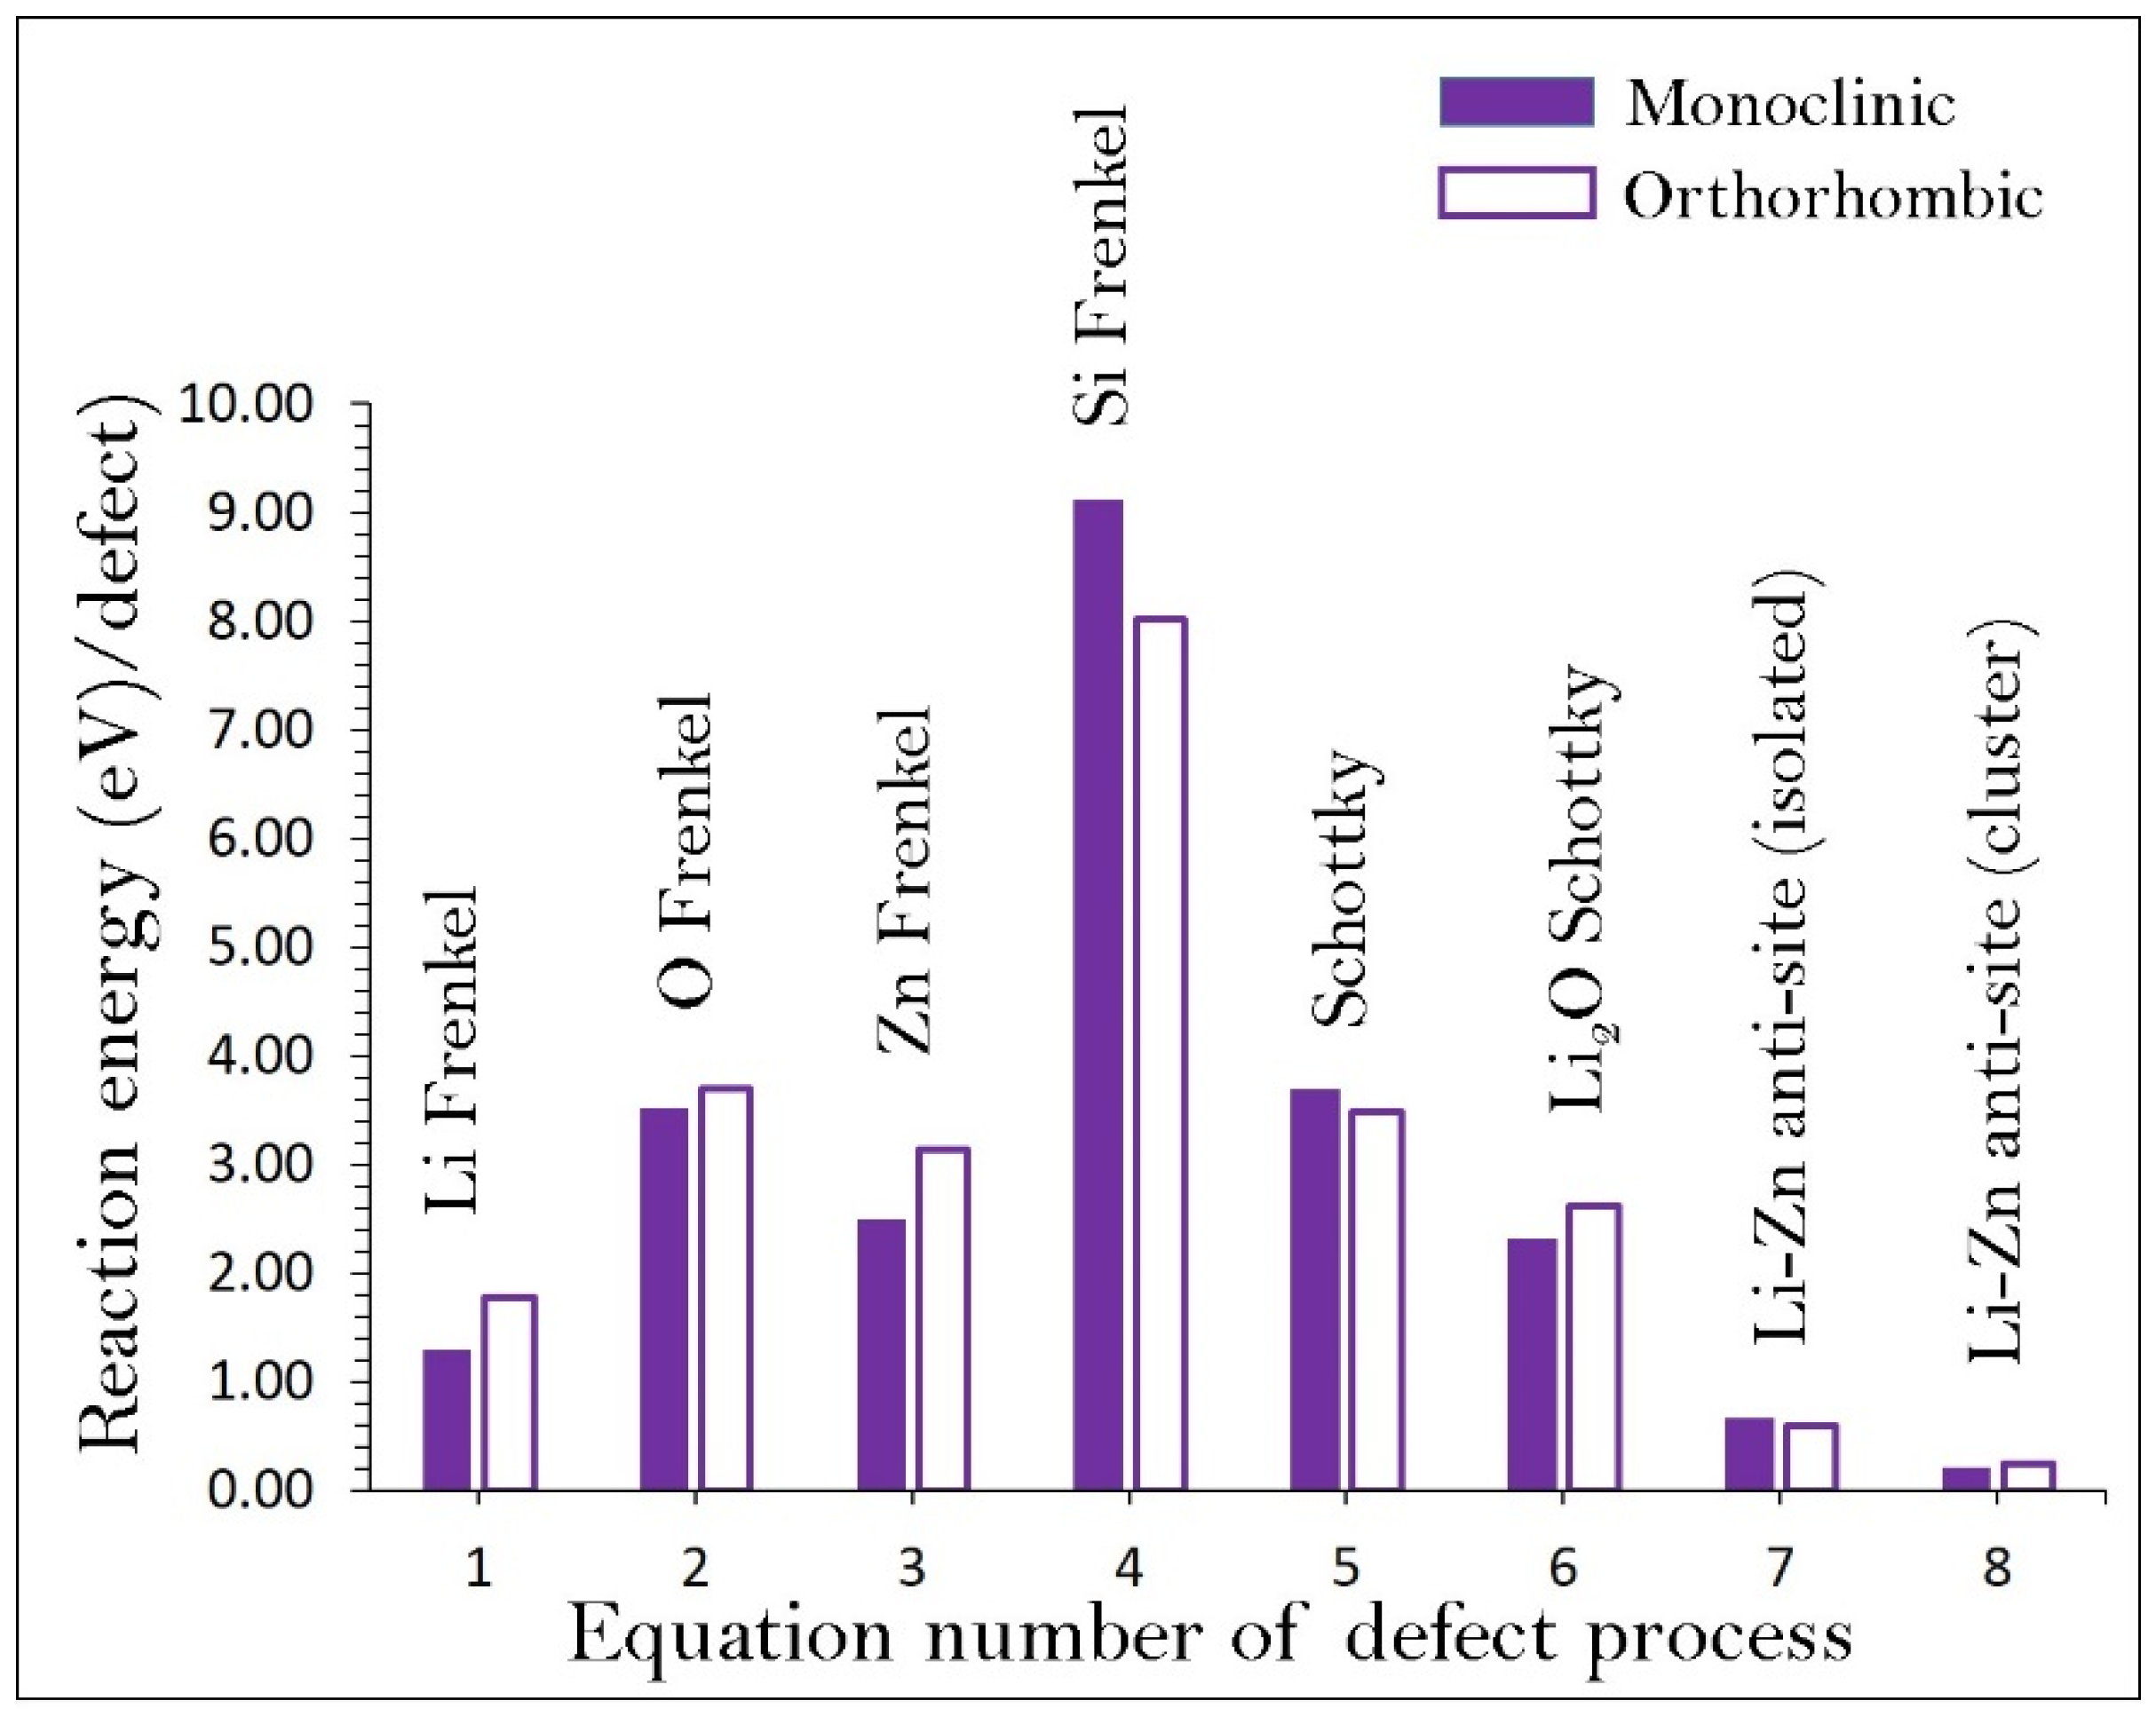
Figure 2 summarises the reaction energies for defect processes. The Li–Zn anti-site defect energy (cluster form) is calculated to be the most dominant defect. This suggests that a small amount of cation inter mixing (Li at the Zn site ( Li Zn ) and Zn at the Li site ( Zn Li ) ) would be present in these materials. The energy difference between the isolated and the cluster form in monoclinic structure is –0.46 eV (−0.35 eV for orthorhombic Li2ZnSiO4). This energy is the binding energy between the isolated defects ( Li Zn and Zn Li ) to form the cluster ( Li Zn : Zn Li )X. The exoergic binding energy suggests that isolated defects have the tendency to form clusters without energy cost. This defect has been observed in a variety of Li, Na and Mg ion battery materials either experimentally or theoretically [4,19,36,37,38,50,51,52]. Experimental studies show that this defect is mainly due to synthesis conditions and cycling of the as-prepared material. In our previous modelling [25], the Li–Mn anti-site defect cluster was found to be the lowest energy defect process in Li2MnSiO4. However, the defect energy was higher than that found in Li2ZnSiO4 due to the different charges of Zn and Mn. It is expected that cation exchange in Li2ZnSiO4 (between Li+ and Zn2+) would be easier than in Li2MnSiO4 (between Li+ and Mn2+) due to the smaller radius of Zn2+ than that of Mn2+. The Li Frenkel is identified as the second most favourable defect energy process. Nevertheless, this process would require moderate temperature. High endothermic energies are observed for other Frenkel and Schottky processes, implying that they are highly unlikely to occur at normal temperatures. We examined the formation of Li2O in this material by considering Li2O Schottky-like reaction (Equation (6)). The formation energy is 2.35 eV per defect in monoclinic phase and 2.50 eV per defect in orthorhombic phase. The formation of Li2O would lead to the formation of V L i and V O in this material at high temperatures. Though there is a small energy difference in each reaction energy between both phases, the trend is observed to be the same.

3.3. Lithium Ion Diffusion

Long range diffusion of Li-ion with low activation energy is an essential condition for a promising Li-ion battery material. Experimental determination of diffusion pathways is generally challenging. Current methodology permitted us to calculate linear (direct) and non-linear (curved) pathways of various local Li hops together with activation energies. Fisher et al. [32] used the current methodology to examine the Li-ion diffusion pathway in LiFePO4. The calculated pathway was non-linear and in excellent agreement with the pathway determined in the neutron diffraction experiment [53].
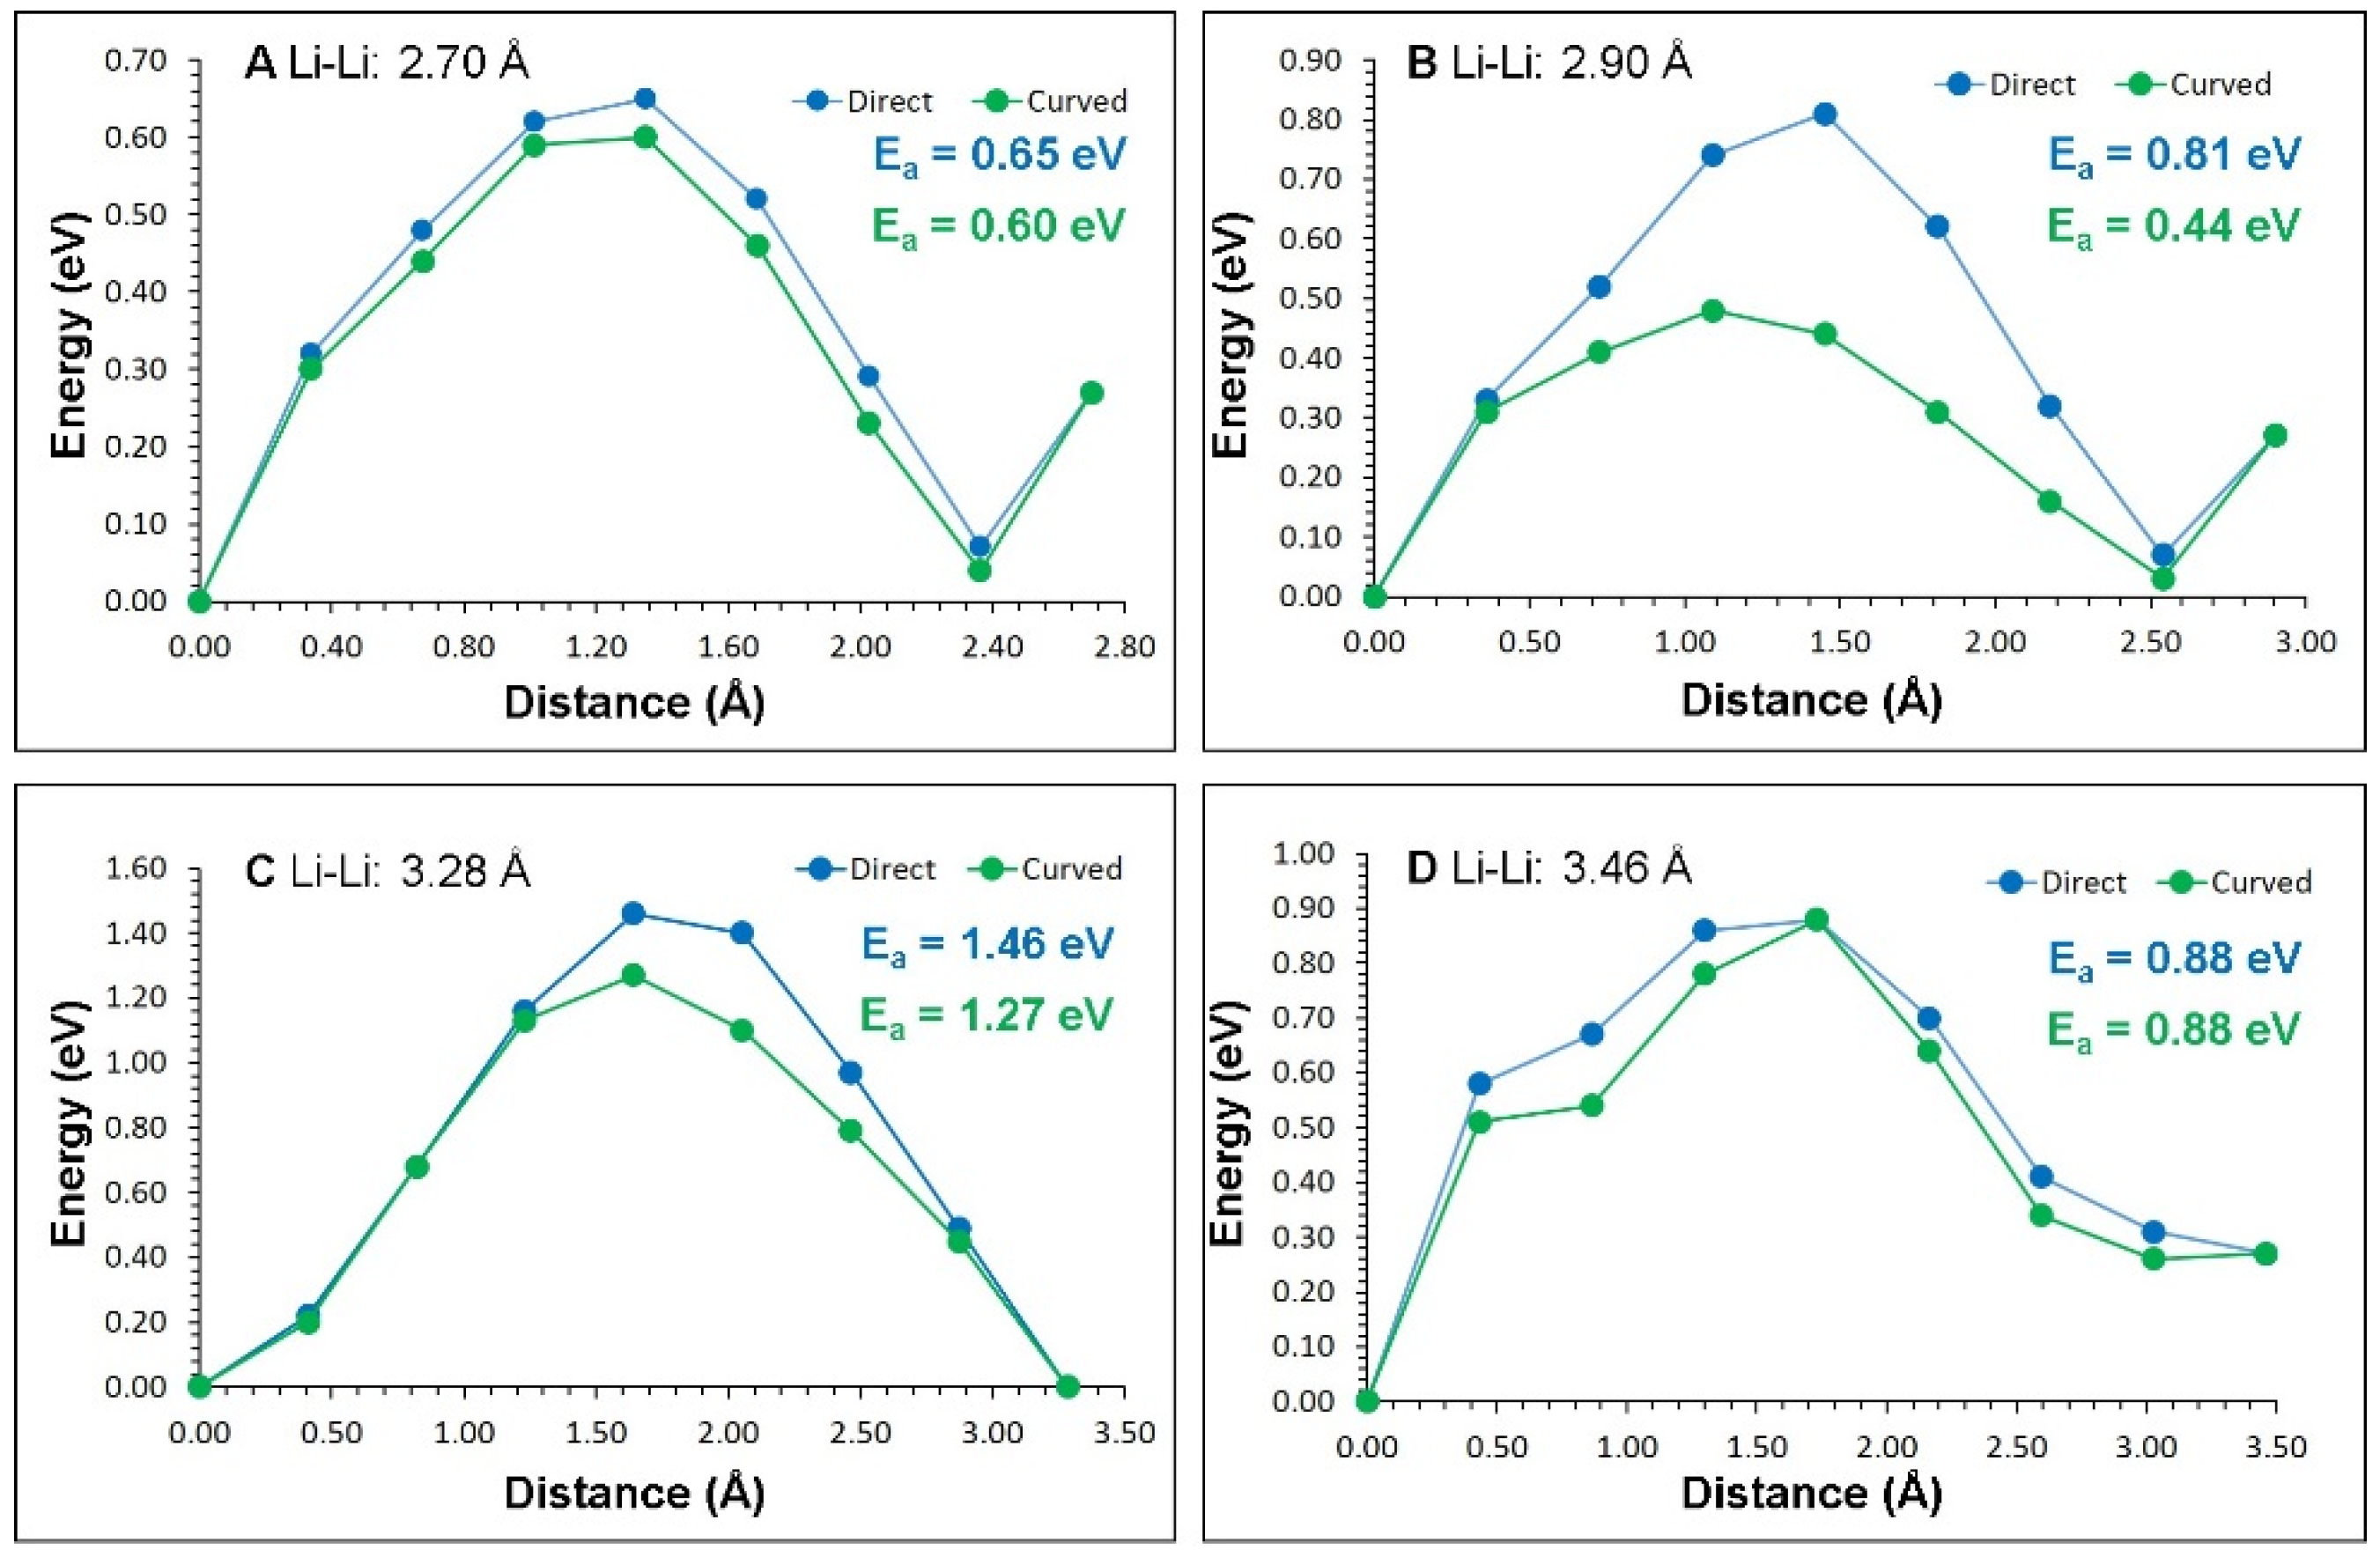
In the monoclinic crystal structure, we identified four different local Li hops (refer to Figure 3) for the vacancy-assisted Li-ion migration. Table 2 lists the local Li hops and corresponding activation energies. Both direct and curved pathways were considered, as the later provided much more freedom to diffuse Li-ions in Li2ZnSiO4. In most of the cases, curved pathways yielded lower activation energies than those calculated in direct pathways (refer to Figure 4). Long range diffusion pathways constructed by connecting local Li hops show that Li-ions will more likely diffuse in the ac plane in a zig-zag pattern (A→D→A→D) as this route has the lowest overall activation energy of 0.88 eV. In Li2MnSiO4, the value was 0.94 eV due to the difference in ionic radii of Zn2+ and Mn2+ [25]. Table 3 reports two different long-range diffusion pathways considered, including a pathway (B→C→B→C) with high activation energy of 1.27 eV.
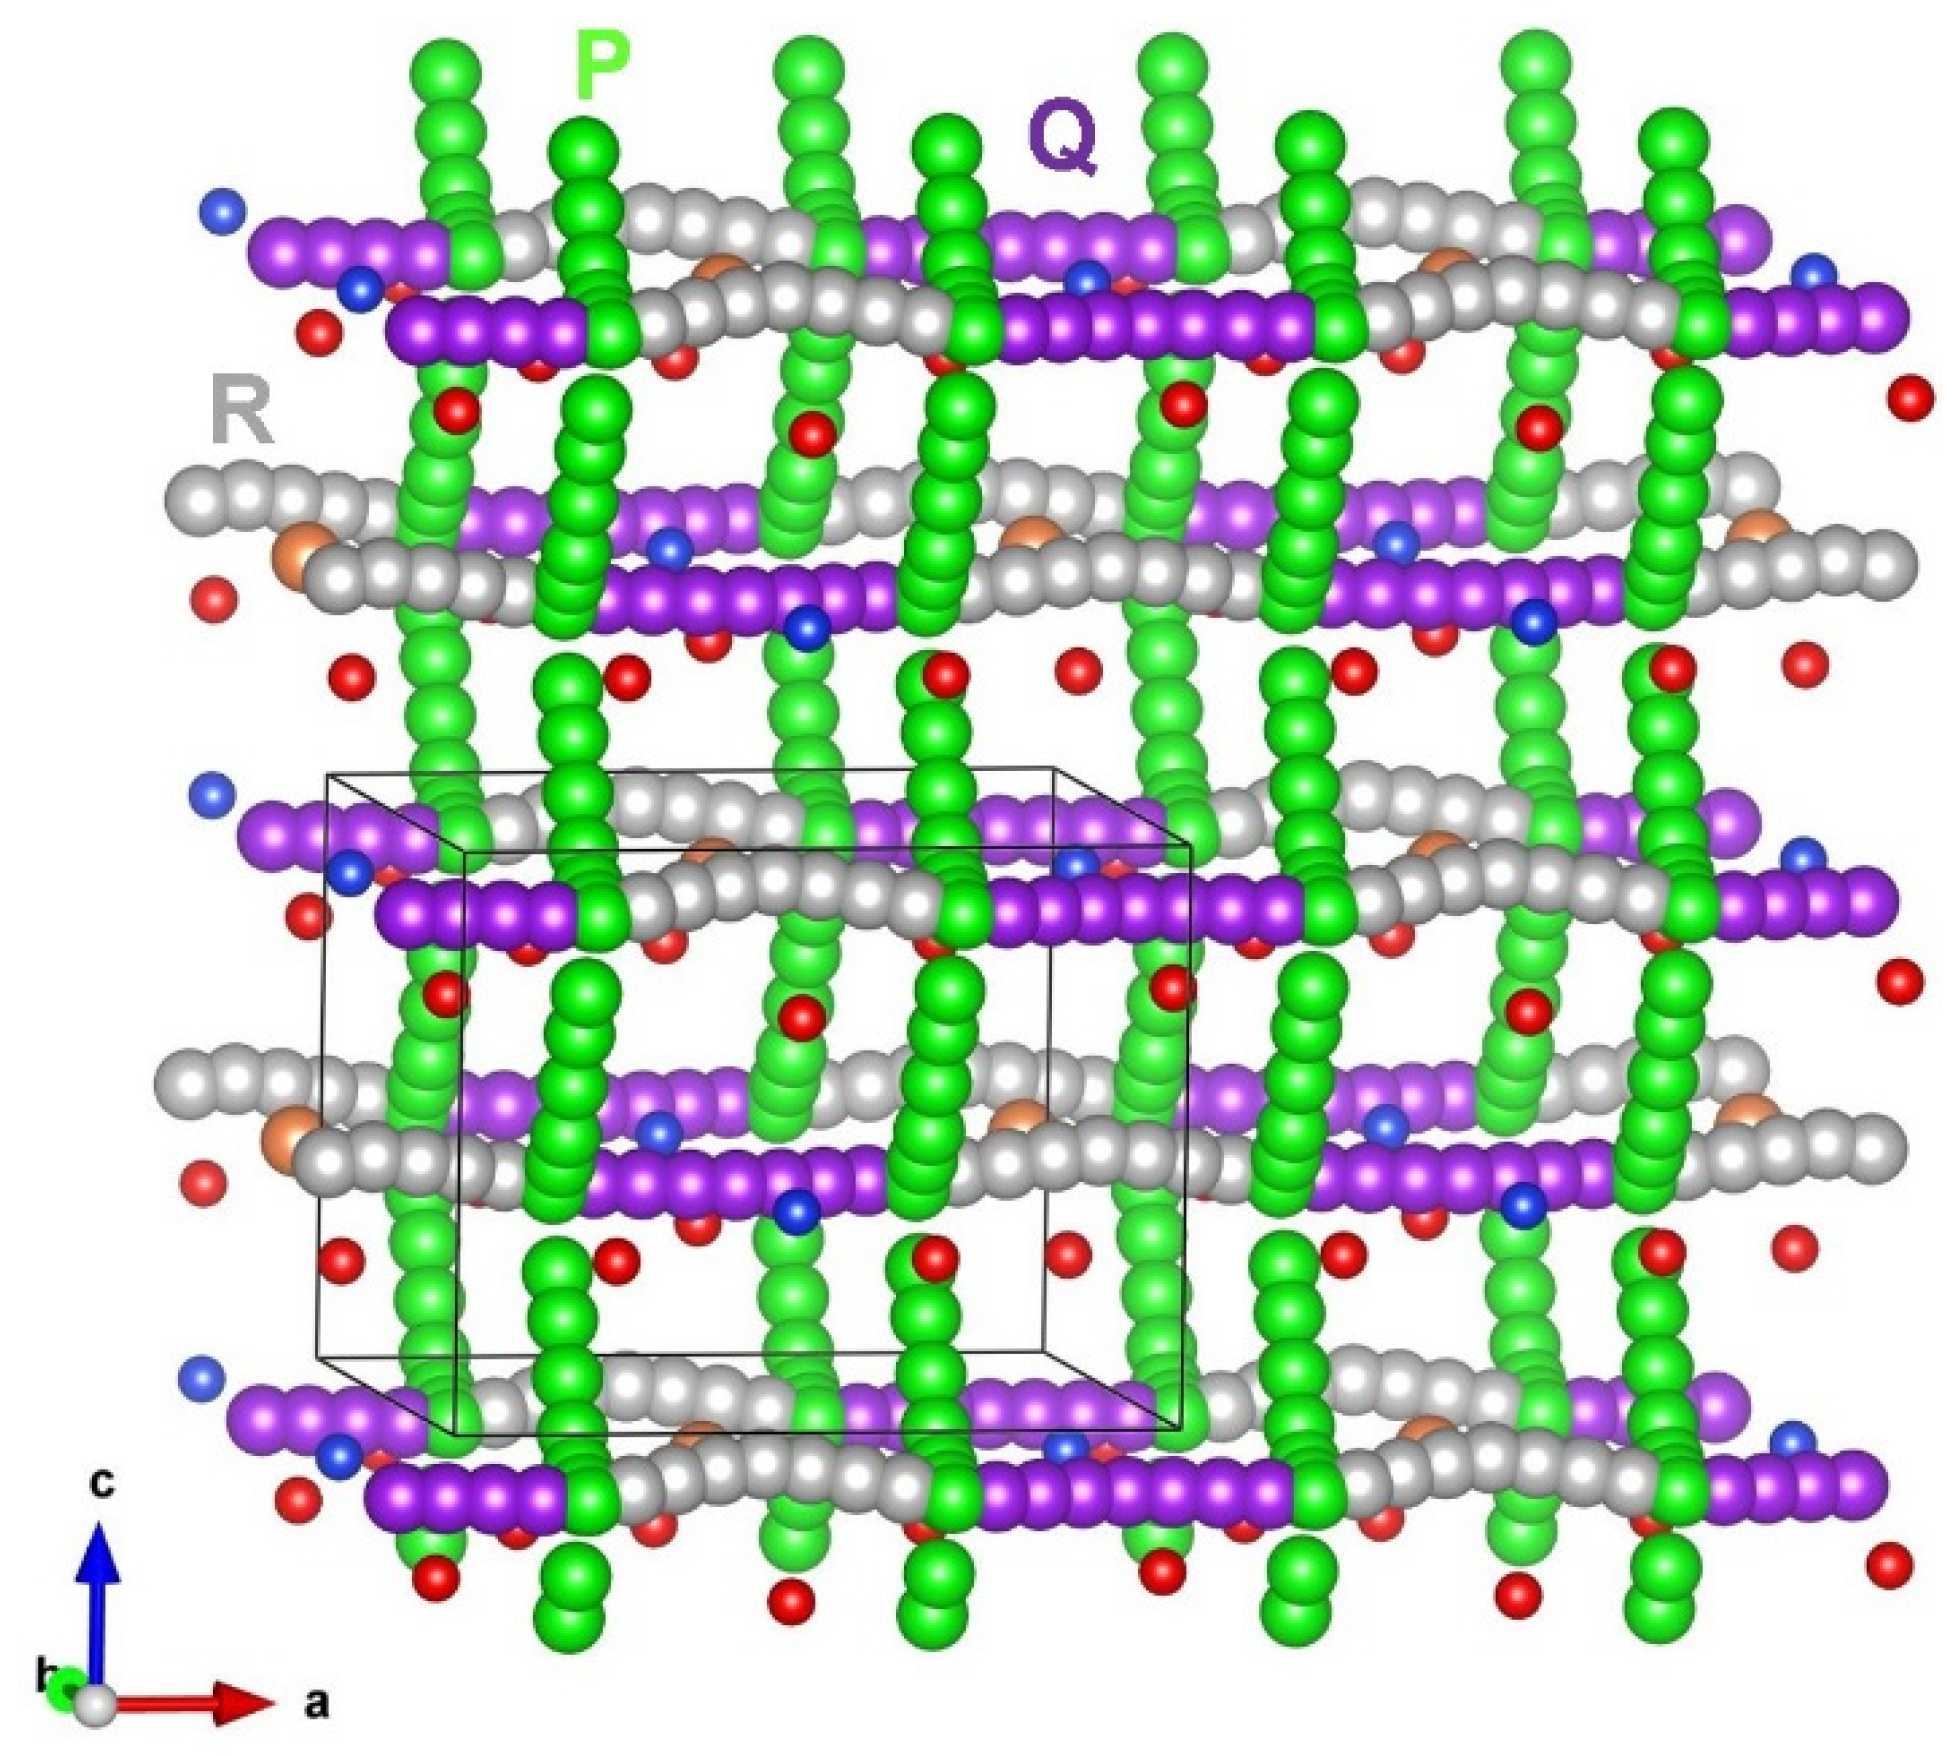
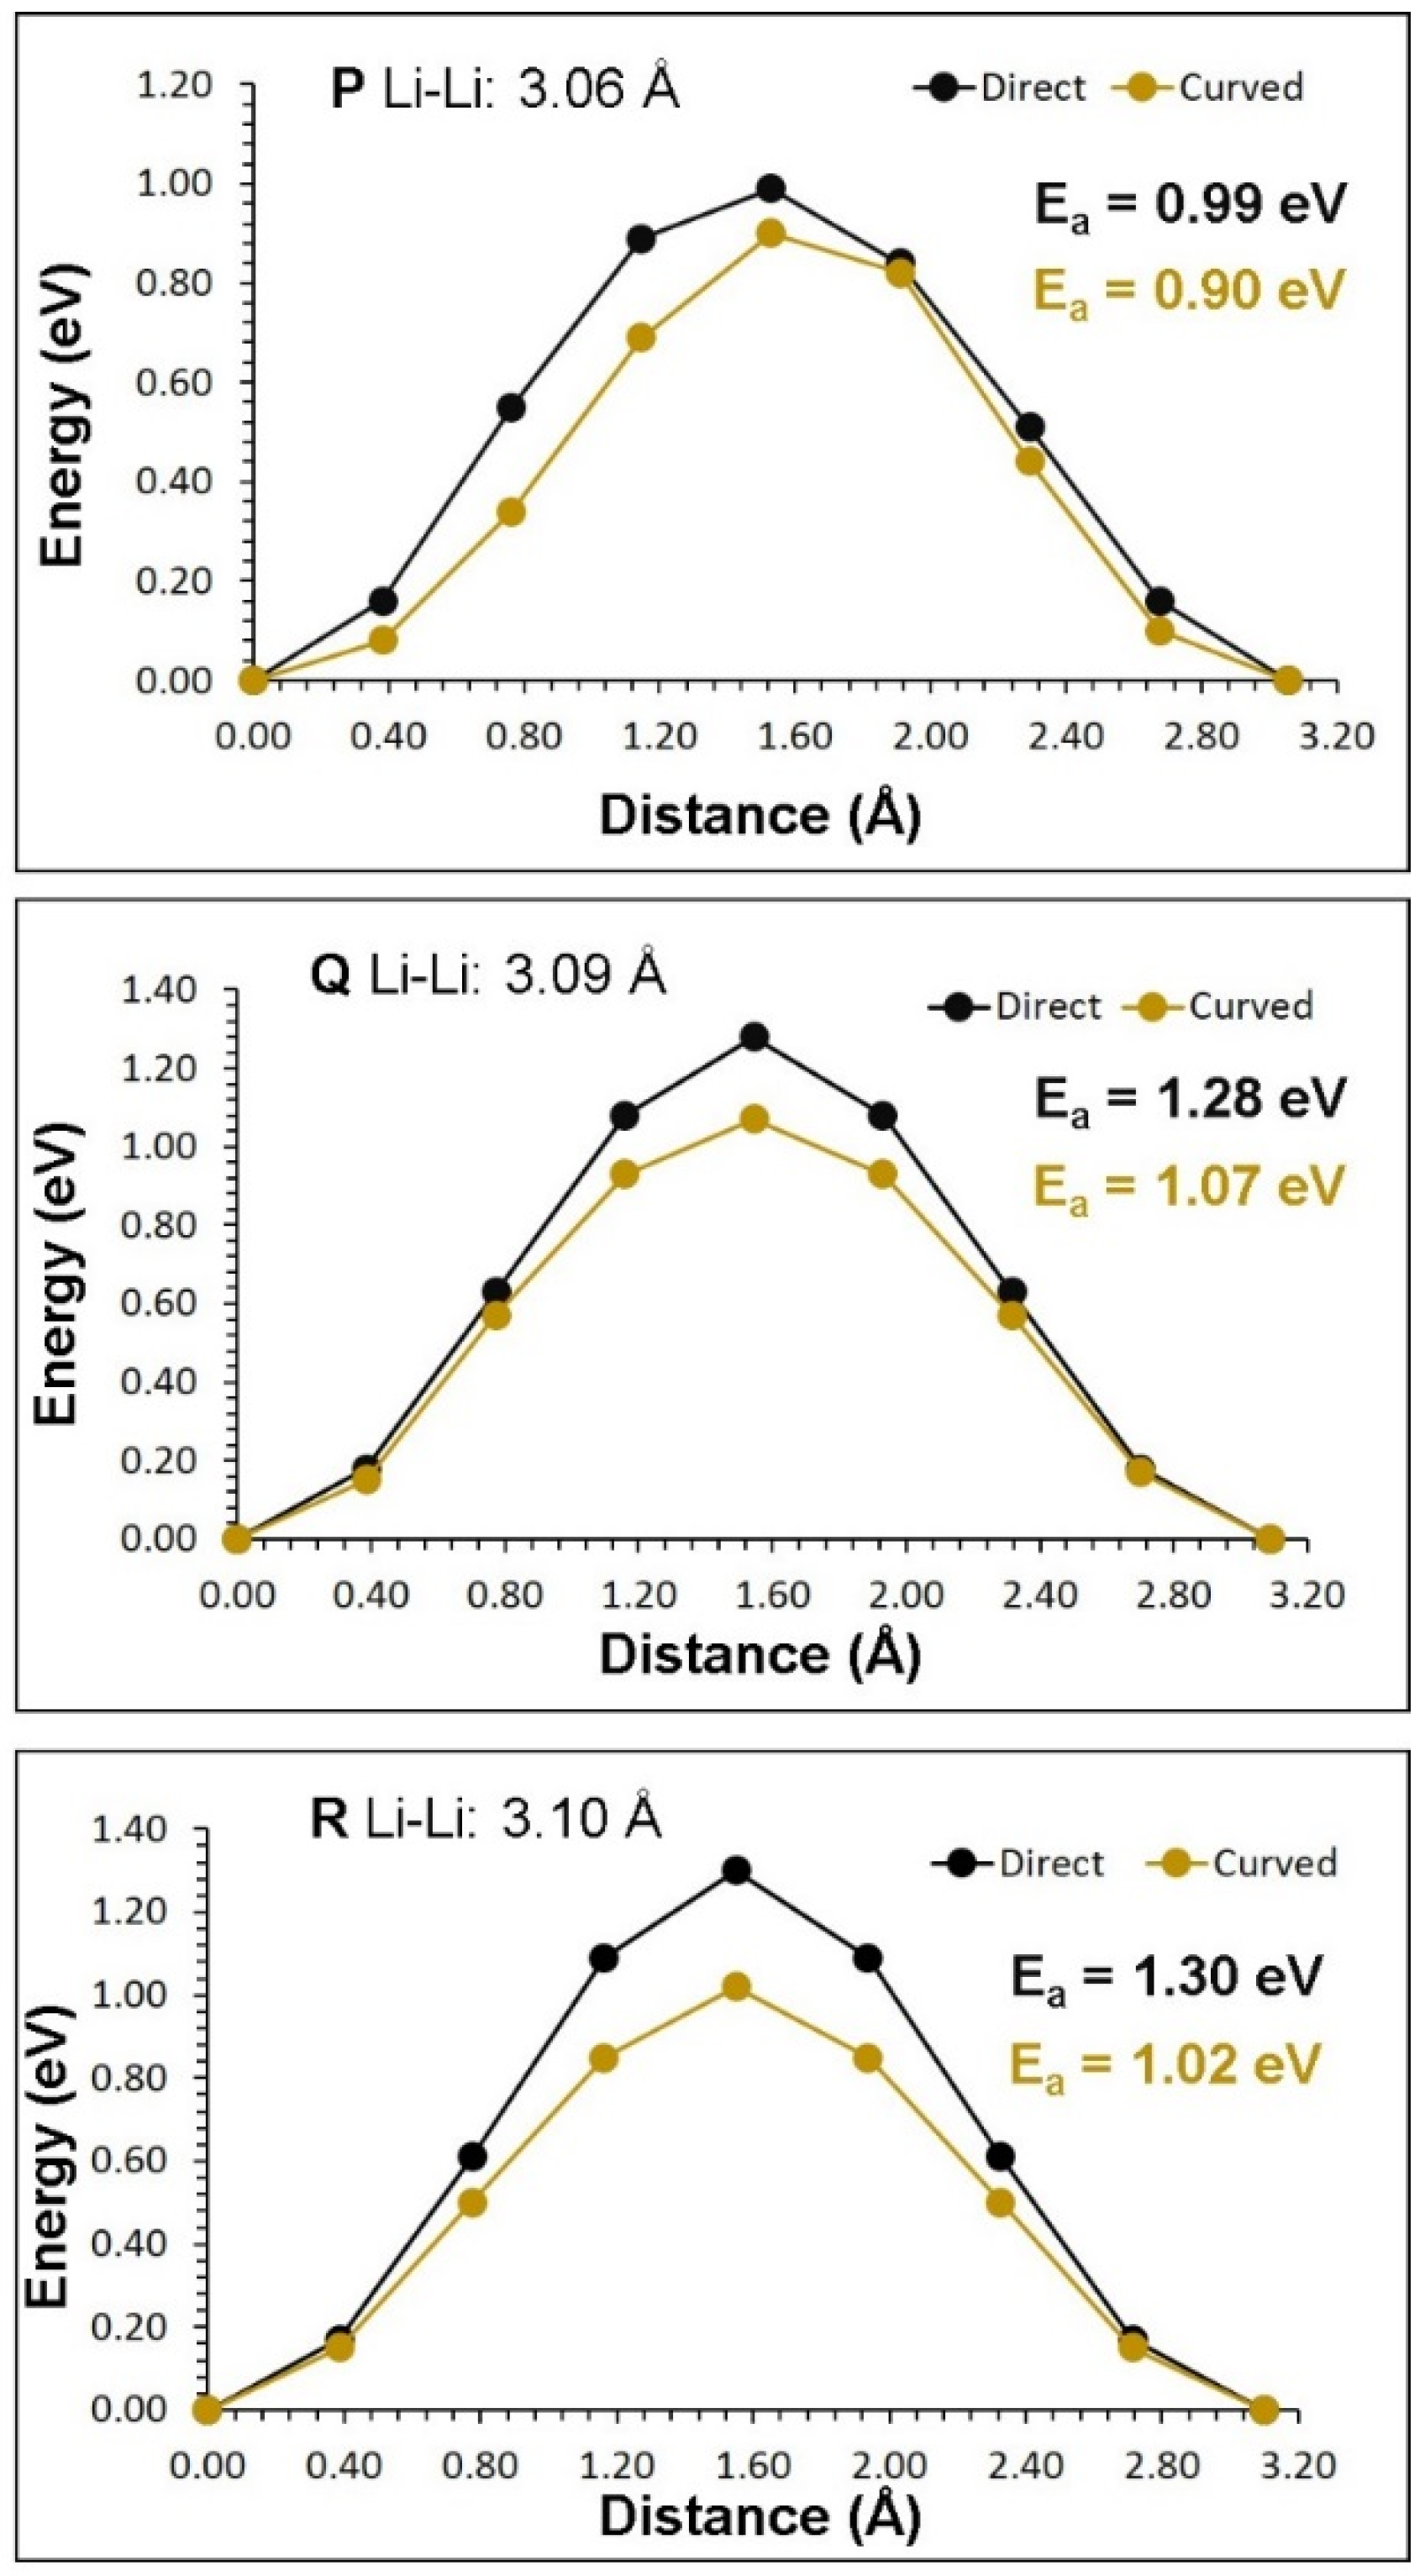
Three different local Li hops (P, Q and R) were identified in orthorhombic Li2ZnSiO4, as shown in Figure 5. Energy profile diagrams for local Li hops with activation energies are shown in Figure 6. In all cases, the activation energy calculated in a curved pathway is lower than that calculated in a direct pathway (refer to Table 4). A Li-ion diffuses in the bc plane in a zig-zag pattern (P→P→P→P) with the activation energy of 0.90 eV. The activation energy for the second pathway (Q→R→Q→R) is 1.07 eV, and in this pathway a Li-ion migrates in the ac plane (refer to Table 5). Similar pathways were calculated in Li2MnSiO4 and their corresponding activation energies were calculated to be 0.95 eV and 1.29 eV respectively [25], due to the larger radius of Mn2+ than that of Zn2+.
The pathways examined in this study should help experimentalists in their future experimental work. Activation energies calculated in both structures show that Li-ion conductivity in Li2ZnSiO4 is moderate.

3.4. Divalent Dopants

The Zn site was doped by some divalent dopants (M = Ni, Mg, Co, Fe, Ca, Sr and Ba) and the solution energy was calculated using the following equation.
MO + Zn Zn X M Zn   X + ZnO .
The lowest solution energy is for Fe2+ in both phases (refer to Figure 7). This suggests that the synthesis of Li2Zn1-xFexSiO4 (0.0 < x < 1.0) should be possible by experimentation. The second most favourable dopant is Mg2+ in monoclinic phase and Ca2+ in orthorhombic phase. The energy difference between the solution energies of Mg2+ and Ca2+ in orthorhombic phase is very small. This is reminiscent of the early experimental facts that in NaI, where the ionic radius r+ of the host cation Na+ differs only slightly from the ionic radius r2+ of the divalent dopant Ca2+, the measurements show a small energy difference between the corresponding activation energies for the cation vacancy motion [54] in a similar fashion as observed in other alkali halides as well [55].

3.5. Trivalent Doping

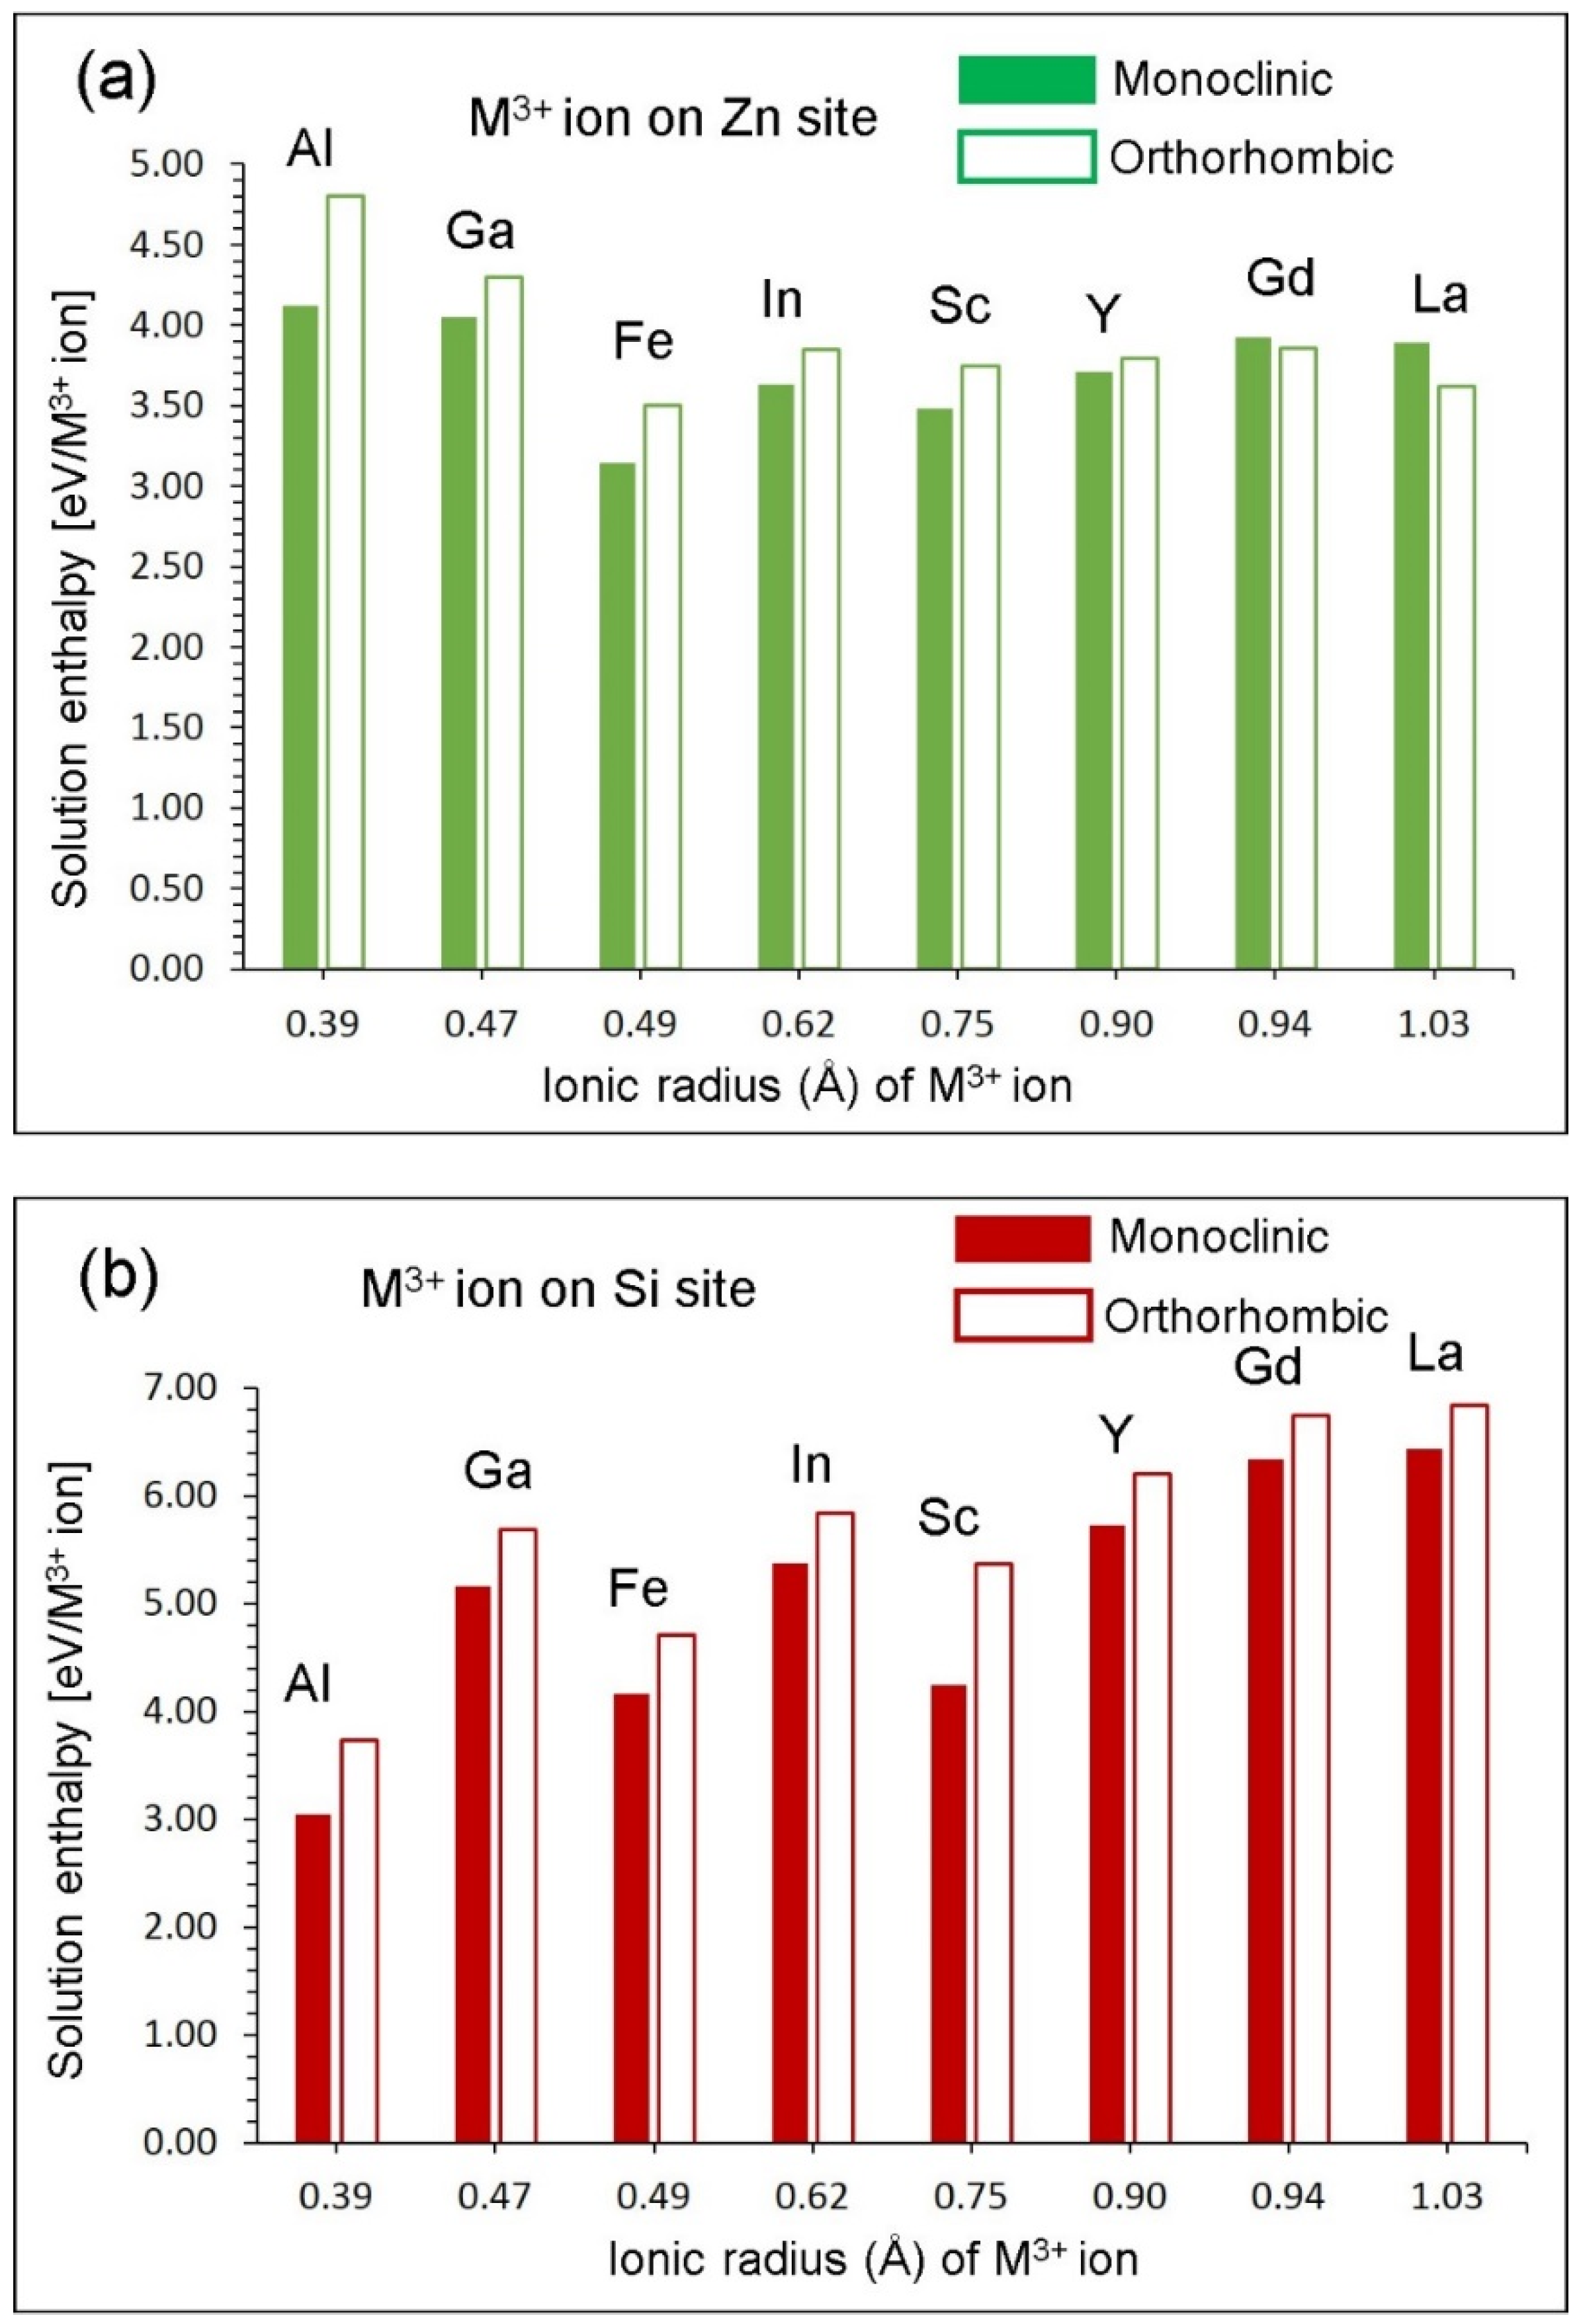
Here, we consider some trivalent dopants (M = Al, Ga, Fe, In, Sc, Y, Gd and La) on Zn and Si sites. Trivalent dopants at the Zn site would introduce Li vacancies that facilitate Li self-diffusion in Li2ZnSiO4. The solution of X2O3 was considered via the following reaction equation, as written using the Kröger–Vink notation.
M 2 O 3 + 2   Zn Zn X + 2   Li Li X     2   M Zn + 2   V Li +   2   ZnO .
Solution enthalpies are reported in Figure 8a. Calculations reveal that Fe3+ is the most favourable dopant in both the monoclinic and orthorhombic structures. Endoergic solution enthalpies suggest that this process can take place at high temperatures. Additionally, it should be stressed that calculations in this study were carried out at 0 K. Therefore, calculations with high temperature would make that process more favourable.
Next, the same dopants were considered at the Si site. Negative charges introduced by substitutional dopants in the lattice were compensated by positively charges Li interstitials. This defect-engineering strategy would increase the capacity of the as-prepared Li2ZnSiO4 material. The following equation was used to calculate the solution energy for this process.
M 2 O 3 + 2 Si Si X + Li 2 O     2 M Si + 2 Li i + 2 SiO 2 .
Figure 8b reports the solution enthalpies. The most favourable dopant was found to be Al3+. The possible composition would be Li2+xZnSi1-xAlxO4 (0.0 < x < 1.0). The exact amount of x should be determined experimentally. A similar strategy was applied to Li2MnSiO4 and Al3+ was found to be the promising dopant at the Mn site [25]. In all cases, the solution enthalpies calculated for the monoclinic phase are slightly lower in energy than those calculated for the orthorhombic phase. The second most favourable dopant is Fe3+. Other dopants exhibit high solution enthalpies, meaning they are highly unlikely to take place at normal temperatures.

3.6. Tetravalent Doping

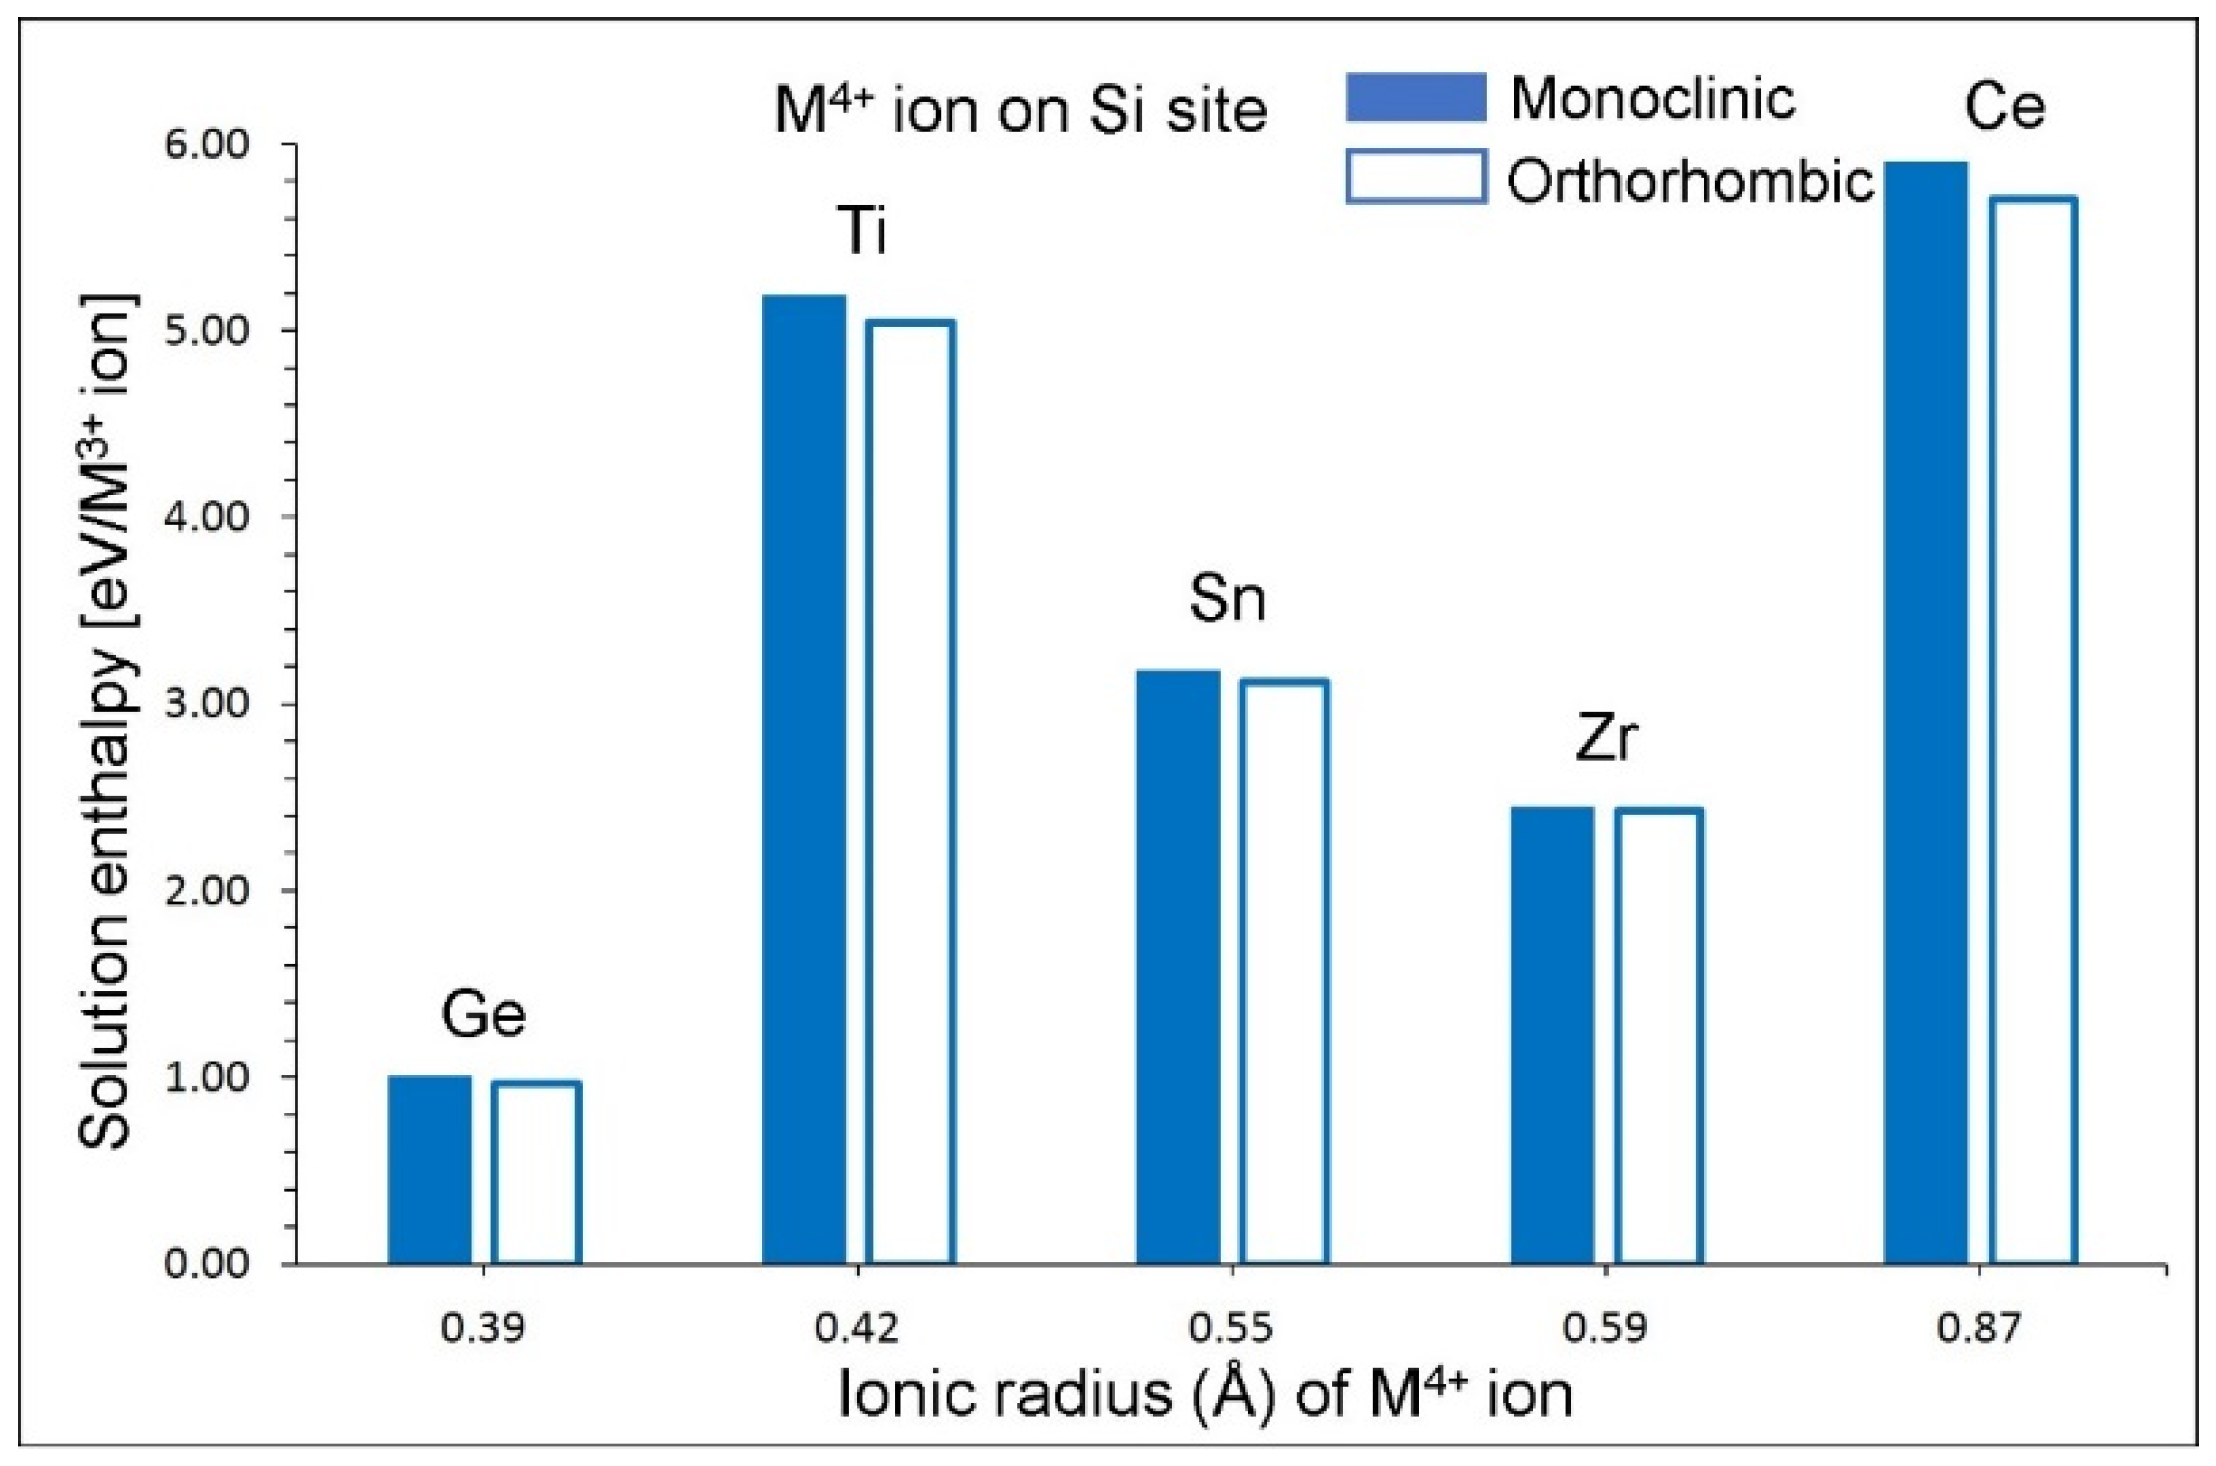
Finally, tetravalent dopants (M = Ge, Ti, Sn, Zr and Ce) were considered at the Si site. The following reaction was constructed to calculate the solution enthalpy. As the charges of the dopants and the Si were the same, no charge compensation was needed.
MO 2 +   Si Si   X M Si   X + SiO 2 .
Figure 9 shows the solution enthalpies calculated. In both structures, the trend in solution enthalpies is the same and there is only a very small difference in solution enthalpies. The promising dopant for this process is found to be the Ge4+. The preference of Ge4+ is due to the small difference between the ionic radii of Si4+ (0.26 Å) and Ge4+ (0.39 Å). The positive solution enthalpy of GeO2 indicates that energy should be provided in the form of heat for this process. This is due to the stronger Si–O bonds present in the SiO4 unit than the Ge–O bonds present the in GeO4 unit. High solution enthalpies are observed for other dopants. Solution enthalpies for TiO2 and CeO2 are approximately 5 eV and 6 eV respectively, suggesting that they are highly unlikely to occur.

4. Conclusions

In this study, atomistic-scale simulations based on classical potentials were employed to study the defect chemistry, Li ion diffusion and doping behaviour in monoclinic and orthorhombic crystal structures of Li2ZnSiO4. The Li–Zn anti-site defect is the dominant defect that would be observed in this material. The Li Frenkel is the second lowest defect energy process, ensuring that Li vacancies and Li interstitials would be present at equilibrium at slightly high temperatures. In both phases, long-range Li-ion diffusion is two dimensional with a moderate diffusion rate and the activation energy of ~ 0.90 eV. Here, we show that Li vacancies required for the vacancy-assisted Li-ion self-diffusion can be introduced in the lattice by doping Fe3+ at the Zn site. Doping of Al3+ at the Si site would introduce extra Li that could enhance the capacity of this material. Promising isovalent dopants at the Zn and the Si sites are Fe2+ and Ge4+ respectively. Though there is a small difference in calculated defect energies between both phases, the trend was observed to be the same.

Supplementary Materials

The following are available online at https://www.mdpi.com/2073-4352/9/11/563/s1, Table S1: Interatomic potential parameters used in the atomistic simulations of Li2ZnSiO4.

Author Contributions

Computation, D.P., S.G. and N.K.; writing, N.K.; analysis and editing, A.C.

Funding

This research was financially supported by the European Union’s H2020 Programme under Grant Agreement number 824072–HARVESTORE.

Acknowledgments

We acknowledge Imperial College for providing high-performance computing facilities.

Conflicts of Interest

The authors declare no conflicts of interest.

References

  1. Padhi, A.K.; Nanjundaswamy, K.S.; Goodenough, J.B. Phospho-olivines as Positive-Electrode Materials for Rechargeable Lithium Batteries. J. Electrochem. Soc. 1997, 144, 1188–1194. [Google Scholar]
  2. Goodenough, J.B.; Kim, Y. Challenges for Rechargeable Li Batteries. Chem. Mater. 2010, 22, 587–603. [Google Scholar]
  3. Yabuuchi, N.; Kubota, K.; Dahbi, M.; Komaba, S. Research Development on Sodium-Ion Batteries. Chem. Rev. 2014, 114, 11636–11682. [Google Scholar]
  4. Nytén, A.; Abouimrane, A.; Armand, M.; Gustafsson, T.; Thomas, J.O. Electrochemical performance of Li2FeSiO4 as a new Li-battery cathode material. Electrochem. Commun. 2005, 7, 156–160. [Google Scholar]
  5. Islam, M.S.; Fisher, C.A.J. Lithium and sodium battery cathode materials: computational insights into voltage, diffusion and nanostructural properties. Chem. Soc. Rev. 2014, 43, 185–204. [Google Scholar]
  6. Tarascon, J.M.; Armand, M. Issues and challenges facing rechargeable lithium batteries. Nature 2001, 414, 359. [Google Scholar]
  7. Hwang, J.-Y.; Myung, S.-T.; Sun, Y.-K. Sodium-ion batteries: Present and future. Chem. Soc. Rev. 2017, 46, 3529–3614. [Google Scholar]
  8. Masquelier, C.; Croguennec, L. Polyanionic (Phosphates, Silicates, Sulfates) Frameworks as Electrode Materials for Rechargeable Li (or Na) Batteries. Chem. Rev. 2013, 113, 6552–6591. [Google Scholar]
  9. Mao, M.; Gao, T.; Hou, S.; Wang, C. A critical review of cathodes for rechargeable Mg batteries. Chem. Soc. Rev. 2018, 47, 8804–8841. [Google Scholar]
  10. Jay, E.E.; Rushton, M.J.D.; Chroneos, A.; Grimes, R.W.; Kilner, J.A. Genetics of superionic conductivity in lithium lanthanum titanates. Phys. Chem. Chem. Phys. 2015, 17, 178–183. [Google Scholar]
  11. Kuganathan, N.; Tsoukalas, L.H.; Chroneos, A. Defects, dopants and Li-ion diffusion in Li2SiO3. Solid State Ionics 2019, 335, 61–66. [Google Scholar]
  12. Islam, M.S.; Dominko, R.; Masquelier, C.; Sirisopanaporn, C.; Armstrong, A.R.; Bruce, P.G. Silicate cathodes for lithium batteries: alternatives to phosphates? J. Mater. Chem. 2011, 21, 9811–9818. [Google Scholar] [Green Version]
  13. Bao, L.; Gao, W.; Su, Y.; Wang, Z.; Li, N.; Chen, S.; Wu, F. Progression of the silicate cathode materials used in lithium ion batteries. Chinese Sci. Bull. 2013, 58, 575–584. [Google Scholar]
  14. Ferrari, S.; Mozzati, M.C.; Lantieri, M.; Spina, G.; Capsoni, D.; Bini, M. New materials for Li-ion batteries: Synthesis and spectroscopic characterization of Li2(FeMnCo)SiO4 cathode materials. Sci. Rep. 2016, 6, 27896. [Google Scholar]
  15. Nytén, A.; Kamali, S.; Häggström, L.; Gustafsson, T.; Thomas, J.O. The lithium extraction/insertion mechanism in Li2FeSiO4. J. Mater. Chem. 2006, 16, 2266–2272. [Google Scholar]
  16. Nishimura, S.-i.; Hayase, S.; Kanno, R.; Yashima, M.; Nakayama, N.; Yamada, A. Structure of Li2FeSiO4. J. Am. Chem. Soc. 2008, 130, 13212–13213. [Google Scholar]
  17. Armstrong, A.R.; Kuganathan, N.; Islam, M.S.; Bruce, P.G. Structure and Lithium Transport Pathways in Li2FeSiO4 Cathodes for Lithium Batteries. J. Am. Chem. Soc. 2011, 133, 13031–13035. [Google Scholar]
  18. Dominko, R.; Bele, M.; Gaberšček, M.; Meden, A.; Remškar, M.; Jamnik, J. Structure and electrochemical performance of Li2MnSiO4 and Li2FeSiO4 as potential Li-battery cathode materials. Electrochem. Commun. 2006, 8, 217–222. [Google Scholar]
  19. Politaev, V.V.; Petrenko, A.A.; Nalbandyan, V.B.; Medvedev, B.S.; Shvetsova, E.S. Crystal structure, phase relations and electrochemical properties of monoclinic Li2MnSiO4. J. Solid State Chem. 2007, 180, 1045–1050. [Google Scholar]
  20. Dominko, R. Li2MSiO4 (M=Fe and/or Mn) cathode materials. J. Power Sources 2008, 184, 462–468. [Google Scholar]
  21. Girish, H.N.; Shao, G.Q. Advances in high-capacity Li2MSiO4 (M = Mn, Fe, Co, Ni, …) cathode materials for lithium-ion batteries. RSC Adv. 2015, 5, 98666–98686. [Google Scholar]
  22. Zhang, L.-L.; Duan, S.; Yang, X.-L.; Peng, G.; Liang, G.; Huang, Y.-H.; Jiang, Y.; Ni, S.-B.; Li, M. Reduced Graphene Oxide Modified Li2FeSiO4/C Composite with Enhanced Electrochemical Performance as Cathode Material for Lithium Ion Batteries. ACS Appl. Mater. Inter. 2013, 5, 12304–12309. [Google Scholar]
  23. Eames, C.; Armstrong, A.R.; Bruce, P.G.; Islam, M.S. Insights into Changes in Voltage and Structure of Li2FeSiO4 Polymorphs for Lithium-Ion Batteries. Chem. Mater. 2012, 24, 2155–2161. [Google Scholar]
  24. Liivat, A.; Thomas, J.O. Li-ion migration in Li2FeSiO4-related cathode materials: A DFT study. Solid State Ionics 2011, 192, 58–64. [Google Scholar]
  25. Kuganathan, N.; Islam, M.S. Li2MnSiO4 Lithium Battery Material: Atomic-Scale Study of Defects, Lithium Mobility, and Trivalent Dopants. Chem. Mater. 2009, 21, 5196–5202. [Google Scholar]
  26. Fisher, C.A.J.; Kuganathan, N.; Islam, M.S. Defect chemistry and lithium-ion migration in polymorphs of the cathode material Li2MnSiO4. J. Mater. Chem. A 2013, 1, 4207–4214. [Google Scholar]
  27. Adnan, S.B.R.S.; Mohamed, N.S. Conductivity and Dielectric Studies of Li2ZnSiO4 Ceramic Electrolyte Synthesized via Citrate Sol Gel Method. Int. J. Electrochem. Sci. 2012, 7, 9844–9858. [Google Scholar]
  28. Sivagami, I.N.; Prasanna, K.; Santhoshkumar, P.; Jo, Y.N.; Kang, S.H.; Kim, T.H.; Lee, C.W. Synthesis of Novel Lithium Metal Silicate and Its Application in Lithium Ion Batteries as a Potential Cathode Material. J. Nanosci. Nanotech. 2017, 17, 8061–8066. [Google Scholar]
  29. Zhuang, Y.; Teng, Y.; Luo, J.; Zhu, B.; Chi, Y.; Wu, E.; Zeng, H.; Qiu, J. Broadband optical amplification in silicate glass ceramics containing Li2ZnSiO4:Cr4+ nanocrystals. Appl. Phys. Lett. 2009, 95, 111913. [Google Scholar]
  30. Seymour, I.D.; Chroneos, A.; Kilner, J.A.; Grimes, R.W. Defect processes in orthorhombic LnBaCo2O5.5 double perovskites. Phys. Chem. Chem. Phys. 2011, 13, 15305–15310. [Google Scholar]
  31. Chiabrera, F.; Garbayo, I.; López-Conesa, L.; Martín, G.; Ruiz-Caridad, A.; Walls, M.; Ruiz-González, L.; Kordatos, A.; Núñez, M.; Morata, A.; et al. Engineering Transport in Manganites by Tuning Local Nonstoichiometry in Grain Boundaries. Adv. Mater. 2019, 31, 1805360. [Google Scholar]
  32. Islam, M.S.; Driscoll, D.J.; Fisher, C.A.J.; Slater, P.R. Atomic-Scale Investigation of Defects, Dopants, and Lithium Transport in the LiFePO4 Olivine-Type Battery Material. Chem. Mater. 2005, 17, 5085–5092. [Google Scholar]
  33. Fisher, C.A.J.; Hart Prieto, V.M.; Islam, M.S. Lithium Battery Materials LiMPO4 (M = Mn, Fe, Co, and Ni): Insights into Defect Association, Transport Mechanisms, and Doping Behavior. Chem. Mater. 2008, 20, 5907–5915. [Google Scholar]
  34. Treacher, J.C.; Wood, S.M.; Islam, M.S.; Kendrick, E. Na2CoSiO4 as a cathode material for sodium-ion batteries: structure, electrochemistry and diffusion pathways. Phys. Chem. Chem. Phys. 2016, 18, 32744–32752. [Google Scholar]
  35. Stokes, S.J.; Islam, M.S. Defect chemistry and proton-dopant association in BaZrO3 and BaPrO3. J. Mater. Chem. 2010, 20, 6258–6264. [Google Scholar]
  36. Kuganathan, N.; Chroneos, A. Defects, Dopants and Sodium Mobility in Na2MnSiO4. Sci. Rep. 2018, 8, 14669. [Google Scholar]
  37. Kuganathan, N.; Chroneos, A. Defects and dopant properties of Li3V2(PO4)3. Sci. Rep. 2019, 9, 333. [Google Scholar]
  38. Kuganathan, N.; Kordatos, A.; Chroneos, A. Defect Chemistry and Li-ion Diffusion in Li2RuO3. Sci. Rep. 2019, 9, 550. [Google Scholar]
  39. Gale, J.D.; Rohl, A.L. The General Utility Lattice Program (GULP). Mol. Simulat. 2003, 29, 291–341. [Google Scholar]
  40. Gale, J.D. GULP: A computer program for the symmetry-adapted simulation of solids. J. Chem. Soc. 1997, 93, 629–637. [Google Scholar]
  41. Mott, N.F.; Littleton, M.J. Conduction in polar crystals. I. Electrolytic conduction in solid salts. Trans. Faraday Soc. 1938, 34, 485–499. [Google Scholar]
  42. Varotsos, P. Comparison of models that interconnect point defect parameters in solids with bulk properties. J. Appl. Phys. 2007, 101, 123503. [Google Scholar]
  43. Varotsos, P. Defect volumes and the equation of state in α−PbF2. Phys. Rev. B 2007, 76, 092106. [Google Scholar]
  44. Chroneos, A.; Vovk, R.V. Modeling self-diffusion in UO2 and ThO2 by connecting point defect parameters with bulk properties. Solid State Ionics 2015, 274, 1–3. [Google Scholar]
  45. Cooper, M.W.D.; Grimes, R.W.; Fitzpatrick, M.E.; Chroneos, A. Modeling oxygen self-diffusion in UO2 under pressure. Solid State Ionics 2015, 282, 26–30. [Google Scholar]
  46. Sarlis, N.V.; Skordas, E.S. Interconnection of a thermodynamical model for point defect parameters in solids with the dynamical theory of diffusion. Solid State Ionics 2019, 335, 82–85. [Google Scholar]
  47. Varotsos, P. Point defect parameters in β-PbF2 revisited. Solid State Ionics 2008, 179, 438–441. [Google Scholar]
  48. Yamaguchi, H.; Akatsuka, K.; Setoguchi, M. Structure of dilithium zinc silicate [gamma]II-Li2ZnSiO4. Acta Crystallogr. Sec. B 1979, 35, 2678–2680. [Google Scholar]
  49. Kröger, F.A.; Vink, H.J. Relations between the Concentrations of Imperfections in Crystalline Solids. Seitz, F., Turnbull, D., Eds. Solid State Phys. 1956, 3, 307–435. [Google Scholar]
  50. Ensling, D.; Stjerndahl, M.; Nytén, A.; Gustafsson, T.; Thomas, J.O. A comparative XPS surface study of Li2FeSiO4/C cycled with LiTFSI- and LiPF6-based electrolytes. J. Mater. Chem. 2009, 19, 82–88. [Google Scholar]
  51. Liu, H.; Choe, M.-J.; Enrique, R.A.; Orvañanos, B.; Zhou, L.; Liu, T.; Thornton, K.; Grey, C.P. Effects of Antisite Defects on Li Diffusion in LiFePO4 Revealed by Li Isotope Exchange. J. Phys. Chem. C 2017, 121, 12025–12036. [Google Scholar]
  52. Kempaiah Devaraju, M.; Duc Truong, Q.; Hyodo, H.; Sasaki, Y.; Honma, I. Synthesis, characterization and observation of antisite defects in LiNiPO4 nanomaterials. Sci. Rep. 2015, 5, 11041. [Google Scholar]
  53. Nishimura, S.-i.; Kobayashi, G.; Ohoyama, K.; Kanno, R.; Yashima, M.; Yamada, A. Experimental visualization of lithium diffusion in LixFePO4. Nat. Mater. 2008, 7, 707. [Google Scholar]
  54. Kostopoulos, D.; Varotsos, P.; Mourikis, S. The Conductivity of Crystalline NaI. Can. J. Phys. 1975, 53, 1318–1320. [Google Scholar]
  55. Varotsos, P.; Miliotis, D. New aspects on the dielectric properties of the alkali halides with divalent impurities. J. Phys. Chem. Solids 1974, 35, 927–930. [Google Scholar]
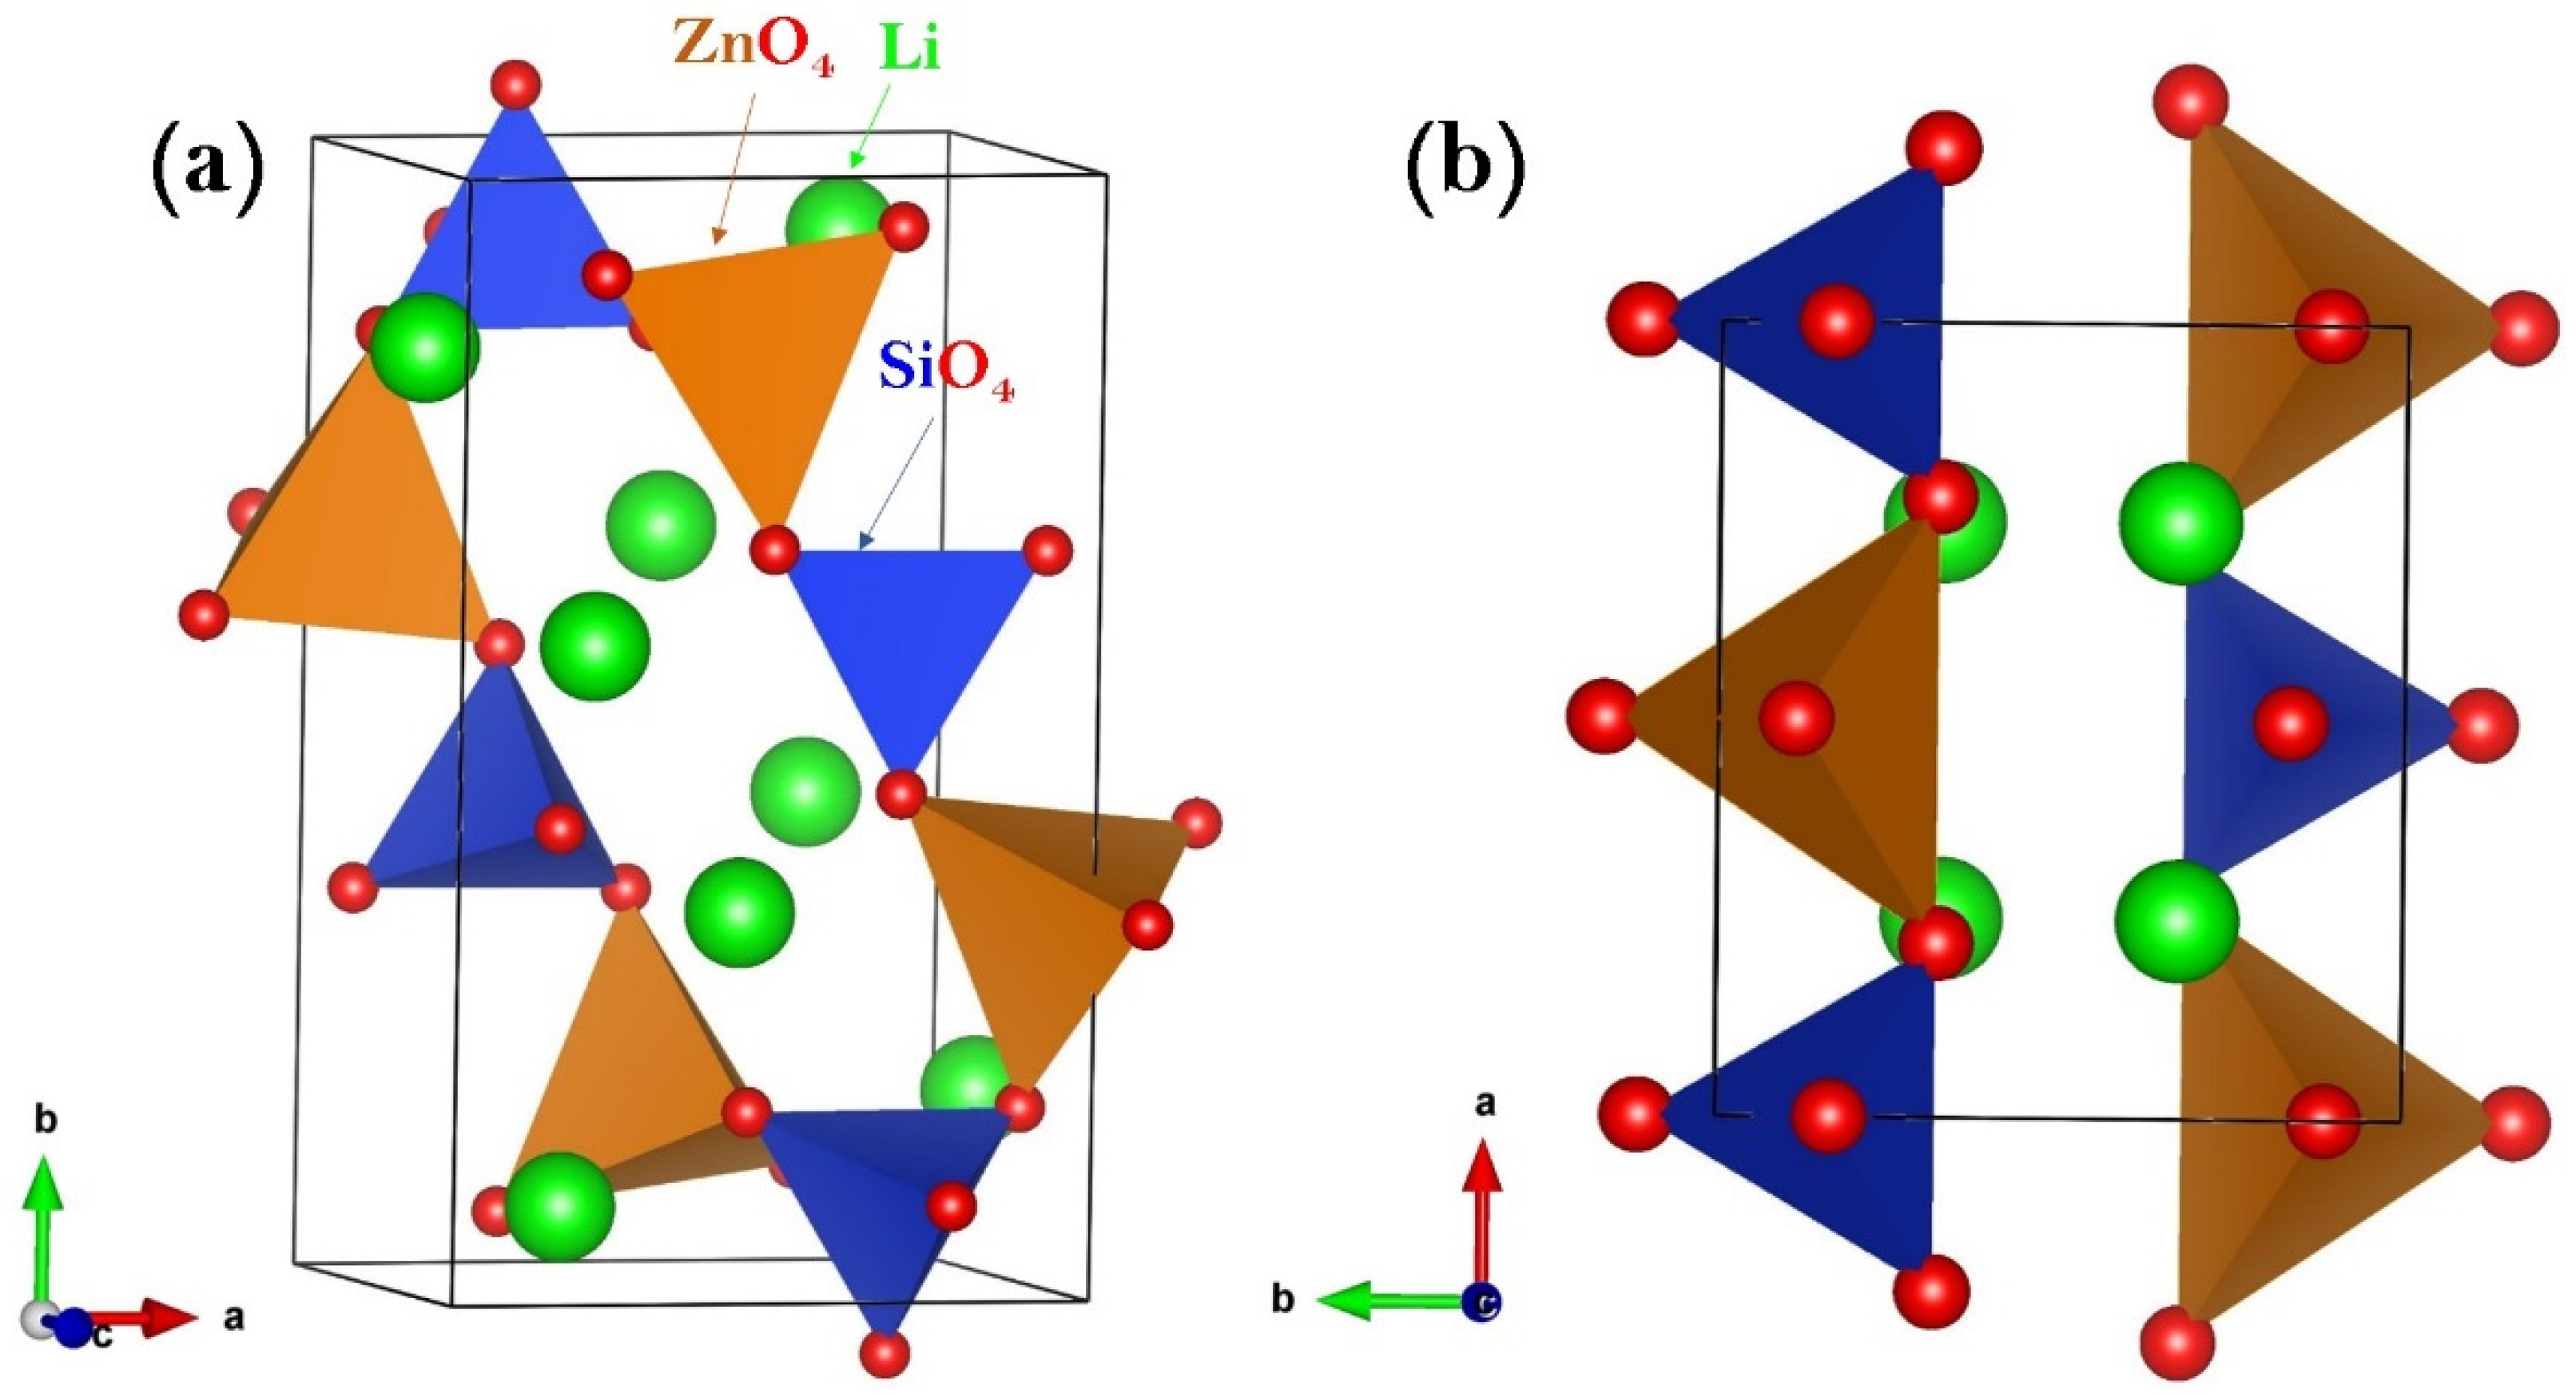
Figure 1. Crystal structures of Li2ZnSiO4 polymorphs: (a) monoclinic (space group P21/n) and (b) orthorhombic (space group Pmn21).
Crystals 09 00563 g001
Figure 2. Energies of intrinsic defect processes calculated in monoclinic and orthorhombic phases of Li2ZnSiO4.
Crystals 09 00563 g002
Figure 3. Possible long-range lithium vacancy migration paths considered in monoclinic Li2ZnSiO4. Yellow, grey, green and purple coloured atoms correspond to different Li hopping trajectories.
Crystals 09 00563 g003
Figure 4. (A–D) Four different energy profiles (as shown in Figure 3) of Li vacancy hopping between two adjacent Li sites in monoclinic Li2ZnSiO4.
Crystals 09 00563 g004
Figure 5. Possible long-range lithium vacancy migration paths considered in orthorhombic Li2ZnSiO4. Grey, green and purple coloured atoms correspond to different Li hopping trajectories.
Crystals 09 00563 g005
Figure 6. Three different energy profiles (as shown in Figure 5) of Li vacancy hopping between two adjacent Li sites in orthorhombic Li2ZnSiO4.
Crystals 09 00563 g006
Figure 7. Enthalpy of solution of MO (M = Ni, Mg, Co, Fe, Ca, Sr and Ba) with respect to the M2+ ionic radius in monoclinic and orthorhombic Li2ZnSiO4.
Crystals 09 00563 g007
Figure 8. The enthalpy of a solution of M 2 O 3 (M = Al, Ga, Fe, In, Sc, Y, Gd and La) with respect to the M3+ ionic radius in monoclinic and orthorhombic Li2ZnSiO4: (a) M3+ at the Zn site, and (b) M3+ at the Si site.
Crystals 09 00563 g008
Figure 9. The enthalpy of a solution of M O 2 (R = Ge, Ti, Sn, Zr and Ce) with respect to the M4+ ionic radius in monoclinic and orthorhombic Li2ZnSiO4.
Crystals 09 00563 g009
Table 1. Comparison between the calculated structural parameters and corresponding experimental [48] or initial values [4] reported for monoclinic (P21/n) and orthorhombic (Pmn21) Li2ZnSiO4.
Monoclinic
ParameterCalculationExperiment [48]|∆|(%)
a (Å)6.22756.26200.07
b (Å)10.650710.60200.55
c (Å)5.02935.02100.46
α = γ (°)90.090.00.00
β (°)90.4790.510.05
Orthorhombic
ParameterCalculationInitial [4]|∆|(%)
a (Å)6.18946.26611.23
b (Å)5.33665.32950.13
c (Å)4.89345.01482.42
α = β = γ (°)90.090.00.00
Table 2. Calculated Li–Li separations and corresponding activation energies in monoclinic Li2ZnSiO4 (refer to Figure 3).
Migration PathLi-Li Separation (Å)Activation Energy (eV)
DirectCurved
A2.700.650.60
B2.900.810.44
C3.281.461.27
D3.460.880.88
Table 3. Possible long-range Li ion diffusion paths and their corresponding overall activation energies in monoclinic Li2ZnSiO4.
Long-Range PathOverall Activation Energy (eV)
A→D→A→D0.88
B→C→B→ C1.27
Table 4. Calculated Li–Li separations and corresponding activation energies in orthorhombic Li2ZnSiO4 (refer to Figure 5).
Migration PathLi-Li Separation (Å)Activation Energy (eV)
DirectCurved
P3.060.990.90
Q3.091.281.07
R3.101.301.02
Table 5. Possible long-range Li ion diffusion paths and their corresponding overall activation energies in orthorhombic Li2ZnSiO4.
Long-Range PathOverall Activation Energy (eV)
P→P→P→P0.90
Q→R→Q→ R1.07