1. Introduction
Cerium-doped oxyorthosilicates (Re
2SiO
5) have gained a lot of attention in the last 30 years as highly-efficient scintillation materials [
1,
2,
3]. Specifically, Lu
2SiO
5:Ce
3+ crystals were widely studied by different groups due to their good scintillation properties including high scintillation yield (~25,000 photons/MeV) and short decay time (less than 40 ns) [
4,
5]. However, the wide-scale use of Lu
2SiO
5:Ce
3+ crystals as scintillators is hampered by the long-lasting afterglow caused by the high number of shallow electron traps whose origin is still under discussion [
6,
7].
Lu
2SiO
5 and Y
2SiO
5 crystals have two positions for doped rare-earth ions which were earlier marked as Re1 and Re2. Already, the first studies of luminescence spectra of Lu
2SiO
5:Ce
3+ crystals have revealed two luminescence centers (at 400 nm and 480 nm) which were attributed either to cerium ions in Lu1 and Lu2 position [
8], or to one cerium ion in regular position and other in interstitial one [
9]. The attribution of the main luminescence peak to 5d→4f transitions of Ce
3+ ions coordinated by six oxygen anions, which was widely accepted in early papers on this subject [
8], was later reconsidered [
10], and now it is generally accepted that this band is formed by the luminescence of Ce
3+ ions coordinated by seven oxygen ions, while that observed at 480 nm is ascribed to luminescence of six-coordinated Ce
3+ ions. In the same way, two luminescence centers in Y
2SiO
5:Ce
3+ bulk crystals and single crystalline films [
11,
12] have been ascribed to Ce
3+ ions in 6- and 7-coordinated positions.
The studies of the structural and optical properties of Re
2SiO
5:Ce
3+ nanocrystals (30 nm or less) have shown that their crystal structure is different from the structure of their bulk counterparts possessing P2
1/c space group instead of C2/c space group typical for Re
2SiO
5:Ce
3+ bulk crystals, so their luminescent and scintillation characteristics are different as well [
13]. Lu
2SiO
5:Ce
3+ nanocrystals have sufficiently lower thermoluminescence [
7,
14] and afterglow levels [
13], which may be attributed [
8,
13] to the higher content of oxygen vacancies (and, so, of F-centers that are possibly responsible for afterglow) in Lu
2SiO
5:Ce
3+ bulk crystals as compared to Lu
2SiO
5:Ce
3+ nanocrystals. However, the origin of this effect is still obscure, and requires more profound understanding.
In Re
2SiO
5 nanocrystals, two different positions for cerium ions are available—9-oxygen-coordinated one and 7-oxygen-coordinated one, but only one optical center was reported [
13]. In this paper, more detailed study of Ce
3+ X-ray and photoluminescence in Re
2SiO
5 nanocrystals is shown. In contrast to previous reports [
8,
13], two optical centers were observed in Lu
2SiO
5:Ce
3+ and Y
2SiO
5:Ce
3+ nanocrystals ascribed to Ce
3+ ions with different oxygen coordination, the first of which is dominant at photo- and second one at X-ray excitation.
3. Results and Discussion
Lu
2SiO
5:Ce
3+ and Y
2SiO
5:Ce
3+ nanocrystals obtained by the methods described in the previous section were characterized using X-ray diffraction (XRD) and transmission electron microscopy (TEM) methods. The size of synthesized nanocrystals was about 30 nm (
Supplementary Materials Figure S1). XRD of Lu
2SiO
5:Ce
3+ nanocrystal is shown in
Figure S2. Both Lu
2SiO
5:Ce
3+ and Y
2SiO
5:Ce
3+ nanocrystals have the same monoclinic P2
1/c structure. This structure is not typical for bulk Lu
2SiO
5:Ce
3+ and Y
2SiO
5:Ce
3+ crystals, which have C2/c crystal structure, and corresponds to Gd
2SiO
5-type structure. Previously, the same P2
1/c structure was observed for 30 nm Lu
2SiO
5:Ce
3+ nanocrystals prepared using the methods of solution combustion synthesis (SCS) [
13].
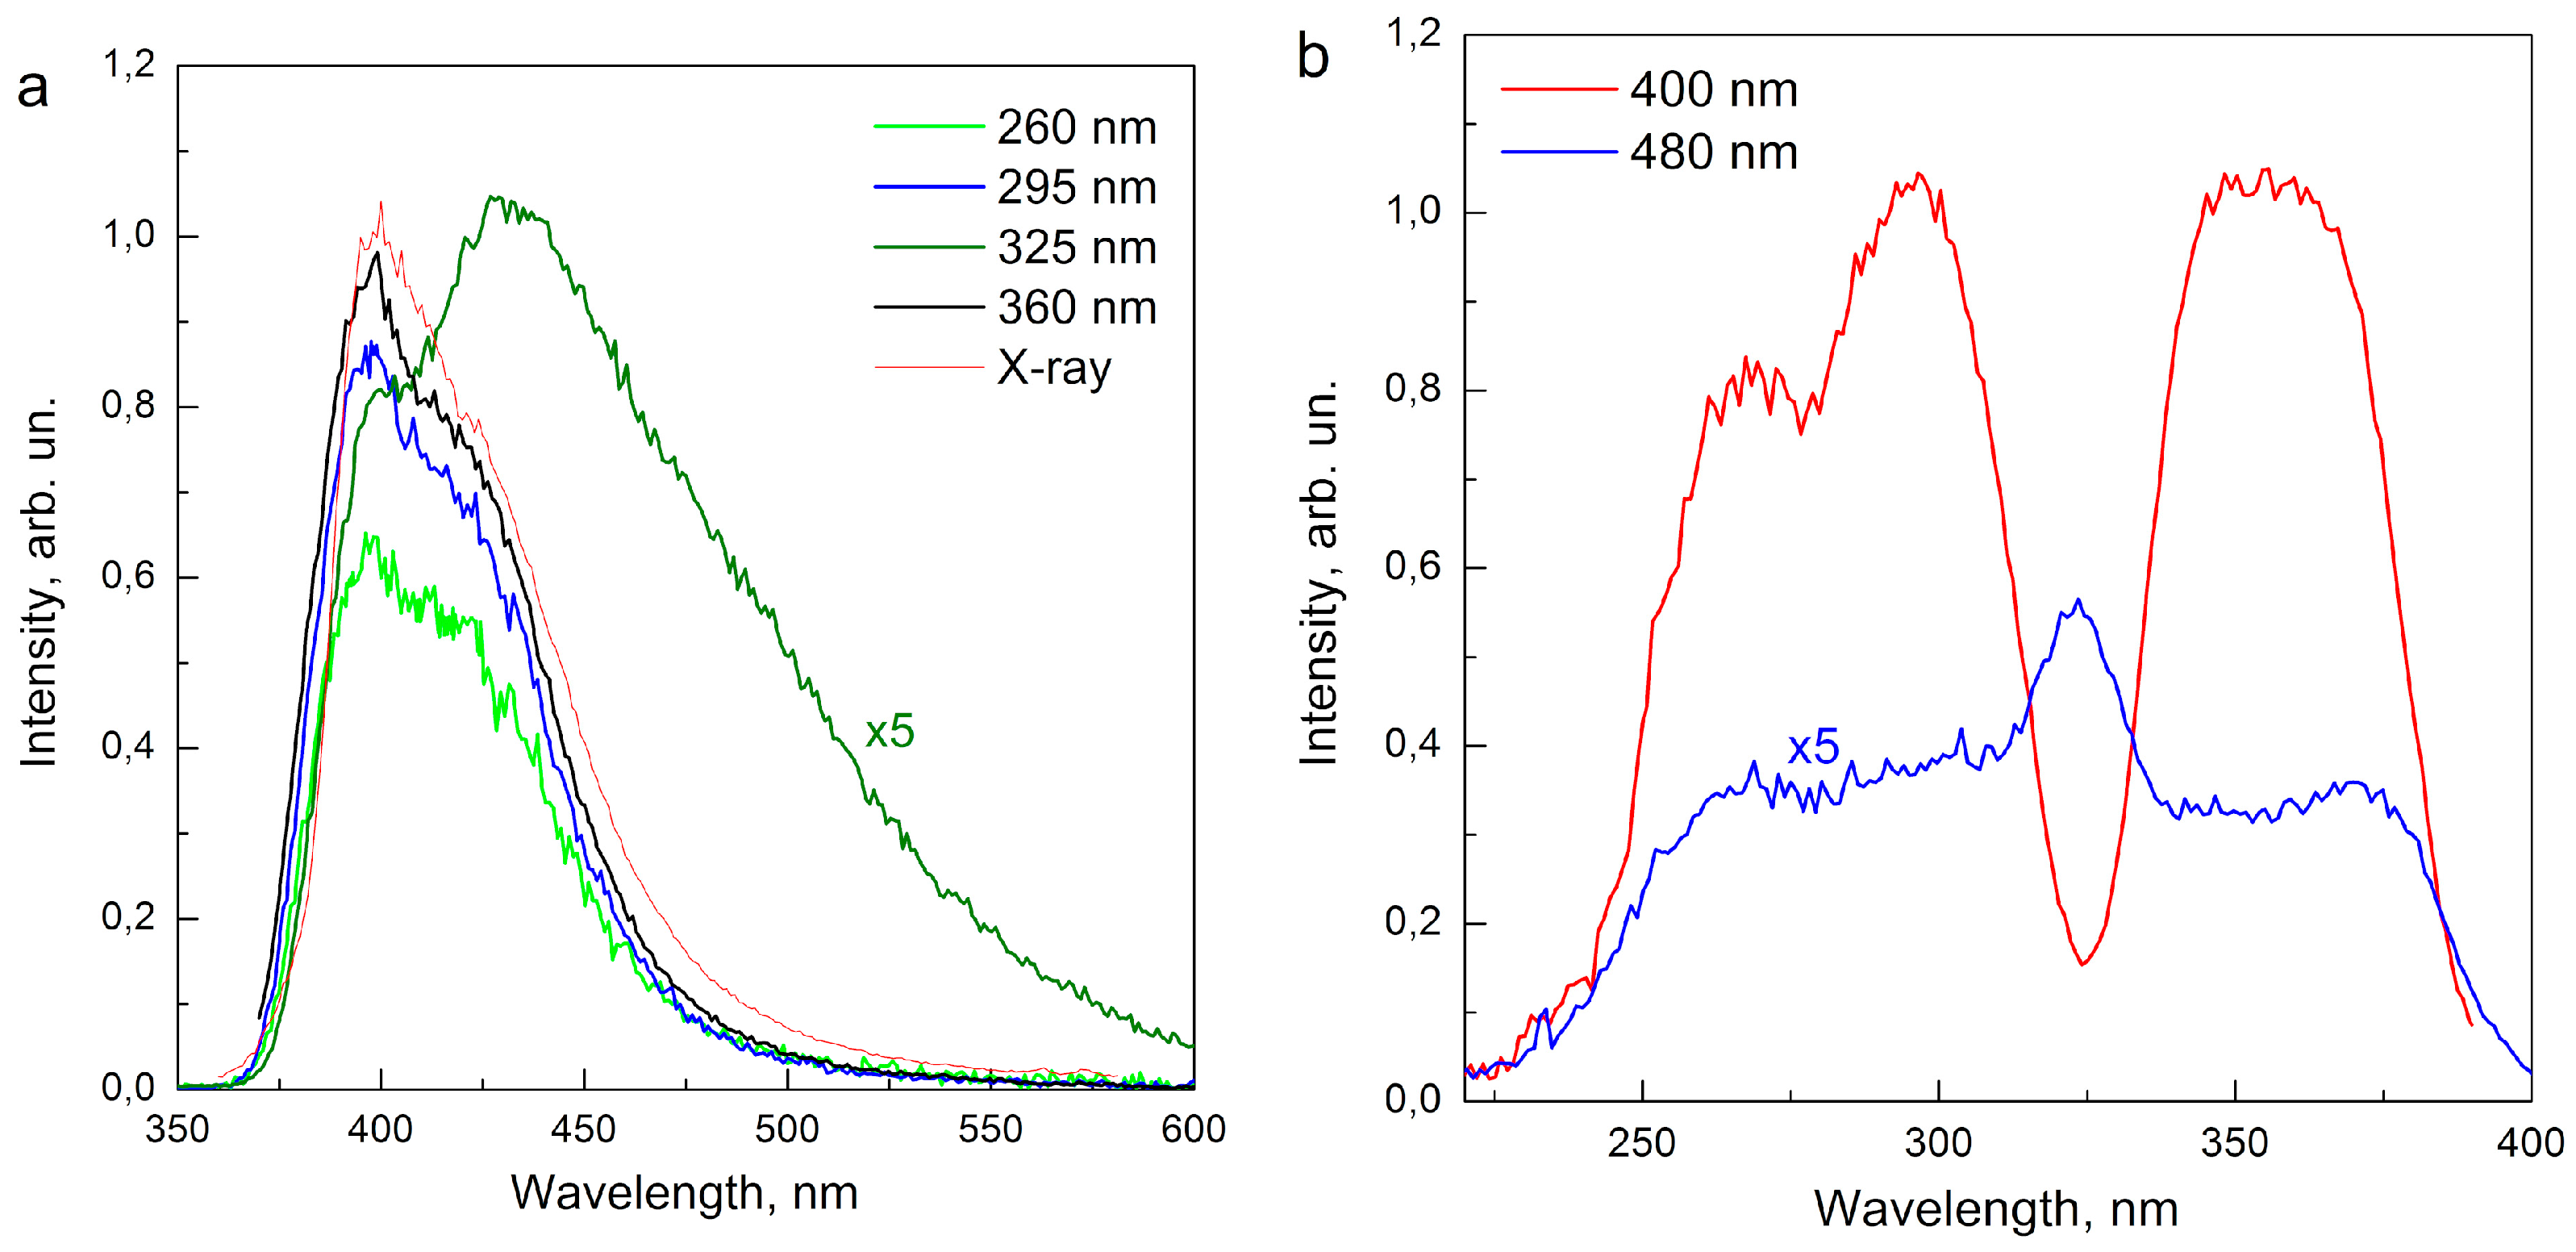
In
Figure 1a photoluminescence and X-ray luminescence spectra of Lu
2SiO
5:Ce
3+ bulk crystals are shown. The spectra obtained at X-ray excitation consist of an intensive luminescence band with maximum at 400 nm with less intensive sub-band at 420 nm (corresponding to 5d→
2F
5/2 and 5d→
2F
7/2 transitions of Ce
3+ ion). The photoluminescence spectra at λ
exc = 325 nm consist of two bands with maxima at 400 nm and 470 nm. Excitation spectra taken at λ
reg = 400 nm consist of three bands with maxima at 270 nm, 295 nm and 355 nm (
Figure 1b). Excitation spectra taken at λ
reg = 480 nm are sufficiently less intensive and poorly resolved with main peak observed at 325 nm and other peaks at 265 nm, 295 nm and 370 nm. Photoluminescence spectra obtained at selective excitation of different bands (λ
exc = 260 nm, 295 nm, and 360 nm) are shown in
Figure 1a. Excitation at 260 nm, 295 nm, and 360 nm leads to luminescence with maximum at 400 nm and sub-band at 420 nm. This luminescence can be assigned to 5d→
2F
5/2 and 5d→
2F
7/2 transitions of 7-oxygen coordinated Ce
3+ ion (Ce1 center). In the same way, the band at 470 nm can be ascribed to luminescence of 6-oxygen coordinated Ce
3+ ion (Ce2 center). So, at 325 nm excitation the complex luminescence band with maximum is observed due to superposition of Ce2 (6-oxygen coordinated Ce
3+ ion) and Ce1 luminescence.
The difference between the excitation spectra taken at different parts of the wide luminescence band clearly confirm its complex nature. In [
8] the study of absorption spectra of Lu
2SiO
5:Ce
3+ crystals allowed the authors to suppose the presence of two optical centers in Lu
2SiO
5:Ce
3+:Ce1 (absorption bands at 3.5 eV (355 nm), 4.2 eV (295 nm), and 4.7 eV (264 nm)), and Ce2 (absorption band at 3.8 eV (325 nm)). They have attributed Ce1 center to 6-oxygen-coordinated Ce
3+ ions, and Ce2 center to 7-oxygen-coordinated Ce
3+ ions, but in the following papers [
10] this attribution was reconsidered, and now Ce1 center is usually assigned to 7-oxygen-coordinated Ce
3+ ions, and Ce2 center to 6-oxygen-coordinated Ce
3+ ions. The excitation spectrum taken at 400 nm almost fully coincide with absorption spectrum of Ce1 center, while some additional low-intensive bands (at 265 nm, 295 nm and 370 nm) in the excitation spectrum taken at 480 nm can be ascribed either to excitation energy transfer between Ce1 and Ce2 centers, or to impact of luminescence of Ce1 centers into luminescence of Ce2 centers at 480 nm.
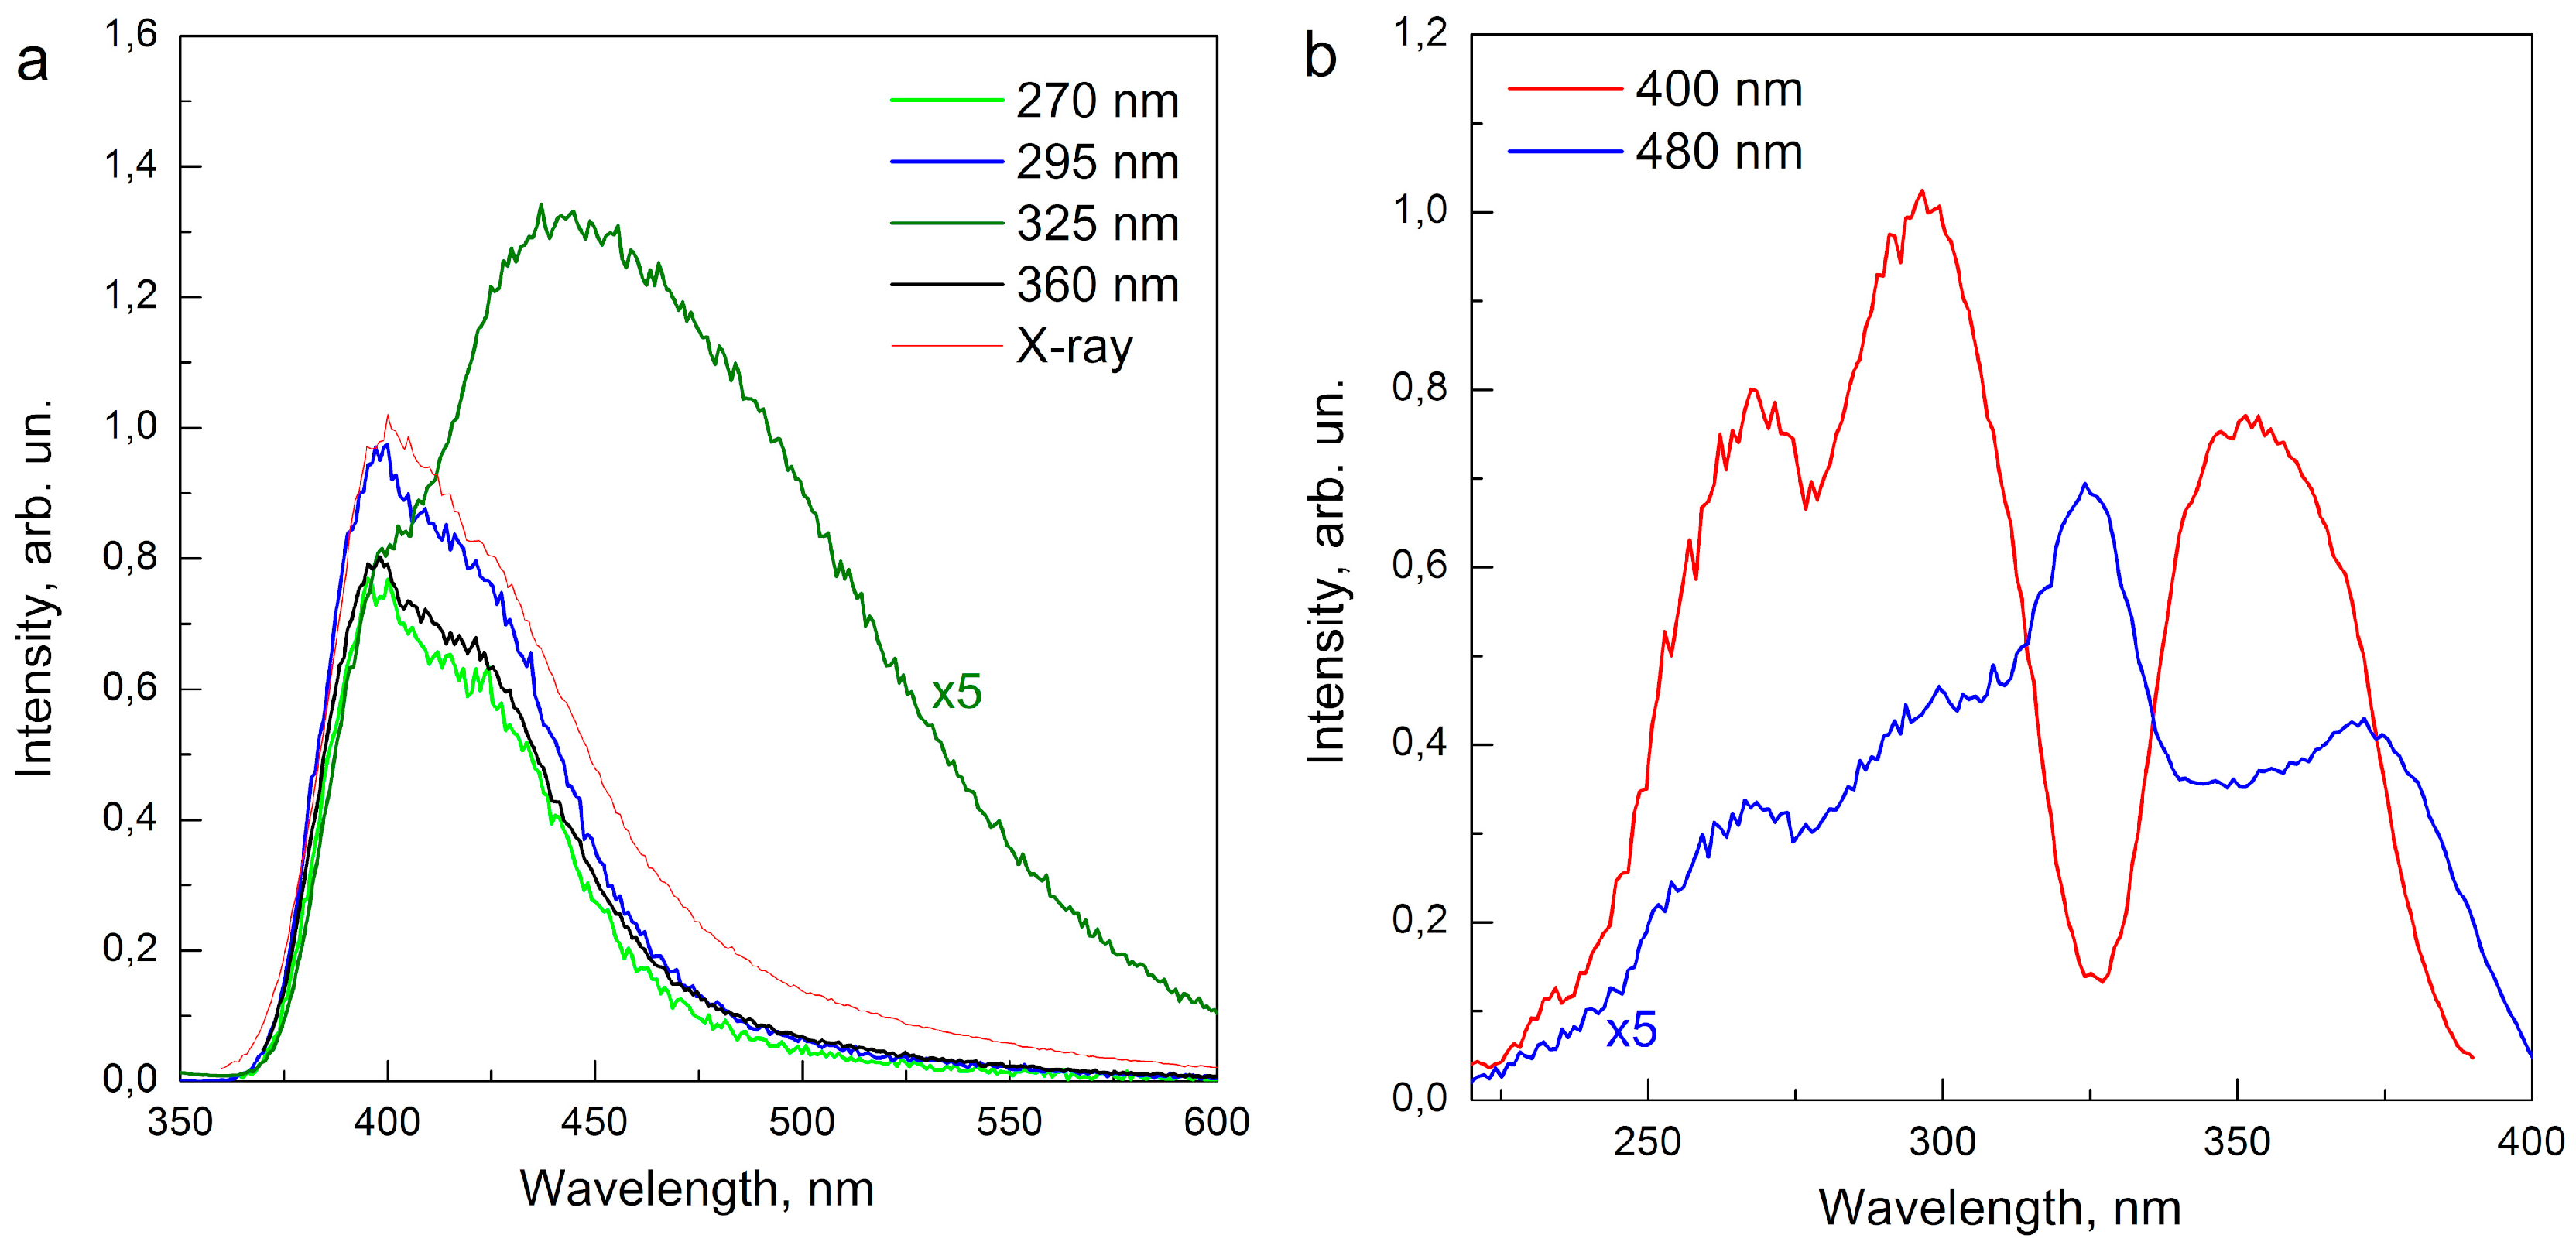
The X-ray and photoluminescence spectra of Y
2SiO
5:Ce
3+ bulk crystals are shown in
Figure 2a, and luminescence excitation spectra are shown in
Figure 2b. They closely resemble the spectra obtained for Lu
2SiO
5:Ce
3+ bulk crystals, and the same attribution of luminescence bands to cerium ions with different oxygen coordination seems reasonable.
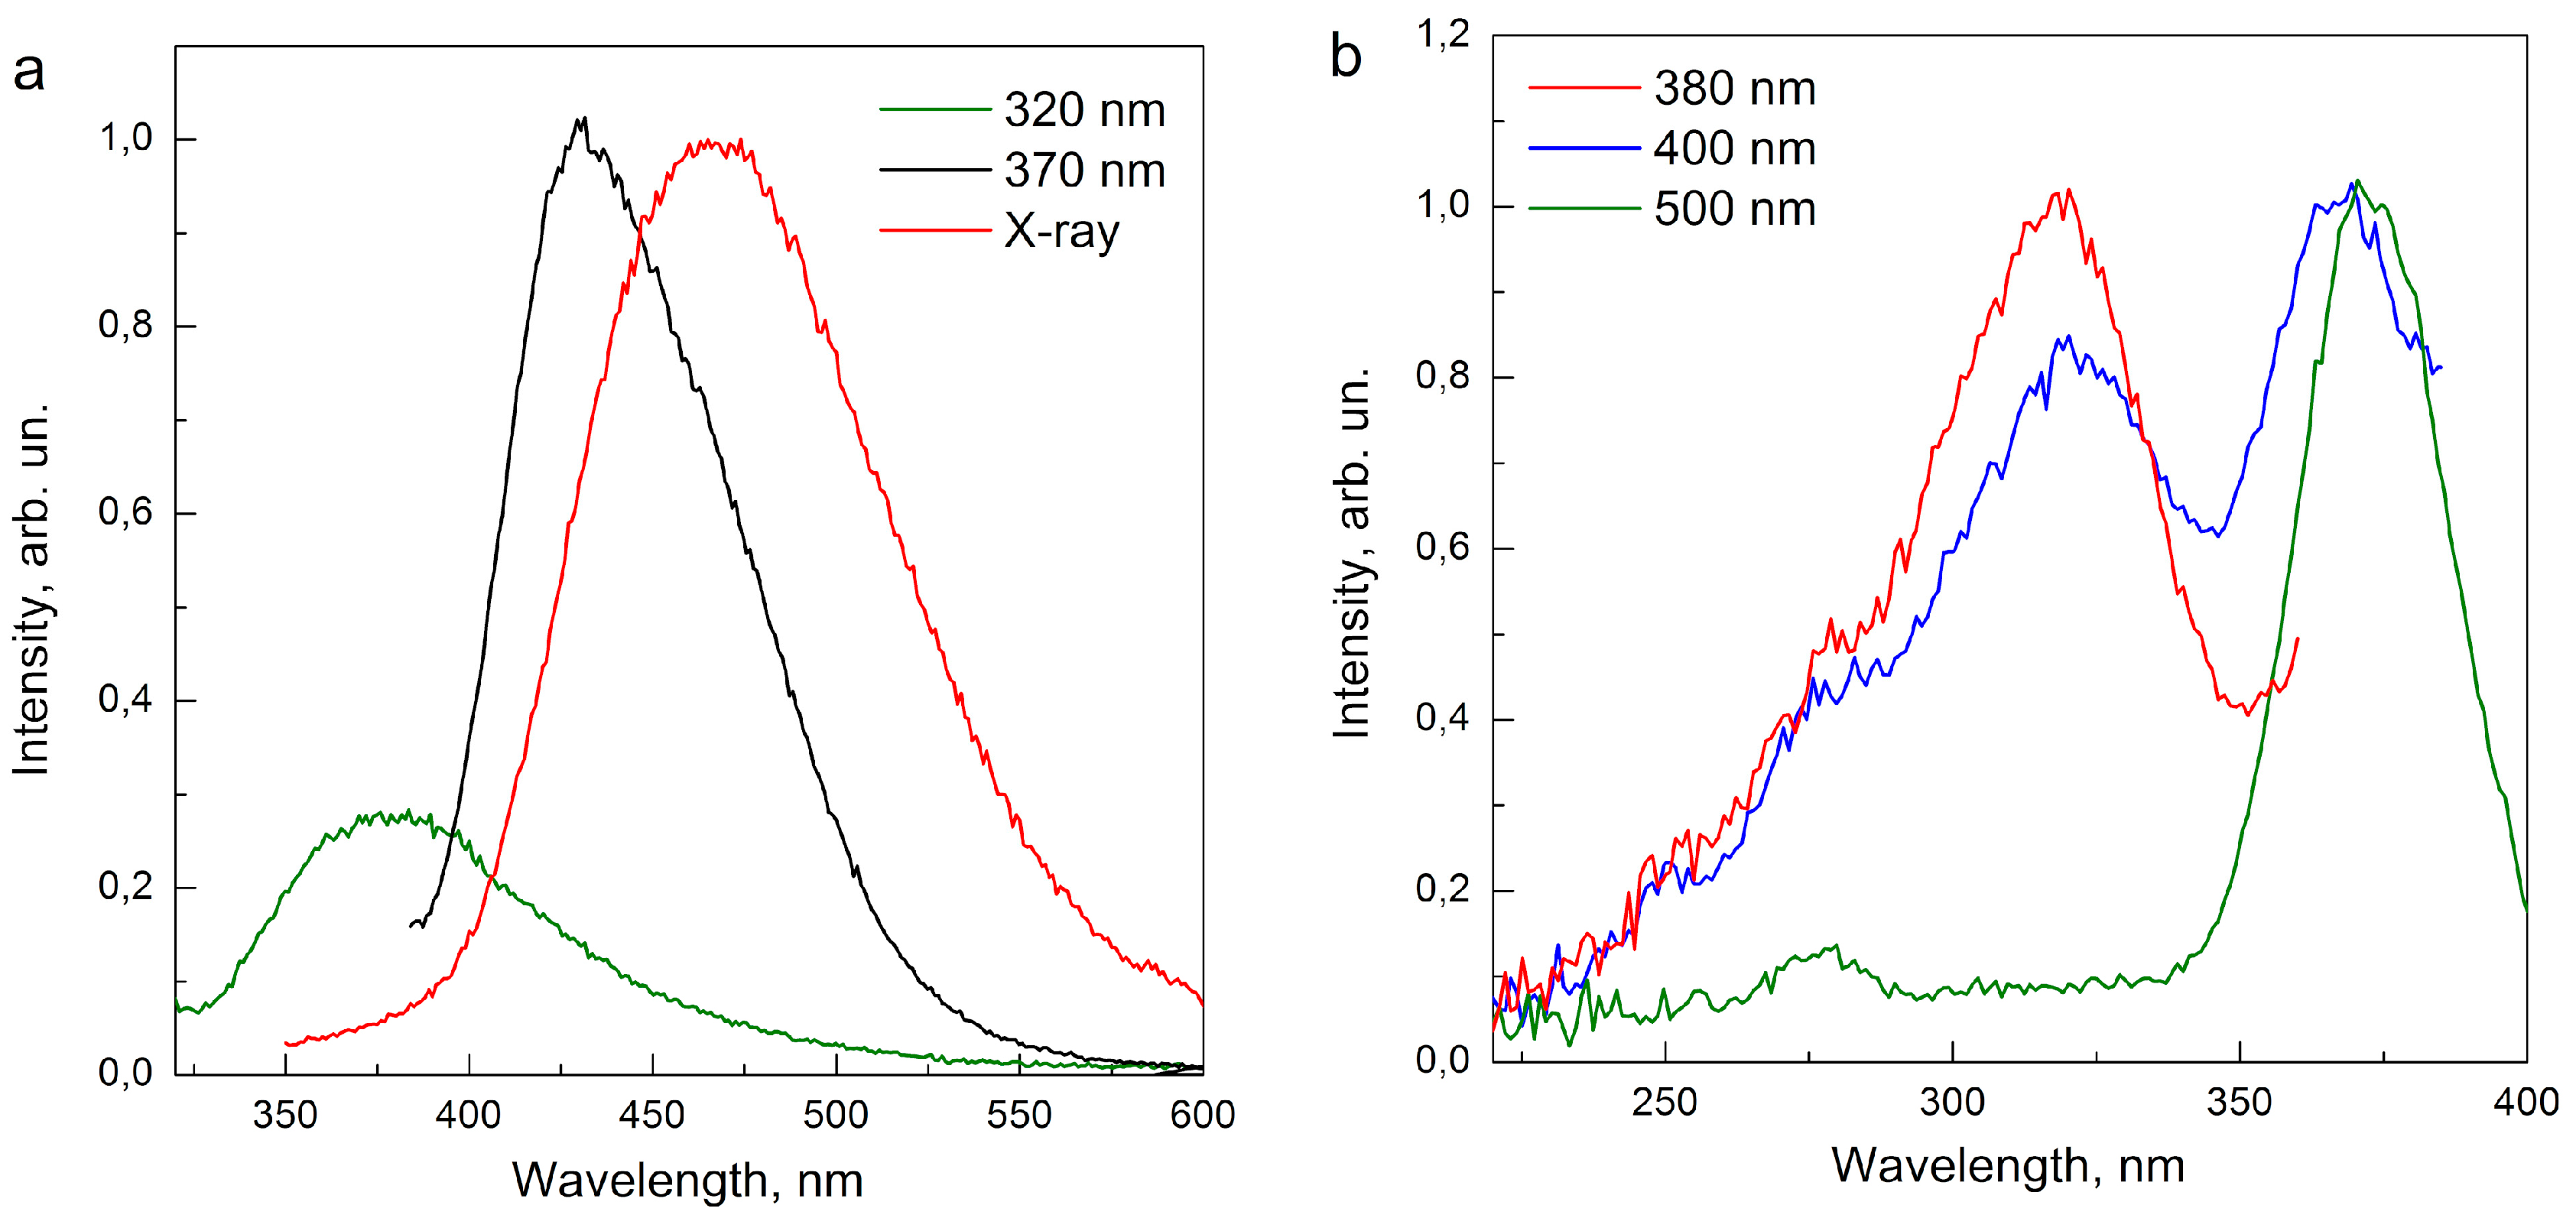
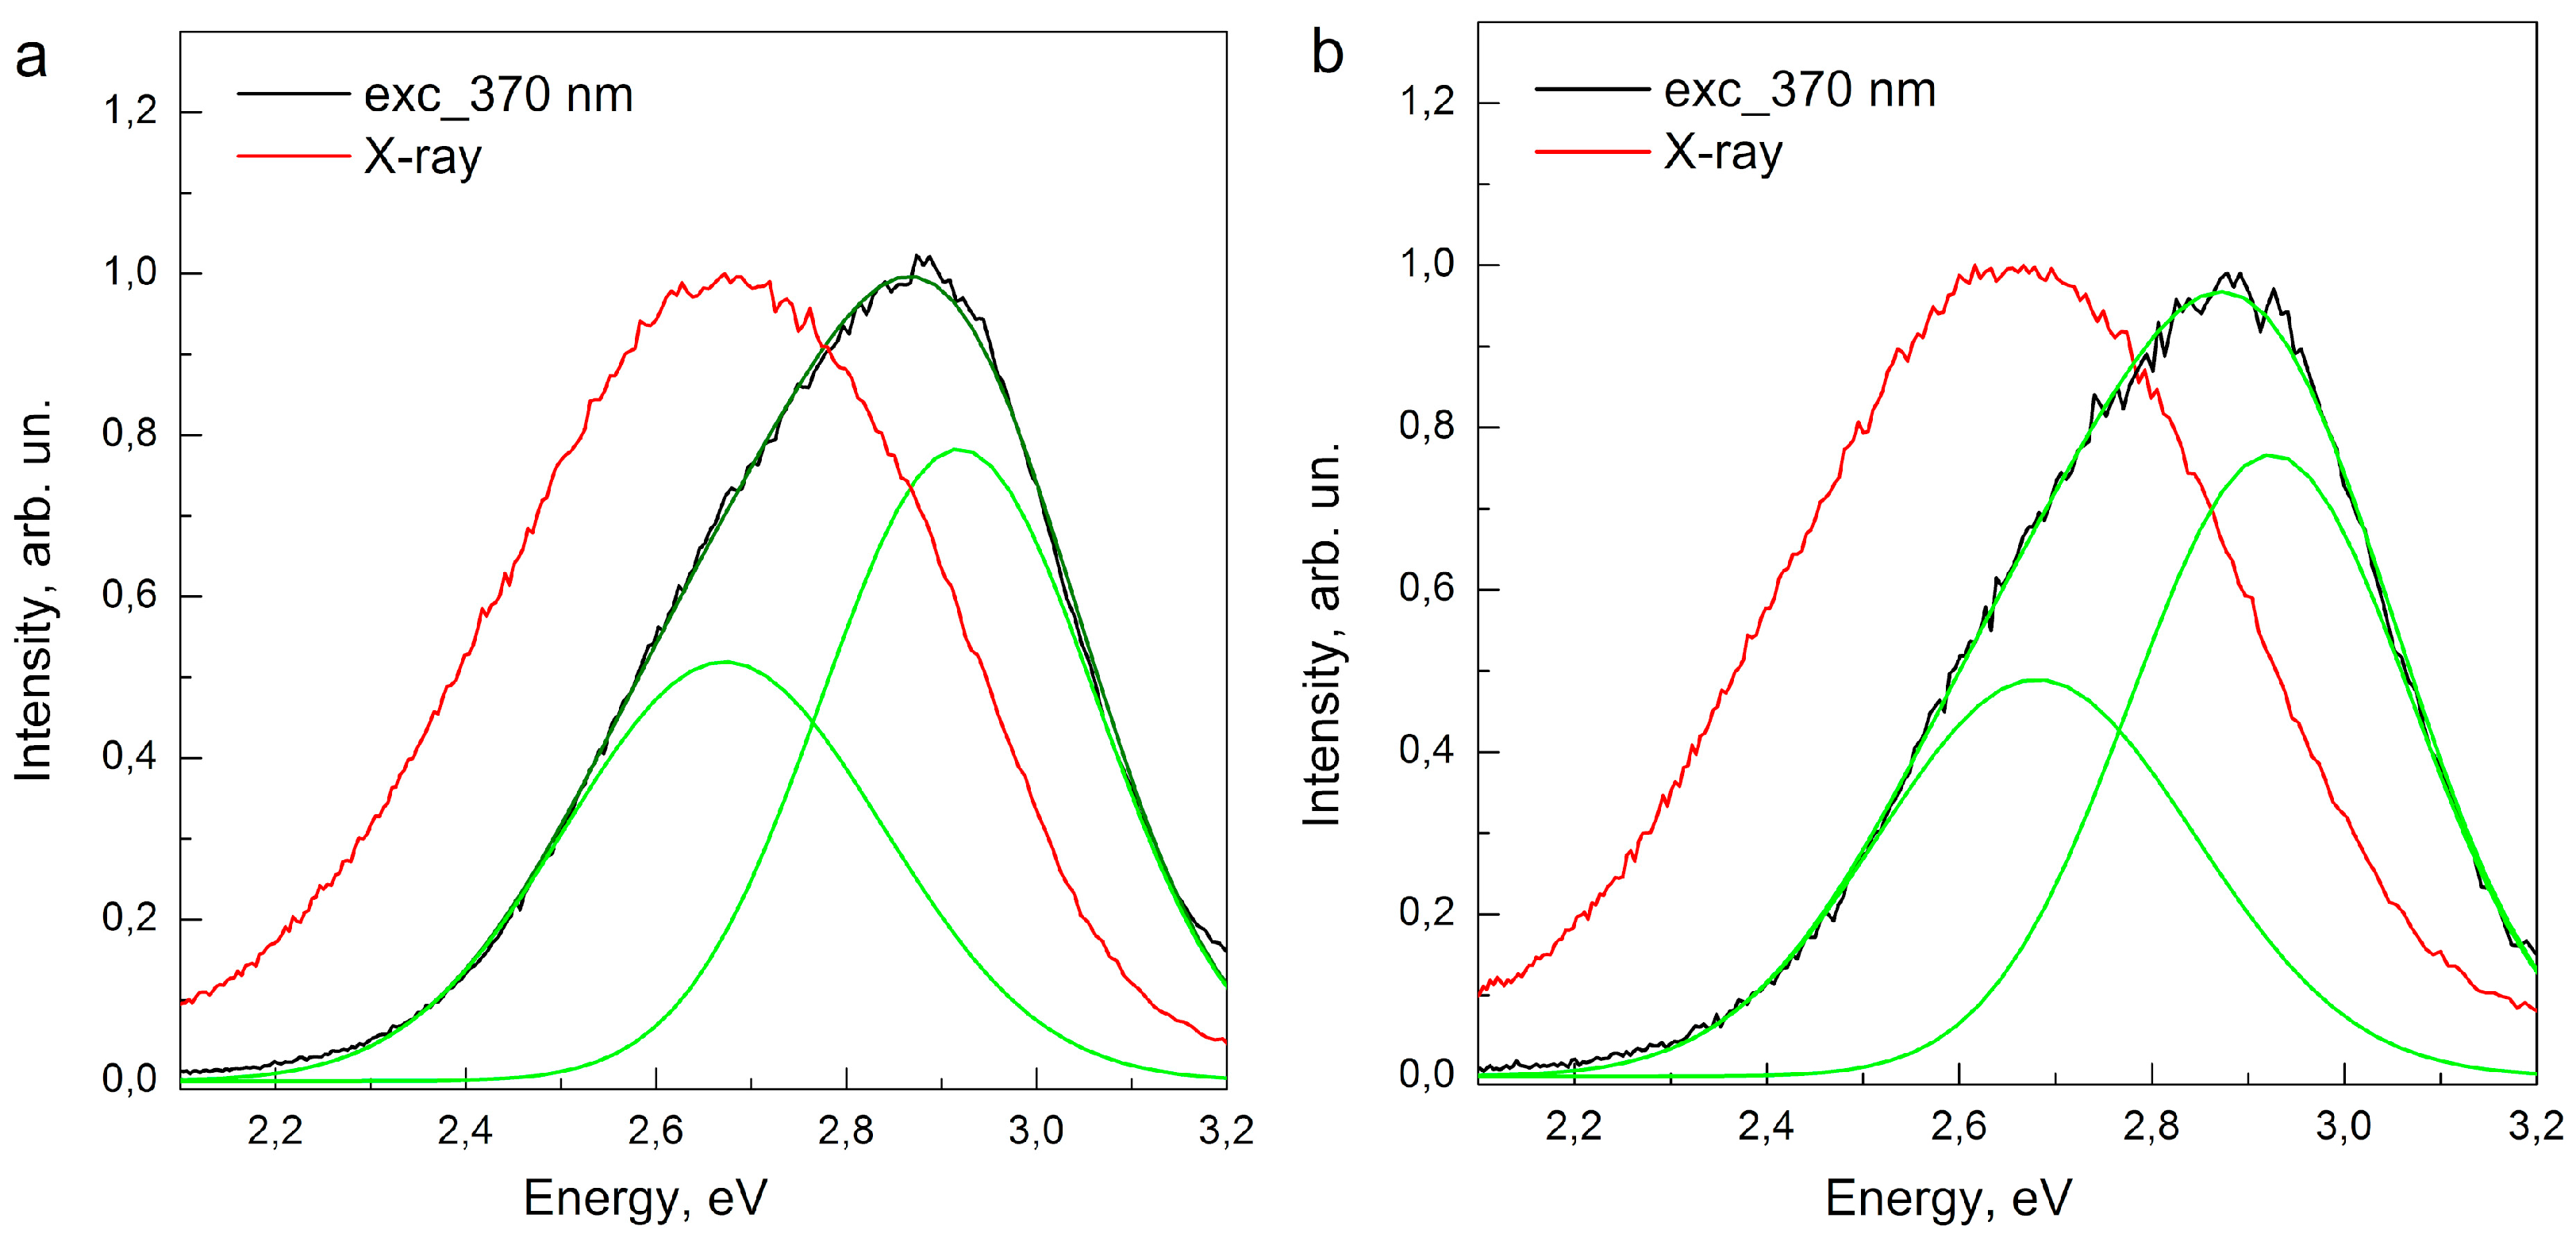
In
Figure 3a, photoluminescence and X-ray luminescence spectra of Lu
2SiO
5:Ce
3+ nanocrystals are shown. Maximum of X-ray luminescence spectrum (470 nm) is red-shifted as compared to maxima of photoluminescence spectra. Excitation spectra (
Figure 3b) taken at λ
reg = 400 nm consist of two intensive bands with maxima at 320 nm and 370 nm, and low-intensive band at 275–280 nm. At λ
reg = 500 nm, the excitation band at 320 nm is absent in the excitation spectra, and only 370 nm excitation band and low-intensive 275–280 nm can be observed. Photoluminescence spectra obtained at different excitation are shown in
Figure 3a. At λ
exc = 320 nm the single luminescence band is observed with maximum at 380 nm, while at λ
exc = 370 nm the spectra consist of the luminescence band with maximum at 430 nm.
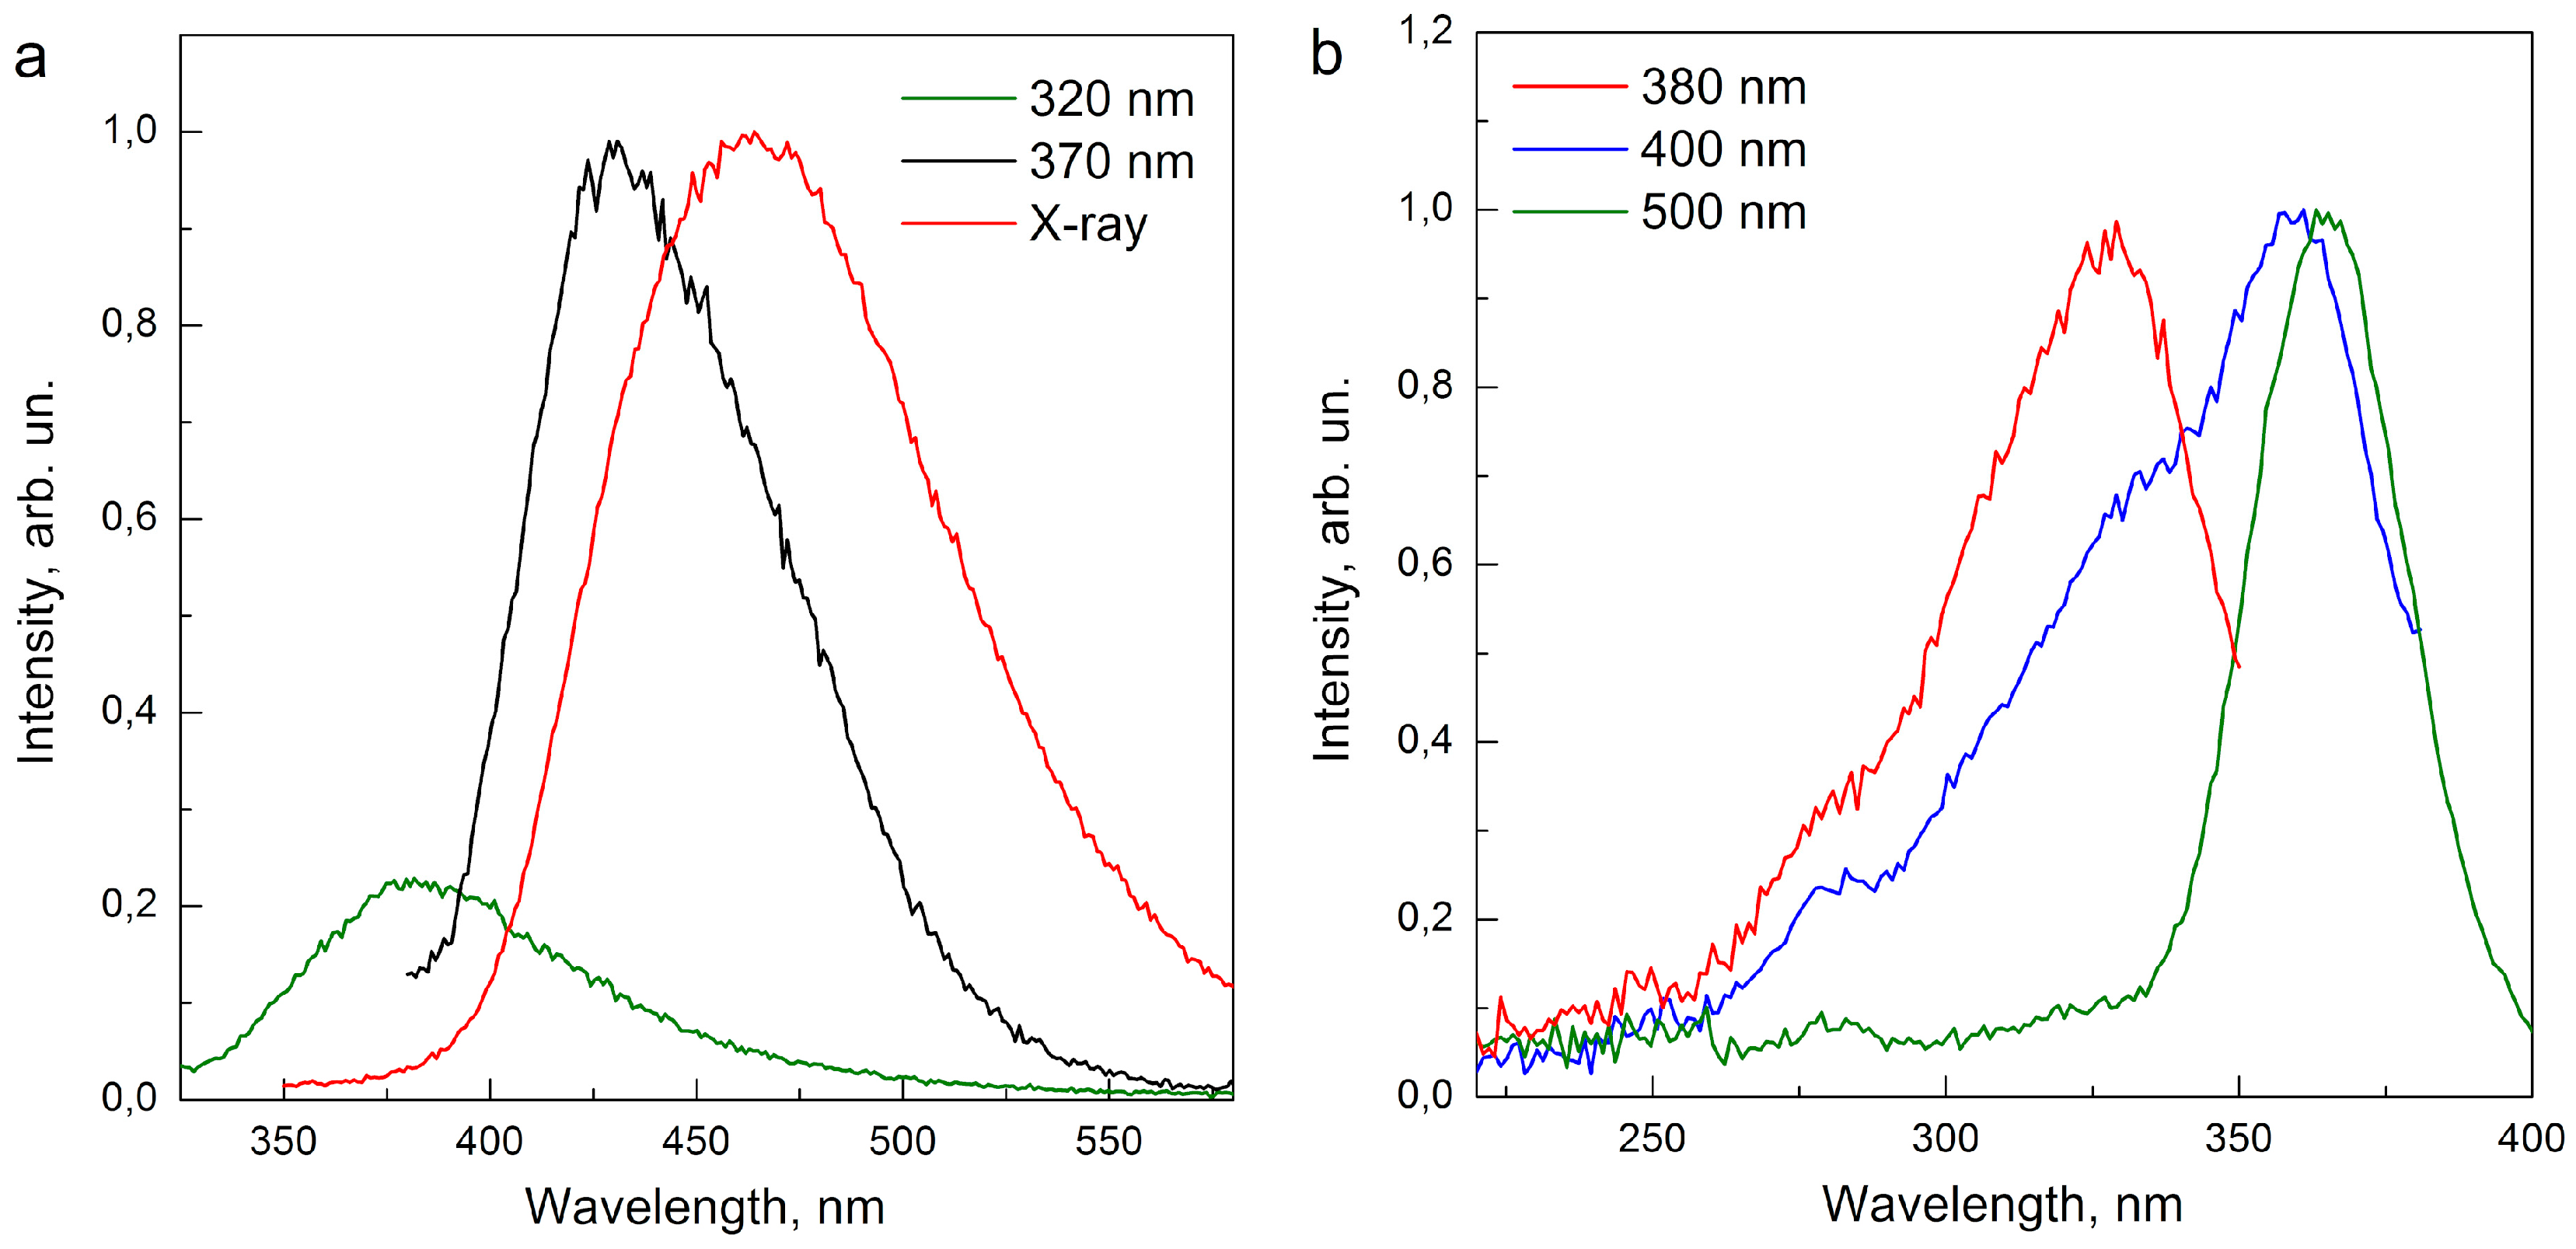
In
Figure 4a,b photoluminescence, excitation and X-ray luminescence spectra of Y
2SiO
5:Ce
3+ nanocrystals are shown. These spectra are similar to the spectra of Lu
2SiO
5:Ce
3+ nanocrystals.
As Lu
2SiO
5:Ce
3+ and Y
2SiO
5:Ce
3+ nanocrystals have Gd
2SiO
5-type structures, it seems reasonable to compare the obtained spectra with spectra of bulk Gd
2SiO
5:Ce
3+ crystals which were discussed in the number of papers before [
3,
16]. The luminescence band with maximum at 430 nm was previously reported for Gd
2SiO
5:Ce
3+ bulk crystals [
17], and in [
18,
19], the complex character of this band was shown. The luminescence band with maximum at 380 nm was not observed before neither in the spectra of Lu
2SiO
5:Ce
3+ (or Y
2SiO
5:Ce
3+) bulk crystals, nor in the spectra of Gd
2SiO
5:Ce
3+ bulk crystals, so it seems to be specific to nanocrystals, and may be related either to F-centers or surface-related defects.
Analysis of the luminescence band with maximum at 430 nm clearly confirms its complex nature (
Figure 5). This band can be decomposed into two bands with maxima at 430 nm (2.9 eV) and 470 nm (2.65 eV). The sub-band at 430 nm is about 1.5 times more intensive than that at 470 nm. Previously for Lu
2SiO
5:Ce
3+ bulk crystals, the tendency of Ce
3+ ions to substitute preferably larger (7-oxygen coordinated) lutetium sites was shown. In Gd
2SiO
5 structure the average distance between rare-earth cation and surrounding ligands is ~2.49 Å for 9-oxygen coordinated site and ~2.39 Å for 7-oxygen coordinated site, so Ce
3+ ions should substitute preferably 9-oxygen coordinated sites. Taking this fact into account, 430 nm band can be attributed to cerium ions at 9-oxygen coordinated sites (Ce1) and 470 nm band to cerium ions at 7-oxygen coordinated sites (Ce2). So, contrary to previous reports [
7,
13], which revealed only one optical center in Re
2SiO
5:Ce
3+ (Re = Lu, Y, Gd) nanocrystals, we clearly observed two different optical centers similar to the centers observed for Gd
2SiO
5:Ce
3+ bulk crystals. Most remarkably, the maximum of X-ray luminescence spectra coincides with the maximum of Ce2 luminescence. This fact does not correspond with situation in Gd
2SiO
5:Ce
3+ bulk crystals where the maxima of UV-excited and high-energy excited luminescence coincide [
13]. Moreover, the redshift of radioluminescence maximum for Gd
2SiO
5:Ce
3+ nanocrystals, as compared to corresponding peak for Gd
2SiO
5:Ce
3+ bulk crystals, was mentioned previously by [
13], but the authors of that report were unable to give any explanation for this unexpected result. Coincidence of the maximum of X-ray luminescence spectra with the maximum of Ce2 photoluminescence makes it possible to argue that despite the fact that cerium ions preferentially occupy larger 9-oxygen coordinated positions, recombination of electron-hole pairs formed at high-energy excitation occurs almost exclusively at smaller 7-oxygen coordinated sites.
According to previously obtained results, the electron traps in Re
2SiO
5 structures are formed mostly by oxygen vacancies, while Ce
3+ ions play the role of hole traps [
20]. The formation of oxygen vacancies occurs mainly on the sites of non-silicon-bonded oxygen, which has sufficiently less binding energy compared to other oxygen ions, and therefore, can easily leave the lattice. The same should be hold for Lu
2SiO
5, and for Gd
2SiO
5-type structures, as observed for Lu
2SiO
5:Ce
3+ and Y
2SiO
5:Ce
3+ nanocrystals. However, while for bulk Lu
2SiO
5 and Y
2SiO
5 the distance between cation site and non-silicon-bonded oxygen ions is almost the same for Re1 and Re2 sites (2.16 Å and 2.166 Å, respectively), for bulk Gd
2SiO
5 (and so, for Lu
2SiO
5 and Y
2SiO
5 nanocrystals), the surrounding of Re1 site includes only one non-silicon-bonded oxygen, and the surrounding of Re2 site includes three non-silicon-bonded oxygen ions [
21]. So, the oxygen vacancies in cerium-doped crystals and nanocrystals Gd
2SiO
5-type structure are located preferentially near Ce2 ions. The high content of oxygen vacancies in Lu
2SiO
5:Ce
3+ and Y
2SiO
5:Ce
3+ nanocrystals provided by oxygen-deficient conditions of sol-gel method used in this research and also by the decrease of vacancy formation energy in nanocrystals [
22,
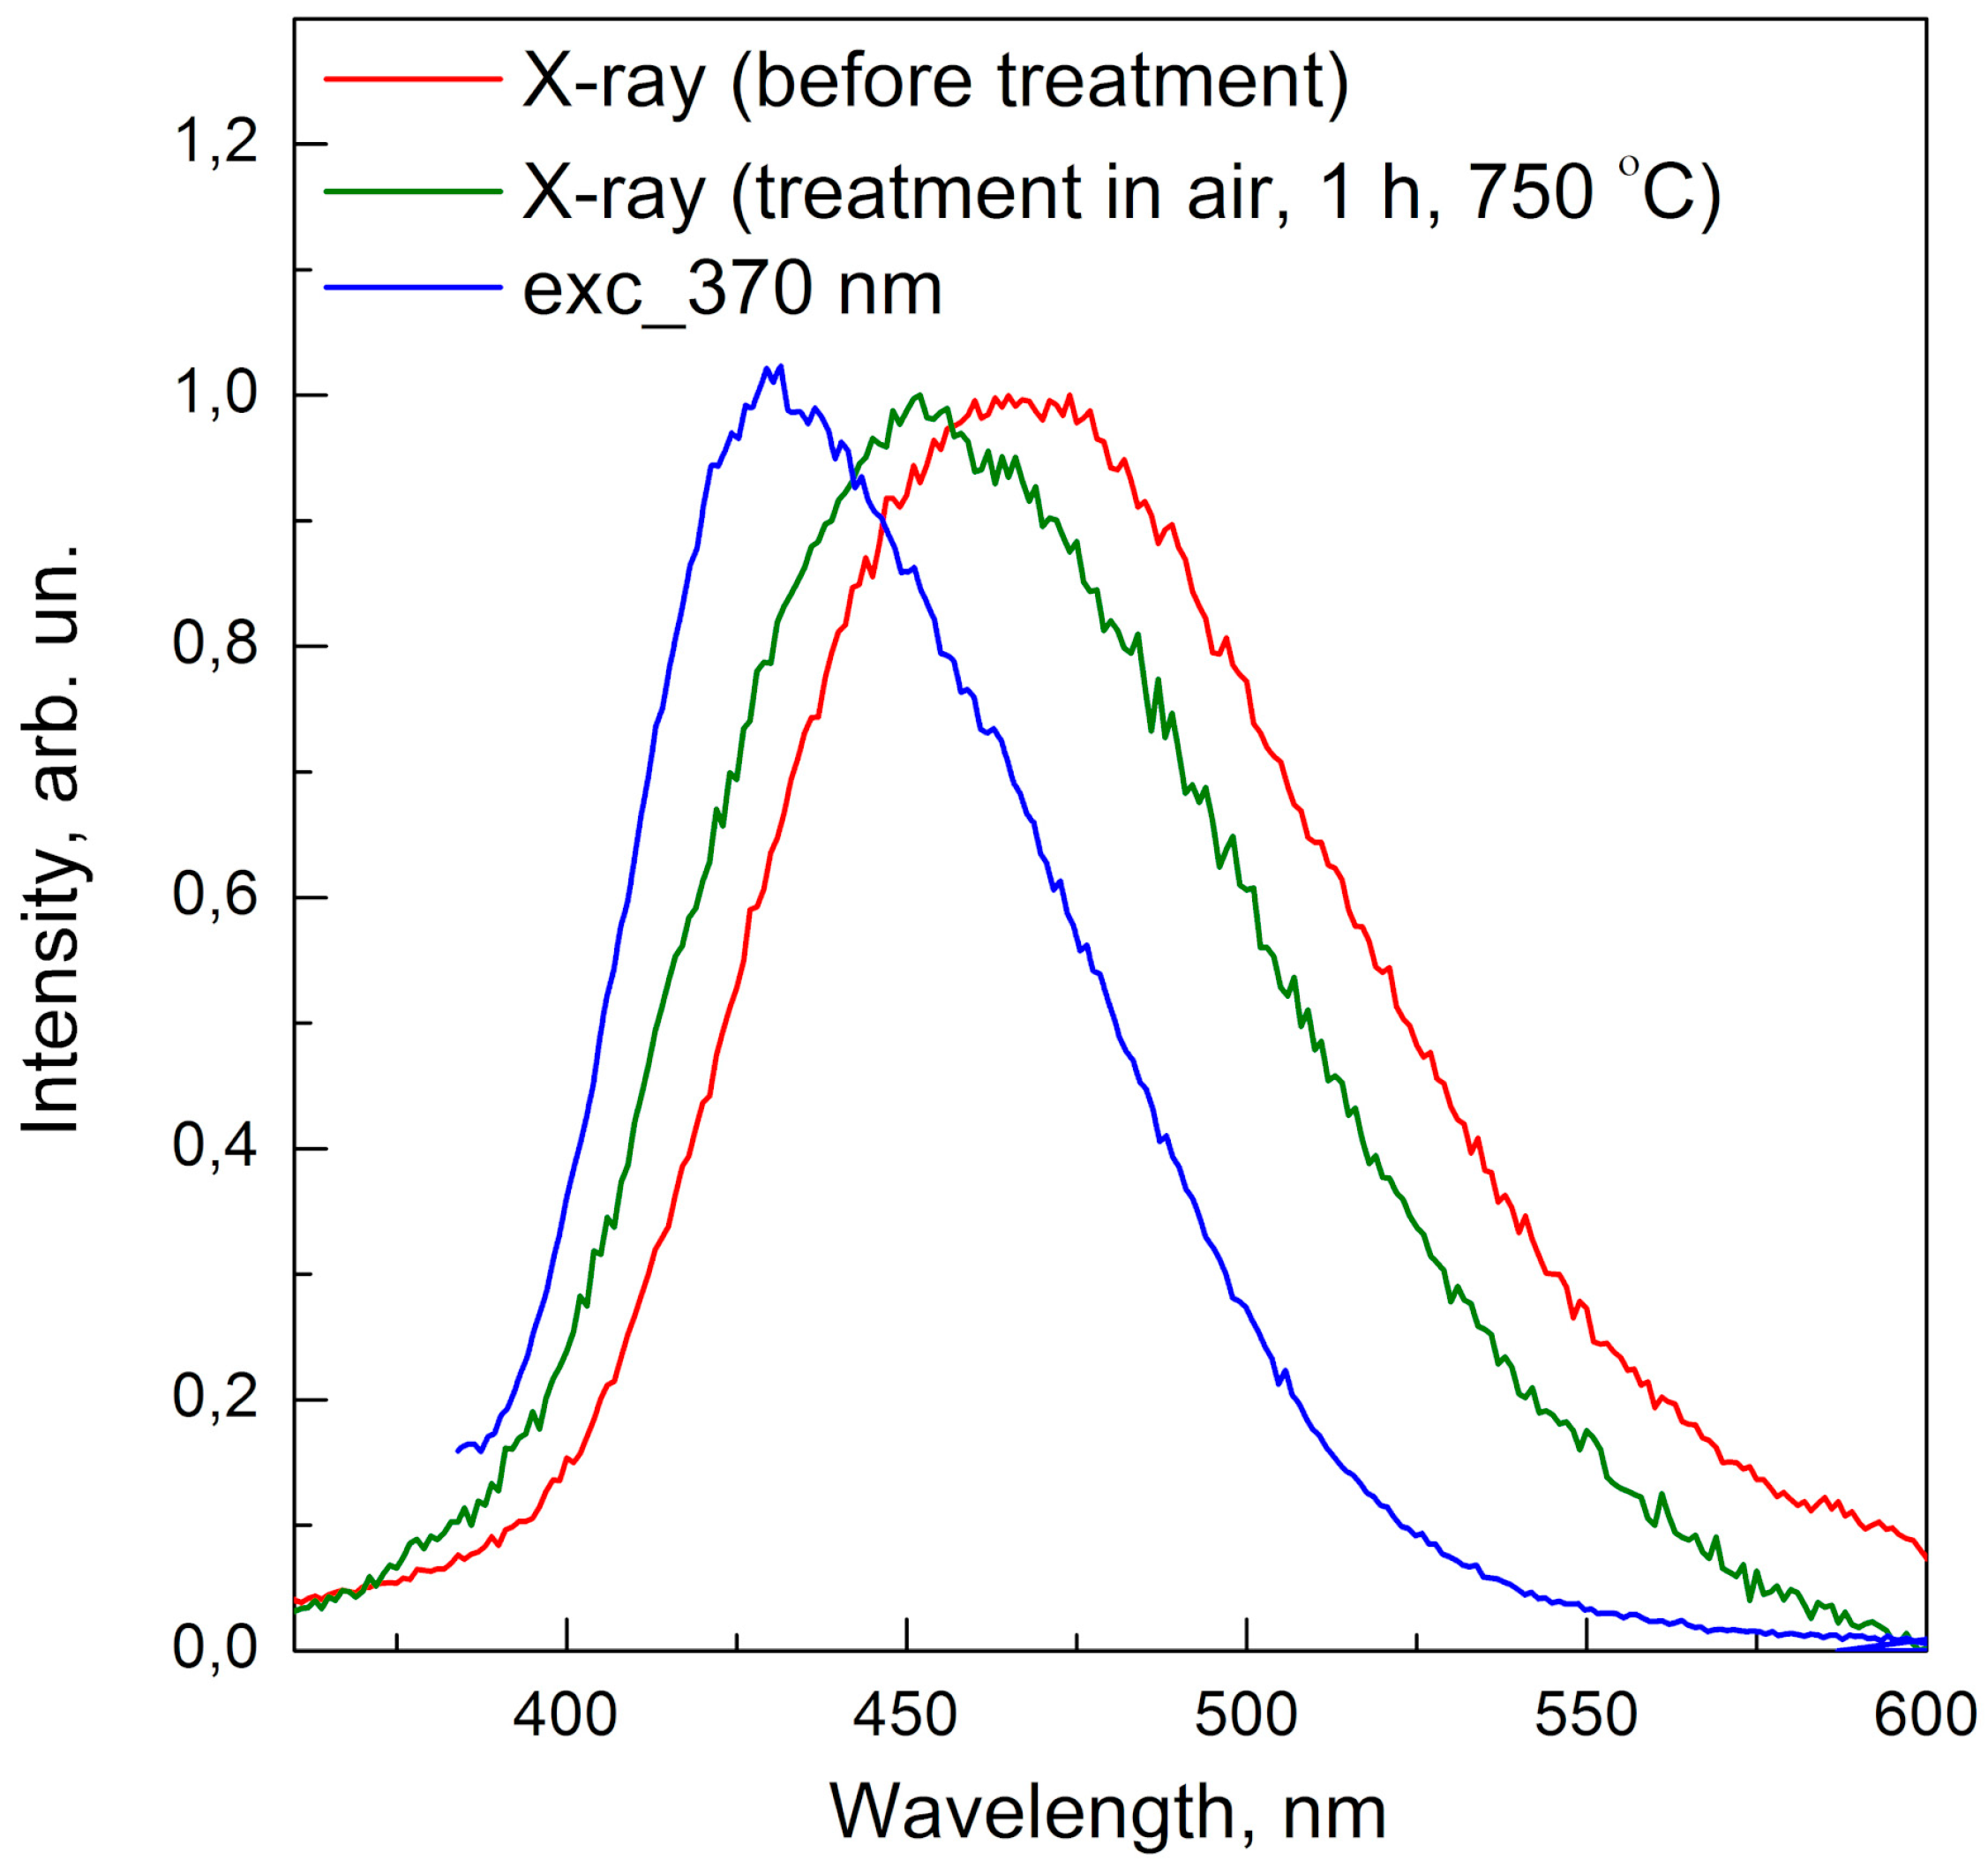
23] can lead to the main role of relative location of oxygen vacancies and cerium ions. Electrons formed at X-ray excitation can move far away from their point of origin, but finally they are trapped on the oxygen vacancies near Ce2 centers and recombine with holes trapped on the same Ce2 centers. The supposition about the role of preferential location of oxygen vacancies close to Ce2 centers in the dynamics of relaxation of high-energy excitation is supported by the change of X-ray luminescence spectra after additional high-temperature treatment of Re
2SiO
5 nanocrystals in air for 1 h at 750 °C (in
Figure 6 the results for Y
2SiO
5:Ce
3+ nanocrystals are shown). The shift of the maximum after treatment in air corresponds to an increase of the relative impact of Ce1 centers and a decrease of the impact of Ce2 centers. As the initial synthesis did not include the stage of high-temperature treatment in air (only in argon atmosphere), additional treatment in air at 750 °C led to partial filling of oxygen vacancies by oxygen, so they could no longer take part in the processes of relaxation of high-energy excitation. So, while for samples with high content of oxygen vacancies (treated in argon), the electron-hole pairs should recombine preferentially on the Ce2 sites, for samples with lower content of oxygen vacancies (treated in air), the recombination on the Ce1 sites is probable as well. In this way, manipulation by the system of oxygen vacancies in oxyorthosilicate nanocrystals opens the way to changing the pathways of high-energy excitation recombination, and can be used for improving the scintillation properties of this material.


