3.1. Frequency-Modulated Textural and Phase Transitions
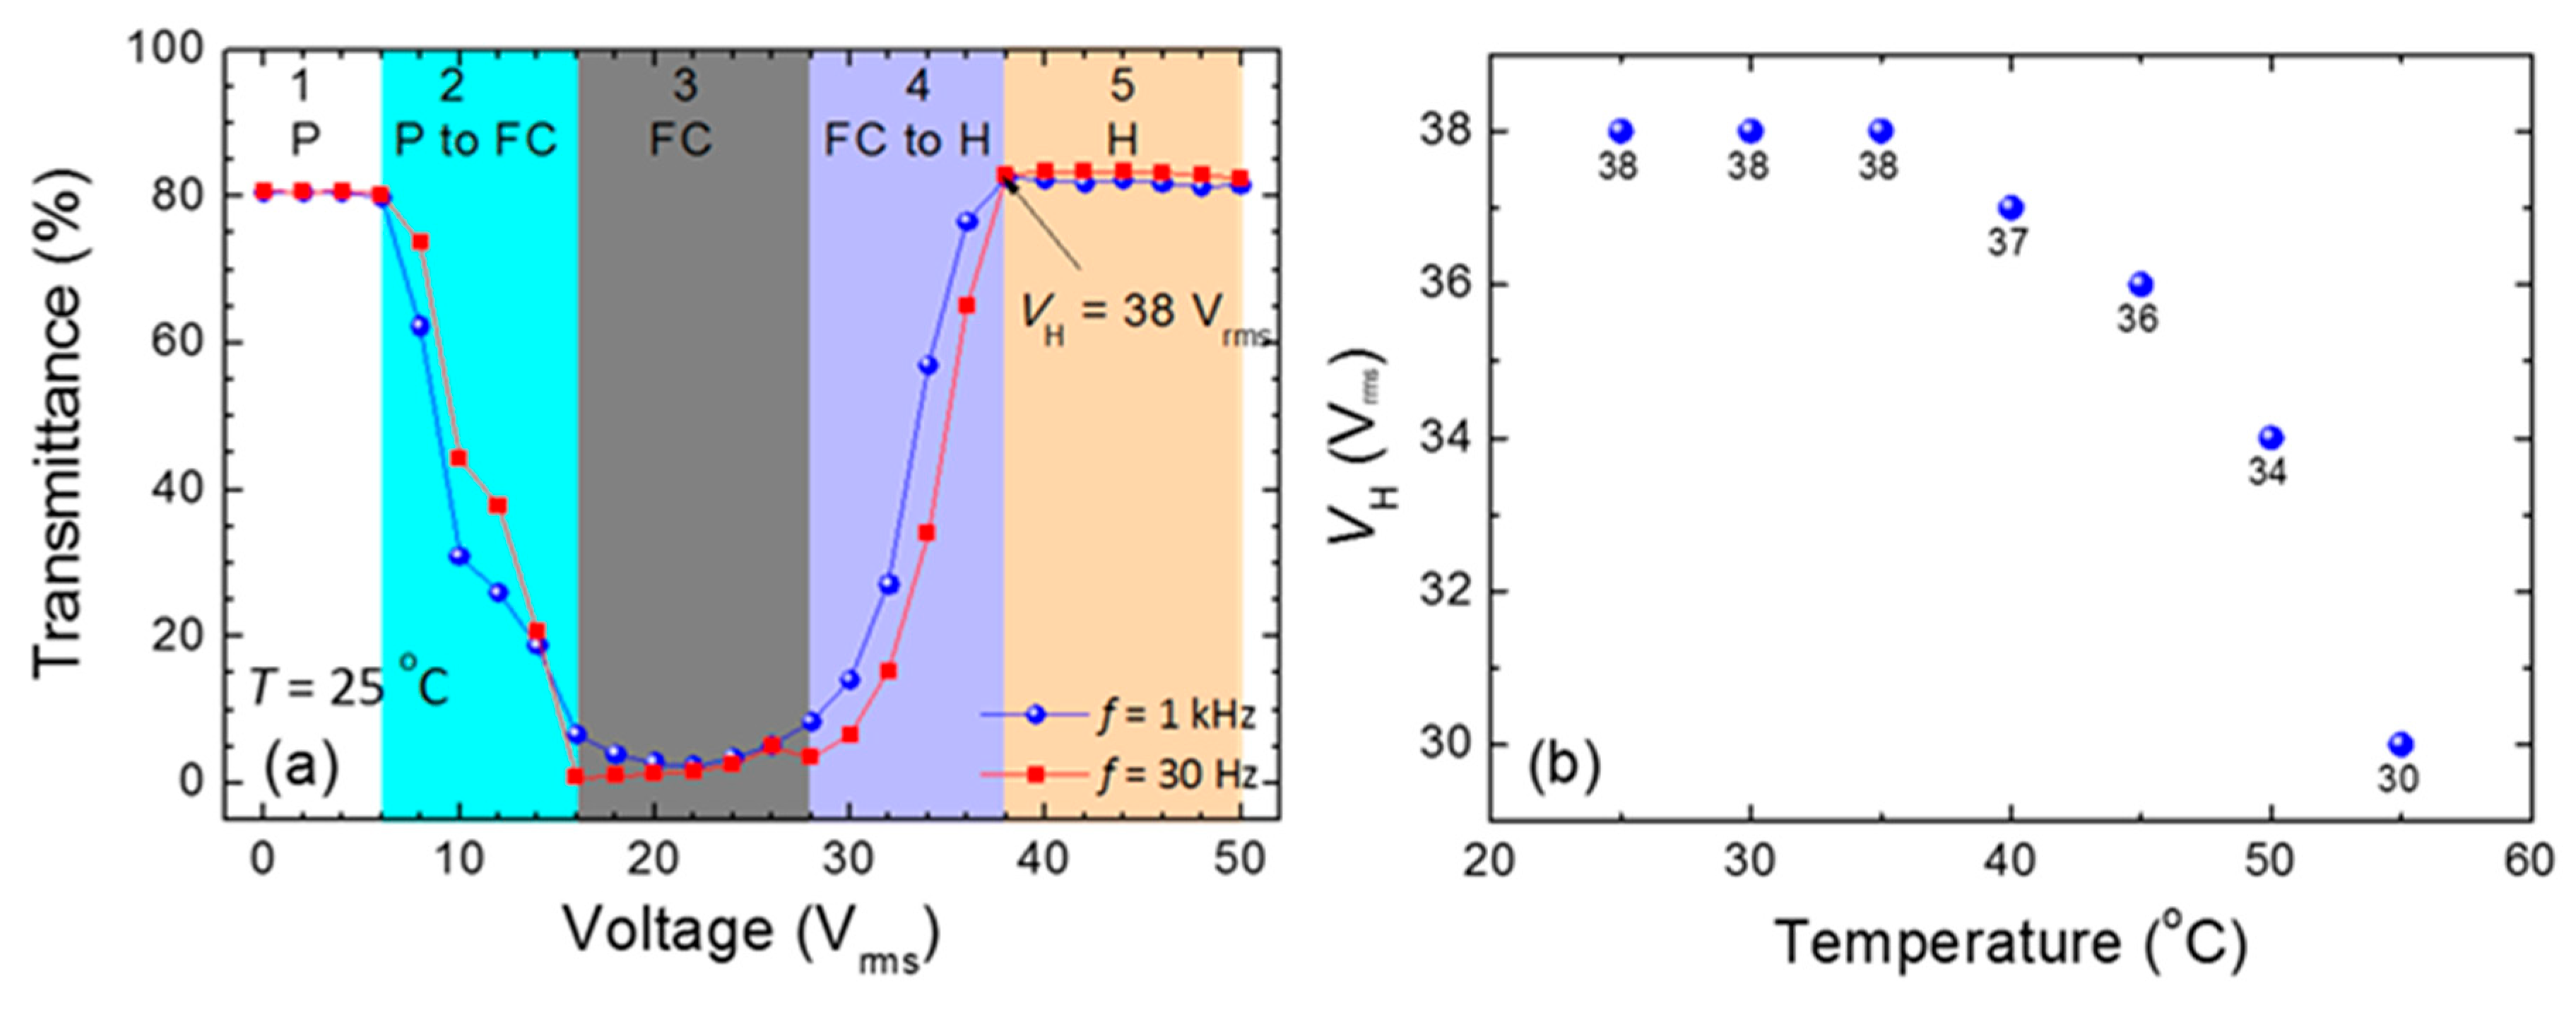
Figure 1a shows the voltage-dependent transmission (
V–
T%) curves of the CLC cell at a fixed temperature of
T = 25 °C as measured without any polarizer. Here, the temperature was precisely controlled by situating the cell in a temperature controller. In the case of the frequency at
f = 1 kHz, the resulting
V–
T% curve illustrates the change of CLC texture from the initial P state to the FC state and finally to the homeotropic (H) state with increasing voltage. This follows the general case for the voltage-induced textural transition of a CLC cell with positive dielectric anisotropy according to the dielectric coupling between LC molecules and electric fields. Accordingly, the
V–
T% curves at given frequencies in
Figure 1a can be divided into five voltage regions, separated by colors, corresponding to specific CLC states and textural transitions. Because the wavelength of the light source (i.e., He–Ne laser) at 632.8 nm is outside the (Bragg) reflection bandgap of the CLC, the transmittance (~80%) of the cell in P state (~80% in region 1,
V < 6 V
rms) is comparable to that of the voltage-sustained H state (~82% in region 5,
V > 38 V
rms). The voltage range (region 3, 6 V
rms <
V < 38 V
rms) resulting in a much-lowered transmittance (
T% < 8%) corresponds to the cell’s FC state that effectively scatters visible light (at the wavelength of 632.8 nm) due to its randomly oriented and broken helices in the bulk. The voltage region 2 (4), showing decreased (increased) transmittance from 80% (5%) to 5% (82%) with ascending voltage between 6 V
rms (28 V
rms) and 28 V
rms (38 V
rms), is thus attributable to the P-to-FC (FC-to-H) textural transition. Besides, in a special case where the frequency of the applied voltage is low enough to bring about electrohydrodynamic instability (EHDI), the ULH state can be obtained in a given voltage region. This phenomenon has been evidenced in some of the early works [
17,
18,
30]. However, when the frequency varies from 1 kHz to 30 Hz in this study, the
V–
T% curve remains nearly unchanged as shown in
Figure 1a. This implies that the ionic effect in our used CLC cell is weak and the frequency of the voltage at 30 Hz is still insufficient to onset the EHDI; thus, the optical signal corresponding to the ULH state is absent in
Figure 1a.
The voltage
VH required for unwinding the CLC helix as well as sustaining the cell in the H state can be expressed as
where
P stands for the helical pitch length and ε
0 (= 8.854 × 10
−12 F⋅m
−1) represents the permittivity in a vacuum. One can see from
Figure 1b that the magnitude of
VH decreases from 38 V
rms to 30 V
rms as the temperature increases from 25 °C to 55 °C. In most of thermotropic calamitic or rod-like LCs, the orientational order parameter (
S) decreases with increasing temperature. Since the twist elastic constant
K22 and the dielectric anisotropy Δ
ε are proportional to
S2 and
S, respectively, the change in
VH as a function of temperature is primarily attributable to the substantial variation in temperature-dependent
K22.
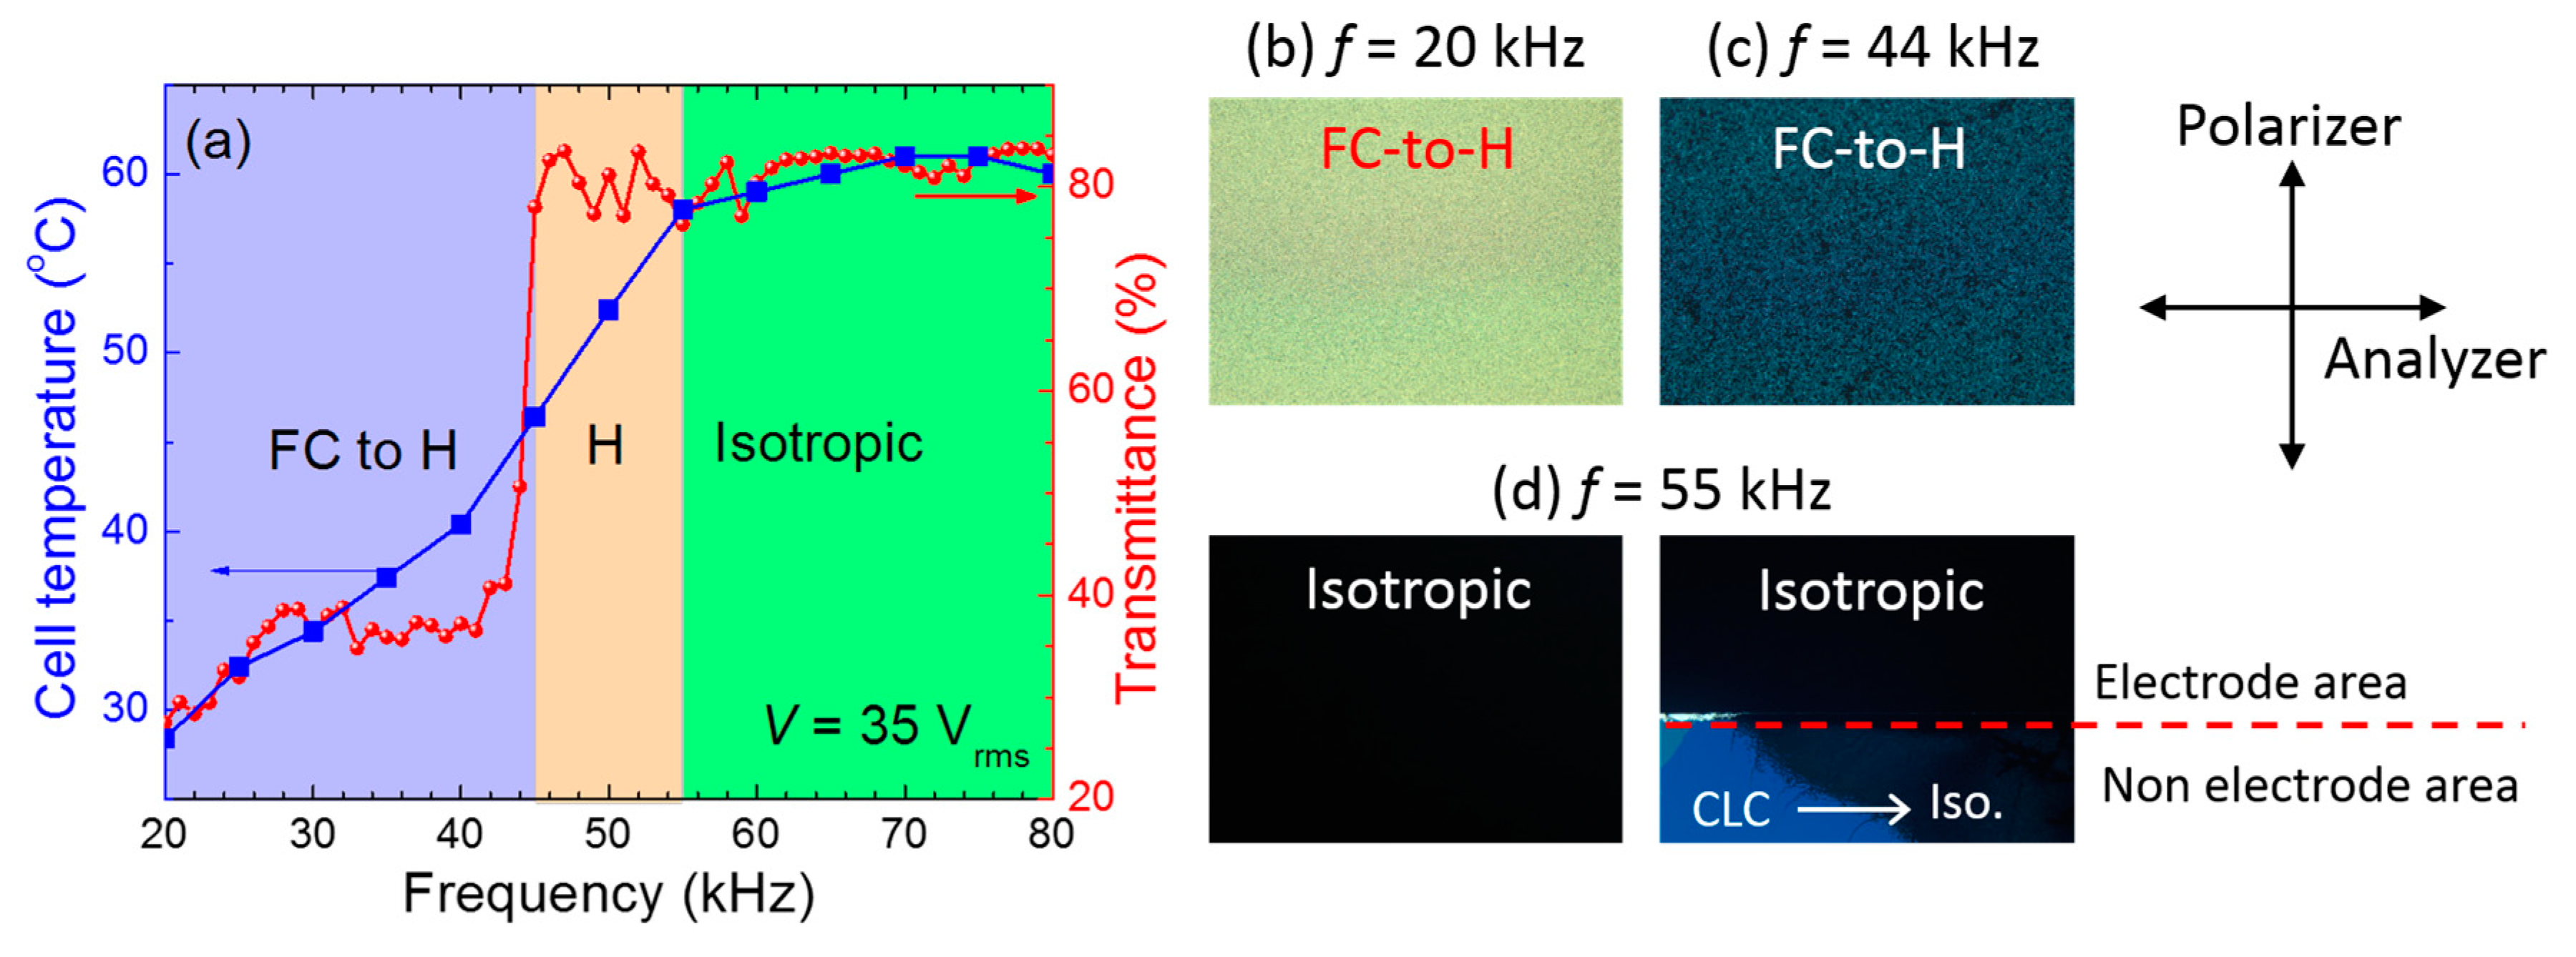
Furthermore,
Figure 2 depicts the applied (voltage) frequency dependence of the steady-state cell temperature and transmission (
Figure 2a) as well as optical textures of the CLC cell subjected to a 35-V
rms voltage at three distinct frequencies (
Figure 2b–d). Here the measurements were performed without using a temperature controller. The cell temperature in the field-off state was
ca. 24.4 °C, namely, the room temperature. Each cell-temperature data point was acquired by holding the given voltage applied to the cell for 10 min to ensure that the cell temperature reached the steady state and became time-independent. It was tested preliminarily that the onset frequency
fth for the induction of dielectric heating by the applied voltage at
V = 35 V
rms is approximately 10 kHz. As revealed in
Figure 2a, the temperature of the cell grows with ascending frequency but this trend becomes mitigated as the frequency is higher than 55 kHz. This is in good agreement with our previous work in which the temperature increase, arising from significant dielectric heating from the pseudo-dielectric relaxation, is a function of the applied frequency [
29,
31]. In the case of
f = 20 kHz, the temperature is elevated by 3.6 °C (i.e.,
T = 28,0 °C at
f = 20 kHz); thus, the texture (
Figure 2b) under applied voltage
V = 35 V
rms (lower than
VH = 38 V
rms at
T = 30.0 °C), corresponding to region 4 in
Figure 1a, is preserved in an intermediate state between FC and H state with low transmission of ~27.5%. As the frequency is promoted from 20 kHz to 45 kHz, the temperature increases monotonically from 28.0 °C to 46.4 °C. In the meantime, the driving voltage (i.e.,
V = 35 V
rms) approaches
VH = 36 V
rms at
T = 45 °C. In consequence, the sharp increase in transmittance to ~78% with increasing frequency in the neighborhood of 45 kHz, as shown in
Figure 2a, is undoubtedly contributed by the process of the FC-to-H phase transition (
Figure 2c). Once the frequency goes beyond 55 kHz such that the temperature showing
T = 58.0 °C becomes higher than the clearing temperature (
Tc = 57.0 °C), the phase transition from the CLC phase to the isotropic phase will be induced. Although the optical textures under crossed polarizers and transmittances without a polarizer in both the isotropic phase and the H state are comparable or virtually identical, the voltage-induced isotropic phase can be confirmed by comparing the optical textures between the electrode and non-electrode areas. As evidenced in
Figure 2d, the texture of the cell in the non-electrode regions around the electrode area gradually changes from the CLC to the isotropic phase owing to the diffusion of heat generated from the electrode. This observation suggests that the textural and phase transitions in the CLC cell can alternatively be induced by modulating the frequency of the applied voltage to control the cell temperature via dielectric heating [
29]. From the results above, one can form a well-aligned and switchable ULH texture by treating a CLC cell with a specific AC voltage.
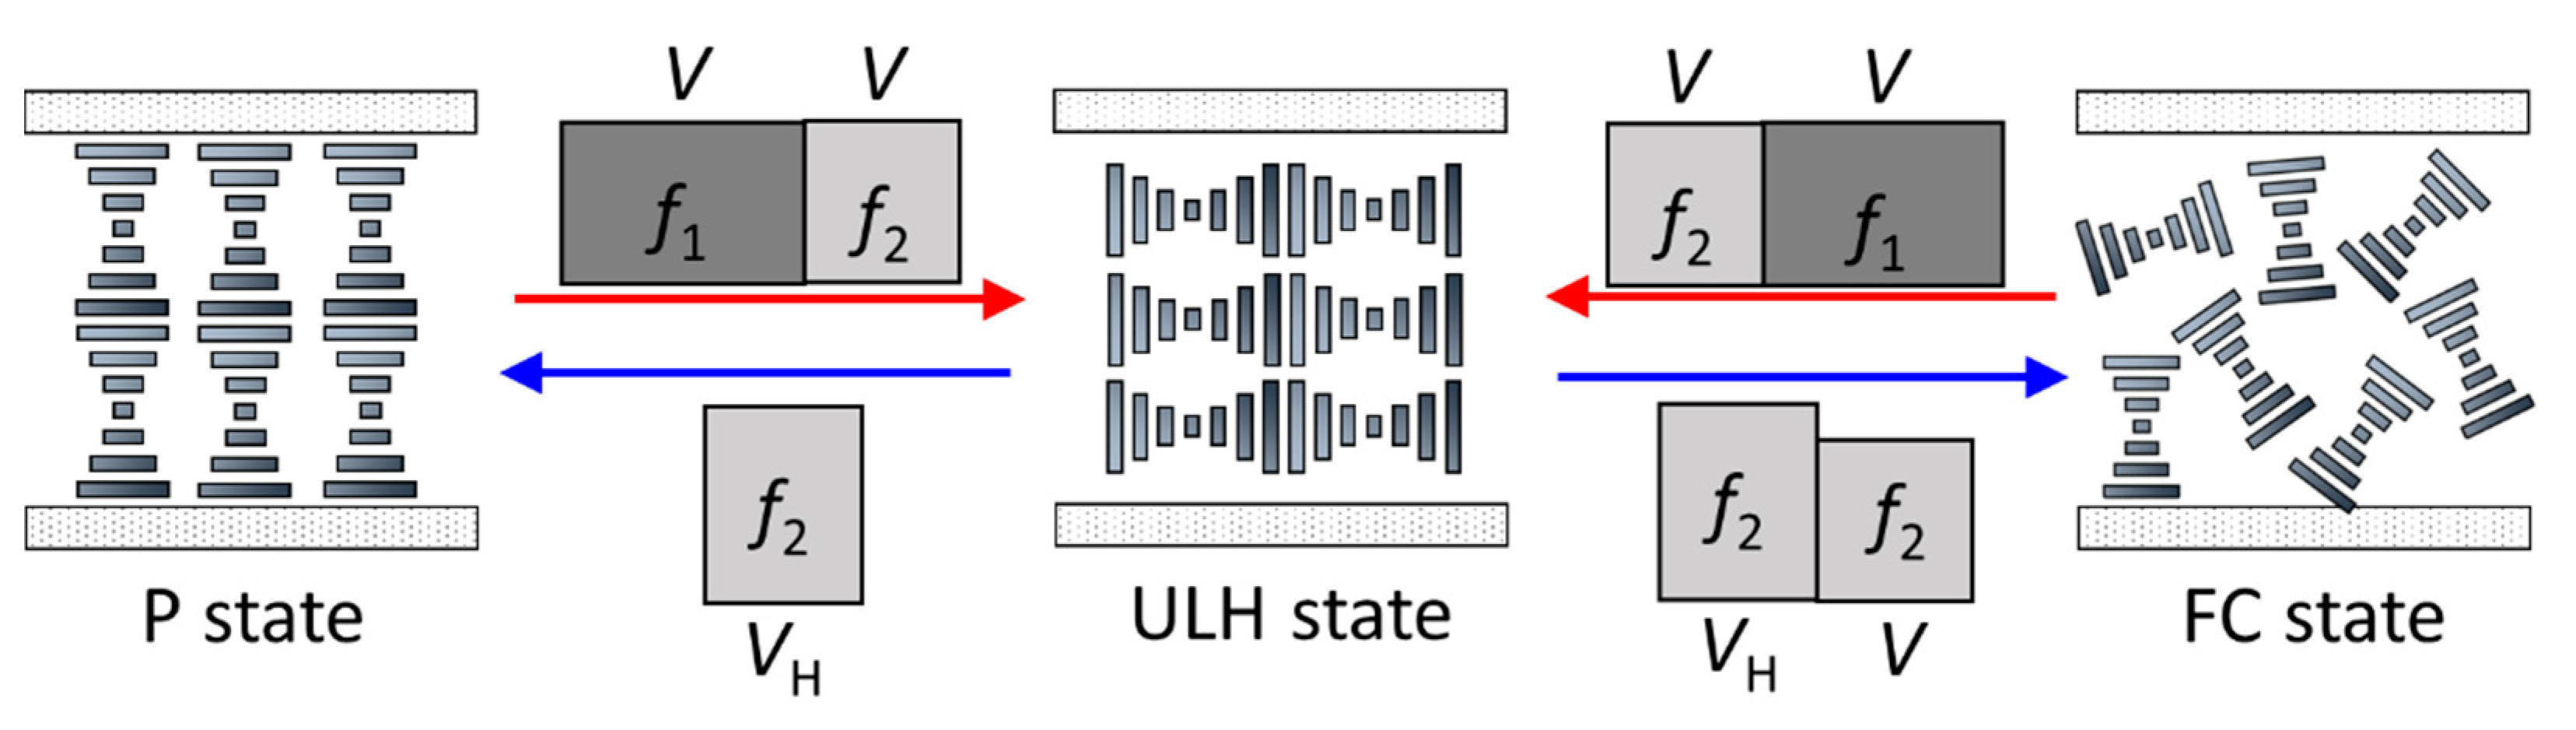
Figure 3 delineates the idea of the proposed electric-field approach to the formation of well-aligned ULH and the scheme for the textural switching. Here, an applied voltage signal, consisting of two pulse components with one at
f1 followed instantly by the other at a lowered frequency
f2, is designed for carrying out the switching of the cell from either the P or FC state to the ULH state. The magnitudes of
f1 and
f2 designated satisfy the conditions of
f1 >
fth and
f2 <
fth, where
fth is the onset frequency for the induction of the dielectric heating in the cell. Such a pulse functions like a heat generator at
f1, enabling the temperature increase of the cell to a given value; it also serves as an agitator at
f2 to provoke phase and textural transitions. As such, there are two ways, alternative to ideas reported in [
12,
17], to form the ULH alignment by optimizing voltage conditions of the hybrid pulse. Referring to
Figure 2a, the first way is to first sustain the cell in the isotropic phase (at an arbitrary temperature beyond the clearing point) by setting the amplitude and frequency of the leading portion of the pulse to be
V = 35 V
rms and
f1 = 55 kHz. When the pulse frequency is switched from
f1 to
f2 whereas the voltage magnitude remains unchanged, the dielectric heating behavior disappears, and the ULH results at
f2 during the isotropic-to-CLC phase transition. In comparison with the method reported in [
12], using the designated hybrid pulse to form ULH structure would be more feasible because an additional heating stage is not required to monitor the temperature variation for the phase transition. Our method further permits the ULH to be electrically switchable by following the general scheme for switching CLC textures. As illustrated in
Figure 3, the obtained ULH can be readily switched back to the P state by triggering the cell with a single pulse of
V =
VH at
f =
f2, and to the FC state by a hybrid pulse at
f2 with amplitudes of
VH for the leading component and
V <
VH for the succeeding component. The second way is to generate ULH via EHDI by elevating the temperature to promote the ionic effect rather than requiring the LC material to be ion-rich [
17,
18]. In this case, the cell is held in the H state at a temperature close to
Tc by the first portion of the pulse at
V = 30 V
rms and
f1 = 55 kHz. It has been demonstrated that the ionic effect in an LC cell is enhanced at a higher temperature thanks to the reduction in molecular ordering and increase in the activation energy of mobile ions [
32]. Therefore, it is expected to obtain ULH by optimizing
f2 to meet the frequency responsible for inducing the EHDI.
3.2. Formation of ULH Alignment after the Treatment of a Designated Hybrid Pulse
Following the switching scheme illustrated in
Figure 3,
Figure 4 shows the processes of the generation of ULH alignment in the CLC cell driven by a hybrid voltage. The total duration of the applied pulse is 810 s. In the case of the ULH formation through the isotropic-to-CLC phase transition,
V = 35 V
rms and
f1 = 55 kHz are fixed. As shown in
Figure 4a, the cell is brought to the isotropic phase by the pulse at
f1 for 600 s. Once the pulse is switched from
f1 to
f2 = 30 Hz or 1 kHz, the isotropic-to-CLC phase transition occurs within 30 s. Meanwhile, the ULH starts to appear and is completely formed throughout the cell at time
t = 810 s. The optic axis of this ULH alignment is deviated by an angle of ~45° from the rubbing direction because of the use of a 90°-twisted planar-aligned cell [
13,
19]. As a result, by rotating the optic axis of ULH parallel to the transmission axis of either of crossed polarizers, excellent dark appearance can be secured, indicating the uniform ULH alignment. Note that the ULH generated is a metastable state which can be retained for several hours at room temperature after voltage removal. The stability of the ULH can further be promoted by optimizing the cell-gap-to-pitch ratio [
17] or by performing polymer stabilization in addition. When
V is reduced from 35 V
rms to 30 V
rms, the temperature of the cell driven by the pulse at
f1 for 600 s, as determined by a thermograph camera, is about 55.2 °C, which is lower than
Tc = 57.0 °C. The dark state of the cell under crossed polarizers thus corresponds to the H state. Because
V = 30 V
rms is very close to
VH = 30 V
rms at
T = 55 °C (
Figure 1b), the textural transition is induced quickly after switching the pulse frequency to
f2 = 30 Hz for 10 s (i.e.,
t = 610 s in
Figure 4b), allowing the ULH to be obtained within the next 20 s. However, if
f2 is changed from 30 Hz to 1 kHz, the FC state instead of the ULH state is generated (
Figure 4b). This implies that the ULH formed by the 30 Hz voltage pulse might be a result of the electrohydrodynamic effect (to be discussed later).
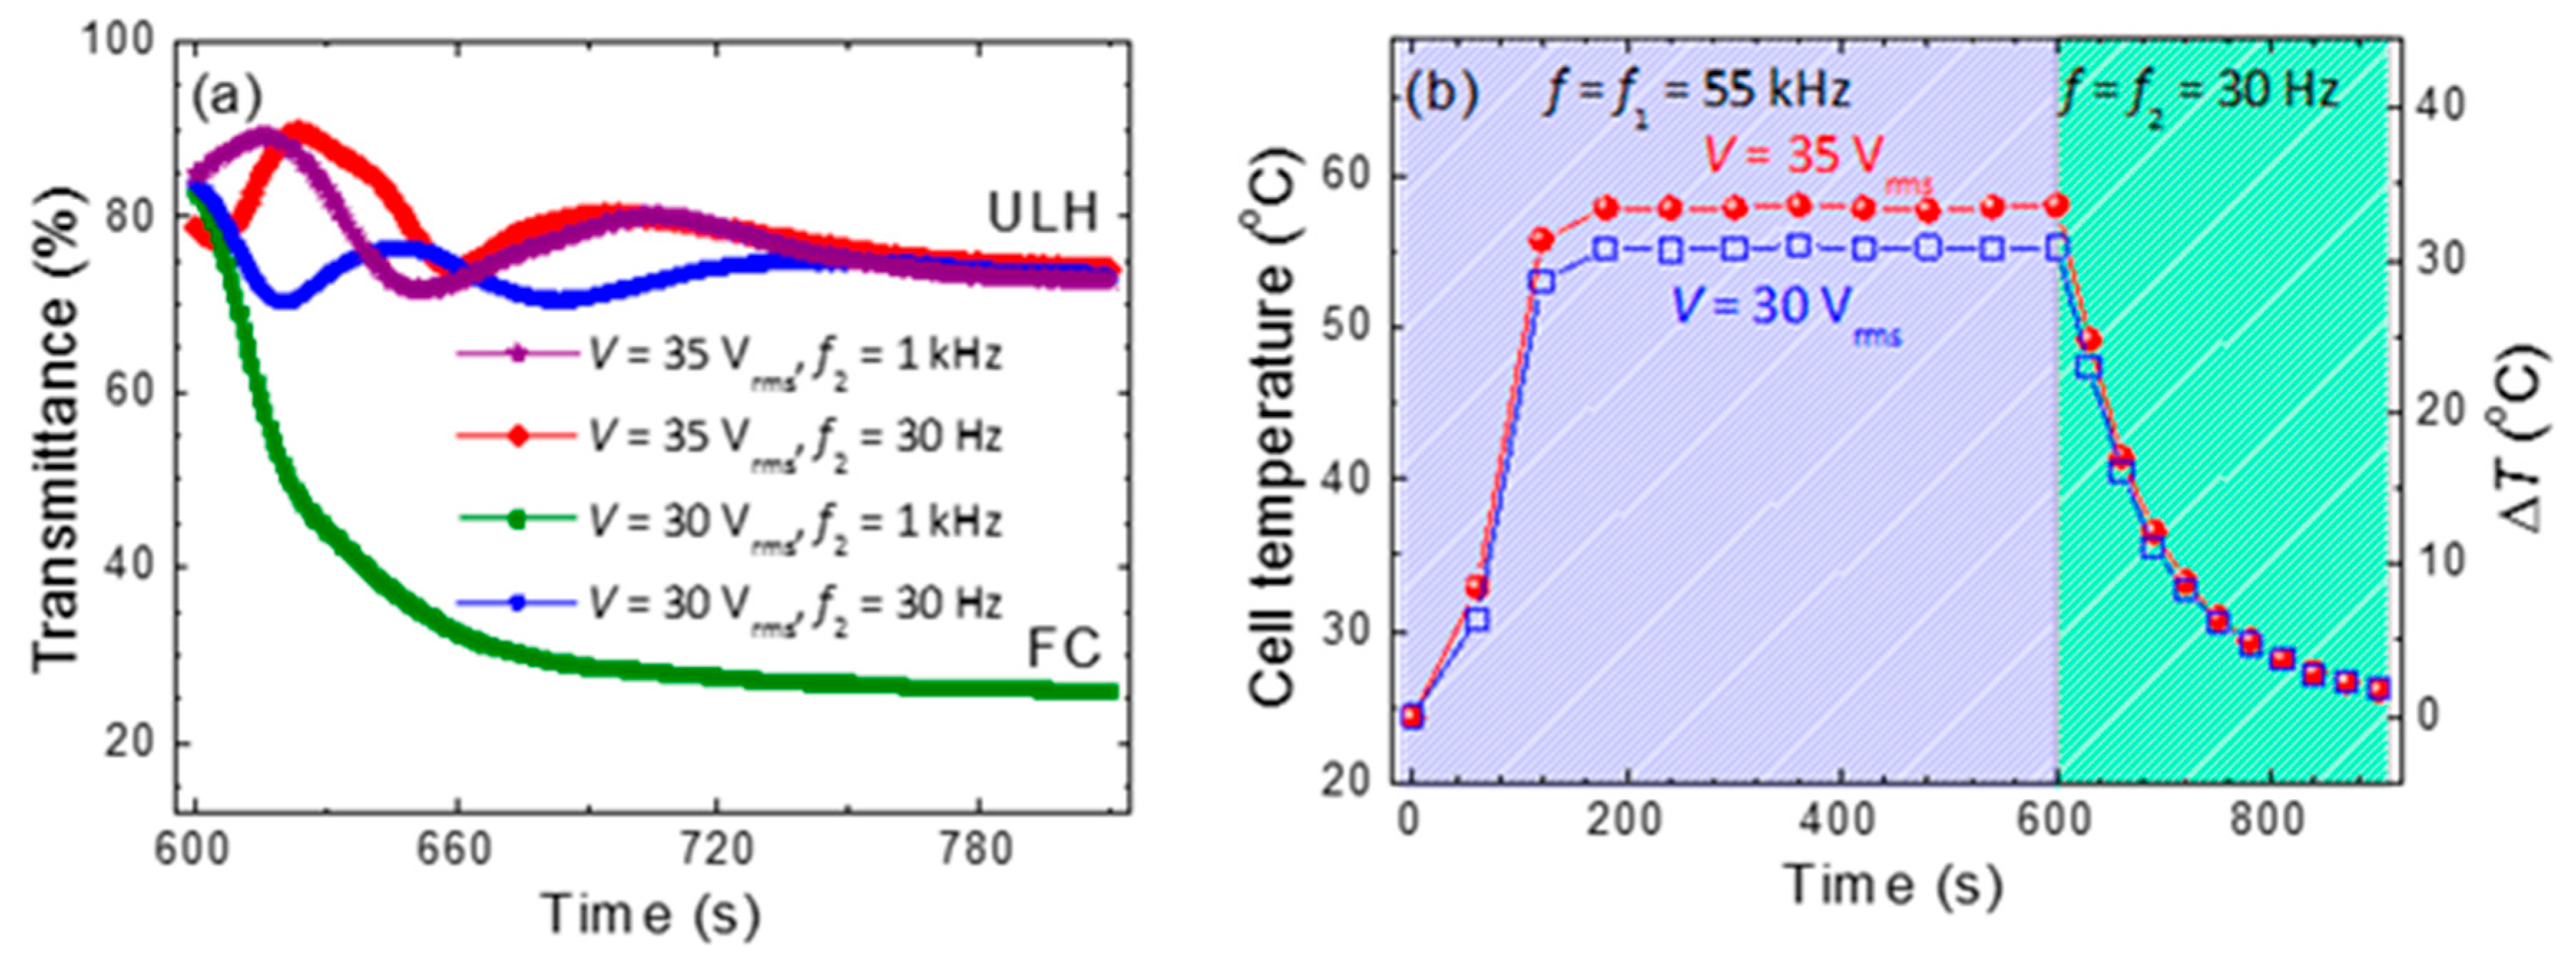
The results mentioned above are further substantiated by measuring the time-dependent transmission curves of the CLC cell within the time of the voltage pulse at
f2. As shown in
Figure 5a, except for the case where the cell exhibits relatively low transmittance (~26%) due to the formation of FC state by
V = 30 V
rms at
f2 = 1 kHz, the transmittances of the other three textures with ULH alignment in the entire measured time are higher than 70%, which are only about 10% lower than that of the H state. The wavy variation in specific temporal regions in these three curves might be attributable to the phase or the textural transition and to the variation in refractive indices with temperature over time.
Figure 5b displays the time-dependent temperature and temperature increment of the cell subjected to 30- and 35-V
rms hybrid pulses. Driving the cell at
f1 = 55 kHz causes the cell temperature to increase, reaching saturation at
T = 58.0 °C for
V = 35
Vrms and
T = 55.2 °C for
V = 30 V
rms at
t ~ 200 s; thus, holding the cell in the isotropic phase and the H state in the CLC phase, respectively. At the time when the pulse is changed from 55 kHz to
f2 = 30 Hz, the temperature drops with ascending time and returns to the initial value (i.e.,
T = 24.4 °C) within 300 s (
t ~ 900 s). The result revealed in
Figure 5b also indicates that the isotropic-to-CLC phase transition at
V = 35 V
rms and the H-to-CLC textural transition can be induced within 30 s after the frequency is switched from
f1 to
f2.
Based on the results mentioned above, it should be emphasized here that the ambient temperature would not be an issue affecting the generation of ULH alignment by the hybrid voltage pulse. It has been proven that the strength of temperature elevation by dielectric heating can be predominated by voltage conditions [
29], as shown in
Figure 2a for example. Therefore, no matter how the ambient temperature is, the cell temperature can be increased to an appropriate value (e.g., a temperature higher than and near the clearing point
Tc of the CLC material for inducing ULH alignment via phase and textural transitions, respectively) by optimizing the frequency and the amplitude of the leading component of the hybrid voltage pulse (i.e., the pulse at
f1). Moreover, according to the results of
Figure 4 and
Figure 5, when the frequency of the voltage pulse is switched from
f1 to
f2, the ULH alignment will be formed within the temperature range near but below
Tc, which is independent of the ambient temperature. The total elapsed time to form ULH alignment by the proposed method can be cut down at the expense of increasing the magnitude
V at
f1 (to shorten the heating time). However, such a waveform design in the operation pulse may be considered complicated in that
V at
f2 needs to be low enough to permit the induction of phase or textural transition.
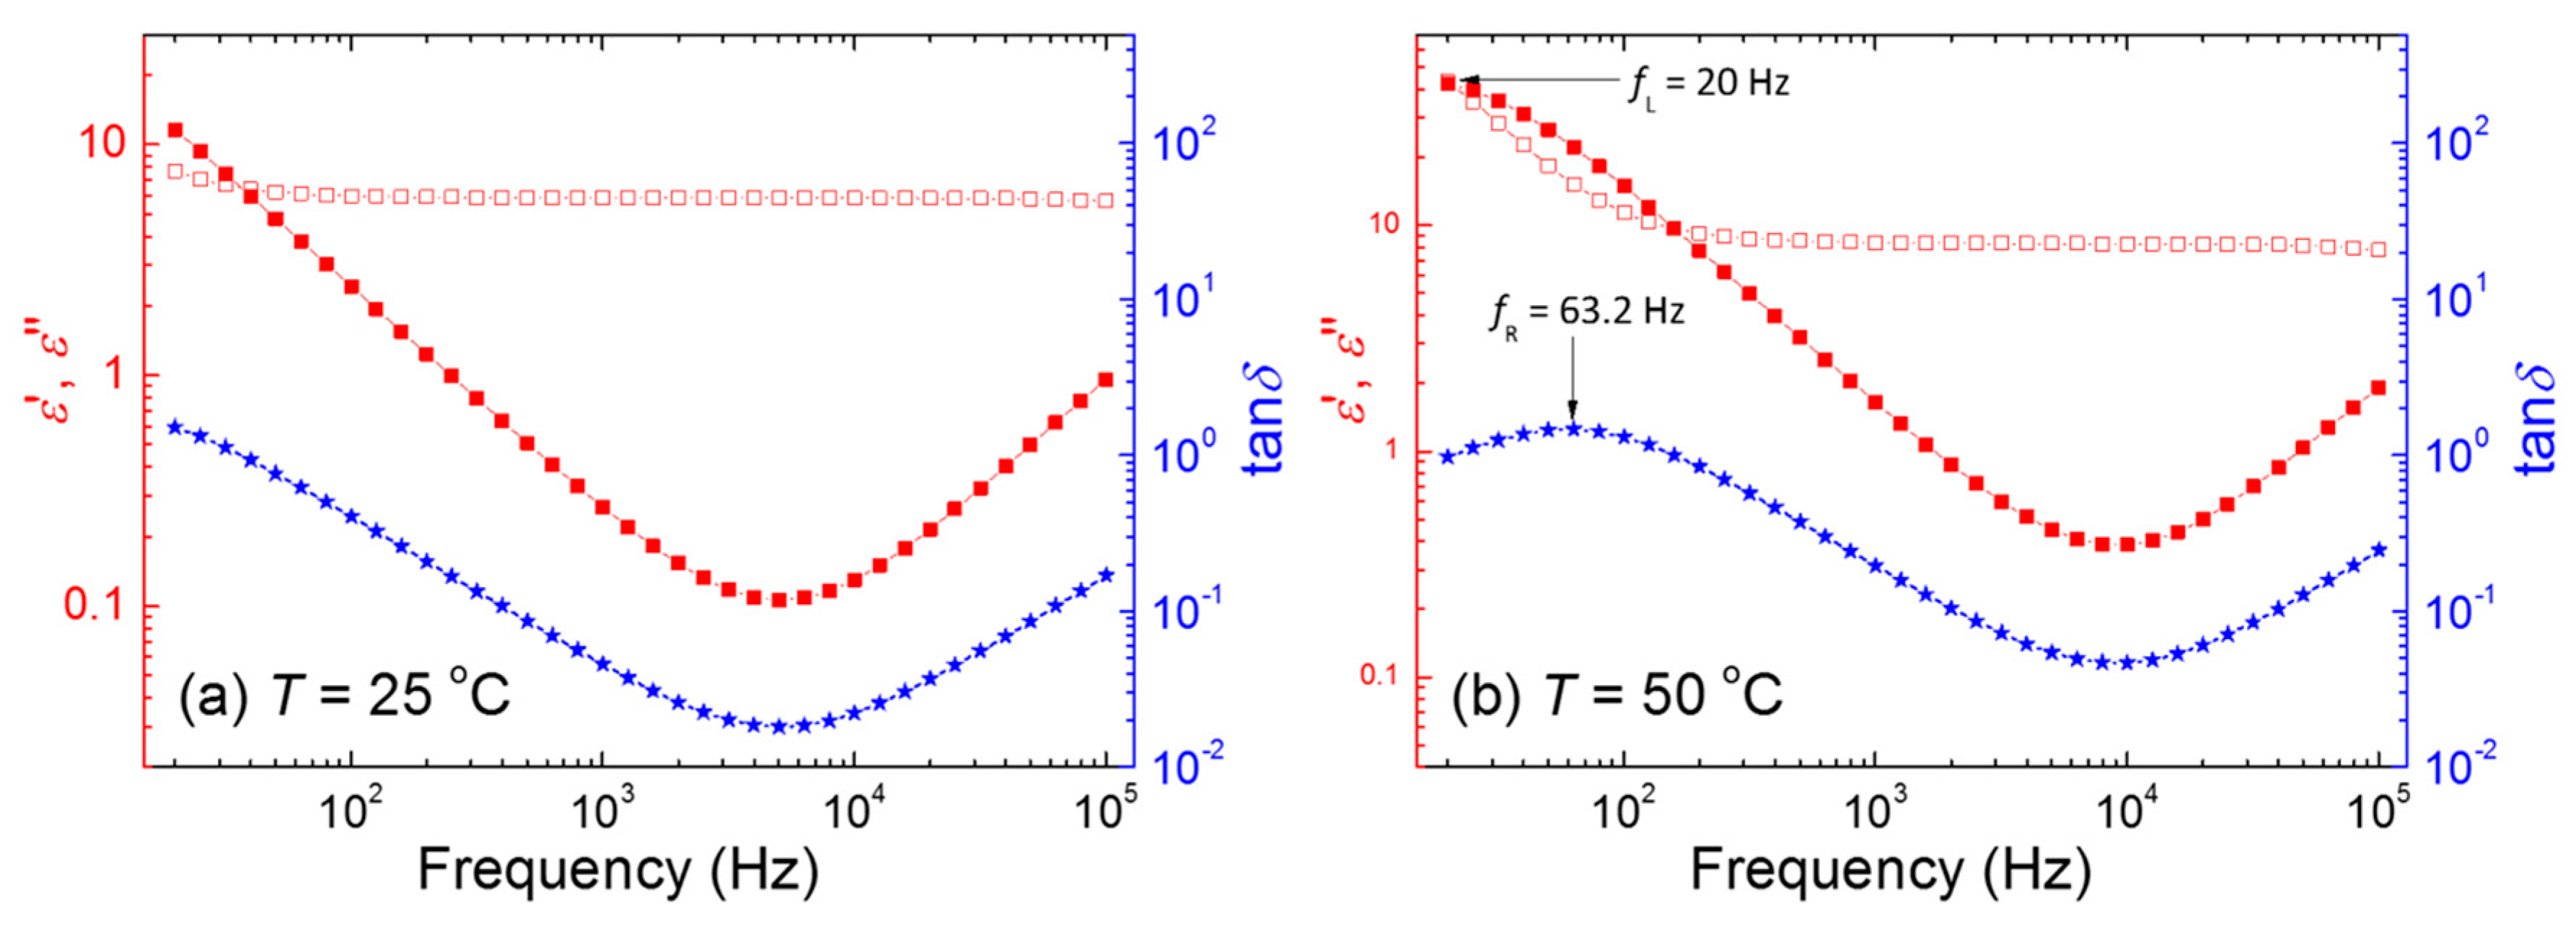
To explain that the ULH, formed by the hybrid pulse of
V = 30 V
rms at
f1 = 55 kHz and
f2 = 30 Hz, is enabled and governed by EHDI,
Figure 6a,b show the real (
ε’)- and imaginary (
ε”)-part dielectric and the loss-tangent (tan
δ) spectra of the CLC cell in the P state at
T = 25 °C and 50 °C, respectively. The probe voltage for dielectric measurements is as low as 0.5 V
rms, which is unable to give rise to the Fréedericksz transition and, in turn, the molecular reorientation. Previously, we have established that the EHDI-induced ULH alignment is determined by the transport of mobile ions and, thus, the strength of space charge polarization unraveled in the complex dielectric spectra. Using dielectric spectroscopy, an optimized frequency range between
fL and
fR to facilitate EHDI-induced ULH has also been identified [
18]. It is worth to mention that
fL in
Figure 6 is the lower frequency at which the
ε’ and
ε” curves intersect each other and the relaxation frequency
fR (>
fL) refers to the one corresponding to the maximum value of the loss-tangent. As shown in
Figure 6a, the value of
ε’ in the measured frequency regime (20 Hz–100 kHz), ascribed to the molecular orientation, is nearly constant. Moreover, based on this role, it is reasonable for the absence of ULH alignment in the cell applied with 30 Hz voltages at
T = 25 °C in
Figure 1a because both
fL and
fR fall lower than 20 Hz, the lower frequency limit of the LCR meter E4980A. In contrast, as the temperature increases to 50 °C, the three curves shift to higher frequencies due to the promoted ionic effect in the cell. As a consequence,
fL and
fR become 20 Hz and 63.2 Hz at 50 °C, respectively, so that the EHDI-induced ULH alignment can be acquired by the pulse of
V = 30 V
rms at
f2 = 30 Hz (note:
fL <
f2 <
fR). This implies that when a CLC with low ion density is used, the ULH can be alternatively realized via the elevation in temperature and thus the resulting ionic effect by adjusting the frequency conditions of the hybrid voltage pulse to onset the EHDI.


