Single-Cell Profiling of Coding and Noncoding Genes in Human Dopamine Neuron Differentiation

 and
and 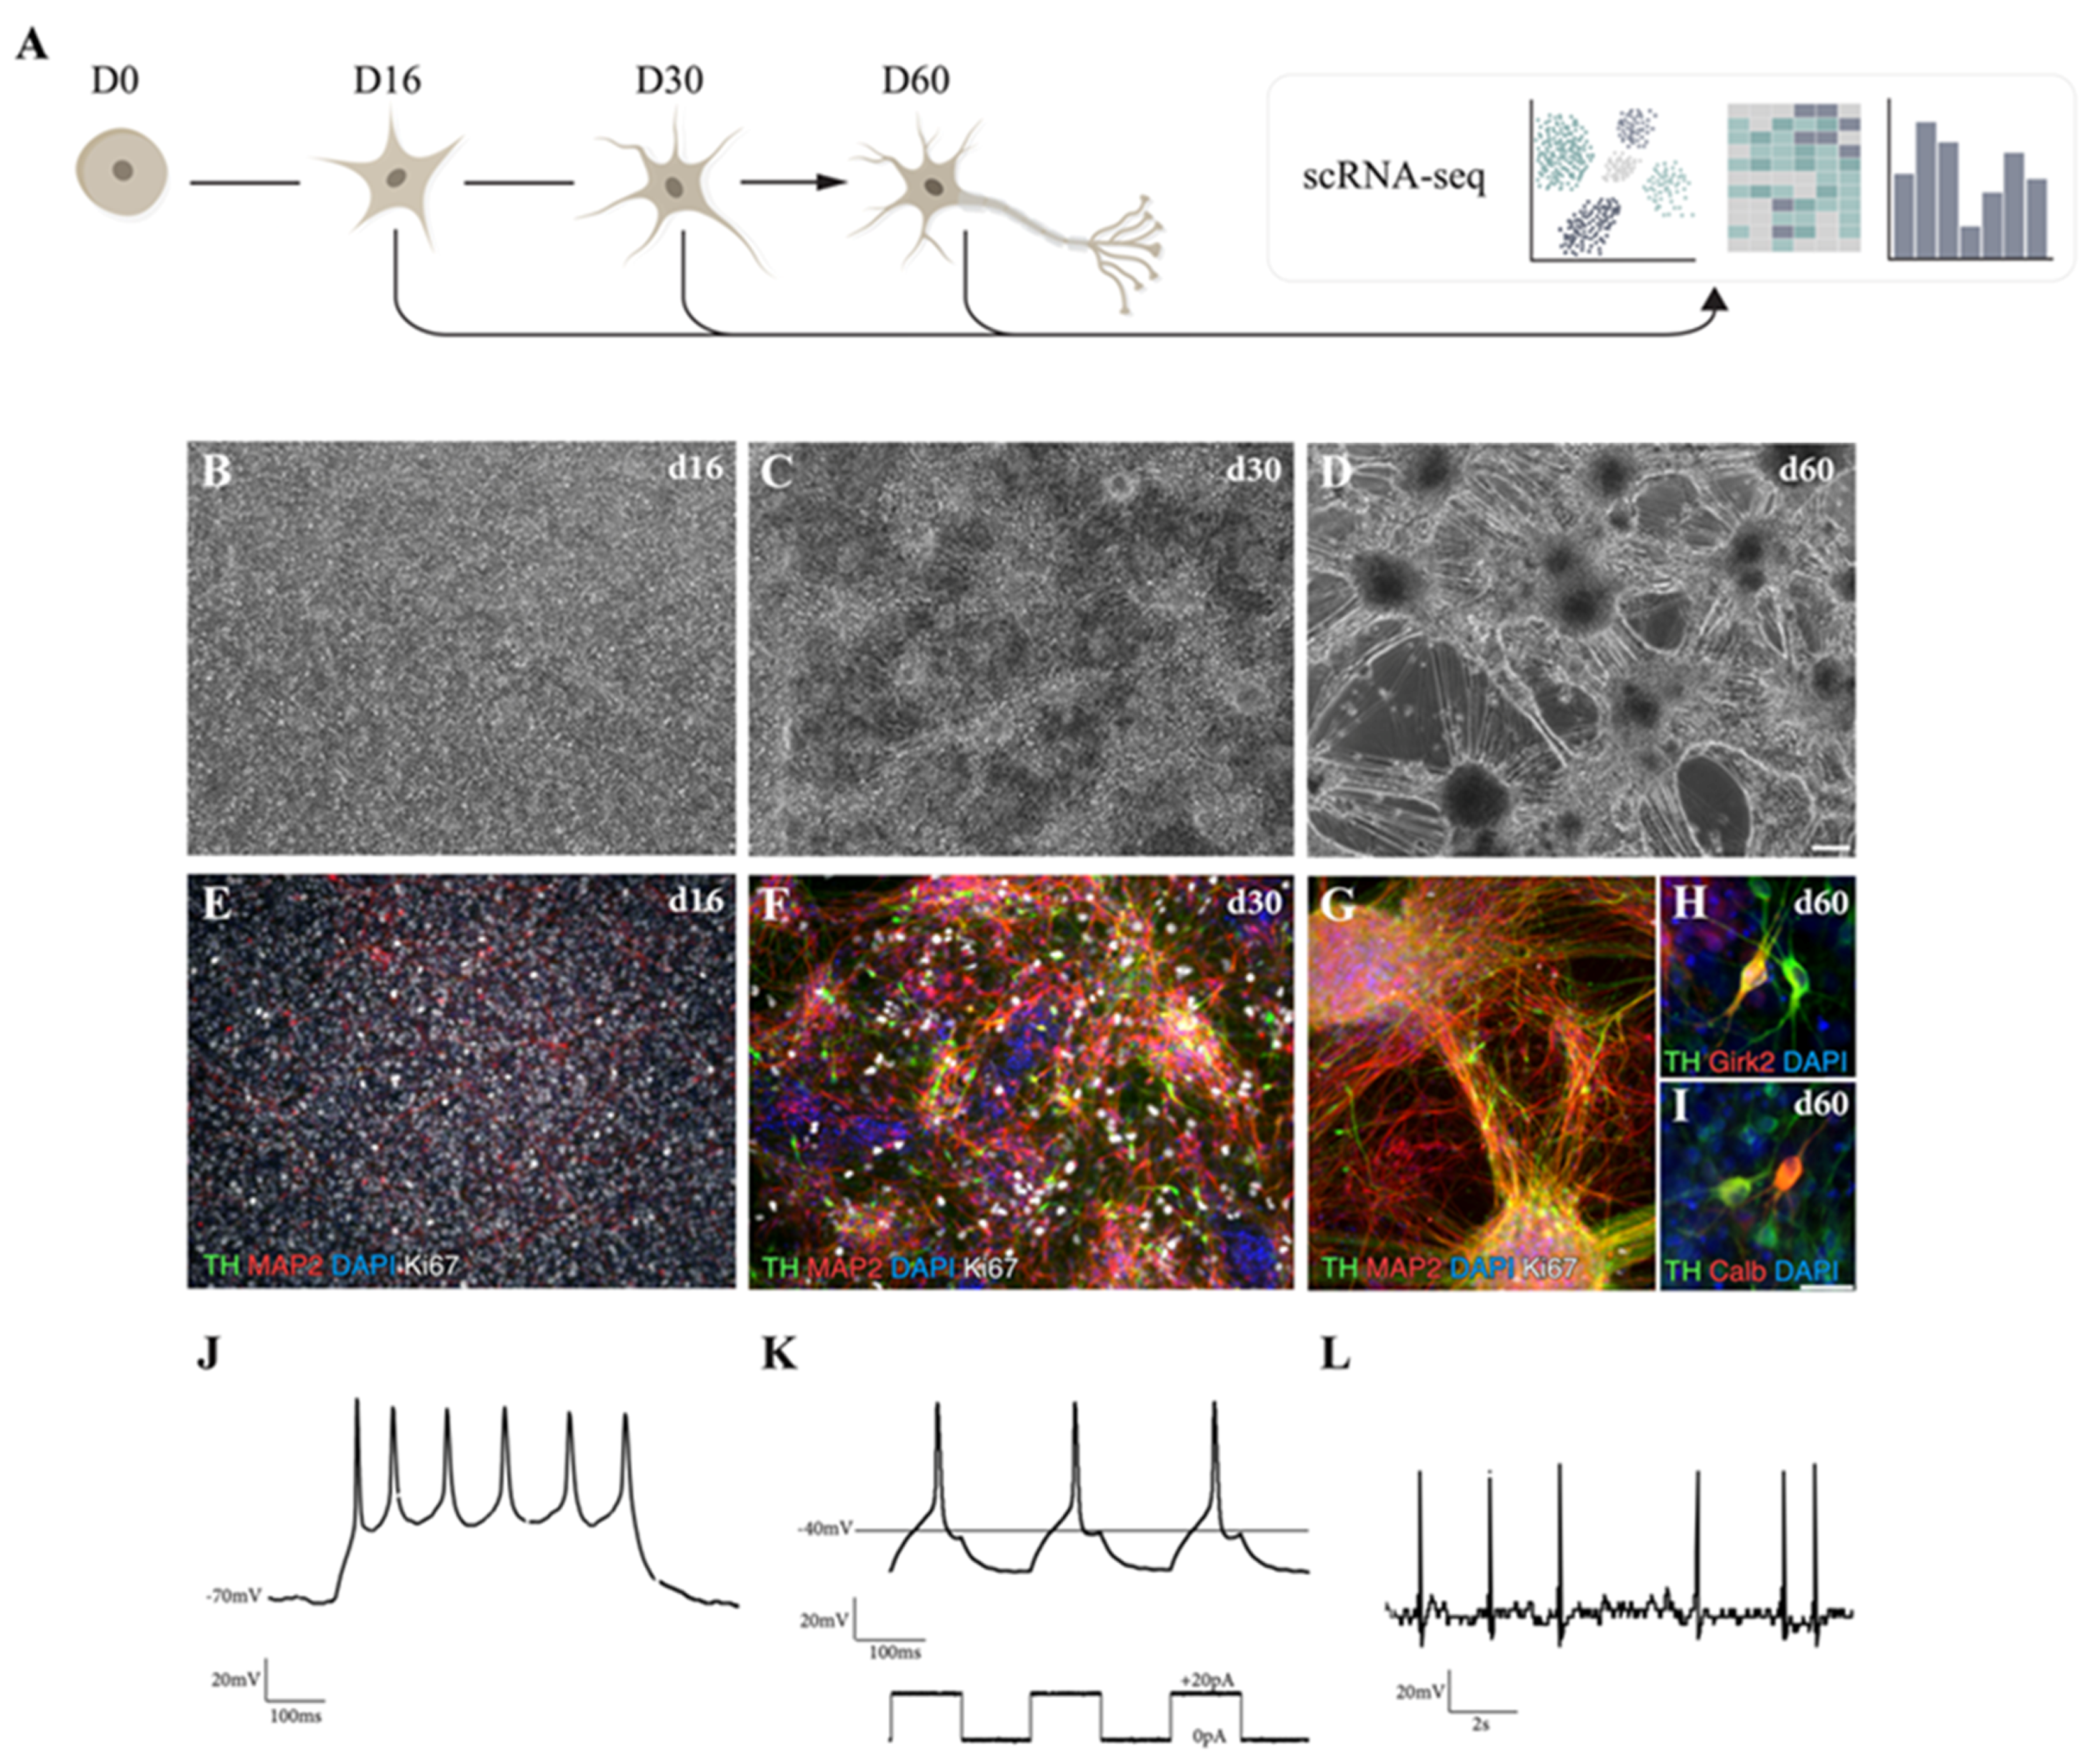
Abstract
1. Introduction
2. Materials and Methods
2.1. hPSC Culture and 2D Differentiation
2.2. scRNA-Seq Analysis
2.3. LncRNA Quantification
2.4. qRT-PCR
2.5. Electrophysiology
2.6. Immunocytochemistry
2.7. Microscopy
2.8. Statistical Analysis
2.9. Code Availability
3. Results
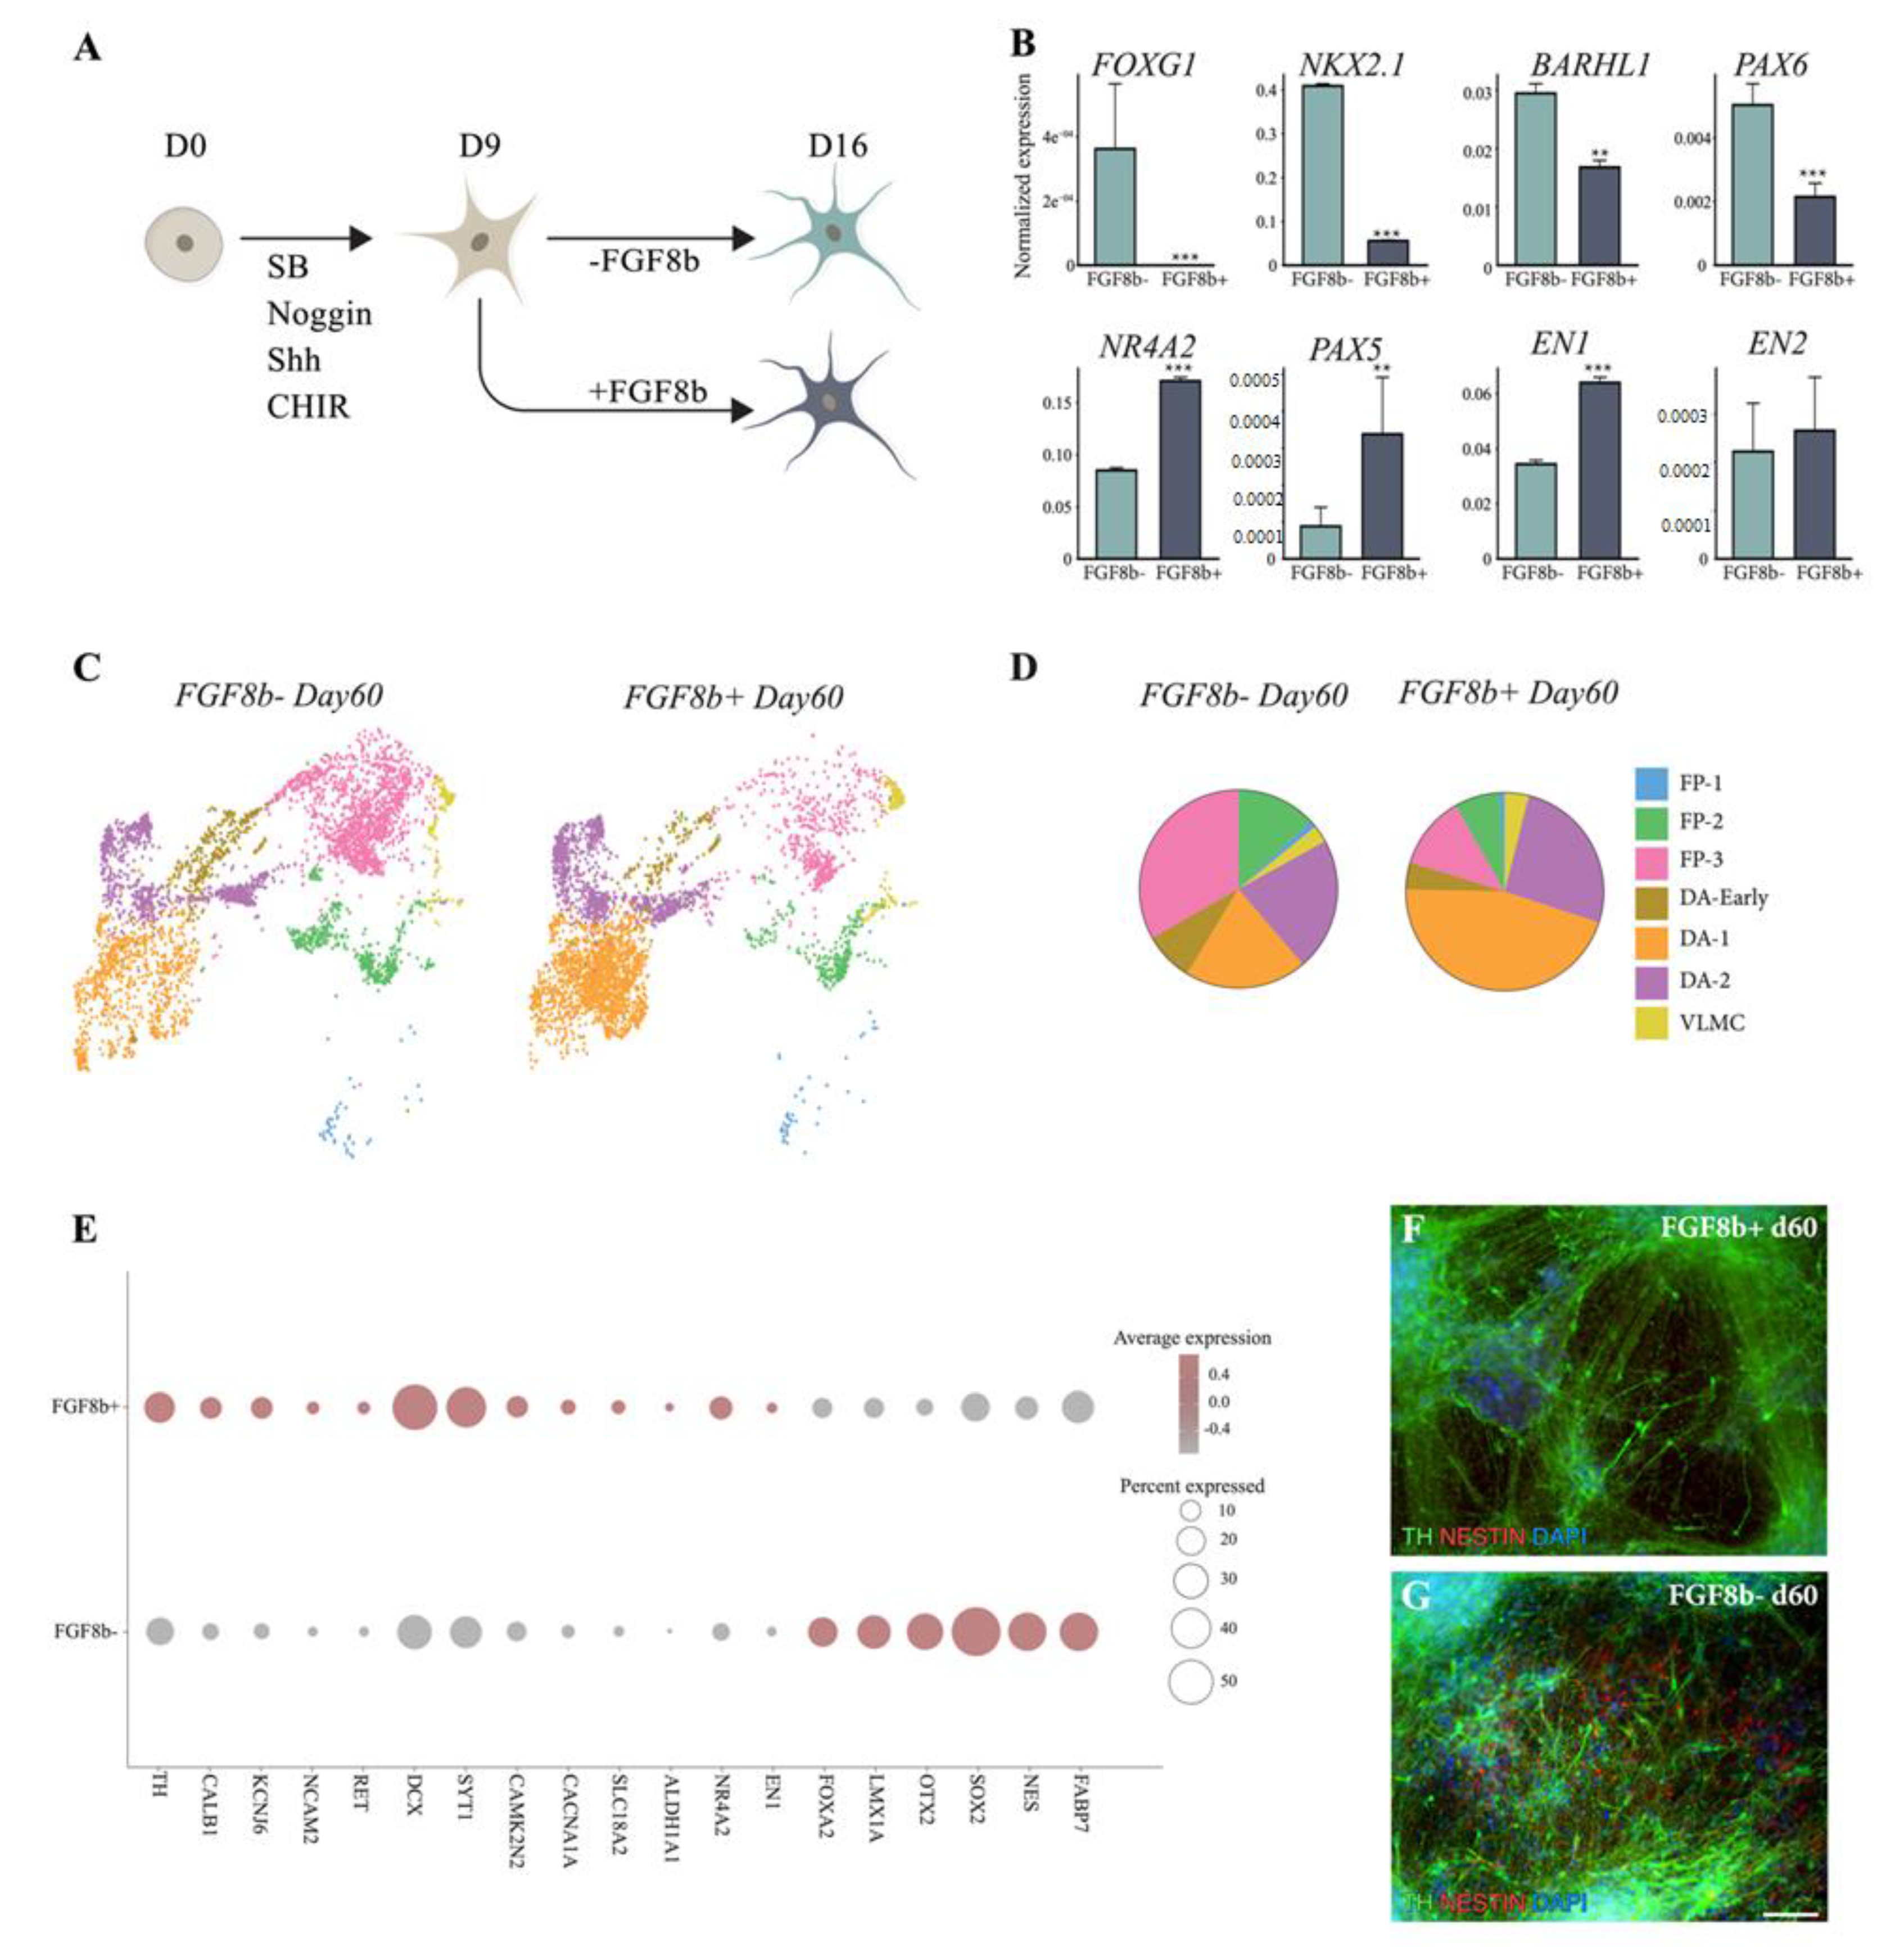
3.1. hPSCs Are Patterned into Functionally Mature DA Neurons
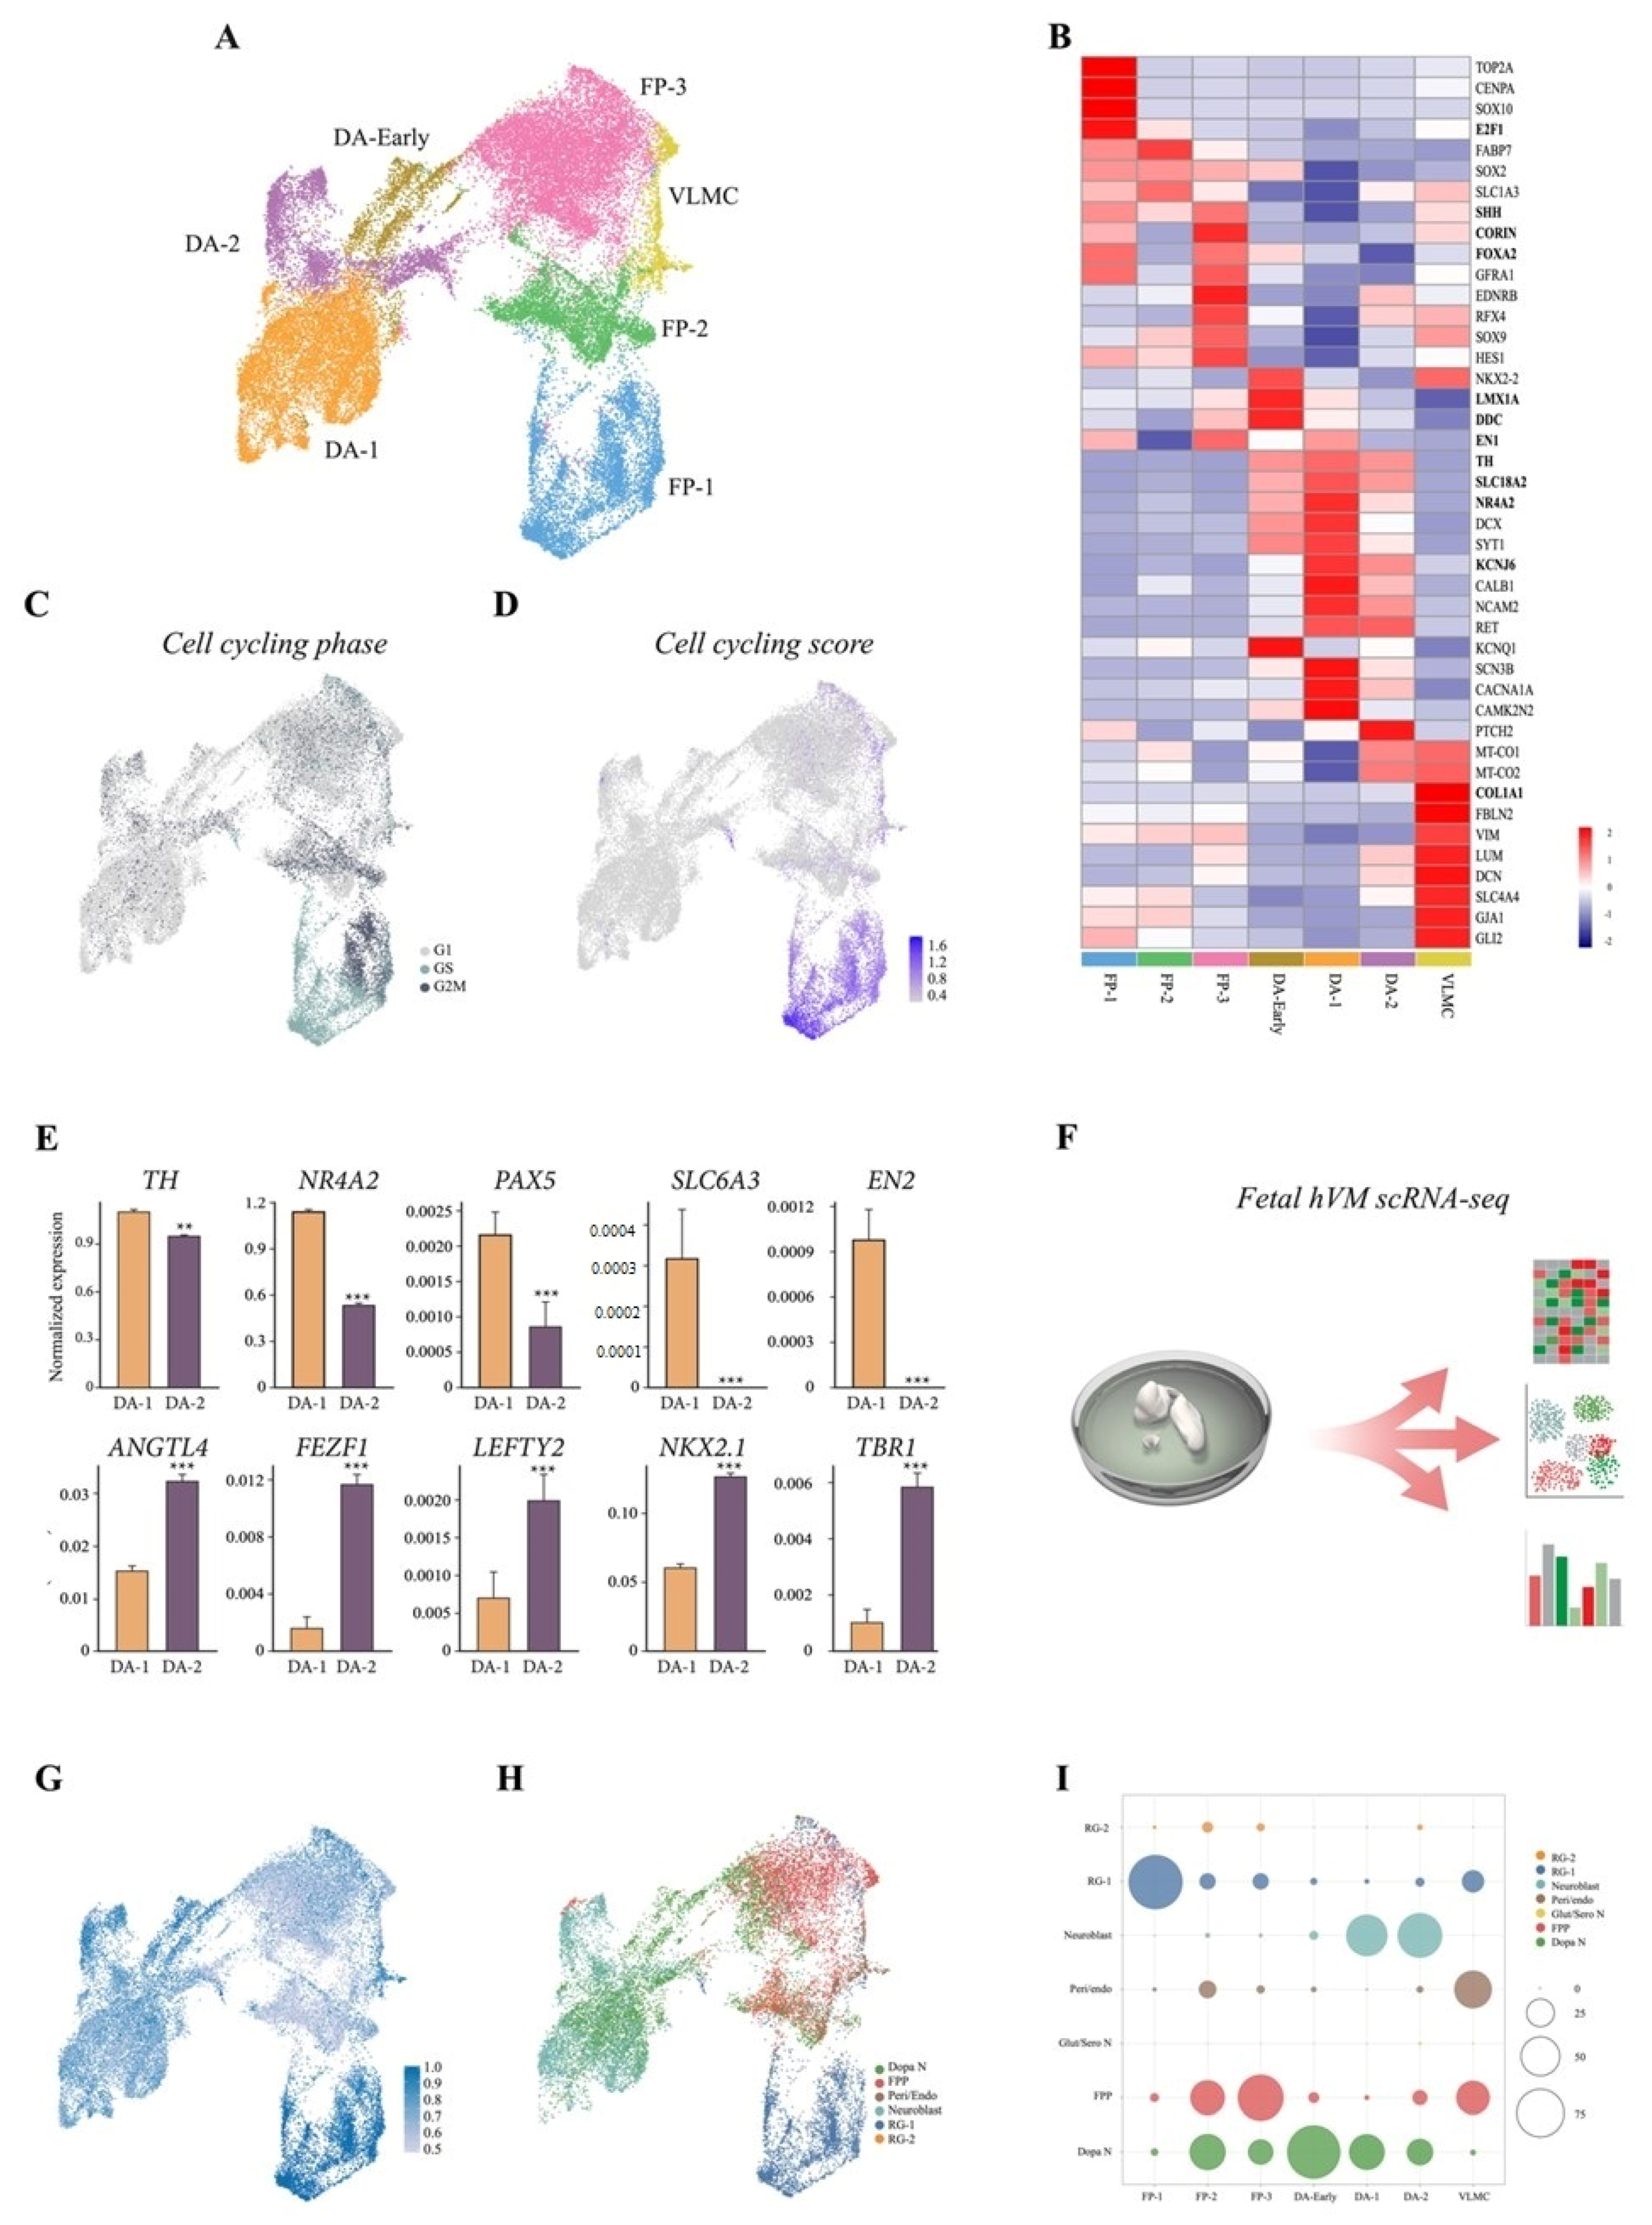
3.2. scRNAseq Reveals Cell-Type Specificity and Developmental Trajectories During VM Differentiation
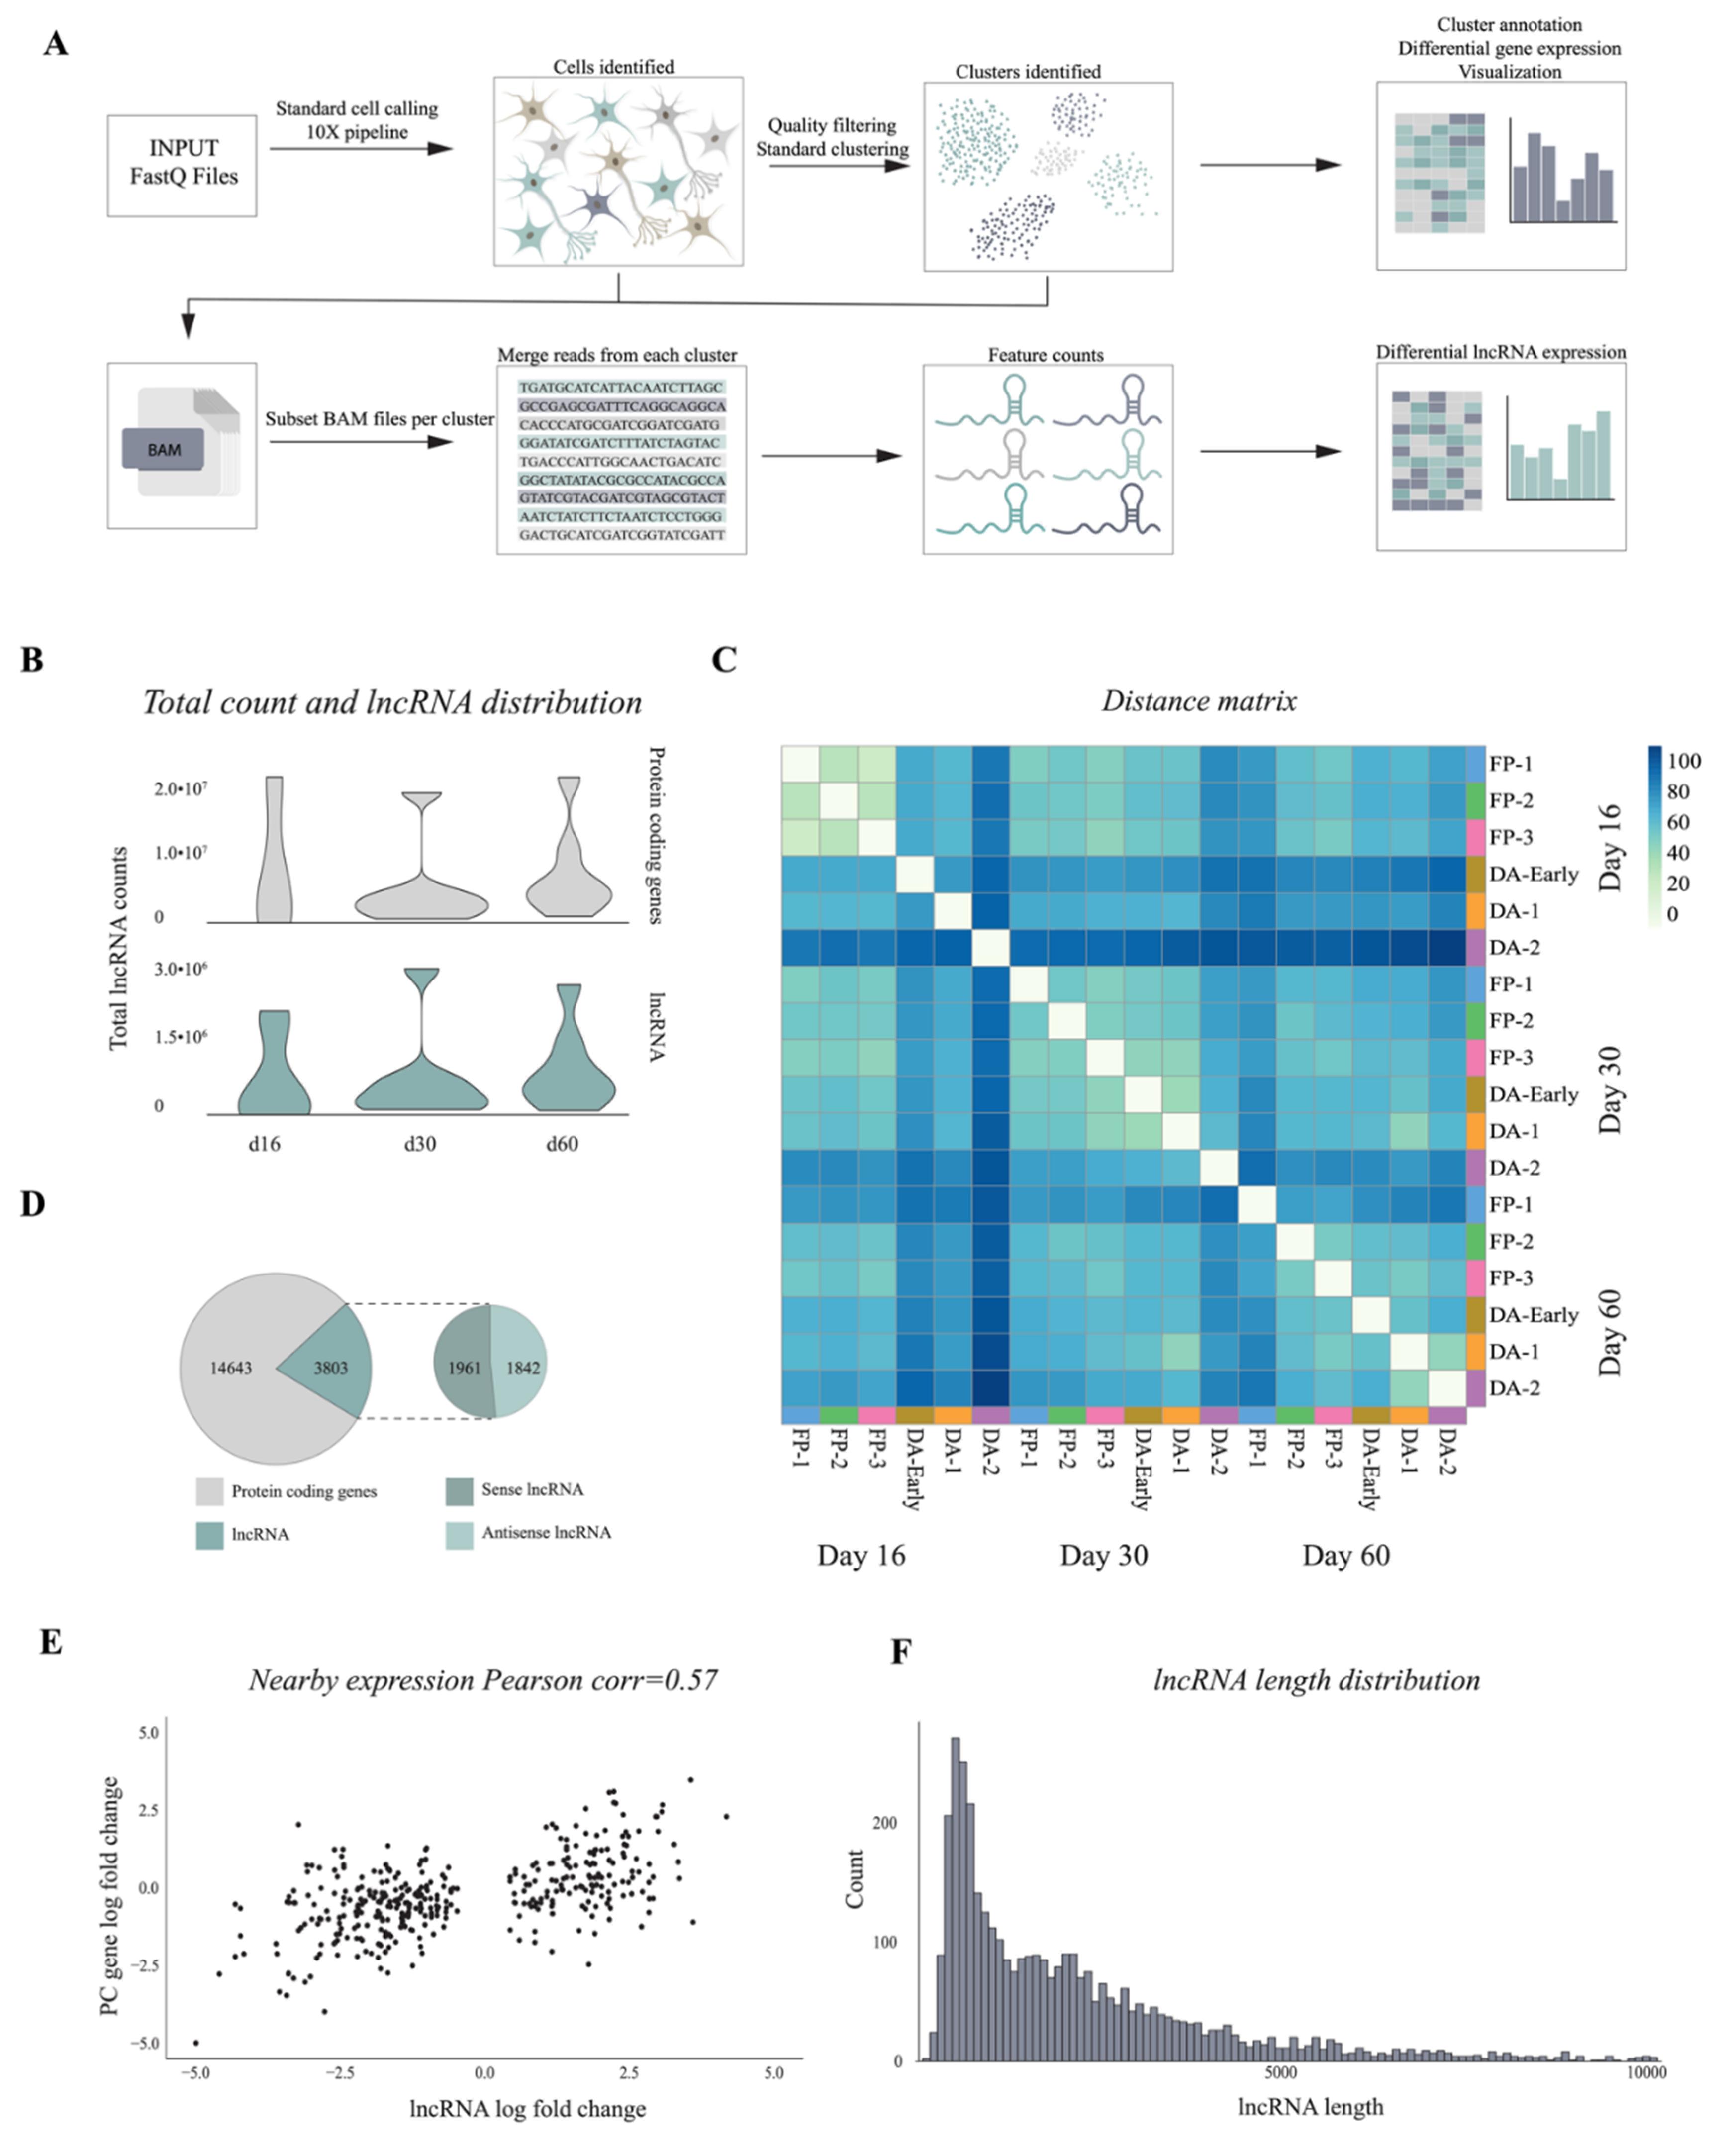
3.3. 10× Genomics Captures a Repertoire of lncRNAs during VM Differentiation
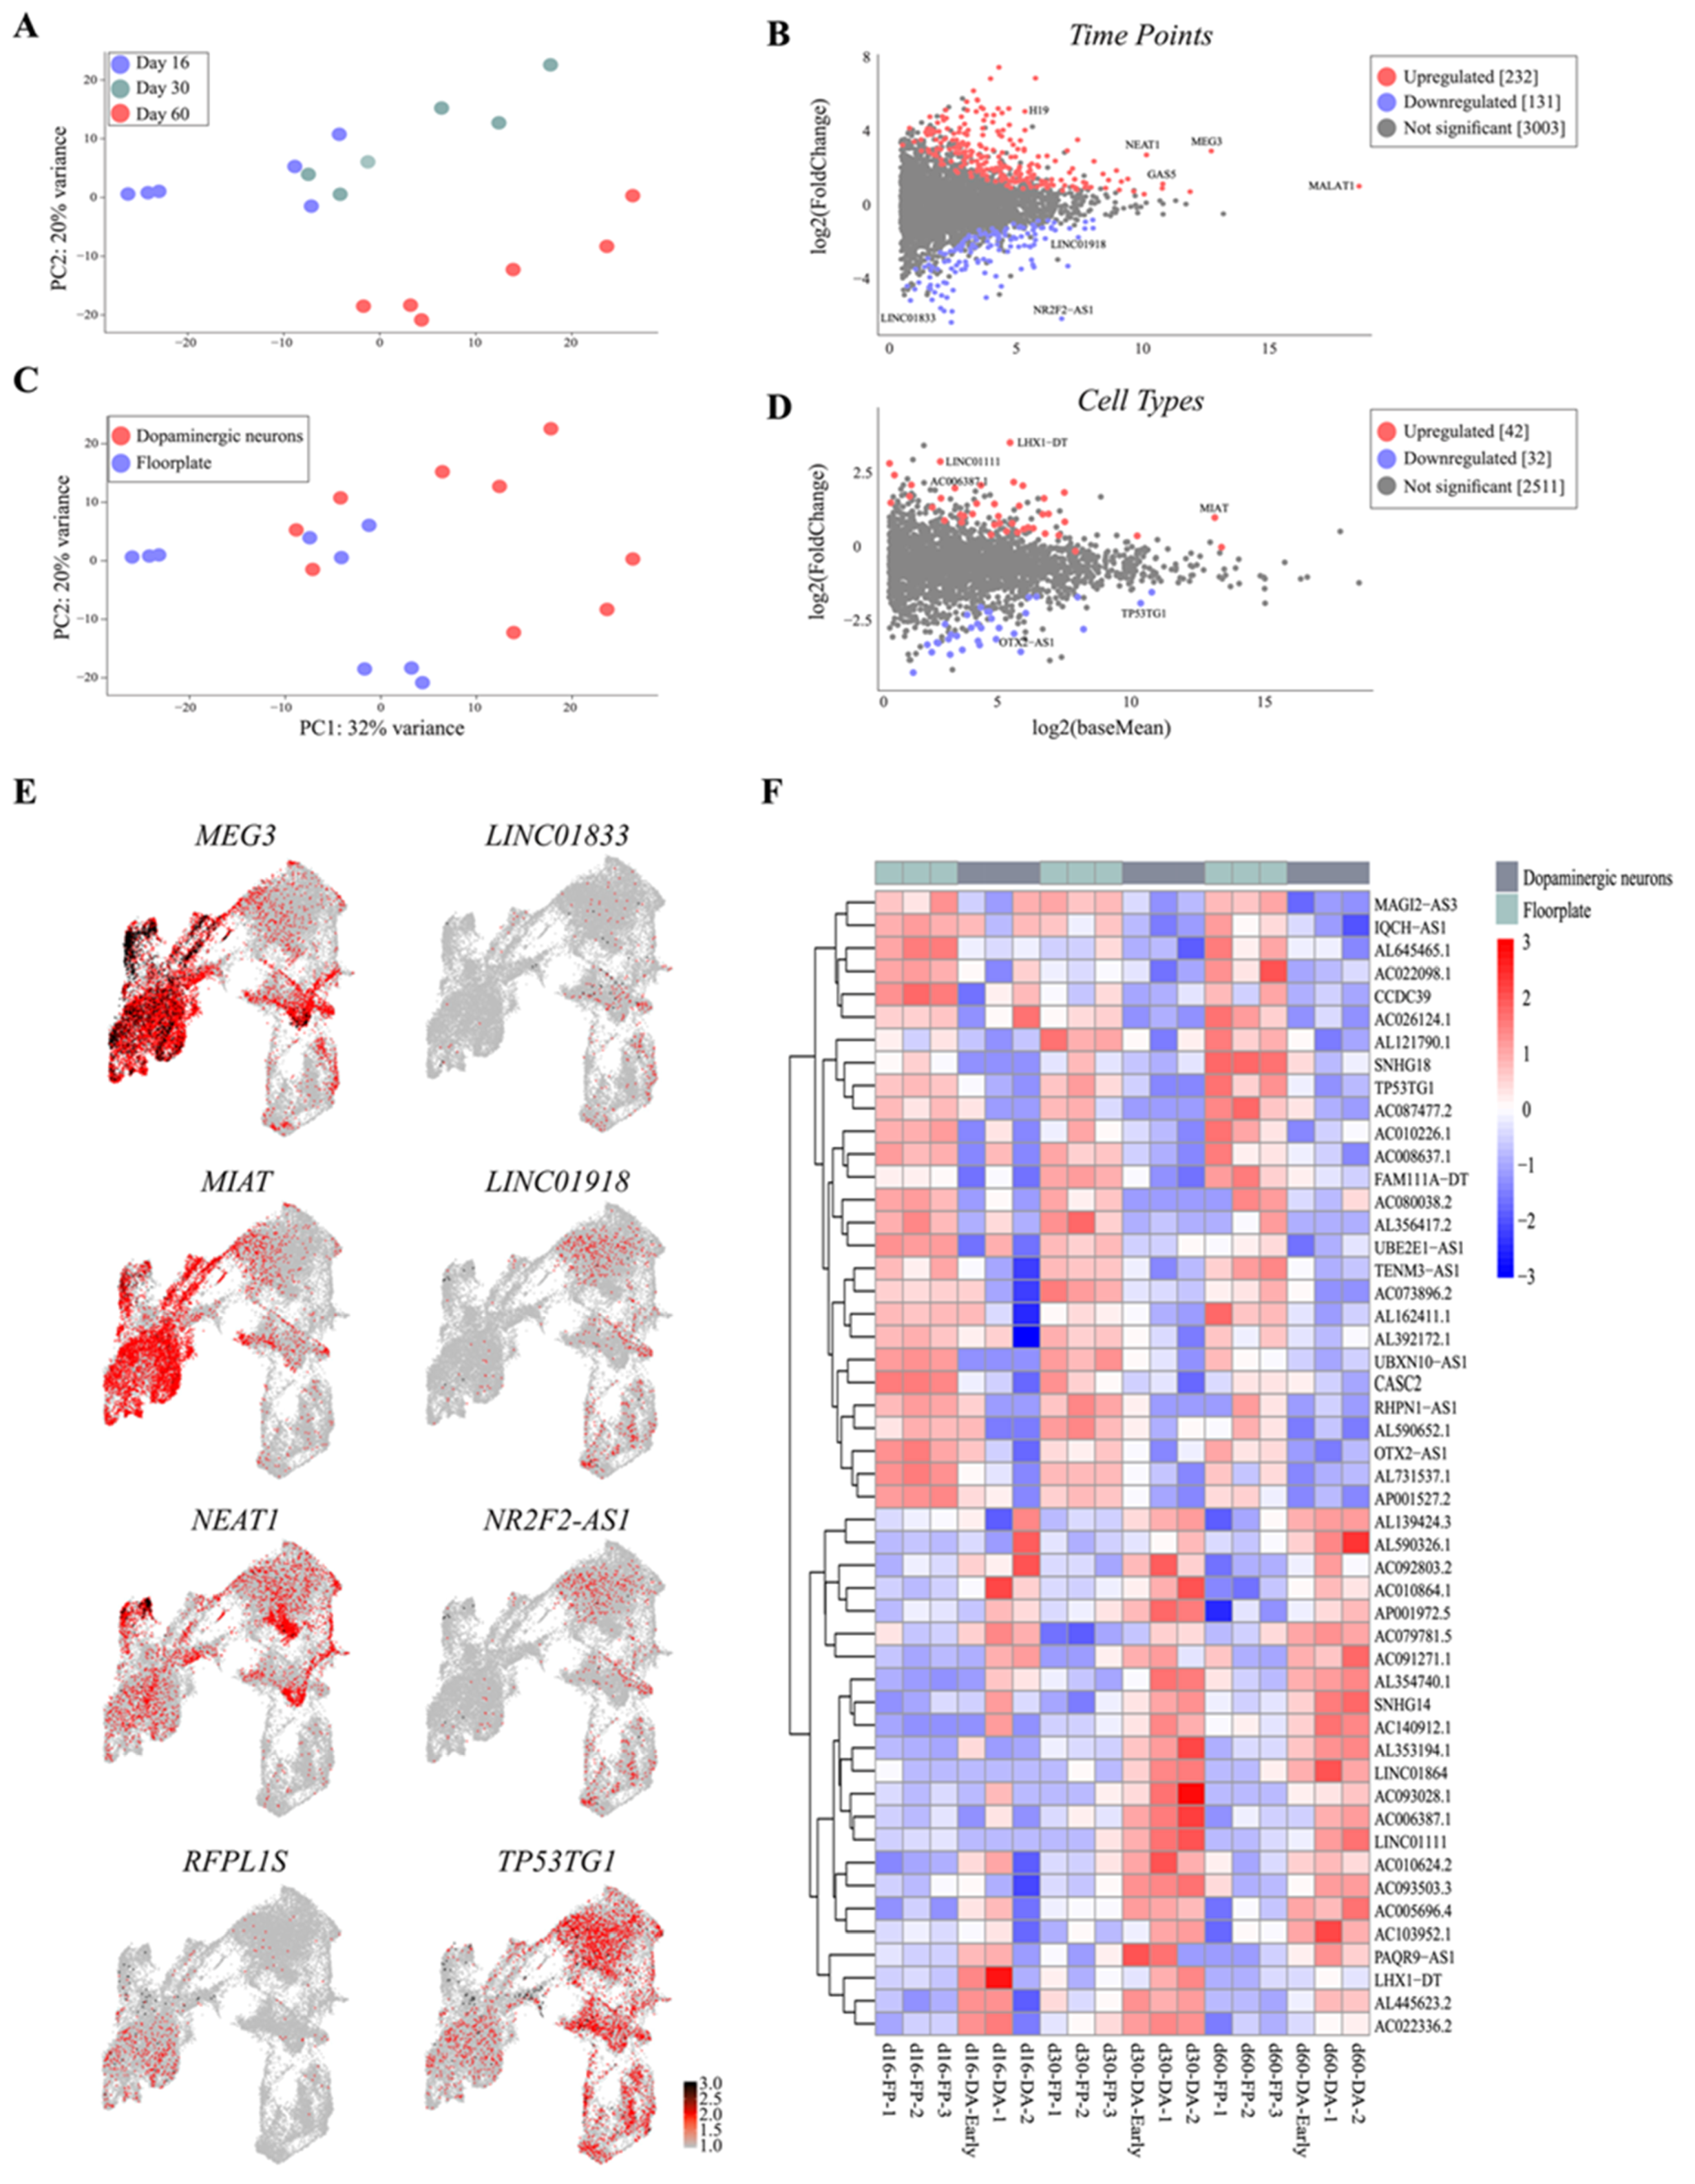
3.4. Single-Cell Analysis Reveals Dynamics and Cell-Type Specificity of LncRNAs During VM Differentiation
4. Discussion
Supplementary Materials
Author Contributions
Funding
Institutional Review Board Statement
Informed Consent Statement
Data Availability Statement
Acknowledgments
Conflicts of Interest
References
- Barker, R.A.; Drouin-Ouellet, J.; Parmar, M. Cell-based therapies for Parkinson disease—past insights and future potential. Nat. Rev. Neurol. 2015, 11, 492–503. [Google Scholar] [CrossRef] [PubMed]
- Barker, R.A.; Parmar, M.; Studer, L.; Takahashi, J. Human Trials of Stem Cell-Derived Dopamine Neurons for Parkinson’s Disease: Dawn of a New Era. Cell Stem Cell 2017, 21, 569–573. [Google Scholar] [CrossRef] [PubMed]
- Parmar, M. Towards stem cell based therapies for Parkinson’s disease. Development 2018, 145, dev156117. [Google Scholar] [CrossRef] [PubMed]
- Barker, R.A.; TRANSEURO consortium. Designing stem-cell-based dopamine cell replacement trials for Parkinson’s disease. Nat. Med. 2019, 25, 1045–1053. [Google Scholar] [CrossRef]
- Kriks, S.; Shim, J.-W.; Piao, J.; Ganat, Y.M.; Wakeman, D.R.; Xie, Z.; Carrillo-Reid, L.; Auyeung, G.; Antonacci, C.; Buch, A.; et al. Dopamine neurons derived from human ES cells efficiently engraft in animal models of Parkinson’s disease. Nat. Cell Biol. 2011, 480, 547–551. [Google Scholar] [CrossRef] [PubMed]
- Grealish, S.; Diguet, E.; Kirkeby, A.; Mattsson, B.; Heuer, A.; Bramoulle, Y.; Van Camp, N.; Perrier, A.L.; Hantraye, P.; Björklund, A.; et al. Human ESC-Derived Dopamine Neurons Show Similar Preclinical Efficacy and Potency to Fetal Neurons when Grafted in a Rat Model of Parkinson’s Disease. Cell Stem Cell 2014, 15, 653–665. [Google Scholar] [CrossRef]
- Kikuchi, T.; Morizane, A.; Doi, D.; Magotani, H.; Onoe, H.; Hayashi, T.; Mizuma, H.; Takara, S.; Takahashi, R.; Inoue, H.; et al. Human iPS cell-derived dopaminergic neurons function in a primate Parkinson’s disease model. Nat. Cell Biol. 2017, 548, 592–596. [Google Scholar] [CrossRef]
- Kirkeby, A.; Nolbrant, S.; Tiklova, K.; Heuer, A.; Kee, N.; Cardoso, T.; Ottosson, D.R.; Lelos, M.J.; Rifes, P.; Dunnett, S.B.; et al. Predictive Markers Guide Differentiation to Improve Graft Outcome in Clinical Translation of hESC-Based Therapy for Parkinson’s Disease. Cell Stem Cell 2017, 20, 135–148. [Google Scholar] [CrossRef]
- Nolbrant, S.; Heuer, A.; Parmar, M.; Kirkeby, A. Generation of high-purity human ventral midbrain dopaminergic progenitors for in vitro maturation and intracerebral transplantation. Nat. Protoc. 2017, 12, 1962–1979. [Google Scholar] [CrossRef]
- Tiklová, K.; Nolbrant, S.; Fiorenzano, A.; Björklund Åsa, K.; Sharma, Y.; Heuer, A.; Gillberg, L.; Hoban, D.B.; Cardoso, T.; Adler, A.F.; et al. Author Correction: Single cell transcriptomics identifies stem cell-derived graft composition in a model of Parkinson’s disease. Nat. Commun. 2020, 11, 1. [Google Scholar] [CrossRef]
- La Manno, G.; Gyllborg, D.; Codeluppi, S.; Nishimura, K.; Salto, C.; Zeisel, A.; Borm, L.E.; Stott, S.R.; Toledo, E.M.; Villaescusa, J.C.; et al. Molecular Diversity of Midbrain Development in Mouse, Human, and Stem Cells. Cell 2016, 167, 566–580.e19. [Google Scholar] [CrossRef] [PubMed]
- Vallejos, C.A.; Risso, D.; Scialdone, A.; Dudoit, S.; Marioni, J.C. Normalizing single-cell RNA sequencing data: Challenges and opportunities. Nat. Methods 2017, 14, 565–571. [Google Scholar] [CrossRef] [PubMed]
- The FANTOM consortium; Carninci, P.; Kasukawa, T.; Katayama, S.; Gough, J.; Frith, M.C.; Maeda, N.; Oyama, R.; Ravasi, T.; Lenhard, B.; et al. The Transcriptional Landscape of the Mammalian Genome. Science 2005, 309, 1559–1563. [Google Scholar] [CrossRef]
- Rinn, J.L.; Kertesz, M.; Wang, J.K.; Squazzo, S.L.; Xu, X.; Brugmann, S.A.; Goodnough, L.H.; Helms, J.A.; Farnham, P.J.; Segal, E.; et al. Functional Demarcation of Active and Silent Chromatin Domains in Human HOX Loci by Noncoding RNAs. Cell 2007, 129, 1311–1323. [Google Scholar] [CrossRef]
- Flynn, R.A.; Chang, H.Y. Long Noncoding RNAs in Cell-Fate Programming and Reprogramming. Cell Stem Cell 2014, 14, 752–761. [Google Scholar] [CrossRef]
- Fiorenzano, A.; Pascale, E.; Gagliardi, M.; Terreri, S.; Papa, M.; Andolfi, G.; Galasso, M.; Tagliazucchi, G.M.; Taccioli, C.; Patriarca, E.J.; et al. An Ultraconserved Element Containing lncRNA Preserves Transcriptional Dynamics and Maintains ESC Self-Renewal. Stem Cell Rep. 2018, 10, 1102–1114. [Google Scholar] [CrossRef]
- Grace, A.; Onn, S. Morphology and electrophysiological properties of immunocytochemically identified rat dopamine neurons recorded in vitro. J. Neurosci. 1989, 9, 3463–3481. [Google Scholar] [CrossRef]
- Marques, S.; Zeisel, A.; Codeluppi, S.; Van Bruggen, D.; Falcão, A.M.; Xiao, L.; Li, H.; Häring, M.; Hochgerner, H.; Romanov, R.A.; et al. Oligodendrocyte heterogeneity in the mouse juvenile and adult central nervous system. Science 2016, 352, 1326–1329. [Google Scholar] [CrossRef]
- Birtele, M.; Sharma, Y.; Storm, P.; Kajtez, J.; Sozzi, E.; Nilsson, F.; Wahlestedt, J.N.; Stott, S.; He, X.L.; Mattsson, B.; et al. Single cell transcriptional and functional analysis of human dopamine neurons in 3D fetal ventral midbrain organoid like cultures. bioRxiv 2020. [Google Scholar] [CrossRef]
- Ang, C.E.; Ma, Q.; Wapinski, O.L.; Fan, S.; Flynn, A.R.; Lee, Q.Y.; Coe, B.P.; Onoguchi, M.; Olmos, V.H.; Do, B.T.; et al. The novel lncRNA lnc-NR2F1 is pro-neurogenic and mutated in human neurodevelopmental disorders. eLife 2019, 8, 41770. [Google Scholar] [CrossRef]
- Prajapati, B.; Fatma, M.; Maddhesiya, P.; Sodhi, M.K.; Fatima, M.; Dargar, T.; Bhagat, R.; Seth, P.; Sinha, S. Identification and epigenetic analysis of divergent long non-coding RNAs in multilineage differentiation of human Neural Progenitor Cells. RNA Biol. 2019, 16, 13–24. [Google Scholar] [CrossRef] [PubMed]
- Ng, S.-Y.; Johnson, R.; Stanton, L.W. Human long non-coding RNAs promote pluripotency and neuronal differentiation by association with chromatin modifiers and transcription factors. EMBO J. 2011, 31, 522–533. [Google Scholar] [CrossRef] [PubMed]
- Zhang, Y.; Jin, T.; Shen, H.; Yan, J.; Guan, M.; Jin, X. Identification of Long Non-Coding RNA Expression Profiles and Co-Expression Genes in Thyroid Carcinoma Based on The Cancer Genome Atlas (TCGA) Database. Med Sci. Monit. 2019, 25, 9752–9769. [Google Scholar] [CrossRef]
- Joshi, P.; Jallo, G.; Perera, R.J. In silico analysis of long non-coding RNAs in medulloblastoma and its subgroups. Neurobiol. Dis. 2020, 141, 104873. [Google Scholar] [CrossRef] [PubMed]
- Muret, K.; Désert, C.; Lagoutte, L.; Boutin, M.; Gondret, F.; Zerjal, T.; Lagarrigue, S. Long noncoding RNAs in lipid metabolism: Literature review and conservation analysis across species. BMC Genom. 2019, 20, 1–18. [Google Scholar] [CrossRef]
- Lyu, Y.; Bai, L.; Qin, C. Long noncoding RNAs in neurodevelopment and Parkinson’s disease. Anim. Model. Exp. Med. 2019, 2, 239–251. [Google Scholar] [CrossRef]
- Simchovitz, A.; Hanan, M.; Niederhoffer, N.; Madrer, N.; Yayon, N.; Bennett, E.R.; Greenberg, D.S.; Kadener, S.; Soreq, H. NEAT1 is overexpressed in Parkinson’s disease substantia nigra and confers drug-inducible neuroprotection from oxidative stress. FASEB J. 2019, 33, 11223–11234. [Google Scholar] [CrossRef]
- Li, L.; Zhuang, Y.; Zhao, X.; Li, X.-K. Long Non-coding RNA in Neuronal Development and Neurological Disorders. Front. Genet. 2019, 9, 744. [Google Scholar] [CrossRef]
- Li, X.L.; Subramanian, M.; Jones, M.F.; Chaudhary, R.; Singh, D.K.; Zong, X.; Gryder, B.; Sindri, S.; Mo, M.; Schetter, A.; et al. Long Noncoding RNA PURPL Suppresses Basal p53 Levels and Promotes Tumorigenicity in Colorectal Cancer. Cell Rep. 2017, 20, 2408–2423. [Google Scholar] [CrossRef]
- Sun, C.; Huang, L.; Li, Z.; Leng, K.; Xu, Y.; Jiang, X.-M.; Cui, Y. Long non-coding RNA MIAT in development and disease: A new player in an old game. J. Biomed. Sci. 2018, 25, 1–7. [Google Scholar] [CrossRef]
- Yan, H.; Rao, J.; Yuan, J.; Gao, L.; Huang, W.; Zhao, L.; Ren, J. Long non-coding RNA MEG3 functions as a competing endogenous RNA to regulate ischemic neuronal death by targeting miR-21/PDCD4 signaling pathway. Cell Death Dis. 2017, 8, 1–15. [Google Scholar] [CrossRef] [PubMed]
- Pan, S.; Shen, M.; Zhou, M.; Shi, X.; He, R.; Yin, T.; Wang, M.; Guo, X.; Qin, R.Y. Long noncoding RNA LINC01111 suppresses pancreatic cancer aggressiveness by regulating DUSP1 expression via microRNA-3924. Cell Death Dis. 2019, 10, 1–16. [Google Scholar] [CrossRef] [PubMed]
- Diaz-Lagares, A.; Crujeiras, A.B.; Lopez-Serra, P.; Soler, M.; Setien, F.; Goyal, A.; Sandoval, J.; Hashimoto, Y.; Martinez-Cardús, A.; Gomez, A.; et al. Epigenetic inactivation of the p53-induced long noncoding RNA TP53 target 1 in human cancer. Proc. Natl. Acad. Sci. USA 2016, 113, E7535–E7544. [Google Scholar] [CrossRef] [PubMed]
- Zheng, R.; Yao, Q.; Li, X.; Xu, B. Long Noncoding Ribonucleic Acid SNHG18 Promotes Glioma Cell Motility via Disruption of α-Enolase Nucleocytoplasmic Transport. Front. Genet. 2019, 10, 1140. [Google Scholar] [CrossRef] [PubMed]
- Ouyang, T.; Zhang, Y.; Tang, S.; Wang, Y. Long non-coding RNA LINC00052 regulates miR-608/EGFR axis to promote progression of head and neck squamous cell carcinoma. Exp. Mol. Pathol. 2019, 111, 104321. [Google Scholar] [CrossRef] [PubMed]
- Cooper, O.; Hargus, G.; Deleidi, M.; Blak, A.; Osborn, T.; Marlow, E.; Lee, K.; Levy, A.; Pérez-Torres, E.; Yow, A.; et al. Differentiation of human ES and Parkinson’s disease iPS cells into ventral midbrain dopaminergic neurons requires a high activity form of SHH, FGF8a and specific regionalization by retinoic acid. Mol. Cell. Neurosci. 2010, 45, 258–266. [Google Scholar] [CrossRef] [PubMed]
- Fasano, C.A.; Chambers, S.M.; Lee, G.; Tomishima, M.J.; Studer, L. Efficient Derivation of Functional Floor Plate Tissue from Human Embryonic Stem Cells. Cell Stem Cell 2010, 6, 336–347. [Google Scholar] [CrossRef]
- Kirkeby, A.; Parmar, M. Building authentic midbrain dopaminergic neurons from stem cells—Lessons from development. Transl. Neurosci. 2012, 3, 314–319. [Google Scholar] [CrossRef]
- Daadi, M.M.; Weiss, S. Generation of Tyrosine Hydroxylase-Producing Neurons from Precursors of the Embryonic and Adult Forebrain. J. Neurosci. 1999, 19, 4484–4497. [Google Scholar] [CrossRef]
- Wang, K.C.; Chang, H.Y. Molecular Mechanisms of Long Noncoding RNAs. Mol. Cell 2011, 43, 904–914. [Google Scholar] [CrossRef]
- Fiorenzano, A.; Pascale, E.; Patriarca, E.J.; Minchiotti, G.; Fico, A. LncRNAs and PRC2: Coupled Partners in Embryonic Stem Cells. Epigenomes 2019, 3, 14. [Google Scholar] [CrossRef]
- Grassi, D.A.; Brattås, P.L.; Jönsson, M.E.; Atacho, D.; Karlsson, O.; Nolbrant, S.; Parmar, M.; Jakobsson, J. Profiling of lincRNAs in human pluripotent stem cell derived forebrain neural progenitor cells. Heliyon 2020, 6, e03067. [Google Scholar] [CrossRef] [PubMed]
- Liu, S.J.; Nowakowski, T.J.; Pollen, A.A.; Lui, J.H.; Horlbeck, M.A.; Attenello, F.J.; He, D.; Weissman, J.S.; Kriegstein, A.R.; Diaz, A.; et al. Single-cell analysis of long non-coding RNAs in the developing human neocortex. Genome Biol. 2016, 17, 1–17. [Google Scholar] [CrossRef] [PubMed]
- Alessio, E.; Buson, L.; Chemello, F.; Peggion, C.; Grespi, F.; Martini, P.; Massimino, M.L.; Pacchioni, B.; Millino, C.; Romualdi, C.; et al. Single cell analysis reveals the involvement of the long non-coding RNA Pvt1 in the modulation of muscle atrophy and mitochondrial network. Nucleic Acids Res. 2019, 47, 1653–1670. [Google Scholar] [CrossRef] [PubMed]
- Jiang, S.; Cheng, S.-J.; Ren, L.-C.; Wang, Q.; Kang, Y.-J.; Ding, Y.; Hou, M.; Yang, X.; Lin, Y.; Liang, N.; et al. An expanded landscape of human long noncoding RNA. Nucleic Acids Res. 2019, 47, 7842–7856. [Google Scholar] [CrossRef] [PubMed]
- Zhou, J.; Xu, J.; Zhang, L.; Liu, S.; Ma, Y.; Wen, X.; Hao, J.; Li, Z.; Ni, Y.; Li, X.; et al. Combined Single-Cell Profiling of lncRNAs and Functional Screening Reveals that H19 Is Pivotal for Embryonic Hematopoietic Stem Cell Development. Cell Stem Cell 2019, 24, 285–298.e5. [Google Scholar] [CrossRef]
- Jönsson, M.E.; Wahlestedt, J.N.; Åkerblom, M.; Kirkeby, A.; Malmevik, J.; Brattås, P.L.; Jakobsson, J.; Parmar, M. Comprehensive analysis of microRNA expression in regionalized human neural progenitor cells reveals microRNA-10 as a caudalizing factor. Development 2015, 142, 3166–3177. [Google Scholar] [CrossRef]
- Fico, A.; Fiorenzano, A.; Pascale, E.; Patriarca, E.J.; Minchiotti, G. Long non-coding RNA in stem cell pluripotency and lineage commitment: Functions and evolutionary conservation. Cell. Mol. Life Sci. 2019, 76, 1459–1471. [Google Scholar] [CrossRef]
- Vernay, B.; Koch, M.; Vaccarino, F.; Briscoe, J.; Simeone, A.; Kageyama, R.; Ang, S.-L. Otx2 Regulates Subtype Specification and Neurogenesis in the Midbrain. J. Neurosci. 2005, 25, 4856–4867. [Google Scholar] [CrossRef]
- Ip, J.Y.; Sone, M.; Nashiki, C.; Pan, Q.; Kitaichi, K.; Yanaka, K.; Abe, T.; Takao, K.; Miyakawa, T.; Blencowe, B.J.; et al. Gomafu lncRNA knockout mice exhibit mild hyperactivity with enhanced responsiveness to the psychostimulant methamphetamine. Sci. Rep. 2016, 6, 27204. [Google Scholar] [CrossRef]
- Cai, L.; Tu, L.; Li, T.; Yang, X.; Ren, Y.; Gu, R.; Zhang, Q.; Yao, H.; Qu, X.; Wang, Q.; et al. Downregulation of lncRNA UCA1 ameliorates the damage of dopaminergic neurons, reduces oxidative stress and inflammation in Parkinson’s disease through the inhibition of the PI3K/Akt signaling pathway. Int. Immunopharmacol. 2019, 75, 105734. [Google Scholar] [CrossRef] [PubMed]


Publisher’s Note: MDPI stays neutral with regard to jurisdictional claims in published maps and institutional affiliations. |
© 2021 by the authors. Licensee MDPI, Basel, Switzerland. This article is an open access article distributed under the terms and conditions of the Creative Commons Attribution (CC BY) license (http://creativecommons.org/licenses/by/4.0/).
Share and Cite
Nilsson, F.; Storm, P.; Sozzi, E.; Hidalgo Gil, D.; Birtele, M.; Sharma, Y.; Parmar, M.; Fiorenzano, A. Single-Cell Profiling of Coding and Noncoding Genes in Human Dopamine Neuron Differentiation. Cells 2021, 10, 137. https://doi.org/10.3390/cells10010137
Nilsson F, Storm P, Sozzi E, Hidalgo Gil D, Birtele M, Sharma Y, Parmar M, Fiorenzano A. Single-Cell Profiling of Coding and Noncoding Genes in Human Dopamine Neuron Differentiation. Cells. 2021; 10(1):137. https://doi.org/10.3390/cells10010137
Chicago/Turabian StyleNilsson, Fredrik, Petter Storm, Edoardo Sozzi, David Hidalgo Gil, Marcella Birtele, Yogita Sharma, Malin Parmar, and Alessandro Fiorenzano. 2021. "Single-Cell Profiling of Coding and Noncoding Genes in Human Dopamine Neuron Differentiation" Cells 10, no. 1: 137. https://doi.org/10.3390/cells10010137
APA StyleNilsson, F., Storm, P., Sozzi, E., Hidalgo Gil, D., Birtele, M., Sharma, Y., Parmar, M., & Fiorenzano, A. (2021). Single-Cell Profiling of Coding and Noncoding Genes in Human Dopamine Neuron Differentiation. Cells, 10(1), 137. https://doi.org/10.3390/cells10010137