
Sensitivity and Specificity of CD19.CAR-T Cell Detection by Flow Cytometry and PCR

 and
and 
Abstract
:1. Introduction
2. Materials and Methods
2.1. PBMCs from Healthy Donors and Patients
2.2. Manufacturing of 3rd Generation CD19.CAR-T Cells
2.3. Flow Cytometry
2.4. Quantitative Real-Time PCR (qPCR)
2.5. Data Analysis
3. Results
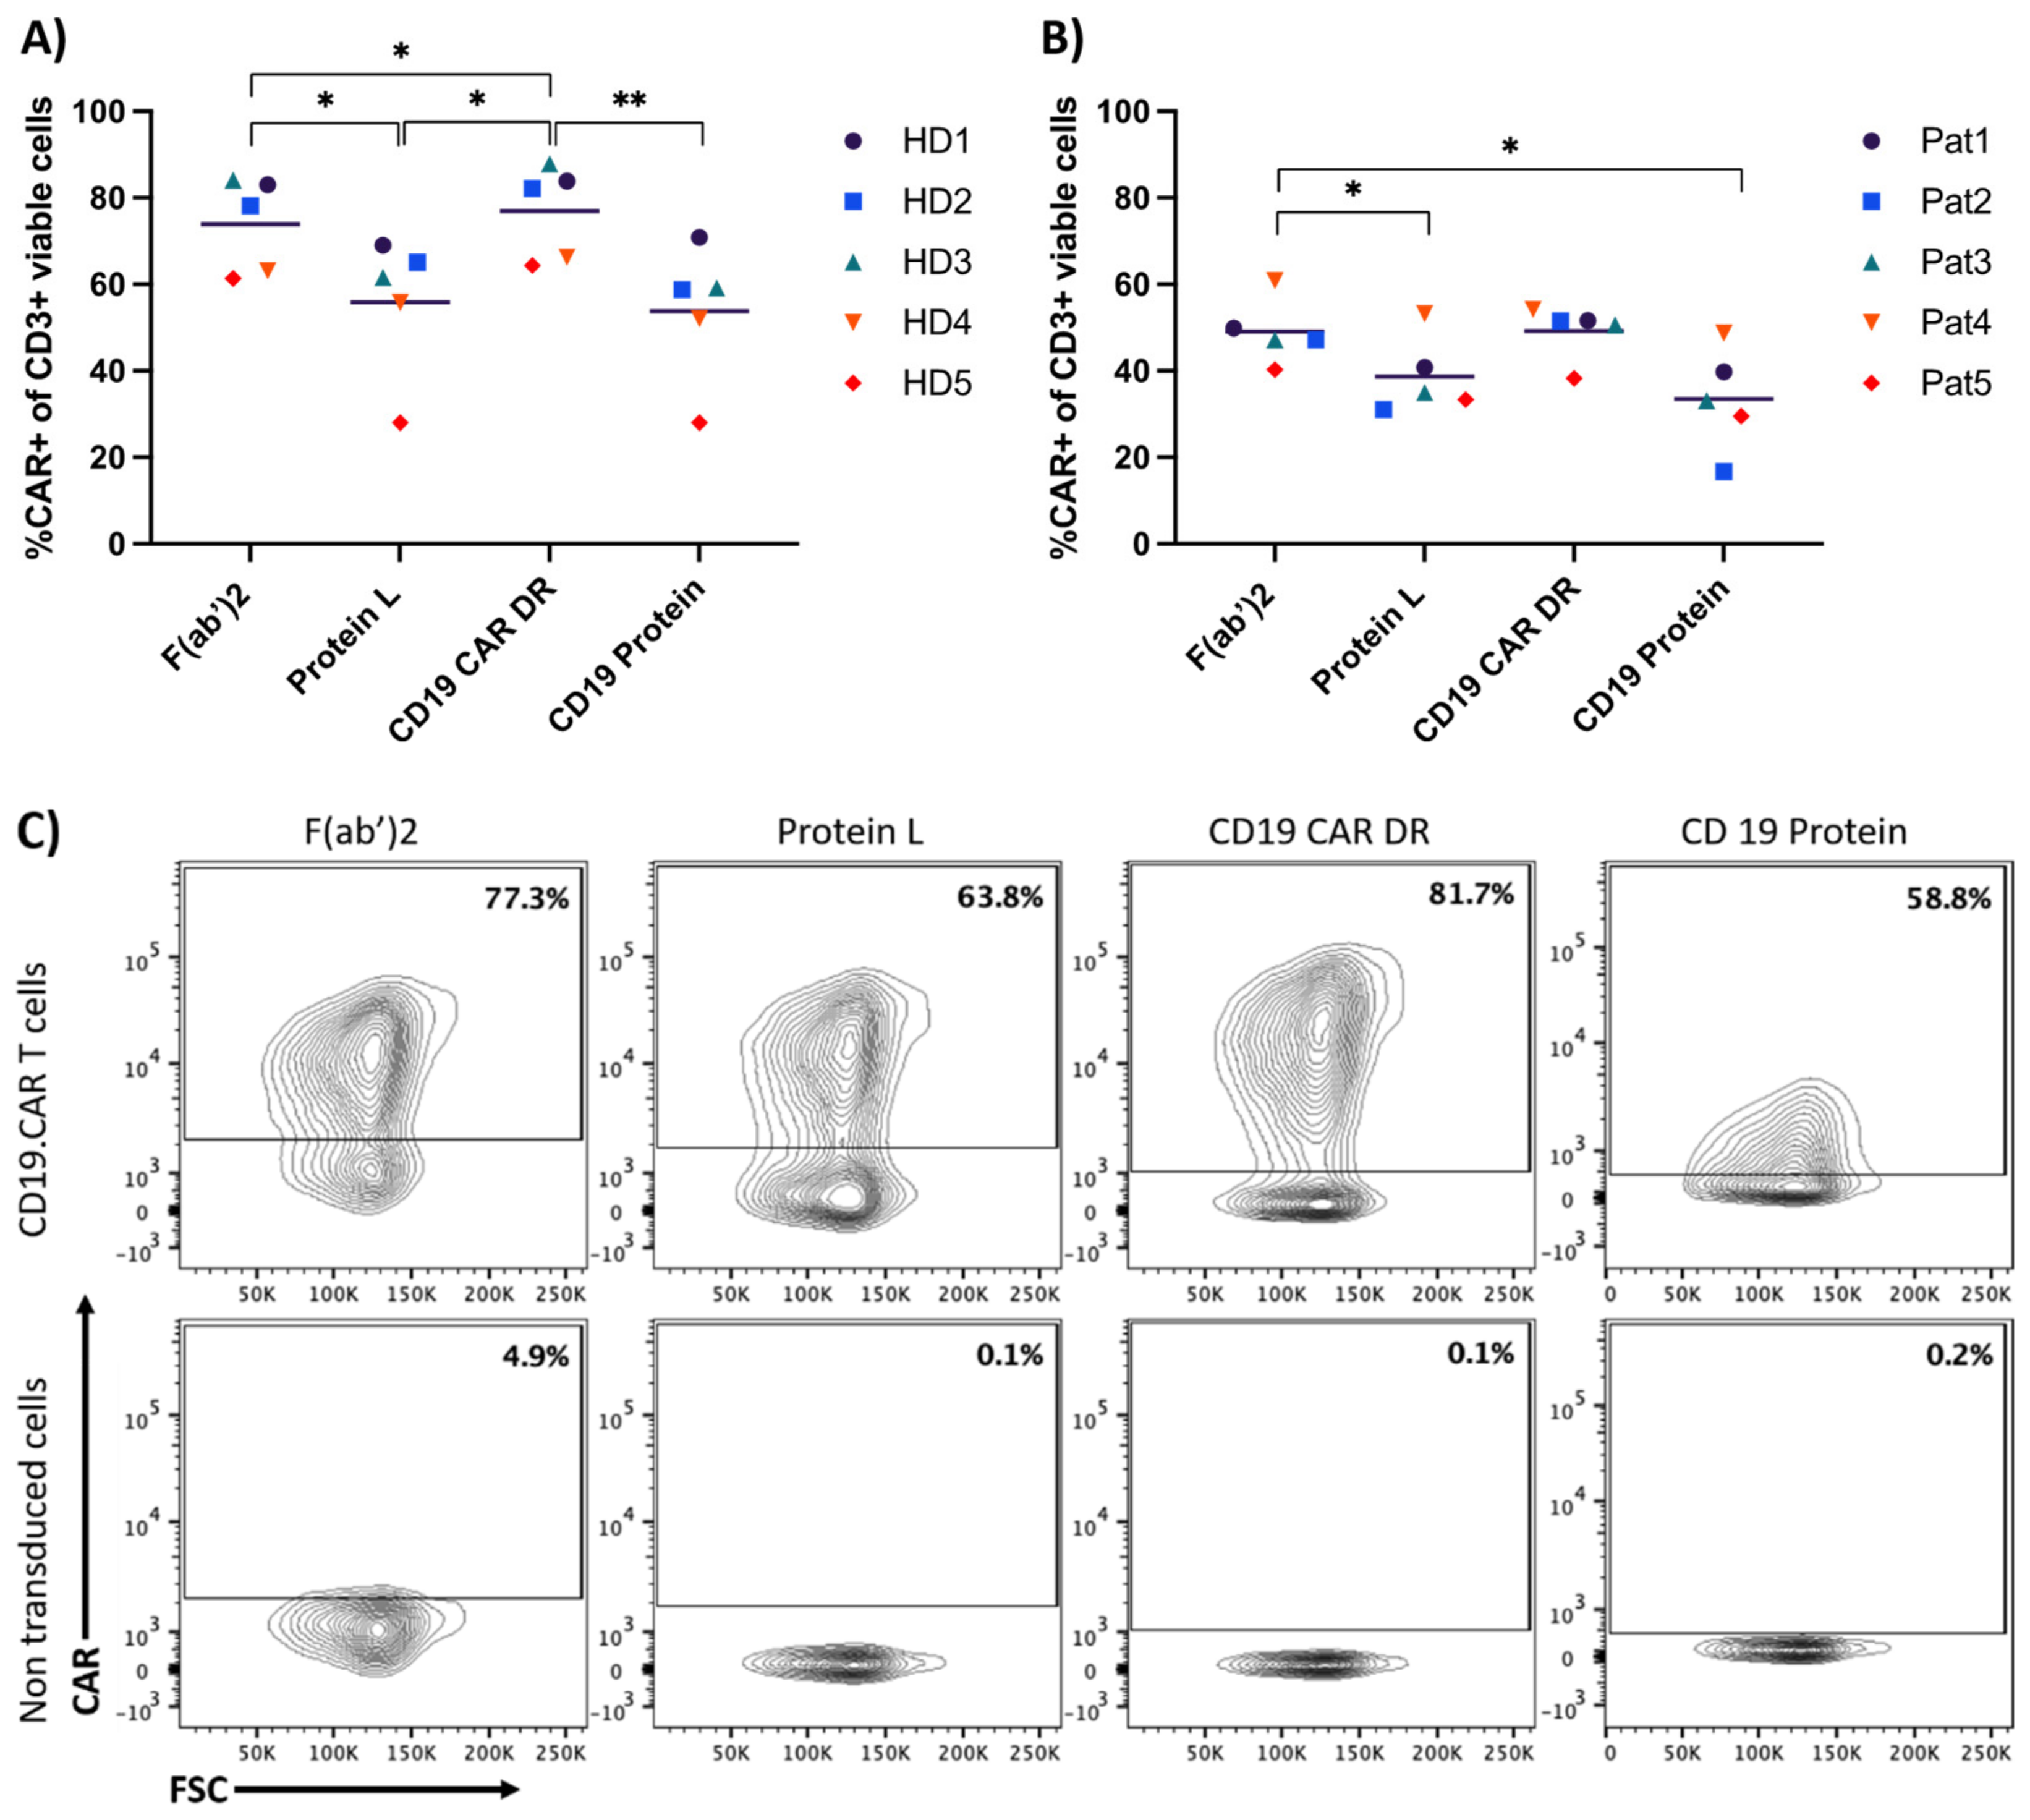
3.1. Comparison of Four Different Detection Reagents
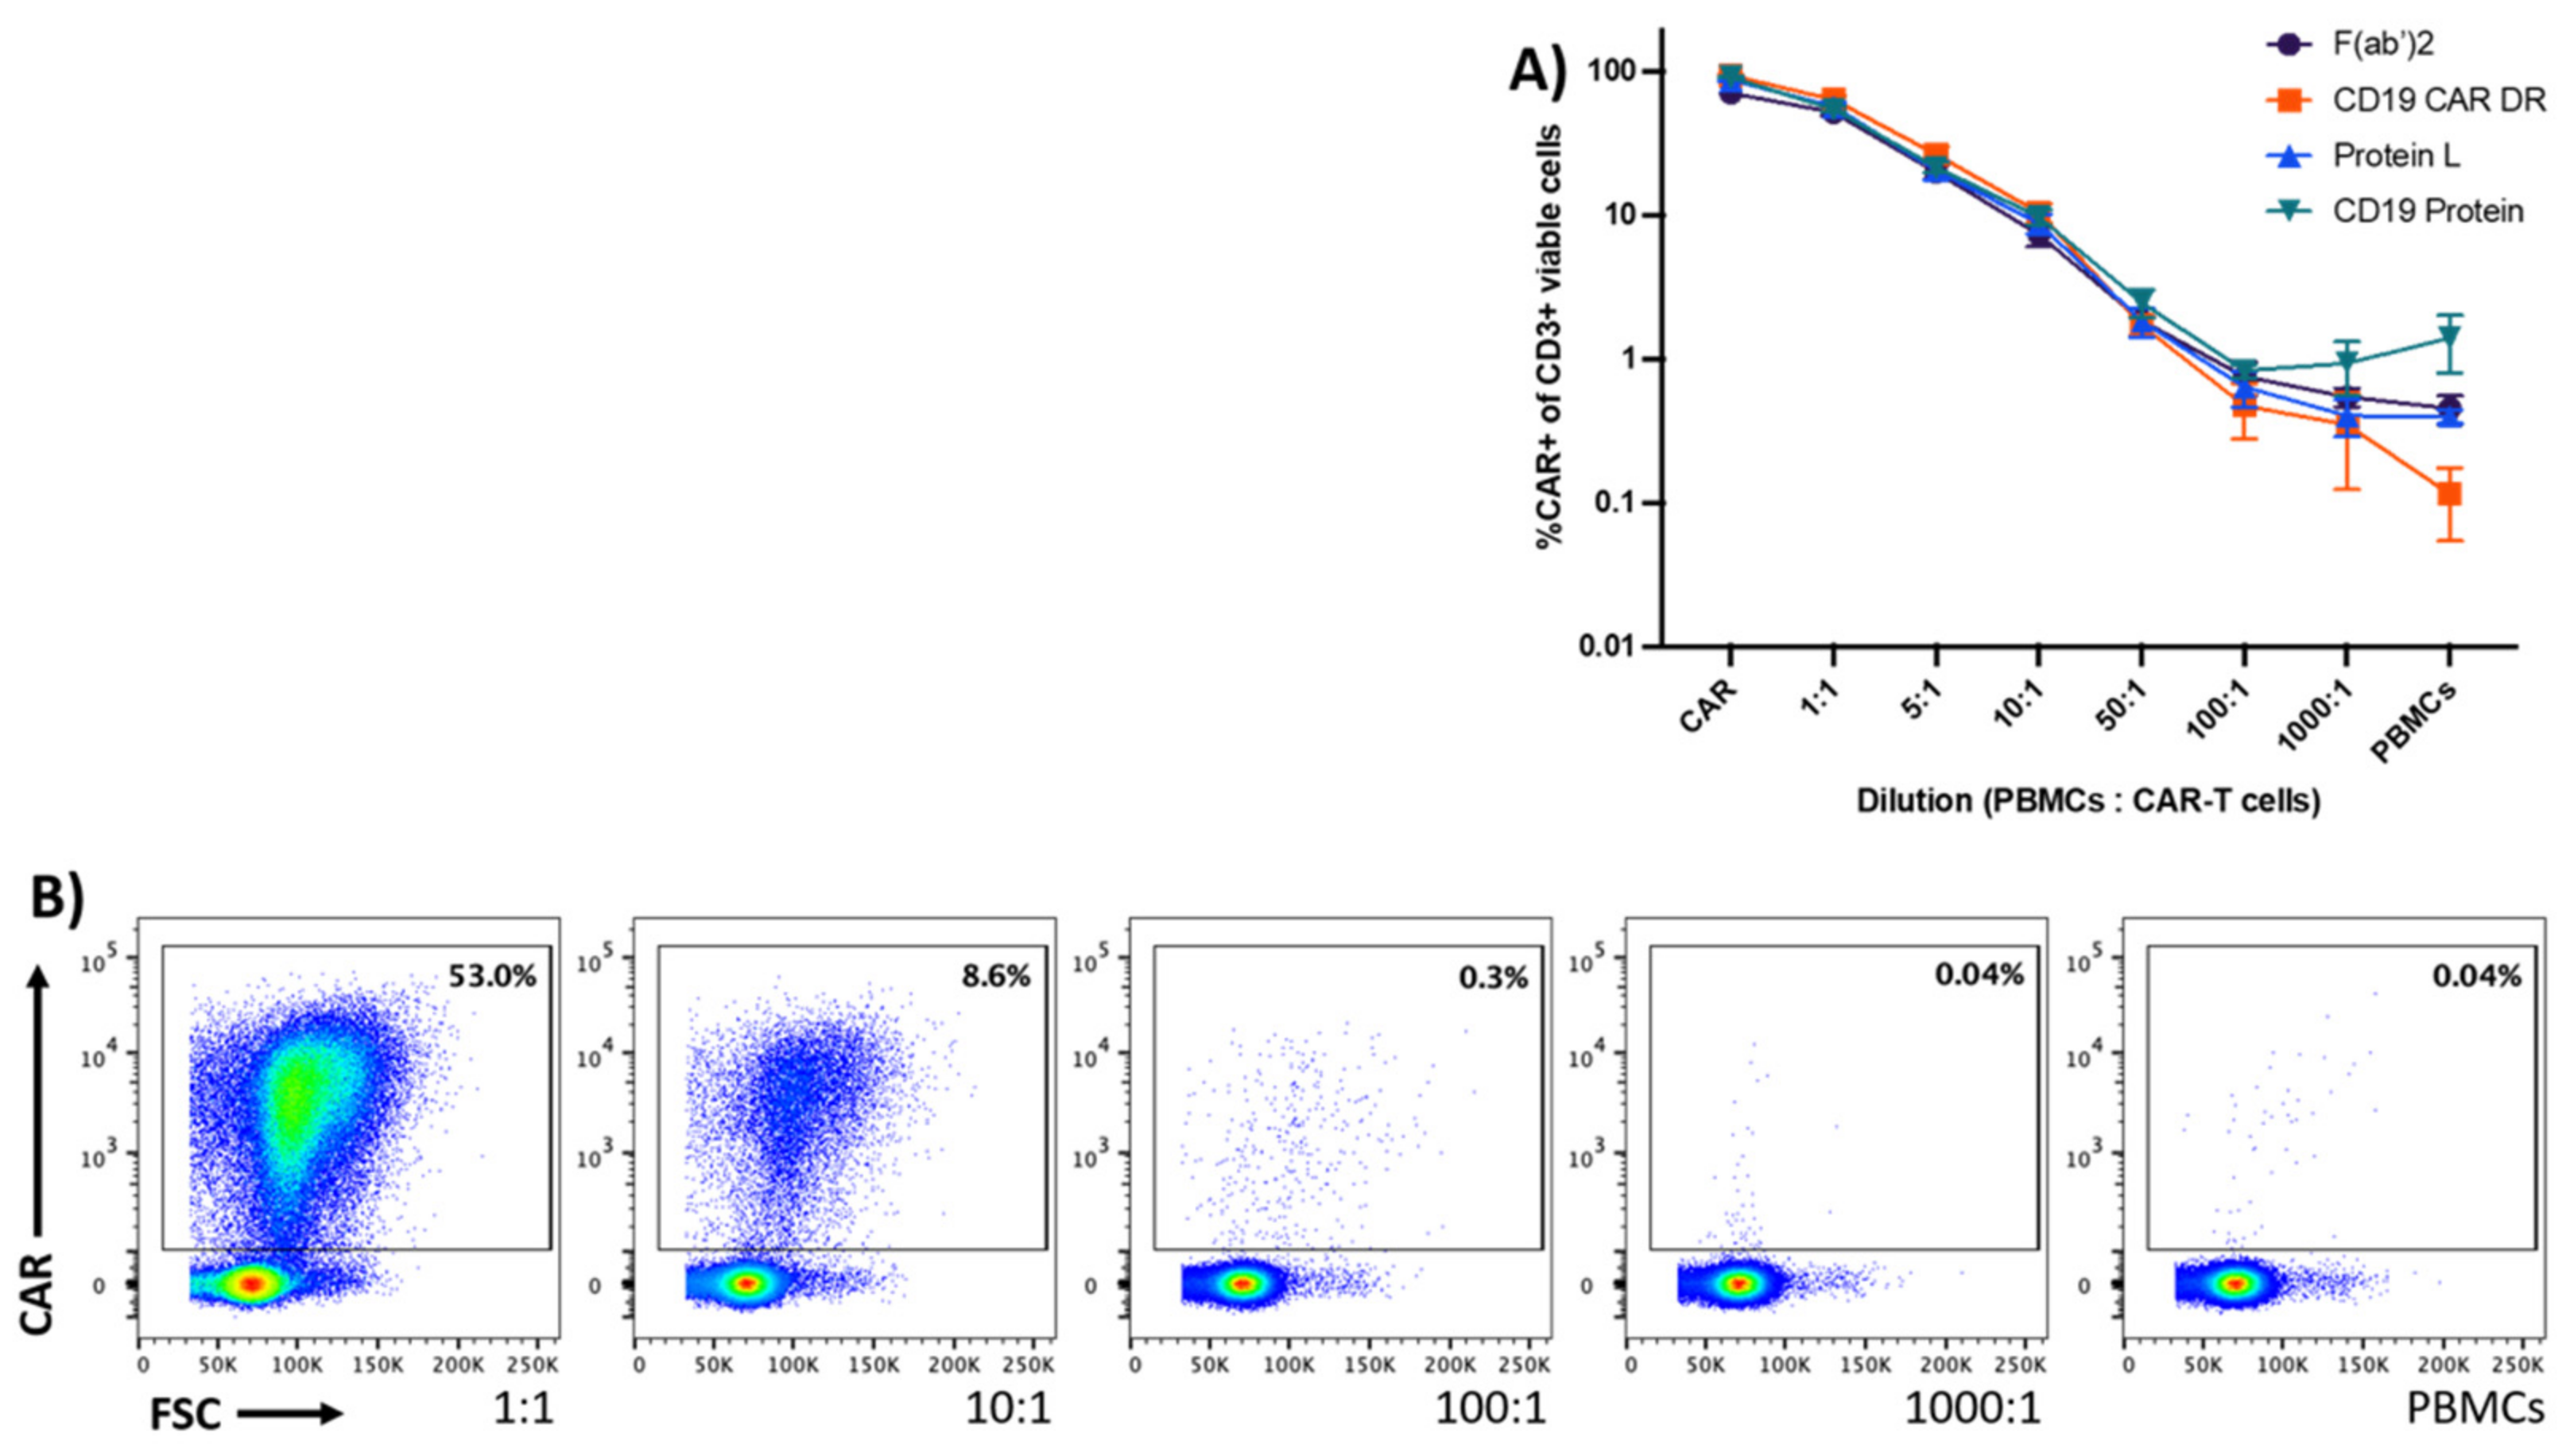
3.2. Sensitivity
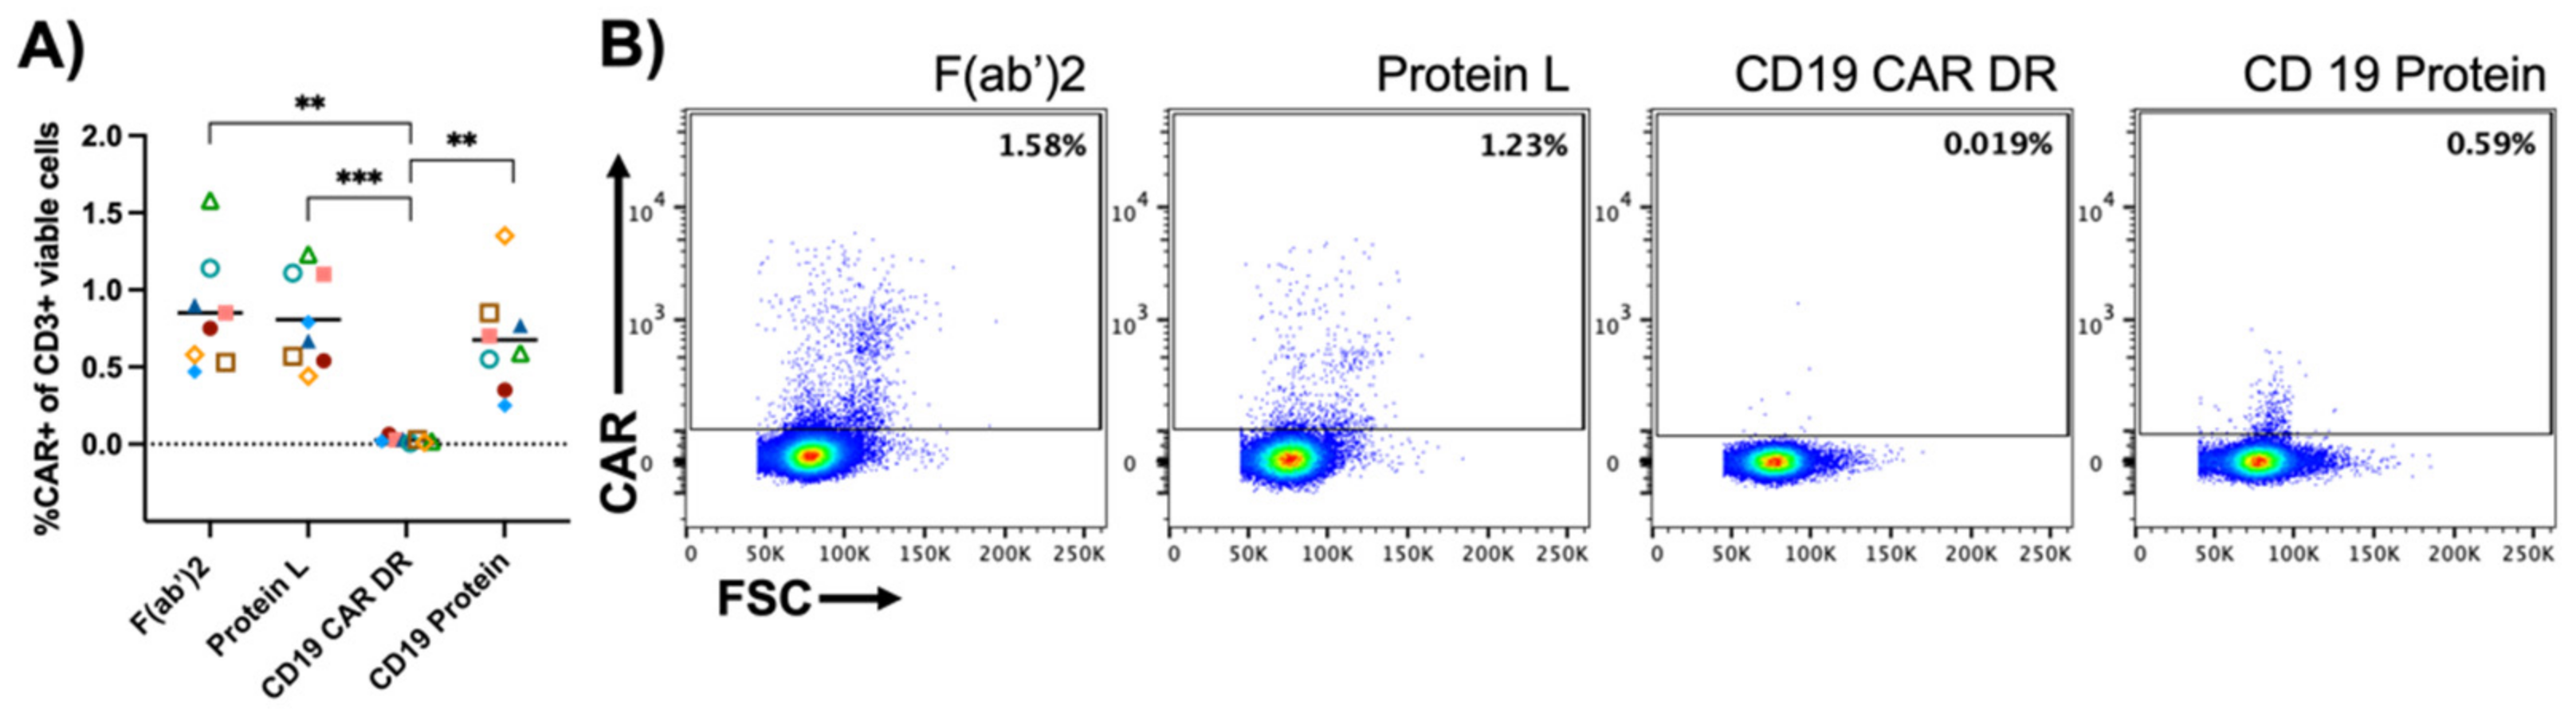
3.3. Specificity
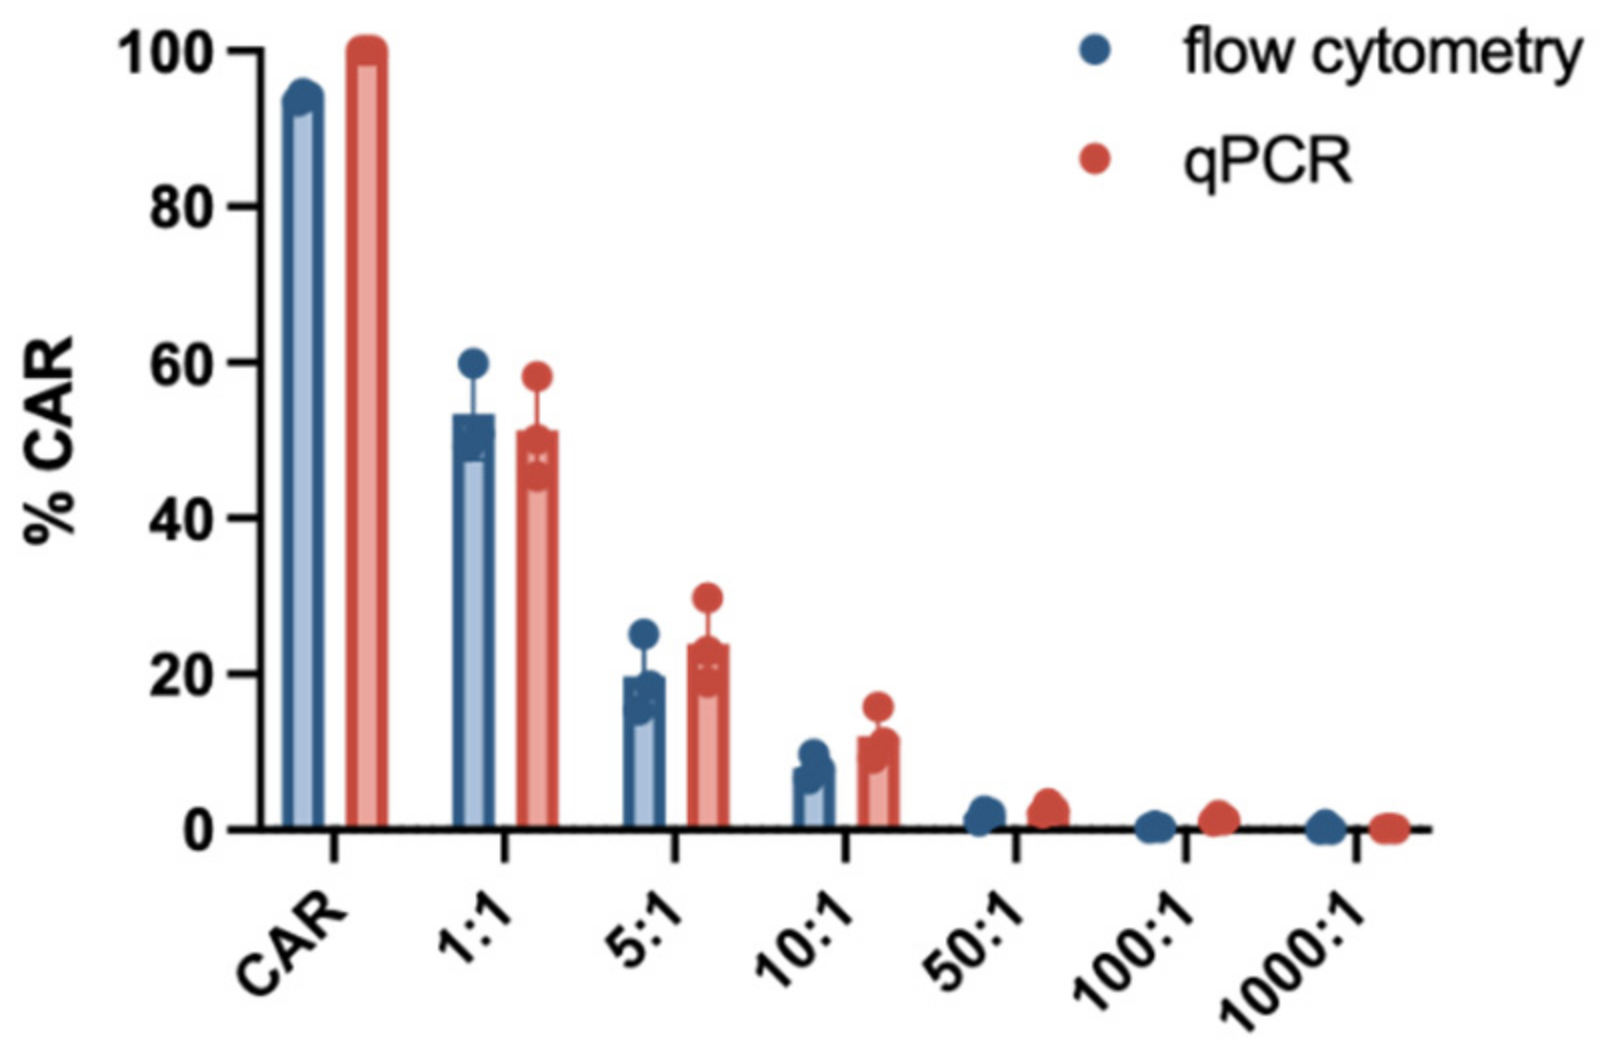
3.4. Comparison of Flow Cytometry and qPCR for CD19.CAR-T Cell Detection
4. Discussion
Supplementary Materials
Author Contributions
Funding
Institutional Review Board Statement
Informed Consent Statement
Conflicts of Interest
References
- Dreger, P.; Dietrich, S.; Schubert, M.L.; Selberg, L.; Bondong, A.; Wegner, M.; Stadtherr, P.; Kimmich, C.; Kosely, F.; Schmitt, A.; et al. CAR T cells or allogeneic transplantation as standard of care for advanced large B-cell lymphoma: An intent-to-treat comparison. Blood Adv. 2020, 4, 6157–6168. [Google Scholar] [CrossRef] [PubMed]
- Maude, S.L.; Laetsch, T.W.; Buechner, J.; Rives, S.; Boyer, M.; Bittencourt, H.; Bader, P.; Verneris, M.R.; Stefanski, H.E.; Myers, G.D.; et al. Tisagenlecleucel in Children and Young Adults with B-Cell Lymphoblastic Leukemia. N. Engl. J. Med. 2018, 378, 439–448. [Google Scholar] [CrossRef] [PubMed]
- Neelapu, S.S.; Locke, F.L.; Bartlett, N.L.; Lekakis, L.J.; Miklos, D.B.; Jacobson, C.A.; Braunschweig, I.; Oluwole, O.O.; Siddiqi, T.; Lin, Y.; et al. Axicabtagene Ciloleucel CAR T-Cell Therapy in Refractory Large B-Cell Lymphoma. N. Engl. J. Med. 2017, 377, 2531–2544. [Google Scholar] [CrossRef]
- Litwin, V.; Hanafi, L.; Mathieu, M.; Pouliot, P.; Boulais, P. Strategies for successful monitoring of CAR T-cells by flow cytometry. Cytotherapy 2020, 22, S130. [Google Scholar] [CrossRef]
- Rafiq, S.; Hackett, C.S.; Brentjens, R.J. Engineering strategies to overcome the current roadblocks in CAR T cell therapy. Nat. Rev. Clin. Oncol. 2020, 17, 147–167. [Google Scholar] [CrossRef]
- Tokarew, N.; Ogonek, J.; Endres, S.; von Bergwelt-Baildon, M.; Kobold, S. Teaching an old dog new tricks: Next-generation CAR T cells. Br. J. Cancer 2019, 120, 26–37. [Google Scholar] [CrossRef] [Green Version]
- Porter, D.L.; Hwang, W.T.; Frey, N.V.; Lacey, S.F.; Shaw, P.A.; Loren, A.W.; Bagg, A.; Marcucci, K.T.; Shen, A.; Gonzalez, V.; et al. Chimeric antigen receptor T cells persist and induce sustained remissions in relapsed refractory chronic lymphocytic leukemia. Sci. Transl. Med. 2015, 7, 303ra139. [Google Scholar] [CrossRef] [PubMed] [Green Version]
- McLellan, A.D.; Ali Hosseini Rad, S.M. Chimeric antigen receptor T cell persistence and memory cell formation. Immunol. Cell Biol. 2019, 97, 664–674. [Google Scholar] [CrossRef] [PubMed]
- Schubert, M.L.; Schmitt, M.; Wang, L.; Ramos, C.A.; Jordan, K.; Muller-Tidow, C.; Dreger, P. Side-effect management of chimeric antigen receptor (CAR) T-cell therapy. Ann. Oncol. 2021, 32, 34–48. [Google Scholar] [CrossRef]
- Bonifant, C.L.; Jackson, H.J.; Brentjens, R.J.; Curran, K.J. Toxicity and management in CAR T-cell therapy. Mol. Oncolytics 2016, 3, 16011. [Google Scholar] [CrossRef]
- Brentjens, R.J.; Riviere, I.; Park, J.H.; Davila, M.L.; Wang, X.; Stefanski, J.; Taylor, C.; Yeh, R.; Bartido, S.; Borquez-Ojeda, O.; et al. Safety and persistence of adoptively transferred autologous CD19-targeted T cells in patients with relapsed or chemotherapy refractory B-cell leukemias. Blood 2011, 118, 4817–4828. [Google Scholar] [CrossRef] [PubMed]
- Yu, S.; Yi, M.; Qin, S.; Wu, K. Next generation chimeric antigen receptor T cells: Safety strategies to overcome toxicity. Mol. Cancer 2019, 18, 125. [Google Scholar] [CrossRef]
- Turtle, C.J.; Hanafi, L.A.; Berger, C.; Hudecek, M.; Pender, B.; Robinson, E.; Hawkins, R.; Chaney, C.; Cherian, S.; Chen, X.; et al. Immunotherapy of non-Hodgkin’s lymphoma with a defined ratio of CD8+ and CD4+ CD19-specific chimeric antigen receptor-modified T cells. Sci. Transl. Med. 2016, 8, 355ra116. [Google Scholar] [CrossRef] [PubMed] [Green Version]
- Maude, S.L.; Frey, N.; Shaw, P.A.; Aplenc, R.; Barrett, D.M.; Bunin, N.J.; Chew, A.; Gonzalez, V.E.; Zheng, Z.; Lacey, S.F.; et al. Chimeric antigen receptor T cells for sustained remissions in leukemia. N. Engl. J. Med. 2014, 371, 1507–1517. [Google Scholar] [CrossRef] [PubMed] [Green Version]
- Kochenderfer, J.N.; Wilson, W.H.; Janik, J.E.; Dudley, M.E.; Stetler-Stevenson, M.; Feldman, S.A.; Maric, I.; Raffeld, M.; Nathan, D.A.; Lanier, B.J.; et al. Eradication of B-lineage cells and regression of lymphoma in a patient treated with autologous T cells genetically engineered to recognize CD19. Blood 2010, 116, 4099–4102. [Google Scholar] [CrossRef]
- Kunz, A.; Gern, U.; Schmitt, A.; Neuber, B.; Wang, L.; Hückelhoven-Krauss, A.; Michels, B.; Hofmann, S.; Müller-Tidow, C.; Dreger, P.; et al. Optimized Assessment of qPCR-Based Vector Copy Numbers as a Safety Parameter for GMP-Grade CAR T Cells and Monitoring of Frequency in Patients. Mol. Ther. Methods Clin. Dev. 2020, 17, 448–454. [Google Scholar] [CrossRef]
- Schubert, M.L.; Kunz, A.; Schmitt, A.; Neuber, B.; Wang, L.; Hückelhoven-Krauss, A.; Langner, S.; Michels, B.; Wick, A.; Daniel, V.; et al. Assessment of CAR T Cell Frequencies in Axicabtagene Ciloleucel and Tisagenlecleucel Patients Using Duplex Quantitative PCR. Cancers 2020, 12, 2820. [Google Scholar] [CrossRef]
- Hulspas, R.; O’Gorman, M.R.G.; Wood, B.L.; Gratama, J.W.; Sutherland, D.R. Considerations for the control of background fluorescence in clinical flow cytometry. Cytom. Part B Clin. Cytom. 2009, 76B, 355–364. [Google Scholar] [CrossRef]
- Hu, Y.; Huang, J. The Chimeric Antigen Receptor Detection Toolkit. Front. Immunol. 2020, 11, 1770. [Google Scholar] [CrossRef]
- Zheng, Z.; Chinnasamy, N.; Morgan, R.A. Protein L: A novel reagent for the detection of chimeric antigen receptor (CAR) expression by flow cytometry. J. Transl. Med. 2012, 10, 29. [Google Scholar] [CrossRef] [Green Version]
- Nilson, B.H.K.; Lögdberg, L.; Kastern, W.; Björck, L.; Åkerström, B. Purification of antibodies using protein L-binding framework structures in the light chain variable domain. J. Immunol. Methods 1993, 164, 33–40. [Google Scholar] [CrossRef]
- Korell, F.; Laier, S.; Sauer, S.; Veelken, K.; Hennemann, H.; Schubert, M.L.; Sauer, T.; Pavel, P.; Mueller-Tidow, C.; Dreger, P.; et al. Current Challenges in Providing Good Leukapheresis Products for Manufacturing of CAR-T Cells for Patients with Relapsed/Refractory NHL or ALL. Cells 2020, 9, 1225. [Google Scholar] [CrossRef]
- Hoffmann, J.-M.; Schubert, M.-L.; Wang, L.; Hückelhoven, A.; Sellner, L.; Stock, S.; Schmitt, A.; Kleist, C.; Gern, U.; Loskog, A.; et al. Differences in Expansion Potential of Naive Chimeric Antigen Receptor T Cells from Healthy Donors and Untreated Chronic Lymphocytic Leukemia Patients. Front. Immunol. 2018, 8, 1956. [Google Scholar] [CrossRef] [Green Version]
- Fraietta, J.A.; Lacey, S.F.; Orlando, E.J.; Pruteanu-Malinici, I.; Gohil, M.; Lundh, S.; Boesteanu, A.C.; Wang, Y.; O’Connor, R.S.; Hwang, W.T.; et al. Determinants of response and resistance to CD19 chimeric antigen receptor (CAR) T cell therapy of chronic lymphocytic leukemia. Nat. Med. 2018, 24, 563–571. [Google Scholar] [CrossRef] [PubMed]
- Walker, A.J.; Majzner, R.G.; Zhang, L.; Wanhainen, K.; Long, A.H.; Nguyen, S.M.; Lopomo, P.; Vigny, M.; Fry, T.J.; Orentas, R.J.; et al. Tumor Antigen and Receptor Densities Regulate Efficacy of a Chimeric Antigen Receptor Targeting Anaplastic Lymphoma Kinase. Mol. Ther. 2017, 25, 2189–2201. [Google Scholar] [CrossRef] [PubMed] [Green Version]
- Yang, Y.; Kohler, M.E.; Chien, C.D.; Sauter, C.T.; Jacoby, E.; Yan, C.; Hu, Y.; Wanhainen, K.; Qin, H.; Fry, T.J. TCR engagement negatively affects CD8 but not CD4 CAR T cell expansion and leukemic clearance. Sci. Transl. Med. 2017, 9, eaag1209. [Google Scholar] [CrossRef] [PubMed] [Green Version]


Publisher’s Note: MDPI stays neutral with regard to jurisdictional claims in published maps and institutional affiliations. |
© 2021 by the authors. Licensee MDPI, Basel, Switzerland. This article is an open access article distributed under the terms and conditions of the Creative Commons Attribution (CC BY) license (https://creativecommons.org/licenses/by/4.0/).
Share and Cite
Schanda, N.; Sauer, T.; Kunz, A.; Hückelhoven-Krauss, A.; Neuber, B.; Wang, L.; Hinkelbein, M.; Sedloev, D.; He, B.; Schubert, M.-L.; et al. Sensitivity and Specificity of CD19.CAR-T Cell Detection by Flow Cytometry and PCR. Cells 2021, 10, 3208. https://doi.org/10.3390/cells10113208
Schanda N, Sauer T, Kunz A, Hückelhoven-Krauss A, Neuber B, Wang L, Hinkelbein M, Sedloev D, He B, Schubert M-L, et al. Sensitivity and Specificity of CD19.CAR-T Cell Detection by Flow Cytometry and PCR. Cells. 2021; 10(11):3208. https://doi.org/10.3390/cells10113208
Chicago/Turabian StyleSchanda, Nicola, Tim Sauer, Alexander Kunz, Angela Hückelhoven-Krauss, Brigitte Neuber, Lei Wang, Mandy Hinkelbein, David Sedloev, Bailin He, Maria-Luisa Schubert, and et al. 2021. "Sensitivity and Specificity of CD19.CAR-T Cell Detection by Flow Cytometry and PCR" Cells 10, no. 11: 3208. https://doi.org/10.3390/cells10113208