Article

A Genome-Wide Screen in Saccharomyces cerevisiae Reveals a Critical Role for Oxidative Phosphorylation in Cellular Tolerance to Lithium Hexafluorophosphate

1
State Key Laboratory of Subtropical Silviculture, School of Forestry and Biotechnology, Zhejiang A&F University, Lin’an, Hangzhou 311300, China
2
Department of Chemistry and Molecular Biology, University of Gothenburg, Medicinaregatan 9C, SE-413 90 Goteborg, Sweden
3
Center for Large-Scale Cell-Based Screening, Faculty of Science, University of Gothenburg, Medicinaregatan 9C, SE-413 90 Goteborg, Sweden
*
Authors to whom correspondence should be addressed.
These authors contributed equally.
Cells 2021, 10(4), 888; https://doi.org/10.3390/cells10040888
Submission received: 31 January 2021 / Revised: 7 April 2021 / Accepted: 12 April 2021 / Published: 13 April 2021
(This article belongs to the Section Plant, Algae and Fungi Cell Biology)

Abstract

:
Lithium hexafluorophosphate (LiPF6) is one of the leading electrolytes in lithium-ion batteries, and its usage has increased tremendously in the past few years. Little is known, however, about its potential environmental and biological impacts. In order to improve our understanding of the cytotoxicity of LiPF6 and the specific cellular response mechanisms to it, we performed a genome-wide screen using a yeast (Saccharomyces cerevisiae) deletion mutant collection and identified 75 gene deletion mutants that showed LiPF6 sensitivity. Among these, genes associated with mitochondria showed the most enrichment. We also found that LiPF6 is more toxic to yeast than lithium chloride (LiCl) or sodium hexafluorophosphate (NaPF6). Physiological analysis showed that a high concentration of LiPF6 caused mitochondrial damage, reactive oxygen species (ROS) accumulation, and ATP content changes. Compared with the results of previous genome-wide screening for LiCl-sensitive mutants, we found that oxidative phosphorylation-related mutants were specifically hypersensitive to LiPF6. In these deletion mutants, LiPF6 treatment resulted in higher ROS production and reduced ATP levels, suggesting that oxidative phosphorylation-related genes were important for counteracting LiPF6-induced toxicity. Taken together, our results identified genes specifically involved in LiPF6-modulated toxicity, and demonstrated that oxidative stress and ATP imbalance maybe the driving factors in governing LiPF6-induced toxicity.

1. Introduction

Lithium-ion batteries are widely used, worldwide, in the field of electronic and electrical appliances, especially in new energy vehicles. As a result, demand and production of lithium-ion batteries has continued to grow rapidly in recent years [1,2,3]. With the disposal of spent lithium-ion batteries, increased concentrations of lithium-containing compounds are entering the environment, resulting in a potential contamination and threat to all types of organisms, including animals, plants, and microbes. Lithium hexafluorophosphate (LiPF6) is one of the leading electrolytes in lithium-ion batteries [4]. It can undergo chemical reactions, such as hydrolysis, decomposition, and combustion, to produce fluorine- and lithium-containing compounds, and might lead to fluorine and lithium toxicity [5].
Lithium is not an essential element for life and it usually occurs in soil and water at a low concentration. Low levels of lithium have many beneficial effects on living organisms, such as DNA synthesis and repair in microbes [6], plant growth stimulation [7], and life span extension in Drosophila [8]. Lithium has also been a pharmacological therapeutic option for bipolar disorder [9]. However, high levels of lithium are toxic, as evidenced by the induction of necrotic lesions in plants [10], and various acute and chronic responses in humans and animals [11]. To date, studies regarding the underlying mechanism of lithium toxicity have mainly suggested an association with oxidative stress and ion homeostasis disruption [11]. High concentrations of lithium have been reported to induce high reactive oxygen species (ROS) formation and to reduce mitochondrial membrane potential, which together contribute to limited energy production and lipid peroxidation [12,13,14]. Additionally, lithium can replace other cations (Na+, K+, Ca+), and specifically competes with magnesium ions (Mg2+), thus interrupting ion channel activity, Na+/K+ homeostasis, and the activity of magnesium-containing enzymes [15,16,17]. Other studies have indicated that lithium in high concentrations alters nucleic acid and protein biosynthesis [17], as well as introduces endoplasmic reticulum stress and N-glycan modification in certain conditions [18]. Likewise, fluorine is also toxic to cells, and hexafluorophosphates quaternary ammonium salts has been reported to lead to oxidative stress [19]. Fluorine can also induce cell apoptosis [20] and is toxic to the central nervous system, affecting neuron cell activity and ion transport [21].
Although some basic mechanisms of lithium toxicity have been revealed, the lithium compounds used in most studies are lithium chloride (LiCl), lithium hydroxide (LiOH), and lithium carbonate (Li2CO3) [5,7,13,22,23,24]. In contrast, limited information is available regarding the cytotoxicity mechanism of hexafluorophosphate or the comprehensive impacts of fluorine and lithium caused by contamination from lithium-ion batteries. It is also not clear whether similar mechanisms are utilized by cells to protect themselves from these toxins, compared with the more-studied lithium-containing compounds. Thus, it is important to investigate LiPF6 specifically, as a representative stressor, to characterize the mechanism of toxicity of lithium-ion battery contamination and the specific responses of cells to it.
The yeast model has been used extensively to study the toxicity and targets of various chemicals and drugs, due to the genetic similarity of yeast to other eukaryotes, and the diverse yeast collections available to researchers [25,26,27,28]. In previous work, a genome-scale genetic screen of the yeast non-essential gene deletion library identified 114 LiCl-sensitive and 6 LiCl-tolerant mutations [29]. In the present study, we first evaluated and compared the cytotoxicity of LiPF6, LiCl, and NaPF6 in Saccharomyces cerevisiae, and confirmed that the cytotoxicity of LiPF6 is different from that of LiCl and NaPF6 at the same concentration. High concentrations of LiPF6 can induce mitochondrial dysfunction, oxidative stress, and lowered ATP yield. Then, using the yeast deletion collection [30,31], a genome-wide screen was performed to identify the specific genes involved in LiPF6-mediated cytotoxicity. We identified 75 genes that may contribute to LiPF6 tolerance. These genes had not been previously reported to modulate LiPF6 resistance, and only a few of them were found to overlap with previously identified LiCl-sensitive genes [29]. This implies the existence of specific toxicity of LiPF6 and specific cellular responses to it. In further research, we found that oxidative phosphorylation-related genes are required for tolerance to LiPF6 and counteraction of LiPF6-induced ROS accumulation. Deletion of these genes also reduced ATP yield under LiPF6 treatment. Not only did our study reveal that the toxicity of LiPF6 is not a simple superposition of two ion poisons (Li+ and PF6), but also elucidated the processes by which LiPF6 induces cytotoxicity and the cellular responses to LiPF6.

2. Materials and Methods

2.1. Growth Curve Measurement

BY4741was cultivated in yeast peptone dextrose (YPD) medium (1% yeast extract, 2% peptone, and 2% glucose) overnight and then diluted to an OD600 of 0.1 in YPD supplemented with 0 mM, 1 mM, 2 mM, 3 mM, 4 mM, and 5 mM of LiPF6 (dissolved in ddH2O, L822100, Macklin, Shanghai, CN), LiCl (dissolved in ddH2O, L9650, Sigma-Aldrich, St. Louis, MO, USA), NaPF6 (dissolved in ddH2O, 208051, Sigma-Aldrich, St. Louis, MO, USA), or both LiCl and NaPF6. The cell density of the cultures was determined, using a spectrophotometer (Ultrospec 2100 Pro, Biochrom, St. Albans, UK), at different time points from 0 to 24 h. The growth curve of BY4741 in yeast peptone glycerol (YPG) medium (1% yeast extract, 2% peptone, and 3% glycerol) with 0 mM or 4 mM LiPF6 was measured from 0 to 144 h, as described above.

2.2. Inhibition Zone Experiment

The toxicity of LiPF6, LiCl, and NaPF6 to yeast was evaluated through the filter diffusion method. The yeast strain was first spread on solid media. Meanwhile, the filters were soaked in different concentrations of three compounds, respectively. Then, the filters were placed on the culture dishes coated with the yeast and plates were cultured at 30 °C for 24 h for the detection of the inhibition zone. The inhibition zone of each sample was measured using a ruler and photographs of the different plates were taken.

2.3. Genome-Wide LiPF6 Screen

The collection of nonessential haploid MATa deletion strains used to make the synthetic genetic array (SGA) collection was derived from BY4741, and was a gift provided by Prof. Charles Boone (Toronto University, Toronto, ON, Canada) [31,32]. The strains in the collection were arrayed in the 384-format. Firstly, the strains, in 384-well frozen stock plates, were spotted onto YPD agar plates (with G418 added) using 384-pining replicators operated by a Singer Rotor (Singer Instruments, Somerset, UK) and the cells were incubated at 30 °C. Then, each 384-arrayed mutant group was replicated in quadruplicate to yield four identical arrays to eliminate operational differences, each with 384 mutant strains, plated on a single plate containing either no LiPF6 or 3 mM LiPF6 to generate a 1536-density array. These array plates were incubated for 2 days at 30 °C. Images of the plates were taken with Phenobooth (Singer Instruments, Somerset, UK) and growth assessment comparing the growth of individual mutants with or without LiPF6 was performed using SGAtools, as described previously [33]. SGAtools. Available online: http://sgatools.ccbr.utoronto.ca/ (accessed on 13 April 2021). Briefly, high-quality images of the plates were first analyzed by SGAtools to produce raw colony size measurements, and then three important biases in colony size measurements were corrected, including plate effect, row/column effect, and spatial effect. The surrounding strains on each plate array are the control strains for biases correction. Fitness scores were calculated against the control experiment by quantifying the deviation from the expected fitness. Mutants that were sensitive to LiPF6 were selected with a cut-off of less than −0.2, since scores below −0.2 usually indicate a relatively strong effect and based on our previous study most of the hits with a score less than −0.2 can be confirmed by other methods [34]. The experiments were repeated three times and the scores of each mutant in three independent experiments are shown in Table 1.

2.4. Functional Enrichment and Interaction Network Analysis

Enrichment of Gene Ontology (GO) terms in the gene sets of interest was analyzed using the GO Term Finder in the Saccharomyces Genome Database [35]. GO Term Finder. Available online: https://www.yeastgenome.org/goTermFinder (accessed on April 13th, 2021). Enrichment of Kyoto Encyclopedia of Genes and Genomes (KEGG) was analyzed using KOBAS [36]. KOBAS. Available online: http://kobas.cbi.pku.edu.cn/kobas3 (accessed on April 13th, 2021). The background in GO and KEGG enrichment analysis was the list of genes for screening. The functional classification analysis was based on the functional description from the Saccharomyces Genome Database. Saccharomyces Genome Database. Available online: https://www.yeastgenome.org/ (accessed on April 13th, 2021). GeneMANIA was used to analyze the co-localizations and genetic and physical interactions of the LiPF6-sensitive mutants [37]. GeneMANIA. Available online: genemania.org (accessed on April 13th, 2021).

2.5. Complementation Strain Construction and Spot Tests

The plasmids for the complementation assays were extracted from Molecular Barcoded Yeast ORF 1.0 (MoBY ORF 1.0 Library) [38], a gift provided by Prof. Charles Boone (Toronto University, Toronto, ON, Canada). These plasmids all express the URA3 gene, which can be used as a selectable marker. The extracted plasmids and empty vectors were transformed into corresponding deletion mutant strains and transformants were selected on SD-Ura agar plates. The complementation strains were confirmed by PCR with the primers listed in Table S1. For the spot test assays, overnight cultures of different strains were adjusted to an OD600 of 0.1 and cultured at 30 °C to reach the mid-log phase. Then, cultures were serially diluted and spotted on plates with or without LiPF6. After incubation at 30 °C, yeast growth was observed.

2.6. Mitochondrial Morphology Observation

Mitochondrial morphology was observed in wild-type cells expressing the mitochondrial matrix protein Ilv3-GFP or by MitoTracker Red CMXRos (M-7512, ThermoFisher Scientific, Waltham, MA, USA) staining. A strain containing Ilv3-GFP was picked up from the commercial Yeast GFP Clone Collection [39]. Yeast GFP Clone Collection. Available online: www.invitrogen.com/clones (accessed on April 13th, 2021). For staining, pre-cultures were diluted to an OD600 of 0.1 and then cultured in YPD medium with or without LiPF6. After 6 h culture, 1 OD cells were collected and resuspended in 200 μL fresh medium. MitoTracker Red CMXRos was added into cell cultures to a final concentration of 50 nM to stain mitochondria, and was allowed to sit at room temperature for 30 min. Then, cells were washed in phosphate buffered saline (PBS) two times before observation using a Zeiss Axio Observer 7 with Z stacks. The cells with tubular or fragmented mitochondria were counted and the proportion of these cells relative to the larger population of cells was calculated. To ensure the accuracy of the result, at least 200 cells were examined in each sample for each replicate.

2.7. ROS Measurement

ROS levels were measured as previously described [40,41]. Overnight cultures of wild-type and deletion mutant strains were diluted to an OD600 of 0.1 and cells were allowed to grow to reach mid-log phase in SD-His before being treated with 0 mM or 1 mM LiPF6 for 1 h at 30 °C. Then, cells were adjusted to an OD600 of 0.5, and 2 mL of the cultures were collected. Cells were washed twice with PBS, followed by incubation with 10 μM 2′,7′-dichlorofluorescein diacetate (H2DCF-DA) (S0033S, Beyotime, Shanghai, CN) in the dark for 30 min. Cells were washed in PBS two times and fluorescence was observed using a Zeiss Axio Observer 7 with GFP filter lens. For each strain, the proportion of H2DCF-DA-positive cells was calculated, and the fluorescence signal per cell was quantified using ImageJ software, as described previously [41,42]. Briefly, after background fluorescence was removed from the image, the total fluorescence of all the cells was measured and then divided by the number of cells.

2.8. Western Blot

Strains containing GFP-tagged ORF at the C-terminus end were picked up from the commercial Yeast GFP Clone Collection [39]. Yeast GFP Clone Collection. Available online: www.invitrogen.com/clones (accessed on April 13th, 2021). Overnight cultures were diluted to an OD600 of 0.1 and cells were allowed to grow to reach the mid-log phase in SD-His before being treated with 0 mM or 1 mM LiPF6 for 1 h at 30 °C. Then the cells were collected and treated with 0.2 M NaOH for 10 min at room temperature and boiled in HU buffer (200 mM phosphate buffer, pH 6.8, 8 M urea, 5% w/v SDS, 1 mM EDTA, 100 mM DTT, bromophenol blue) for 10 min. Denatured proteins were separated on a 10% SDS-PAGE gel and transferred to a nitrocellulose membrane. After sequential incubation with primary antibody and secondary antibody, signals were detected by using electrochemiluminescence (Amersham Imager 600, GE Healthcare Life Sciences, Boston, MA, USA). Antibodies to GFP (ab6556, Abcam, Cambridge, UK), Flag (14793S, Cell Signaling Technology, Danvers, MA, USA), and Pgk1 (ab113687, Abcam, Cambridge, UK) were used. Pgk1 served as the loading control and bands of Cox5a protein were quantified using ImageJ software.

2.9. Measurement of Mitochondrial ATP Synthesis

ATP synthesis based on isolated mitochondria was measured using a previously described method [43]. Briefly, cells were grown to saturation and diluted to an OD600 of 0.1 in YPD. Cells were grown to an OD600 of 0.5 before treated with 0 or 4 mM LiPF6. After 3 h of incubation, 40 OD cells were collected and lysed with zymolyase followed by two-step centrifugation to obtain crude preparations of mitochondria. Using a firefly luciferin-luciferase assay, the ATP synthetic activity of the mitochondria was determined. The relative ATP synthetic activity was normalized by each protein concentration of different samples determined using the Bradford method [44].

3. Results

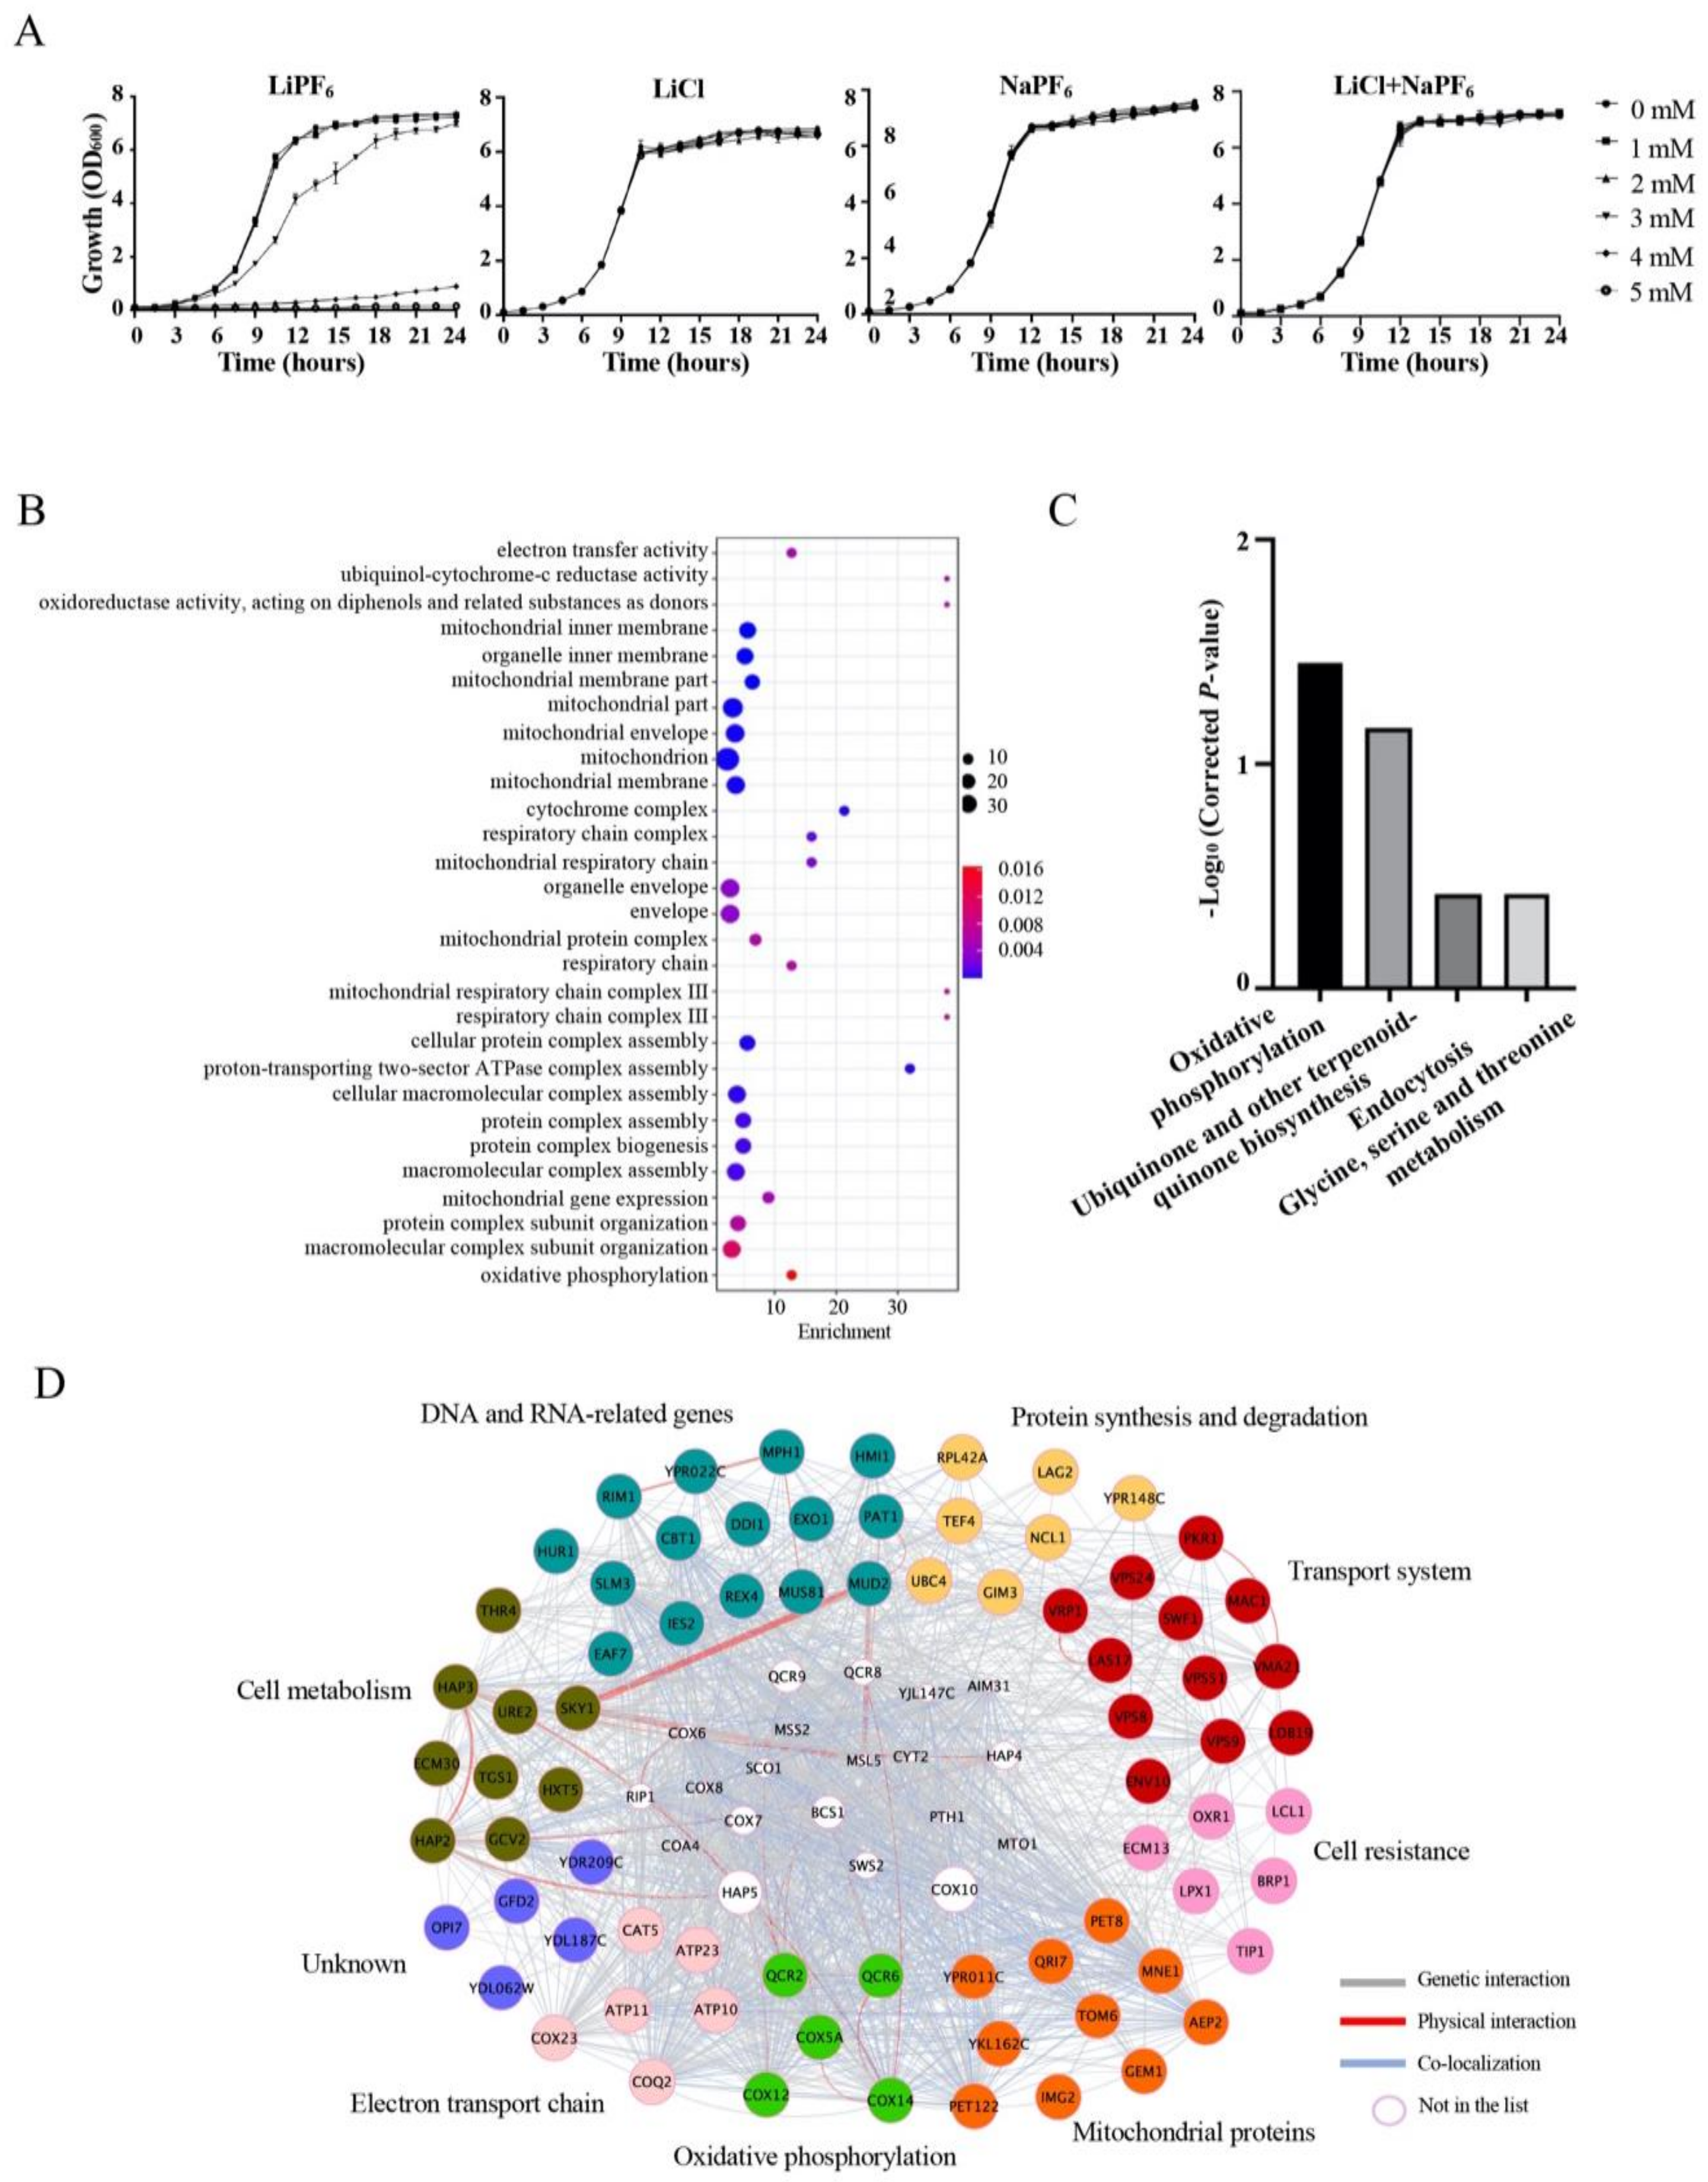
3.1. Growth in LiPF6-, LiCl-, and NaPF6-Supplemented Medium

We monitored cell growth of BY4741 in YPD containing different concentrations of LiPF6, LiCl, and NaPF6, ranging from 0 mM to 5 mM. Compared with the non-LiPF6-treated culture, the cell growth in the LiPF6-treated cultures did not change significantly when the LiPF6 concentrations were 2 mM or lower. However, cell growth was affected in cultures with LiPF6 concentrations of 3 mM, with a notably prolonged log phase growth (Figure 1A). Still, cells were able to grow to normal levels, similar to the controls, at 24 h. This indicated that tolerance mechanisms utilized by the cells to protect themselves from the toxicity of LiPF6 had been activated. In stark contrast to the growth in these moderate- and low-concentration conditions, upon exposure to higher concentrations (4 mM) cell growth was seriously inhibited, and the lag phase was substantially prolonged. Finally, when the concentration was increased to 5 mM, cell growth was completely inhibited (Figure 1A). This indicates that LiPF6 is very toxic to yeast cells in concentrations above 4 mM. In order to compare the toxicity of LiPF6 and separate the overall impact of LiPF6 into that from the single factors of Li+- or PF6-induced toxicity, we also measured the growth of BY4741 in medium containing the same concentration of LiCl or NaPF6, so that each of the three solutions had the same amount of Li+ or PF6- (Figure 1A). However, the sensitivity of the wild-type S. cerevisiae varied between the solutions in an unexpected way. BY4741 showed a much lower sensitivity to both LiCl and NaPF6; cell growth was not significantly affected in the presence of either LiCl or NaPF6, even at the maximum concentration of 5 mM (Figure 1A). In order to further verify this result, the inhibition zone of these three compounds against S. cerevisiae was investigated. LiPF6 has an obvious inhibition zone when the concentrations were 30 mM or higher, but LiCl and NaPF6 did not affect yeast growth at the same concentrations (Figure S1). The growth of BY4741 in liquid medium with both LiCl and NaPF6 added at the same time was also detected. There is no obvious growth inhibition even the concentrations of LiCl and NaPF6 increased to 5 mM (Figure 1A). This indicates that the LiPF6 electrolytes used in lithium-ion batteries have higher toxicity than either Li+ or PF6 alone, at the same ionic concentration; thus, LiPF6 has its own unique toxicity, which is not a simple additive effect of two compounds.

3.2. A Genome-Wide Screen Identifies Deletion Strains with Increased Sensitivity to LiPF6

In order to obtain a global view of the genes involved in LiPF6 toxicity and tolerance in S. cerevisiae, a genome-wide screen of the SGA yeast deletion collection was performed. The first step was to determine the LC50 of LiPF6 on solid medium, a concentration high enough to inhibit growth but below the concentration for 100% lethality. We observed cell growth on randomly selected 96-well plates in solid medium containing 0 mM, 2 mM, 3 mM, and 4 mM LiPF6. In the presence of 3 mM LiPF6, control strains at the outer ring of the plates showed about 50% inhibition while some deletion mutants (Figure S2, red circles) exhibited notable growth inhibition, implying that these mutants were sensitive to LiPF6. Since the cell growth of the control strains was reduced by nearly half under this concentration, approximating the LC50, we screened the deletion collection for growth changes on solid plates containing 3 mM LiPF6. After three independent replicates, we identified 75 strains with enhanced sensitivity to LiPF6 (Table 1).
GO analysis of sensitive deletion mutants was performed to identify the significantly overrepresented categories of genes among the sensitive strains. In the GO result, most of the enriched genes in the deletion mutants that showed sensitivity to LiPF6 were associated with mitochondria or mitochondria-related function (Figure 1B). Among these, the main enriched GO terms were ubiquinol-cytochrome-c reductase activity and oxidoreductase activity, acting on the diphenols and related substances as donors, mitochondrial respiratory chain complex III, and respiratory chain complex III (Figure 1B). Through localization analysis, we noted that mitochondria-localized proteins were highly represented in our sensitive strains list, accounting for about 25% of the sensitivity-associated genes (Table S2). This indicated that mitochondria-localized proteins were the main group that responded to LiPF6. KEGG analysis of the sensitive strains was also performed, and four enriched pathways were found: oxidative phosphorylation; ubiquinone and other terpenoid-quinone biosynthesis; endocytosis; and glycine, serine, and threonine metabolism (Figure 1C). However, only oxidative phosphorylation was enriched with a cut-off p-value of <0.05. Oxidative phosphorylation was the functional category for four genes: COX5A, COX12, QCR2, and QCR6. All of these genes participate in mitochondrial respiration and ATP synthesis [46]. In summary, the sensitive mutants had defects in mitochondrial function, suggesting an important role for mitochondria in LiPF6-induced toxicity.
In addition, functional classification of the genes that, upon deletion, resulted in higher sensitivity to LiPF6 was performed according to the functional description from the Saccharomyces Genome Database. The 75 genes, with the exception of five uncharacterized genes, were classified into eight groups: oxidative phosphorylation, electron transport chain, mitochondrial proteins, cell resistance, transport system, protein synthesis and degradation, DNA and RNA-related genes, and cell metabolism (Figure 1D and Table 1). Genetic and physical interaction networks were also analyzed, which provided information on the functional association between the genes of interest. This analysis demonstrated that over 22% (17/75) of the encoded gene products are ones that are reported to have physical interactions with each other (Figure 1D, red lines). There were also many genetic interactions between the 75 genes that were not part of the physical interaction networks (Figure 1D, grey lines). Co-localization analysis revealed that most of the encoded gene products were co-localized with other proteins (Figure 1D, blue lines). This indicated that many of these genes were not only associated in terms of functional processes, but were also physically bound to each other, to cooperatively participate in the modulation of LiPF6 toxicity.

3.3. Oxidative Phosphorylation-Related Genes Are Required for Tolerance to LiPF6

GO and KEGG analysis indicated that mitochondria were the main organelles involved in the response to LiPF6, so we focused on the oxidative phosphorylation pathway, which occurs in the mitochondria. Of the 75 genes from the sensitive mutant strains identified during the screening, four were the components of the oxidative phosphorylation pathway. The deletion mutants of these genes were not, however, responsive to LiCl, even at a high concentration (0.4 M) [29], implying that the oxidative phosphorylation pathway might be specifically involved in cell tolerance to LiPF6. Ubiquinol-cytochrome-c reductase subunit 2 (Qcr2) and subunit 6 (Qcr6) are subunits of the electron transfer chain complexes III, namely ubiquinol cytochrome-c reductase complex [47,48]. Cox5a and Cox12 are the subunits of cytochrome c oxidase (COX), which is part of the complex IV of the mitochondrial electron transport chain [49]. In addition, we also tested another gene, cytochrome c oxidase assembly factor 14 (COX14). Although it is not included in oxidative phosphorylation pathway in KEGG analysis, it is associated with cytochrome c oxidase assembly [50,51] and we tested these genes together. In our screen, deletion of any of these genes conferred cell sensitivity to LiPF6 (Figure 2A). In order to clarify whether these specific genes indeed modulate LiPF6 toxicity, spot test assays for each of the mutants were carried out to validate the results of the large-scale screen. As shown in Figure 2B, cox5a, cox12, cox14, qcr2, and qcr6 mutants displayed significant compromise in growth on plates with LiPF6. Plasmids from the MoBY ORF 1.0 Library expressing each of these genes were then transformed into their corresponding deletion mutants to confirm whether the LiPF6-sensitive phenotype is due to the specific disruption of these genes. The mutants cox5a, cox12, cox14, qcr2, and qcr6 carrying the complementary plasmid exhibited normal growth, similar to that of the control strain carrying an empty vector, whereas the deletion strains carrying empty vectors continued to exhibit sensitivity to LiPF6 (Figure 2C). These results suggested that the sensitive phenotype of the mutants was indeed caused by deletion of the genes encoding Cox5a, Cox12, Cox14, Qcr2, and Qcr6. As Cox5a, Cox12, Cox14, Qcr2, and Qcr6 are critical components of the oxidative phosphorylation pathway and are essential for mitochondrial energy production to support most of the metabolic activities in cells, it is speculated that normal mitochondrial function maintenance is required for cellular tolerance to LiPF6.

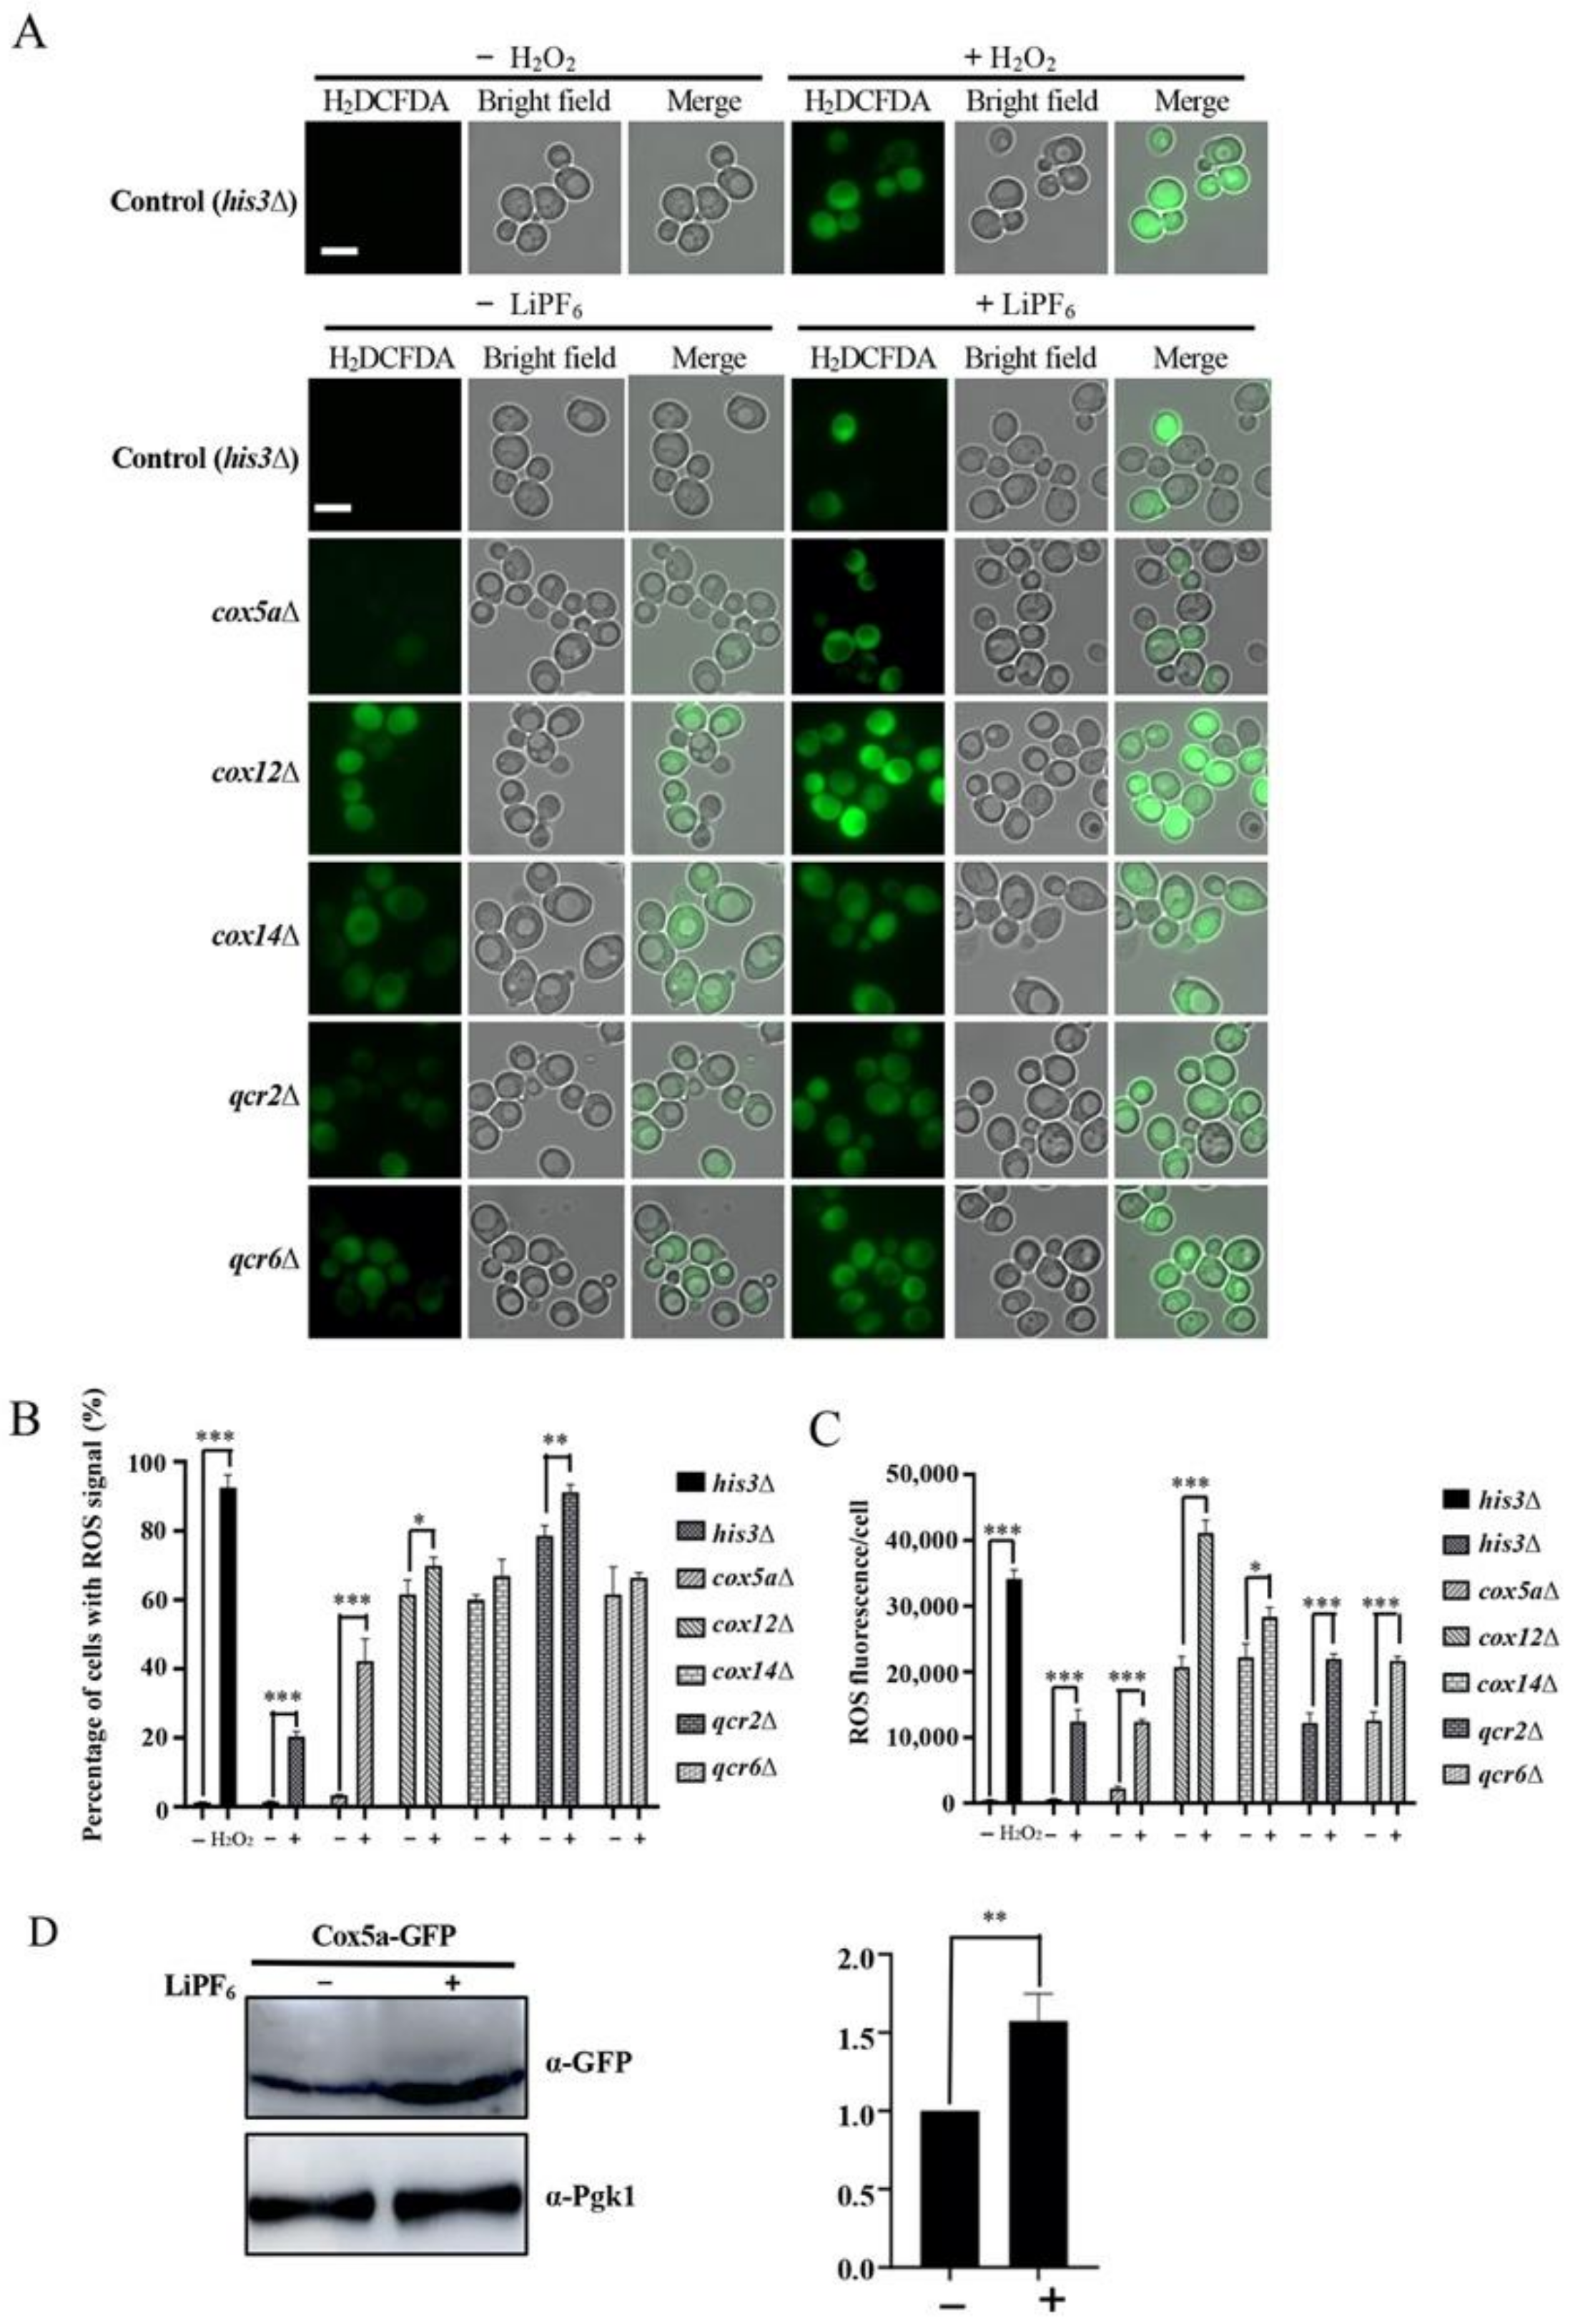
3.4. High Concentration of LiPF6 Alters Mitochondrial Morphology, Induces ROS Accumulation, and Reduces ATP Levels

Mitochondria are essential organelles with multiple functions in eukaryotic cells. They are responsible for the generation of ATP, which serves as an energy source for numerous critical cellular activities, and are involved in apoptosis, ion homeostasis, and signal transduction [52,53,54]. During the process of oxidative phosphorylation, mitochondria are also associated with the generation and management of ROS, which was the main source of intracellular ROS [55,56]. In our screening, among the LiPF6-sensitive strains, it was mitochondrial mutants that were most enriched, indicating that mitochondria may play essential roles in modulating LiPF6-associated toxicity. The yeast growth in YPG medium in the absence or presence of LiPF6 was measured, in which glycerol serves as the single carbon source and cells depend on mitochondria to generate energy. Compared to the growth in YPD with 4 mM LiPF6, which would resume after 60 h, the yeast growth in YPG in the presence of 4 mM LiPF6 was completely inhibited (Figure S3). Since utilization of the nonfermentable carbon source glycerol requires mitochondrial function, it provided evidence for the toxic effects of LiPF6 on mitochondria. Therefore, we then analyzed mitochondrial morphology changes in response to LiPF6 treatment. Cells treated with carbonyl cyanide m-chlorophenylhydrazone (CCCP), a mitochondrial uncoupler, served as the positive control (Figure 3A). Under normal conditions, cells displayed a dynamic branched tubular mitochondrial network, as expected from previous studies [57]. In the presence of CCCP or 4 mM LiPF6, the tubular mitochondria were disrupted into fragmented shapes (Figure 3A). We quantified the fragmented mitochondria before and after LiPF6 incubation and found that ~90% of cells displayed fragmented mitochondria after LiPF6 exposure (Figure 3A), even higher than that of positive control. In order to further verify the effect of LiPF6 on mitochondrial morphology, we used a mitochondrial matrix protein Ilv3 fused to GFP as a mitochondria marker to observe the morphological alterations [57]. Similarly, under normal conditions, a tubular mitochondrial network was observed. However, after LiPF6 treatment, about 95% of the cells displayed a fragmented GFP signal (Figure S4). Thus, the mitochondria were drastically reshaped when subjected to high concentrations of LiPF6.
As damaged mitochondria are the main source of intracellular ROS [58], we sought to determine whether LiPF6 could induce ROS in yeast. Mid-log phase cells were treated with 1 mM LiPF6 in synthetic complete (SC) liquid medium, and H2DCFDA was utilized in the measurement of ROS levels [59]. As shown in Figure 3B, almost no ROS signal was detected in the untreated cells, while in the presence of LiPF6, the wild-type strain exhibited a positive ROS signal throughout the cell, showing that LiPF6 can induce oxidative stress (Figure 3B). Furthermore, we tested whether the production of ATP was affected by LiPF6. Crude mitochondrial fraction was isolated from wild-type strains treated with 0 mM or 4 mM LiPF6, and then ATP synthesis was measured. As shown in Figure 3C, the ATP synthesis ability of mitochondria isolated from LiPF6-treated cultures was significantly impaired as the ATP levels decreased compared with that of the control.

3.5. Oxidative Phosphorylation-Related Genes Are Required for Counteraction of LiPF6-Induced ROS

In order to explain why deletion of oxidative phosphorylation-related genes leads to cells to exhibit sensitivity to LiPF6, we tested the ROS levels in deletion strains when treated with LiPF6. The H2O2-treated SGA control strain (his3Δ) was used as a positive control. An untreated control strain (his3Δ) was used as a negative control. As expected, after treated with H2O2, strong fluorescent signals were accumulated in the cells (Figure 4A). Like the control strain, a limited ROS signal was detected in mutant cox5a in the absence of LiPF6. However, upon exposure to LiPF6, cox5a accumulated substantial ROS (Figure 4A). The percentage of ROS indicator-stained cells was counted, and is shown in Figure 4B. For the control strain exposed to LiPF6, about 20% of the cells accumulated ROS. However, for the cox5a strain, the proportion increased to approximate 40%. Thus, Cox5a was required to partially counteract the LiPF6-induced ROS. In the other four deletion mutants (cox12, cox14, qcr2, and qcr6), deletion of these genes caused production of ROS in more than 50% of the cells under normal conditions (Figure 4A,B), suggesting that these four genes were critical for intracellular ROS balance under normal physiological conditions. Upon exposure to LiPF6, although the proportion of cox12, cox14, qcr2, and qcr6 cells with ROS signal was not increased or slightly increased compared with untreated cells (Figure 4B), the average fluorescence intensity per cell in each mutant was remarkably increased, and was much higher than that of the control strain (Figure 4C). This suggested that Cox12, Cox14, Qcr2, and Qcr6 are also involved in the mediation of LiPF6-induced ROS.
Then, the protein expression levels of these genes were detected before and after LiPF6 treatment. Cox5a protein levels were remarkably increased after LiPF6 treatment (Figure 4D). Increased Cox5a might help cells to maintain ROS at a low level. The levels of the other four proteins were not significantly changed or cannot be detected (Figure S5). In summary, deletion of the oxidative phosphorylation-related genes caused a high level of ROS accumulation in cells treated with LiPF6. This may be one of the reasons why deletion of these genes increased sensitivity to LiPF6.

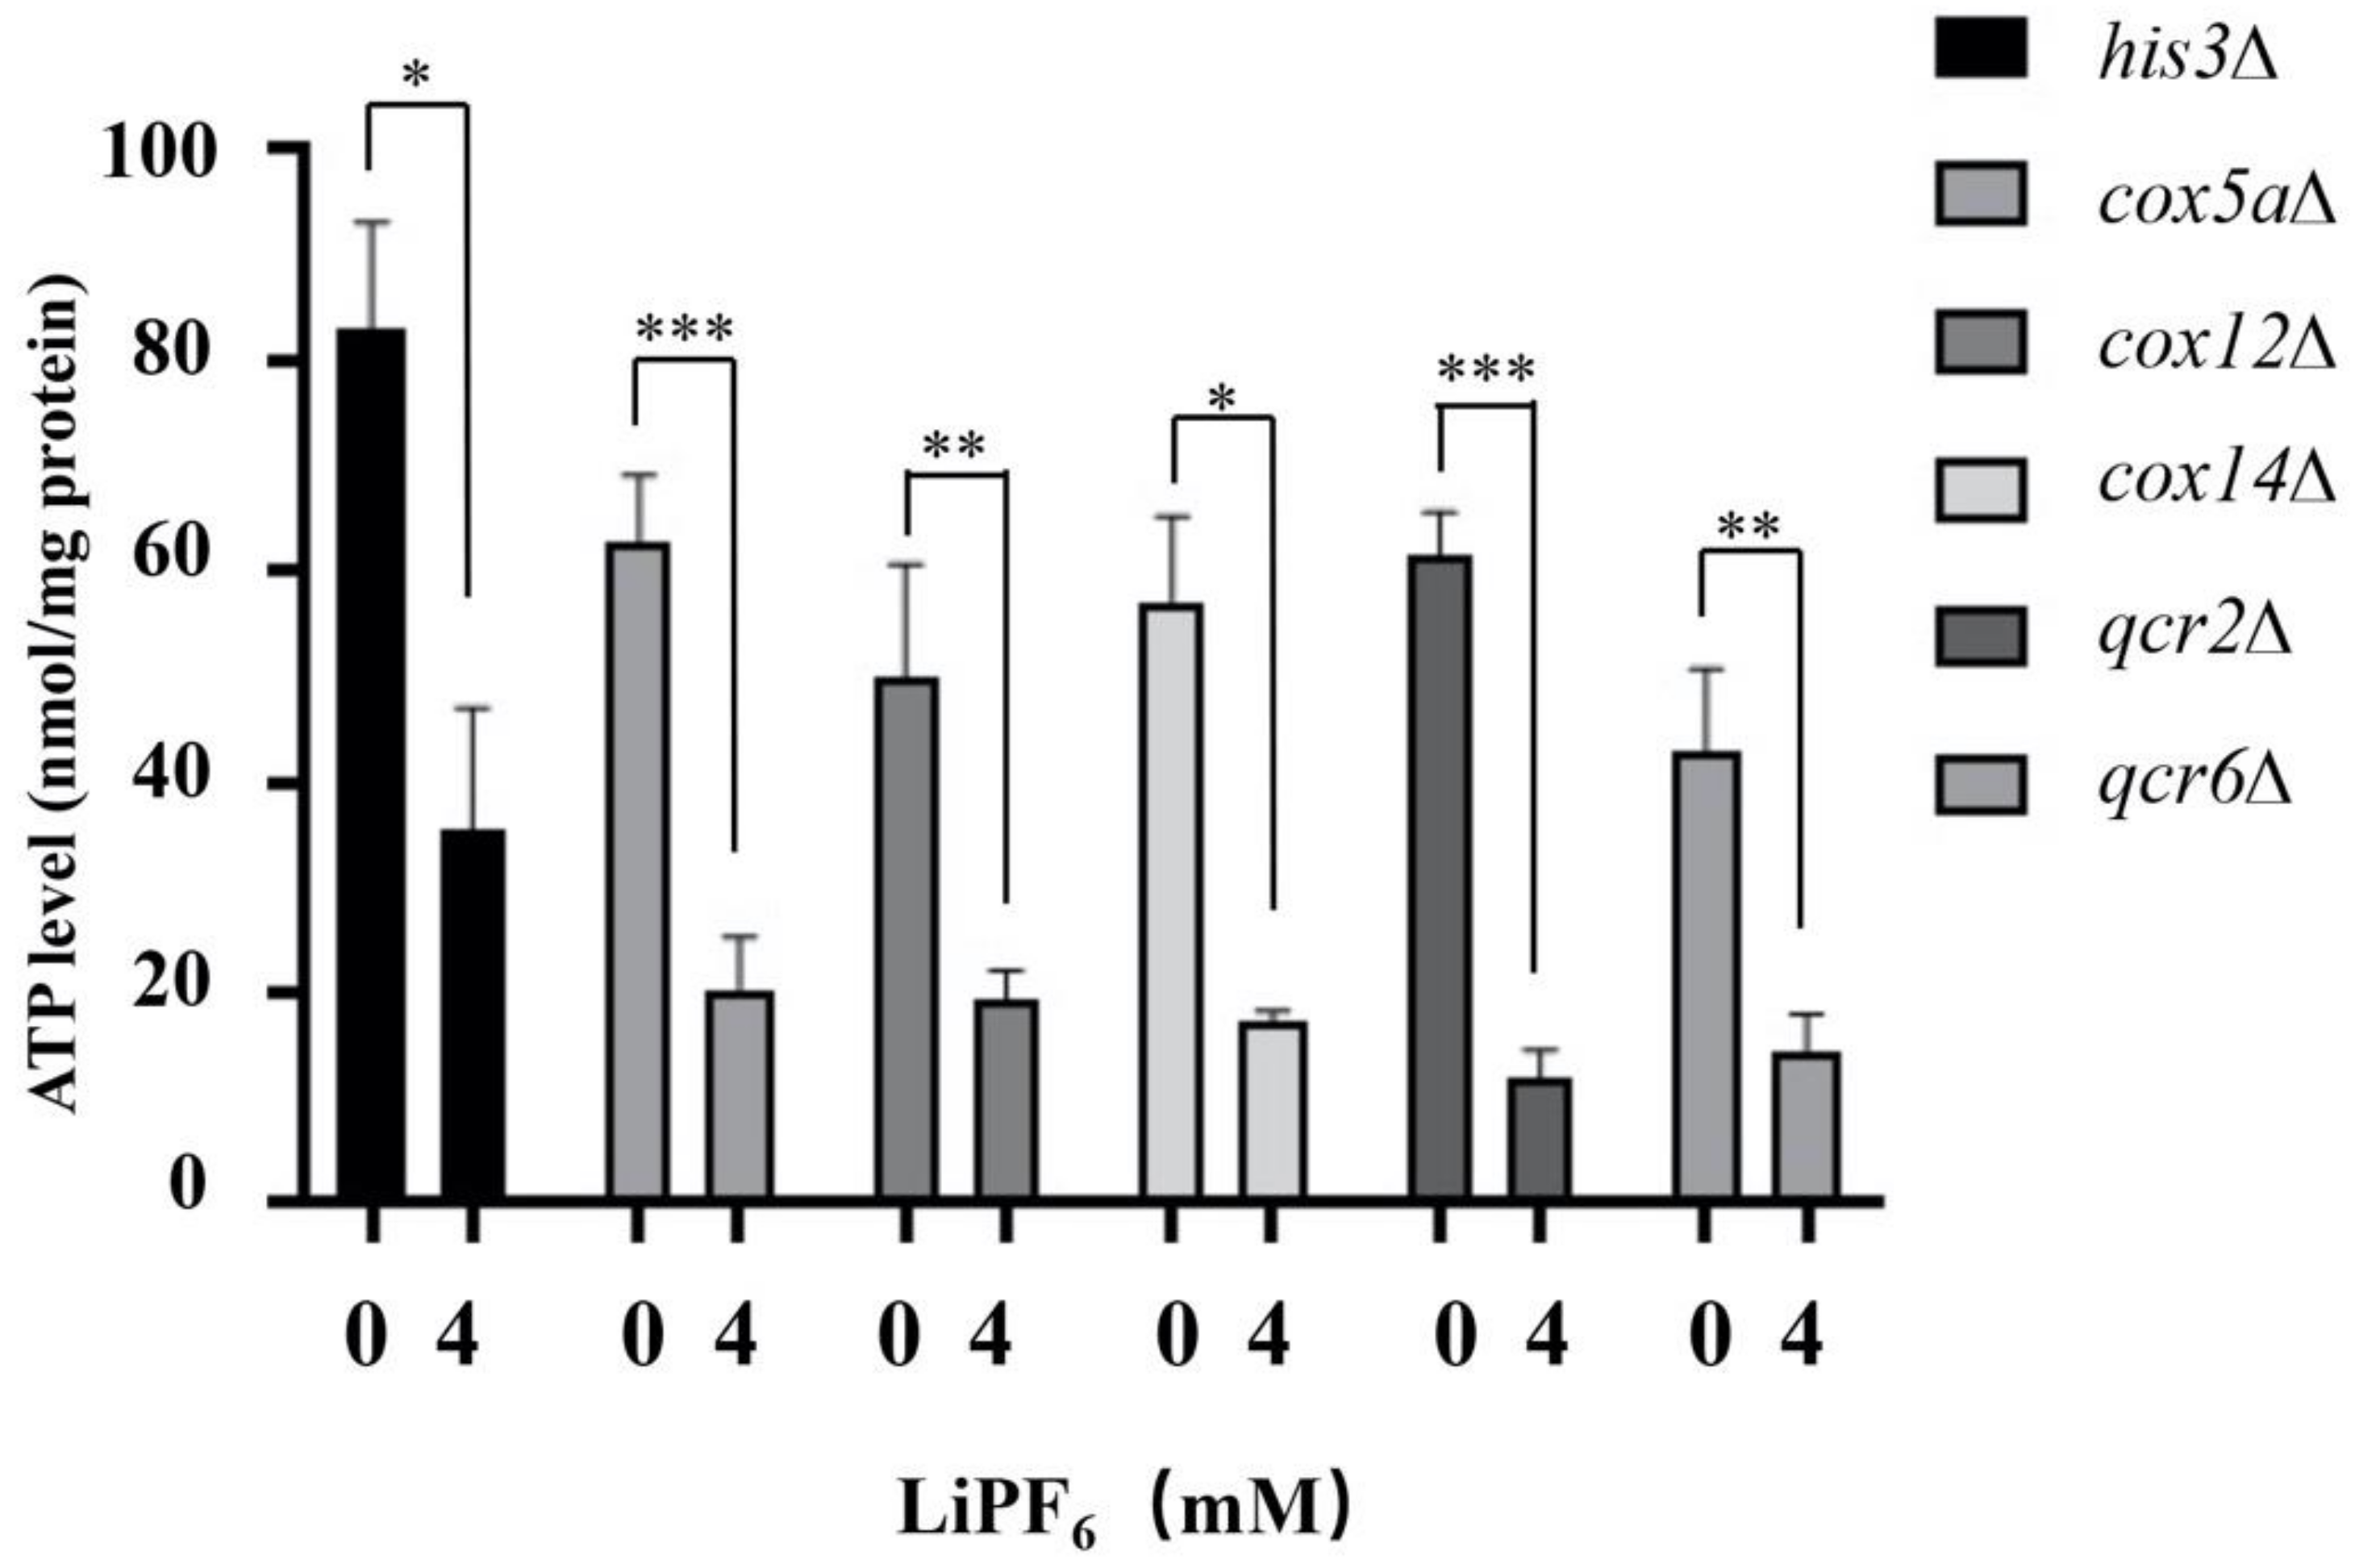
3.6. Deletion of Oxidative Phosphorylation-Related Genes Alters ATP Synthesis Abilities under High Concentration of LiPF6 Treatment

To examine whether deletion of these five oxidative phosphorylation-related genes could affect mitochondrial ATP synthetic activity in the presence of LiPF6, ATP synthesis was compared between the control strain (his3Δ) and the deletion strains. Under normal physiological conditions, the ATP synthesis abilities of the deletion mutants were lower than that in the control strain (Figure 5). When exposed to 4 mM LiPF6, the control strain showed about a 45% decrease in ATP production. However, for the deletion strains, the gap between the treated and untreated cells was widened (Figure 5). Furthermore, the ATP synthesis in these five deletion strains in the presence of LiPF6 was less than 25 nmol/mg, which was much lower than the 35 nmol/mg in the control strain (Figure 5). Thus, we can see that Cox5a, Cox12, Cox14, Qcr2, and Qcr6 were indispensable for maintaining the ATP levels when exposed to LiPF6. Higher ATP levels are beneficial in helping cells survive when they are exposed to LiPF6.
Among the sensitive strains, there were three other genes involved in mitochondrial ATP synthesis, ATP10, ATP11, and ATP23, which belong to the mitochondrial F1F0 ATP synthase. We speculate that these genes might also be important for the tolerance to LiPF6 because they are critical for cellular ATP content maintenance. Spot test assays of these mutants and complementation strains were carried out to confirm the result of high-throughput screening. Data in Figure S6A,B indicated that deletion of these three genes result in sensitivity to LiPF6. A further ATP assay suggested that deletion of these mitochondrial F1F0 ATP synthase-related genes results in decreased ATP levels in the cells compared with the control strain under normal conditions. For atp10Δ and atp23Δ, in the presence of LiPF6, the ATP content is further decreased and lower than that of control strain (Figure S6C). This could be the potential reason for their LiPF6 sensitivity.

3.7. Oxidative Phosphorylation-Related Mutants Were Specifically Hypersensitive to LiPF6

In order to test whether the identified oxidative phosphorylation-related genes (COX5A, COX12, COX14, QCR2, and QCR6) were specifically responsive to LiPF6, spot test assays were performed to examine deletion mutant growth on the LiCl and NaPF6 plates. First, we observed the cell growth on 3 mM LiCl- and NaPF6-containing plates, which have the same number of moles of Li+ and PF6 as 3 mM LiPF6. The data demonstrated no significant difference between the control and deletion strains when exposed to Li+ or PF6 ions in the form of LiCl and NaPF6 (Figure 6). When the concentration of NaPF6 was increased to 70 mM, the qcr2, qcr6, cox12, and cox14 mutants exhibited compromised growth compared with the control strain. However, the cox5a mutant was still not suppressed. Likewise, the growth of the qcr2, qcr6, cox5a, cox12, and cox14 mutants on LiCl plates showed no difference compared with the control strain despite the concentration increasing to 200 mM (Figure 6), which was consistent with previous published results [29]. These results indicated that Cox5a specifically responds to LiPF6, and that, although the other four gene mutants were cross-sensitive to NaPF6, a high concentration of NaPF6 was required to elicit observable effects.

4. Discussion

LiPF6 is one of the leading electrolytes in lithium-ion batteries and is toxic to the environment and organisms [4]. It is important to reveal the mechanism underlying the toxicity of LiPF6 and to decipher the specific response of cells to it. Our results revealed that the yeast was more sensitive to LiPF6 than to LiCl or NaPF6. Physiological and morphological analysis revealed that mitochondrial damage, oxidative stress, and ATP imbalance were the driving factors governing LiPF6-induced toxicity. A genome-wide screening of the yeast deletion collection identified 75 mutants that showed sensitivity to LiPF6. Among these, the oxidative phosphorylation pathway was the most enriched pathway, per the KEGG database, and genes in this pathway were specifically hypersensitive to LiPF6. In the presence of LiPF6, mutants with deletions of these genes exhibited higher ROS production and reduced ATP production compared with the control strain, and this might explain their sensitivity to LiPF6. Our study not only identified the process by which LiPF6 induces cytotoxicity, but also elucidated the specific genes that confer cell tolerance to LiPF6.
Yeast has a high tolerance to Li+, as shown by a previous study, in which researchers used 0.1 M LiCl to identify its hypersensitive mutants [29]. Likewise, in our study, we also found that a low concentration of NaPF6 (5 mM) did not affect yeast growth. In contrast, 5 mM LiPF6 completely inhibited yeast growth. This indicates that LiPF6 was more toxic than LiCl or NaPF6 in yeast, and that the cytotoxicity induced by LiPF6 might be different from that induced by LiCl or NaPF6. Zhao et al. identified 114 LiCl-sensitive mutants in a genome-scale genetic screening. A large number of the mutant genes were identified as being involved in sporulation and meiosis, and vacuolar protein sorting; these are the two major cellular processes affected by LiCl [29]. These genes were found to be associated with intracellular lithium content and ion homeostasis, which might be involved in sensitivity to lithium stress [29]. In our study, mitochondrial genes and genes related to mitochondrial processes were the genes found to be most enriched, and represented the major cellular responses to LiPF6. We compared the 75 LiPF6-sensitive genes identified here (Table 1) with the 114 lithium-sensitive mutants reported previously. We observed that four LiPF6-sensitive genes were also involved in sensitivity to LiCl. Three of these encode proteins involved in vacuolar protein sorting (Vps8, Vps9, and Vps51). Vps8 functions in protein targeting during late endosome-to-vacuole transport [60,61]. Vps9 is involved in Golgi-endosome trafficking and sorting through the multivesicular body [62,63]. Vps51 is required for the recycling of proteins from endosomes to the late Golgi [64,65]. Deletion of Vps8, Vps9, and Vps51 leads to accumulation of intracellular lithium contents, implying that these genes are critical for ion homeostasis [29]. Regarding Vps8 and Vps9, mutants vps8 and vps9 are sensitive to LiCl only when concentrations are 0.4 M or higher. In contrast, the phenotypes of mutants vps8 and vps9 included sensitivity to 3 mM LiPF6 (a concentration that should not induce lithium stress in yeast). This suggests that the sensitivity to LiPF6 might not be attributable to lithium homeostasis disruption. Thus, although some strains with deletions of vacuolar protein sorting genes exhibited cross-sensitivity to LiCl, this might be due to alteration of other biological processes, causing the yeast cells to become sensitive to LiPF6.
Fluorescence microscope observations indicated that LiPF6 induced fragmentation of mitochondria and accumulation of ROS, which could result in lipid, protein, and DNA peroxidation [66,67,68]. ATP synthetic activity measurement using the isolated crude mitochondrial fraction indicated that LiPF6 impairs ATP synthesis. Moreover, LiPF6 treatment causes more toxicity to yeast cells when cultured in respiratory medium. It also provides evidence for the negative effect of LiPF6 on mitochondria. Previous studies reported that high concentrations of LiCl and Li2CO3 impaired mitochondria complex II and IV activity, enhanced ROS formation, lowered mitochondrial membrane potential, and induced cytochrome c release from the mitochondria to the cytosol [14,69,70,71]. In addition, a recent review also summarized research indicating that an overdose of fluoride can induce mitochondrial damage, affect the regulation of intracellular redox homeostasis, and activate endoplasmic reticulum stress and apoptosis [72]. Thus, LiPF6 might have a similar mode of action, via effects on mitochondria, to those of lithium chloride, lithium carbonate, or fluoride. However, as the molar quantity of Li+ and PF6 of LiPF6 in our study was much lower than that in the above-discussed studies, the effect of LiPF6 on mitochondria was much stronger.
The mitochondrial respiratory chain consists of the NADH dehydrogenase complex, succinate dehydrogenase complex, cytochrome c reductase complex, and cytochrome c oxidase complex, as well as the ATP synthase complex, together with ubiquinone and cytochrome c, which act as electron carriers [73]. The mitochondrial electron transport chain plays a major role in ATP production, but this process is accompanied by the generation of ROS [74]. In our genome-wide screening, the cytochrome c reductase complex mutants qcr2 and qcr6, the cytochrome c oxidase complex mutants cox5a, cox12, and cox14, the ATP synthase complex mutant atp10, atp11, and atp23 were identified to be sensitive to LiPF6. Previous studies have reported that deletion of these genes results in different degrees of mitochondrial dysfunction [55]. However, S. cerevisiae does not strictly depend on the function of mitochondria when cultured in YPD medium. Under normal physiological conditions, cox5a, cox12, cox14, qcr2, qcr6, atp10, atp11, and atp23 had similar growth to or weaker growth than that of the control strain, as well as in the ATP synthesis ability. In the presence of LiPF6, however, cell growth and ATP synthesis were remarkably reduced in deletion mutants. This gave us a clue that mitochondrial efficiency and sufficient ATP content are critical for tolerance to LiPF6. ROS measurement also indicated that COX5A deletion leads to an increased proportion of cells with ROS signal compared to the control strain. For the other four oxidative phosphorylation-related genes, although deletion mutants of these genes did not significantly affect the proportion of cells with a ROS signal after LiPF6 treatment, the average fluorescence intensity per cell was increased. From these data, we speculated that the oxidative phosphorylation-related genes were critical for the counteraction of LiPF6-induced ROS accumulation and ATP reduction, processes that might be beneficial for cell survival after exposure to LiPF6. More importantly, western blot analysis suggested that the Cox5a protein was accumulated after LiPF6 exposure. Combined with the results from the spot test of LiCl and NaPF6, we concluded that cox5a was specifically sensitive to LiPF6 and the increased protein expression of Cox5a is a mechanism by which yeast cells can overcome the toxicity of LiPF6.
Taken together, our study revealed the cytotoxicity of the lithium-ion battery electrolytes LiPF6, and identified the genes related to oxidative phosphorylation as critical for conferring resistance to LiPF6. This work will provide valuable information about the toxicity mechanisms of industrial products and will give researchers valuable information to be used in policy choices in the relevant industry fields.

Supplementary Materials

The following are available online at https://www.mdpi.com/article/10.3390/cells10040888/s1, Figure S1: Sensitivity of S. cerevisiae to LiPF6, LiCl, and NaPF6, Figure S2: Photographs of plates in the absence or presence of 3 mM LiPF6, Figure S3: Growth comparison of BY4741 in YPD or YPG media, Figure S4: Mitochondrial morphology was affected by LiPF6, Figure S5: Detection of Cox14, Cox12, Qcr2, and Qcr6 protein expression changes, Figure S6: Mitochondrial F1F0 ATP synthase-related gene deletion strains show increased sensitivity to LiPF6, Table S1: Primers for identification of complementation strains, Table S2: Location distribution of the 75 genes associated with LiPF6-sensitivity.

Author Contributions

Conceptualization, S.L., X.C. and B.L.; formal analysis, X.J., J.Z. and X.C.; funding acquisition, X.J., X.C. and B.L.; investigation, X.J., J.Z., T.A., H.Z., W.F. and D.L.; supervision, S.L. and B.L.; validation, T.A.; visualization, X.J. and J.Z.; writing—original draft, X.J.; writing—review and editing, X.C. and B.L. All authors have read and agreed to the published version of the manuscript.

Funding

This research was funded by grants from Zhejiang Provincial Natural Science Foundation of China (LQ19C070001) to X.C. and the National Natural Science Foundation of China (31800163) to X.J., as well as the Swedish Cancer Fund (Cancerfonden) [CAN 2017/643 and 19 0069] and the Swedish Natural Research Council (Vetenskapsrådet) [VR 2015-04984 and VR 2019-03604] to B.L.

Institutional Review Board Statement

Not applicable.

Informed Consent Statement

Not applicable.

Data Availability Statement

The data presented in this study are available on request from the corresponding author.

Acknowledgments

We thank Charles Boone (Toronto University, Toronto, ON, Canada) for providing us with the SGA collection and Molecular Barcoded Yeast ORF 1.0 (MoBY ORF 1.0 Library).

Conflicts of Interest

The authors declare no conflict of interest. The funders had no role in the design of the study; in the collection, analyses, or interpretation of data; in the writing of the manuscript, or in the decision to publish the results.

References

  1. Li, J.; He, X.; Zeng, X. Designing and examining e-waste recycling process: Methodology and case studies. Environ. Technol. 2017, 38, 652–660. [Google Scholar] [CrossRef]
  2. He, Y.; Yuan, X.; Zhang, G.; Wang, H.; Zhang, T.; Xie, W.; Li, L. A critical review of current technologies for the liberation of electrode materials from foils in the recycling process of spent lithium-ion batteries. Sci. Total Environ. 2020, 142382. [Google Scholar] [CrossRef]
  3. Sun, X.; Hao, H.; Zhao, F.; Liu, Z. Global lithium flow 1994-2015: Implications for improving resource efficiency and security. Environ. Sci. Technol. 2018, 52, 2827–2834. [Google Scholar] [CrossRef] [PubMed]
  4. Sironval, V.; Reylandt, L.; Chaurand, P.; Ibouraadaten, S.; Palmai-Pallag, M.; Yakoub, Y.; Ucakar, B.; Rose, J.; Poleunis, C.; Vanbever, R.; et al. Respiratory hazard of Li-ion battery components: Elective toxicity of lithium cobalt oxide (LiCoO2) particles in a mouse bioassay. Arch. Toxicol. 2018, 92, 1673–1684. [Google Scholar] [CrossRef] [PubMed]
  5. Aral, H.; Vecchio-Sadus, A. Toxicity of lithium to humans and the environment--a literature review. Ecotoxicol. Environ. Saf. 2008, 70, 349–356. [Google Scholar] [CrossRef] [PubMed]
  6. Becker, R.W.; Tyobeka, E.M. Lithium enhances the proliferation of HL-60 promyelocytic leukemia cells. Leuk. Res. 1990, 14, 879–884. [Google Scholar] [CrossRef]
  7. Kalinowska, M.; Hawrylak-Nowak, B.; Szymanska, M. The influence of two lithium forms on the growth, L-ascorbic acid content and lithium accumulation in lettuce plants. Biol. Trace Elem. Res. 2013, 152, 251–257. [Google Scholar] [CrossRef] [Green Version]
  8. Castillo-Quan, J.I.; Li, L.; Kinghorn, K.J.; Ivanov, D.K.; Tain, L.S.; Slack, C.; Kerr, F.; Nespital, T.; Thornton, J.; Hardy, J.; et al. Lithium promotes longevity through GSK3/NRF2-dependent hormesis. Cell Rep. 2016, 15, 638–650. [Google Scholar] [CrossRef] [Green Version]
  9. Leonard, A.; Hantson, P.; Gerber, G.B. Mutagenicity, carcinogenicity and teratogenicity of lithium compounds. Mutat. Res. 1995, 339, 131–137. [Google Scholar] [CrossRef]
  10. Naranjo, M.A.; Romero, C.; Belles, J.M.; Montesinos, C.; Vicente, O.; Serrano, R. Lithium treatment induces a hypersensitive-like response in tobacco. Planta 2003, 217, 417–424. [Google Scholar] [CrossRef]
  11. Shahzad, B.; Mughal, M.N.; Tanveer, M.; Gupta, D.; Abbas, G. Is lithium biologically an important or toxic element to living organisms? An overview. Environ. Sci. Pollut. Res. Int. 2017, 24, 103–115. [Google Scholar] [CrossRef]
  12. Hawrylak-Nowak, B.; Kalinowska, M.; Szymanska, M. A study on selected physiological parameters of plants grown under lithium supplementation. Biol. Trace Elem. Res. 2012, 149, 425–430. [Google Scholar] [CrossRef] [Green Version]
  13. Tandon, A.; Dhawan, D.K.; Nagpaul, J.P. Effect of lithium on hepatic lipid peroxidation and antioxidative enzymes under different dietary protein regimens. J. Appl. Toxicol. 1998, 18, 187–190. [Google Scholar] [CrossRef]
  14. Eskandari, M.R.; Fard, J.K.; Hosseini, M.J.; Pourahmad, J. Glutathione mediated reductive activation and mitochondrial dysfunction play key roles in lithium induced oxidative stress and cytotoxicity in liver. Biometals 2012, 25, 863–873. [Google Scholar] [CrossRef] [PubMed]
  15. Lenox, R.H.; McNamara, R.K.; Papke, R.L.; Manji, H.K. Neurobiology of lithium: An update. J. Clin. Psychiatry 1998, 59 (Suppl. S6), 37–47. [Google Scholar]
  16. Holstein-Rathlou, N.H. Lithium transport across biological membranes. Kidney Int. Suppl. 1990, 28, S4–S9. [Google Scholar] [PubMed]
  17. Birch, N.J. Possible mechanism for biological action of lithium. Nature 1976, 264, 681. [Google Scholar] [CrossRef] [PubMed]
  18. Nagy, T.; Frank, D.; Katai, E.; Yahiro, R.K.; Poor, V.S.; Montsko, G.; Zrinyi, Z.; Kovacs, G.L.; Miseta, A. Lithium induces ER stress and N-glycan modification in galactose-grown Jurkat cells. PLoS ONE 2013, 8, e70410. [Google Scholar] [CrossRef] [Green Version]
  19. Biczak, R.; Telesinski, A.; Pawlowska, B. Oxidative stress in spring barley and common radish exposed to quaternary ammonium salts with hexafluorophosphate anion. Plant Physiol. Biochem. 2016, 107, 248–256. [Google Scholar] [CrossRef]
  20. Wei, Q.; Deng, H.; Cui, H.; Fang, J.; Zuo, Z.; Deng, J.; Li, Y.; Wang, X.; Zhao, L. A mini review of fluoride-induced apoptotic pathways. Environ. Sci. Pollut. Res. Int. 2018, 25, 33926–33935. [Google Scholar] [CrossRef] [PubMed]
  21. Dec, K.; Lukomska, A.; Maciejewska, D.; Jakubczyk, K.; Baranowska-Bosiacka, I.; Chlubek, D.; Wasik, A.; Gutowska, I. The influence of fluorine on the disturbances of homeostasis in the central nervous system. Biol. Trace Elem. Res. 2017, 177, 224–234. [Google Scholar] [CrossRef] [Green Version]
  22. Zhu, F.; Li, Q.; Zhang, F.; Sun, X.; Cai, G.; Zhang, W.; Chen, X. Chronic lithium treatment diminishes the female advantage in lifespan in Drosophila melanogaster. Clin. Exp. Pharmacol. Physiol. 2015, 42, 617–621. [Google Scholar] [CrossRef]
  23. Bachmann, R.F.; Wang, Y.; Yuan, P.; Zhou, R.; Li, X.; Alesci, S.; Du, J.; Manji, H.K. Common effects of lithium and valproate on mitochondrial functions: Protection against methamphetamine-induced mitochondrial damage. Int. J. Neuropsychopharmacol. 2009, 12, 805–822. [Google Scholar] [CrossRef] [Green Version]
  24. Kleineidam, A.; Vavassori, S.; Wang, K.; Schweizer, L.M.; Griac, P.; Schweizer, M. Valproic acid- and lithium-sensitivity in prs mutants of Saccharomyces cerevisiae. Biochem. Soc. Trans. 2009, 37, 1115–1120. [Google Scholar] [CrossRef] [Green Version]
  25. Hellauer, K.; Lesage, G.; Sdicu, A.M.; Turcotte, B. Large-scale analysis of genes that alter sensitivity to the anticancer drug tirapazamine in Saccharomyces cerevisiae. Mol. Pharmacol. 2005, 68, 1365–1375. [Google Scholar] [CrossRef] [Green Version]
  26. Barberis, A.; Gunde, T.; Berset, C.; Audetat, S.; Luthi, U. Yeast as a screening tool. Drug Discov. Today Technol. 2005, 2, 187–192. [Google Scholar] [CrossRef]
  27. Norcliffe, J.L.; Alvarez-Ruiz, E.; Martin-Plaza, J.J.; Steel, P.G.; Denny, P.W. The utility of yeast as a tool for cell-based, target-directed high-throughput screening. Parasitology 2014, 141, 8–16. [Google Scholar] [CrossRef] [PubMed] [Green Version]
  28. Zimmermann, A.; Hofer, S.; Pendl, T.; Kainz, K.; Madeo, F.; Carmona-Gutierrez, D. Yeast as a tool to identify anti-aging compounds. FEMS Yeast Res. 2018, 18. [Google Scholar] [CrossRef] [PubMed]
  29. Zhao, J.; Lin, W.; Ma, X.; Lu, Q.; Ma, X.; Bian, G.; Jiang, L. The protein kinase Hal5p is the high-copy suppressor of lithium-sensitive mutations of genes involved in the sporulation and meiosis as well as the ergosterol biosynthesis in Saccharomyces cerevisiae. Genomics 2010, 95, 290–298. [Google Scholar] [CrossRef] [PubMed] [Green Version]
  30. van Leeuwen, J.; Pons, C.; Mellor, J.C.; Yamaguchi, T.N.; Friesen, H.; Koschwanez, J.; Ušaj, M.M.; Pechlaner, M.; Takar, M.; Ušaj, M.; et al. Exploring genetic suppression interactions on a global scale. Science 2016, 354, aag0839. [Google Scholar] [CrossRef] [Green Version]
  31. Tong, A.H.; Evangelista, M.; Parsons, A.B.; Xu, H.; Bader, G.D.; Page, N.; Robinson, M.; Raghibizadeh, S.; Hogue, C.W.; Bussey, H.; et al. Systematic genetic analysis with ordered arrays of yeast deletion mutants. Science 2001, 294, 2364–2368. [Google Scholar] [CrossRef] [PubMed]
  32. Tong, A.H.; Lesage, G.; Bader, G.D.; Ding, H.; Xu, H.; Xin, X.; Young, J.; Berriz, G.F.; Brost, R.L.; Chang, M.; et al. Global mapping of the yeast genetic interaction network. Science 2004, 303, 808–813. [Google Scholar] [CrossRef] [Green Version]
  33. Wagih, O.; Usaj, M.; Baryshnikova, A.; VanderSluis, B.; Kuzmin, E.; Costanzo, M.; Myers, C.L.; Andrews, B.J.; Boone, C.M.; Parts, L. SGAtools: One-stop analysis and visualization of array-based genetic interaction screens. Nucleic Acids Res. 2013, 41, W591–W596. [Google Scholar] [CrossRef] [Green Version]
  34. Babazadeh, R.; Ahmadpour, D.; Jia, S.; Hao, X.; Widlund, P.; Schneider, K.; Eisele, F.; Edo, L.D.; Smits, G.J.; Liu, B.; et al. Syntaxin 5 is required for the formation and clearance of protein inclusions during proteostatic stress. Cell. Rep. 2019, 28, 2096–2110.e2098. [Google Scholar] [CrossRef] [PubMed] [Green Version]
  35. Hong, E.L.; Balakrishnan, R.; Dong, Q.; Christie, K.R.; Park, J.; Binkley, G.; Costanzo, M.C.; Dwight, S.S.; Engel, S.R.; Fisk, D.G.; et al. Gene Ontology annotations at SGD: New data sources and annotation methods. Nucleic Acids Res. 2008, 36, D577–D581. [Google Scholar] [CrossRef] [PubMed] [Green Version]
  36. Xie, C.; Mao, X.; Huang, J.; Ding, Y.; Wu, J.; Dong, S.; Kong, L.; Gao, G.; Li, C.Y.; Wei, L. KOBAS 2.0: A web server for annotation and identification of enriched pathways and diseases. Nucleic Acids Res. 2011, 39, W316–W322. [Google Scholar] [CrossRef] [Green Version]
  37. Zuberi, K.; Franz, M.; Rodriguez, H.; Montojo, J.; Lopes, C.T.; Bader, G.D.; Morris, Q. GeneMANIA prediction server 2013 update. Nucleic Acids Res. 2013, 41, W115–W122. [Google Scholar] [CrossRef] [PubMed]
  38. Ho, C.H.; Magtanong, L.; Barker, S.L.; Gresham, D.; Nishimura, S.; Natarajan, P.; Koh, J.L.Y.; Porter, J.; Gray, C.A.; Andersen, R.J.; et al. A molecular barcoded yeast ORF library enables mode-of-action analysis of bioactive compounds. Nat. Biotechnol. 2009, 27, 369–377. [Google Scholar] [CrossRef] [Green Version]
  39. Huh, W.K.; Falvo, J.V.; Gerke, L.C.; Carroll, A.S.; Howson, R.W.; Weissman, J.S.; O’Shea, E.K. Global analysis of protein localization in budding yeast. Nature 2003, 425, 686–691. [Google Scholar] [CrossRef]
  40. Peng, X.; Li, F.; Li, S.; Zhu, Y. Expression of a mitochondrial gene orfH79 from the CMS-HongLian rice inhibits Saccharomyces cerevisiae growth and causes excessive ROS accumulation and decrease in ATP. Biotechnol. Lett. 2009, 31, 409–414. [Google Scholar] [CrossRef]
  41. Fletcher, E.; Gao, K.; Mercurio, K.; Ali, M.; Baetz, K. Yeast chemogenomic screen identifies distinct metabolic pathways required to tolerate exposure to phenolic fermentation inhibitors ferulic acid, 4-hydroxybenzoic acid and coniferyl aldehyde. Metab. Eng. 2019, 52, 98–109. [Google Scholar] [CrossRef]
  42. Schneider, C.A.; Rasband, W.S.; Eliceiri, K.W. NIH Image to ImageJ: 25 years of image analysis. Nat. Methods 2012, 9, 671–675. [Google Scholar] [CrossRef]
  43. Ye, X.; Morikawa, K.; Ho, S.-H.; Araki, M.; Nishida, K.; Hasunuma, T.; Hara, K.Y.; Kondo, A. Evaluation of genes involved in oxidative phosphorylation in yeast by developing a simple and rapid method to measure mitochondrial ATP synthetic activity. Microb. Cell Fact. 2015, 14, e56. [Google Scholar] [CrossRef] [Green Version]
  44. Bradford, M.M. A rapid and sensitive method for the quantitation of microgram quantities of protein utilizing the principle of protein-dye binding. Anal. Biochem. 1976, 72, 248–254. [Google Scholar] [CrossRef]
  45. Benjamini, Y.; Hochberg, Y. Controlling the false discovery rate: A practical and powerful approach to multiple testing. J. R. Stat. Soc. Ser. B 1995, 57, 289–300. [Google Scholar] [CrossRef]
  46. Wilson, D.F. Oxidative phosphorylation: Regulation and role in cellular and tissue metabolism. J. Physiol. 2017, 595, 7023–7038. [Google Scholar] [CrossRef] [PubMed] [Green Version]
  47. Schafer, J.; Dawitz, H.; Ott, M.; Adelroth, P.; Brzezinski, P. Structural and functional heterogeneity of cytochrome c oxidase in S. cerevisiae. Biochim. Biophys. Acta Bioenerg. 2018, 1859, 699–704. [Google Scholar] [CrossRef]
  48. Wikstrom, M.; Sharma, V. Proton pumping by cytochrome c oxidase—A 40 year anniversary. Biochim. Biophys. Acta Bioenerg. 2018, 1859, 692–698. [Google Scholar] [CrossRef] [PubMed]
  49. Timon-Gomez, A.; Nyvltova, E.; Abriata, L.A.; Vila, A.J.; Hosler, J.; Barrientos, A. Mitochondrial cytochrome c oxidase biogenesis: Recent developments. Semin. Cell Dev. Biol. 2018, 76, 163–178. [Google Scholar] [CrossRef] [PubMed]
  50. Fontanesi, F.; Clemente, P.; Barrientos, A. Cox25 teams up with Mss51, Ssc1, and Cox14 to regulate mitochondrial cytochrome c oxidase subunit 1 expression and assembly in Saccharomyces cerevisiae. J. Biol. Chem. 2011, 286, 555–566. [Google Scholar] [CrossRef] [PubMed] [Green Version]
  51. Mick, D.U.; Vukotic, M.; Piechura, H.; Meyer, H.E.; Warscheid, B.; Deckers, M.; Rehling, P. Coa3 and Cox14 are essential for negative feedback regulation of COX1 translation in mitochondria. J. Cell Biol. 2010, 191, 141–154. [Google Scholar] [CrossRef] [PubMed] [Green Version]
  52. Chandel, N.S. Evolution of mitochondria as signaling organelles. Cell Metab. 2015, 22, 204–206. [Google Scholar] [CrossRef] [PubMed] [Green Version]
  53. Shadel, G.S.; Horvath, T.L. Mitochondrial ROS signaling in organismal homeostasis. Cell 2015, 163, 560–569. [Google Scholar] [CrossRef] [Green Version]
  54. Labbe, K.; Murley, A.; Nunnari, J. Determinants and functions of mitochondrial behavior. Annu. Rev. Cell. Dev. Biol. 2014, 30, 357–391. [Google Scholar] [CrossRef]
  55. Kwon, Y.Y.; Choi, K.M.; Cho, C.; Lee, C.K. Mitochondrial efficiency-dependent viability of Saccharomyces cerevisiae mutants carrying individual electron transport chain component deletions. Mol. Cells 2015, 38, 1054–1063. [Google Scholar] [CrossRef] [PubMed] [Green Version]
  56. Zorov, D.B.; Juhaszova, M.; Sollott, S.J. Mitochondrial reactive oxygen species (ROS) and ROS-induced ROS release. Physiol. Rev. 2014, 94, 909–950. [Google Scholar] [CrossRef] [Green Version]
  57. Laporte, D.; Gouleme, L.; Jimenez, L.; Khemiri, I.; Sagot, I. Mitochondria reorganization upon proliferation arrest predicts individual yeast cell fate. Elife 2018, 7, e35685. [Google Scholar] [CrossRef]
  58. Klaunig, J.E.; Wang, Z.; Pu, X.; Zhou, S. Oxidative stress and oxidative damage in chemical carcinogenesis. Toxicol. Appl. Pharmacol. 2011, 254, 86–99. [Google Scholar] [CrossRef]
  59. James, J.; Fiji, N.; Roy, D.; Andrew, M.G.D.; Shihabudeen, M.S.; Chattopadhyay, D.; Thirumurugan, K. A rapid method to assess reactive oxygen species in yeast using H2DCF-DA. Anal. Methods 2015, 7, 8572–8575. [Google Scholar] [CrossRef]
  60. Markgraf, D.F.; Ahnert, F.; Arlt, H.; Mari, M.; Peplowska, K.; Epp, N.; Griffith, J.; Reggiori, F.; Ungermann, C. The CORVET subunit Vps8 cooperates with the Rab5 homolog Vps21 to induce clustering of late endosomal compartments. Mol. Biol. Cell. 2009, 20, 5276–5289. [Google Scholar] [CrossRef] [Green Version]
  61. Robinson, J.S.; Klionsky, D.J.; Banta, L.M.; Emr, S.D. Protein sorting in Saccharomyces cerevisiae: Isolation of mutants defective in the delivery and processing of multiple vacuolar hydrolases. Mol. Cell. Biol. 1988, 8, 4936–4948. [Google Scholar] [CrossRef]
  62. Davies, B.A.; Topp, J.D.; Sfeir, A.J.; Katzmann, D.J.; Carney, D.S.; Tall, G.G.; Friedberg, A.S.; Deng, L.; Chen, Z.; Horazdovsky, B.F. Vps9p CUE domain ubiquitin binding is required for efficient endocytic protein traffic. J. Biol. Chem. 2003, 278, 19826–19833. [Google Scholar] [CrossRef] [Green Version]
  63. Rothman, J.H.; Howald, I.; Stevens, T.H. Characterization of genes required for protein sorting and vacuolar function in the yeast Saccharomyces cerevisiae. EMBO J. 1989, 8, 2057–2065. [Google Scholar] [CrossRef] [PubMed]
  64. Reggiori, F.; Wang, C.W.; Stromhaug, P.E.; Shintani, T.; Klionsky, D.J. Vps51 is part of the yeast Vps fifty-three tethering complex essential for retrograde traffic from the early endosome and Cvt vesicle completion. J. Biol. Chem. 2003, 278, 5009–5020. [Google Scholar] [CrossRef] [PubMed] [Green Version]
  65. Conibear, E.; Cleck, J.N.; Stevens, T.H. Vps51p mediates the association of the GARP (Vps52/53/54) complex with the late Golgi t-SNARE Tlg1p. Mol. Biol. Cell. 2003, 14, 1610–1623. [Google Scholar] [CrossRef] [PubMed] [Green Version]
  66. Ott, M.; Gogvadze, V.; Orrenius, S.; Zhivotovsky, B. Mitochondria, oxidative stress and cell death. Apoptosis 2007, 12, 913–922. [Google Scholar] [CrossRef] [PubMed]
  67. Valko, M.; Morris, H.; Cronin, M.T. Metals, toxicity and oxidative stress. Curr. Med. Chem. 2005, 12, 1161–1208. [Google Scholar] [CrossRef] [Green Version]
  68. Valko, M.; Leibfritz, D.; Moncol, J.; Cronin, M.T.; Mazur, M.; Telser, J. Free radicals and antioxidants in normal physiological functions and human disease. Int. J. Biochem. Cell Biol. 2007, 39, 44–84. [Google Scholar] [CrossRef]
  69. Salimi, A.; Gholamifar, E.; Naserzadeh, P.; Hosseini, M.J.; Pourahmad, J. Toxicity of lithium on isolated heart mitochondria and cardiomyocyte: A justification for its cardiotoxic adverse effect. J. Biochem. Mol. Toxicol. 2017, 31. [Google Scholar] [CrossRef]
  70. Hroudova, J.; Fisar, Z. Activities of respiratory chain complexes and citrate synthase influenced by pharmacologically different antidepressants and mood stabilizers. Neuro. Endocrinol. Lett. 2010, 31, 336–342. [Google Scholar]
  71. Luptak, M.; Hroudova, J. Important role of mitochondria and the effect of mood stabilizers on mitochondrial function. Physiol. Res. 2019, 68, S3–S15. [Google Scholar] [CrossRef] [PubMed]
  72. Zuo, H.; Chen, L.; Kong, M.; Qiu, L.; Lu, P.; Wu, P.; Yang, Y.; Chen, K. Toxic effects of fluoride on organisms. Life Sci. 2018, 198, 18–24. [Google Scholar] [CrossRef] [PubMed]
  73. Srinivasan, S.; Avadhani, N.G. Cytochrome c oxidase dysfunction in oxidative stress. Free Radic. Biol. Med. 2012, 53, 1252–1263. [Google Scholar] [CrossRef] [PubMed] [Green Version]
  74. Rich, P.R.; Marechal, A. The mitochondrial respiratory chain. Essays Biochem. 2010, 47, 1–23. [Google Scholar] [CrossRef] [PubMed] [Green Version]
Figure 1. Identification of LiPF6-sensitive mutants by genome-wide screening. (A) Sensitivity of S. cerevisiae to LiPF6, LiCl, NaPF6, and both LiCl and NaPF6. Cell growth of BY4741 treated with different concentrations of LiPF6, LiCl, and NaPF6, respectively, was measured by reading absorbance at 600 nm (OD600) at the indicated time points. Growth curves were performed in triplicate. Growth was represented by mean OD600 values and error bars indicate SE. (B) GO term analysis for the 75 genes in Table 1, the deletion of which resulted in LiPF6 sensitivity. (C) KEGG analysis for the 75 genes in Table 1. The p-value was corrected using the Benjamini and Hochberg (1995) correction method [45]. (D) Genetic interactions, physical interactions, and co-localization of the 75 LiPF6-sensitive genes. Grey, red, and blue edges indicate genetic interactions, physical interactions, and co-localization, respectively. The node colors indicate different functions. SE, Standard Error; GO, Gene Ontology; KEGG, Kyoto Encyclopedia of Genes and Genomes.
Cells 10 00888 g001
Figure 2. Oxidative phosphorylation-related gene deletion strains show increased sensitivity to LiPF6. (A) Phenotypes of the SGA control strain (MATa his3Δ::kanMX4) and deletion mutants in our screen. Each strain was arranged in quadruplicate. (B) Spot test to verify the screening results. The control strain and cox5a, cox12, cox14, qcr2, and qcr6 strains were grown to mid-log phase in YPD medium and then diluted to an OD600 of 0.5. Cells were serially diluted onto YPD agar plates either containing 3 mM LiPF6 or no LiPF6. Plates were photographed after 48 h of incubation at 30 °C. Images shown are representative of triplicates. (C) Spot test of the complementation strains. Deletion mutant strains transformed with empty vector or plasmid expressing the corresponding genes were grown to mid-log phase in YPD medium before diluting to an OD600 of 0.5 and cells were serially diluted onto YPD plates with 3 mM LiPF6 or without LiPF6. The control strain transformed with empty vector served as a control. Images were representative of triplicates. SGA, Synthetic Genetic Array; YPD, Yeast Peptone Dextrose.
Cells 10 00888 g002
Figure 3. Effects of LiPF6 on mitochondrial morphology, ROS, and ATP synthesis. (A) Mitochondrial morphology of BY4741 was observed with or without LiPF6. A total of 10 μM CCCP-treated cells served as the positive control. Mitochondria stained with MitoTracker Red CMXRos are shown on the left; 3D volume images of mitochondria are shown in the second column; bright-field micrographs are shown in the third column; and merged images are shown on the right. “−”: without LiPF6 and CCCP; “+ LiPF6”: with 4 mM LiPF6; “+ CCCP”: with 10 μM CCCP. Scale bar represents 5 μm. The percentage of cells exhibiting tubular or fragmented mitochondria was calculated. At least 200 cells of each sample were used for quantitation. Error values indicate the SE from three independent experiments. ***, p < 0.001. (B) Intracellular ROS were detected in BY4741 in the absence or presence of LiPF6. ROS signal stained with H2DCFDA was shown on the left; bright-field micrographs are shown in the middle; and merged images are shown on the right. “−”: without LiPF6; “+”: with 4 mM LiPF6. Scale bar represents 5 μm. (C) Mitochondrial ATP synthesis was measured after incubation with 0 or 4 mM LiPF6. The vertical axis represents the ATP content per mg protein. Error bars indicate the SE from three independent experiments. **, p < 0.01, Student’s t-test. CCCP, Carbonyl cyanide m-chlorophenylhydrazone; ROS, Reactive Oxygen Species; SE, Standard Error.
Cells 10 00888 g003
Figure 4. Oxidative phosphorylation-related genes are required for the regulation of LiPF6-induced ROS. (A) The presence of ROS in BY4741 and the deletion mutant strains in medium with or without LiPF6 was determined. The H2O2-treated SGA control strain (his3Δ) served as a positive control. Left, ROS signal; middle, bright-field micrographs; right, merged images. Scale bar represents 5 μm. (B) Quantifications of H2DCFDA-positive cells. Three independent biological experiments were carried out, and for each replicate, a minimum of 200 cells were counted. The vertical axis represents the percentage of cells with a ROS signal, and the horizontal axis represents the different strains. Error bars indicate SE. ***, p < 0.001, **, p < 0.01, *, p < 0.05, Student’s t-test. (C) Quantifications of fluorescence intensity per cell. Three independent biological experiments were carried out and for each replicate, and a minimum of 200 cells were counted. The vertical axis represents the fluorescence intensity per cell, and the horizontal axis represents the different strains. Error bars indicate SE. ***, p < 0.001, *, p < 0.05, Student’s t-test. (D) Western bolt analysis of Cox5a before and after LiPF6 treatment. Pgk1 served as a loading control. Accumulation levels of Cox5a protein were quantified using ImageJ software. Error bars indicate SE. **, p < 0.01, Student’s t-test. ROS, Reactive Oxygen Species; SE, Standard Error.
Cells 10 00888 g004
Figure 5. Deletion of the oxidative phosphorylation-related genes aggravated the decrease in ATP production under LiPF6 treatment. ATP synthesis abilities were compared between the control strain (his3Δ) and the deletion mutants. The vertical axis represents the ATP content per mg protein. The data shown represent averages of three experiments, and error bars indicate SE. ***, p < 0.001, **, p < 0.01, *, p < 0.05, Student’s t-test. YPD, Yeast Peptone Dextrose; SE, Standard Error.
Cells 10 00888 g005
Figure 6. Oxidative phosphorylation-related genes are not hypersensitive to LiCl or NaPF6. The SGA control strain and deletion strains were grown to mid-log phase in YPD medium before diluting to an OD600 of 0.5. Cultures were serially diluted onto YPD plates containing different concentrations of LiCl or NaPF6. Plates were incubated at 30 °C and photographed. SGA, Synthetic Genetic Array; YPD, Yeast Peptone Dextrose.
Cells 10 00888 g006
Table 1. The 75 genes deleted in the LiPF6-sensitive mutants, as identified from the genome-wide screen.
ORFGeneScore 1 ap-Value 1 aScore 2 ap-Value 2 aScore 3 ap-Value 3 aLocation b
Oxidative Phosphorylation
YNL052WCOX5A−0.37510.00006−0.28800.00027−0.33220.00011mitochondrion
YLR038CCOX12−0.33920.00002−0.79940.00339−0.74400.01456cytoplasm
YML129CCOX14−0.58640.00055−0.73460.00388−0.35170.00018mitochondrion
YPR191WQCR2−0.50950.00365−0.71600.00026−0.35030.00001mitochondrion
YFR033CQCR6−0.21240.00002−0.54720.00001−0.28440.00006cytoplasm
Electron Transport Chain
YNL315CATP11−0.42360.00001−0.48840.00003−0.28340.00001mitochondrion
YNR020CATP23−0.40090.00000−0.42830.00013−0.30160.00001-
YLR393WATP10−0.30610.00000−0.37440.00107−0.41610.00003mitochondrion
YOR125CCAT5−0.66730.00062−0.65310.00018−0.48100.00038-
YNR041CCOQ2−0.51510.00196−0.64840.00043−0.43070.00005mitochondrion
YHR116WCOX23−0.49630.00000−0.64150.00326−0.47250.00035cytoplasm
Mitochondrial Proteins
YMR282CAEP2−0.62560.00030−0.65450.00012−0.40350.00046mitochondrion
YNL003CPET8−0.62970.00277−0.62040.01065−0.48150.00005mitochondrion
YAL048CGEM1−0.52270.00222−0.46280.00008−0.30970.00008-
YPR011C-−0.36960.00006−0.32740.00013−0.27200.00212mitochondrion
YOR045WTOM6−0.29750.00012−0.23180.00004−0.31060.00001mitochondrion
YKL162C-−0.44140.00001−0.36620.00005−0.26340.00001mitochondrion
YOR350CMNE1−0.23840.00003−0.64790.00014−0.28880.00001mitochondrion
YDL104CQRI7−0.62810.00128−0.61040.00025−0.36290.00001mitochondrion
YER153CPET122−0.26640.00032−0.62570.00064−0.38020.00001mitochondrion
YCR071CIMG2−0.56180.00349−0.56900.00003−0.38130.00003mitochondrion
DNA and RNA-Related Genes
YCR028C-ARIM1−0.57140.00325−0.58150.00024−0.29900.00003mitochondrion
YKL208WCBT1−0.46500.00064−0.80630.00017−0.46490.00002mitochondrion
YOL080CREX4−0.54780.00000−0.59250.00001−0.46100.00001nucleolus, nucleus
YDL033CSLM3−0.42630.00014−0.57730.00007−0.40090.00002mitochondrion
YKL074CMUD2−0.39400.00001−0.22440.00011−0.27300.00001cytoplasm, nucleus
YOR033CEXO1−0.68150.00162−0.58060.00015−0.27380.00001nucleus
YNL215WIES2−0.41730.00006−0.37610.00000−0.25940.00003nucleus
YDR386WMUS81−0.25060.00000−0.36850.00003−0.23870.00001-
YIR002CMPH1−0.31170.00000−0.22640.00001−0.50030.00021cytoplasm, nucleus
YOL095CHMI1−0.67350.00339−0.57630.00010−0.23540.00002-
YPR022C-−0.31920.00020−0.38450.00000−0.49430.00003cytoplasm, nucleus
YNL136WEAF7−0.43890.00004−0.26740.00001−0.20940.00001nucleus
YER143WDDI1−0.33620.00000−0.23920.00001−0.26290.00002cytoplasm
YCR077CPAT1−0.37270.00008−0.36010.00001−0.31470.00005cytoplasm
YGL168WHUR1−0.31310.00001−0.52680.00000−0.40620.00001-
Transport System
YAL002WVPS8−0.67840.00002−0.64230.00002−0.46570.00001endosome
YML097CVPS9−0.61790.00001−0.51430.00003−0.53460.00008cytoplasm
YKR020WVPS51−0.48770.00012−0.42490.00002−0.34400.00004punctate composite
YKL041WVPS24−0.46520.00000−0.40970.00026−0.28600.00006punctate composite, endosome
YOR322CLDB19−0.69970.00006−0.40520.00000−0.29720.00003cytoplasm, late Golgi
YLR065CENV10−0.22370.00003−0.27070.00001−0.38960.00009ambiguous
YMR021CMAC1−0.53250.00027−0.57490.00014−0.52730.00029cytoplasm, nucleus
YGR105WVMA21−0.50960.00006−0.43750.00002−0.39840.00002vacuole
YDR126WSWF1−0.49260.00004−0.26020.00000−0.32490.00002-
YMR123WPKR1−0.29930.00000−0.22860.00002−0.20830.00005ER
YOR181WLAS17−0.21130.00001−0.20260.00002−0.20520.00002actin
YLR337CVRP1−0.50670.00006−0.38040.00000−0.62440.00002punctate composite, actin
Cell Metabolism
YMR189WGCV2−0.20850.00000−0.44200.00030−0.55000.00002mitochondrion
YGL237CHAP2−0.51620.00004−0.29850.00000−0.36600.00000nucleus
YCR053WTHR4−0.29610.00004−0.35730.00001−0.37670.00016cytoplasm, nucleus
YPL157WTGS1−0.42550.00001−0.24660.00001−0.23100.00002nucleolus
YMR216CSKY1−0.65090.00035−0.58100.00003−0.57510.00002cytoplasm
YLR436CECM30−0.27240.00002−0.43120.00000−0.43280.00002cytoplasm
YHR096CHXT5−0.22060.00004−0.22800.00002−0.29110.00003-
YBL021CHAP3−0.33530.00082−0.22170.00000−0.30640.00000cytoplasm, nucleus
YNL229CURE2−0.26390.00012−0.31450.00001−0.22080.00000cytoplasm
Protein Synthesis and Degradation
YNL162WRPL42A−0.28850.00000−0.21050.00000−0.22940.00000cytoplasm
YBL024WNCL1−0.59150.00002−0.56680.00001−0.40870.00007nucleus
YPR148C-−0.41260.00003−0.37590.00002−0.46870.00003punctate composite
YKL081WTEF4−0.39320.00001−0.32160.00003−0.35710.00000cytoplasm
YBR082CUBC4−0.27830.00002−0.35560.00001−0.30650.00000cytoplasm, nucleus
YOL025WLAG2−0.34600.00001−0.24280.00000−0.34090.00001-
YNL153CGIM3−0.25390.00004−0.23000.00002−0.42800.00005cytoplasm
Cell Resistance
YOR084WLPX1−0.41310.00000−0.37100.00029−0.23180.00011ambiguous
YPL196WOXR1−0.38090.00001−0.29650.00000−0.20730.00000-
YBL043WECM13−0.44610.00002−0.46890.00000−0.34060.00001-
YPL056CLCL1−0.34800.00005−0.35830.00004−0.39460.00002-
YBR067CTIP1−0.20710.00006−0.28960.00003−0.22850.00000ER
YGL007WBRP1−0.72190.00031−0.70440.00002−0.62130.00005-
Unknown
YDL062W −0.46260.00485−0.52240.00048−0.34120.00002-
YCL036WGFD2−0.35460.00005−0.43420.00023−0.34470.00037-
YDR360WOPI7−0.41440.00001−0.39200.00002−0.30420.00000-
YDR209C-−0.36990.00002−0.34550.00001−0.33060.00000-
YDL187C-−0.44460.00048−0.30410.00013−0.44040.00030-
a 1, 2, and 3 indicate three independent replicates. b “-” indicates unknown.
Publisher’s Note: MDPI stays neutral with regard to jurisdictional claims in published maps and institutional affiliations.

