
Unraveling Human AQP5-PIP Molecular Interaction and Effect on AQP5 Salivary Glands Localization in SS Patients

 , , ,
, , ,  , , , , and add
Show full author list
, , , , and add
Show full author list
Abstract
:
1. Introduction
2. Materials and Methods
2.1. Plasmid Preparation
2.2. cRNA Preparation and Xenopus leavis Swell Assay
2.3. Isolation of Oocytes Membrane
2.4. Cell Culture and Transfection
2.5. NS-SV-AC Proximity Ligation Assay
2.6. PIP Cloning, Expression, Purification, and Deglycosylation
2.7. AQP5 Expression, Purification
2.8. Co-Elution Assay
2.9. Microscale Thermophoresis
2.10. Immunoprecipitation and Western Blotting
2.11. In-Gel Trypsin Digestion of Immunoprecipitated Proteins and Liquid Chromatography/Electrospray Ionization MS/MS Analysis
2.12. PIP Knockout Mice
2.13. Mice SGs Immunohistochemistry
2.14. Human Minor SG Samples
2.15. hMSG Proximity Ligation Assay
2.16. Double Immunofluorescence
2.17. Statistical Analyses
3. Results
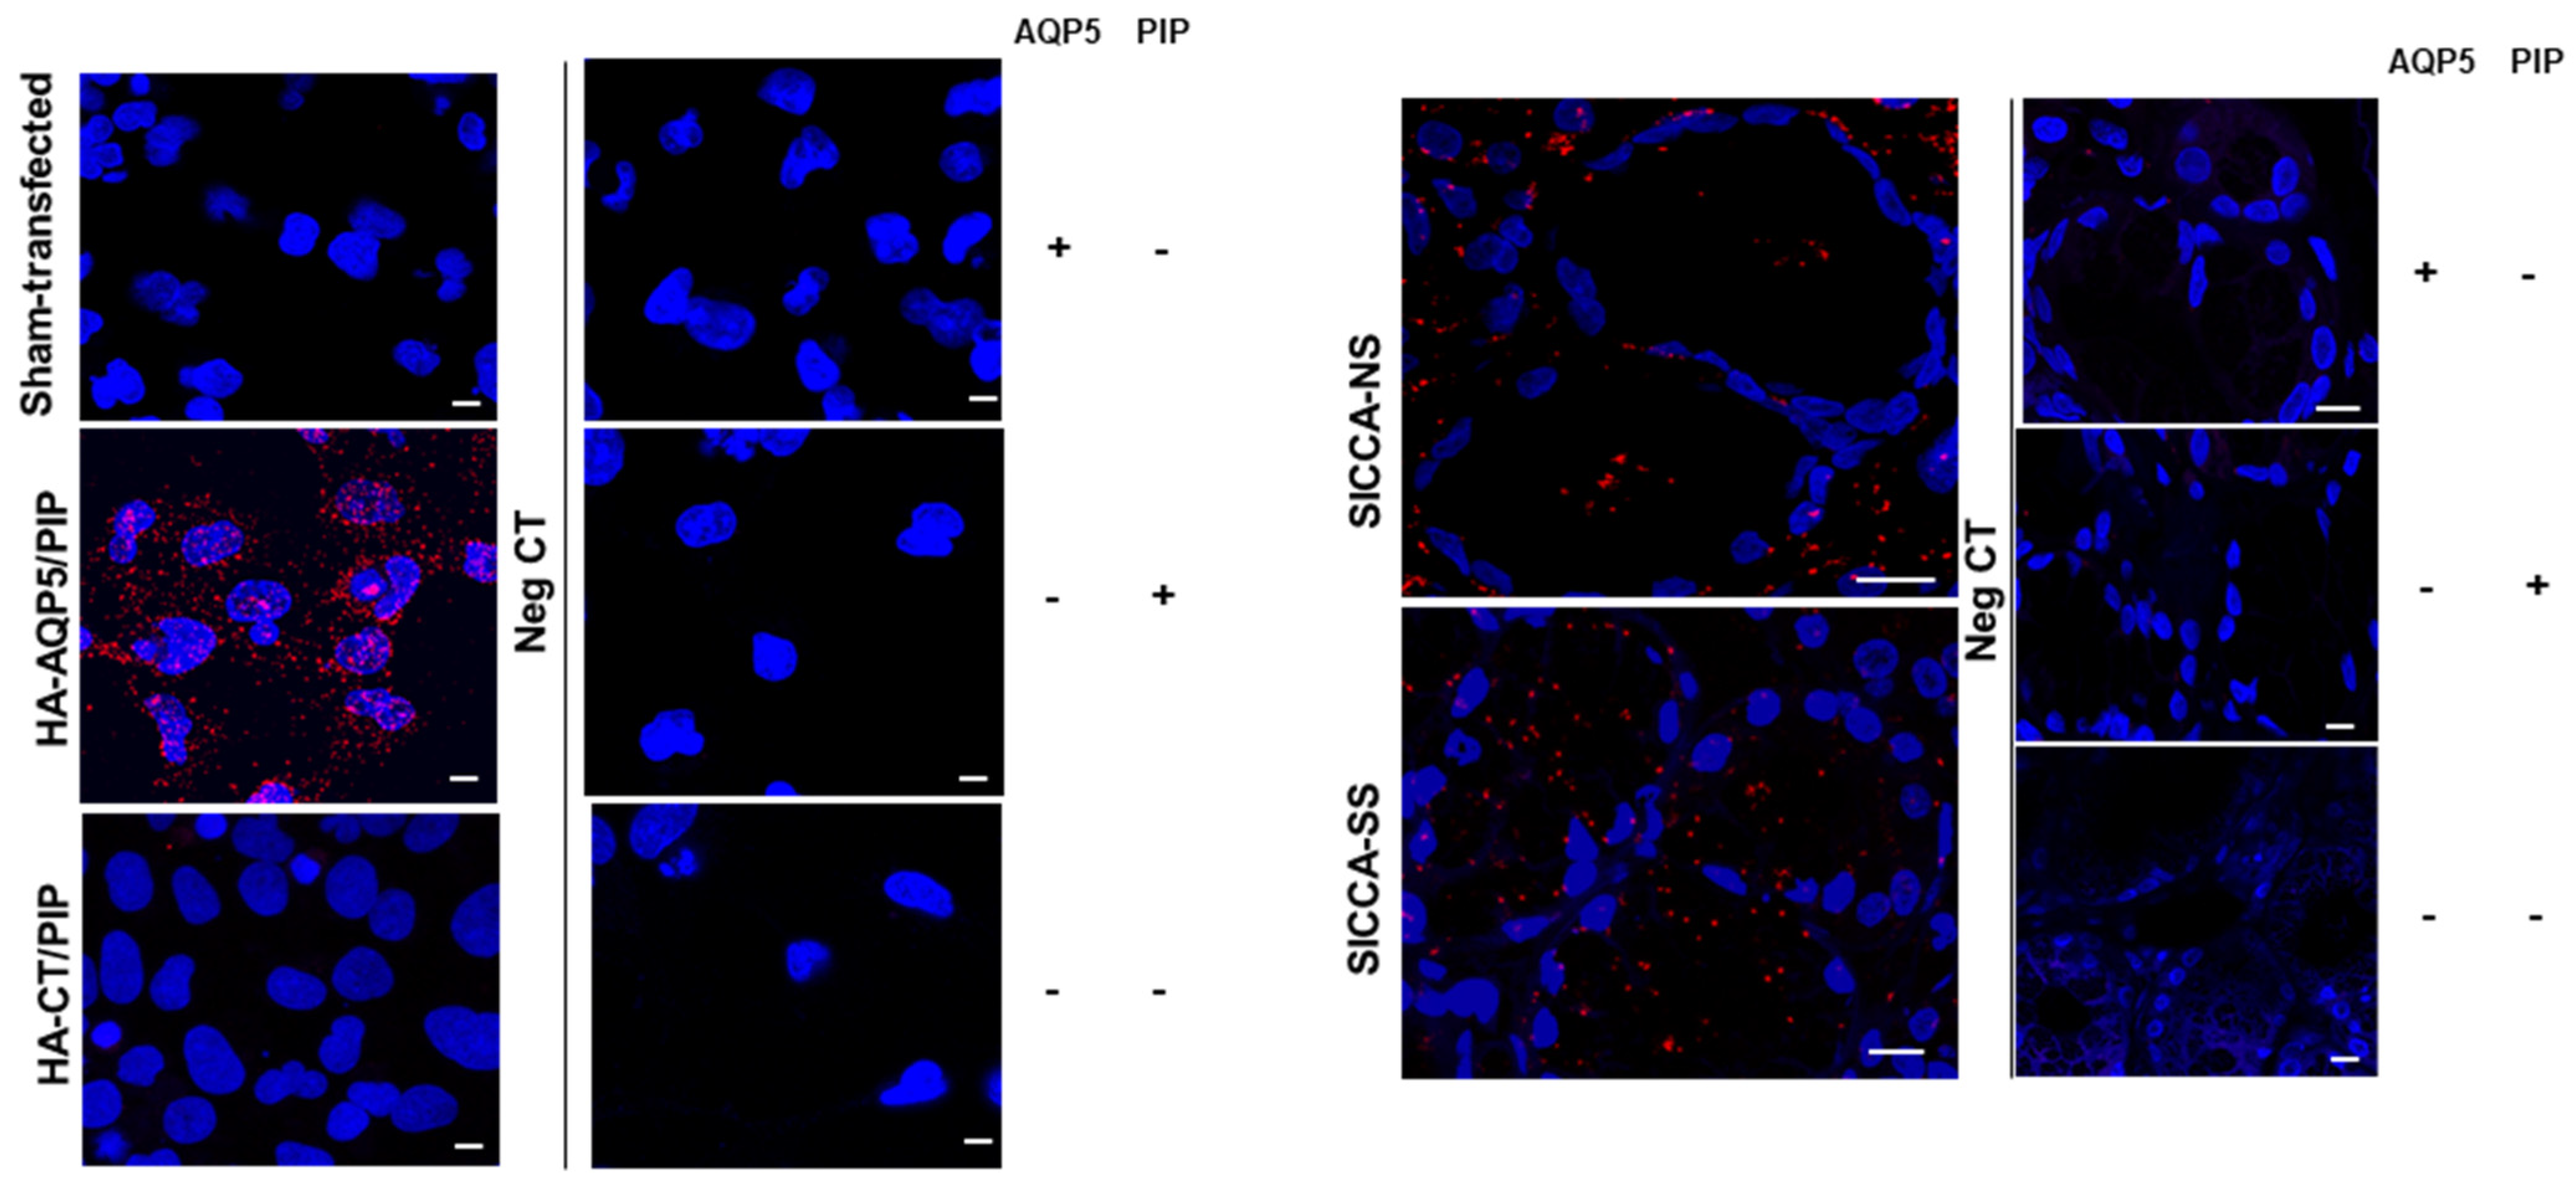
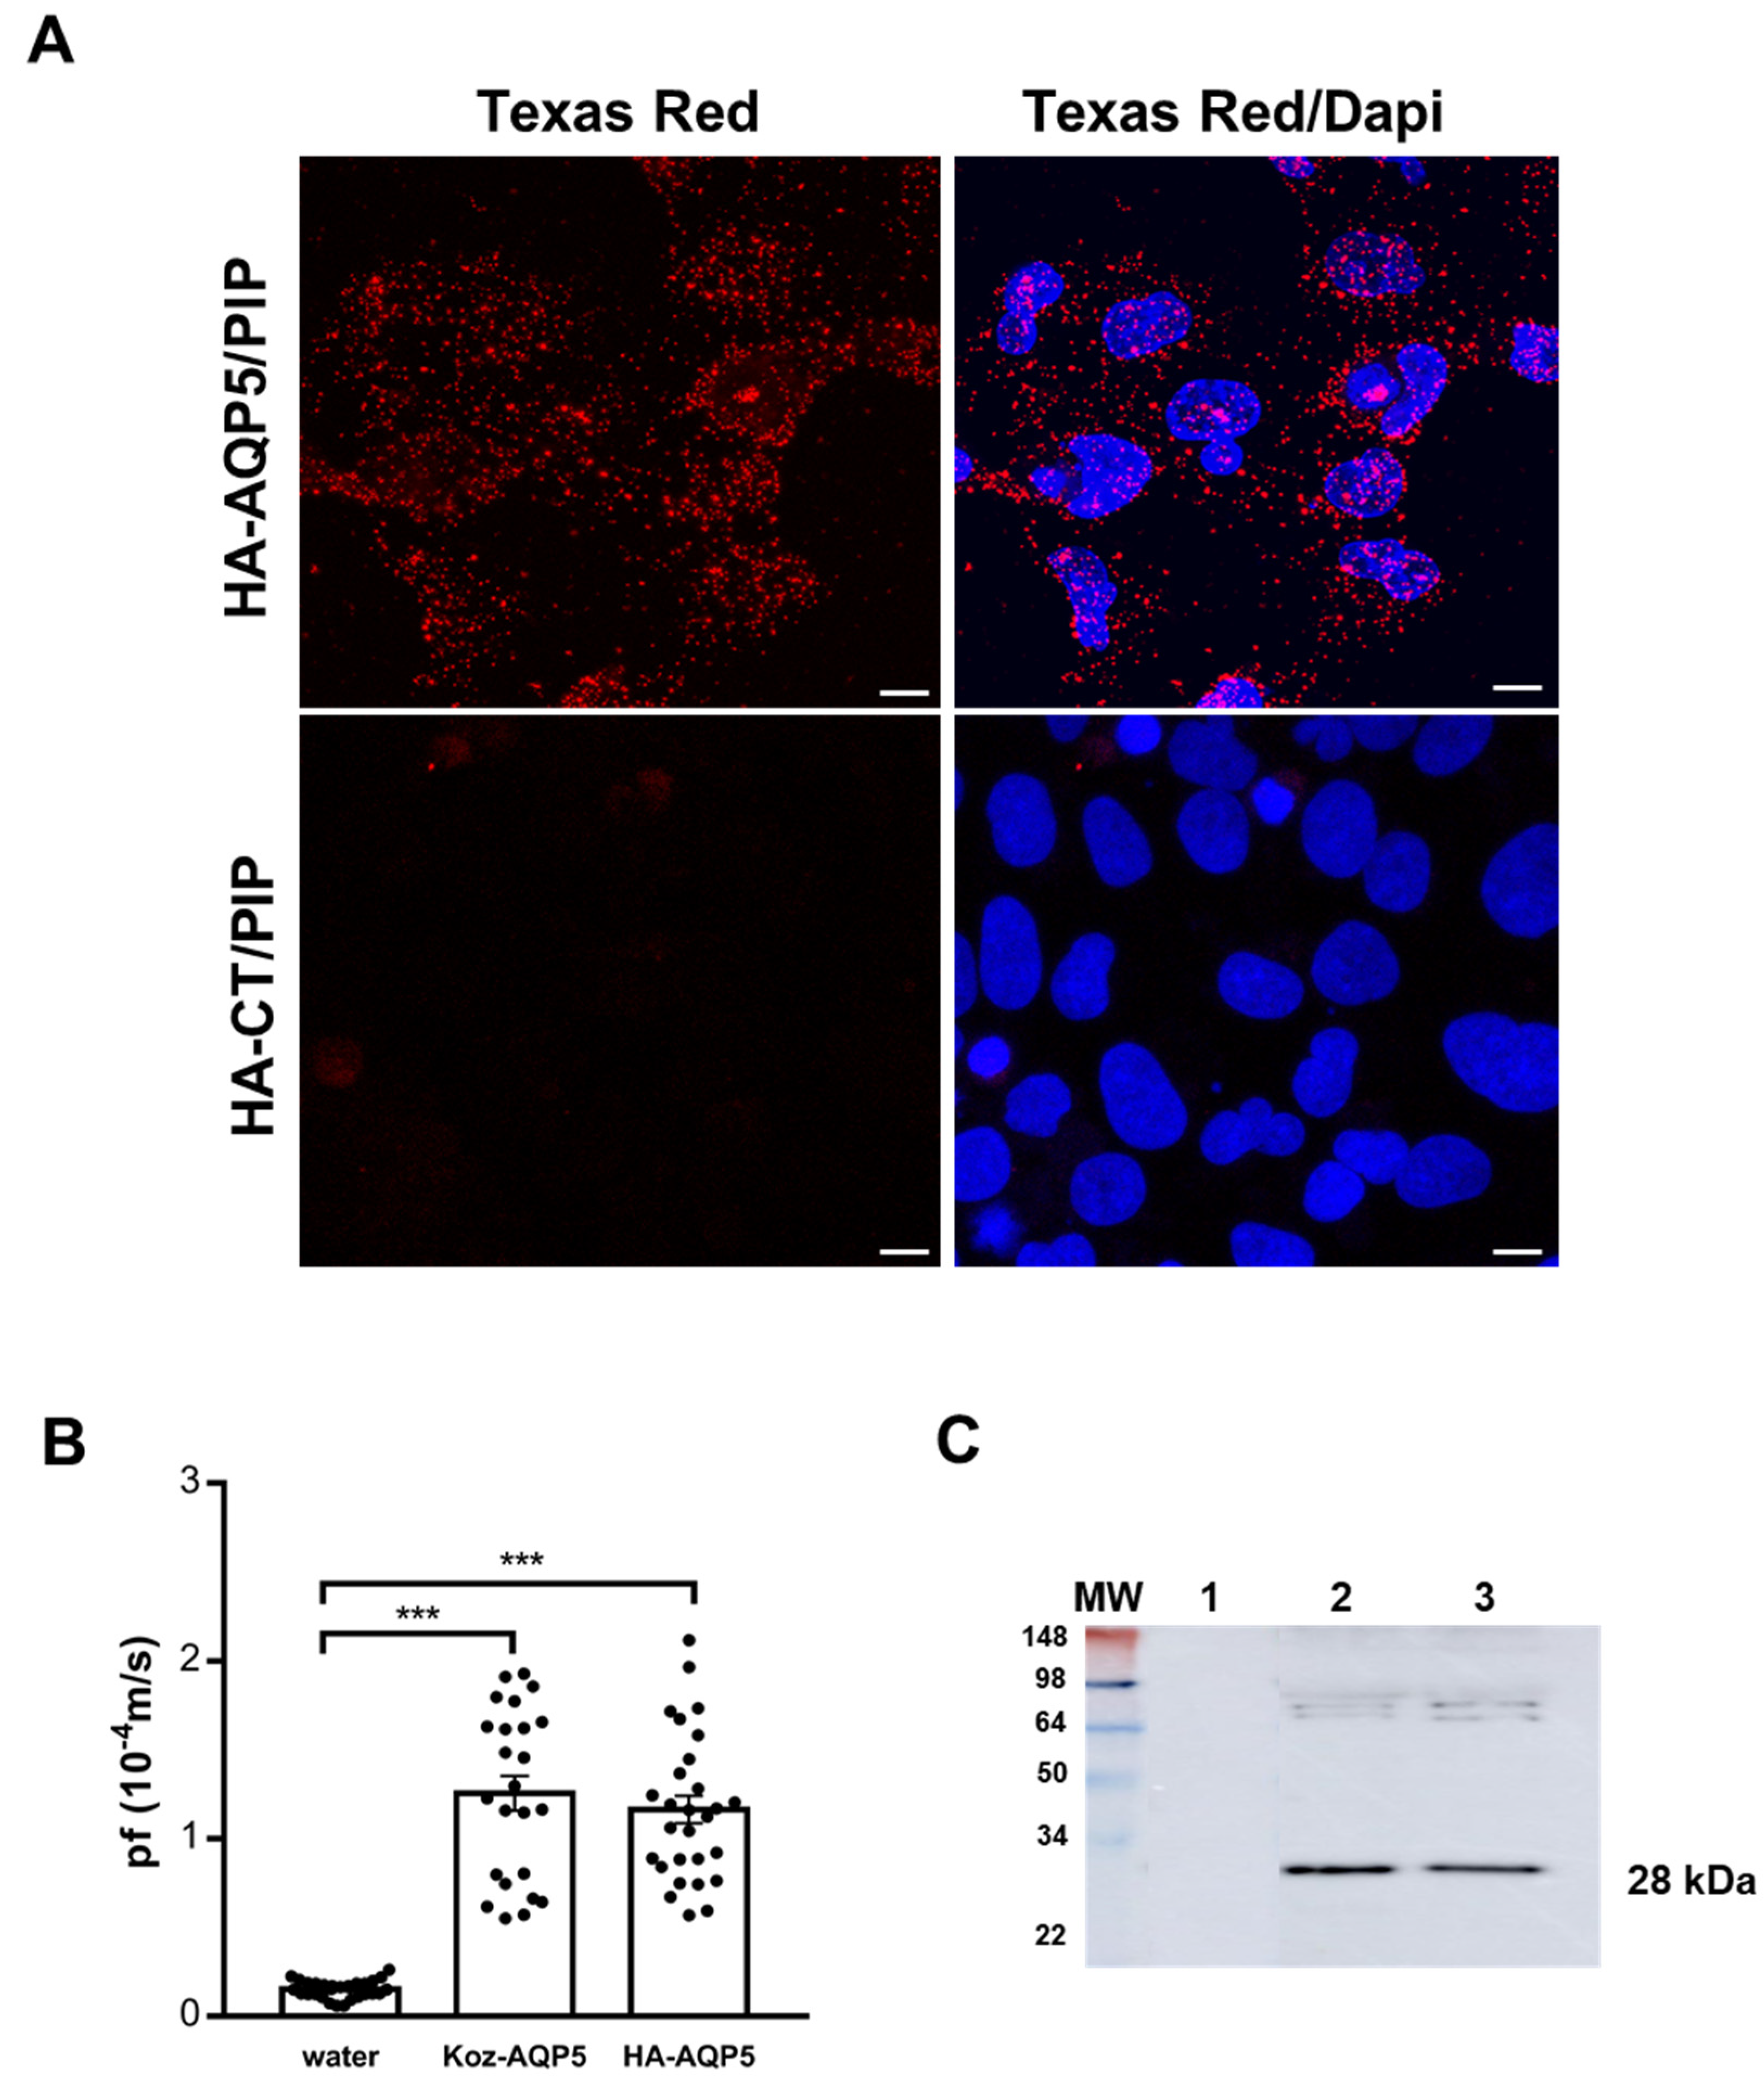
3.1. In Vitro Assessment of Human AQP5 and PIP Protein-Protein Interaction in NS-SV-AC Cells
3.2. Molecular Basis for Human AQP5-PIP Protein-Protein Interaction
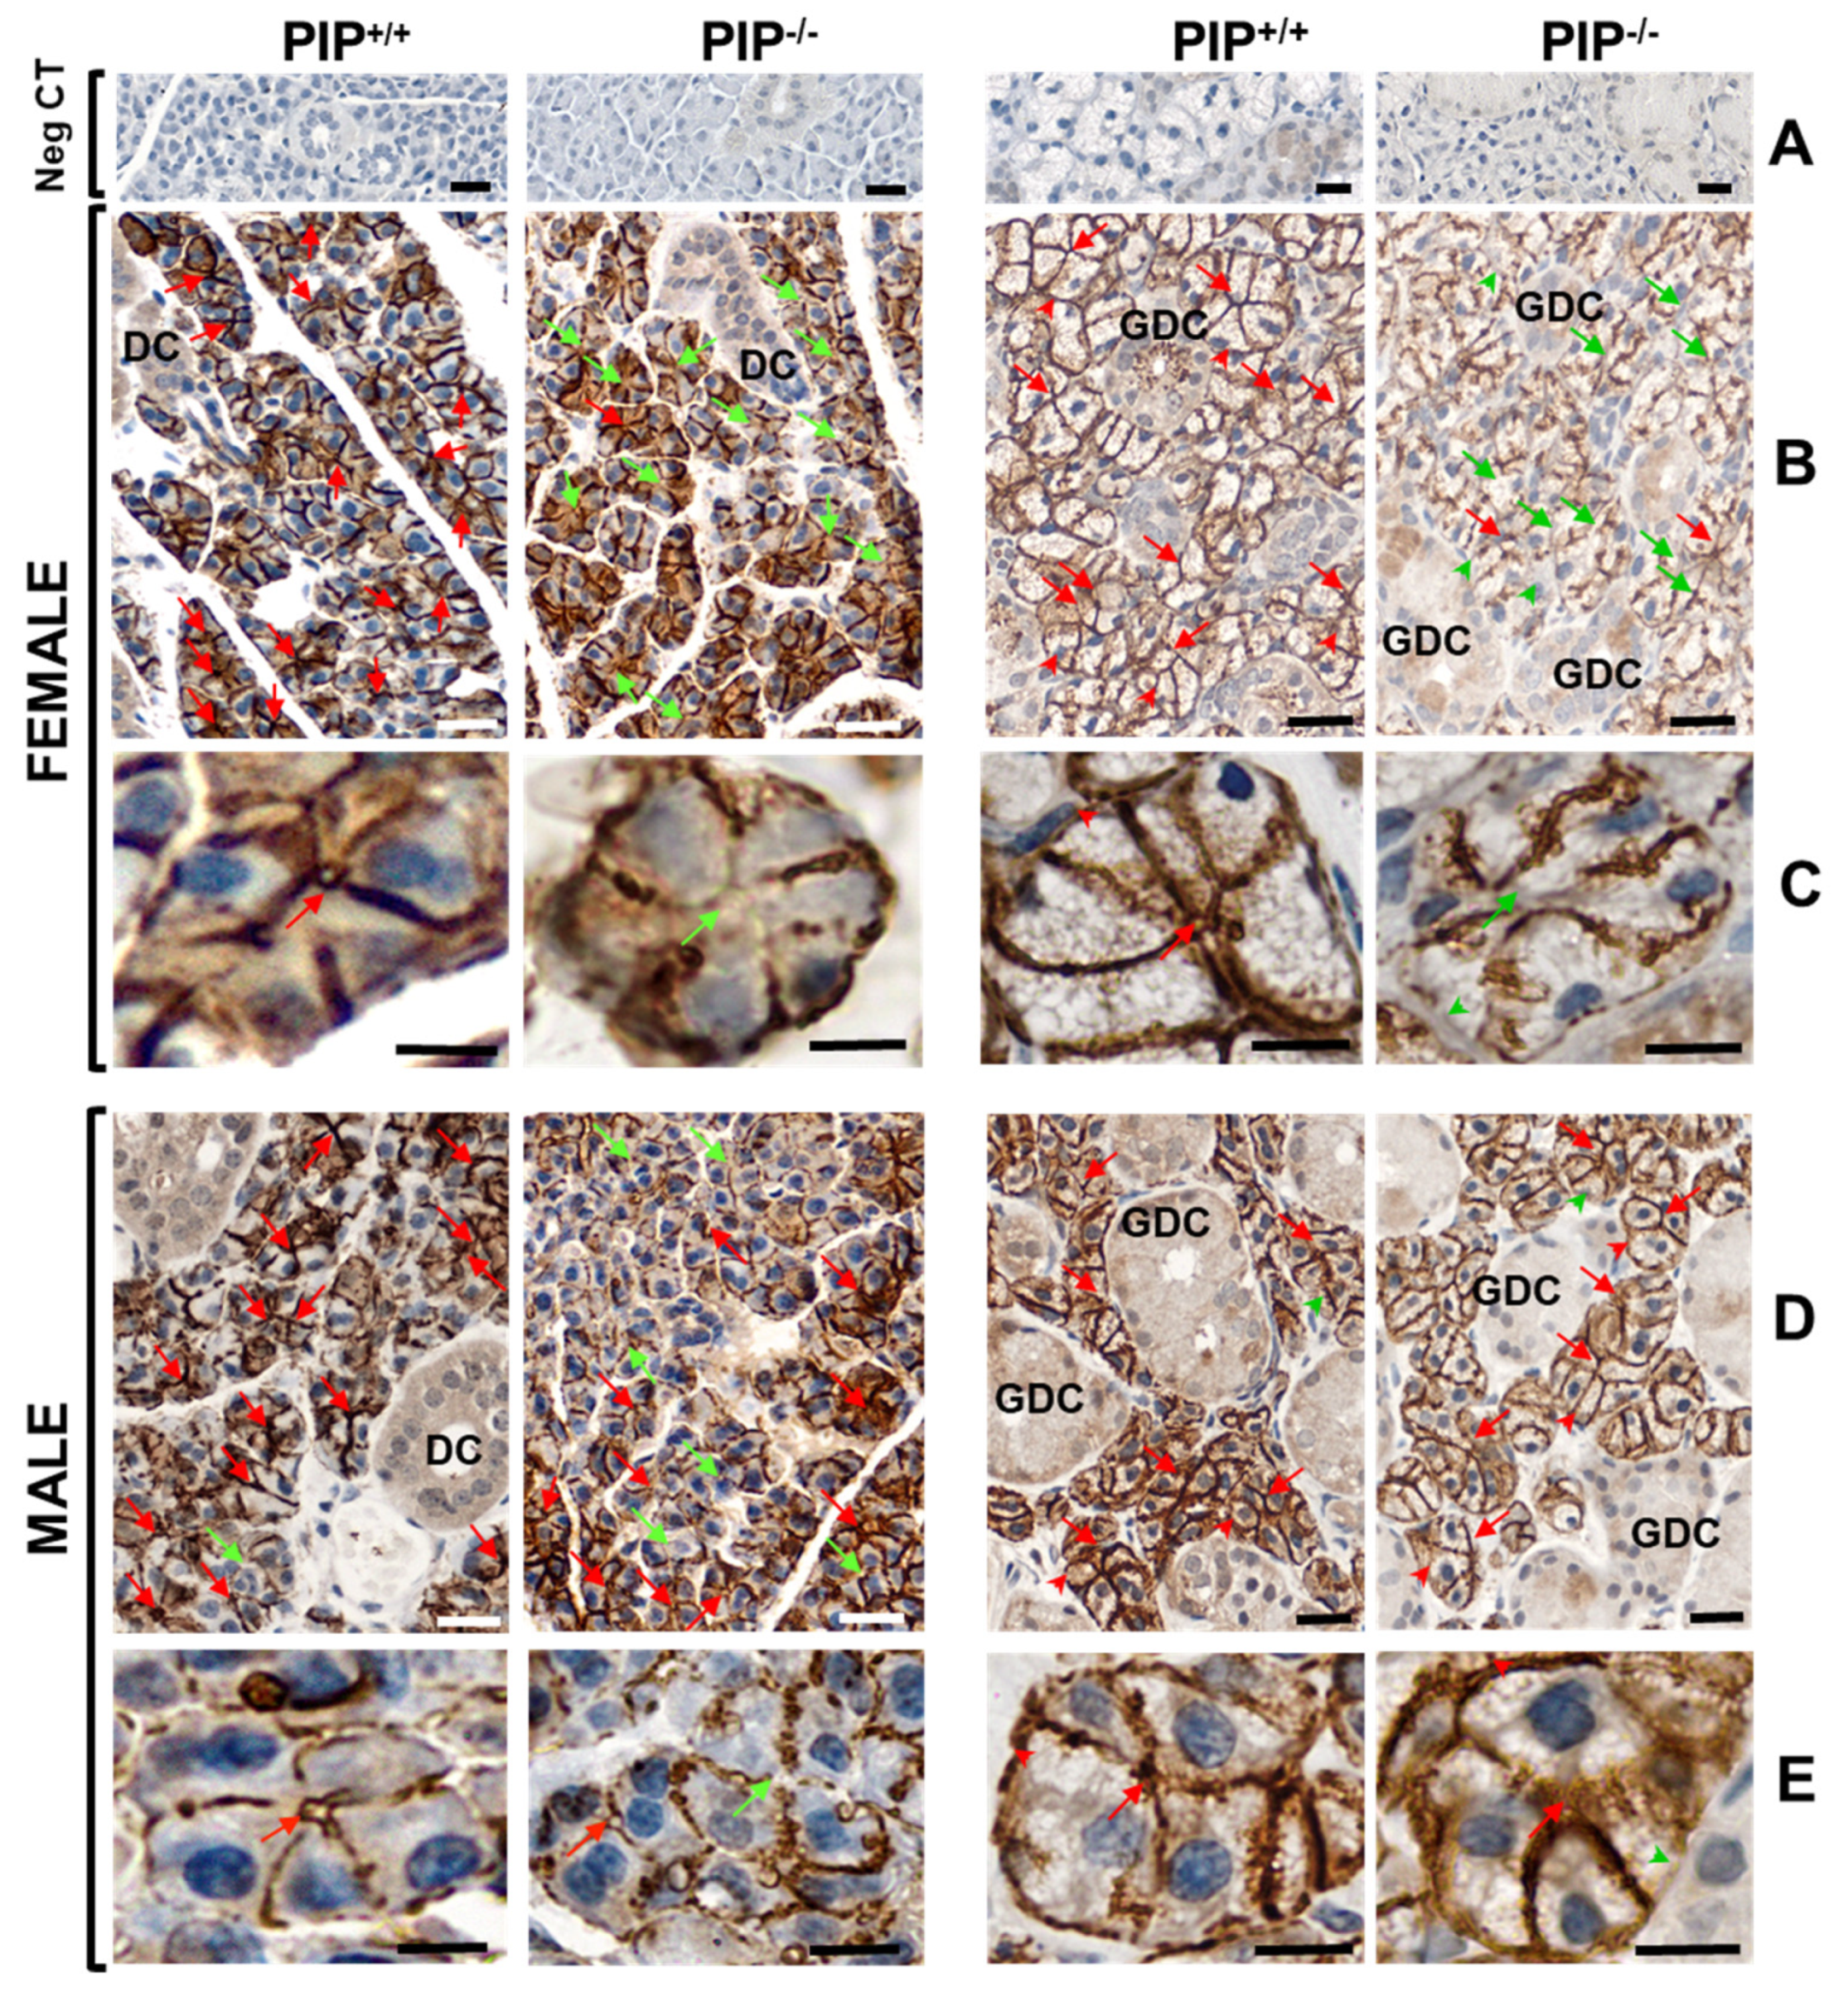
3.3. Identification of PIP-AQP5 Interaction in Mouse SGs
3.4. Altered AQP5 Localization in SG of PIP Knockout Mice
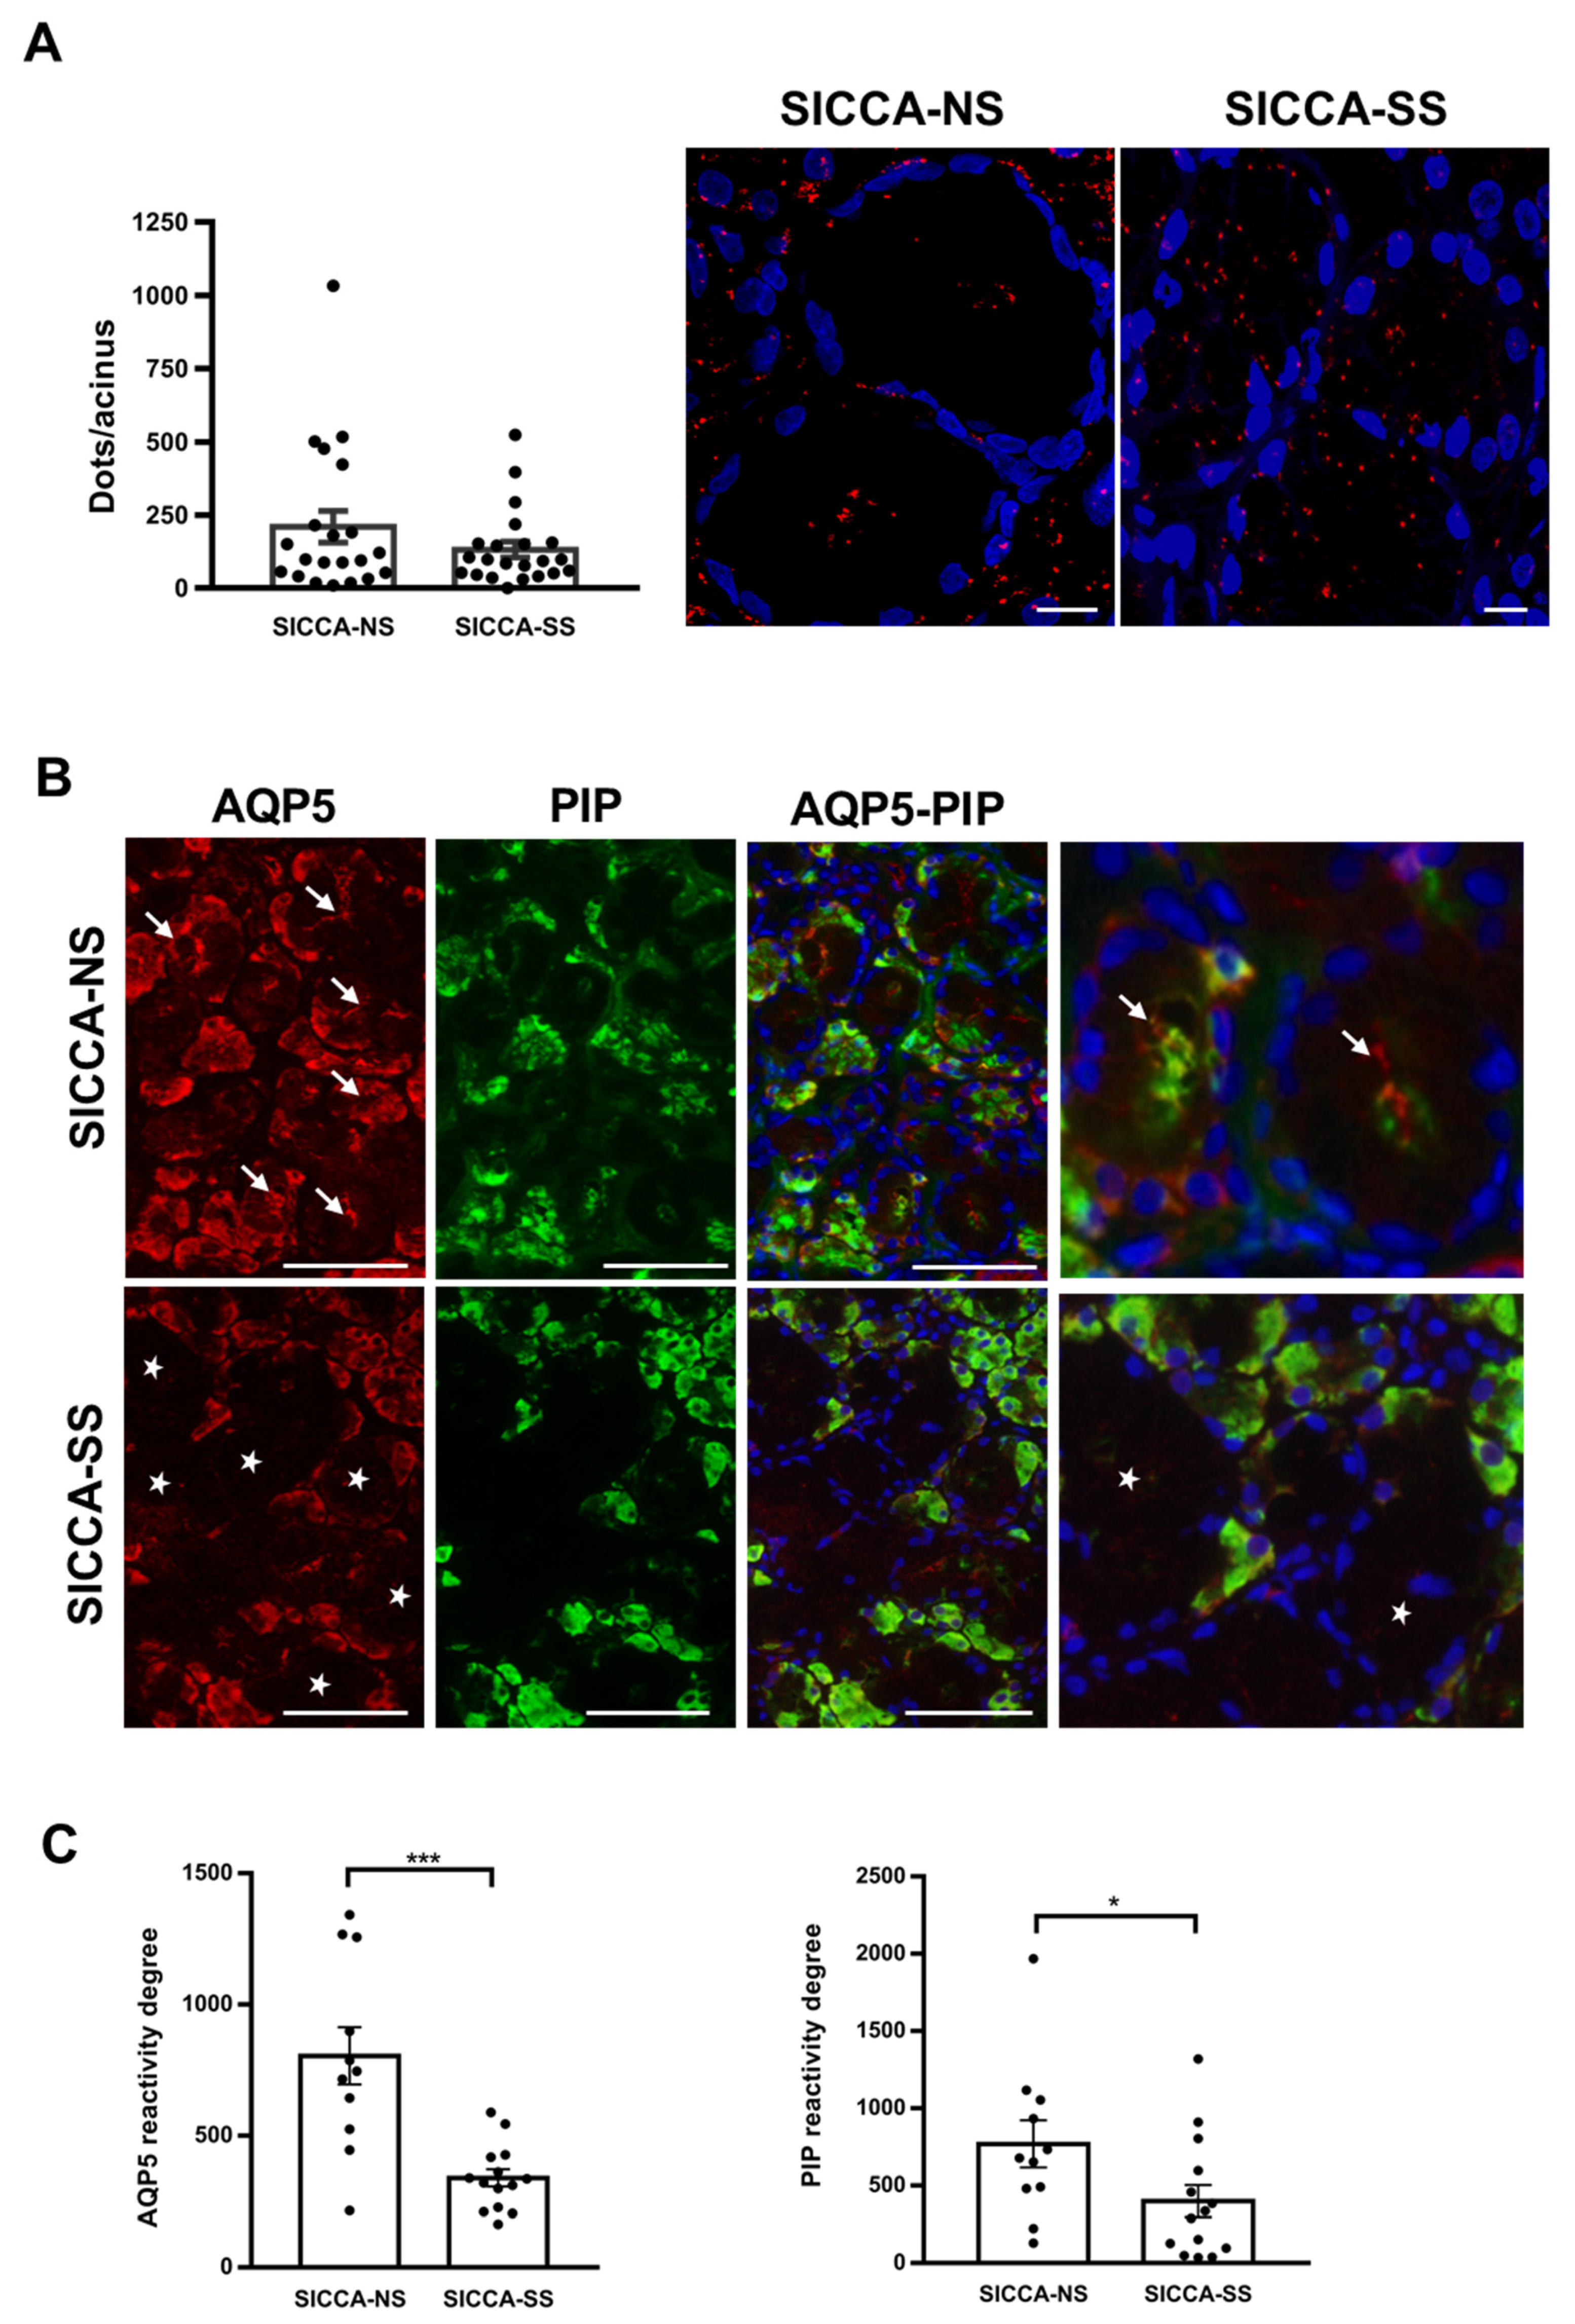
3.5. Altered Localization of AQP5-PIP Complexes and AQP5 and PIP in Human Minor SG Acini from SS Patients
4. Discussion
5. Conclusions
Author Contributions
Funding
Institutional Review Board Statement
Informed Consent Statement
Data Availability Statement
Acknowledgments
Conflicts of Interest
Appendix A

References
- Parisis, D.; Chivasso, C.; Perret, J.; Soyfoo, M.S.; Delporte, C. Current State of Knowledge on Primary Sjögren’s Syndrome, an Autoimmune Exocrinopathy. J. Clin. Med. 2020, 9, 2299. [Google Scholar] [CrossRef] [PubMed]
- Agre, P. Aquaporin Water Channels (Nobel Lecture). Angew. Chem. Int. Ed. Engl. 2004, 43, 4278–4290. [Google Scholar] [CrossRef] [PubMed]
- Horsefield, R.; Nordén, K.; Fellert, M.; Backmark, A.; Törnroth-Horsefield, S.; van Scheltinga, A.C.T.; Kvassman, J.; Kjellbom, P.; Johanson, U.; Neutze, R. High-Resolution x-Ray Structure of Human Aquaporin 5. Proc. Natl. Acad. Sci. USA 2008, 105, 13327–13332. [Google Scholar] [CrossRef] [PubMed] [Green Version]
- Hosoi, K.; Yao, C.; Hasegawa, T.; Yoshimura, H.; Akamatsu, T. Dynamics of Salivary Gland AQP5 under Normal and Pathologic Conditions. Int. J. Mol. Sci. 2020, 21, 1182. [Google Scholar] [CrossRef] [PubMed] [Green Version]
- Delporte, C. Aquaporins in Secretory Glands and Their Role in Sjögren’s Syndrome. Handb. Exp. Pharmacol. 2009, 185–201. [Google Scholar] [CrossRef] [Green Version]
- Tsubota, K.; Hirai, S.; King, L.S.; Agre, P.; Ishida, N. Defective Cellular Trafficking of Lacrimal Gland Aquaporin-5 in Sjögren’s Syndrome. Lancet 2001, 357, 688–689. [Google Scholar] [CrossRef]
- Steinfeld, S.; Cogan, E.; King, L.S.; Agre, P.; Kiss, R.; Delporte, C. Abnormal Distribution of Aquaporin-5 Water Channel Protein in Salivary Glands from Sjögren’s Syndrome Patients. Lab. Investig. 2001, 81, 143–148. [Google Scholar] [CrossRef] [PubMed] [Green Version]
- Yoshimura, S.; Nakamura, H.; Horai, Y.; Nakajima, H.; Shiraishi, H.; Hayashi, T.; Takahashi, T.; Kawakami, A. Abnormal Distribution of AQP5 in Labial Salivary Glands Is Associated with Poor Saliva Secretion in Patients with Sjögren’s Syndrome Including Neuromyelitis Optica Complicated Patients. Mod. Rheumatol. 2016, 26, 384–390. [Google Scholar] [CrossRef]
- Ohashi, Y.; Tsuzaka, K.; Takeuchi, T.; Sasaki, Y.; Tsubota, K. Altered Distribution of Aquaporin 5 and Its C-Terminal Binding Protein in the Lacrimal Glands of a Mouse Model for Sjögren’s Syndrome. Curr. Eye Res. 2008, 33, 621–629. [Google Scholar] [CrossRef]
- Zhou, L.; Wei, R.; Zhao, P.; Koh, S.K.; Beuerman, R.W.; Ding, C. Proteomic Analysis Revealed the Altered Tear Protein Profile in a Rabbit Model of Sjögren’s Syndrome-Associated Dry Eye. Proteomics 2013, 13, 2469–2481. [Google Scholar] [CrossRef] [Green Version]
- Gallo, A.; Martini, D.; Sernissi, F.; Giacomelli, C.; Pepe, P.; Rossi, C.; Riveros, P.; Mosca, M.; Alevizos, I.; Baldini, C. Gross Cystic Disease Fluid Protein-15(GCDFP-15)/Prolactin-Inducible Protein (PIP) as Functional Salivary Biomarker for Primary Sjögren’s Syndrome. J. Genet. Syndr. Gene Ther. 2013, 4. [Google Scholar] [CrossRef] [Green Version]
- Cecchettini, A.; Finamore, F.; Ucciferri, N.; Donati, V.; Mattii, L.; Polizzi, E.; Ferro, F.; Sernissi, F.; Mosca, M.; Bombardieri, S.; et al. Phenotyping Multiple Subsets in Sjögren’s Syndrome: A Salivary Proteomic SWATH-MS Approach towards Precision Medicine. Clin. Proteom. 2019, 16, 26. [Google Scholar] [CrossRef] [PubMed]
- Myal, Y.; Gregory, C.; Wang, H.; Hamerton, J.L.; Shiu, R.P. The Gene for Prolactin-Inducible Protein (PIP), Uniquely Expressed in Exocrine Organs, Maps to Chromosome 7. Somat. Cell Mol. Genet. 1989, 15, 265–270. [Google Scholar] [CrossRef] [PubMed]
- Lee, B.; Bowden, G.H.W.; Myal, Y. Identification of Mouse Submaxillary Gland Protein in Mouse Saliva and Its Binding to Mouse Oral Bacteria. Arch. Oral Biol. 2002, 47, 327–332. [Google Scholar] [CrossRef]
- Zhou, L.; Beuerman, R.W.; Chan, C.M.; Zhao, S.Z.; Li, X.R.; Yang, H.; Tong, L.; Liu, S.; Stern, M.E.; Tan, D. Identification of Tear Fluid Biomarkers in Dry Eye Syndrome Using ITRAQ Quantitative Proteomics. J. Proteome Res. 2009, 8, 4889–4905. [Google Scholar] [CrossRef]
- Hassan, M.I.; Bilgrami, S.; Kumar, V.; Singh, N.; Yadav, S.; Kaur, P.; Singh, T.P. Crystal Structure of the Novel Complex Formed between Zinc Alpha2-Glycoprotein (ZAG) and Prolactin-Inducible Protein (PIP) from Human Seminal Plasma. J. Mol. Biol. 2008, 384, 663–672. [Google Scholar] [CrossRef]
- Caputo, E.; Camarca, A.; Moharram, R.; Tornatore, P.; Thatcher, B.; Guardiola, J.; Martin, B.M. Structural Study of GCDFP-15/Gp17 in Disease versus Physiological Conditions Using a Proteomic Approach. Biochemistry 2003, 42, 6169–6178. [Google Scholar] [CrossRef]
- Blanchard, A.; Nistor, A.; Castaneda, F.E.; Martin, D.; Hicks, G.G.; Amara, F.; Shiu, R.P.C.; Myal, Y. Generation and Initial Characterization of the Prolactin-Inducible Protein (PIP) Null Mouse: Accompanying Global Changes in Gene Expression in the Submandibular Gland. Can. J. Physiol. Pharmacol. 2009, 87, 859–872. [Google Scholar] [CrossRef]
- Fetter, K.; Van Wilder, V.; Moshelion, M.; Chaumont, F. Interactions between Plasma Membrane Aquaporins Modulate Their Water Channel Activity. Plant Cell 2004, 16, 215–228. [Google Scholar] [CrossRef] [Green Version]
- Azuma, M.; Tamatani, T.; Kasai, Y.; Sato, M. Immortalization of Normal Human Salivary Gland Cells with Duct-, Myoepithelial-, Acinar-, or Squamous Phenotype by Transfection with SV40 Ori- Mutant Deoxyribonucleic Acid. Lab. Investig. 1993, 69, 24–42. [Google Scholar]
- Backmark, A.; Nyblom, M.; Törnroth-Horsefield, S.; Kosinska-Eriksson, U.; Nordén, K.; Fellert, M.; Kjellbom, P.; Johanson, U.; Hedfalk, K.; Lindkvist-Petersson, K.; et al. Affinity Tags Can Reduce Merohedral Twinning of Membrane Protein Crystals. Acta Crystallogr. Sect. D Biol. Crystallogr. 2008, 64, 1183–1186. [Google Scholar] [CrossRef] [PubMed]
- Wang, Z.; Schey, K.L. Identification of a Direct Aquaporin-0 Binding Site in the Lens-Specific Cytoskeletal Protein Filensin. Exp. Eye Res. 2017, 159, 23–29. [Google Scholar] [CrossRef]
- Shiboski, C.H.; Shiboski, S.C.; Seror, R.; Criswell, L.A.; Labetoulle, M.; Lietman, T.M.; Rasmussen, A.; Scofield, H.; Vitali, C.; Bowman, S.J.; et al. 2016 American College of Rheumatology/European League Against Rheumatism Classification Criteria for Primary Sjögren’s Syndrome: A Consensus and Data-Driven Methodology Involving Three International Patient Cohorts. Arthritis Rheumatol. 2017, 69, 35–45. [Google Scholar] [CrossRef] [PubMed]
- Schindelin, J.; Arganda-Carreras, I.; Frise, E.; Kaynig, V.; Longair, M.; Pietzsch, T.; Preibisch, S.; Rueden, C.; Saalfeld, S.; Schmid, B.; et al. Fiji: An Open-Source Platform for Biological-Image Analysis. Nat. Methods 2012, 9, 676–682. [Google Scholar] [CrossRef] [Green Version]
- Roche, J.V.; Nesverova, V.; Olsson, C.; Deen, P.M.; Törnroth-Horsefield, S. Structural Insights into AQP2 Targeting to Multivesicular Bodies. Int. J. Mol. Sci. 2019, 20, 5351. [Google Scholar] [CrossRef] [Green Version]
- Reichow, S.L.; Clemens, D.M.; Freites, J.A.; Németh-Cahalan, K.L.; Heyden, M.; Tobias, D.J.; Hall, J.E.; Gonen, T. Allosteric mechanism of water-channel gating by Ca2+-calmodulin. Nat. Struct. Mol. Biol. 2013, 20, 1085–1092. [Google Scholar] [CrossRef] [PubMed] [Green Version]
- Kitchen, P.; Salman, M.M.; Halsey, A.M.; Clarke-Bland, C.; MacDonald, J.A.; Ishida, H.; Vogel, H.J.; Almutiri, S.; Logan, A.; Kreida, S.; et al. Targeting Aquaporin-4 Subcellular Localization to Treat Central Nervous System Edema. Cell 2020, 181, 784–799.e19. [Google Scholar] [CrossRef]
- Lee, M.G.; Ohana, E.; Park, H.W.; Yang, D.; Muallem, S. Molecular Mechanism of Pancreatic and Salivary Gland Fluid and HCO3 Secretion. Physiol. Rev. 2012, 92, 39–74. [Google Scholar] [CrossRef] [Green Version]
- Ma, T.; Song, Y.; Gillespie, A.; Carlson, E.J.; Epstein, C.J.; Verkman, A.S. Defective Secretion of Saliva in Transgenic Mice Lacking Aquaporin-5 Water Channels. J. Biol. Chem. 1999, 274, 20071–20074. [Google Scholar] [CrossRef] [PubMed] [Green Version]
- Krane, C.M.; Melvin, J.E.; Nguyen, H.V.; Richardson, L.; Towne, J.E.; Doetschman, T.; Menon, A.G. Salivary Acinar Cells from Aquaporin 5-Deficient Mice Have Decreased Membrane Water Permeability and Altered Cell Volume Regulation. J. Biol. Chem. 2001, 276, 23413–23420. [Google Scholar] [CrossRef] [Green Version]
- Delporte, C. Aquaporins in Salivary Glands and Pancreas. Biochim. Biophys. Acta 2014, 1840, 1524–1532. [Google Scholar] [CrossRef]
- Yang, B.; Verkman, A.S. Water and Glycerol Permeabilities of Aquaporins 1–5 and MIP Determined Quantitatively by Expression of Epitope-Tagged Constructs in Xenopus Oocytes. J. Biol. Chem. 1997, 272, 16140–16146. [Google Scholar] [CrossRef] [Green Version]
- Lis, H.; Sharon, N. Protein Glycosylation. Structural and Functional Aspects. Eur. J. Biochem. 1993, 218, 1–27. [Google Scholar] [CrossRef] [PubMed]
- Schaefer, J.V.; Plückthun, A. Engineering Aggregation Resistance in IgG by Two Independent Mechanisms: Lessons from Comparison of Pichia Pastoris and Mammalian Cell Expression. J. Mol. Biol. 2012, 417, 309–335. [Google Scholar] [CrossRef]
- Lin-Cereghino, G.P.; Stark, C.M.; Kim, D.; Chang, J.; Shaheen, N.; Poerwanto, H.; Agari, K.; Moua, P.; Low, L.K.; Tran, N.; et al. The Effect of α-Mating Factor Secretion Signal Mutations on Recombinant Protein Expression in Pichia Pastoris. Gene 2013, 519, 311–317. [Google Scholar] [CrossRef] [Green Version]
- Caputo, E.; Autiero, M.; Mani, J.C.; Basmaciogullari, S.; Basmociogullari, S.; Piatier-Tonneau, D.; Guardiola, J. Differential Antibody Reactivity and CD4 Binding of the Mammary Tumor Marker Protein GCDFP-15 from Breast Cyst and Its Counterparts from Exocrine Epithelia. Int. J. Cancer 1998, 78, 76–85. [Google Scholar] [CrossRef]
- Basmaciogullari, S.; Autiero, M.; Culerrier, R.; Mani, J.C.; Gaubin, M.; Mishal, Z.; Guardiola, J.; Granier, C.; Piatier-Tonneau, D. Mapping the CD4 Binding Domain of Gp17, a Glycoprotein Secreted from Seminal Vesicles and Breast Carcinomas. Biochemistry 2000, 39, 5332–5340. [Google Scholar] [CrossRef] [PubMed]
- Mostafa, S.; Seamon, V.; Azzarolo, A.M. Influence of sex hormones and genetic predisposition in Sjögren’s syndrome: A new clue to the immunopathogenesis of dry eye disease. Exp. Eye Res. 2012, 96, 88–97. [Google Scholar] [CrossRef] [PubMed] [Green Version]
- Lebeck, J.; Gena, P.; O’Neill, H.; Skowronski, M.T.; Lund, S.; Calamita, G.; Praetorius, J. Estrogen prevents increased hepatic aquaporin-9 expression and glycerol uptake during starvation. Am. J. Physiol. Gastrointest. Liver Physiol. 2012, 302, G365–G374. [Google Scholar] [CrossRef] [Green Version]
- Wawrzkiewicz-Jałowiecka, A.; Lalik, A.; Soveral, G. Recent Update on the Molecular Mechanisms of Gonadal Steroids Action in Adipose Tissue. Int. J. Mol. Sci. 2021, 22, 5226. [Google Scholar] [CrossRef]
- Jiang, X.X.; Fei, X.W.; Zhao, L.; Ye, X.L.; Xin, L.B.; Qu, Y.; Xu, K.H.; Wu, R.J.; Lin, J. Aquaporin 5 Plays a Role in Estrogen-Induced Ectopic Implantation of Endometrial Stromal Cells in Endometriosis. PLoS ONE 2015, 10, e0145290. [Google Scholar] [CrossRef] [Green Version]
- Naderi, A.; Vanneste, M. Prolactin-Induced Protein Is Required for Cell Cycle Progression in Breast Cancer. Neoplasia 2014, 16, 329–342.e14. [Google Scholar] [CrossRef] [Green Version]
- Noda, Y.; Horikawa, S.; Kanda, E.; Yamashita, M.; Meng, H.; Eto, K.; Li, Y.; Kuwahara, M.; Hirai, K.; Pack, C.; et al. Reciprocal Interaction with G-Actin and Tropomyosin Is Essential for Aquaporin-2 Trafficking. J. Cell Biol. 2008, 182, 587–601. [Google Scholar] [CrossRef] [Green Version]
- Edechi, C.A.; Ikeogu, N.M.; Akaluka, G.N.; Terceiro, L.E.L.; Machado, M.; Salako, E.S.; Barazandeh, A.F.; Kung, S.K.P.; Uzonna, J.E.; Myal, Y. The Prolactin Inducible Protein Modulates Antitumor Immune Responses and Metastasis in a Mouse Model of Triple Negative Breast Cancer. Front. Oncol. 2021, 11, 639859. [Google Scholar] [CrossRef]
- Login, F.H.; Palmfeldt, J.; Cheah, J.S.; Yamada, S.; Nejsum, L.N. Aquaporin-5 Regulation of Cell-Cell Adhesion Proteins: An Elusive “Tail” Story. Am. J. Physiol. Cell Physiol. 2021, 320, C282–C292. [Google Scholar] [CrossRef]
- Moosavi, M.-S.; Elham, Y. Aquaporins 1, 3 and 5 in Different Tumors, Their Expression, Prognosis Value and Role as New Therapeutic Targets. Pathol. Oncol. Res. 2020, 26, 615–625. [Google Scholar] [CrossRef]
- Mobasheri, A.; Barrett-Jolley, R. Aquaporin Water Channels in the Mammary Gland: From Physiology to Pathophysiology and Neoplasia. J. Mammary Gland Biol. Neoplasia 2014, 19, 91–102. [Google Scholar] [CrossRef] [PubMed] [Green Version]
- Urbaniak, A.; Jablonska, K.; Podhorska-Okolow, M.; Ugorski, M.; Dziegiel, P. Prolactin-Induced Protein (PIP)-Characterization and Role in Breast Cancer Progression. Am. J. Cancer Res. 2018, 8, 2150–2164. [Google Scholar] [PubMed]
- Wang, L.J.; Greaves, W.O.; Sabo, E.; Noble, L.; Tavares, R.; Ng, T.; DeLellis, R.A.; Resnick, M.B. GCDFP-15 Positive and TTF-1 Negative Primary Lung Neoplasms: A Tissue Microarray Study of 381 Primary Lung Tumors. Appl. Immunohistochem. Mol. Morphol. 2009, 17, 505–511. [Google Scholar] [CrossRef] [PubMed]


Publisher’s Note: MDPI stays neutral with regard to jurisdictional claims in published maps and institutional affiliations. |
© 2021 by the authors. Licensee MDPI, Basel, Switzerland. This article is an open access article distributed under the terms and conditions of the Creative Commons Attribution (CC BY) license (https://creativecommons.org/licenses/by/4.0/).
Share and Cite
Chivasso, C.; Nesverova, V.; Järvå, M.; Blanchard, A.; Rose, K.L.; Öberg, F.K.; Wang, Z.; Martin, M.; Lhotellerie, F.; Zindy, E.; et al. Unraveling Human AQP5-PIP Molecular Interaction and Effect on AQP5 Salivary Glands Localization in SS Patients. Cells 2021, 10, 2108. https://doi.org/10.3390/cells10082108
Chivasso C, Nesverova V, Järvå M, Blanchard A, Rose KL, Öberg FK, Wang Z, Martin M, Lhotellerie F, Zindy E, et al. Unraveling Human AQP5-PIP Molecular Interaction and Effect on AQP5 Salivary Glands Localization in SS Patients. Cells. 2021; 10(8):2108. https://doi.org/10.3390/cells10082108
Chicago/Turabian StyleChivasso, Clara, Veronika Nesverova, Michael Järvå, Anne Blanchard, Kristie L Rose, Fredrik Kryh Öberg, Zhen Wang, Maud Martin, Florent Lhotellerie, Egor Zindy, and et al. 2021. "Unraveling Human AQP5-PIP Molecular Interaction and Effect on AQP5 Salivary Glands Localization in SS Patients" Cells 10, no. 8: 2108. https://doi.org/10.3390/cells10082108