Article

Uncovering the Metabolic and Stress Responses of Human Embryonic Stem Cells to FTH1 Gene Silencing

by
Luana Scaramuzzino
1,†,
Valeria Lucchino
1,†,
Stefania Scalise
1,
Michela Lo Conte
1,
Clara Zannino
1,
Alessandro Sacco
1,
Flavia Biamonte
1,2,
Elvira Immacolata Parrotta
3,*,
Francesco Saverio Costanzo
1,2 and
Giovanni Cuda
1
1
Research Centre for Advanced Biochemistry and Molecular Biology, Department of Experimental and Clinical Medicine, University Magna Graecia, 88100 Catanzaro, Italy
2
Center of Interdepartmental Services (CIS), “Magna Graecia” University of Catanzaro, 88100 Catanzaro, Italy
3
Department of Medical and Surgical Sciences, University Magna Graecia, 88100 Catanzaro, Italy
*
Author to whom correspondence should be addressed.
These authors equally contributed to this work.
Cells 2021, 10(9), 2431; https://doi.org/10.3390/cells10092431
Submission received: 18 August 2021 / Revised: 3 September 2021 / Accepted: 13 September 2021 / Published: 15 September 2021
(This article belongs to the Collection Researches on Normal and Cancer Stem Cells)

Abstract

:
Embryonic stem cells (ESCs) are pluripotent cells with indefinite self-renewal ability and differentiation properties. To function properly and maintain genomic stability, ESCs need to be endowed with an efficient repair system as well as effective redox homeostasis. In this study, we investigated different aspects involved in ESCs’ response to iron accumulation following stable knockdown of the ferritin heavy chain (FTH1) gene, which encodes for a major iron storage protein with ferroxidase activity. Experimental findings highlight unexpected and, to a certain extent, paradoxical results. If on one hand FTH1 silencing does not correlate with increased ROS production nor with changes in the redox status, strengthening the concept that hESCs are extremely resistant and, to a certain extent, even refractory to intracellular iron imbalance, on the other, the differentiation potential of hESCs seems to be affected and apoptosis is observed. Interestingly, we found that FTH1 silencing is accompanied by a significant activation of the nuclear factor (erythroid-derived-2)-like 2 (Nrf2) signaling pathway and pentose phosphate pathway (PPP), which crosstalk in driving hESCs antioxidant cascade events. These findings shed new light on how hESCs perform under oxidative stress, dissecting the molecular mechanisms through which Nrf2, in combination with PPP, counteracts oxidative injury triggered by FTH1 knockdown.

1. Introduction

An impaired intracellular balance between reactive oxygen species (ROS) production and clearance is responsible for establishing an oxidative stress status, eventually leading to lethal consequences [1] for the cells. ROS are able to elicit a wide spectrum of responses; slight variations in their concentration may produce profound and opposite effects in distinct cell types [2]. High levels of ROS, predominantly produced by mitochondrial respiration, are classically linked to cellular damage, DNA damage, and apoptosis. At the same time, a large body of data recognizes ROS as signaling messengers involved in many biological processes, including DNA synthesis, modulation of gene expression, cellular respiration, protein–protein interactions [3], as well as activation of critical pathways such as protein kinase B (AKT) and NF-κB signaling [4]. In hESCs, constant exposure to high levels of ROS was shown to induce cell cycle arrest and apoptosis [5]; however, by regulating the redox state, ROS also target important aspects of pluripotency, such as metabolism, self-renewal, and cell fate [6,7,8]. During evolution, cells have developed specific and efficient antioxidant defense mechanisms to promptly detoxify reactive intermediates and to maintain redox homeostasis [9]. The response to oxidative stress is quite variable: some cell types are extremely sensitive, while others, such as ESCs, are highly resistant [5,10]. ESCs are pluripotent cells characterized by an unlimited capacity for self-renewal and the ability to give rise to cells of all three germ layers (ectoderm, mesoderm, and endoderm) that occur naturally during embryo development in vivo, or by differentiating culture conditions in vitro [11]. As such, it is extremely important for ESCs to function properly and to maintain their genome stability. To do so, ESCs are equipped with enhanced repair systems and efficient control of redox homeostasis to prevent dramatic consequences of oxidative stress [12]. It has been shown that low levels of ROS are required for ESCs to sustain their self-renewal capability [10,13], while a significant increase in ROS promotes ESC differentiation [14,15]. The canonical pluripotency core itself, including OCT4, SOX2, and NANOG, is responsible for regulating the expression of some important antioxidant genes, such as SOD1, suggesting a correlation between mechanisms governing pluripotency and antioxidant systems [16]. To maintain high antioxidant capacity, ESCs rely on low mitochondrial biogenesis and reduced oxygen consumption [17,18,19]. The antioxidant system includes a wide range of enzymes such as those encoded by the superoxide dismutase family genes (SODs), glutathione peroxidase family (GPXs), and catalase (CAT). In addition, many other non-enzymatic molecules and compounds such as ascorbic acid, directly or indirectly, participate in antioxidant events [20].
The redox status is greatly influenced by compounds primarily involved in the metabolism of specific substances, such as iron [21]. Iron deficiency, triggered by deferoxamine (DFO) treatment, causes a loss of pluripotency in both ESCs and induced pluripotent stem cells (iPSCs) [22]. On the other hand, increased intracellular iron levels negatively affect the status of pluripotent stem cells (PSCs), leading to excess ROS production and DNA damage and a reduced proliferation rate [23]. The effects of ROS accumulation in ESCs and their functional consequences remain controversial. The role of unbalanced iron metabolism in ESCs is even less well understood, suggesting that much still remains to be investigated in this direction.
PSCs mainly rely on glycolysis [24], while oxidative metabolism (i.e., mitochondrial respiration and fatty acid metabolism) take place upon PSC differentiation [17,25,26]. Reprogramming of somatic cells to generate iPSCs requires, among others, a metabolic switch from oxidative phosphorylation (OXPHOS) to glycolysis [18]. The prevailing aerobic over oxidative mitochondrial metabolism in PSCs is reminiscent of cancer metabolism [27,28,29]. Like cancer cells, in fact, PSCs divide rapidly and, in order to sustain a high proliferation rate, these cells are required to produce ATP from glycolysis even in the presence of normal oxygen levels. Glycolytic metabolism also generates nicotinamide adenine dinucleotide phosphate (NADPH), which helps to protect cells from oxidative stress injuries [30]. Additionally, as cancer cells, PSCs are characterized by an increased expression of hypoxia-inducible factors (HIFs) and oxygen-sensitive transcription factors. Under particular conditions, such as in the presence of high concentrations of lipids, oxidative mitochondrial metabolism is active in hESCs, indicating that these cells can rapidly adapt their metabolism to various nutrient conditions while maintaining full self-renewal properties [31].
To push PSC technology towards clinical applications, a comprehensive understanding of stemness and its potentiality, as well as stem cell metabolism and its modulation, is fundamental. While ESCs’ general metabolic aspects have been widely investigated [31,32,33], very little is currently known about the role of iron metabolism and the consequences of iron accumulation in hESCs. On the basis of these considerations, the present work aims to dissect the molecular events triggered by silencing of the FTH1 gene, encoding a major antioxidant protein with ferroxidase activity. We have analyzed key processes known to be associated with intracellular iron accumulation, such as DNA damage, apoptosis, oxidative stress, antioxidant defense system, and metabolic changes. Our findings provide clear evidence of an overactivation of the nuclear factor (erythroid-derived-2)-like 2 (Nrf2) signaling pathway, which emerges as the major player and safeguard against iron-mediated oxidative stress in response to downregulation of ferritin expression. From a metabolic point of view, we also identified pentose phosphate pathway (PPP) activation as the primary metabolic response to maintain the redox status in hESCs.

2. Materials and Methods

2.1. Cell Culture

H9 Embryonic Stem Cell line was obtained from WiCell Research Institute (Madison, WI, USA, http://www.wicell.org, accessed on 30 April 2019). ESCs were propagated on Matrigel-coated (Corning, New York, NY, USA, 354277) dishes in StemMACS iPS-Brew medium (Miltenyi Biotec, Bergisch Gladbach, Germany, 130-104-368) and cultured at 37 °C in 5% CO2 in a humidified incubator with daily medium replacement. Cells were sub-cultured as small colonies with Gentle Dissociation reagent (STEMCELL Technologies, Vancouver, BC, Canada, 07174).

2.2. Lentiviral Production and Generation of Stable Knock-Down ESCs

Lentiviral particles were produced in 293T cells following the standard procedure. Briefly, sub-confluent 293T cells were transfected with shFTH1 or shSCR control lentiviral vector plasmids (Sigma-Aldrich, St. Louis, MO, USA) along with pCMV-DR9-9 and pCMV-VSVG plasmids (Sigma-Aldrich). After 48 h, supernatants were harvested, filtered through a 0.45 µM filter, and used for ESCs infection, previously seeded in a 6-well plate at a cell density of 2 × 10⁵ cells/well. Infected cells were incubated with shFTH1 and shSCR control lentiviral particles [Multiplicity of Infection (MOI) = 10] in the presence of 8 μg/mL of Polybrene (Sigma-Aldrich) using Lipofectamine 3000 Reagent (Thermo Fisher Scientific, Waltham, MA, USA). Two days after transduction, transduced cells were selected with puromycin (1 µg/mL) for 10 days. Knock-down efficiency was assessed via both Western blot and qRT-PCR analysis (Figure S1).

2.3. RNA Isolation and Quantitative Real-Time PCR

Cell pellets were collected after 48 h of culture and total RNA was extracted with TRIzol Reagent (Thermo Fisher Scientific, 15596018) and reverse transcribed using High-Capacity cDNA Reverse Transcription kit (Applied Biosystems, Foster City, CA, USA, 4368814) according to manufacturer’s instructions. Real-time quantitative PCR (qRT-PCR) was performed according to StepOnePlus system’s protocol (Applied Biosystems) with SensiFAST SYBR Hi-ROX Kit (Meridian Bioscience, Cincinnati, OH, USA, BIO-92020). Ct values for each target gene were normalized to GAPDH Ct values. See Supplement Information Table S1 for the primer sequences used in this study.

2.4. Immunofluorescence

Cells at ~80% confluence were fixed with 3.7% formaldehyde (Sigma-Aldrich), permeabilized with 0.1% Triton X-100, then blocked with 1% bovine serum albumin (BSA) in PBS. Cells were stained with primary antibodies Nanog (1:200; rabbit polyclonal, #PA1-097, Thermo Fisher Scientific), Oct4 (1:200; mouse monoclonal, #75463, Cell Signalling), Sox2 (1:500; rabbit monoclonal, #97959, Abcam), TRA1-60 (1:100; mouse monoclonal, #41-100, Life Technologies, Carlsbad, CA, USA), Brachyury (1:20; goat polyclonal, #AF2085, R&D System), Sox17 (1:20; goat polyclonal, #AF1924, R&D System), Nestin (1:1000; mouse monoclonal, #60091, Stem Cell Technologies), and Nrf2 (1:100; mouse monoclonal, #SC-365949, Santa Cruz) and incubated overnight at 4 °C in a blocking buffer. Secondary antibodies goat anti-mouse Alexa-Fluor-488, goat anti-rabbit Alexa Fluor-594, and donkey anti-goat Alexa-Fluor-594 (all from Life Technologies) were used for detection. DAPI (Carl Roth) was used for nuclei counterstain. Images were acquired with a Leica DMi8 inverted microscope. The filter cubes and software were provided by Leica.

2.5. Western Blotting

Cells were harvested after reaching 90% confluency and then were lysed in RIPA lysis buffer (Sigma-Aldrich) containing a protease inhibitor cocktail (Thermo Fisher Scientific, 78430). Protein concentration was determined by Bradford assay (Biorad, Hercules, Canada). Equal amounts of protein were resolved by 12% SDS-PAGE and transferred to a nitrocellulose membrane (Biorad, 1704159). Membranes were blocked at room temperature with TBST (0.1% Tween-20 in TBST) containing 5% milk. Immunoblotting was performed with primary antibodies against FTH1 (Santa Cruz, #376594, 1:200), Nanog (Thermo Fisher Scientific, #PA1-097, 1:500), Nrf2 (Santa Cruz, #SC-365949, 1:100), p62/Sqstm1 (Abcam, #ab56416, 1:1000), Gpx4 (Abcam, #ab41787, 1 µg/mL), HIF1α (Cell Signaling, #3716s, 1:1000), FTL (Santa Cruz, #74513, 1:100), Caspase 3 (Cell Signaling, #9669, 1:1000), Akt1 (Cell Signaling, #2967, 1:1000), pAkt1 (Cell Signaling, #4058, 1:1000), Erk1/2 (Cell Signaling, #9107, 1:1000), pErk1/2 (Cell Signaling, #4376, 1:1000), and Parp1 (Cell Signaling, #9543, 1:1000) overnight at 4 °C. After several washes with TBST, membranes were incubated with horseradish peroxidase (HRP)-conjugated secondary antibodies (Jackson ImmunoResearch, West Grove, PA, USA) for 1 h at room temperature. Immunoreactive protein bands were probed using an enhanced chemiluminescence detection system (Biorad, Hercules, CA, USA, 170-5060) and acquired with UVITEC 165 Imaging Systems. Gapdh (Bioss, BS-1099 R, 1:1000) or Actin (Santa Cruz, SC-1616, 1:500) antibodies were used indifferently as loading control.

2.6. Measurement of Intracellular Iron, Total ROS and Mitochondrial Superoxide Species

Intracellular iron concentration was measured using the Iron Assay kit (Sigma-Aldrich, MAK025) according to the manufacturer’s instructions. Total intracytoplasmic ROS as well as specific mitochondrial superoxide species were assessed by flow cytometry using the fluorescent probes 2′-7′- Dichlorodihydrofluorescein diacetate (CM-H2DCFDA; Thermo Fisher Scientific) and MitoSOX™ Red Mitochondrial Superoxide Indicator, respectively. For the quantification of mitochondrial superoxide levels, cells were cultured for 72 h and then incubated with 2 mM MitoSOX™ Red Mitochondrial Superoxide Indicator (Thermo Fisher Scientific) for 30 min at 37 °C. Intracellular ROS levels were instead assayed by staining the cells with 1.5 mM CM-H2DCFDA (Thermo Fisher Scientific) for 30 min at 37 °C. Fluorescence intensity was measured by flow cytometry using a FACS BD LSRFortessaTM X-20 cytofluorimeter (BD Biosciences, Bedford, MA, USA). The results were analyzed with FlowJo software (Tree Star, Inc., Williamson Way Ashland, OR 97520, USA). Three independent experiments were conducted.

2.7. Analysis of Mitochondrial Membrane Potential (ΔΨ)

Mitochondrial membrane potential (ΔΨ) was measured using 0.1 µM ΔΨ fluorescent indicator TMRM (tetramethylrhodamine methyl ester) (Thermo Fisher Scientific). Cells were harvested after 72 h of culture and TMRM fluorescence intensity was measured after 30 min of incubation at 37 °C by flow cytometry using a FACS BD LSRFortessaTM X-20 cytofluorimeter (BD Biosciences). The results were analyzed with FlowJo software (Tree Star, Inc.). Three independent experiments were conducted.

2.8. Embryoid Bodies (EBs) Formation Assay

ESCs at ~80% confluence were dissociated into single cells with StemPro Accutase (Life Technologies). A total of 1.5 × 10⁶ cells were resuspended in Brew medium containing 10 µM Y27632 ROCK inhibitor (Selleckchem, S1049), and cultured on ultra-low attachment plates (TPP, 93060). Cells were maintained in these conditions for 3 days. After 7 days, floating EBs were plated on laminin-coated dishes (Biolamina, Sundbyberg, Sweden, LN521-03) and cultured in DMEM-F12 medium (Gibco, Waltham, MA, USA, 21331-020) containing 20% Knockout Serum Replacement (KSR; Gibco, 10828-028), 1% Glutamax I-CTS (Gibco, A12860-01), 1% MEM-NEAA (Gibco, 1140-035), 0,1 mM 2-mercaptoethanol (Gibco, 21985-023), and 1% Pen/Strep (Gibco, 15140-122) for 28 days.

2.9. Alkaline Phosphatase Assay

After 48 h of culture, cells were fixed with 3.7% formaldehyde (FA) solution (Sigma Aldrich, 252549-100ML) for 15 min at room temperature. Alkaline phosphatase assay was performed using 1-Step NBT/BCIP (Thermo Fisher Scientific, 34042) according to the manufacturer’s instructions.

2.10. Metabolic and Bioenergetic Function Profile

Total ATP production rates in H9-shFTH1 and shSCR control cells were measured with the Agilent Seahorse analyzer using the XFp Real-Time Rate Assay Kit. Simultaneous quantification of ATP fractions produced by mitochondrial oxidative phosphorylation (OXPHOS) and glycolysis were detected. For bioenergetics quantification, cells were dissociated into single cells with Accutase and seeded onto Agilent Seahorse XFp Cell Culture Miniplates at a cell density of 2 × 10³/well in brew medium supplemented with 10 µM Y27632 ROCK inhibitor. After 24 h, the growth medium was exchanged with unbuffered media and incubated for 30 min at 37 °C, allowing temperature and pH to reach their equilibria before starting the baseline measurements. Once the basal oxygen consumption rate (OCR) and extracellular acidification rate (ECAR) were obtained, cells were metabolically perturbed by the addition of three different compounds: oligomycin (1.5 µM), rotenone, and antimycin A (0.5 µM). Finally, the template was loaded into the Seahorse Analyzer for ATP measurement. The same procedure for cell preparation was used for the glycolytic rate assay and measurement performed according to the manufacturer’s instruction. Rotenone/antimycin A were used to block mitochondrial activity while 2-DG was used to inhibit glycolysis. Results were uploaded to Agilent Seahorse Analytics to calculate parameters relative to ATP production and XF glycolytic rate assays. GraphPad Prism software was used to create graphs.

2.11. Apoptosis Analysis

For the identification of apoptotic cells, a double staining with Annexin V and PI was performed using Alexa Fluor®488 Annexin V/Dead Cell Apoptosis Kit (Thermo Fisher Scientific, Waltham, MA, USA) according to the manufacturer’s instructions. 72 h after seeding, cells were harvested and stained with Annexin V and PI, alone and in combination. After an incubation of 15 min at room temperature, each tube was diluted with 400 µL of annexin binding buffer and cells were analyzed by flow cytometry using BD LSRFortessaTM X-20 cytofluorometer (BD Biosciences).

2.12. Statistics

All statistical data were generated from at least three independent biological replicates and are represented as mean ± standard error of the mean (SEM). Data were analyzed with PRISM version 7.0 (GraphPad Software Inc., San Diego, CA, USA). The significance of differences (p-value) was analyzed using Student’s t-test and presented with the following levels of significance: * p < 0.05, ** p < 0.01, and *** p < 0.001.

3. Results

3.1. Effects of FTH1-Silencing on ESCs Pluripotency

Iron homeostasis is involved in many biological processes, including maintenance of pluripotency in human PSCs. Results from previous work found that depletion of intracellular iron is associated with impairment of pluripotency and self-renewal due to a significant reduction in NANOG expression [22]. Cells maintain a balanced iron pool and ferritin, as the major iron storage protein, plays a crucial role in this regulation. Therefore, to speculate on the role of ferritin in the context of hESCs, we first generated FTH1-silenced cells (FTH1-KD) via lentiviral transfection with short hairpin RNA (shRNA), confirming the successful knock-down both at the mRNA and protein level of the transfected hESC (Supplementary Figure S1B–E). Morphologically, colonies originated from FTH1-KD hESCs were more flattened than those of shSCR control (Supplementary Figure S1A), and alkaline phosphatase (AP) activity was reduced in these cells (Figure 1A). Nevertheless, FTH1-KD hESCs colonies were positive for pluripotency markers Oct4, TRA-1-60, and Sox2, while the expression of Nanog was slightly increased (Figure 1B). This last finding was further confirmed by immunoblot analysis, demonstrating that Nanog expression is indeed higher in FTH1-silenced hESCs. (Figure 1C and Supplementary Figure S2A). At the transcriptional level, NANOG, OCT4, and SOX2 resulted in evenly increased FTH1-KD hESCs (Figure 1D). We further asked whether FTH1 knockdown could, either directly or indirectly, promote spontaneous differentiation of hESCs. Analysis of the transcript levels of AFP, Nkx2.5, and PAX6, specific to endoderm, mesoderm, and ectoderm germ layers, respectively, revealed an enhanced expression of these genes in FTH1-KD hESCs (Figure 1E, left panel). Next, we induced both SCR control and FTH1-KD hESCs to differentiate using the embryoid bodies (EBs) formation assay (Supplementary Figure S2B). On day 28 of differentiation, EBs were harvested and analyzed for endodermal- (GATA4, FOXA2), mesodermal- (HAND1, CD31), and ectodermal- (NESTIN, PAX6) associated markers. Interestingly, while endodermal and mesodermal transcript levels resulted in upregulated FTH1-KD-derived EBs compared to control EBs, the ectodermal genes NESTIN and PAX6 were significantly downregulated in EBs derived from silenced cells (Figure 1E, right panel). Immunofluorescence analysis for Sox17 (endodermal marker), Brachyury (mesodermal marker), and Nestin further confirmed that the percentage of Nestin+ cells is lower in FTH1-silenced hESCs compared to SCR control (Figure 1F and Supplementary Figure S2C). We do not have a clear-cut explanation for the contradictory findings reported here; we hypothesize that the initial response of ESCs to FTH1 gene silencing might be overcome during EB formation, in particular towards mesodermal and endodermal differentiation. The molecular mechanisms underlying this controversial phenomenon are still under deep investigation by our group.

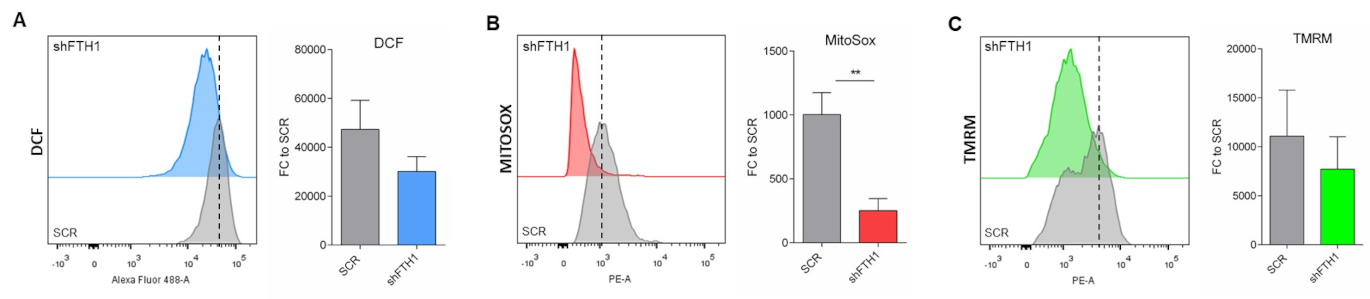
3.2. ROS Levels Are Reduced upon FTH1-Gene Silencing in hESCs

The role of ferritin in preventing iron-mediated oxidative stress has been reported in several studies [34]. Downregulation in FTH1 expression leads to excess labile iron, in turn promoting the formation of oxygen-derived free radicals [35,36]. To speculate on the effects of FTH1 silencing in hESCs, we measured the levels of intracellular iron in these cells; moreover, we performed a measurement of total and mitochondrial ROS levels together with an analysis of the mitochondrial membrane potential (ΔΨM) on three biological replicates of SCR vs. FTH1-KD hESCs, using DCF, MitoSox, and TMRM dyes, respectively (Supplementary Figure S3B,C). Intriguingly, while iron concentration increased, as expected, in FTH1-KD hESCs (Supplementary Figure S3A), a significant reduction in total ROS levels was detected compared to SCR controls (FTH1-KD: CM-H2DCFDA MFI: 29785,7 vs. SCR: CM-H2DCFDA MFI: 47341,7) (Figure 2A). Likewise, MitoSox assay showed a decrease in mitochondrial superoxide in FTH1-deficient cells (FTH1-KD: MitoSOX Red MFI: 251,8 vs. SCR: MitoSOX Red MFI: 1002,3) (Figure 2B). A similar, asymmetric behavior was observed by flow cytometry analysis, which revealed a reduction in TMRM fluorescence, indicative of mitochondrial membrane depolarization, in FTH1-KD hESCs (MFI: 7722) compared to SCR (MFI: 11086,7) (Figure 2C). Altogether, these results led us to conclude that hESCs activate a powerful and effective antioxidant mechanism and are thus capable of protect themselves, at least to some extent, from shFTH1-mediated iron toxicity.

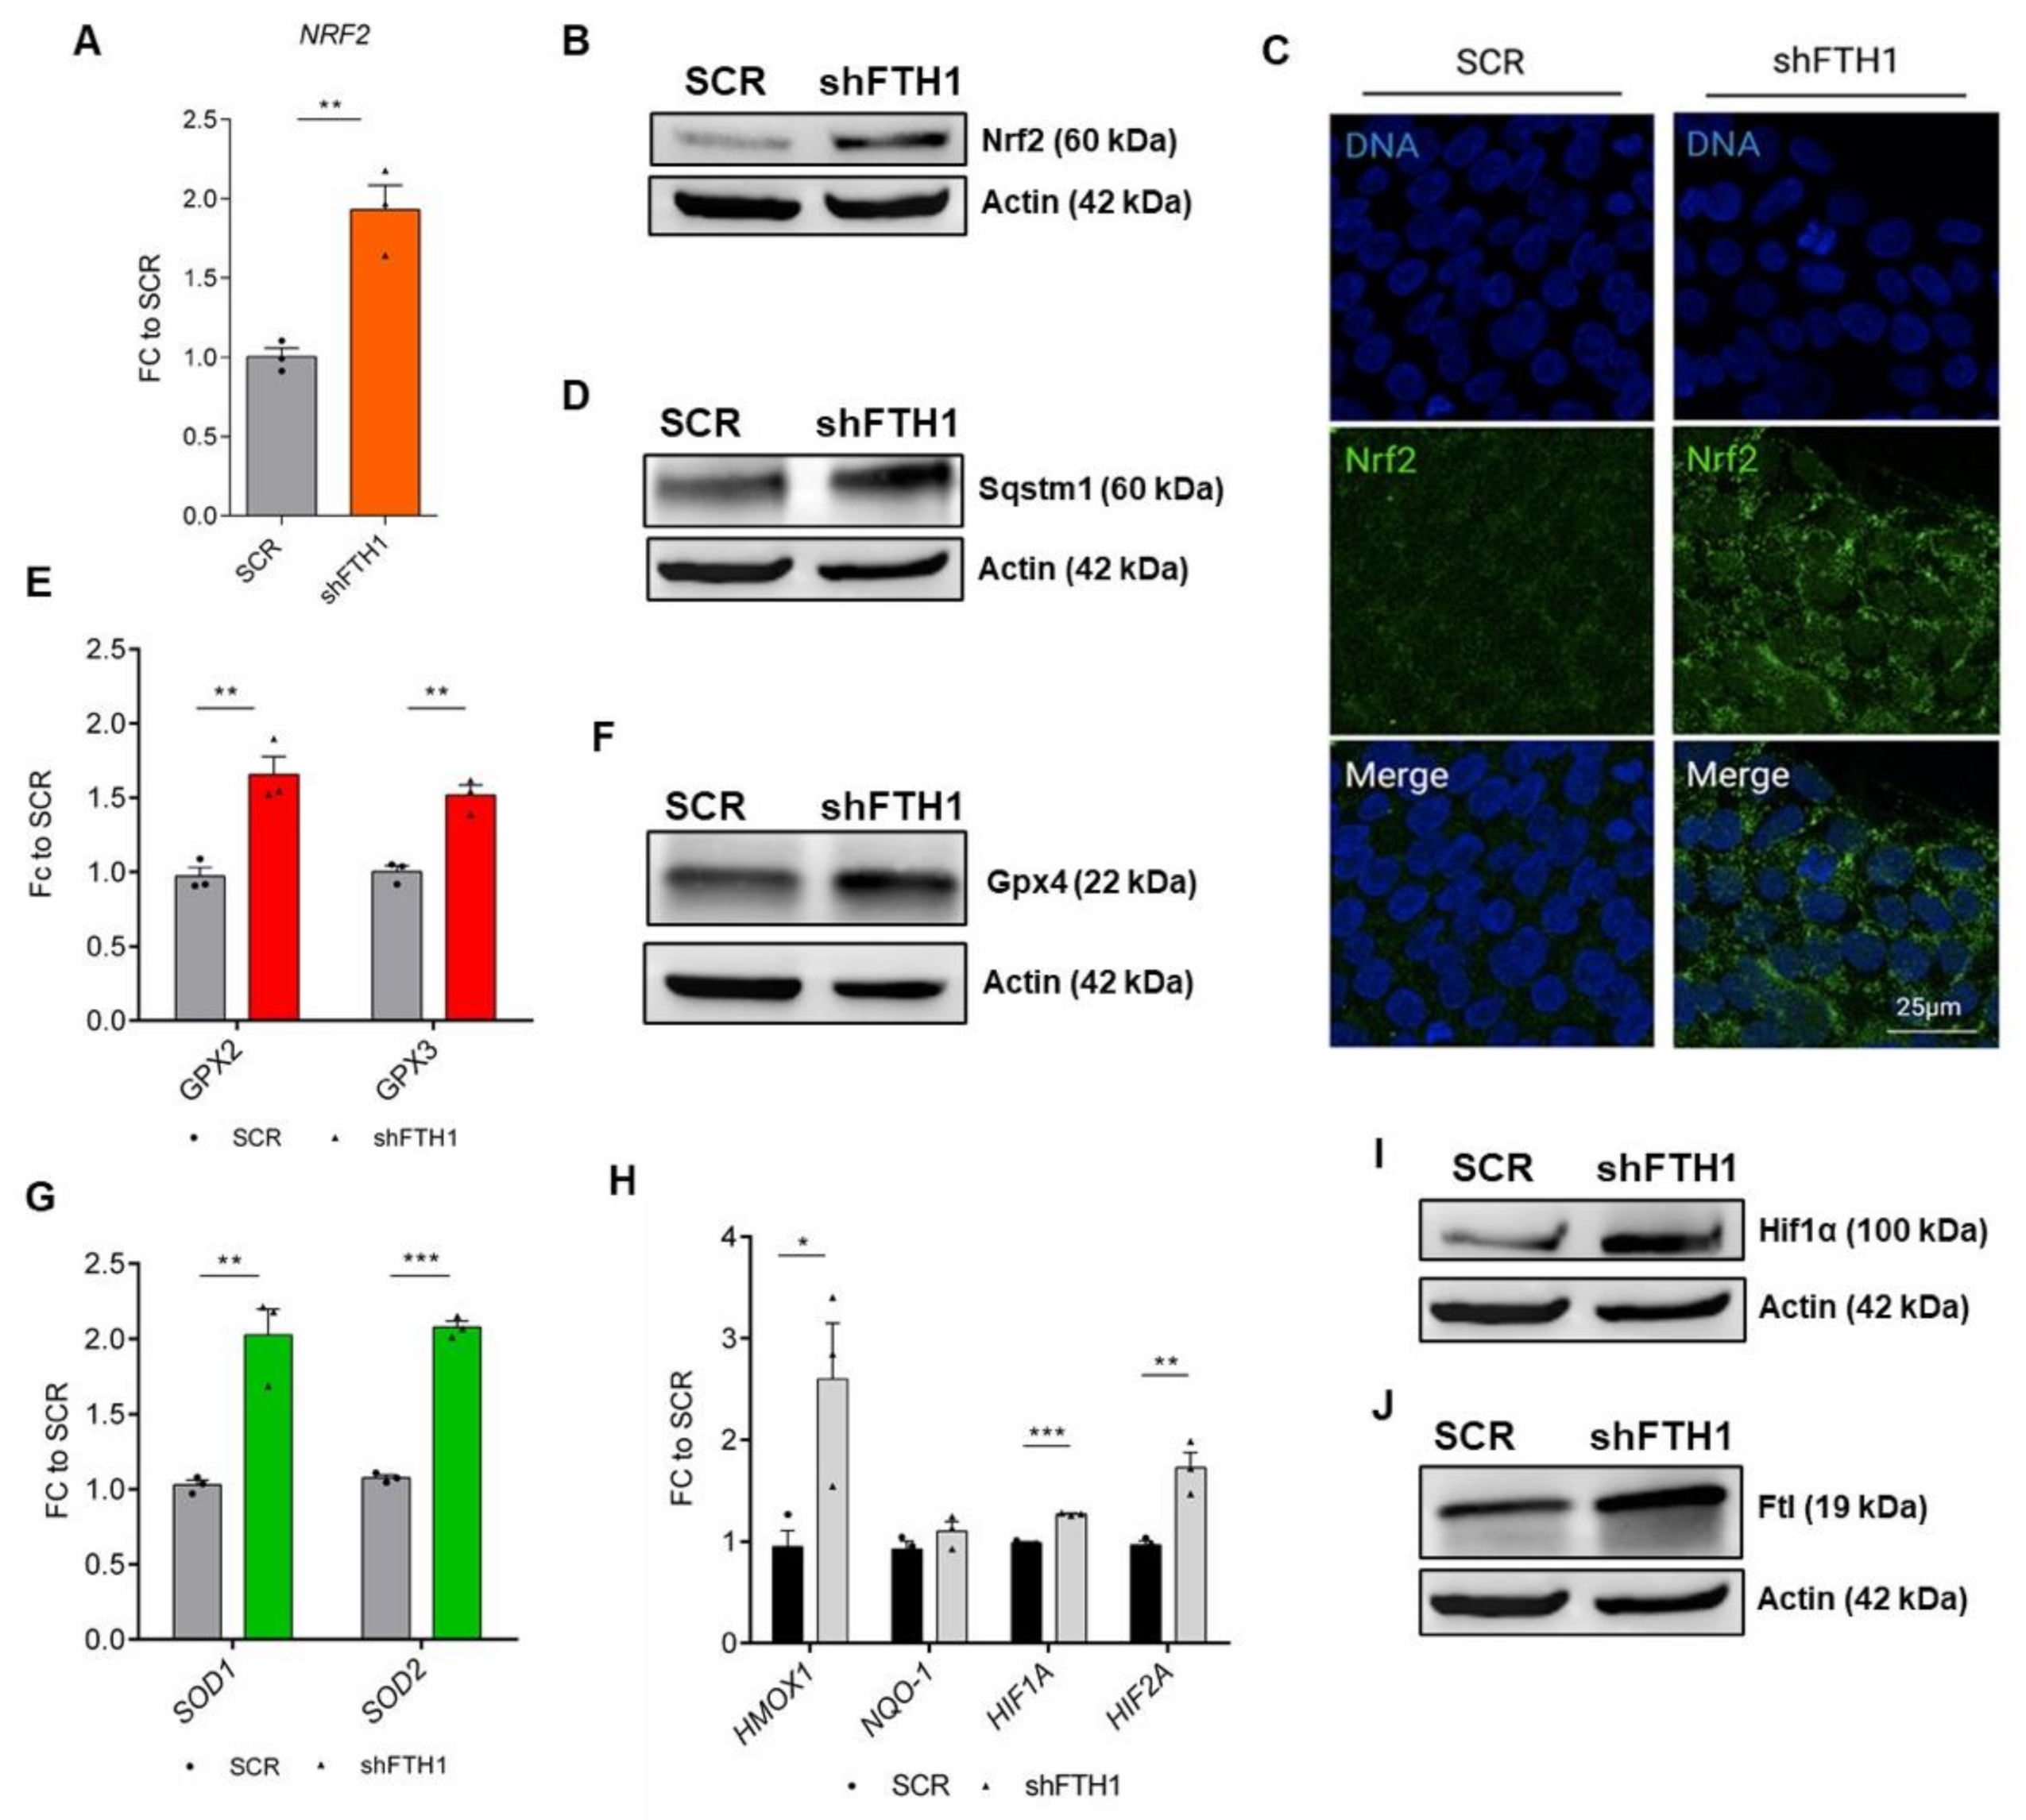
3.3. Nrf2 Signaling Pathway Drives the Antioxidant Response in hESCs

Nuclear factor erythroid 2-related factor 2 (Nrf2) is a transcription factor ubiquitously expressed in most eukaryotic cells. Nrf2-Keap1 (Kelch-like ECH-associated protein 1) signaling pathway was shown to play a central role in protecting cells against oxidative stress [37,38]. Under basal conditions, Nrf2 is bound to its negative regulator Keap1, which directs it to proteasomal degradation. In the presence of high levels of intracellular ROS, Keap1 is oxidized and releases Nrf2, which is free to translocate into the nucleus, where it binds to antioxidant response elements (AREs) and induces the expression of antioxidant target genes, such as HMOX1, NQO1, GST, and GPX [39]. Besides its role as a fine regulator of redox and metabolic homeostasis, Nrf2 also acts as a pluripotency master gene: Nrf2 activation in hESCs was shown to enhance NANOG transcriptional activity by delaying Nanog protein degradation through POMP-mediated proteasome ubiquitination [40,41]. In this study, we found that FTH1-KD hESCs express higher levels of Nrf2 transcript and protein, assessed via qRT-PCR (Figure 3A), immunoblot (Figure 3B and Supplementary Figure S4A), and immunofluorescence (Figure 3C and Supplementary Figure S4F), respectively. Similarly, we could also observe an increased expression of p62/Sqstm1 (Figure 3D and Supplementary Figure S4B) which, in the non-canonical Nrf2-Keap1 pathway, is known to bind Keap1, allowing Nrf2 to migrate into the nucleus [42]. Moreover, the p62 protein yields a feedback loop that amplifies the Nrf2 system [43]. In addition to increased expression of Nrf2 in FTH1-silenced hESCs, we observed the overexpression of major antioxidant enzymes, such as glutathione peroxidases GPX2, GPX3 (Figure 3E), Gpx4 (Figure 3F and Supplementary Figure S4C), and superoxide dismutases (SOD) 1 and 2 (Figure 3G). Additionally, several Nrf2-regulated genes (HMOX1, NQO-1, HIF1α, HIF2α) (Figure 3H) and proteins (HIF1α, Ftl) (Figure 3I,J respectively and Supplementary Figure S4D,E) were found to be highly expressed in FTH1-KD hESCs. Altogether, these findings suggest a crosstalk between FTH1 silencing and overactivation of the Nrf2 signaling pathway and its cognate effectors in hESCs.

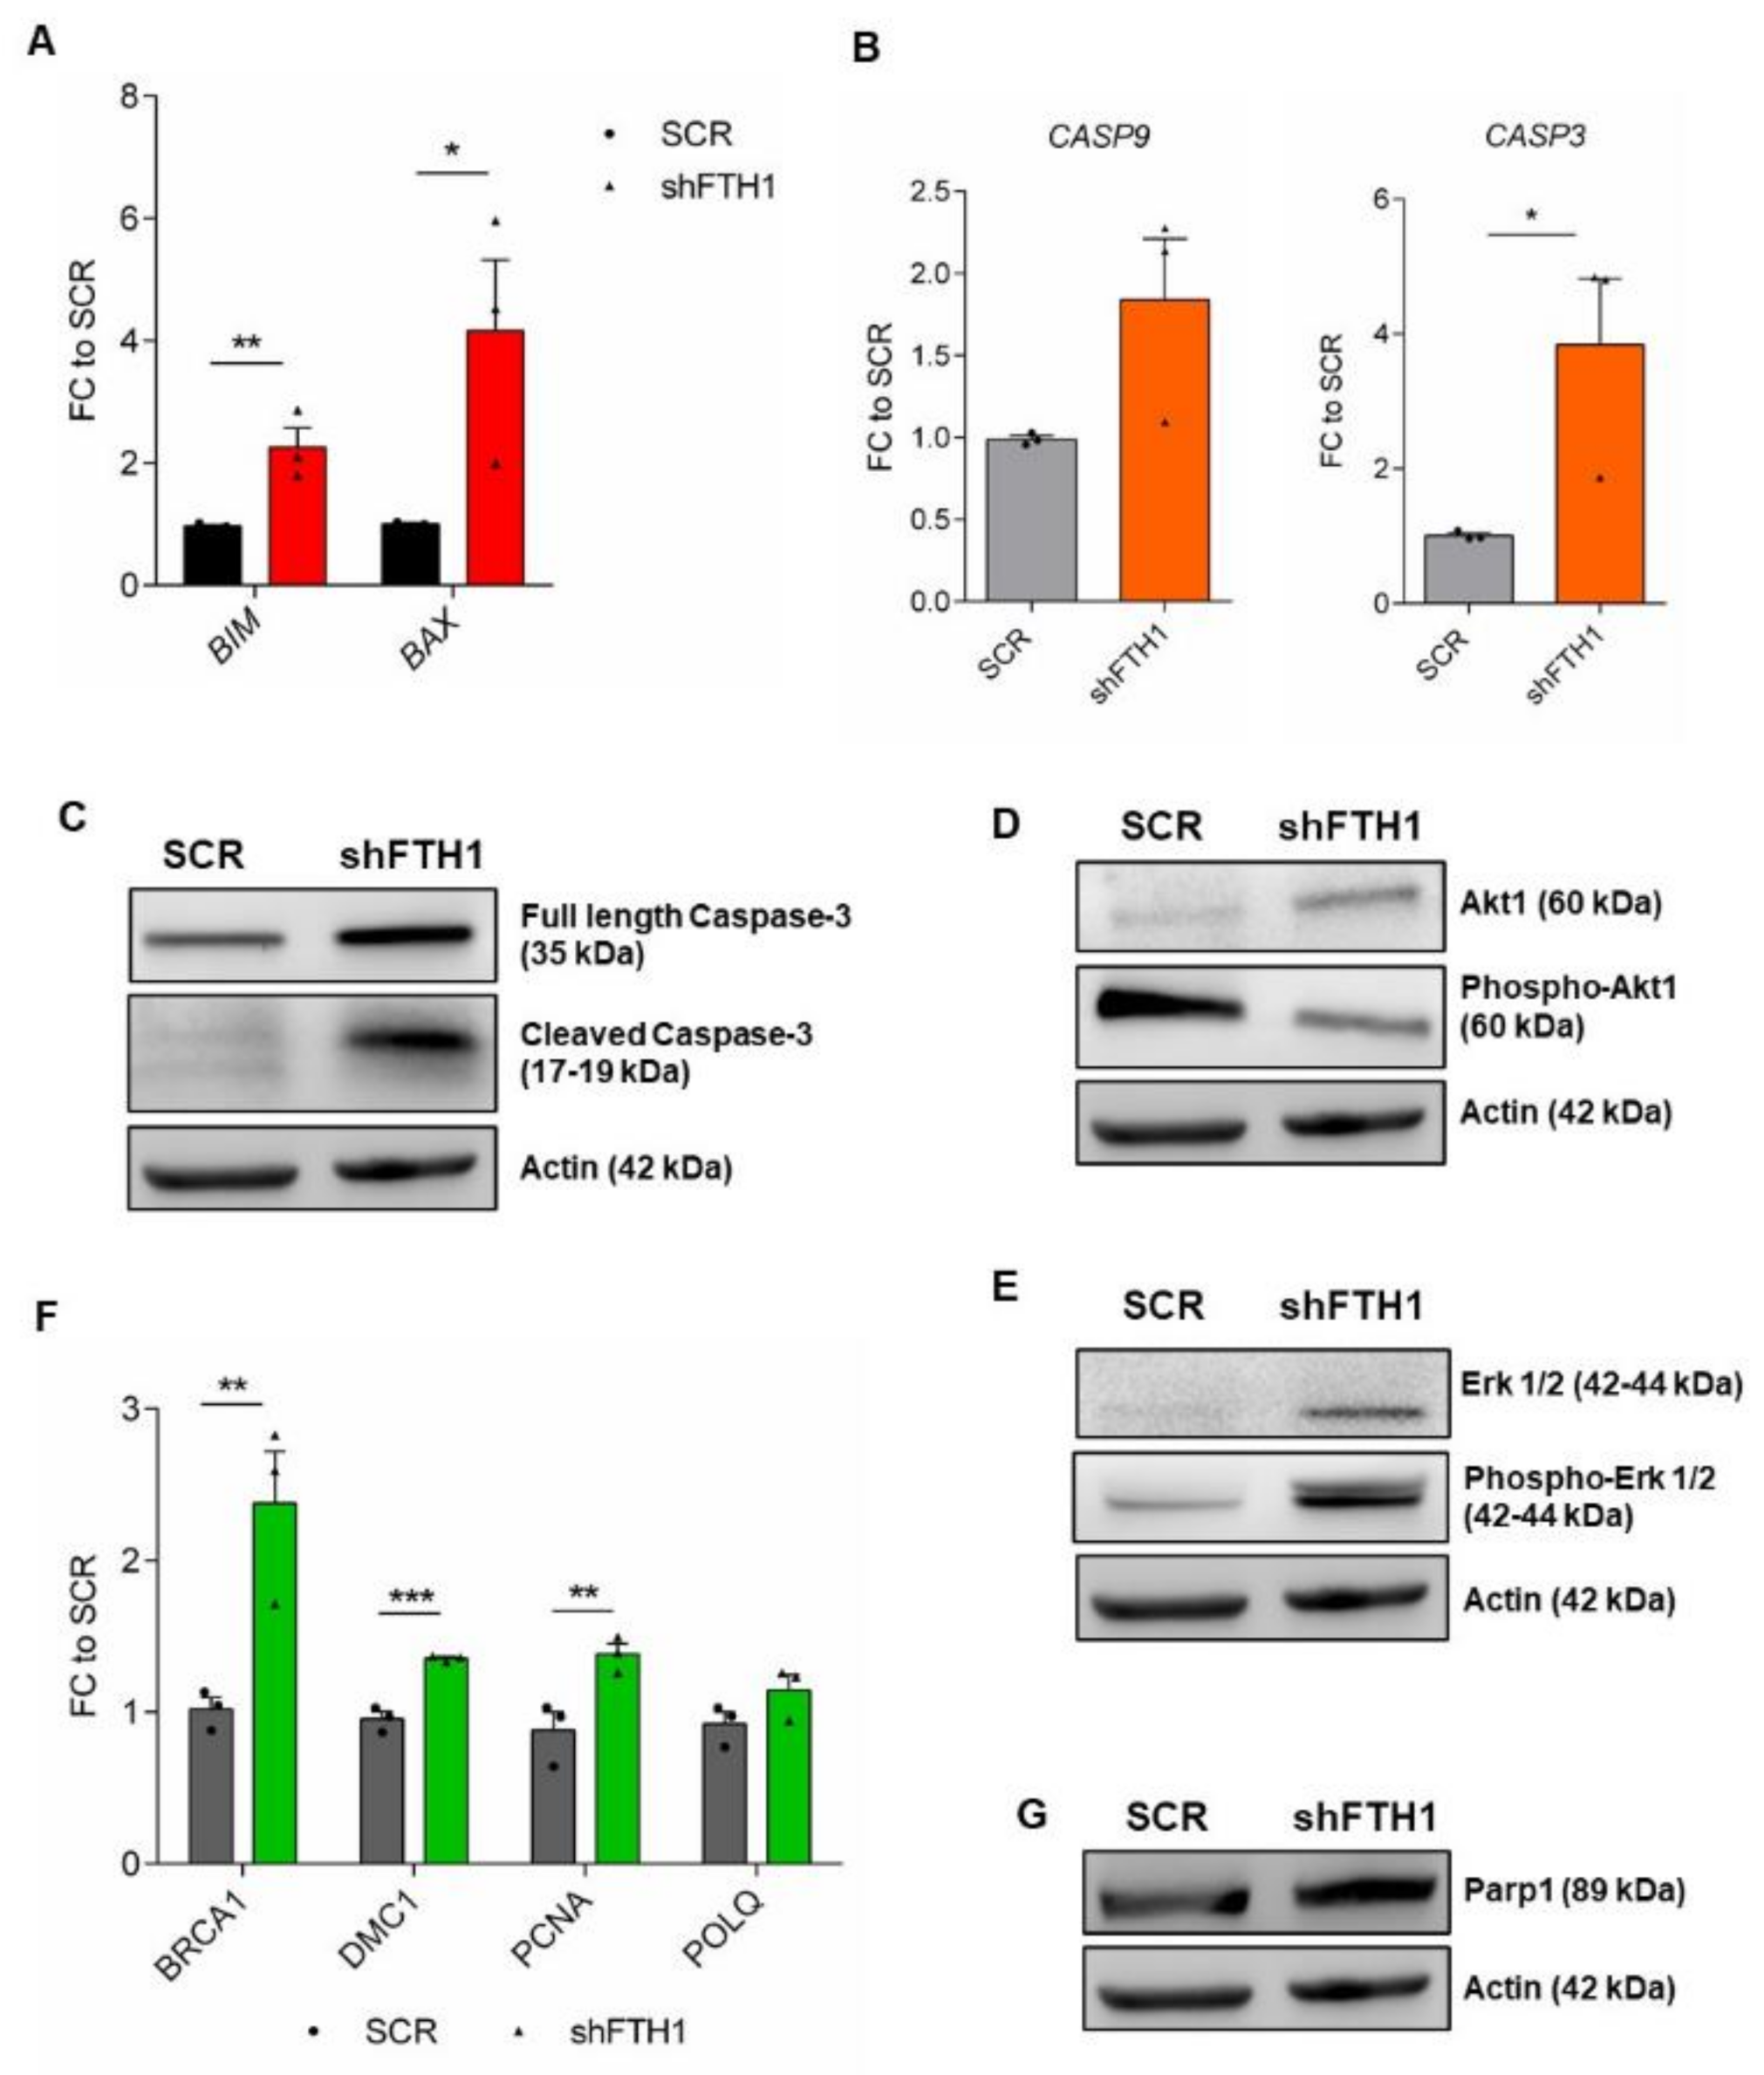
3.4. Effects of FTH1 Knock-Down on Apoptosis

Labile iron accumulation is a well-known cell damage effector and pro-apoptotic factor [44,45,46]; intracellular iron overload by ferric ammonium citrate (FAC) treatment leads to ferroptosis, an iron-regulated cell death [47]. To check the effects of FTH1-silencing on apoptosis, expression analysis of intrinsic pro-apoptotic genes such as BAX and BIM, as well as CASP9 and CASP3 was performed, revealing a significant upregulation in FTH1-KD hESCs compared to SCR control (Figure 4A,B). Similarly, immunoblot analysis of cleaved Caspase3 protein confirmed its overexpression in FTH1-silenced hESCs (Figure 4C, Supplementary Figure S5A,E). Further, flow cytometry-based analysis of apoptosis showed a significantly higher percentage of late apoptotic cells in FTH1-KD cells compared to SCR (Supplementary Figure S7). It is by now generally accepted that Akt and Erk1/2 pathways are both linked to apoptosis, but with opposite effects: Erk promotes apoptosis, both intrinsically and extrinsically and its activity can be driven by the presence of ROS [48]. By contrast, Akt is linked to cell survival, therefore its activity mediates the suppression of apoptosis [49]. Based on these observations, we speculated whether Erk and Akt could be involved in our FTH1-KD hESCs system; therefore, we measured their expression levels by immunoblot analysis and found that the active, phosphorylated Akt protein (pAkt) expression was reduced (Figure 4D, Supplementary Figure S5B,F), while the expression of pErk1/2 resulted in a significant increase (Figure 4E, Supplementary Figure S5C,G) in FTH1-silenced hESCs. Collectively, these findings clearly suggest that an active cell death program occurs in hESCs when ferritin is stably downregulated. In addition, based on the evidence that high ROS levels and FTH1 modulation also associate with DNA damage [50,51,52,53], we measured the expression of some DNA damage-associated genes. In line with previous studies, here we show that BRCA1, DMC1, PCNA, and POLQ are indeed significantly upregulated in FTH1-KD hESCs (Figure 4F). Similarly, we could also observe an increased expression of Parp1 protein, a substrate of activated caspase 3, in FTH1-silenced hESCs (Figure 4G, Supplementary Figure S5D,H). Overall, these results provide strong evidence that FTH1 silencing induces apoptosis in hESCs and triggers the activation of DNA-damage response programs, which are efficiently counteracted by the survival mechanisms described above.

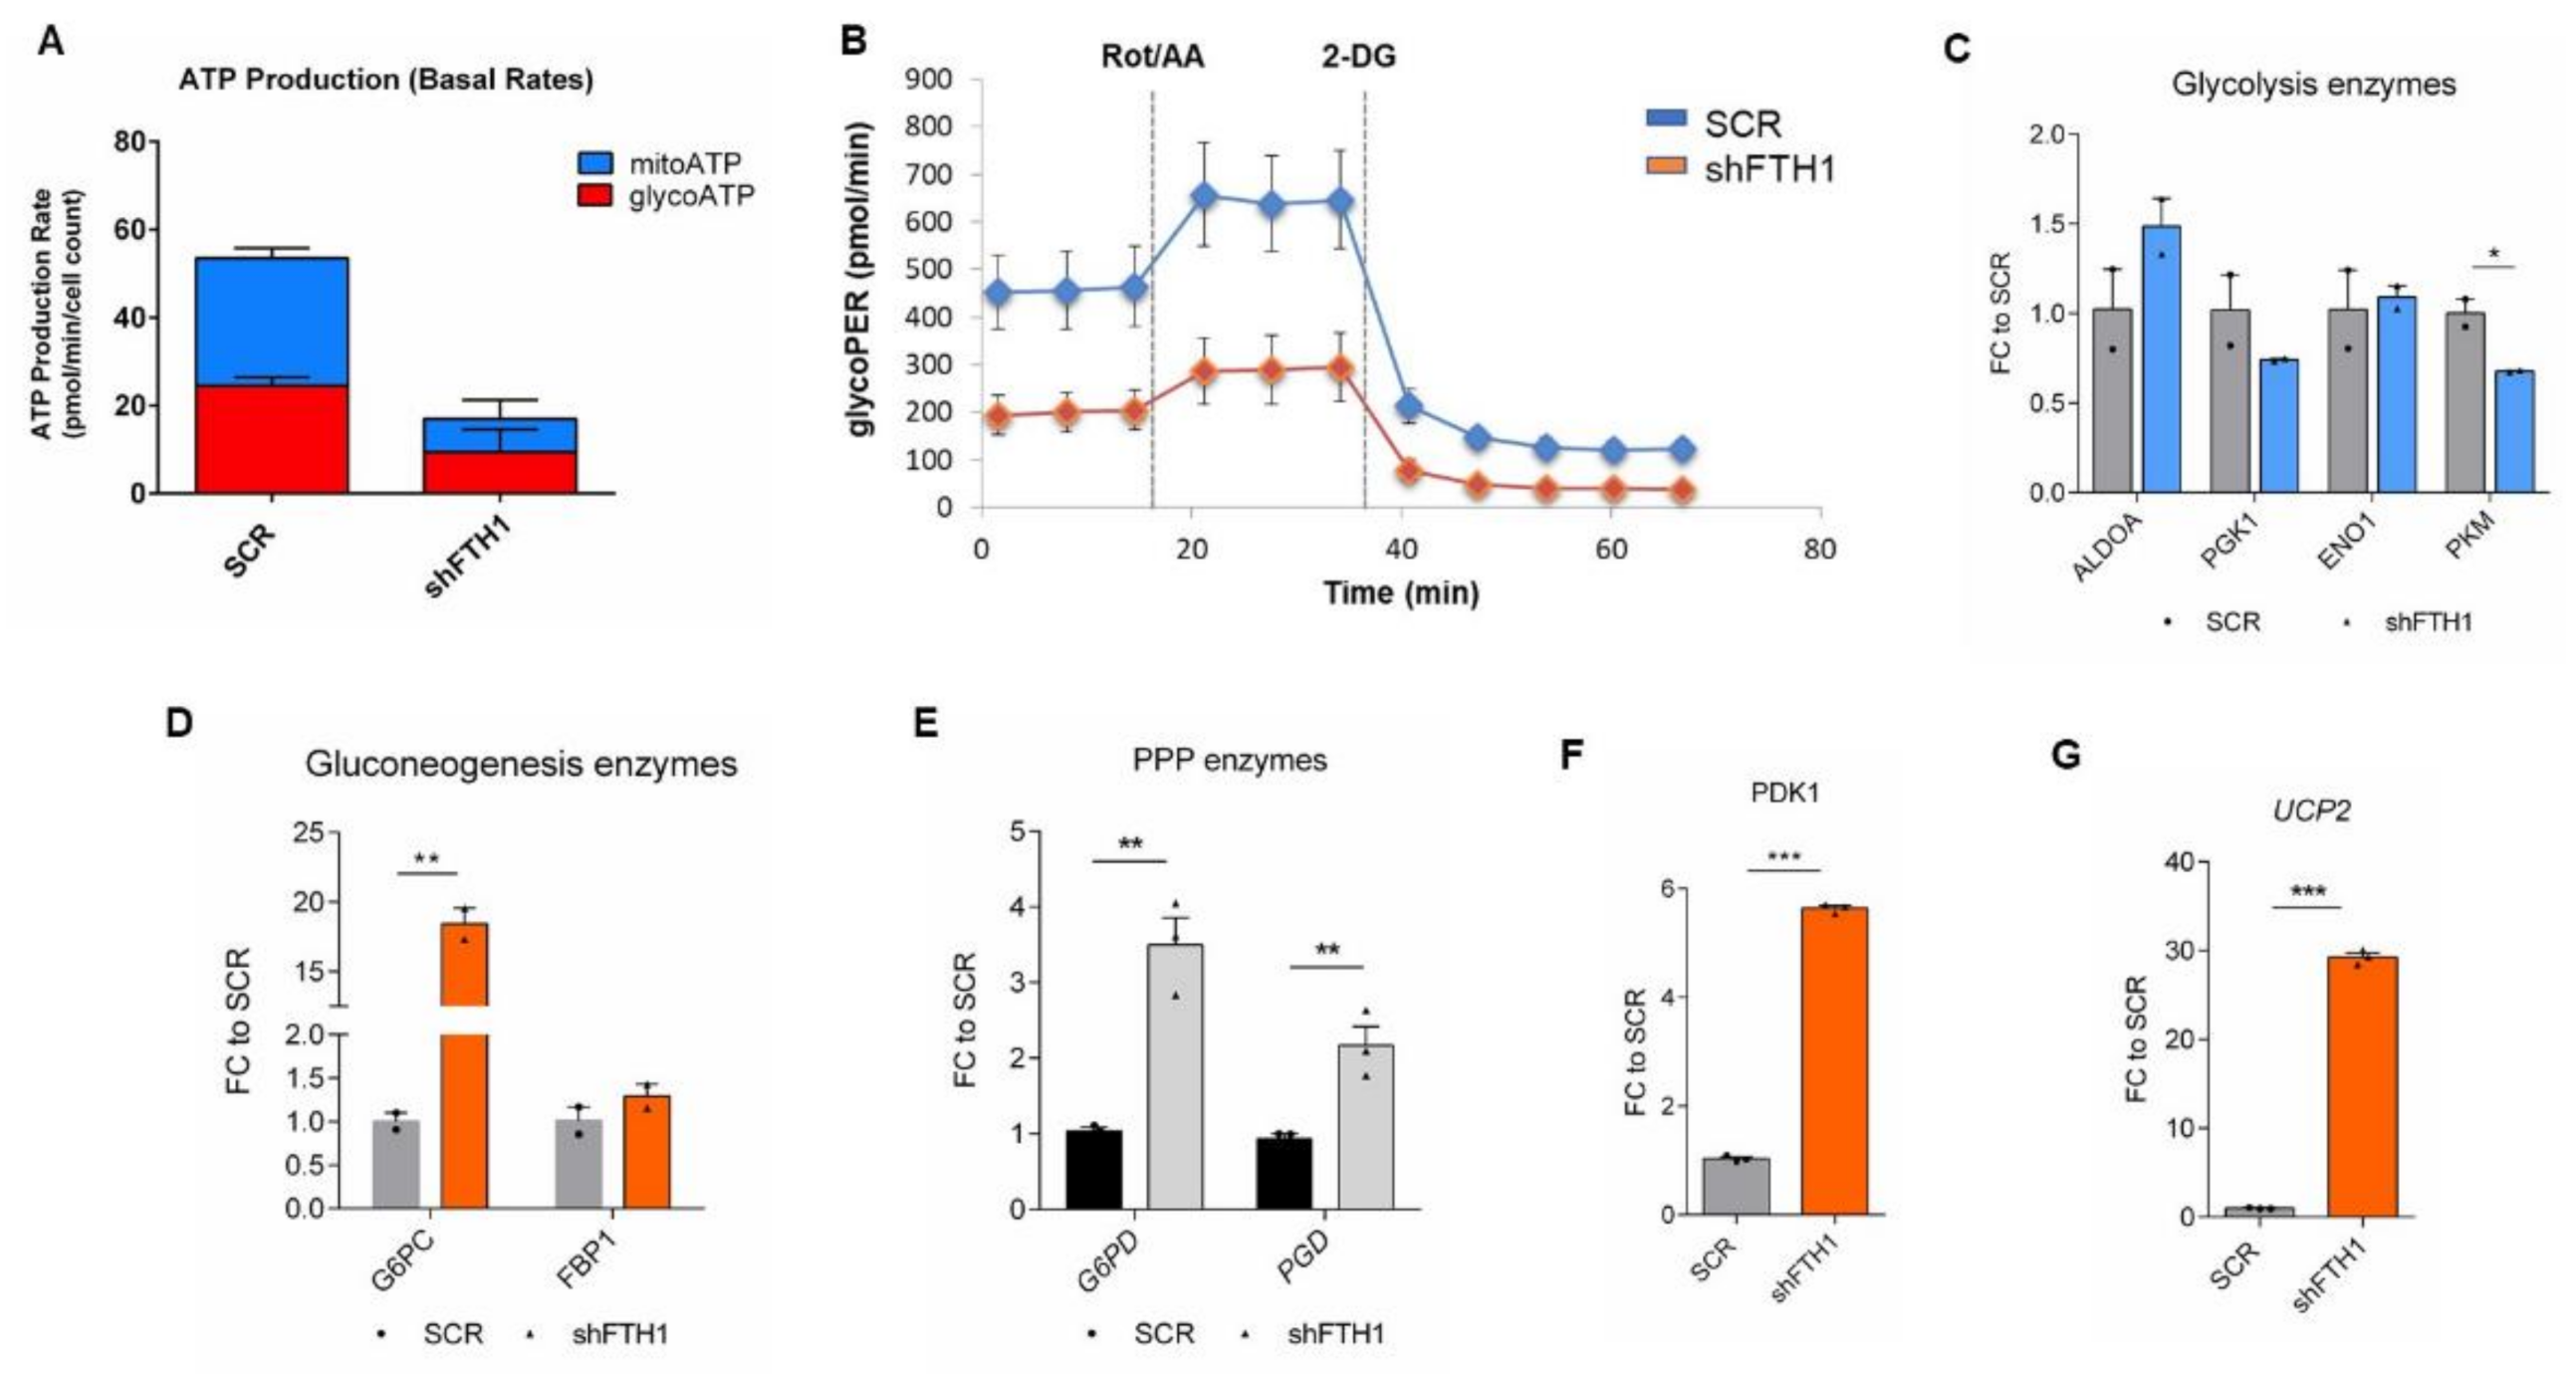
3.5. Effects of FTH1 Repression on Cellular Metabolism

Under oxidative stress conditions, a metabolic shift from OXPHOS to glycolysis was reported to be occurring [54], indicating a clear and intimate correlation between oxidative stress and metabolic changes. It is also well known that hPSCs mainly rely on glycolysis while OXPHOS takes place as soon as these cells enter differentiation [33,55]. Using the Seahorse analyzer, we first quantified the fraction of ATP generated by glycolysis and by OXPHOS, demonstrating an overall reduction in total ATP production from both metabolic sources in FTH1-silenced hESCs compared to SCR control. Therefore, we further sought to speculate on the total glycolytic activity in both cell lines. A lower basal and compensatory glycolytic rate was detected in FTH1-silenced hESCs, suggesting that mitochondrial respiration is somehow inhibited in these cells, which retain the capability to manage energy demand despite the downregulation of the ferritin gene (Figure 5B and Supplementary Figure S6B). For a more comprehensive metabolic investigation, we analyzed the expression levels of glycolysis-specific genes such as ALDOA, PGK1, ENO1, and PKM, along with gluconeogenesis-related genes G6PC1 and FBP1. In line with the results obtained by the glycolytic rate analysis, we could not observe significant changes in the expression of glycolytic genes between SCR and FTH1-silenced hESCs, with the exception of the PKM (pyruvate kinase M1/2) gene, encoding an ATP-generating enzyme, which results in significantly downregulated silenced cells (Figure 5C), strengthening the result obtained with the Seahorse analyzer quantification of total ATP production. On the other hand, the expression of G6PC1 (Glucose-6-Phosphatase Catalytic Subunit 1) resulted in significantly higher FTH1-silenced cells (Figure 5D). G6PC1 encodes one of the key enzymes responsible for glucose production from glucose-6-phosphate, and therefore it is critically involved in glucose homeostasis. This finding perfectly matches with the fact that high glucose levels are required for the proper functionality of detox systems, such as the pentose phosphate (PPP), glucuronidation, and glutathione biosynthesis pathways, all of which are finely tuned by Nrf2 [56,57]. In support of this, we found that G6PD (glucose-6-phosphate dehydrogenase) and PGD (6-Phosphogluconate dehydrogenase), two key enzymes of the PPP pathway, were significantly increased in FTH1-silenced cells (Figure 5E), strengthening the concept that the PPP may represent a crucial metabolic target through which the Nrf2 signaling potentiates the antioxidant response in hPSCs. The expression of PDK1 (pyruvate dehydrogenase kinase 1) was also significantly enhanced in FTH1-silenced hESCs (Figure 5F); its expression is positively regulated by HIF1α, previously shown to participate in ROS-induced metabolic reprogramming, where PDK1 prevents the pyruvate from entering the TCA cycle (tricarboxylic acid cycle or Krebs cycle) [58]. We finally tested the expression level of UCP2 (Uncoupling protein-2), a protein of the inner mitochondrial membrane, involved in uncoupling OXPHOS from ATP synthesis. Analogously to PDK1, UCP2 expression was significantly higher in FTH1-silenced hESCs (Figure 5G). As PDK1, UCP2 blocks pyruvate entry into the Krebs cycle and shunts it towards the PPP pathway [19,59,60]. Altogether, our findings are indicative of a metabolic rewiring occurring in response to iron-mediated oxidative stress in hESCs.

4. Discussion

Pluripotent stem cells (PSCs), including ESCs and iPSCs, possess unique and extraordinary self-renewal capabilities, while maintaining their pluripotency [61]. In addition to these properties, PSCs also have the ability to give rise to almost any cell type, both in vivo and in vitro. On the basis of these key features, PSCs technology holds enormous potential in many fields of biomedical research, including drug screening, development and repurposing [62,63,64,65], disease modelling [66,67,68,69,70], cell therapy [71], aging [72], and regenerative medicine [73]. Although significant progress has been made, many hurdles still need to be overcome to push PSCs technology towards the road to clinical practice. Apart from immunogenicity and genomic instability, undoubtedly representing the two major challenges, the successful differentiation and functional maturation of PSC derivatives must faithfully recapitulate all aspects of somatic cells and tissues, including the metabolic function. For instance, little is known about the role of ferritin heavy chain (FTH1), the major ferroxidase protein, in human ESCs homeostasis. Ferritin is composed of 24 heavy and light chains, whose core is able to sequester up to 4500 iron atoms [74]. Ferritin heavy chain, in particular, is responsible for the oxidation of ferrous iron [Fe(II)] to less reactive ferric iron [Fe(III)] [75]. Even though there is a wide literature suggesting that FTH1 is a major player in protecting cells against oxidative stress [76], so far, its role in embryonic stem cells has not been fully elucidated. As mentioned earlier in this work, ROS play an important role as second messengers in embryo development [77,78], and their effects, beneficial or deleterious, depend on the embryo developmental stage. Compared to most terminally differentiated cells, ESCs are extremely resistant to hypoxic stress as they live and greatly proliferate at low oxygen concentrations [79,80], suggesting that they are equipped with a highly efficient antioxidant system [5,10]. Because of its strong ferroxidase activity, FTH1 is supposed to be one of the major players in this system, maintaining iron in a safe and bioavailable form. To gain insights on the effects of FTH1-mediated control of ROS-induced cellular stress, here we stably silenced the FTH1 gene in H9 human embryonic stem cell line using the shRNA strategy. Intracellular ROS production, measured in shFTH1-hESC by flow cytometry together with mitochondrial superoxide species, revealed that silenced cells have decreased levels of ROS accumulation. Similarly, mitochondrial membrane potential detected by TMRM assay, showed that FTH1 silencing produces a reduction in mitochondrial membrane depolarization in shFTH1-hESCs compared to SCR control. By monitoring self-renewal and pluripotency, interesting findings emerged: (i) morphologically, shFTH1 hESCs were more flattened and had less AP+ cells compared to SCR control cells; (ii) the core pluripotency genes OCT4, NANOG, and SOX2 were significantly overexpressed in FTH1-silenced cells; (iii) immunoblot analysis of Nanog protein revealed an increased expression in silenced cells. As pointed out elsewhere in the text, NANOG expression is under the control of the nuclear factor erythroid 2-related factor 2 (Nrf2), a stress-activated transcription factor involved in the cellular response to multiple injuries, among which oxidation is the most prominent. In a recent review, Dai and Coll. [81] summarize Nrf2-Keap1 signaling in the context of stem cell state and function, suggesting that it can serve as a master regulator of stem cell redox and metabolic homeostasis. Nrf2, in fact, can efficiently modulate ESCs and iPSCs pluripotency status by finely tuning NANOG and OCT4 expression through direct binding to upstream regions of these genes and delaying their proteasome-mediated ubiquitination [41]. Our data showed clear evidence of the increased Nrf2 expression in hESCs, both at mRNA and protein level, upon FTH1 silencing. Overexpression of Nrf2 is therefore responsible, in our model, for the upregulation of NANOG, as well as for the activation of the Gpx4 (glutathione peroxidase 4) ROS scavenger protein. A correlation between activation of Nrf2 and induced expression of FTH1 has been previously reported in mouse embryonic fibroblasts (MEFs) exposed to beta-naphthoflavone and chemo preventive dithiolethiones, providing a mechanistic link between regulation of the iron storage protein ferritin and the cancer chemo preventive response [82]. Ferritin is also known to function as a powerful anti-apoptotic protein [83]. Accordingly, our results show that FTH1-silencing triggers the activation of apoptosis-associated genes BAX, BIM, CASP3, and CASP9; we further deepened our analysis by studying the AKT and ERK1/2 pathways, which undergo significant perturbations during apoptosis. Previous studies have reported conflicting results, showing that MAPK/ERK and PI3/AKT signaling pathways can be either activated [84] or decreased [85] in mESCs and hESCs upon ROS exposure. Our data clearly indicate that ferritin silencing produces a reduction in the levels of the active, phosphorylated form of Akt, while ERK1/2 signaling is activated. With respect to cell metabolism, most of the studies have focused on glycolytic metabolism and on its role in maintaining pluripotency, as well as the importance of a metabolic shift required for somatic cells in order to enter pluripotency during reprogramming. In this study we went beyond previous reports, speculating whether modulation of FTH1 by repression may impact on hESCs homeostasis and metabolic properties. Interestingly, extensive analysis showed that FTH1-silenced hESCs undergo significant metabolic reorganization. More specifically, we observed that FTH1-KD hESCs cells respond to the loss of ferritin heavy chain by activating a strong antioxidant response that entails the expression of major ROS scavengers such as SODs, CAT, and GPXs. Moreover, FTH1-silenced hESCs had an increased expression of the G6PD gene, which is one of the most important sources of NADPH, essential for maintaining redox homeostasis [86]. Together with G6PD, PDK1 and UCP2 were upregulated as well in silenced cells, suggesting a rewiring of metabolites from glycolysis to PPP and corroborated by a reduced glycolytic flux in shFTH1-hESCs. Consistent with the idea that PPP flux leads to an elevated reduction of NADP+ to NADPH [87,88], we suggest that an increased PPP flux is favored in hESCs with repressed FTH1 expression to drive the ROS clearance.

5. Conclusions

To our knowledge, this is the first study shedding light on the role of ferritin modulation by repression in human ESCs. In agreement with our work, previous studies have reported that ESCs are very resistant to oxidative stress. Interestingly, here we provide evidence of a potential interplay between the Nrf2 axis and oxidative pentose phosphate pathway (PPP) as the molecular mechanism underlying the antioxidant response in hESCs under shFTH1-induced stress conditions (Figure 6). Future investigations are necessary to validate the conclusions drawn from this study.

Supplementary Materials

The following are available online at https://www.mdpi.com/article/10.3390/cells10092431/s1, Figure S1: Assessment of FTH1 silencing efficiency, Figure S2: SCR and shFTH1 hESCs pluripotency characterization, Figure S3: Iron level quantification and flow cytometric assessment of intracellular ROS levels and mitochondrial membrane potential (ΔΨM), Figure S4: Study of Nrf2 signaling activation upon FTH1 silencing, Figure S5: Evaluation of FTH1 silencing effect on apoptosis and DNA damage, Figure S6: Analysis of metabolic changes occurring in FTH1 hESCs. Table S1: List of primers used for qRT-PCR experiments.

Author Contributions

Conceptualization, E.I.P. and G.C.; Data curation, V.L. and E.I.P.; Formal analysis, L.S., V.L., S.S., M.L.C., A.S., F.B. and E.I.P.; Funding acquisition, G.C.; Investigation, L.S., V.L., S.S., M.L.C., C.Z. and E.I.P.; Methodology, L.S., V.L., S.S., M.L.C., C.Z., A.S. and F.B.; Project administration, E.I.P. and G.C.; Resources, G.C.; Supervision, E.I.P., F.S.C. and G.C.; Validation, L.S. and V.L.; Visualization, E.I.P.; Writing—original draft, E.I.P.; Writing—review and editing, F.S.C. and G.C. All co-authors have reviewed the manuscript and approved its content prior to submission. All co-authors confirm that the manuscript has been submitted solely to this journal and is not published, in press, or submitted elsewhere. All authors have read and agreed to the published version of the manuscript.

Funding

This study was supported in part by grant # PRIN 2017CH4RNP_001 to G.C. and the European Commission’s FESR FSE 2014–2020 and Regione Calabria to V.L.

Institutional Review Board Statement

Not applicable.

Informed Consent Statement

Not applicable.

Data Availability Statement

All the data presented in this study are available from the corresponding author upon reasonable request.

Conflicts of Interest

The authors declare no conflict of interest.

References

  1. Forrester, S.J.; Kikuchi, D.S.; Hernandes, M.S.; Xu, Q.; Griendling, K.K. Reactive Oxygen Species in Metabolic and Inflammatory Signaling. Circ. Res. 2018, 122, 877–902. [Google Scholar] [CrossRef]
  2. Martindale, J.L.; Holbrook, N.J. Cellular Response to Oxidative Stress: Signaling for Suicide and Survival*. J. Cell. Physiol. 2002, 192, 1–15. [Google Scholar] [CrossRef] [PubMed]
  3. Holmström, K.M.; Finkel, T. Cellular Mechanisms and Physiological Consequences of Redox-Dependent Signalling. Nat. Rev. Mol. Cell Biol. 2014, 15, 411–421. [Google Scholar] [CrossRef] [PubMed]
  4. Zhong, W.; Qian, K.; Xiong, J.; Ma, K.; Wang, A.; Zou, Y. Curcumin Alleviates Lipopolysaccharide Induced Sepsis and Liver Failure by Suppression of Oxidative Stress-Related Inflammation via PI3K/AKT and NF-ΚB Related Signaling. Biomed. Pharmacother. 2016, 83, 302–313. [Google Scholar] [CrossRef] [PubMed]
  5. Guo, Y.-L.; Chakraborty, S.; Rajan, S.S.; Wang, R.; Huang, F. Effects of Oxidative Stress on Mouse Embryonic Stem Cell Proliferation, Apoptosis, Senescence, and Self-Renewal. Stem Cells Dev. 2010, 19, 1321–1331. [Google Scholar] [CrossRef]
  6. Forsyth, N.R.; Musio, A.; Vezzoni, P.; Simpson, A.H.R.W.; Noble, B.S.; McWhir, J. Physiologic Oxygen Enhances Human Embryonic Stem Cell Clonal Recovery and Reduces Chromosomal Abnormalities. Cloning Stem Cells 2006, 8, 16–23. [Google Scholar] [CrossRef]
  7. Ji, A.-R.; Ku, S.-Y.; Cho, M.S.; Kim, Y.Y.; Kim, Y.J.; Oh, S.K.; Kim, S.H.; Moon, S.Y.; Choi, Y.M. Reactive Oxygen Species Enhance Differentiation of Human Embryonic Stem Cells into Mesendodermal Lineage. Exp. Mol. Med. 2010, 42, 175. [Google Scholar] [CrossRef] [Green Version]
  8. Saito, S.; Lin, Y.-C.; Tsai, M.-H.; Lin, C.-S.; Murayama, Y.; Sato, R.; Yokoyama, K.K. Emerging Roles of Hypoxia-Inducible Factors and Reactive Oxygen Species in Cancer and Pluripotent Stem Cells. Kaohsiung J. Med. Sci. 2015, 31, 279–286. [Google Scholar] [CrossRef] [Green Version]
  9. Trachootham, D.; Lu, W.; Ogasawara, M.A.; Valle, N.R.-D.; Huang, P. Redox Regulation of Cell Survival. Antioxid. Redox Signal. 2008, 10, 1343–1374. [Google Scholar] [CrossRef] [Green Version]
  10. Armstrong, L.; Tilgner, K.; Saretzki, G.; Atkinson, S.P.; Stojkovic, M.; Moreno, R.; Przyborski, S.; Lako, M. Human Induced Pluripotent Stem Cell Lines Show Stress Defense Mechanisms and Mitochondrial Regulation Similar to Those of Human Embryonic Stem Cells. Stem Cells 2010, 28, 661–673. [Google Scholar] [CrossRef] [PubMed]
  11. Murry, C.E.; Keller, G. Differentiation of Embryonic Stem Cells to Clinically Relevant Populations: Lessons from Embryonic Development. Cell 2008, 132, 661–680. [Google Scholar] [CrossRef] [PubMed] [Green Version]
  12. Ogasawara, M.A.; Zhang, H. Redox Regulation and Its Emerging Roles in Stem Cells and Stem-Like Cancer Cells. Antioxid. Redox Signal. 2009, 11, 1107–1122. [Google Scholar] [CrossRef] [PubMed]
  13. Saretzki, G.; Walter, T.; Atkinson, S.; Passos, J.F.; Bareth, B.; Keith, W.N.; Stewart, R.; Hoare, S.; Stojkovic, M.; Armstrong, L.; et al. Downregulation of Multiple Stress Defense Mechanisms During Differentiation of Human Embryonic Stem Cells. Stem Cells 2008, 26, 455–464. [Google Scholar] [CrossRef] [PubMed]
  14. Lin, C.-Y.; Peng, C.-Y.; Huang, T.-T.; Wu, M.-L.; Lai, Y.-L.; Peng, D.H.; Chen, P.-F.; Chen, H.-F.; Yen, B.L.; Wu, K.K.; et al. Exacerbation of Oxidative Stress-Induced Cell Death and Differentiation in Induced Pluripotent Stem Cells Lacking Heme Oxygenase-1. Stem Cells Dev. 2012, 21, 1675–1687. [Google Scholar] [CrossRef] [Green Version]
  15. Sanzo, M.D.; Aversa, I.; Santamaria, G.; Gagliardi, M.; Panebianco, M.; Biamonte, F.; Zolea, F.; Faniello, M.C.; Cuda, G.; Costanzo, F. FTH1P3, a Novel H-Ferritin Pseudogene Transcriptionally Active, Is Ubiquitously Expressed and Regulated during Cell Differentiation. PLoS ONE 2016, 11, e0151359. [Google Scholar] [CrossRef]
  16. Solari, C.; Petrone, M.V.; Vazquez Echegaray, C.; Cosentino, M.S.; Waisman, A.; Francia, M.; Barañao, L.; Miriuka, S.; Guberman, A. Superoxide Dismutase 1 Expression Is Modulated by the Core Pluripotency Transcription Factors Oct4, Sox2 and Nanog in Embryonic Stem Cells. Mech. Dev. 2018, 154, 116–121. [Google Scholar] [CrossRef]
  17. Folmes, C.D.L.; Dzeja, P.P.; Nelson, T.J.; Terzic, A. Metabolic Plasticity in Stem Cell Homeostasis and Differentiation. Cell. Stem Cell 2012, 11, 596–606. [Google Scholar] [CrossRef] [Green Version]
  18. Prigione, A.; Fauler, B.; Lurz, R.; Lehrach, H.; Adjaye, J. The Senescence-Related Mitochondrial/Oxidative Stress Pathway Is Repressed in Human Induced Pluripotent Stem Cells. Stem Cells 2010, 28, 721–733. [Google Scholar] [CrossRef]
  19. Zhang, J.; Khvorostov, I.; Hong, J.S.; Oktay, Y.; Vergnes, L.; Nuebel, E.; Wahjudi, P.N.; Setoguchi, K.; Wang, G.; Do, A.; et al. UCP2 Regulates Energy Metabolism and Differentiation Potential of Human Pluripotent Stem Cells. EMBO J. 2011, 30, 4860–4873. [Google Scholar] [CrossRef] [Green Version]
  20. De Angelis, M.T.; Santamaria, G.; Parrotta, E.I.; Scalise, S.; Lo Conte, M.; Gasparini, S.; Ferlazzo, E.; Aguglia, U.; Ciampi, C.; Sgura, A.; et al. Establishment and Characterization of Induced Pluripotent Stem Cells (IPSCs) from Central Nervous System Lupus Erythematosus. J. Cell. Mol. Med. 2019, 23, 7382–7394. [Google Scholar] [CrossRef]
  21. Galaris, D.; Barbouti, A.; Pantopoulos, K. Iron Homeostasis and Oxidative Stress: An Intimate Relationship. Biochim. Biophys. Acta BBA-Mol. Cell Res. 2019, 1866, 118535. [Google Scholar] [CrossRef]
  22. Han, Z.; Yu, Y.; Xu, J.; Bao, Z.; Xu, Z.; Hu, J.; Yu, M.; Bamba, D.; Ma, W.; Ding, F.; et al. Iron Homeostasis Determines Fate of Human Pluripotent Stem Cells Via Glycerophospholipids-Epigenetic Circuit. Stem Cells 2019, 37, 489–503. [Google Scholar] [CrossRef]
  23. Han, Z.; Xu, Z.; Chen, L.; Ye, D.; Yu, Y.; Zhang, Y.; Cao, Y.; Djibril, B.; Guo, X.; Gao, X.; et al. Iron Overload Inhibits Self-renewal of Human Pluripotent Stem Cells via DNA Damage and Generation of Reactive Oxygen Species. FEBS Open Bio 2020, 10, 726–733. [Google Scholar] [CrossRef] [Green Version]
  24. Kondoh, H.; Lleonart, M.E.; Nakashima, Y.; Yokode, M.; Tanaka, M.; Bernard, D.; Gil, J.; Beach, D. A High Glycolytic Flux Supports the Proliferative Potential of Murine Embryonic Stem Cells. Antioxid. Redox Signal. 2007, 9, 293–299. [Google Scholar] [CrossRef] [PubMed]
  25. Liu, K.; Cao, J.; Shi, X.; Wang, L.; Zhao, T. Cellular Metabolism and Homeostasis in Pluripotency Regulation. Protein Cell 2020, 11, 630–640. [Google Scholar] [CrossRef]
  26. Zhang, J.; Nuebel, E.; Daley, G.Q.; Koehler, C.M.; Teitell, M.A. Metabolic Regulation in Pluripotent Stem Cells during Reprogramming and Self-Renewal. Cell Stem Cell 2012, 11, 589–595. [Google Scholar] [CrossRef] [PubMed] [Green Version]
  27. Caiazza, C.; D’Agostino, M.; Passaro, F.; Faicchia, D.; Mallardo, M.; Paladino, S.; Pierantoni, G.M.; Tramontano, D. Effects of Long-Term Citrate Treatment in the PC3 Prostate Cancer Cell Line. Int. J. Mol. Sci. 2019, 20, 2613. [Google Scholar] [CrossRef] [PubMed] [Green Version]
  28. Heiden, M.G.V.; Locasale, J.W.; Swanson, K.D.; Sharfi, H.; Heffron, G.J.; Amador-Noguez, D.; Christofk, H.R.; Wagner, G.; Rabinowitz, J.D.; Asara, J.M.; et al. Evidence for an Alternative Glycolytic Pathway in Rapidly Proliferating Cells. Science 2010, 329, 1492–1499. [Google Scholar] [CrossRef] [PubMed] [Green Version]
  29. Lisowski, P.; Kannan, P.; Mlody, B.; Prigione, A. Mitochondria and the Dynamic Control of Stem Cell Homeostasis. EMBO Rep. 2018, 19, e45432. [Google Scholar] [CrossRef]
  30. Ralser, M.; Wamelink, M.M.; Kowald, A.; Gerisch, B.; Heeren, G.; Struys, E.A.; Klipp, E.; Jakobs, C.; Breitenbach, M.; Lehrach, H.; et al. Dynamic Rerouting of the Carbohydrate Flux Is Key to Counteracting Oxidative Stress. J. Biol. 2007, 6, 10. [Google Scholar] [CrossRef] [PubMed] [Green Version]
  31. Zhang, H.; Badur, M.G.; Divakaruni, A.S.; Parker, S.J.; Jäger, C.; Hiller, K.; Murphy, A.N.; Metallo, C.M. Distinct Metabolic States Can Support Self-Renewal and Lipogenesis in Human Pluripotent Stem Cells under Different Culture Conditions. Cell Rep. 2016, 16, 1536–1547. [Google Scholar] [CrossRef] [Green Version]
  32. Lees, J.G.; Rathjen, J.; Sheedy, J.R.; Gardner, D.K.; Harvey, A.J. Distinct Profiles of Human Embryonic Stem Cell Metabolism and Mitochondria Identified by Oxygen. Reproduction 2015, 150, 367–382. [Google Scholar] [CrossRef] [Green Version]
  33. Varum, S.; Rodrigues, A.S.; Moura, M.B.; Momcilovic, O.; Easley, C.A.; Ramalho-Santos, J.; Van Houten, B.; Schatten, G. Energy Metabolism in Human Pluripotent Stem Cells and Their Differentiated Counterparts. PLoS ONE 2011, 6, e20914. [Google Scholar] [CrossRef] [Green Version]
  34. Tian, Y.; Lu, J.; Hao, X.; Li, H.; Zhang, G.; Liu, X.; Li, X.; Zhao, C.; Kuang, W.; Chen, D.; et al. FTH1 Inhibits Ferroptosis Through Ferritinophagy in the 6-OHDA Model of Parkinson’s Disease. Neurotherapeutics 2020, 17, 1796–1812. [Google Scholar] [CrossRef]
  35. Kerins, M.J.; Ooi, A. The Roles of NRF2 in Modulating Cellular Iron Homeostasis. Antioxid. Redox Signal. 2018, 29, 1756–1773. [Google Scholar] [CrossRef] [Green Version]
  36. Salatino, A.; Aversa, I.; Battaglia, A.M.; Sacco, A.; Di Vito, A.; Santamaria, G.; Chirillo, R.; Veltri, P.; Tradigo, G.; Di Cello, A.; et al. H-Ferritin Affects Cisplatin-Induced Cytotoxicity in Ovarian Cancer Cells through the Modulation of ROS. Oxid. Med. Cell. Longev. 2019, 2019, e3461251. [Google Scholar] [CrossRef] [PubMed]
  37. McMahon, M.; Itoh, K.; Yamamoto, M.; Hayes, J.D. Keap1-Dependent Proteasomal Degradation of Transcription Factor Nrf2 Contributes to the Negative Regulation of Antioxidant Response Element-Driven Gene Expression. J. Biol. Chem. 2003, 278, 21592–21600. [Google Scholar] [CrossRef] [PubMed] [Green Version]
  38. Kobayashi, A.; Kang, M.-I.; Okawa, H.; Ohtsuji, M.; Zenke, Y.; Chiba, T.; Igarashi, K.; Yamamoto, M. Oxidative Stress Sensor Keap1 Functions as an Adaptor for Cul3-Based E3 Ligase To Regulate Proteasomal Degradation of Nrf2. Mol. Cell. Biol. 2004, 24, 7130–7139. [Google Scholar] [CrossRef] [Green Version]
  39. Kansanen, E.; Kuosmanen, S.M.; Leinonen, H.; Levonen, A.-L. The Keap1-Nrf2 Pathway: Mechanisms of Activation and Dysregulation in Cancer. Redox Biol. 2013, 1, 45–49. [Google Scholar] [CrossRef] [Green Version]
  40. Hawkins, K.E.; Joy, S.; Delhove, J.M.K.M.; Kotiadis, V.N.; Fernandez, E.; Fitzpatrick, L.M.; Whiteford, J.R.; King, P.J.; Bolanos, J.P.; Duchen, M.R.; et al. NRF2 Orchestrates the Metabolic Shift during Induced Pluripotent Stem Cell Reprogramming. Cell Rep. 2016, 14, 1883–1891. [Google Scholar] [CrossRef] [PubMed] [Green Version]
  41. Jang, J.; Wang, Y.; Kim, H.-S.; Lalli, M.A.; Kosik, K.S. Nrf2, a Regulator of the Proteasome, Controls Self-Renewal and Pluripotency in Human Embryonic Stem Cells. Stem Cells 2014, 32, 2616–2625. [Google Scholar] [CrossRef] [PubMed] [Green Version]
  42. Katsuragi, Y.; Ichimura, Y.; Komatsu, M. Regulation of the Keap1–Nrf2 Pathway by P62/SQSTM1. Curr. Opin. Toxicol. 2016, 1, 54–61. [Google Scholar] [CrossRef] [Green Version]
  43. Jain, A.; Lamark, T.; Sjøttem, E.; Larsen, K.B.; Awuh, J.A.; Øvervatn, A.; McMahon, M.; Hayes, J.D.; Johansen, T. P62/SQSTM1 Is a Target Gene for Transcription Factor NRF2 and Creates a Positive Feedback Loop by Inducing Antioxidant Response Element-Driven Gene Transcription. J. Biol. Chem. 2010, 285, 22576–22591. [Google Scholar] [CrossRef] [Green Version]
  44. Jin, X.; He, X.; Cao, X.; Xu, P.; Xing, Y.; Sui, S.; Wang, L.; Meng, J.; Lu, W.; Cui, R.; et al. Iron Overload Impairs Normal Hematopoietic Stem and Progenitor Cells through Reactive Oxygen Species and Shortens Survival in Myelodysplastic Syndrome Mice. Haematologica 2018, 103, 1627–1634. [Google Scholar] [CrossRef] [PubMed] [Green Version]
  45. Dixon, S.J.; Stockwell, B.R. The Role of Iron and Reactive Oxygen Species in Cell Death. Nat. Chem. Biol. 2014, 10, 9–17. [Google Scholar] [CrossRef] [PubMed]
  46. Stoyanovsky, D.A.; Billiar, T.R. Cellular non-heme iron modulates apoptosis and caspase 3 activity. In Radicals for Life; Elsevier: Amsterdam, The Netherlands, 2007; pp. 253–268. ISBN 978-0-444-52236-8. [Google Scholar]
  47. Fang, S.; Yu, X.; Ding, H.; Han, J.; Feng, J. Effects of Intracellular Iron Overload on Cell Death and Identification of Potent Cell Death Inhibitors. Biochem. Biophys. Res. Commun. 2018, 503, 297–303. [Google Scholar] [CrossRef]
  48. Zhuang, S.; Yan, Y.; Daubert, R.A.; Han, J.; Schnellmann, R.G. ERK Promotes Hydrogen Peroxide-Induced Apoptosis through Caspase-3 Activation and Inhibition of Akt in Renal Epithelial Cells. Am. J. Physiol.-Ren. Physiol. 2007, 292, F440–F447. [Google Scholar] [CrossRef] [Green Version]
  49. Kennedy, S.G.; Kandel, E.S.; Cross, T.K.; Hay, N. Akt/Protein Kinase B Inhibits Cell Death by Preventing the Release of Cytochrome c from Mitochondria. Mol. Cell. Biol. 1999, 19, 5800–5810. [Google Scholar] [CrossRef] [Green Version]
  50. Cal, M.; Matyjaszczyk, I.; Litwin, I.; Augustyniak, D.; Ogórek, R.; Ko, Y.; Ułaszewski, S. The Anticancer Drug 3-Bromopyruvate Induces DNA Damage Potentially Through Reactive Oxygen Species in Yeast and in Human Cancer Cells. Cells 2020, 9, 1161. [Google Scholar] [CrossRef]
  51. Rowe, L.A.; Degtyareva, N.; Doetsch, P.W. DNA Damage-Induced Reactive Oxygen Species (ROS) Stress Response in Saccharomyces Cerevisiae. Free Radic. Biol. Med. 2008, 45, 1167–1177. [Google Scholar] [CrossRef] [Green Version]
  52. Storr, H.L.; Kind, B.; Parfitt, D.A.; Chapple, J.P.; Lorenz, M.; Koehler, K.; Huebner, A.; Clark, A.J.L. Deficiency of Ferritin Heavy-Chain Nuclear Import in Triple A Syndrome Implies Nuclear Oxidative Damage as the Primary Disease Mechanism. Mol. Endocrinol. 2009, 23, 2086–2094. [Google Scholar] [CrossRef] [Green Version]
  53. Yu, T.-W.; Anderson, D. Reactive Oxygen Species-Induced DNA Damage and Its Modification: A Chemical Investigation. Mutat. Res. Mol. Mech. Mutagen. 1997, 379, 201–210. [Google Scholar] [CrossRef]
  54. Zheng, J. Energy Metabolism of Cancer: Glycolysis versus Oxidative Phosphorylation (Review). Oncol. Lett. 2012, 4, 1151–1157. [Google Scholar] [CrossRef] [Green Version]
  55. Wanet, A.; Arnould, T.; Najimi, M.; Renard, P. Connecting Mitochondria, Metabolism, and Stem Cell Fate. Stem Cells Dev. 2015, 24, 1957–1971. [Google Scholar] [CrossRef] [Green Version]
  56. Heiss, E.H.; Schachner, D.; Zimmermann, K.; Dirsch, V.M. Glucose Availability Is a Decisive Factor for Nrf2-Mediated Gene Expression. Redox Biol. 2013, 1, 359–365. [Google Scholar] [CrossRef] [Green Version]
  57. Mitsuishi, Y.; Taguchi, K.; Kawatani, Y.; Shibata, T.; Nukiwa, T.; Aburatani, H.; Yamamoto, M.; Motohashi, H. Nrf2 Redirects Glucose and Glutamine into Anabolic Pathways in Metabolic Reprogramming. Cancer Cell 2012, 22, 66–79. [Google Scholar] [CrossRef] [PubMed] [Green Version]
  58. Kim, J.; Tchernyshyov, I.; Semenza, G.L.; Dang, C.V. HIF-1-Mediated Expression of Pyruvate Dehydrogenase Kinase: A Metabolic Switch Required for Cellular Adaptation to Hypoxia. Cell Metab. 2006, 3, 177–185. [Google Scholar] [CrossRef] [PubMed] [Green Version]
  59. Iurlaro, R.; León-Annicchiarico, C.L.; Muñoz-Pinedo, C. Chapter Three-Regulation of Cancer Metabolism by Oncogenes and Tumor Suppressors. In Methods in Enzymology; Galluzzi, L., Kroemer, G., Eds.; Conceptual Background and Bioenergetic/Mitochondrial Aspects of Oncometabolism; Academic Press: Cambridge, MA, USA, 2014; Volume 542, pp. 59–80. [Google Scholar]
  60. Pecqueur, C.; Alves-Guerra, M.-C.; Gelly, C.; Lévi-Meyrueis, C.; Couplan, E.; Collins, S.; Ricquier, D.; Bouillaud, F.; Miroux, B. Uncoupling Protein 2, in Vivo Distribution, Induction upon Oxidative Stress, and Evidence for Translational Regulation. J. Biol. Chem. 2001, 276, 8705–8712. [Google Scholar] [CrossRef] [Green Version]
  61. Parrotta, E.I.; Scalise, S.; Taverna, D.; De Angelis, M.T.; Sarro, G.; Gaspari, M.; Santamaria, G.; Cuda, G. Comprehensive Proteogenomic Analysis of Human Embryonic and Induced Pluripotent Stem Cells. J. Cell. Mol. Med. 2019, 23, 5440–5453. [Google Scholar] [CrossRef] [PubMed] [Green Version]
  62. Avior, Y.; Sagi, I.; Benvenisty, N. Pluripotent Stem Cells in Disease Modelling and Drug Discovery. Nat. Rev. Mol. Cell Biol. 2016, 17, 170–182. [Google Scholar] [CrossRef] [PubMed]
  63. Fiedler, L.R.; Chapman, K.; Xie, M.; Maifoshie, E.; Jenkins, M.; Golforoush, P.A.; Bellahcene, M.; Noseda, M.; Faust, D.; Jarvis, A.; et al. MAP4K4 Inhibition Promotes Survival of Human Stem Cell-Derived Cardiomyocytes and Reduces Infarct Size In Vivo. Cell. Stem Cell 2019, 24, 579–591.e12. [Google Scholar] [CrossRef] [Green Version]
  64. Wainger, B.J.; Kiskinis, E.; Mellin, C.; Wiskow, O.; Han, S.S.W.; Sandoe, J.; Perez, N.P.; Williams, L.A.; Lee, S.; Boulting, G.; et al. Intrinsic Membrane Hyperexcitability of Amyotrophic Lateral Sclerosis Patient-Derived Motor Neurons. Cell Rep. 2014, 7, 1–11. [Google Scholar] [CrossRef] [Green Version]
  65. Zhu, Z.; Huangfu, D. Human Pluripotent Stem Cells: An Emerging Model in Developmental Biology. Development 2013, 140, 705–717. [Google Scholar] [CrossRef] [Green Version]
  66. Lucchino, V.; Scaramuzzino, L.; Scalise, S.; Grillone, K.; Lo Conte, M.; Esposito, C.; Aguglia, U.; Ferlazzo, E.; Perrotti, N.; Malatesta, P.; et al. Generation of Human Induced Pluripotent Stem Cell Lines (UNIMGi003-A and UNIMGi004-A) from Two Italian Siblings Affected by Unverricht-Lundborg Disease. Stem Cell Res. 2021, 53, 102329. [Google Scholar] [CrossRef]
  67. Orban, M.; Goedel, A.; Haas, J.; Sandrock-Lang, K.; Gärtner, F.; Jung, C.B.; Zieger, B.; Parrotta, E.; Kurnik, K.; Sinnecker, D.; et al. Functional Comparison of Induced Pluripotent Stem Cell- and Blood-Derived GPIIbIIIa Deficient Platelets. PLoS ONE 2015, 10, e0115978. [Google Scholar] [CrossRef] [PubMed] [Green Version]
  68. Parrotta, E.I.; Lucchino, V.; Scaramuzzino, L.; Scalise, S.; Cuda, G. Modeling Cardiac Disease Mechanisms Using Induced Pluripotent Stem Cell-Derived Cardiomyocytes: Progress, Promises and Challenges. Int. J. Mol. Sci. 2020, 21, 4354. [Google Scholar] [CrossRef] [PubMed]
  69. Parrotta, E.I.; Procopio, A.; Scalise, S.; Esposito, C.; Nicoletta, G.; Santamaria, G.; De Angelis, M.T.; Dorn, T.; Moretti, A.; Laugwitz, K.-L.; et al. Deciphering the Role of Wnt and Rho Signaling Pathway in IPSC-Derived ARVC Cardiomyocytes by In Silico Mathematical Modeling. Int. J. Mol. Sci. 2021, 22, 2004. [Google Scholar] [CrossRef] [PubMed]
  70. Scalise, S.; Scaramuzzino, L.; Lucchino, V.; Esposito, C.; Malatesta, P.; Grillone, K.; Perrotti, N.; Cuda, G.; Parrotta, E.I. Generation of IPSC Lines from Two Patients Affected by Febrile Seizure Due to Inherited Missense Mutation in SCN1A Gene. Stem Cell Res. 2020, 49, 102083. [Google Scholar] [CrossRef] [PubMed]
  71. Yamanaka, S. Pluripotent Stem Cell-Based Cell Therapy-Promise and Challenges. Cell. Stem Cell 2020, 27, 523–531. [Google Scholar] [CrossRef] [PubMed]
  72. Passaro, F.; Testa, G. Implications of Cellular Aging in Cardiac Reprogramming. Front. Cardiovasc. Med. 2018, 18, 43. [Google Scholar] [CrossRef] [PubMed] [Green Version]
  73. Parrotta, E.I.; Scalise, S.; Scaramuzzino, L.; Cuda, G. Stem Cells: The Game Changers of Human Cardiac Disease Modelling and Regenerative Medicine. Int. J. Mol. Sci. 2019, 20, 5760. [Google Scholar] [CrossRef] [Green Version]
  74. Harrison, P.M.; Banyard, S.H.; Hoare, R.J.; Russell, S.M.; Treffry, A. The Structure and Function of Ferritin. Ciba Found. Symp. 1976, 20, 19–40. [Google Scholar] [CrossRef]
  75. Xu, B.; Chasteen, N.D. Iron Oxidation Chemistry in Ferritin. Increasing Fe/O2 Stoichiometry during Core Formation. J. Biol. Chem. 1991, 266, 19965–19970. [Google Scholar] [CrossRef]
  76. Cheng, H.-T.; Yen, C.-J.; Chang, C.-C.; Huang, K.-T.; Chen, K.-H.; Zhang, R.-Y.; Lee, P.-Y.; Miaw, S.-C.; Huang, J.-W.; Chiang, C.-K.; et al. Ferritin Heavy Chain Mediates the Protective Effect of Heme Oxygenase-1 against Oxidative Stress. Biochim. Biophys. Acta BBA-Gen. Subj. 2015, 1850, 2506–2517. [Google Scholar] [CrossRef] [PubMed]
  77. Dennery, P.A. Effects of Oxidative Stress on Embryonic Development. Birth Defects Res. Part C Embryo Today Rev. 2007, 81, 155–162. [Google Scholar] [CrossRef] [PubMed]
  78. Han, Y.; Ishibashi, S.; Iglesias-Gonzalez, J.; Chen, Y.; Love, N.R.; Amaya, E. Ca2+-Induced Mitochondrial ROS Regulate the Early Embryonic Cell Cycle. Cell Rep. 2018, 22, 218–231. [Google Scholar] [CrossRef] [Green Version]
  79. Rodesch, F.; Simon, P.; Donner, C.; Jauniaux, E. Oxygen Measurements in Endometrial and Trophoblastic Tissues during Early Pregnancy. Obstet. Gynecol. 1992, 80, 283–285. [Google Scholar]
  80. Ezashi, T.; Das, P.; Roberts, R.M. Low O2 Tensions and the Prevention of Differentiation of HES Cells. Proc. Natl. Acad. Sci. USA 2005, 102, 4783–4788. [Google Scholar] [CrossRef] [Green Version]
  81. Dai, X.; Yan, X.; Wintergerst, K.A.; Cai, L.; Keller, B.B.; Tan, Y. Nrf2: Redox and Metabolic Regulator of Stem Cell State and Function. Trends Mol. Med. 2020, 26, 185–200. [Google Scholar] [CrossRef] [Green Version]
  82. Pietsch, E.C.; Chan, J.Y.; Torti, F.M.; Torti, S.V. Nrf2 Mediates the Induction of Ferritin H in Response to Xenobiotics and Cancer Chemopreventive Dithiolethiones*. J. Biol. Chem. 2003, 278, 2361–2369. [Google Scholar] [CrossRef] [Green Version]
  83. Aung, W.; Hasegawa, S.; Furukawa, T.; Saga, T. Potential Role of Ferritin Heavy Chain in Oxidative Stress and Apoptosis in Human Mesothelial and Mesothelioma Cells: Implications for Asbestos-Induced Oncogenesis. Carcinogenesis 2007, 28, 2047–2052. [Google Scholar] [CrossRef] [PubMed]
  84. Burdon, T.; Smith, A.; Savatier, P. Signalling, Cell Cycle and Pluripotency in Embryonic Stem Cells. Trends Cell Biol. 2002, 12, 432–438. [Google Scholar] [CrossRef] [Green Version]
  85. Armstrong, L.; Hughes, O.; Yung, S.; Hyslop, L.; Stewart, R.; Wappler, I.; Peters, H.; Walter, T.; Stojkovic, P.; Evans, J.; et al. The Role of PI3K/AKT, MAPK/ERK and NFκβ Signalling in the Maintenance of Human Embryonic Stem Cell Pluripotency and Viability Highlighted by Transcriptional Profiling and Functional Analysis. Hum. Mol. Genet. 2006, 15, 1894–1913. [Google Scholar] [CrossRef] [PubMed] [Green Version]
  86. Stincone, A.; Prigione, A.; Cramer, T.; Wamelink, M.M.C.; Campbell, K.; Cheung, E.; Olin-Sandoval, V.; Grüning, N.-M.; Krüger, A.; Alam, M.T.; et al. The Return of Metabolism: Biochemistry and Physiology of the Pentose Phosphate Pathway. Biol. Rev. 2015, 90, 927–963. [Google Scholar] [CrossRef] [PubMed] [Green Version]
  87. Grant, C.M. Metabolic Reconfiguration Is a Regulated Response to Oxidative Stress. J. Biol. 2008, 7, 1. [Google Scholar] [CrossRef] [Green Version]
  88. Ralser, M.; Lehrach, H. Building a New Bridge between Metabolism, Free Radicals and Longevity. Aging 2009, 1, 836–838. [Google Scholar]
Figure 1. FTH1 silencing influences hESCs pluripotency. (A) Alkaline phosphatase (AP) staining of colonies in SCR control and in hESCs transfected with lentiviral shFTH1 shows that FTH1-silenced ES colonies contain less AP+ cells; scale bar, 250 µm; (B) Undifferentiated SCR and FTH1-KD hESCs were stained for Oct4 (green), Nanog (red), TRA-1-60 (green), and Sox2 (red) expression, while nuclei were counterstained with 4′.6-diamidino-2-phenylindole (DAPI). Scale bars, 50 μm. No significant differences were detected between the two groups with the exception of Nanog, which shows a slight positivity in FTH1-silenced cells; (C) The levels of Nanog protein were assessed by immunoblotting (IB). Band intensity analysis shows a higher level in FTH1-KD cells compared to SCR control. Actin levels were evaluated to confirm equal loading control; (D) mRNA levels of pluripotency-associated genes NANOG, OCT4, and SOX2 were measured in undifferentiated SCR and FTH1-KD hESCs via qRT-PCR; (E) left panel: mRNA levels of endodermal (AFP), mesodermal (Nkx2.5), and ectodermal (PAX6) genes were measured in undifferentiated SCR and FTH1-silenced hESCs via qRT-PCR analysis; AFP and Nkx2.5 expression levels were higher in shFTH1 cells, while the expression levels of PAX6 were significantly diminished in silenced cells; (E) right panel: mRNA levels of endodermal (GATA4, FOXA2), mesodermal (HAND1, CD31), and ectodermal (NESTIN, PAX6) genes were measured in SCR and FTH1-KD embryoid bodies (EBs) on day 28 of differentiation by qRT-PCR; (F) Sox17, Brachyury, and Nestin, endodermal, mesodermal, and ectodermal markers, respectively, were stained via immunofluorescence in SCR and shFTH EBs on day 28 of differentiation; scale bar, 50 μm. Results of all qRT-PCR shown were normalized to value in SCR cells and are represented as mean ± SEM (n = 3); significance is calculated by t-test: * p ≤ 0.05; ** p ≤ 0.01, *** p ≤ 0.001.
Cells 10 02431 g001
Figure 2. Analysis of ROS levels and mitochondrial functionality in FTH1-KD hESCs. (A) DCF staining showed that total cellular ROS levels are reduced in FTH1-silenced hESCs (light blue curve and bar plot) with respect to control cells; (B) Mitochondrial superoxide was significantly lower in FTH1-silenced hESCs (red curve and bar plot); (C) FTH1-KD cells presented a decrease in mitochondrial membrane depolarization (green curve and bar plot) compared to SCR cells. All data are represented as mean ± SEM (n = 3); ** p ≤ 0.01, t-test. Small dots refer to SCR replicates, while squares refer to shFTH1 triplicates.
Cells 10 02431 g002
Figure 3. The Nrf2 pathway is activated in FTH1-KD hESCs. (A) NRF2 expression was measured in undifferentiated SCR and FTH1-KD hESCs via qRT-PCR, showing a significant up-regulation in presence of FTH1 silencing; (B) Nrf2 protein level was assessed by immunoblotting (IB), indicating an increased expression of FTH1-KD hESCs; (C) Immunofluorescence of Nrf2 (green) and nuclei (blue) in SCR control hESCs and FTH1 silenced cells (scale bar, 25 µm); (D) Immunoblot analysis for p62/Sqstm1 protein in SCR and FTH1-KD cells showing an upregulation of its expression in silenced cells; (E) qRT-PCR analysis of glutathione peroxidases 2 and 3 (GPX2, GPX3) antioxidant genes in SCR control and FTH1-KD hESCs; (F) Western blot analysis for Gpx4 protein, confirming increased expression of FTH1-KD hESCs; (G) qRT-PCR analysis of SOD1 and SOD2 expression in SCR and shFTH1 hESCs showing an upregulation of these genes in modulated hESCs; (H) mRNA levels of Nrf2 target genes (HMOX1, NQO-1, HIF1α, HIF2α) were measured in SCR and FTH1-KD hESCs via qRT-PCR; (I, J) Immunoblot analysis of HIF1α (I) and ferritin light chain (Ftl) (J) showed upregulation of both proteins in FTH1-silenced cells with respect to SCR cells. In all Western blots presented in this figure, actin levels were evaluated to confirm equal loading control. qRT-PCR data were normalized to values in SCR cells and are represented as mean ± SEM (n = 3); significance is calculated by t-test: * p ≤ 0.05; ** p ≤ 0.01, *** p ≤ 0.001. Small dots refer to SCR replicates, while triangles refer to shFTH1 triplicates.
Cells 10 02431 g003
Figure 4. FTH1 silencing leads to expression of apoptosis and DNA damage markers in hESCs. (A,B) qRT-PCR for apoptosis-associated genes BIM and BAX (A) and CASP3 and CASP9 (B) showing increased expression levels of apoptotic marker in FTH1-KD hESCs compared to SCR control; (C) Activation of apoptotic signaling in FTH1-KD hESCs is demonstrated also by immunoblot analysis for full length and cleaved form of caspase-3; (D) Western blot analysis of Akt1 and phosphorylated Akt1 (Ser473, pAkt) protein expression; (E) Immunoblot for total Erk1/2 and phosphorylated Erk1/2 (Thr202/Tyr204, pErk1/2) in SCR control and FTH1-KD hESCs; (F) qRT-PCR analysis for DNA damage related genes (BRCA1, DMC1, PCNA, POLQ) in control and silenced hESCs; (G) Western blot analysis for Parp1 protein expression in SCR and FTH1-silenced cells. For all Western blots shown, actin levels were evaluated as loading control. Results of qRT-PCR were normalized to measurements in SCR cells (n = 3); * p ≤ 0.05; ** p ≤ 0.01, t-test, *** p ≤ 0.001. Small dots refer to SCR replicates, while triangles refer to shFTH1 triplicates.
Cells 10 02431 g004
Figure 5. Metabolic rearrangement in FTH1-KD hESCs. (A) Quantification of total cellular ATP production (from glycolysis and mitochondrial oxidative phosphorylation) rate using a Seahorse XF analyzer. ATP production was calculated by measuring the oxygen consumption and acidification rate. Each sample (SCR and shFTH1-hESCs) was measured in at least three biological replicates. Seahorse analysis shows a lower ATP production (from both sources) in FTH1-KD cells compared to SCR control; (B) Glycolytic rate measurements in SCR and FTH1-silenced cells calculated by subtracting extracellular acidification rate (ECAR). As shown, FTH1-KD hESCs do not undergo metabolic switch. Since mitochondrial acidification is blocked, the approach measures glycolytic-ECAR only correlating to extracellular lactate accumulation. Glycolytic rate was reduced in FTH1-silenced hESCs; (C) qRT-PCR analysis for glycolytic enzymes (ALDOA2, PGK1, ENO1, and PKM) mRNA expression; (D) Expression of G6PC and FBP1 gluconeogenesis genes in SCR and shFTH1-hESCs measured by qRT-PCR analysis; (E) Pentose phosphate pathway (PPP) genes G6PD and PGD were significantly up-regulated shFTH1 cells with respect to SCR control cells; (F,G) The PDK1 gene, responsible for inactivation of pyruvate dehydrogenase (F) and the gene UCP2 (G), which uncouples OXPHOS from ATP synthesis, both resulted in significantly up-regulated in FTH1-KD cells compared to SCR cells. For all qRT-PCR graphs, results were normalized to measurements in SCR cells (n = 3); * p ≤ 0.05; ** p ≤ 0.01, *** p ≤ 0.001, t-test compared to SCR. Small dots refer to SCR replicates, while triangles refer to shFTH1 triplicates.
Cells 10 02431 g005
Figure 6. Schematic diagram illustrating oxidative stress response mediated by FTH1 downregulation in hESCs. FTH1 (1) is the master scavenger molecule for intracellular iron homeostasis and its inactivation leads to imbalanced redox homeostasis due to intracellular iron accumulation (2) and ROS production (3). Surprisingly, in hESCs, a reduced expression of FTH1 expression is not associated with oxidative stress and ROS production. This phenomenon can be explained by three crucial findings: first, FTH1-silenced hESCs showed an enhanced transcriptional activity of Nrf2 (4–5) on key antioxidant target genes such as HIF-1, HMOX-1, NQO-1, GPX2/3/4, SOD1/2, FTL (6); second, we observed the activation of an alternative metabolic program from glycolysis (7–8) to pentose phosphate pathway (PPP) where the activity of the G6PD enzyme ensures the conversion of NADP+ to NADPH (9) involved in ROS neutralization; third, the mitochondrial metabolism was found to be inactive (10) in FTH1-silenced hESCs, as demonstrated by the upregulation of PDK1 and UCP2 genes (11), specifically involved in preventing pyruvate from entering the tricarboxylic acid cycle (TCA) (12).
Cells 10 02431 g006
Publisher’s Note: MDPI stays neutral with regard to jurisdictional claims in published maps and institutional affiliations.

