
A Method for Bridging Population-Specific Genotypes to Detect Gene Modules Associated with Alzheimer’s Disease


Abstract
:1. Introduction
2. Materials and Methods
2.1. Data
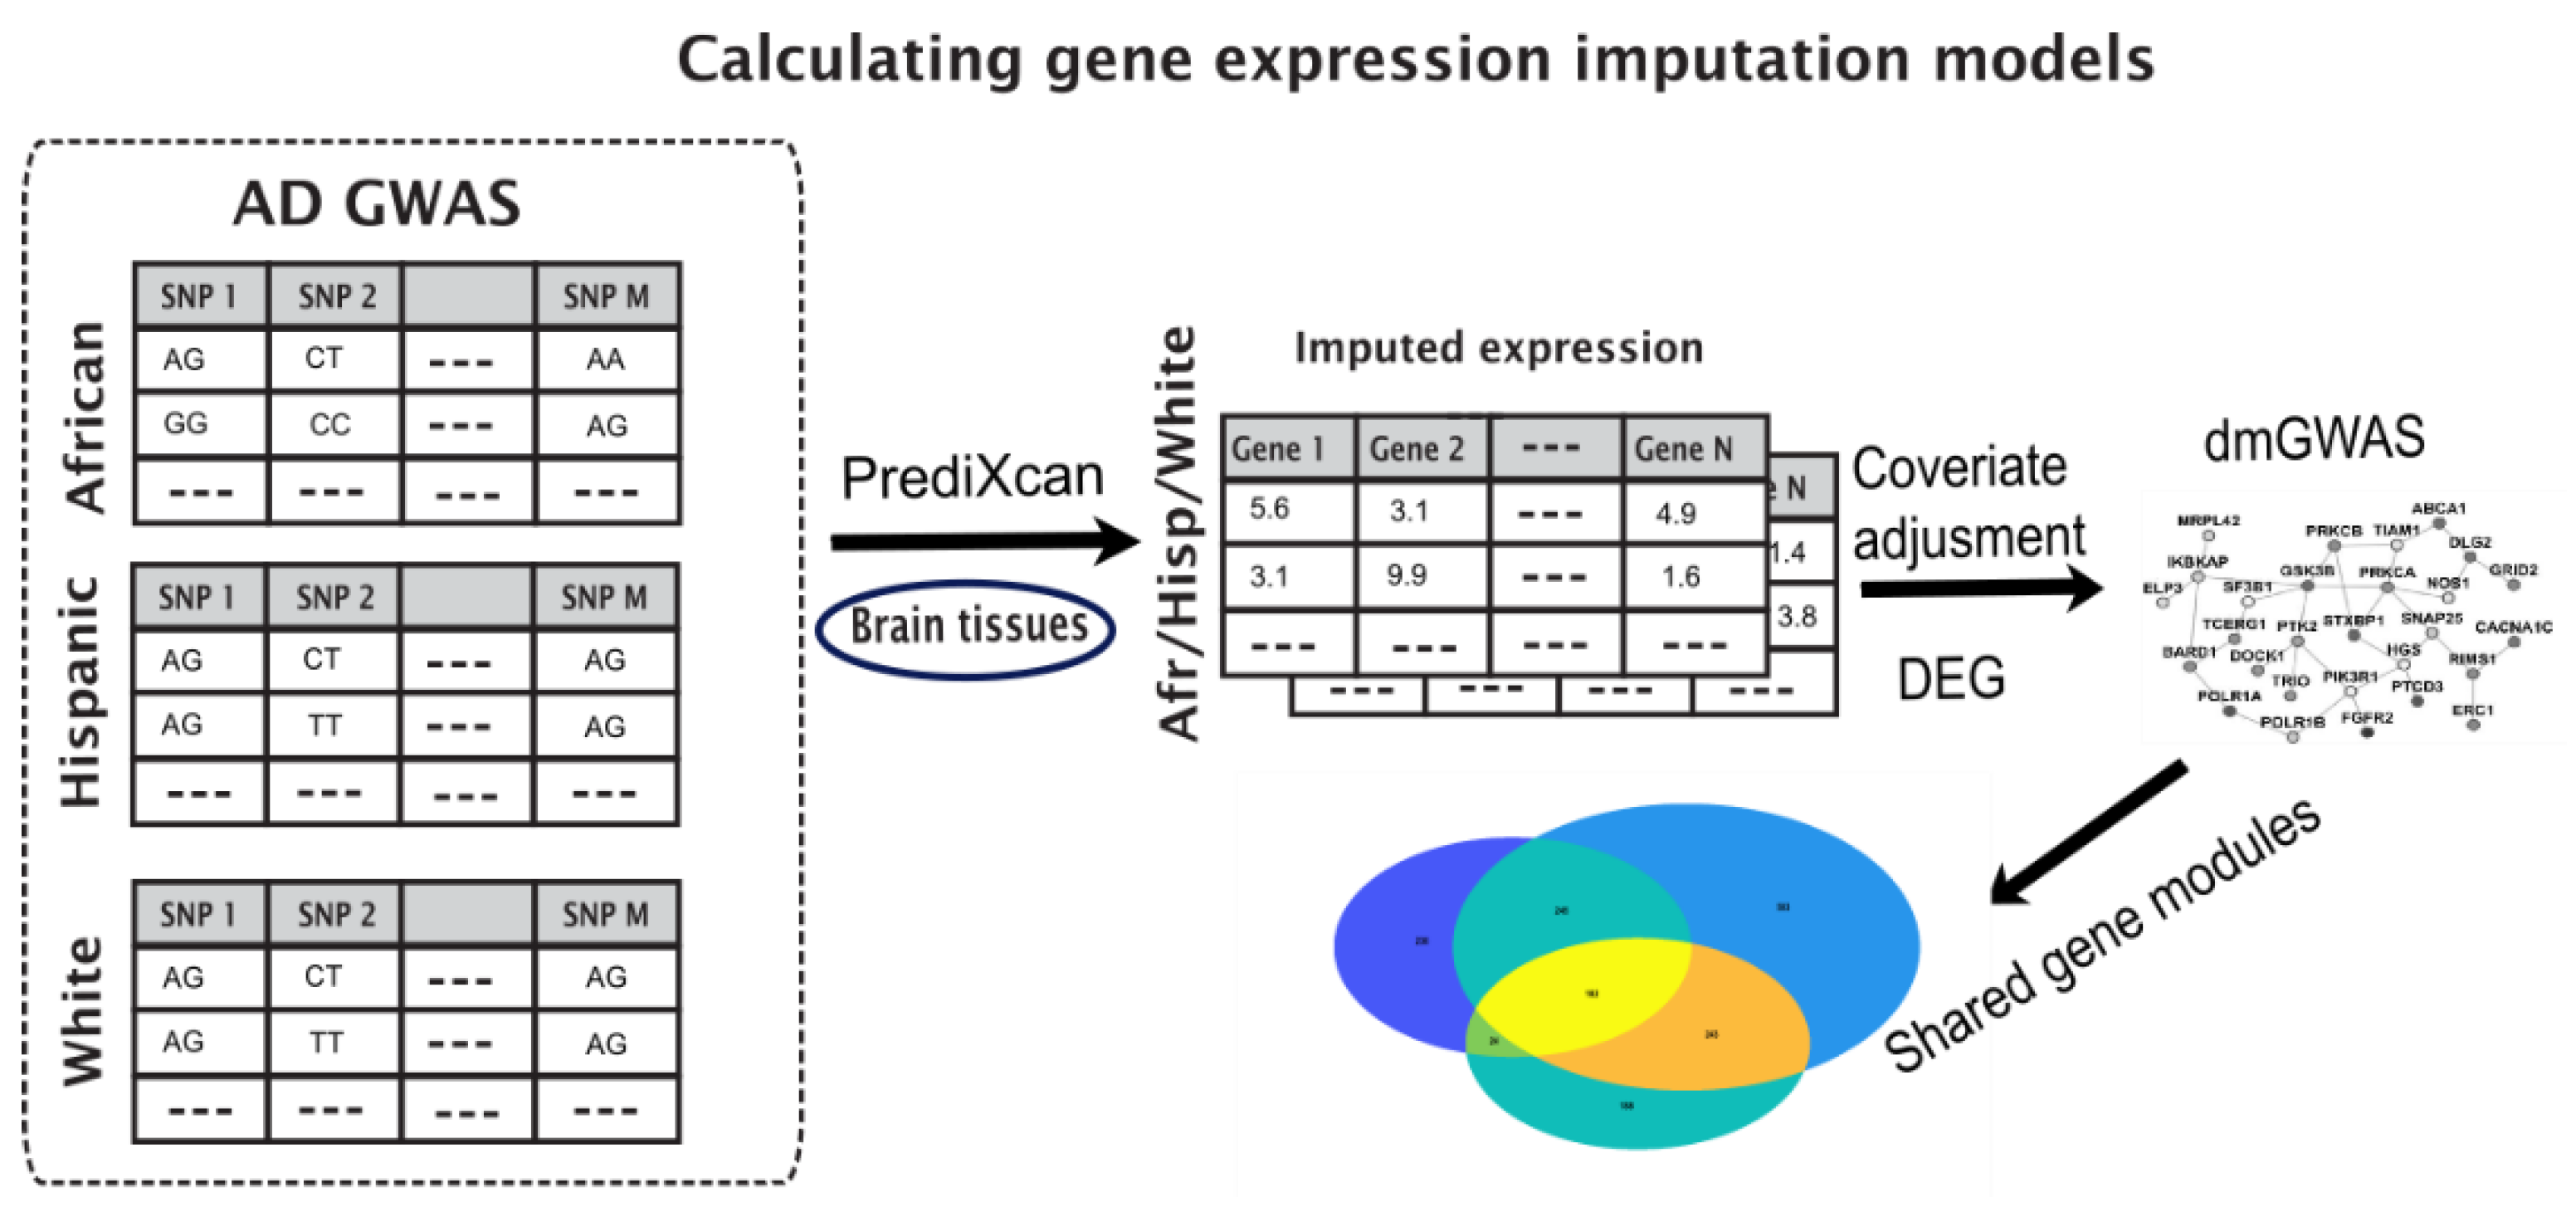
2.2. Enriched Gene Pipeline
2.3. Imputed Gene Expression Data
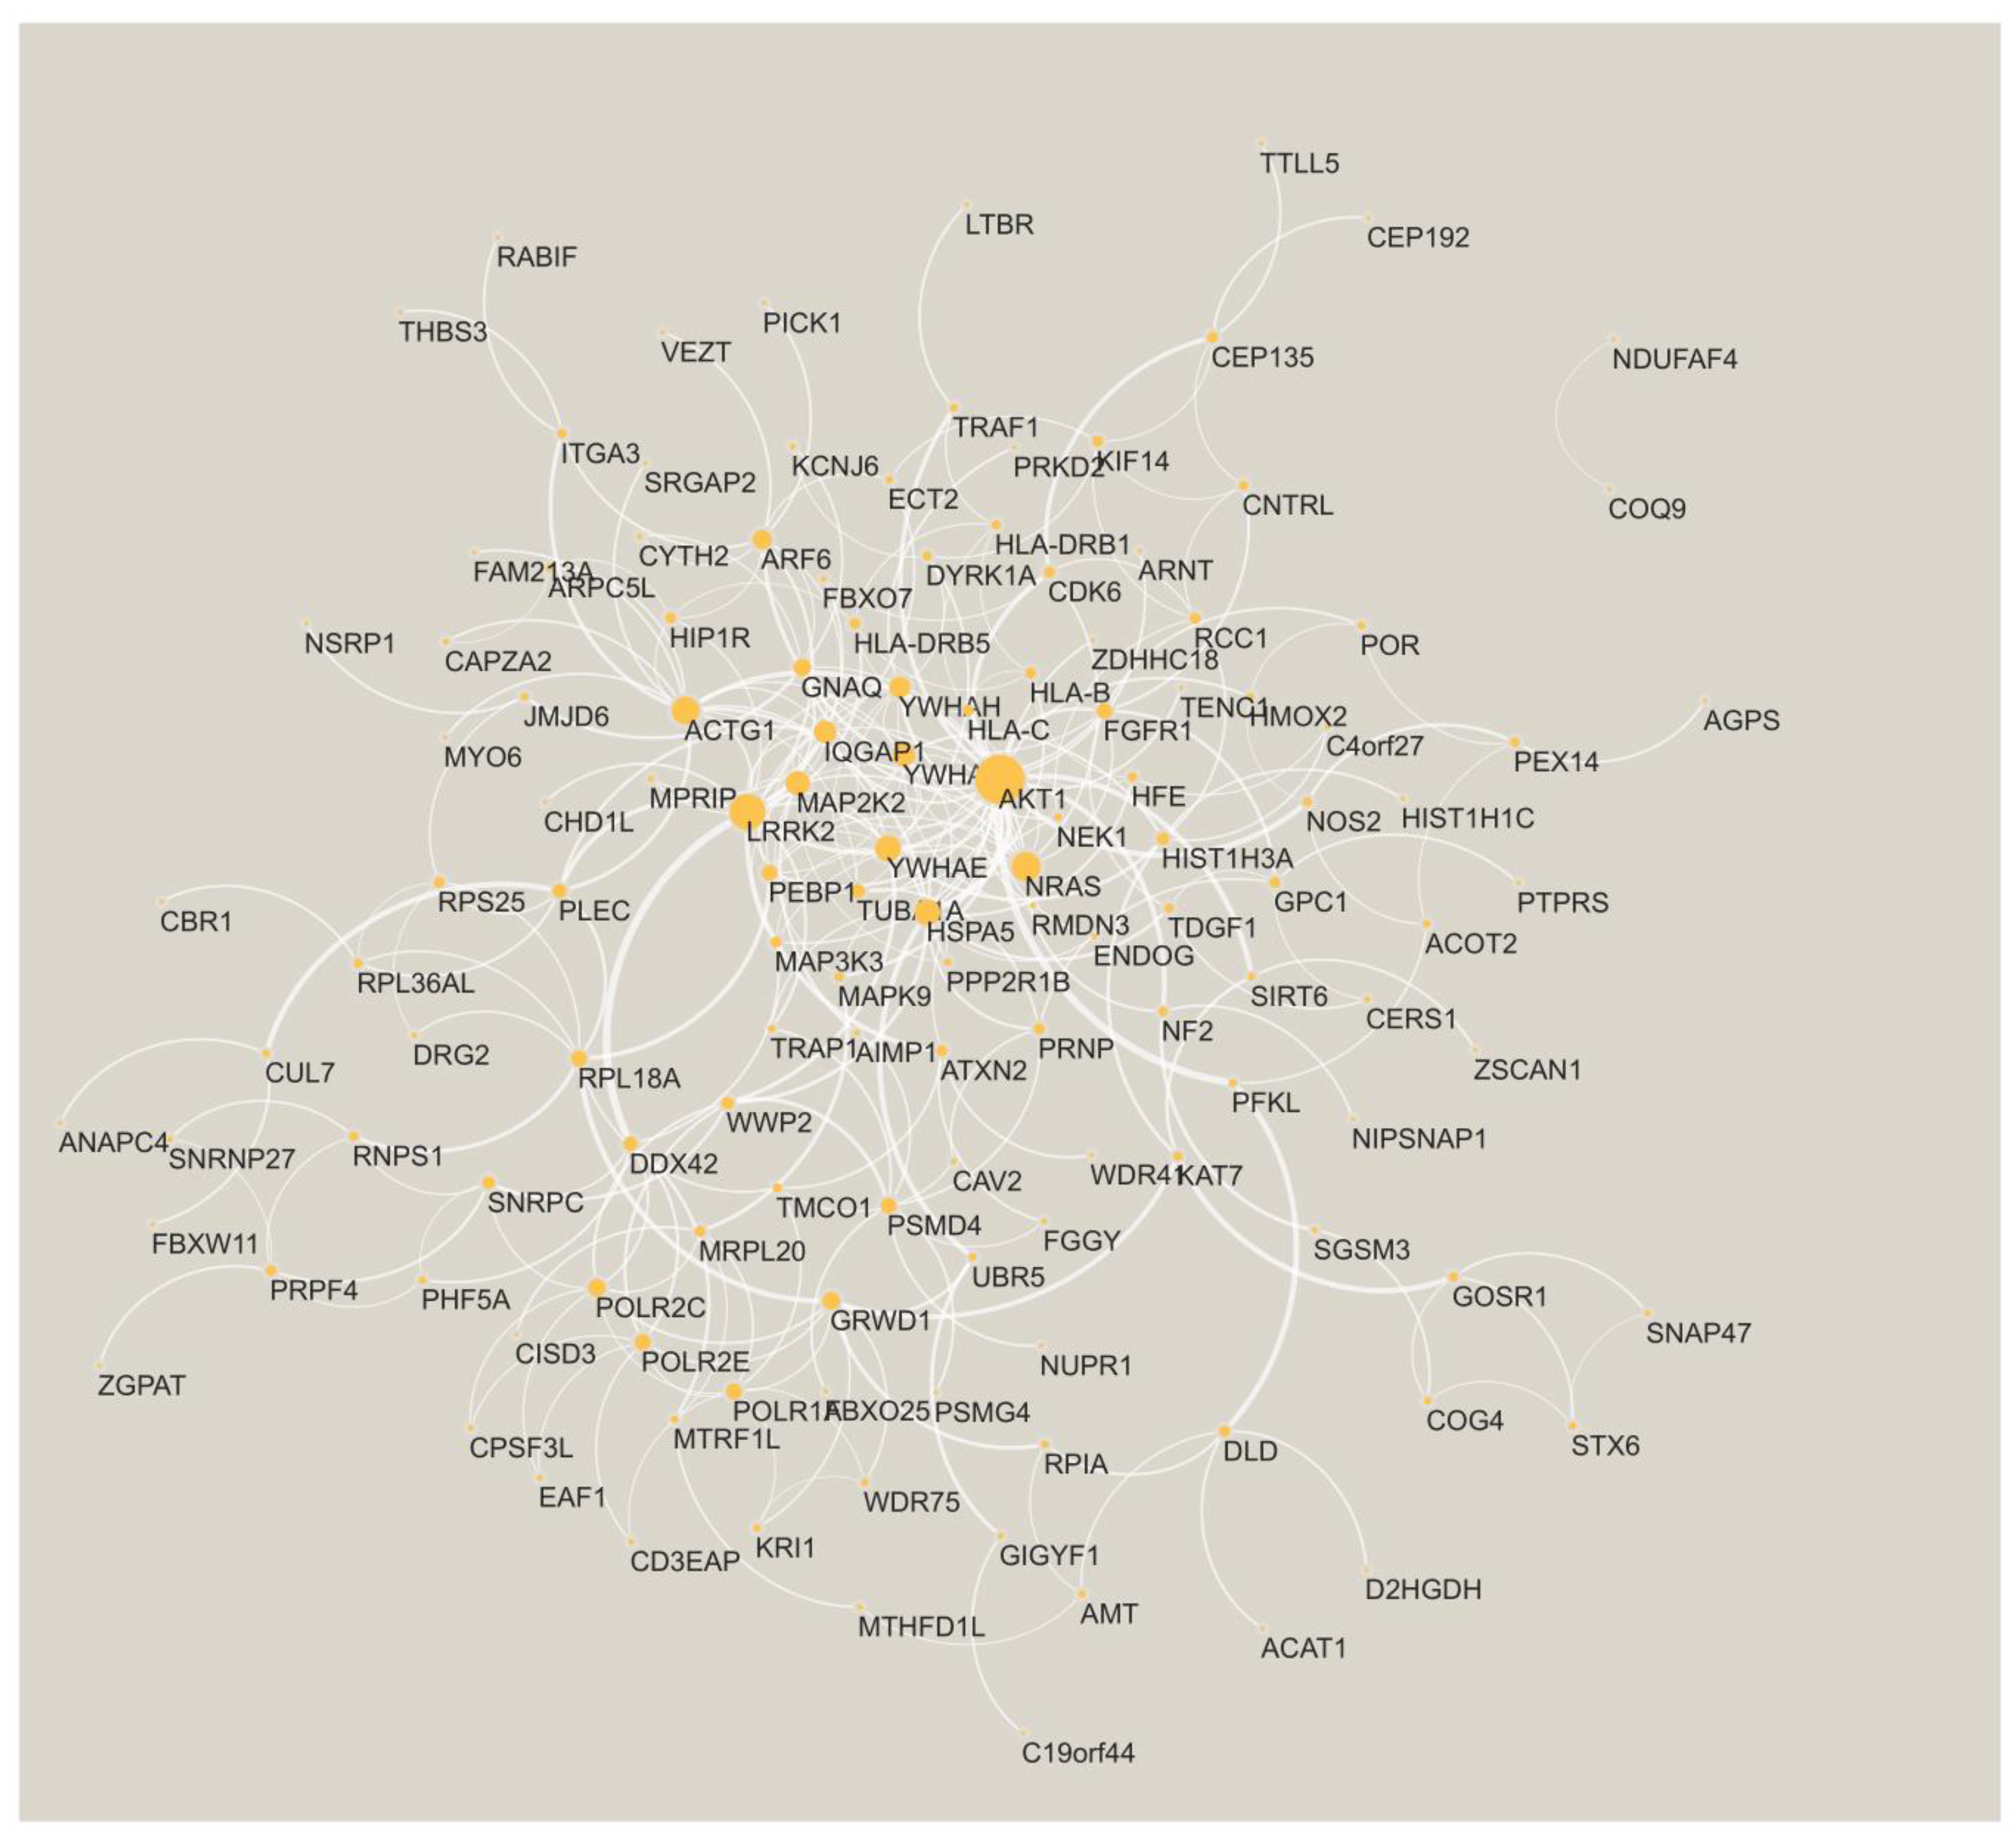
2.4. Identify Differentially Expressed Modules through Dense Gene Module Computations
2.5. Gene Set Variation Analysis of the Imputed Expression
3. Results
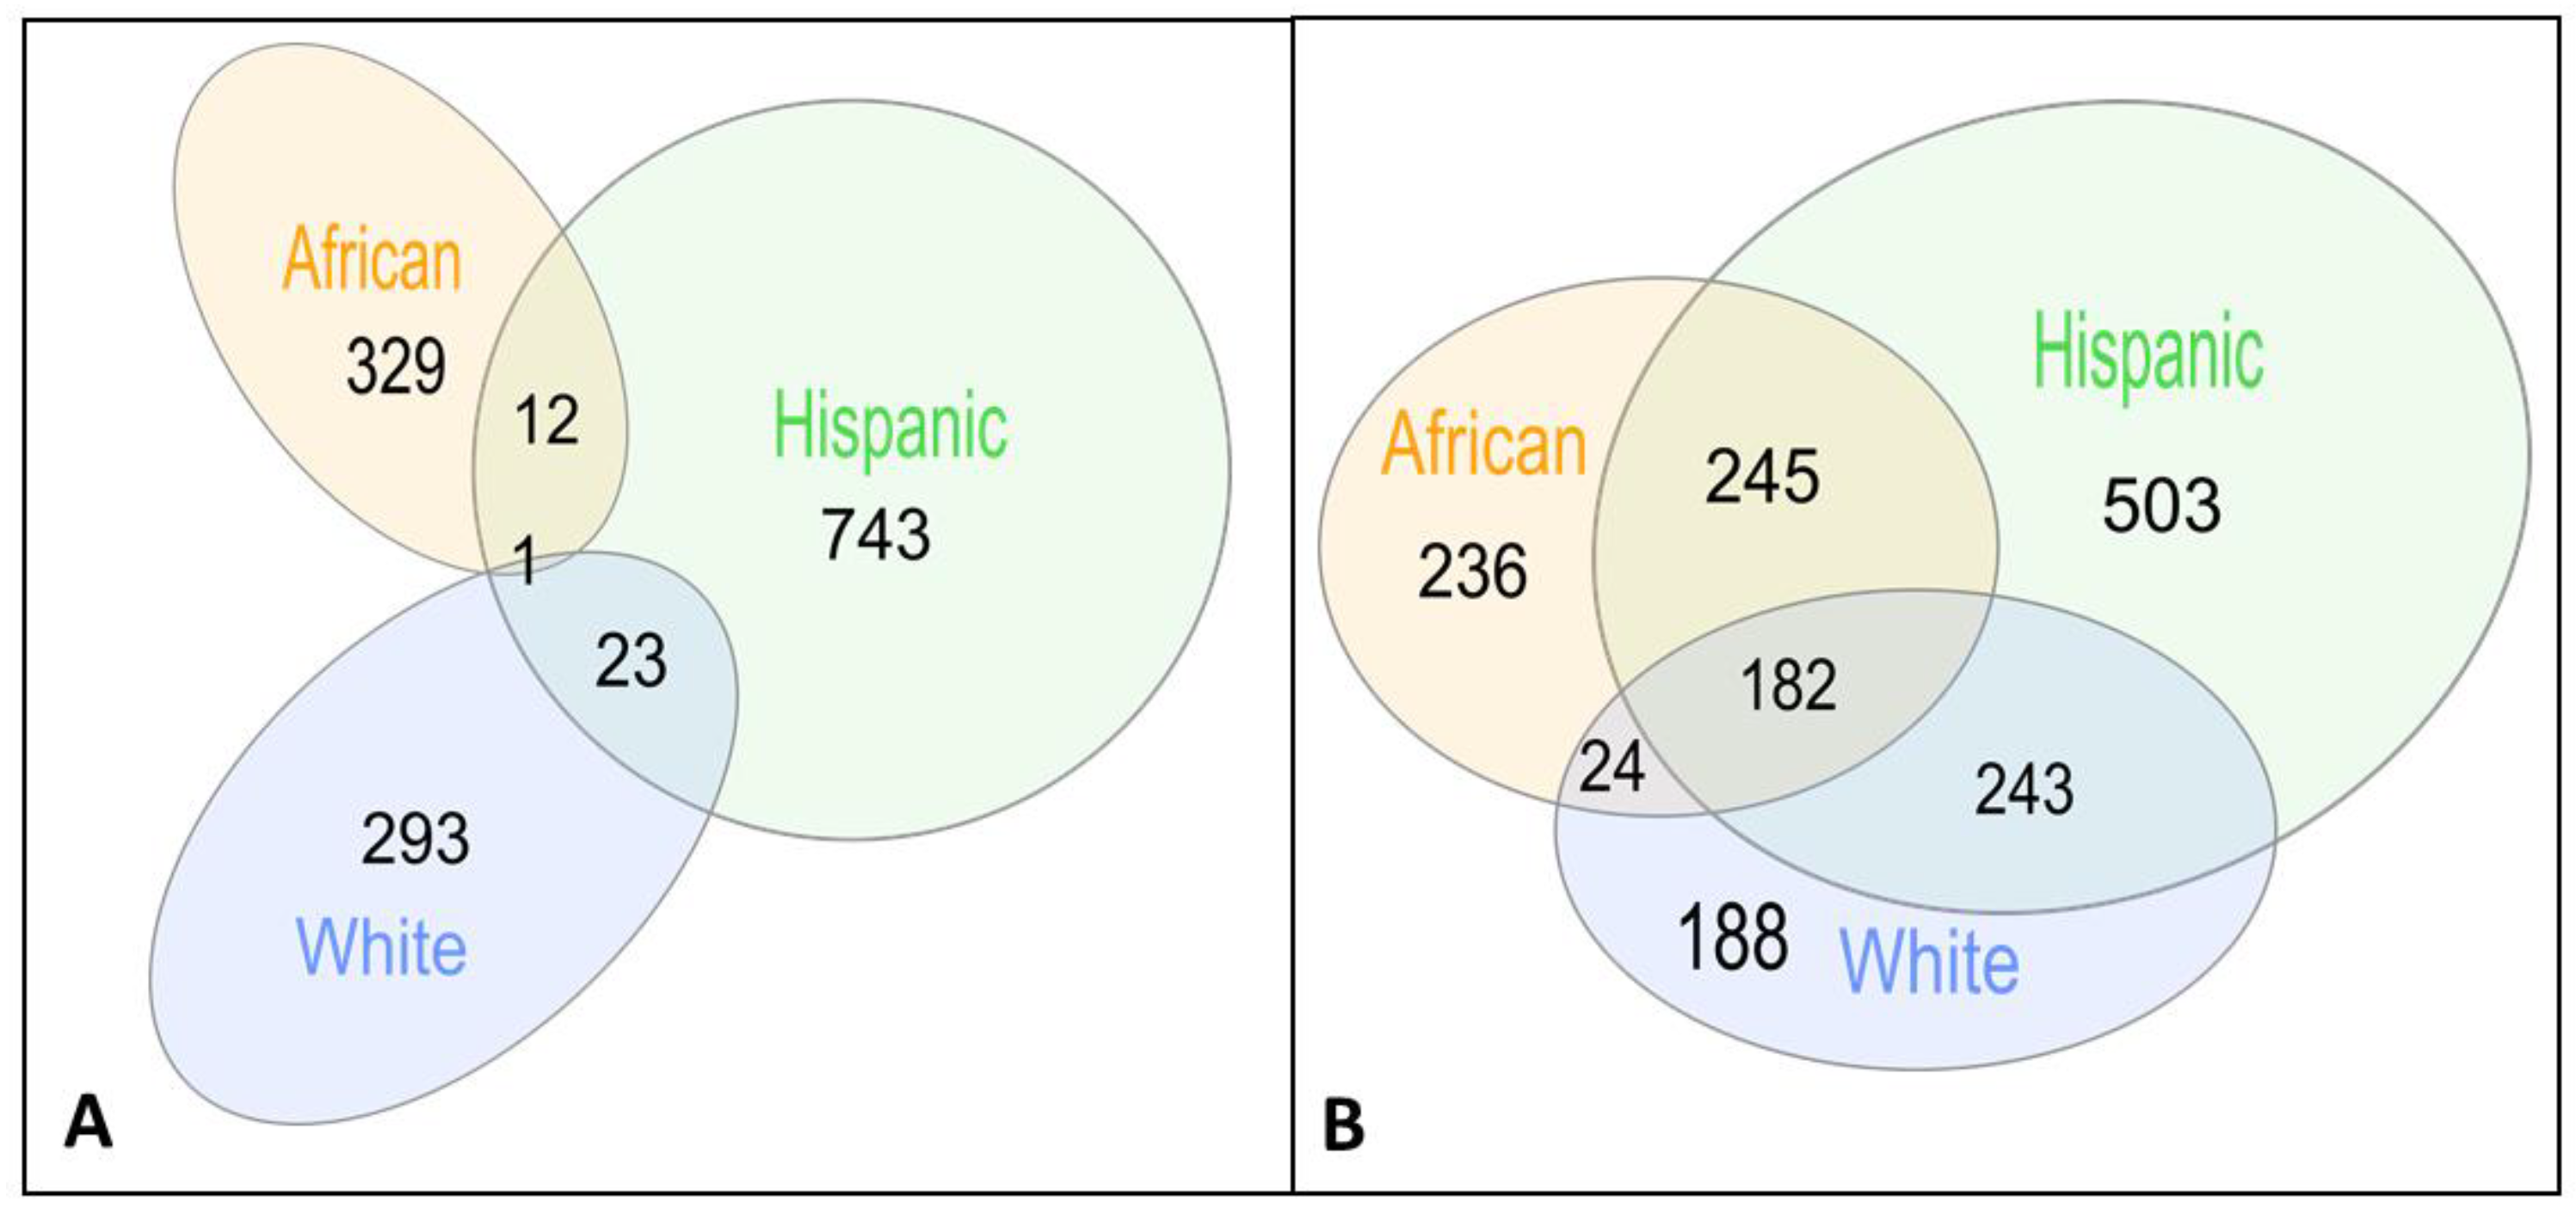
3.1. Key Gene Modules Are Shared across Populations
3.2. Shared Genes Overlap with Previously Detected AD-Associated Genes
3.3. Shared Genes Are Enriched with Biological Processes Associated with AD
3.4. Comparison to GSVA
4. Discussion
5. Conclusions
Supplementary Materials
Author Contributions
Funding
Institutional Review Board Statement
Informed Consent Statement
Data Availability Statement
Conflicts of Interest
References
- Gamazon, E.R.; Wheeler, H.E.; Shah, K.P.; Mozaffari, S.V.; Aquino-Michaels, K.; Carroll, R.J.; Eyler, A.E.; Denny, J.C.; Nicolae, D.L.; Cox, N.J. A gene-based association method for mapping traits using reference transcriptome data. Nat. Genet. 2015, 47, 1091–1098. [Google Scholar] [CrossRef] [PubMed] [Green Version]
- Wainberg, M.; Sinnott-Armstrong, N.; Mancuso, N.; Barbeira, A.N.; Knowles, D.A.; Golan, D.; Ermel, R.; Ruusalepp, A.; Quertermous, T.; Hao, K. Opportunities and challenges for transcriptome-wide association studies. Nat. Genet. 2019, 51, 592–599. [Google Scholar] [CrossRef] [PubMed]
- Barfield, R.; Feng, H.; Gusev, A.; Wu, L.; Zheng, W.; Pasaniuc, B.; Kraft, P. Transcriptome-wide association studies accounting for colocalization using Egger regression. Genet. Epidemiol. 2018, 42, 418–433. [Google Scholar] [CrossRef] [PubMed]
- Hauberg, M.E.; Zhang, W.; Giambartolomei, C.; Franzén, O.; Morris, D.L.; Vyse, T.J.; Ruusalepp, A.; Fromer, M.; Sieberts, S.K.; Johnson, J.S. Large-scale identification of common trait and disease variants affecting gene expression. Am. J. Hum. Genet. 2017, 100, 885–894. [Google Scholar] [CrossRef]
- Bhattacharya, A.; García-Closas, M.; Olshan, A.F.; Perou, C.M.; Troester, M.A.; Love, M.I. A framework for transcriptome-wide association studies in breast cancer in diverse study populations. Genome Biol. 2020, 21, 1–18. [Google Scholar] [CrossRef] [Green Version]
- Geoffroy, E.; Gregga, I.; Wheeler, H.E. Population-Matched Transcriptome Prediction Increases TWAS Discovery and Replication Rate. IScience 2020, 23, 101850. [Google Scholar] [CrossRef]
- Peterson, R.E.; Kuchenbaecker, K.; Walters, R.K.; Chen, C.-Y.; Popejoy, A.B.; Periyasamy, S.; Lam, M.; Iyegbe, C.; Strawbridge, R.J.; Brick, L. Genome-wide association studies in ancestrally diverse populations: Opportunities, methods, pitfalls, and recommendations. Cell 2019, 179, 589–603. [Google Scholar] [CrossRef]
- Marigorta, U.M.; Navarro, A. High trans-ethnic replicability of GWAS results implies common causal variants. PLoS Genet. 2013, 9, e1003566. [Google Scholar] [CrossRef] [Green Version]
- Mikhaylova, A.V.; Thornton, T.A. Accuracy of gene expression prediction from genotype data with PrediXcan varies across and within continental populations. Front. Genet. 2019, 10, 261. [Google Scholar] [CrossRef] [Green Version]
- Hänzelmann, S.; Castelo, R.; Guinney, J. GSVA: Gene set variation analysis for microarray and RNA-seq data. BMC Bioinform. 2013, 14, 7. [Google Scholar] [CrossRef] [Green Version]
- Kunkle, B.W.; Schmidt, M.; Klein, H.-U.; Naj, A.C.; Hamilton-Nelson, K.L.; Larson, E.B.; Evans, D.A.; De Jager, P.L.; Crane, P.K.; Buxbaum, J.D. Novel Alzheimer disease risk loci and pathways in African American individuals using the African genome resources panel: A meta-analysis. JAMA Neurol. 2021, 78, 102–113. [Google Scholar] [CrossRef] [PubMed]
- Das, S.; Forer, L.; Schönherr, S.; Sidore, C.; Locke, A.E.; Kwong, A.; Vrieze, S.I.; Chew, E.Y.; Levy, S.; McGue, M. Next-generation genotype imputation service and methods. Nat. Genet. 2016, 48, 1284–1287. [Google Scholar] [CrossRef] [Green Version]
- McCarthy, S.; Das, S.; Kretzschmar, W.; Delaneau, O.; Wood, A.R.; Teumer, A.; Kang, H.M.; Fuchsberger, C.; Danecek, P.; Sharp, K. A reference panel of 64,976 haplotypes for genotype imputation. Nat. Genet. 2016, 48, 1279. [Google Scholar]
- Poulin, S.P.; Dautoff, R.; Morris, J.C.; Barrett, L.F.; Dickerson, B.C.; Initiative, A.s.D.N. Amygdala atrophy is prominent in early Alzheimer’s disease and relates to symptom severity. Psychiatry Res. Neuroimaging 2011, 194, 7–13. [Google Scholar] [CrossRef] [PubMed] [Green Version]
- Jung, F.; Kazemifar, S.; Bartha, R.; Rajakumar, N. Semiautomated Assessment of the Anterior Cingulate Cortex in Alzheimer’s Disease. J. Neuroimaging 2019, 29, 376–382. [Google Scholar] [CrossRef] [PubMed] [Green Version]
- Cho, H.; Kim, J.-H.; Kim, C.; Ye, B.S.; Kim, H.J.; Yoon, C.W.; Noh, Y.; Kim, G.H.; Kim, Y.J.; Kim, J.-H. Shape changes of the basal ganglia and thalamus in Alzheimer’s disease: A three-year longitudinal study. J. Alzheimer’s Dis. 2014, 40, 285–295. [Google Scholar] [CrossRef] [PubMed]
- Toniolo, S.; Serra, L.; Olivito, G.; Marra, C.; Bozzali, M.; Cercignani, M. Patterns of cerebellar gray matter atrophy across Alzheimer’s disease progression. Front. Cell. Neurosci. 2018, 12, 430. [Google Scholar] [CrossRef]
- Guo, C.C.; Tan, R.; Hodges, J.R.; Hu, X.; Sami, S.; Hornberger, M. Network-selective vulnerability of the human cerebellum to Alzheimer’s disease and frontotemporal dementia. Brain 2016, 139, 1527–1538. [Google Scholar] [CrossRef]
- Setti, S.E.; Hunsberger, H.C.; Reed, M.N. Alterations in hippocampal activity and Alzheimer’s disease. Transl. Issues Psychol. Sci. 2017, 3, 348. [Google Scholar] [CrossRef]
- Giannakopoulos, P.; Hof, P.R.; Michel, J.-P.; Guimon, J.; Bouras, C. Cerebral cortex pathology in aging and Alzheimer’s disease: A quantitative survey of large hospital-based geriatric and psychiatric cohorts. Brain Res. Rev. 1997, 25, 217–245. [Google Scholar] [CrossRef]
- Zhang, Y.; Liu, Z.; Ji, B.; Liu, L.; Wu, S.; Liu, X.; Wang, S.; Wang, L. Metabolite Profile of Alzheimer’s Disease in the Frontal Cortex as Analyzed by HRMAS 1H NMR. Front. Aging Neurosci. 2019, 10, 424. [Google Scholar] [CrossRef] [PubMed]
- Van Hoesen, G.W.; Hyman, B.T.; Damasio, A.R. Entorhinal cortex pathology in Alzheimer’s disease. Hippocampus 1991, 1, 1–8. [Google Scholar] [CrossRef] [PubMed]
- Baloyannis, S.J.; Mavroudis, I.; Mitilineos, D.; Baloyannis, I.S.; Costa, V.G. The Hypothalamus in Alzheimer’s Disease. In Hypothalamus in Health and Diseases; IntechOpen: London, UK, 2018. [Google Scholar]
- Vercruysse, P.; Vieau, D.; Blum, D.; Petersén, Å.; Dupuis, L. Hypothalamic alterations in neurodegenerative diseases and their relation to abnormal energy metabolism. Front. Mol. Neurosci. 2018, 11, 2. [Google Scholar] [CrossRef] [Green Version]
- Lorenzi, R.M.; Palesi, F.; Castellazzi, G.; Vitali, P.; Anzalone, N.; Bernini, S.; Cotta Ramusino, M.; Sinforiani, E.; Micieli, G.; Costa, A. Unsuspected involvement of spinal cord in Alzheimer Disease. Front. Cell. Neurosci. 2020, 14, 6. [Google Scholar] [CrossRef] [PubMed] [Green Version]
- Nie, X.; Sun, Y.; Wan, S.; Zhao, H.; Liu, R.; Li, X.; Wu, S.; Nedelska, Z.; Hort, J.; Qing, Z. Subregional structural alterations in hippocampus and nucleus accumbens correlate with the clinical impairment in patients with Alzheimer’s disease clinical spectrum: Parallel combining volume and vertex-based approach. Front. Neurol. 2017, 8, 399. [Google Scholar] [CrossRef]
- Burns, J.; Galvin, J.; Roe, C.; Morris, J.; McKeel, D. The pathology of the substantia nigra in Alzheimer disease with extrapyramidal signs. Neurology 2005, 64, 1397–1403. [Google Scholar] [CrossRef]
- Chen, H.-H.; Petty, L.E.; Sha, J.; Zhao, Y.; Kuzma, A.; Valladares, O.; Bush, W.; Naj, A.C.; Gamazon, E.R.; Below, J.E. Genetically regulated expression in late-onset Alzheimer’s disease implicates risk genes within known and novel loci. Transl. Psychiatry 2021, 11, 618. [Google Scholar] [CrossRef]
- Ritchie, M.E.; Phipson, B.; Wu, D.; Hu, Y.; Law, C.W.; Shi, W.; Smyth, G.K. limma powers differential expression analyses for RNA-sequencing and microarray studies. Nucleic Acids Res. 2015, 43, e47. [Google Scholar] [CrossRef]
- Jia, P.; Zheng, S.; Long, J.; Zheng, W.; Zhao, Z. dmGWAS: Dense module searching for genome-wide association studies in protein–protein interaction networks. Bioinformatics 2011, 27, 95–102. [Google Scholar] [CrossRef] [Green Version]
- Manuel, A.M.; Dai, Y.; Freeman, L.A.; Jia, P.; Zhao, Z. Dense module searching for gene networks associated with multiple sclerosis. BMC Med. Genom. 2020, 13, 48. [Google Scholar] [CrossRef]
- Szklarczyk, D.; Gable, A.L.; Lyon, D.; Junge, A.; Wyder, S.; Huerta-Cepas, J.; Simonovic, M.; Doncheva, N.T.; Morris, J.H.; Bork, P. STRING v11: Protein–protein association networks with increased coverage, supporting functional discovery in genome-wide experimental datasets. Nucleic Acids Res. 2019, 47, D607–D613. [Google Scholar] [CrossRef] [PubMed] [Green Version]
- Shannon, P.; Markiel, A.; Ozier, O.; Baliga, N.S.; Wang, J.T.; Ramage, D.; Amin, N.; Schwikowski, B.; Ideker, T. Cytoscape: A software environment for integrated models of biomolecular interaction networks. Genome Res. 2003, 13, 2498–2504. [Google Scholar] [CrossRef] [PubMed]
- Chen, J.; Bardes, E.E.; Aronow, B.J.; Jegga, A.G. ToppGene Suite for gene list enrichment analysis and candidate gene prioritization. Nucleic Acids Res. 2009, 37, W305–W311. [Google Scholar] [CrossRef] [PubMed]
- Liao, Y.; Wang, J.; Jaehnig, E.J.; Shi, Z.; Zhang, B. WebGestalt 2019: Gene set analysis toolkit with revamped UIs and APIs. Nucleic Acids Res. 2019, 47, W199–W205. [Google Scholar] [CrossRef] [Green Version]
- Jeong, H.-H.; Chandrakantan, A.; Adler, A.C. Obstructive Sleep Apnea and Dementia-Common Gene Associations through Network-Based Identification of Common Driver Genes. Genes 2021, 12, 542. [Google Scholar] [CrossRef]
- Kleschevnikov, A.M.; Yu, J.; Kim, J.; Lysenko, L.V.; Zeng, Z.; Yu, Y.E.; Mobley, W.C. Evidence that increased Kcnj6 gene dose is necessary for deficits in behavior and dentate gyrus synaptic plasticity in the Ts65Dn mouse model of Down syndrome. Neurobiol. Dis. 2017, 103, 1–10. [Google Scholar] [CrossRef]
- Cooper, A.; Grigoryan, G.; Guy-David, L.; Tsoory, M.M.; Chen, A.; Reuveny, E. Trisomy of the G protein-coupled K+ channel gene, Kcnj6, affects reward mechanisms, cognitive functions, and synaptic plasticity in mice. Proc. Natl. Acad. Sci. USA 2012, 109, 2642–2647. [Google Scholar] [CrossRef] [Green Version]
- Lott, I.T.; Head, E. Dementia in Down syndrome: Unique insights for Alzheimer disease research. Nat. Rev. Neurol. 2019, 15, 135–147. [Google Scholar] [CrossRef]
- Rudolph, J.; Roberts, G.; Muthurajan, U.M.; Luger, K. HPF1 and nucleosomes mediate a dramatic switch in activity of PARP1 from polymerase to hydrolase. eLife 2021, 10, e65773. [Google Scholar] [CrossRef]
- Gibbs-Seymour, I.; Fontana, P.; Rack, J.G.M.; Ahel, I. HPF1/C4orf27 is a PARP-1-interacting protein that regulates PARP-1 ADP-ribosylation activity. Mol. Cell 2016, 62, 432–442. [Google Scholar] [CrossRef]
- Martire, S.; Mosca, L.; d’Erme, M. PARP-1 involvement in neurodegeneration: A focus on Alzheimer’s and Parkinson’s diseases. Mech. Ageing Dev. 2015, 146, 53–64. [Google Scholar] [CrossRef] [PubMed]
- Mao, K.; Zhang, G. The role of PARP1 in neurodegenerative diseases and aging. FEBS J. 2021, 289, 2013–2024. [Google Scholar] [CrossRef] [PubMed]
- Xia, Z.; Chibnik, L.B.; Glanz, B.I.; Liguori, M.; Shulman, J.M.; Tran, D.; Khoury, S.J.; Chitnis, T.; Holyoak, T.; Weiner, H.L. A putative Alzheimer’s disease risk allele in PCK1 influences brain atrophy in multiple sclerosis. PLoS ONE 2010, 5, e14169. [Google Scholar] [CrossRef] [PubMed]
- Lehmann, D.J.; Barnardo, M.C.; Fuggle, S.; Quiroga, I.; Sutherland, A.; Warden, D.R.; Barnetson, L.; Horton, R.; Beck, S.; Smith, A.D. Replication of the association of HLA-B7 with Alzheimer’s disease: A role for homozygosity? J. Neuroinflamm. 2006, 3, 33. [Google Scholar] [CrossRef] [Green Version]
- Tao, Y.; Han, Y.; Yu, L.; Wang, Q.; Leng, S.X.; Zhang, H. The predicted key molecules, functions, and pathways that bridge mild cognitive impairment (MCI) and Alzheimer’s disease (AD). Front. Neurol. 2020, 11, 233. [Google Scholar] [CrossRef]
- Rappaport, N.; Twik, M.; Plaschkes, I.; Nudel, R.; Iny Stein, T.; Levitt, J.; Gershoni, M.; Morrey, C.P.; Safran, M.; Lancet, D. MalaCards: An amalgamated human disease compendium with diverse clinical and genetic annotation and structured search. Nucleic Acids Res. 2017, 45, D877–D887. [Google Scholar] [CrossRef] [Green Version]
- Kimura, R.; Kamino, K.; Yamamoto, M.; Nuripa, A.; Kida, T.; Kazui, H.; Hashimoto, R.; Tanaka, T.; Kudo, T.; Yamagata, H. The DYRK1A gene, encoded in chromosome 21 Down syndrome critical region, bridges between β-amyloid production and tau phosphorylation in Alzheimer disease. Hum. Mol. Genet. 2007, 16, 15–23. [Google Scholar] [CrossRef] [Green Version]
- Wegiel, J.; Dowjat, K.; Kaczmarski, W.; Kuchna, I.; Nowicki, K.; Frackowiak, J.; Mazur Kolecka, B.; Wegiel, J.; Silverman, W.P.; Reisberg, B. The role of overexpressed DYRK1A protein in the early onset of neurofibrillary degeneration in Down syndrome. Acta Neuropathol. 2008, 116, 391–407. [Google Scholar] [CrossRef] [Green Version]
- Watanabe, N.; Araki, W.; Chui, D.-H.; Makifuchi, T.; Ihara, Y.; Tabira, T. Glypican-1 as an Aβ binding HSPG in the human brain: Its localization in DIG domains and possible roles in the pathogenesis of Alzheimer’s disease. FASEB J. 2004, 18, 1013–1015. [Google Scholar] [CrossRef]
- Cheng, F.; Fransson, L.-Å.; Mani, K. Suppression of glypican-1 autodegradation by NO-deprivation correlates with nuclear accumulation of amyloid beta in normal fibroblasts. Glycoconj. J. 2015, 32, 675–684. [Google Scholar] [CrossRef]
- Lorente-Gea, L.; García, B.; Martín, C.; Ordiales, H.; García-Suárez, O.; Piña-Batista, K.M.; Merayo-Lloves, J.; Quirós, L.M.; Fernández-Vega, I. Heparan sulfate proteoglycans undergo differential expression alterations in Alzheimer disease brains. J. Neuropathol. Exp. Neurol. 2020, 79, 474–483. [Google Scholar] [CrossRef] [PubMed]
- Giannattasio, C.; Poleggi, A.; Puopolo, M.; Pocchiari, M.; Antuono, P.; Dal Forno, G.; Wekstein, D.R.; Matera, M.G.; Seripa, D.; Acciarri, A. Survival in Alzheimer’s Disease Is Shorter in Women Carrying Heterozygosity at Codon 129 of the PRNP Gene and No APOE ε4 Allele. Dement. Geriatr. Cogn. Disord. 2008, 25, 354–358. [Google Scholar] [CrossRef] [PubMed]
- Golanska, E.; Hulas–Bigoszewska, K.; Rutkiewicz, E.; Styczynska, M.; Peplonska, B.; Barcikowska, M.; Bratosiewicz–Wasik, J.; Liberski, P. Polymorphisms within the prion (PrP) and prion-like protein (Doppel) genes in AD. Neurology 2004, 62, 313–315. [Google Scholar] [CrossRef]
- Golanska, E.; Hulas-Bigoszewska, K.; Sieruta, M.; Zawlik, I.; Witusik, M.; Gresner, S.M.; Sobow, T.; Styczynska, M.; Peplonska, B.; Barcikowska, M. Earlier onset of Alzheimer’s disease: Risk polymorphisms within PRNP, PRND, CYP46, and APOE genes. J. Alzheimer’s Dis. 2009, 17, 359–368. [Google Scholar] [CrossRef]
- Zhao, T.; Hu, Y.; Zang, T.; Wang, Y. Integrate GWAS, eQTL, and mQTL data to identify Alzheimer’s disease-related genes. Front. Genet. 2019, 10, 1021. [Google Scholar] [CrossRef] [Green Version]
- Penke, B.; Tóth, A.M.; Földi, I.; Szűcs, M.; Janáky, T. Intraneuronal β-amyloid and its interactions with proteins and subcellular organelles. Electrophoresis 2012, 33, 3608–3616. [Google Scholar] [CrossRef] [PubMed]
- Wang, X.; Zheng, W. Ca2+ homeostasis dysregulation in Alzheimer’s disease: A focus on plasma membrane and cell organelles. FASEB J. 2019, 33, 6697–6712. [Google Scholar] [CrossRef]
- Correia, S.C.; Resende, R.; Moreira, P.I.; Pereira, C.M. Alzheimer’s disease-related misfolded proteins and dysfunctional organelles on autophagy menu. DNA Cell Biol. 2015, 34, 261–273. [Google Scholar] [CrossRef]
- Joshi, G.; Bekier, M.I.; Wang, Y. Golgi fragmentation in Alzheimer’s disease. Front. Neurosci. 2015, 9, 340. [Google Scholar] [CrossRef] [Green Version]
- Moh, C.; Kubiak, J.Z.; Bajic, V.P.; Zhu, X.; Smith, M.A.; Lee, H.-g. Cell cycle deregulation in the neurons of Alzheimer’s disease. Cell Cycle Dev. 2011, 565–576. [Google Scholar]
- Li, J.-S.; Yao, Z.-X. Modulation of FGF receptor signaling as an intervention and potential therapy for myelin breakdown in Alzheimer’s disease. Med. Hypotheses 2013, 80, 341–344. [Google Scholar] [CrossRef] [PubMed]
- Turner, C.A.; Eren-Koçak, E.; Inui, E.G.; Watson, S.J.; Akil, H. Dysregulated fibroblast growth factor (FGF) signaling in neurological and psychiatric disorders. Semin. Cell Dev. Biol. 2016, 53, 136–143. [Google Scholar] [CrossRef] [PubMed] [Green Version]
- Regan, P.; McClean, P.L.; Smyth, T.; Doherty, M. Early stage glycosylation biomarkers in Alzheimer’s disease. Medicines 2019, 6, 92. [Google Scholar] [CrossRef] [Green Version]
- Zhang, X.; Alshakhshir, N.; Zhao, L. Glycolytic metabolism, brain resilience, and Alzheimer’s disease. Front. Neurosci. 2021, 15, 476. [Google Scholar] [CrossRef] [PubMed]
- Haukedal, H.; Freude, K.K. Implications of glycosylation in Alzheimer’s disease. Front. Neurosci. 2021, 1432. [Google Scholar] [CrossRef] [PubMed]
- Boix, C.P.; Lopez-Font, I.; Cuchillo-Ibañez, I.; Sáez-Valero, J. Amyloid precursor protein glycosylation is altered in the brain of patients with Alzheimer’s disease. Alzheimer’s Res. Ther. 2020, 12, 96. [Google Scholar] [CrossRef] [PubMed]
- Schedin-Weiss, S.; Winblad, B.; Tjernberg, L.O. The role of protein glycosylation in Alzheimer disease. FEBS J. 2014, 281, 46–62. [Google Scholar] [CrossRef]
- Searcy, J.L. Lipid Signaling in Brain Aging and Alzheimer’s Disease: Pharmacologically Targeting Cholesterol Synthesis, Transport and Metabolism. Ph.D. Thesis, University of Kentucky, Lexington, KY, USA, 2009. [Google Scholar]
- Mizumoto, S.; Yamada, S. An Overview of in vivo Functions of Chondroitin Sulfate and Dermatan Sulfate Revealed by Their Deficient Mice. Front. Cell Dev. Biol. 2021, 9, 764781. [Google Scholar] [CrossRef]
- Dewitt, D.A.; Silver, J.; Canning, D.R.; Perry, G. Chondroitin sulfate proteoglycans are associated with the lesions of Alzheimer’s disease. Exp. Neurol. 1993, 121, 149–152. [Google Scholar] [CrossRef] [Green Version]
- Zhang, Z.; Ohtake-Niimi, S.; Kadomatsu, K.; Uchimura, K. Reduced molecular size and altered disaccharide composition of cerebral chondroitin sulfate upon Alzheimer’s pathogenesis in mice. Nagoya J. Med. Sci. 2016, 78, 293. [Google Scholar]
- Brandan, E.; Melo, F.; Garcia, M.; Contreras, M. Significantly reduced expression of the proteoglycan decorin in Alzheimer’s disease fibroblasts. Clin. Mol. Pathol. 1996, 49, M351. [Google Scholar] [CrossRef] [PubMed] [Green Version]
- Snow, A.; Mar, H.; Nochlin, D.; Kresse, H.; Wight, T. Peripheral distribution of dermatan sulfate proteoglycans (decorin) in amyloid-containing plaques and their presence in neurofibrillary tangles of Alzheimer’s disease. J. Histochem. Cytochem. 1992, 40, 105–113. [Google Scholar] [CrossRef] [PubMed] [Green Version]
- Snow, A.D.; Cummings, J.A.; Lake, T. The Unifying Hypothesis of Alzheimer’s Disease: Heparan Sulfate Proteoglycans/Glycosaminoglycans Are Key as First Hypothesized Over 30 Years Ago. Front. Aging Neurosci. 2021, 599. [Google Scholar] [CrossRef] [PubMed]
- Zhang, G.-l.; Zhang, X.; Wang, X.-m.; Li, J.-P. Towards understanding the roles of heparan sulfate proteoglycans in Alzheimer’s disease. BioMed Res. Int. 2014, 2014, 516028. [Google Scholar] [CrossRef] [Green Version]
- Kar, S.; Poirier, J.; Guevara, J.; Dea, D.; Hawkes, C.; Robitaille, Y.; Quirion, R. Cellular distribution of insulin-like growth factor-II/mannose-6-phosphate receptor in normal human brain and its alteration in Alzheimer’s disease pathology. Neurobiol. Aging 2006, 27, 199–210. [Google Scholar] [CrossRef]
- Mathews, P.M.; Guerra, C.B.; Jiang, Y.; Grbovic, O.M.; Kao, B.H.; Schmidt, S.D.; Dinakar, R.; Mercken, M.; Hille-Rehfeld, A.; Rohrer, J. Alzheimer’s disease-related overexpression of the cation-dependent mannose 6-phosphate receptor increases Aβ secretion: Role for altered lysosomal hydrolase distribution in β-amyloidogenesis. J. Biol. Chem. 2002, 277, 5299–5307. [Google Scholar] [CrossRef] [Green Version]
- Mehta, K.; Yaffe, K.; Pérez-Stable, E.a.; Stewart, A.; Barnes, D.; Kurland, B.; Miller, B. Race/ethnic differences in AD survival in US Alzheimer’s Disease Centers. Neurology 2008, 70, 1163–1170. [Google Scholar] [CrossRef] [Green Version]
- Shadlen, M.F.; Larson, E.B.; Gibbons, L.; McCormick, W.C.; Teri, L. Alzheimer’s disease symptom severity in blacks and whites. J. Am. Geriatr. Soc. 1999, 47, 482–486. [Google Scholar] [CrossRef]
- Steenland, K.; Goldstein, F.C.; Levey, A.; Wharton, W. A meta-analysis of Alzheimer’s disease incidence and prevalence comparing African-Americans and Caucasians. J. Alzheimer’s Dis. 2016, 50, 71–76. [Google Scholar] [CrossRef] [Green Version]
- Celis, K.; Griswold, A.J.; Bussies, P.L.; Rajabli, F.; Whitehead, P.; Dorfsman, D.; Hamilton-Nelson, K.; Bigio, E.; Mesulam, M.; Geula, C. Transcriptome Analysis of Single Nucleus RNA-seq from Alzheimer Disease APOE4 Carrier Brains in African American (AA) and Non-Hispanic Whites (NHW) Reveals Differences in APOE Expression (4626). Neurology 2020, 94. [Google Scholar]
- Griswold, A.J.; Celis, K.; Bussies, P.L.; Rajabli, F.; Whitehead, P.L.; Hamilton-Nelson, K.L.; Beecham, G.W.; Dykxhoorn, D.M.; Nuytemans, K.; Wang, L. Increased APOE ε4 expression is associated with the difference in Alzheimer’s disease risk from diverse ancestral backgrounds. Alzheimer’s Dement. 2021, 17, 1179–1188. [Google Scholar] [CrossRef] [PubMed]
- Gabbouj, S.; Ryhänen, S.; Marttinen, M.; Wittrahm, R.; Takalo, M.; Kemppainen, S.; Martiskainen, H.; Tanila, H.; Haapasalo, A.; Hiltunen, M. Altered insulin signaling in Alzheimer’s disease brain–special emphasis on PI3K-Akt pathway. Front. Neurosci. 2019, 13, 629. [Google Scholar] [CrossRef] [PubMed]
- Long, H.-Z.; Cheng, Y.; Zhou, Z.-W.; Luo, H.-Y.; Wen, D.-D.; Gao, L.-C. PI3K/AKT signal pathway: A target of natural products in the prevention and treatment of Alzheimer’s disease and Parkinson’s disease. Front. Pharmacol. 2021, 12, 648636. [Google Scholar] [CrossRef] [PubMed]
- Rickle, A.; Bogdanovic, N.; Volkman, I.; Winblad, B.; Ravid, R.; Cowburn, R.F. Akt activity in Alzheimer’s disease and other neurodegenerative disorders. Neuroreport 2004, 15, 955–959. [Google Scholar] [CrossRef]
- Zhao, Y.; Ho, P.; Yih, Y.; Chen, C.; Lee, W.; Tan, E. LRRK2 variant associated with Alzheimer’s disease. Neurobiol. Aging 2011, 32, 1990–1993. [Google Scholar] [CrossRef] [PubMed]
- Henderson, M.X.; Sengupta, M.; Trojanowski, J.Q.; Lee, V.M. Alzheimer’s disease tau is a prominent pathology in LRRK2 Parkinson’s disease. Acta Neuropathol. Commun. 2019, 7, 1–16. [Google Scholar] [CrossRef] [PubMed] [Green Version]
- Vergara, C.; Parker, M.M.; Franco, L.; Cho, M.H.; Valencia-Duarte, A.V.; Beaty, T.H.; Duggal, P. Genotype imputation performance of three reference panels using African ancestry individuals. Hum. Genet. 2018, 137, 281–292. [Google Scholar] [CrossRef]
- Campbell, M.C.; Tishkoff, S.A. African genetic diversity: Implications for human demographic history, modern human origins, and complex disease mapping. Annu. Rev. Genom. Hum. Genet. 2008, 9, 403. [Google Scholar] [CrossRef] [Green Version]


| White | African | Hispanic | |
|---|---|---|---|
| # of samples | 2545 | 1221 | 3102 |
| # of cases | 1266 | 85 | 1425 |
| # of controls | 1279 | 1136 | 1677 |
| Average age cases | 72.9 | 80.8 | 79 |
| Average age controls | NA | 78.3 | 73 |
| # of significant modules | 317 | 342 | 779 |
| Afr + Hisp | Afr + White | Hisp + White |
|---|---|---|
| AGPAT4, CYB5A, DRG2, HSPA14 | C4orf27, KCNJ6, TMEM218 | ACP6, DHX36, SUCLG2 |
| ANO5, GADD45GIP1, NUP50, RNGTT | AGPS, CBS, NIPSNAP1, TRAP1 | |
| ARPC5L, DYRK1A, S100A10, TTLL13 | AGPS, CDK5RAP2, NIPSNAP1, NME7 | |
| BDKRB1, CERS1, HHATL | AGPS, MCUR1, NDUFAF4, NIPSNAP1 | |
| BTN2A2, HLA-DRB1, HLA-DRB5 | AIMP1, CEP135, GCSH, SFI1 | |
| C4orf27, IFNGR2, KCNJ6, TMEM218 | ALDH5A1, HSCB, MRPL35, NFXL1, VEZT | |
| C4orf27, KCNJ6, TMEM218 | ALDH5A1, HSCB, NFXL1, VEZT | |
| CCDC146, HIP1R, VPS28 | ATP6V0A1, CYTH2, SMPD3 | |
| DCDC2, FAM118A, NMU | B3GAT3, CSGALNACT2, GOSR1, GPR35, NRAS, SNAP47 | |
| ENAH, FYCO1, PRMT6, SMG7 | BMP7, GNB2, GRB7, SERINC1, TDGF1 | |
| HEATR1, HLA-B, HLA-H | BTN2A1, HMGCR, TYW1 | |
| HLA-B, HLA-H, UXS1 | C4orf27, KCNJ6, TMEM218 | |
| NDUFAF6, OTX1, RGS20 | CAPZA2, HIP1R, KRI1, MYO6, RIN3 | |
| CBL, RIPK1, TAB2, YWHAE | ||
| COMMD2, COMMD4, TP53RK | ||
| CPSF3L, GIGYF1, HSD17B14, SNRPC | ||
| CSNK1E, CUL7, DDX42, MAPK9, RCC1 | ||
| CSNK1E, KIAA0101, LTBR, NBR1, TMEM259, TRIM4 | ||
| DERL1, RMDN3, SLC13A3, SRPR | ||
| GPC1, ITGA3, RABIF, RPS25, ZDHHC18 | ||
| HLA-B, HLA-H, PSMA4, WDR11 | ||
| MRPL20, MTRF1L, NDUFAF4, PDPR | ||
| NRAS, SLC4A7, SNAP47, UNC5B | ||
| RIPK1, TAB2, TICAM1 |
Publisher’s Note: MDPI stays neutral with regard to jurisdictional claims in published maps and institutional affiliations. |
© 2022 by the authors. Licensee MDPI, Basel, Switzerland. This article is an open access article distributed under the terms and conditions of the Creative Commons Attribution (CC BY) license (https://creativecommons.org/licenses/by/4.0/).
Share and Cite
Dai, Y.; Jia, P.; Zhao, Z.; Gottlieb, A. A Method for Bridging Population-Specific Genotypes to Detect Gene Modules Associated with Alzheimer’s Disease. Cells 2022, 11, 2219. https://doi.org/10.3390/cells11142219
Dai Y, Jia P, Zhao Z, Gottlieb A. A Method for Bridging Population-Specific Genotypes to Detect Gene Modules Associated with Alzheimer’s Disease. Cells. 2022; 11(14):2219. https://doi.org/10.3390/cells11142219
Chicago/Turabian StyleDai, Yulin, Peilin Jia, Zhongming Zhao, and Assaf Gottlieb. 2022. "A Method for Bridging Population-Specific Genotypes to Detect Gene Modules Associated with Alzheimer’s Disease" Cells 11, no. 14: 2219. https://doi.org/10.3390/cells11142219