Article

A Combination Therapy of Urolithin A+EGCG Has Stronger Protective Effects than Single Drug Urolithin A in a Humanized Amyloid Beta Knockin Mice for Late-Onset Alzheimer’s Disease

by
Sudhir Kshirsagar
1,
Rainier Vladlen Alvir
1,
Jangampalli Adi Pradeepkiran
1,
Ashly Hindle
1,
Murali Vijayan
1,
Bhagavathi Ramasubramaniam
1,
Subodh Kumar
1,2,
Arubala P. Reddy
3 and
P. Hemachandra Reddy
1,3,4,5,6,7,*
1
Department of Internal Medicine, Texas Tech University Health Sciences Center, 3601 4th Street, Lubbock, TX 79430, USA
2
Center of Emphasis in Neuroscience, Department of Molecular and Translational Medicine, Texas Tech University Health Sciences Center, El Paso, TX 79905, USA
3
Nutritional Sciences Department, College of Human Sciences, Texas Tech University, 1301 Akron Ave, Lubbock, TX 79409, USA
4
Department of Pharmacology and Neuroscience, Texas Tech University Health Sciences Center, Lubbock, TX 79430, USA
5
Department of Neurology, Texas Tech University Health Sciences Center, Lubbock, TX 79430, USA
6
Department of Public Health, Graduate School of Biomedical Sciences, Texas Tech University Health Sciences Center, Lubbock, TX 79430, USA
7
Department of Speech, Language, and Hearing Sciences, Texas Tech University Health Sciences Center, Lubbock, TX 79430, USA
*
Author to whom correspondence should be addressed.
Cells 2022, 11(17), 2660; https://doi.org/10.3390/cells11172660
Submission received: 22 July 2022 / Revised: 23 August 2022 / Accepted: 24 August 2022 / Published: 27 August 2022

Abstract

:
In the current study, for the first time, we study mitophagy enhancer urolithin A and a combination of urolithin A+green tea extract EGCG against human Aβ peptide-induced mitochondrial and synaptic, dendritic, inflammatory toxicities and behavioral changes in humanized homozygous amyloid beta knockin (hAbKI) mice of late-onset Alzheimer’s disease (AD). Our findings reveal significantly increased positive effects of urolithin A and a combination treatment of urolithin A+EGCG in hAbKI mice for phenotypic behavioral changes including motor coordination, locomotion/exploratory activity, spatial learning and working memory. mRNA and protein levels of mitochondrial fusion, synaptic, mitophagy and autophagy genes were upregulated, and mitochondrial fission genes are downregulated in urolithin A and combine treatment in hAbKI mice; however, the effect is stronger in combined treatment. Immunofluorescence analysis of hippocampal brain sections shows similar findings of mRNA and protein levels. Mitochondrial dysfunction is significantly reduced in both treatment groups, but a stronger reduction is observed in combined treatment. Dendritic spines and lengths are significantly increased in both treatment groups, but the effect is stronger in combined treatment. The fragmented number of mitochondria is reduced, and mitochondrial length is increased, and mitophagosomal formations are increased in both the groups, but the effect is stronger in the combined treatment. The levels of amyloid beta (Aβ) 40 and Aβ42 are reduced in both treatments, however, the reduction is higher for combined treatment. These observations suggest that urolithin A is protective against human Aβ peptide-induced toxicities; however, combined treatment of urolithin A+EGCG is effective and stronger, indicating that combined therapy is promising to treat late-onset AD patients.

1. Introduction

Alzheimer’s disease (AD) is a late-onset, progressive neurological disease that is characterized by the loss of memory and multiple cognitive functions [1]. A new case of dementia is diagnosed every 3 s and more than 85% of AD cases occur in patients over the age of 60 years [2]. It is estimated that by the end of the year 2050, 50% of people worldwide who are 85 years of age or older will be afflicted with AD. With the increasing aged population, AD has become a major health concern.
AD occurs in the following two forms: early-onset familial and late-onset sporadic. Early-onset familial AD is uncommon, with one to two percent of total AD cases. Mutations in the APP, PS1 and PS2 loci cause familial AD [3,4]. Late-onset AD is the most common form of the disease. A combination of genetic and environmental and lifestyle conditions plays a large role, in addition to the ApoE4 genotype being a major risk factor for AD [5,6].
Several years of intense research from our lab and others have revealed that multiple cellular changes are involved with the disease process, including synaptic damage, mitochondrial abnormalities, increased free radical production/oxidative stress, defective mitophagy, microRNA deregulation, the proliferation of astrocytes and microglia, in addition to production and accumulation of amyloid beta (Aβ) and phosphorylated tau (p-Tau) [1,2,5,6,7,8,9,10]. These changes were observed primarily in the learning and memory regions of the brain, including the entorhinal cortex and hippocampus [11]. Among these, synaptic damage and mitochondrial dysfunction are early cellular changes in both early-onset familial and late-onset sporadic AD [12].
Increasing evidence also suggests that mitochondrial abnormalities, including changes in mitochondrial DNA, mitochondrial gene expressions, mitochondrial ATP, mitochondrial enzymatic activities, mitochondria-induced increased free radicals, lipid peroxidation, reduced axonal transport, impaired mitochondrial biogenesis, mitochondrial dynamics and defective mitophagy, are extensively reported in AD [5,6,7,13,14,15,16,17].
Mitophagy is a cellular event that clears the dead or dying mitochondria by autophagy. Mitophagy is initiated by autophagosomal formation. Mitophagy begins with the formation of the phagophore, which expands through lipid acquisition to become the autophagosome [5,7]. Following the selective engulfment of defective mitochondria, the mitochondria are subsequently catabolized by fusion of the autophagosome to a lysosome to form an autolysosome, where the enveloped contents are degraded [5,7].
Defective mitophagy is an emerging science and is caused by impaired mitochondrial dynamics (increased fission, decreased fusion or vice versa), defective mitochondrial biogenesis and abnormal interaction of mutant proteins such as Aβ and p-Tau with mitochondrial proteins Drp1, VDAC1, CypD, ABAD and others [18,19,20,21,22]. Recent evidence from our lab and others indicates that mitophagy proteins PINK1 and Parkin are largely reduced in AD, primarily due to abnormal interactions between Aβ and p-Tau with the fission protein Drp1 [23,24,25,26,27,28,29,30], leading to reduced clearance of dead or dying mitochondria. These studies also suggest that reduced levels of Drp1, VDAC1, CypD and ABAD may inhibit abnormal interactions with Aβ and p-tau and maintain the quality of mitochondria, mitochondrial health and mitophagy in AD [5,31]. Another important factor is the increase and/or restoration of mitophagy with a pharmacological approach, which is urgently needed in AD. Currently, several newly developed pharmacological treatments and novel chemical modulators such as nicotinamide riboside, tomatidine, actinonin and urolithin A, and even a combination of mitophagy enhancers such as urolithin A with green tea extract EGCG, might be used to promote the efficient removal of damaged mitochondria and restore the energetic status in AD neurons.
Urolithin A is abundantly present in pomegranates. Pomegranates are enriched with natural polyphenols, including ellagitannins, which are hydrolyzed to ellagic acid. Ellagic acid is transformed by the gut microbiota into urolithins. Recent in vitro studies have investigated urolithins’ antioxidant effects, particularly on aging and age-related neurodegenerative diseases, such as AD [28,29,30,31,32,33]. Recent familial AD mouse models revealed that urolithin A ameliorated cognitive impairment, prevented neuronal apoptosis and enhanced neurogenesis in APP/PS1 mice. Furthermore, urolithin A attenuated Aβ deposition and periplaque microgliosis and astrocytosis in the cortex and hippocampus [32,33]. However, the impact of urolithin A is not yet studied in late-onset AD mouse models such as humanized Aβ knockin mice.
Egpigallocatechin gallate (EGCG) is a green tea extract enriched with flavonoids. Several studies have shown that EGCG has important anti-atherogenic, anti-inflammatory anti-amyloid beta and anti-phosphorylated tau properties, with potential neuroprotective effects against cerebrovascular and neurodegenerative diseases, such as Alzheimer’s, Parkinson’s and Huntington’s [34]. It has been reported that EGCG bypassed the blood–brain barrier (BBB) and reached the functional parts of the brain [34]. Increasing evidence also suggests that EGCG suppresses Aβ-induced inflammatory responses in microglia. Wei and colleagues observed that EGCG was able to suppress the expression of TNFα, IL-1β, IL-6 and inducible nitric oxide synthase and to restore the levels of intracellular antioxidants against free radical-induced pro-inflammatory effects in microglia, the nuclear erythroid-2 related factor 2 and the heme oxygenase-1 [35]. It has been reported that EGCG was able to redirect Aβ polypeptides’ aggregation into off-pathway protein assemblies [36]. In another study, Bieschke and colleagues showed that EGCG converted the large mature Aβ fibrils into smaller forms with no toxicity for mammalian cells [37]. A recent primary neuronal culture study of DIV8 revealed that EGCG was able to enhance the clearance of AD-related phosphorylated tau species, indicating that EGCG could be used as an adjuvant agent for AD treatment [38]. Similar findings were obtained by Chang and colleagues that EGCG reduced Aβ accumulation in M146 L and CHO cells [39]. Further, a recent study reported that EGCG inhibited Aβ generation and oxidative stress involvement of nuclear receptors through peroxisome proliferator-activated receptor gamma (PPARγ) in N2a/APP695 cells [40].
Using mitophagy enhancers (nicotinamide riboside, tomatidine, actinonin and urolithin A) and mutant APP, mutant Tau cDNAs, and immortalized primary hippocampal (HT22) neurons, we studied the protective effects of mitophagy enhancers [28,29].
We recently optimized doses of mitophagy enhancers urolithin A, actinonin, tomatidine and nicotinamide riboside in HT22 cells [28]. We transfected HT22 cells with mutant APP cDNA and treated them with mitophagy enhancers and assessed mRNA and protein levels of mitochondrial dynamics, biogenesis, mitophagy and synaptic genes, cell survival and mitochondrial respiration [28]. MutantAPPHT22 cells showed increased fission, decreased fusion, synaptic and mitophagy genes, reduced cell survival and defective mitochondrial respiration, and excessively fragmented and reduced length of mitochondria. However, these events were reversed in mitophagy enhancer-treated mmAPPHT22 cells. Cell survival was significantly increased, mRNA and protein levels of mitochondrial fusion, synaptic and mitophagy genes were increased, the mitochondrial number was reduced, and mitochondrial length was increased and mitochondrial fragmentation was reduced in mitophagy-enhancers-treated mAPPHT22 cells. Further, urolithin A showed the strongest protective effects against mutant APP and Aβ-induced mitochondrial and synaptic toxicities.
In another in vitro study, we transfected HT22 cells with mutant Tau cDNA and treated them with mitophagy enhancers, nicotinamide riboside, tomatidine, actinonin and urolithin A and assessed mRNA and protein levels of mitochondrial dynamics, mitochondrial biogenesis, mitophagy/autophagy and synaptic genes [29]. We found increased fission, decreased fusion, synaptic and mitophagy genes, reduced cell survival and defective mitochondrial respiration. However, these events were reversed in mitophagy enhancer-treated mTauHT22 cells. Cell survival was increased, mRNA and protein levels of mitochondrial fusion, synaptic and mitophagy genes were increased, and mitochondrial fragmentation is reduced in mitophagy enhancers treated mTauHT22 cells. Further, urolithin A showed the strongest protective effects among all enhancers tested in AD. Our combination treatments of urolithin A+EGCG, in addition to urolithin A and EGCG individual treatments, revealed that the combination treatment approach is even stronger than urolithin A treatment. These studies prompted us to investigate the protective effects of (1) urolithin A and (2) a combination of urolithin A+EGCG in humanized homozygous amyloid beta knockin mice of late-onset AD. Our current study is the first to investigate the impact of urolithin A and a combination of urolithin A+EGCG in the late-onset AD mouse model.
Our recent study of 7-month-old homozygous hAbKI mice revealed that hAbKI mice showed behavioral impairments in motor coordination, reduced locomotor and exploration activities, and impairments in working memory and spatial learning and memory [41]. The mRNA and protein analyses revealed the increased expression of mitochondrial fission genes and reduced expression of mitochondrial-fusion, mitochondrial biogenesis, synaptic, autophagy and mitophagy genes in hAbKI mice. Immunofluorescence analysis revealed altered immunoreactivities and agreed with the mRNA and protein data (immunoblot) results. Increased mitochondrial fragmentation and reduced mitochondrial length in both hippocampal and cortical tissues were observed. Mitochondrial function was defective. Reduced dendritic spines were observed in both the cerebral cortices and hippocampi of hAbKI mice. Soluble Aβ40 and Aβ42 were detected at 3 months of age and progressively increased in 7-month-old hAbKI mice [41]. These observations suggest that early behavioral, cellular, molecular, synaptic, dendritic and mitochondrial changes occur in hAbKI mice of late-onset AD.
Recently, we also assessed mitochondrial respiration (oxygen consumption rate-OCR, proton leaks and ATP) using the Seahorse Bioanalyzer for (1) green tea extract EGCG, (2) urolithin A and (3) a combination of urolithin A+EGCG in mAPPHT22 cells. Our findings revealed that maximal OCR was significantly decreased in mAPPHT22 cells compared to HT22 cells. By contrast, OCR was significantly increased in mAPPHT22 cells treated with urolithin A, EGCG and a combination of urolithin A+EGCG compared to untreated mAPPHT22 cells. A combination of urolithin A+EGCG-treated mAPPHT22 cells showed the strongest protective effects compared to individual treatments of EGCG and urolithin A. Additionally, OCR is stronger for urolithin A compared to EGCG, indicating that as a mitophagy enhancer, urolithin A is a better molecule than EGCG for mitophagy activity (details are given below). These findings prompted us to study urolithin A and urolithin A+EGCG in hAbKI mice that represent late-onset AD.
In the current study, using a late-onset AD mouse model, hAbKI mice [42], we tested urolithin A and in the combination of both urolithin A+ green tea extract EGCG against human Abeta peptide-induced mitochondrial and synaptic, dendritic and inflammatory toxicities in mice. We assessed behavioral changes using the Y-maze, open field, rotarod and Morris water maze and also assessed mRNA and protein levels of mitochondrial dynamics, biogenesis, mitophagy and synaptic genes and cell survival; assessed mitochondrial structure and dendritic spines in 7-month-old hAbKI mice treated with urolithin A and urolithin A+EGCG. Since we reported the findings of 7-month-old hAbKI mice in comparison to WT control mice earlier [41], in the current study, we compared the data between urolithin A and a combination treatment of urolithin A+EGCG with hAbKI mice.

2. Materials and Methods

Chemicals and Reagents

We received mouse HT22 cells from David Schubert as a gift. Cell culture supplements such as Dulbecco’s Modified Eagle Medium (DMEM), Minimum Essential Medium (MEM), fetal bovine serum, penicillin/streptomycin and Trypsin-EDTA were purchased from GIBCO (Gaithersburg, MD, USA).
Urolithin A. Urolithin A is a natural product with antiproliferative and antioxidant activity, and was purchased from Sigma-Aldrich, St. Louis, MO, USA.
Preparation of urolithin stock solution.
The urolithin A solution was prepared by dissolving it in dimethyl sulfoxide (DMSO) at a concentration of 20 mg/mL (optimized in our lab).
EGCG (−)-Epigallocatechin gallate. (−)-Epigallocatechin gallate from green tea is the prime, and was purchased from Sigma-Aldrich, St. Louis, MO, USA.
Preparation of EGCG stock solution.
The EGCG solution was prepared by dissolving it in H2O at a concentration of 5 mg/mL.
Mutant APP cDNA constructs. Mutant APP Swe/IND cDNA clone (pCAX-APP Swe/Ind) has been obtained from Add gene—https://www.addgene.org and later sub-cloned into a mammalian expression vector pRP-Puro- CAG. The pRP vector has a pUC backbone, CMV promoter and SV40 polyadenylation site with puromycin selection for stable transfection. We used NCBI sequence hAPP [NM_201414.2]∗(K595N M596L V642F) in order to confirm the sequence output.
Cell culture work. HT22 cells were grown for 2–3 days until they are 60–70% confluent. The medium used for growing these cells is 1:1 mixture of DMEM and OptiMEM with 10% FBS plus penicillin and streptomycin [Invitrogen, Carlsbad, CA, USA]. We have performed 5 independent cell cultures and transfections with mutant APP cDNA treatments for all experiments (HT22 cells, HT22 cells+mAPPcDNA, HT22 cells+mAPPcDNA+urolithin A, HT22 cells+mAPP+EGCG, HT22 cells+mAPP cDNA+urolithin A+EGCG and later treated with urolithin A and EGCG for 24 hrs.
Humanized A-beta-Knock-in (hAbKI) Mice. The homozygous humanized knock-in mouse model (hAbKI), which has an entire mouse APP sequence with a human A-beta sequence was used for this study [42]. Most of the AD cases in humans were observed at the late stage of life, but a majority of the available AD mouse model with APP overexpression shows consistently early development of AD onset. A recently developed hAbKI AD mouse model seen to develop age-dependent changes in cognitive and synaptic plasticity. Additionally, an inflammatory response that mimics late-onset progression has been noticed in sporadic human AD cases. In this special mouse model, three amino acids within the A-beta region of the mouse APP sequence are “knocked in” to express human A-beta without changes to the 5′ and 3′UTR mouse sequences. Thus, the use of hAbKI mice is suitable for our proposed studies. Homozygotes are viable, fertile and live beyond 22 months. The hA-beta-loxP-KI allele is available on a C57BL6J/SJL congenic background (Stock No. 031050). Breeding pairs were purchased from Jackson Labs, Bar Harbor, ME, USA. Mice were bred and housed under a standard 12 h light-dark cycle, with lights on at 7 AM in the Laboratory Animal Resource Center, Texas, Tech University Health Sciences Center, accredited by the Association for Assessment and Accreditation of Laboratory Animal Care International (AAALAC). All experimental protocols were approved by Texas Tech University Health Sciences Center, Institutional Animal Care and Use Committee (TTUHSC-IACUC).
Treatment of animals. After confirming hAbKI mice at 3 months of age, mice were then divided into the following three experimental groups: (1) Control group hAbKI mice: No treatment; (2) Urolithin A group: hAbKI mice were administered with urolithin A (2.5 mg/kg body weight) (i.p.), optimized in our lab, 3 times per week for 4 months and (3) Combined treatment group: urolithin A+EGCG group. hAbKI mice were administered with urolithin A (2.5 mg/kg body weight) + EGCG (25 mg/kg body weight) (i.p.) 3 times per week for 4 months. At the end of 4 months of treatment, animals were sacrificed by cervical dislocation. Brain tissues were collected and stored in the deep freezer for further assays.
For this study total 20 animals per group were used (20 hAbKI mice and 20 treated hAbKI mice with urolithin A, and urolithin A+EGCG) for behavioral analysis. For cell biology (immunoblot, amyloid-beta levels) and molecular biology (mRNA expression) 5 mice were used, for immunofluorescence 5 mice, for transmission-electron-microscopy 5 mice and for Golgi–Cox analyses 5 mice were used per group.
Rotarod test. A rotarod test was performed on 7-month-old treated and untreated hAbKI mice to measure their balance, coordination and motor planning. Said mice were placed on the mouse rotarod unit (Med Associates, Inc., St. Albans, VT, USA) in order to check the differences in balance and motor coordination. The rotarod behavioral assessment test was performed as described before [43,44,45].
Open field test. The open-field test was used to examine the general locomotor-activity levels, willingness to explore, anxiety-related behavior and these activities were tracked using the ANY-Maze® software (Stoelting, Wood Dale, IL, USA). The open field behavioral assessment test was performed as described before [43,44,45]. Seven-month-old treated and untreated hAbKI mice were placed in a 40 cm square open field with video-tracking tools and mice were observed for 5 min under moderate lighting. The stages of general activity were measured by evaluating the total distance traveled and average speed.
Y-Maze test. To measure the impulsive change in habituation and spatial working memory, we used Y-maze test. Working memory has been shown to be sensitive to hippocampal damage. The working memory behavioral assessment test was performed as described before [43,44,45]. Treated and untreated hAbKI mice at the age of 7 months were allowed to freely explore all three arms of the Y-maze and impulsive change was calculated. Each mouse was placed in one of the arms for five minutes in order to take a trial and repeated for all three arms in the maze. The number of total arm selections and sequence of arm selections was recorded (ANY-Maze®, Stoelting, Wood Dale, IL, USA).
Morris water maze test. We used the Morris-water-maze (MWM) test in untreated and hAbKI mice treated with Urolithin A and EGCG drugs in order to measure spatial long-term memory and learning [44,45,46]. The MWM test was carried out in a tank that is 120 cm wide and 50 cm deep. The tank was filled with opacified water (Utrecht Art Supplies, Cranbury, NJ, USA) and kept at a temperature of 25 ± 0.5 °C. The tank was divided into four quadrants such as NE, NW, SW and SE. A platform with a 9 cm diameter was submerged 1 cm under the water surface; this platform was placed in the NW quadrant and remained at the same position during the whole experiment. For this study, each group of animals was trained for 4 days in the MWM, with four trials per day and during each trial the mice were allowed to run for one minute. If the mice could not find the platform within one minute, they were placed on the platform using the net for approximately 3 s. The mice were dried with a towel and placed into a holding cage after each trial. Mice were video-tracked using ANY-Maze® software (Stoelting, Wood Dale, IL, USA). Additionally, the behavioral parameters including distance traveled, average time to find the platform and average speed were measured [44,45,46].
Quantitative real-time (qRT) PCR. To perform the qRT-PCR, first cortical tissue was harvested from untreated and hAbKI mice treated with Urolithin A and EGCG drugs, then total RNA was isolated from cortical tissues. Using primer Express Software (Applied Biosystems, Carlsbad, CA, USA), we designed the oligonucleotide primers for the housekeeping genes such as β-actin and GAPDH. Additionally, we designed primers for the mitochondrial-structural genes, fission genes (Drp1, Fis1), fusion genes (MFN1, MFN2, Opa1), mitochondrial biogenesis genes (PGC1a, Nrf1, Nrf2, TFAM), synaptic genes (synaptophysin, PSD95, synapsins1-2, synaptobrevins1-2, neurogranin and synaptopodin), and autophagy/mitophagy genes (LC3B-I and II, LC3B, ATG5, Beclin1, PINK1, Parkin, and BCL2). The primer sequences and amplicon sizes are mentioned in Table 1. We have performed RT-PCR using SYBR-Green chemistry-based quantitative real-time RT-PCR as described by Kandimalla et al. 2016 [43] and Kandimalla et al. 2022 [44].
Immunoblotting Analysis. To perform immunoblotting analysis, proteins were extracted from the cortical tissues of untreated hAbKI mice and hAbKI mice treated with urolithin A and EGCG drugs. The method was previously described in our lab publication by Kandimalla et al., 2016 [43]. We evaluated the expression of different proteins including mitochondrial dynamics, biogenesis, synaptic, autophagy and mitophagy. Beta-actin was used as a housekeeping protein in order to normalize the levels of above-mentioned proteins. Details on antibodies and dilutions are mentioned in Table 2.
Immunofluorescence Analysis. We performed immunofluorescence analysis on brain sections of 7-month-old treated and untreated hAbKI mice. The immunoreactivity and intensity of mitochondrial dynamics, biogenesis, synaptic and mitophagy proteins were analyzed using this technique, which was defined previously in our lab publications [45,46,47]. To measure the immunoreactivities of antibodies, several pictures were taken at different magnifications such as 4×, 10×, 20×, 40× and 100×. Statistical significance was calculated as per the intensities of red, green, or blue colors by using NIH ImageJ software. Details of antibody dilutions are specified in Table 3.
Dendritic Spine Analysis Using Golgi–Cox Staining. We used 7-month-old treated and untreated hAbKI mice brains for this study. Dendritic spines of neurons in the brains were detected by Golgi–Cox staining, using the FD Rapid GolgiStain Kit (PK401, FD NeuroTechnologies, Columbia, MD, USA) as explained previously [44,45,46]. Mouse brain tissues were infused for 2 weeks and handled as per the manufacturer’s instructions. All the procedures were performed in dark conditions. In short, images of dendrites within the CA1 subregion of the hippocampus and cerebral cortex were taken by using a 4×, 10×, 20× and 100× objective by using an AMG EVOS microscope (Thermo Fisher Scientific, Waltham, MA, USA) or an Olympus IX83 (Olympus Corporation, Tokyo, Japan). We selected roughly 20 neurons randomly from each group of mice and measured them with a double-blind, controlled design. To evaluate the number of spines and the total dendritic length, ImageJ and Image-Pro Plus software were used.
Transmission Electron Microscopy (TEM) of Brain Mitochondria. We have performed transmission electron microscopy by using hippocampal and cortical sections of 7-month-old treated and untreated hAbKI mice. We were able to determine the mitochondrial number and size by using the previously described method from our lab publications [44,45,46]. We used Image J software to analyze the number and size of mitochondria in the treated and untreated hAbKI mouse brains. In short, we identified the mitochondria within a defined area of the field and numbered them by two independent, experienced researchers blinded to the details of each sample group. We took ten random micrographs from the hippocampus and cerebral cortex of each of the 3 pairs of treated and untreated hAbKI mice in order to measure the mitochondrial number and size (i.e., 30 micrographs for each genotype).
Mitophagosomal formations were assessed in hippocampal sections using ten random micrographs from urolithin A and combination of urolithin A+EGCG-treated and untreated hAbKI mice [44,45,46].
Measurement of Soluble Aβ Levels. We used sandwich ELISA method to detect the soluble Aβ levels, as previously described in Manczak et al. 2016 [25] and Manczak et al. 2018 [48,49,50]. For this method, 96-well plate was used, and the procedure was performed by following the manufacturer’s instructions. Each sample was run in duplicate and protein concentrations of the homogenates were measured using the BCA detection method. The concentration of Aβ was expressed as pg Aβ/mg protein.
Mitochondrial Functional Assays. Mitochondrial function was evaluated by using protein lysates of 7-month-old treated and untreated hAbKI mice. For this, we measured the concentration of H2O2, lipid peroxidation and ATP. The production levels of H2O2 were measured using cerebral cortices, as previously described in Reddy et al. 2018 [23]. In short, the reaction mixture, which contains mitochondrial proteins, horseradish peroxidase, Amplex Red reagents and a reaction buffer, was incubated at room temperature for 30 min followed by spectrophotometer readings of fluorescence (570 nm). The production of H2O2 was determined using a standard curve equation expressed in nmol/μg mitochondrial protein.
As defined before in Reddy et al. 2018 [23], levels of 4-hydroxy-nonenol were measured using HNE-His ELISA Kit (Cell BioLabs, Inc., San Diego, CA, USA). In short, freshly prepared protein lysates were added to a 96-well protein-binding plate and incubated overnight at 4 °C. Later, the plate was washed 3 times and the anti-HNE-His antibody was added to the protein, which was then incubated for 2 h at room temperature. Then, a secondary antibody conjugated with peroxidase was added to the samples and incubated for 2 h at room temperature. Next, an enzyme substrate was added to the sample and incubated at room temperature. Optical density was measured (at 450 nm) to count the level of HNE.
We isolated mitochondria from cortical tissues of treated and untreated hAbKI mice as described previously in Reddy et al. 2018 [23], and mitochondrial ATP levels were measured by using an ATP determination kit (Molecular Probes, Eugene, OR, USA). ATP levels from mitochondrial pellets were measured by using a standard curve method.
Measurement of mitochondrial respiration by using Seahorse XFe96 extracellular flux analyzer. We used advanced seahorse technique to measure the mitochondrial respiration, the method was described in our previous publication [28]. Briefly, to perform the experiment, HT22 cells were grown overnight in a petri dish and next day cells were transfected with mTau plasmid for 24 h. Later, cells were trypsinized, counted and treated with mitophagy enhancers and plated 10,000 cells in 80 μL growth medium (DMEM medium supplemented with 10% fetal bovine serum, 1% penicillin and streptomycin) in each well, except four background correction wells (A1, A12, H1 and H12), which should be blanked with 80 μL of growth medium. In order to obtain the uniform cell distribution and to decrease edge effects for cells, the cell plate was kept in the cell culture hood to stabilize at 20–25 °C for 1 h. Next, they were incubated overnight in the cell culture incubator. The utility plate and sensory cartridge were detached and placed the sensory cartridge upside down next to the utility plate. Seahorse XF Calibrant (200 μL) was added to each well of the utility plate, then lower the sensory cartridge back onto the utility plate kept in a non-CO2 and 37 °C incubator overnight. Next day, the medium from XF96 cell culture microplate was removed by keeping 20 μL of the media in the plate. Later, 180 μL of freshly prepared assay medium (1 mL 200 mM glutamine, 1 mL 100 mM pyruvate solution and 0.1 g D-glucose in 98 mL XF base medium) was added and incubated the XF96 cell culture microplate at 37 °C in non-CO2 incubator for 1 h. Meanwhile, the stock solutions of oligomycin, FCCP and rotenone/antimycin A were diluted as per the protocol and loaded 20 μL of 1.5 μM oligomycin in port A, 22 μL of 1 μM FCCP in port B and 25 μL of 0.5 μM rotenone/antimycin A in port C of the hydrated sensory cartridge. The utility plate was then kept in the seahorse machine and hydrated sensory cartridge for calibration. Once the calibration was finished, the utility plate was removed and exchanged the XF96 cell culture microplate on the tray with the accurate direction as labeled on corner of the plate and then loaded the tray. After the OCR measurements are completed, which is about 1 h and 24 min, the results are automatically formed, analyzed by the wave software and data were transferred to excel or prism file. The data shown are mean ± standard error of the mean from six to eight wells.
Statistical Analysis. The data is presented as mean ± SE. Statistical analysis was performed by using GraphPad Prism (Version 9.1.1) software (GraphPad Software, San Diego, CA, USA). The statistics were performed by using either one-way ANOVA followed by Tukey’s test for multiple comparisons test, T test was also used for the comparison between two samples. * p < 0.05 was taken as significant value.

3. Results

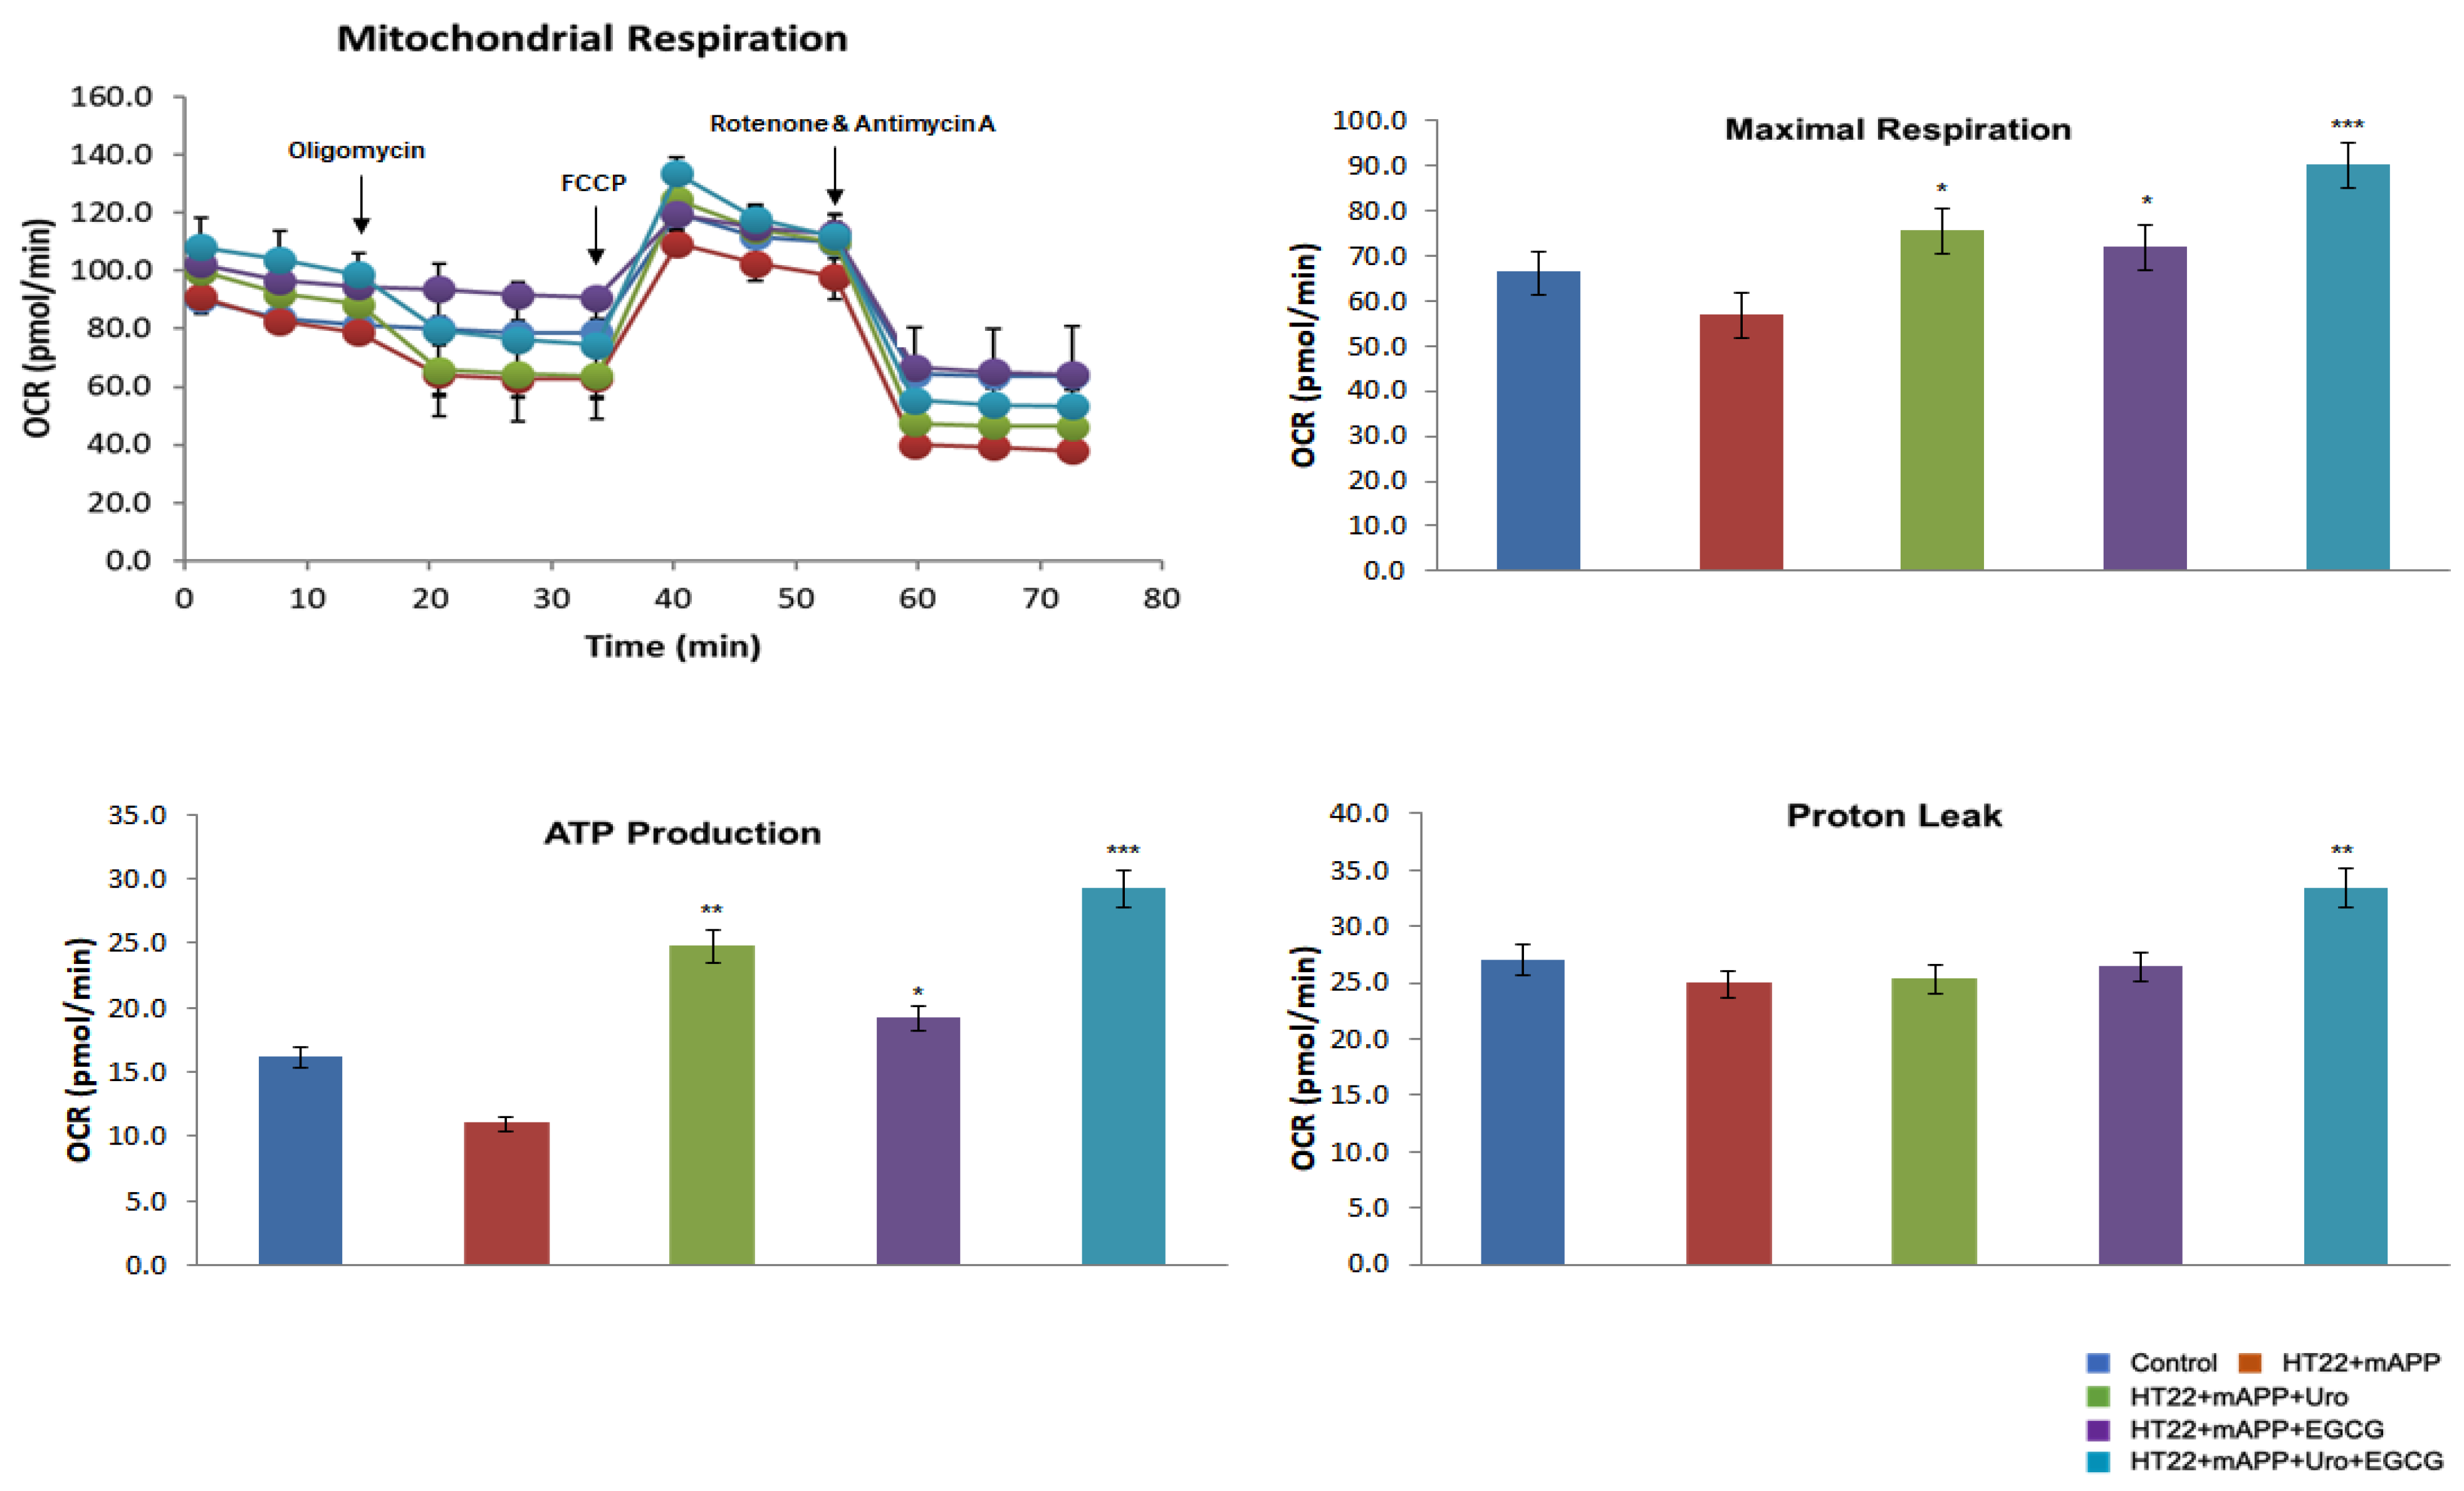
3.1. Mitochondrial Respiration in Mutant APPHTT Cells Treated with Urolithin A, EGCG, Combination of Urolithin A+EGCG

To determine the impact of urolithin A, EGCG, a combination of urolithin A+EGCG in mutant APPHT22 cells (HT22 cells were transfected with mutant APP cDNA for 24 hrs), and assessed mitochondrial respiration (oxygen consumption rate, proton leaks and ATP) in HT22 cells, mAPPHT22 cells, mAPP+urolithin A, mAPP+EGCG, mAPP+urolithin A+EGCG. We compared respiration data of (1) mAPPHT22 cells with HT22 cells alone, (2) mutantAPPHT22 cells treated with urolithin A, (3) mAPPHT22 cells treated with EGCG and a combination of mAPPHT22 cells with urolithin A+EGCG. As shown in Figure 1, the maximal OCR was significantly decreased in mAPPHT22 cells compared to HT22 cells alone. On the other hand, OCR was significantly increased in mAPPHT22 cells treated with urolithin A (p = 0.03); EGCG (p = 0.05) and a combination of urolithin A+EGCG (p = 0.001) compared to untreated mAPPHT22 cells. As expected, a combination of urolithin A+EGCG-treated mAPPHT22 cells showed stronger protective effects, indicating combination therapy is powerful. Mitochondrial respiration is stronger for urolithin A compared to EGCG, indicating that mitophagy enhancer, urolithin A is a better and more promising molecule to enhance mitophagy activity. Seahorse mitochondrial respiration data clearly suggest that combination therapy is better than a single molecule, and urolithin A has stronger protective effects than EGCG. These findings prompted us to study urolithin A and urolithin A+EGCG in humanized Abeta knockin mice that represent late-onset AD.

3.1.1. Phenotypic Behavior

To determine the beneficial effects of mitophagy enhancer urolithin A and a combination of urolithin A and EGCG, we assessed phenotypic behavior using the rotarod for motor coordination, the open field for locomotor activity/exploration abilities, the Y-maze for working memory and the Morris water maze for spatial learning and memory in 7-month-old hAbKI mice treated with urolithin A and a combination of urolithin A+EGCG relative to untreated hAbKI mice.
Rotarod: On an accelerating rotarod test, hAbKI mice treated with urolithin A exhibited an increased latency to fall compared to untreated hAbKI mice (p = 0.014) (Figure 2A), indicating that urolithin A-treated seven-month-old hAbKI mice improved motor deficits, and, as expected, a combined treatment of urolithin A+EGCG of hAbKI stayed a longer period of time on an accelerating rotarod (p = 0.008) compared to untreated hAbKI mice (Figure 1A), suggesting that combined treatment is much more effective than a single drug, urolithin A treatment.
Open Field: Compared to 7-month-old hAbKI mice, urolithin A-treated hAbKI mice showed significantly increased total distance traveled (p = 0.022) and increased average speed (p = 0.037) (Figure 2B), indicating that locomotor activity is enhanced in urolithin A-treated hAbKI mice. Interestingly, combined treatment of urolithin A+EGCG hAbKI mice showed higher statistical significance for both locomotor activity and average speed compared to untreated hAbKI mice. Overall, these observations suggest that combined treatment is stronger and more effective than a single drug, urolithin A treatment in hAbKI mice.
Morris Water Maze: As shown in Figure 2C, urolithin A-treated hAbKI mice showed significantly reduced time to find the platform (p = 0.013) and reduced distance traveled (p = 0.020) compared with urolithin A untreated hAbKI mice, indicating that urolithin A-treated hAbKI mice exhibited improved spatial learning and memory behavior. We observed similar findings for the combined treatment of urolithin A+EGCG in hAbKI mice compared to untreated hAbKI mice.
Y-Maze: Compared to 7-month-old untreated hAbKI mice, urolithin A-treated hAbKI mice showed increased arm entries and also an increased percentage of spontaneous alternations, but not significant, indicating a trend of increasing working memory (Figure 2D). Similar observations were found for the combined treatment of urolithin A+EGCG in hAbKI mice relative to untreated hAbKI mice.

3.1.2. mRNA Expression

To determine the impact of urolithin A and combined treatment of urolithin A+EGCG on mitochondrial dynamics, mitochondrial biogenesis, synaptic, autophagy and mitophagy genes, we conducted qRT-PCR from the cortical tissues of urolithin A and combined treatment of urolithin A+EGCG-treated 7-month-old hAbKI mice relative to untreated hAbKI mice.
Mitochondrial dynamics: As shown in Table 4, decreased mRNA levels of fission genes Drp1 (by 1.96-fold) and Fis1 (by 2.32-fold) were observed in urolithin A-treated hAbKI mice relative to untreated mice. On the other hand, fusion genes (Mfn1 by 2.03-fold, Mfn2 by 3.4-fold and Opa1 by 2.91-fold) were increased in urolithin A-treated hAbKI mice relative to untreated mice, indicating that urolithin A enhanced fusion machinery and reduced fission activity in hAbKI mice. Similar to urolithin A, combined treatment (urolithin A+EGCG) showed similar activities, but fold changes were higher in hAbKI mice treated with urolithin A+EGCG relative to untreated hAbKI mice (Table 4). These observations strongly suggest that combined treatment is more effective than single treatment of urolithin A in hAbKI mice.
Mitochondrial biogenesis: Increased levels of biogenesis genes PGC1α (by 3.03-fold), Nrf1 (by 1.46-fold), Nrf2 (by 2.39-fold) and TFAM (by 1.8-fold) were found in urolithin A-treated 7-month-old hAbKI mice relative to untreated hAbKI mice (Table 4), indicating that mitochondrial biogenesis was enhanced in 7-month-old hAbKI mice.
As shown in Table 4, mRNA levels of mitochondrial genes (PGC1a by 4.1-fold, Nrf1 by 2.76-fold, Nrf2 by 3.25-fold and TFAM by 2.2-fold) were higher in the combined treatment of urolithin A+EGCG in 7-month-old hAbKI mice relative untreated hAbKI mice. These observations indicate that combined treatment of urolithin A+EGCG is more effective than a single treatment of urolithin A in hAbKI mice.
Synaptic genes: As shown in Table 4, all synaptic genes (by synaptophysin 3.45-fold, PSD95 by 2.9-fold, synap25 by 3.7-fold, synapsin1 by 2.2-fold, synapsin2 by 10.2-fold, synaptobrevin1 by 2.7-fold, synaptobrevin2 by 6.6-fold and neurogranin by 3.81-fold) were upregulated in urolithin A-treated 7-month-old hAbKI mice relative to untreated hAbKI mice (Table 4).
Similar to urolithin A-treated hAbKI mice, mRNA fold-changes of synaptic genes were upregulated in the combined treatment of urolithin A+EGCG in hAbKI mice; however, fold changes are higher than single urolithin A treatment, synaptophysin (by 3.95-fold), PSD95 (by 3.5-fold), synap25 (by 6.34-fold), synapsin1 (by 17.03-fold), synapsin2 (by 14.6-fold), synaptobrevin1(by 4.67-fold), synaptobrevin2 (by 7.87-fold) and neurogranin (by 8.5-fold).
Mitophagy genes: Mitophagy genes were upregulated in urolithin A-treated 7-month-old hAbKI mice relative to untreated hAbKI mice, PINK1 (by 2.63-fold) and Parkin (by 2.3-fold). mRNA fold changes were also upregulated in the combined treatment of urolithin A+EGCG with a much higher fold change than urolithin A for treatment, PINK1 (by 3.34-fold) and Parkin (by 2.33-fold) (Table 4). These observations strongly suggest that combined treatment is more effective and stronger than a single treatment for AD.
Autophagy genes: As shown in Table 4, autophagy genes were upregulated in urolithin A-treated 7-month-old hAbKI mice relative to untreated mice (ATG5 by 2.07-fold, BCL2 by 2.5-fold and LC3B by 2.08-fold). mRNA fold changes of autophagy genes were upregulated at much higher folds for combined treated hAbKI mice relative to untreated mice (ATG5 by 2.23-fold, BCL2 by 4.8-fold and LC3B by 4.34-fold).
Overall, these observations strongly suggest that combined treatment is more effective and stronger than a single treatment for AD.

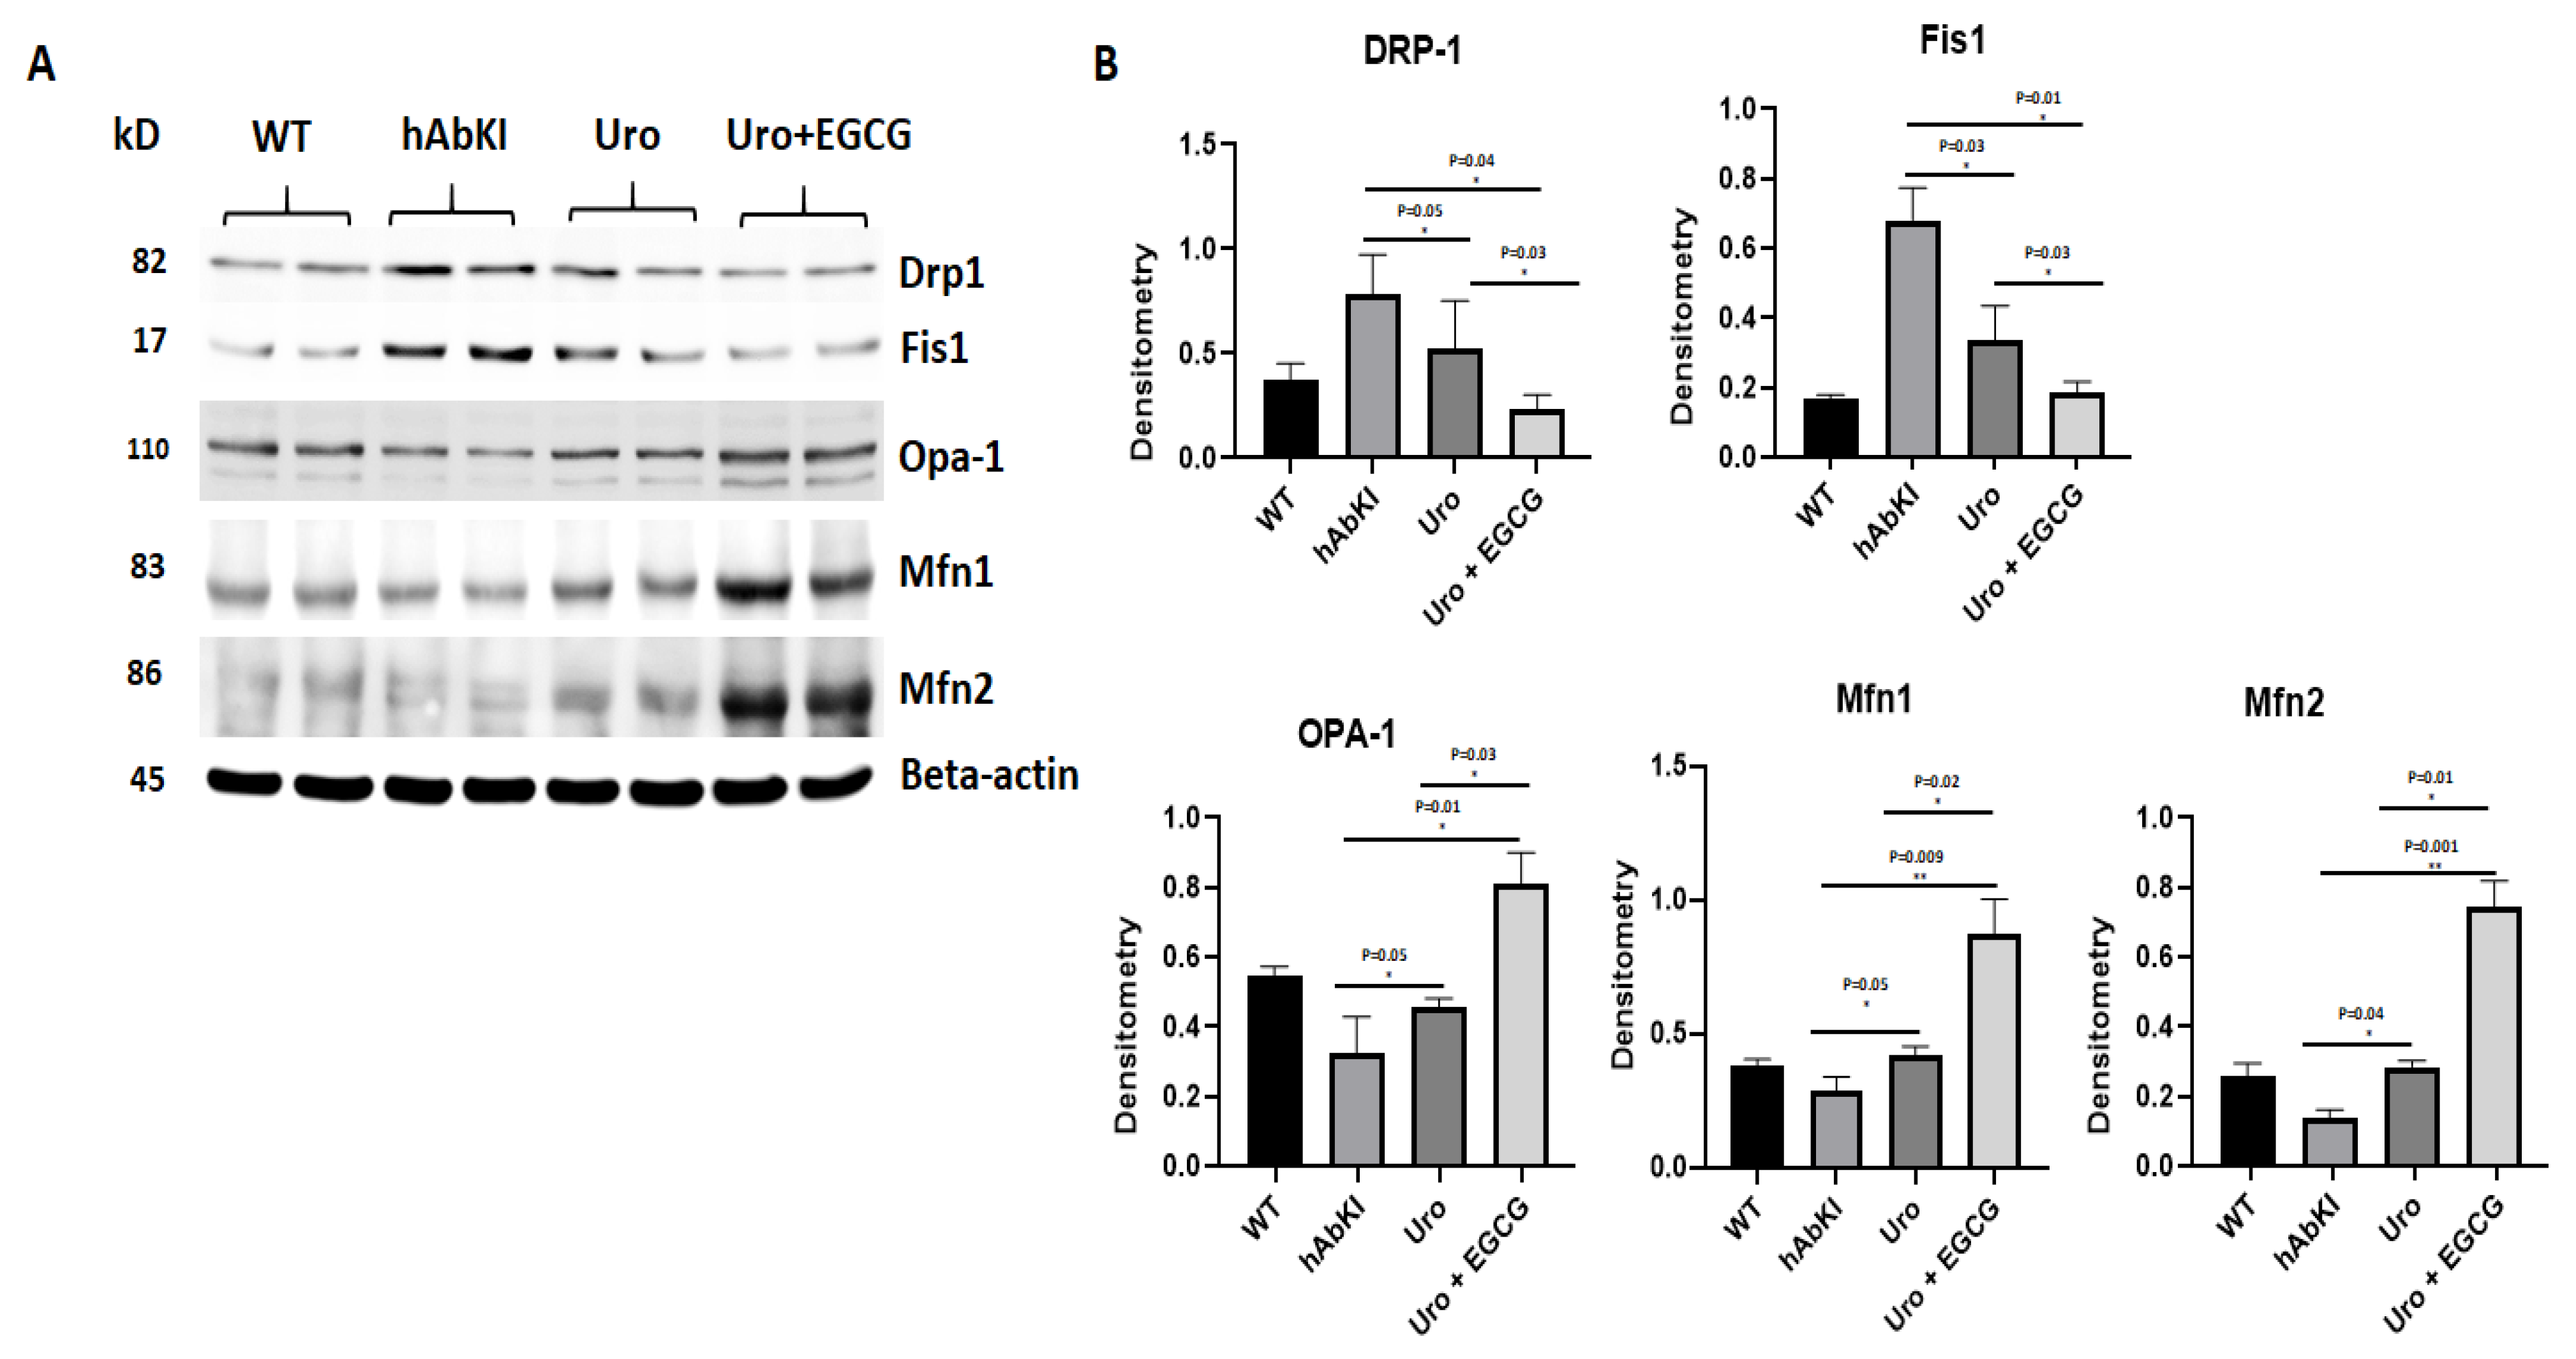
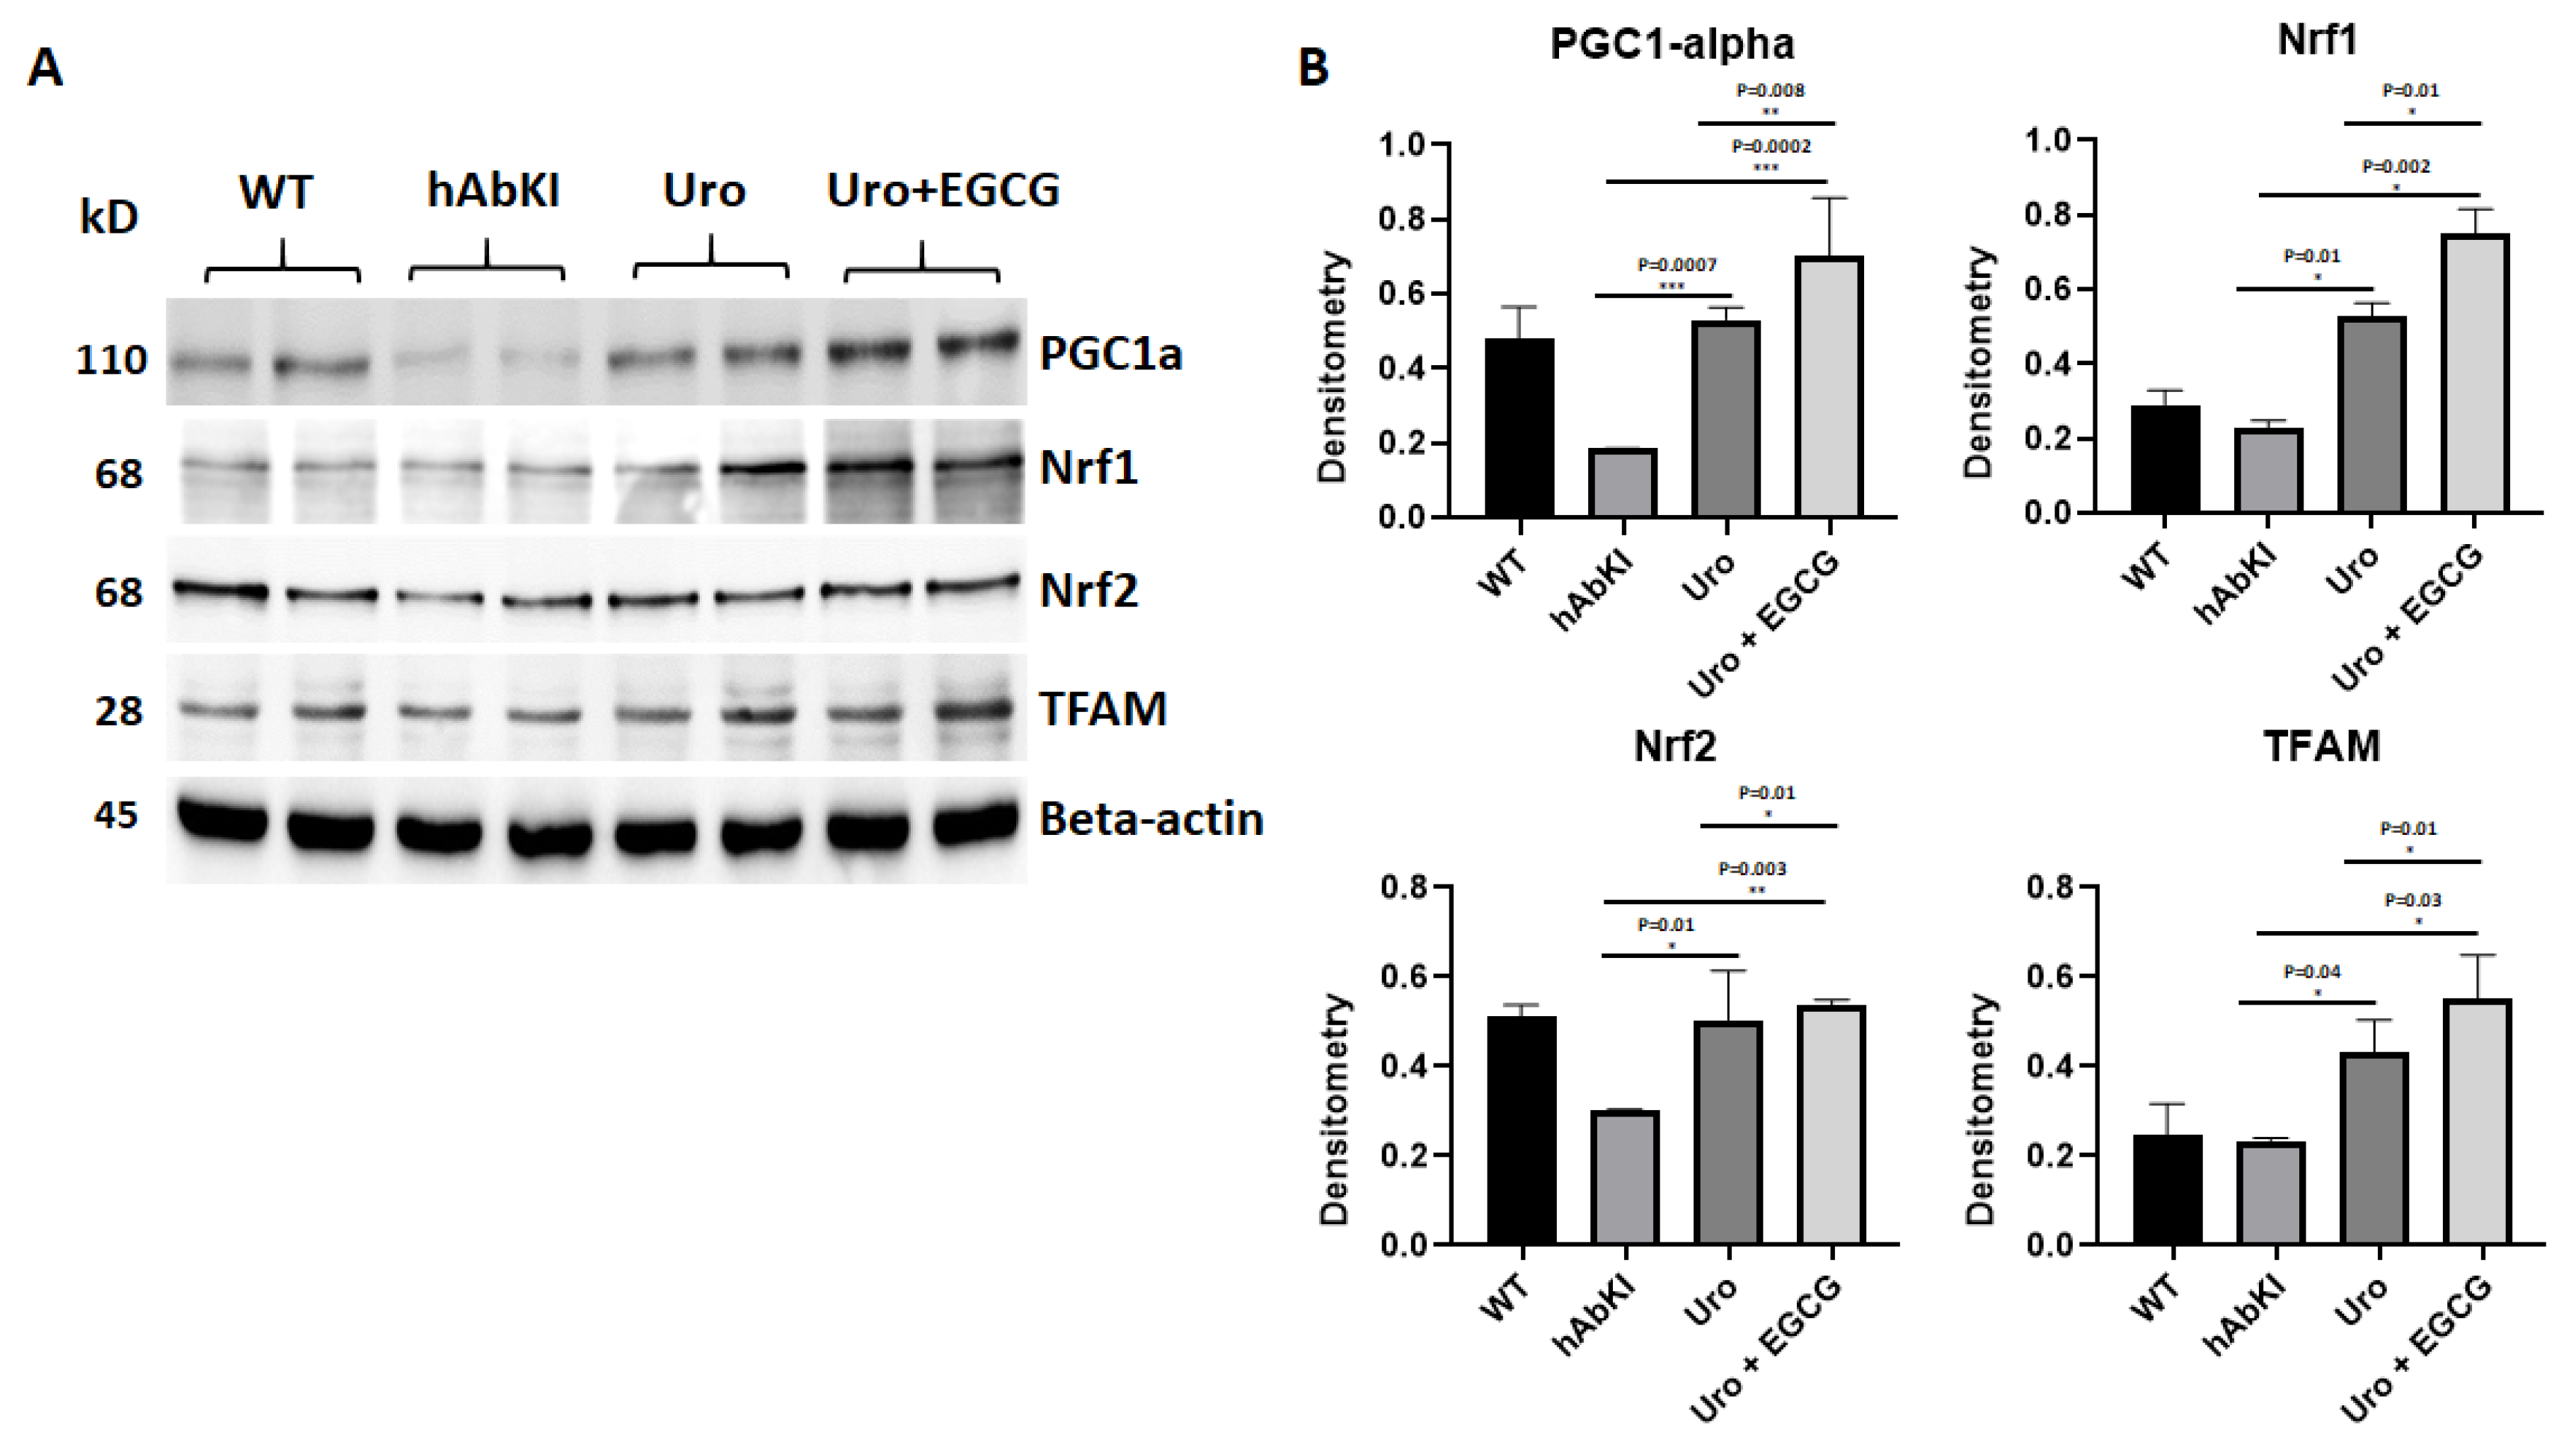
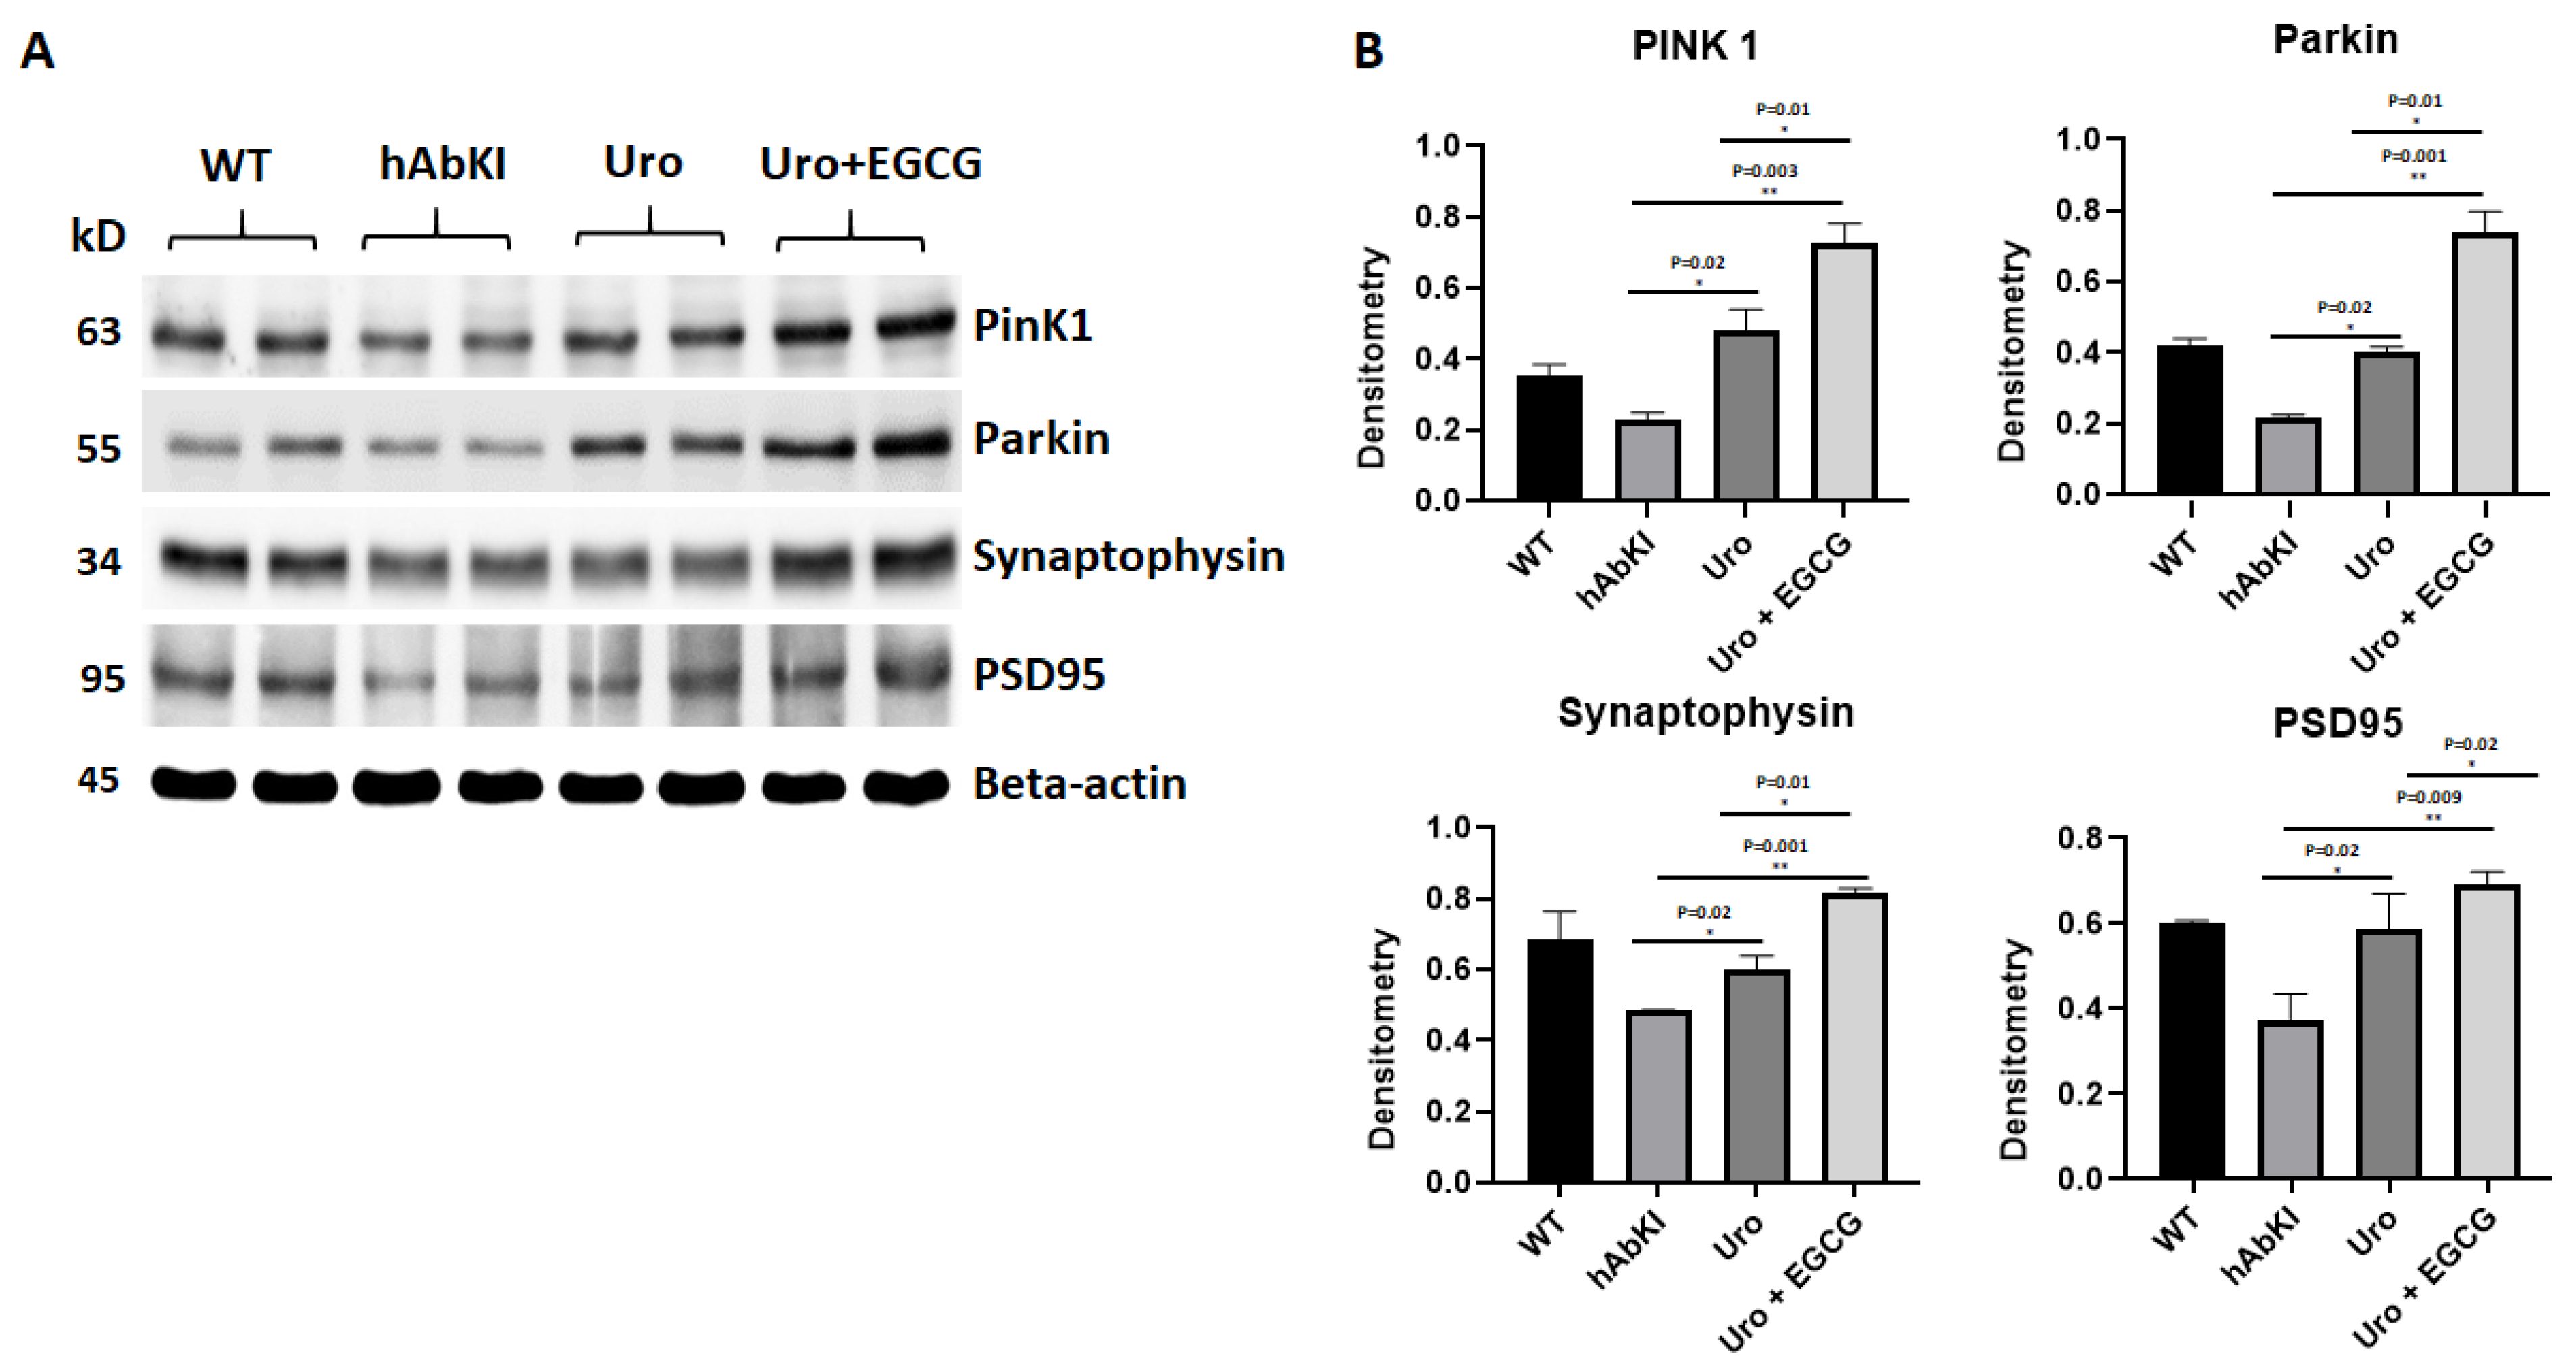
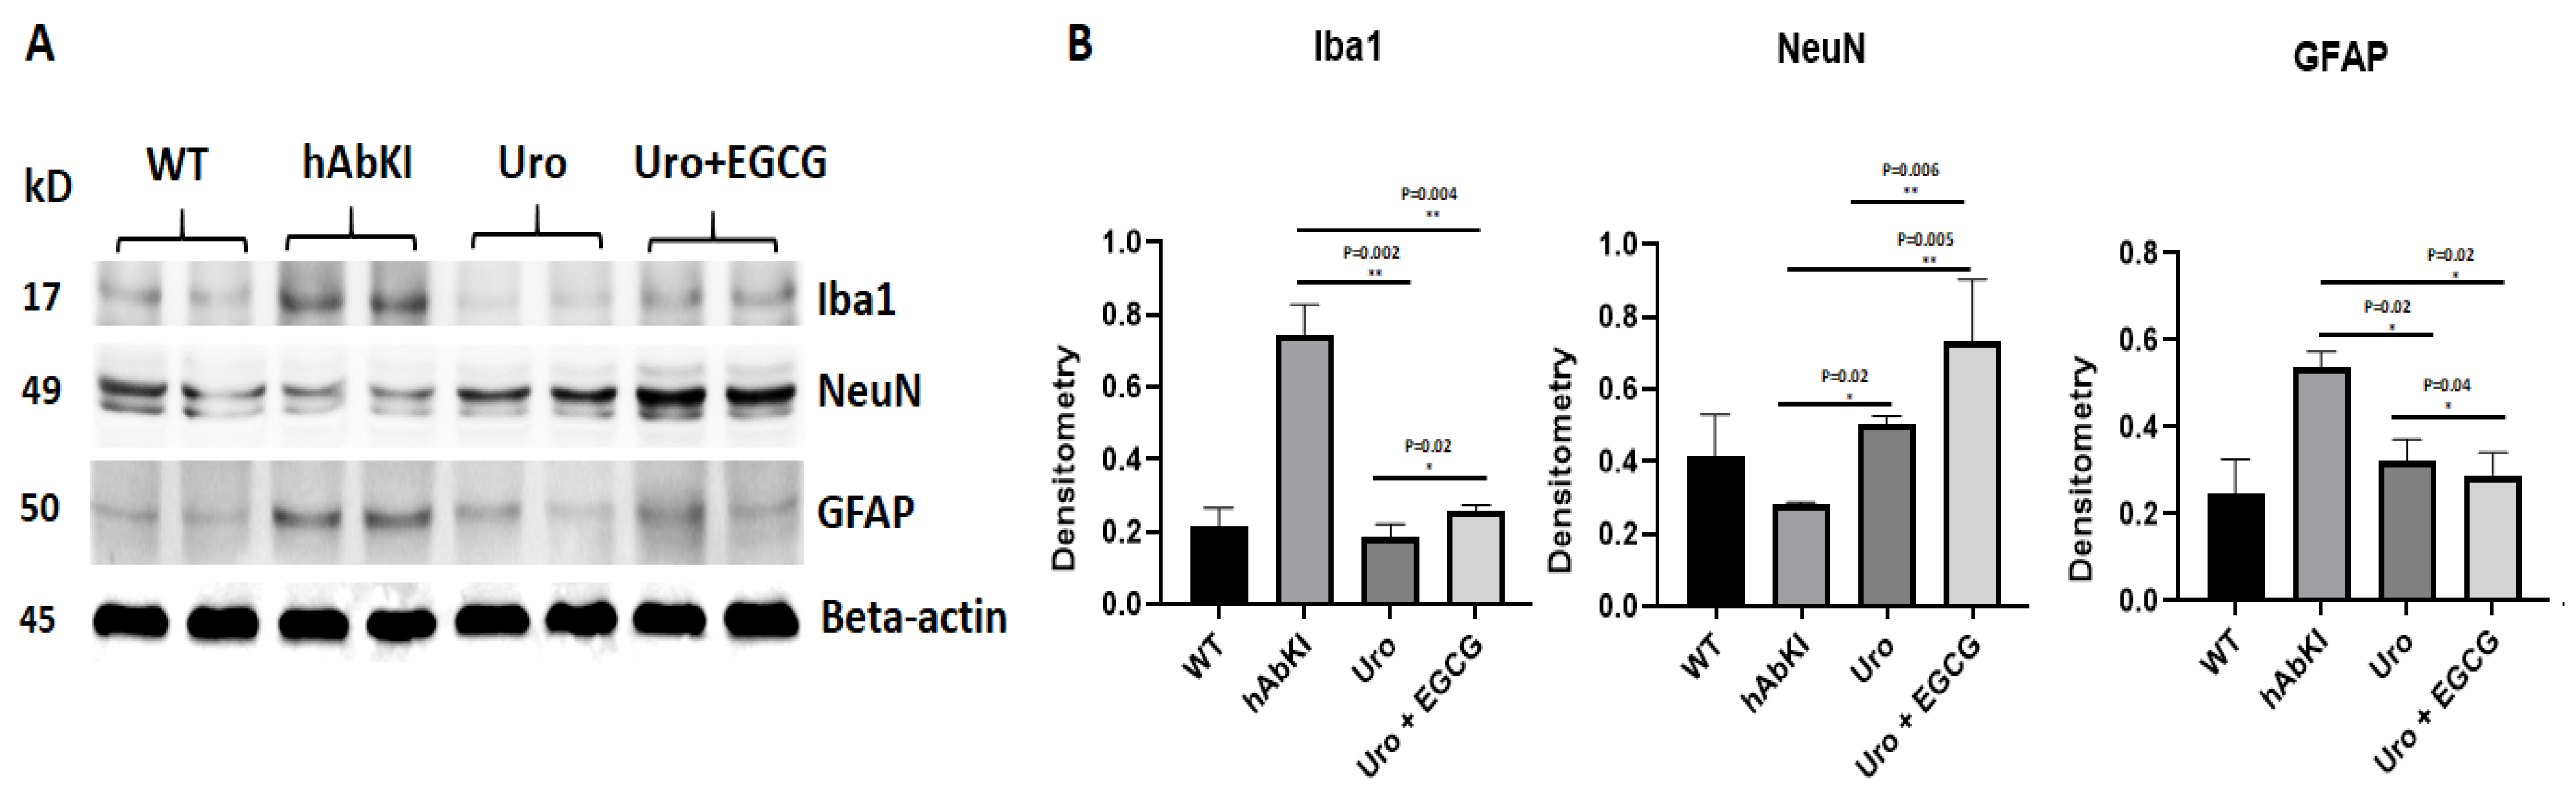
3.1.3. Immunoblotting Analysis

To assess the beneficial effects of urolithin A and combined treatment of urolithin A+EGCG on mitochondrial-, synaptic-, autophagy-, mitophagy- and inflammation-protein levels, we performed immunoblotting analysis using protein lysates prepared from 7-month-old hAbKI mice and urolithin A-treated and combined treatment of urolithin A+EGCG in hAbKI mice.
Mitochondrial dynamics proteins: As shown in Figure 3, fission proteins Drp1 (p = 0.05) and Fis1 (p = 0.03) were significantly decreased in urolithin A-treated 7-month-old hAbKI mice relative to untreated hAbKI mice. Significantly reduced mitochondrial fission proteins Drp1 (p = 0.03) and Fis1 (p = 0.03) were found in hAbKI mice treated with urolithin A compared to the combination treatment of urolithin A+EGCG, indicating that combination treatment reduces fission activity better than urolithin A alone. As expected, in comparison to hAbKI mice, combined treatment of urolithin A+EGCG in hAbKI mice showed a further decrease in fission proteins Drp1 (p = 0.04) and Fis1 (p = 0.01) (Figure 3). These observations strongly suggest that urolithin A reduces fission activity, and combined treatment is even better in reducing fission machinery.
On the other hand, mitochondrial fusion proteins Mfn2 (p = 0.04) and Opa1 (p = 0.05) were significantly increased in urolithin A-treated hAbKI mice and combined treatment of urolithin A+EGCG in 7-month-old hAbKI mice Mfn1 (p = 0.009), Mfn2 (p = 0.001) and Opa1 (p = 0.01) relative to untreated hAbKI mice. In hAbKI mice treated with urolithin A compared to the combination treatment of urolithin A+EGCG, fusion proteins Mfn1 (p = 0.02), Mfn2 (p = 0.01) and Opa1 (p = 0.03) were significantly increased, indicating that combination treatment is better and stronger than urolithin A alone for mitochondrial fusion activity. These observations suggest that urolithin A enhances fusion activity and combined treatment is even better.
Mitochondrial biogenesis proteins: Mitochondrial biogenesis proteins were significantly increased in urolithin A-treated hAbKI mice (PGC1a p = 0.0007, Nrf1 p = 0.01, Nrf2 p = 0.01 and TFAM p = 0.04) (Figure 4) relative to untreated hAbKI mice (Figure 4) and mitochondrial biogenesis proteins were increased further in combined treatment of urolithin A+EGCG in hAbKI mice (PGC1a p = 0.0002, Nrf1 p = 0.002, Nrf2 p = 0.003 and TFAM p = 0.03). In hAbKI mice treated with urolithin A compared to combination treatment of urolithin A+EGCG, mitochondrial biogenesis proteins PGC1a (p = 0.008), Nrf1 (p = 0.01), Nrf2 (p = 0.01) and TFAM (p = 0.01) significantly increased, indicating that combination treatment is better and stronger than urolithin A alone for mitochondrial biogenesis activity.
Mitophagy and synaptic proteins: As shown in Figure 5, both mitophagy (PINK1 p = 0.02, and Parkin p = 0.02) and synaptic proteins (synaptophysin p = 0.02 and PSD95 p = 0.02) were significantly increased in urolithin A-treated 7-month-old hAbKI mice relative to untreated hAbKI mice, and these effects even stronger in combined treatment of urolithin A+EGCG for mitophagy in hAbKI mice (PINK1 p = 0.003 and Parkin p = 0.001) and synaptic proteins (synaptophysin p = 0.001 and PSD95 p = 0.009). In hAbKI mice treated with urolithin A compared to the combination treatment of urolithin A+EGCG, mitophagy and synaptic proteins PINK1 (p = 0.01), Parkin (p = 0.01), synaptophysin (p = 0.01) and PSD95 (p = 0.02) were significantly increased, indicating that combination treatment is better than urolithin A alone for mitophagy and synaptic activity.
Autophagy Proteins: Significantly increased levels of autophagy proteins (Beclin p = 0.05, ATG5 p = 0.004, LC3B1 p = 0.003, LC3B2 p = 0.0001 and BCL2 p = 0.04) were found in urolithin A-treated 7-month-old hAbKI mice relative to untreated hAbKI mice (Figure 6), and increased levels are even higher for autophagy proteins (Beclin p = 0.04, ATG5 p = 0.002, LC3B1 p = 0.003, LC3B2 p = 0.0001 and BCL2 p = 0.04) in combined treatment of urolithin A+EGCG in hAbKI mice. In hAbKI mice treated with urolithin A compared to combination treatment of urolithin A+EGCG, autophagy proteins Beclin (p = 0.05), ATG5 (p = 0.01) and BCL2 (p = 0.006) significantly increased, indicating that combination treatment is better than urolithin A alone for autophagy.
Inflammatory proteins: As shown in Figure 7, microglial marker Iba1 (p = 0.002) and astrocytic marker GFAP (p = 0.02) proteins were significantly reduced in hAbKI mice treated with urolithin A and this reduction is even higher in urolithin A+EGCG-treated hAbKI mice, Iba (p = 0.004) and GFAP (p = 0.02) relative to untreated hAbKI mice. On the contrary, neuronal marker NeuN showed a significantly increased in both urolithin-treated A (p = 0.02) and combined treatment of urolithin A+EGCG (p = 0.005) in hAbKI mice relative to untreated mice. In hAbKI mice treated with urolithin A compared to the combination treatment of urolithin A+EGCG, microglial marker Iba1 (p = 0.004), astrocytic marker GFAP (p = 0.02) proteins were significantly reduced and neuronal marker NeuN (p = 0.006), significantly increased, indicating that combination treatment is better than urolithin A alone.

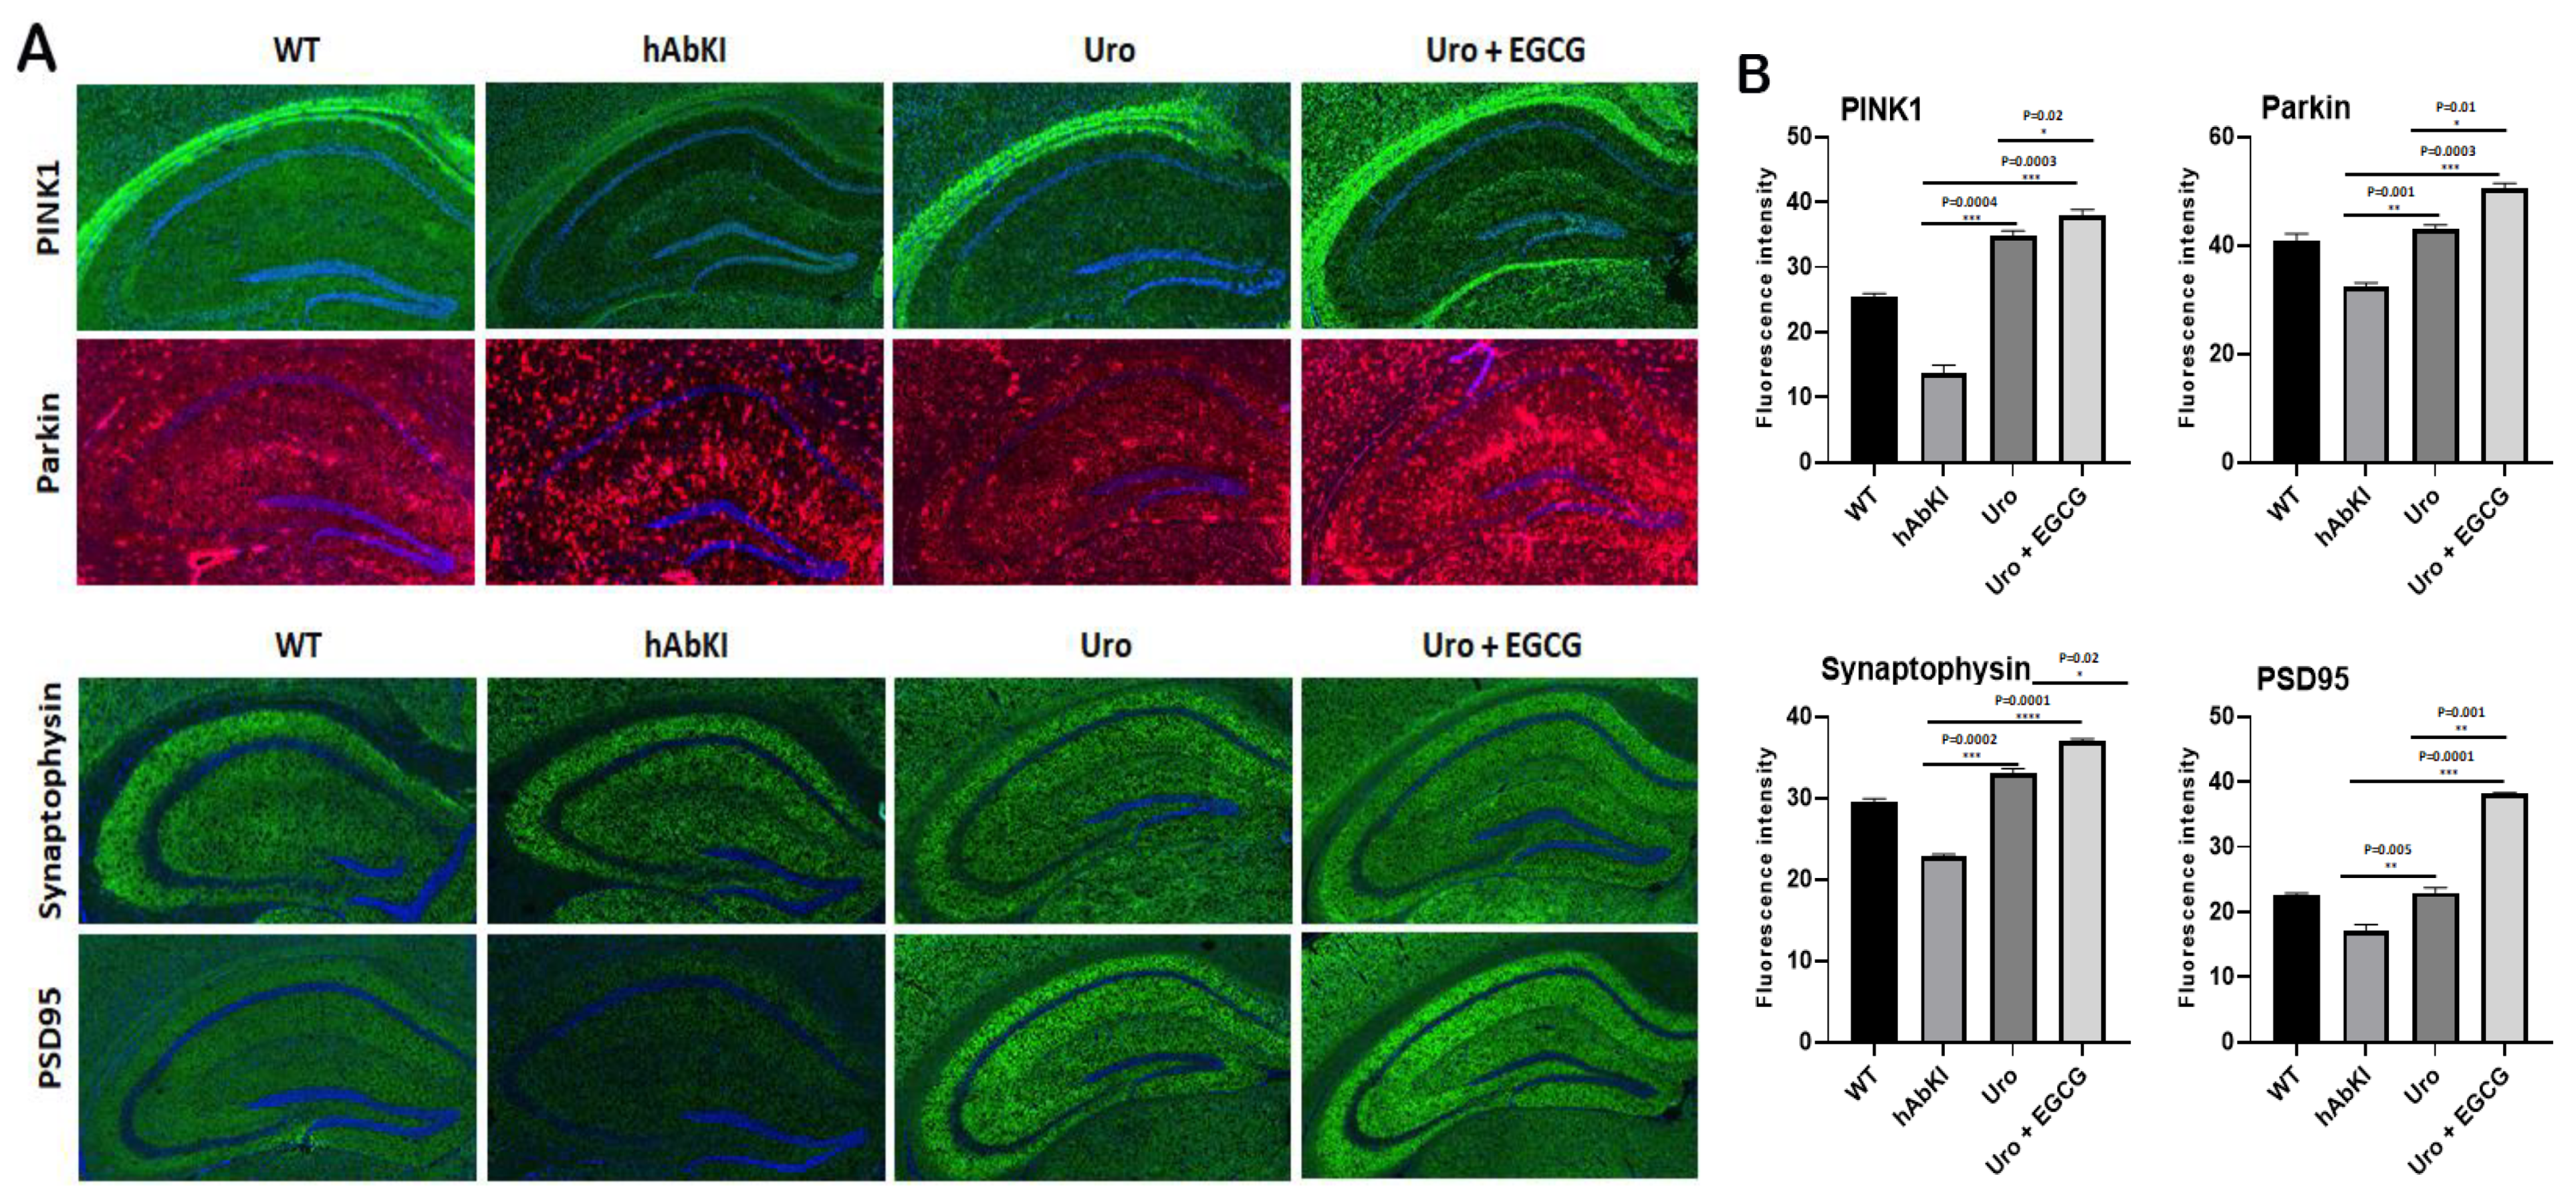
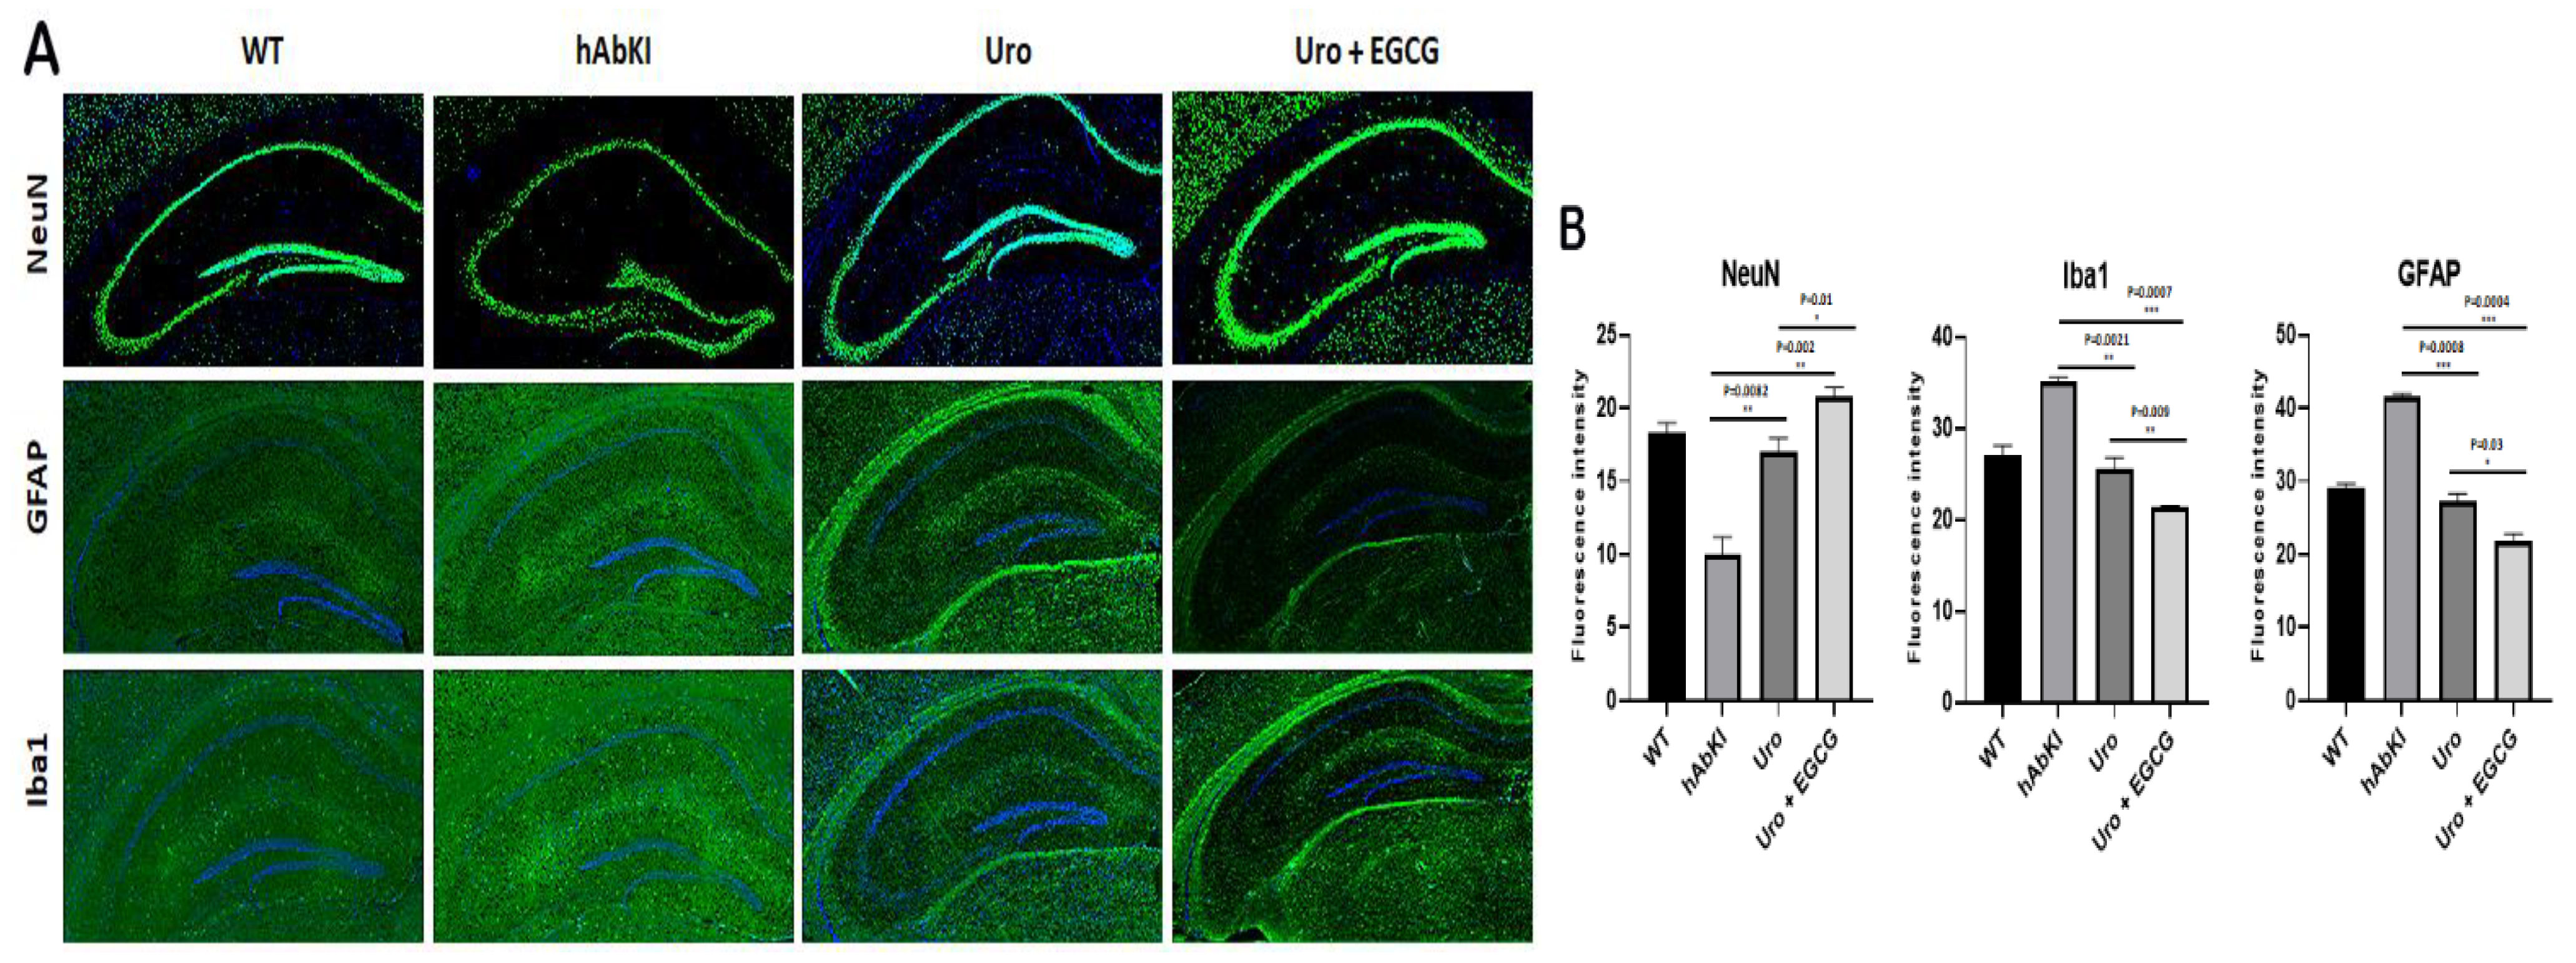
3.1.4. Immunofluorescence Analysis

Using hippocampal brain sections from hAbKI mice and urolithin A-treated and urolithin A+EGCG-treated hAbKI mice, we performed immunofluorescence analysis of mitochondrial dynamics, mitochondrial biogenesis, synaptic and inflammatory, and neuronal proteins in order to understand the impact of urolithin A and urolithin A+EGCG treatment in the hippocampus of hAbKI mice.
Mitochondrial dynamics: As shown in Figure 8, immunoreactivities of mitochondrial fission proteins Drp1 (p = 0.007) and Fis1 (p = 0.001) were reduced in urolithin A-treated hAbKI mice relative to untreated hAbKI mice. These reductions were even higher for Drp1 (p = 0.0003) and Fis1 (p = 0.0007) in the combined treatment of urolithin A+EGCG in hAbKI mice. In hAbKI mice treated with urolithin A relative to the combination treatment of urolithin A+EGCG, immunoreactivities of fission proteins Drp1 (p = 0.02) and Fis1 (p = 0.0007) were significantly reduced, indicating that the combination treatment reduces fission activity better than urolithin A alone.
On the contrary, immunoreactivities of fusion proteins were increased (Mfn1 p = 0.0002, Mfn2 p = 0.007 and Opa1 p = 0.001) in urolithin A-treated hAbKI mice and these effects were even higher (Mfn1 p = 0.0001, Mfn2 p = 0.0002 and Opa1 p = 0.0003) in combined treated hAbKI mice (Figure 8). In hAbKI mice treated with urolithin A relative to the combination treatment of urolithin A+EGCG, immunoreactivities of fusion proteins Mfn1 (p = 0.02), Mfn2 (p = 0.02) and Opa1 (p = 0.03) were significantly increased, indicating that combination treatment is better than urolithin A alone for mitochondrial fusion activity.
Mitochondrial biogenesis: As shown in Figure 9, mitochondrial biogenesis (PGC1a p = 0.004, Nrf1 p = 0.004, Nrf2 p = 0.0002) was increased in urolithin A-treated 7-month-old hAbKI mice. As expected, combined treatment showed a higher increase of biogenesis proteins (PGC1a p = 0.0007, Nrf1 p = 0.0002, Nrf2 p = 0.0001 and TFAM p = 0.002) in the hippocampus of 7-month-old hAbKI mice. In hAbKI mice treated with urolithin A relative to the combination treatment of urolithin A+EGCG, immunoreactivities of mitochondrial biogenesis proteins PGC1a (p = 0.02), Nrf1 (p = 0.03), Nrf2 (p = 0.006) and TFAM (p = 0.02) were significantly increased, indicating that combination treatment is better and stronger than urolithin A alone for mitochondrial biogenesis activity.
Synaptic and mitophagy proteins: Our immunofluorescence analysis revealed that mitophagy proteins (PINK1 p = 0.0004 and Parkin p = 0.001) and synaptic protein synaptophysin (p = 0.0002 and PSD95 p = 0.005) were increased in urolithin A-treated hAbKI mice relative to untreated hAbKI mice (Figure 10A,B). These effects are higher in the combined treatment of urolithin A+EGCG for mitophagy (PINK1 p = 0.0003 and Parkin p = 0.0003) and synaptic proteins (p = 0.0001 and PSD95 p = 0.0001) (Figure 10A,B) in the hippocampus of hAbKI mice. Immunoreactivities of mitophagy proteins PINK1 (p = 0.02), Parkin (p = 0.01) and synaptic proteins synaptophysin (p = 0.02) and PSD95 (p = 0.001) were significantly increased in hAbKI mice treated with urolithin A relative to the combination treatment of urolithin A+EGCG, indicating that combination treatment is better and stronger than urolithin A alone for mitophagy and synaptic activities.
Inflammatory and neuronal proteins: As shown in Figure 11A,B, immunoreactivities of neuronal marker NeuN significantly increased in urolithin A (p = 0.0082) and combined treatment of urolithin A+ EGCG (p = 0.002) in the hippocampus of hAbKI mice. On the other hand, immunoreactivities of microglial marker Iba (p = 0.0008) for urolithin A and urolithin A+EGCG for Iba (p = 0.0004) and astrocytic marker GFAP (p = 0.0008) for urolithin A; urolithin A+EGCG (p = 0.0004) were reduced in urolithin A and combined treatment of urolithin A+EGCG in hAbKI mice. Immunoreactivities of microglial marker Iba1 (p = 0.0007), astrocytic marker GFAP (p = 0.0004) proteins were significantly reduced and neuronal marker NeuN (p = 0.01) significantly increased in hAbKI mice treated with urolithin A relative to combination treatment of urolithin A+EGCG, indicating that the combination treatment is better and stronger than urolithin A alone for mitophagy and synaptic activity.

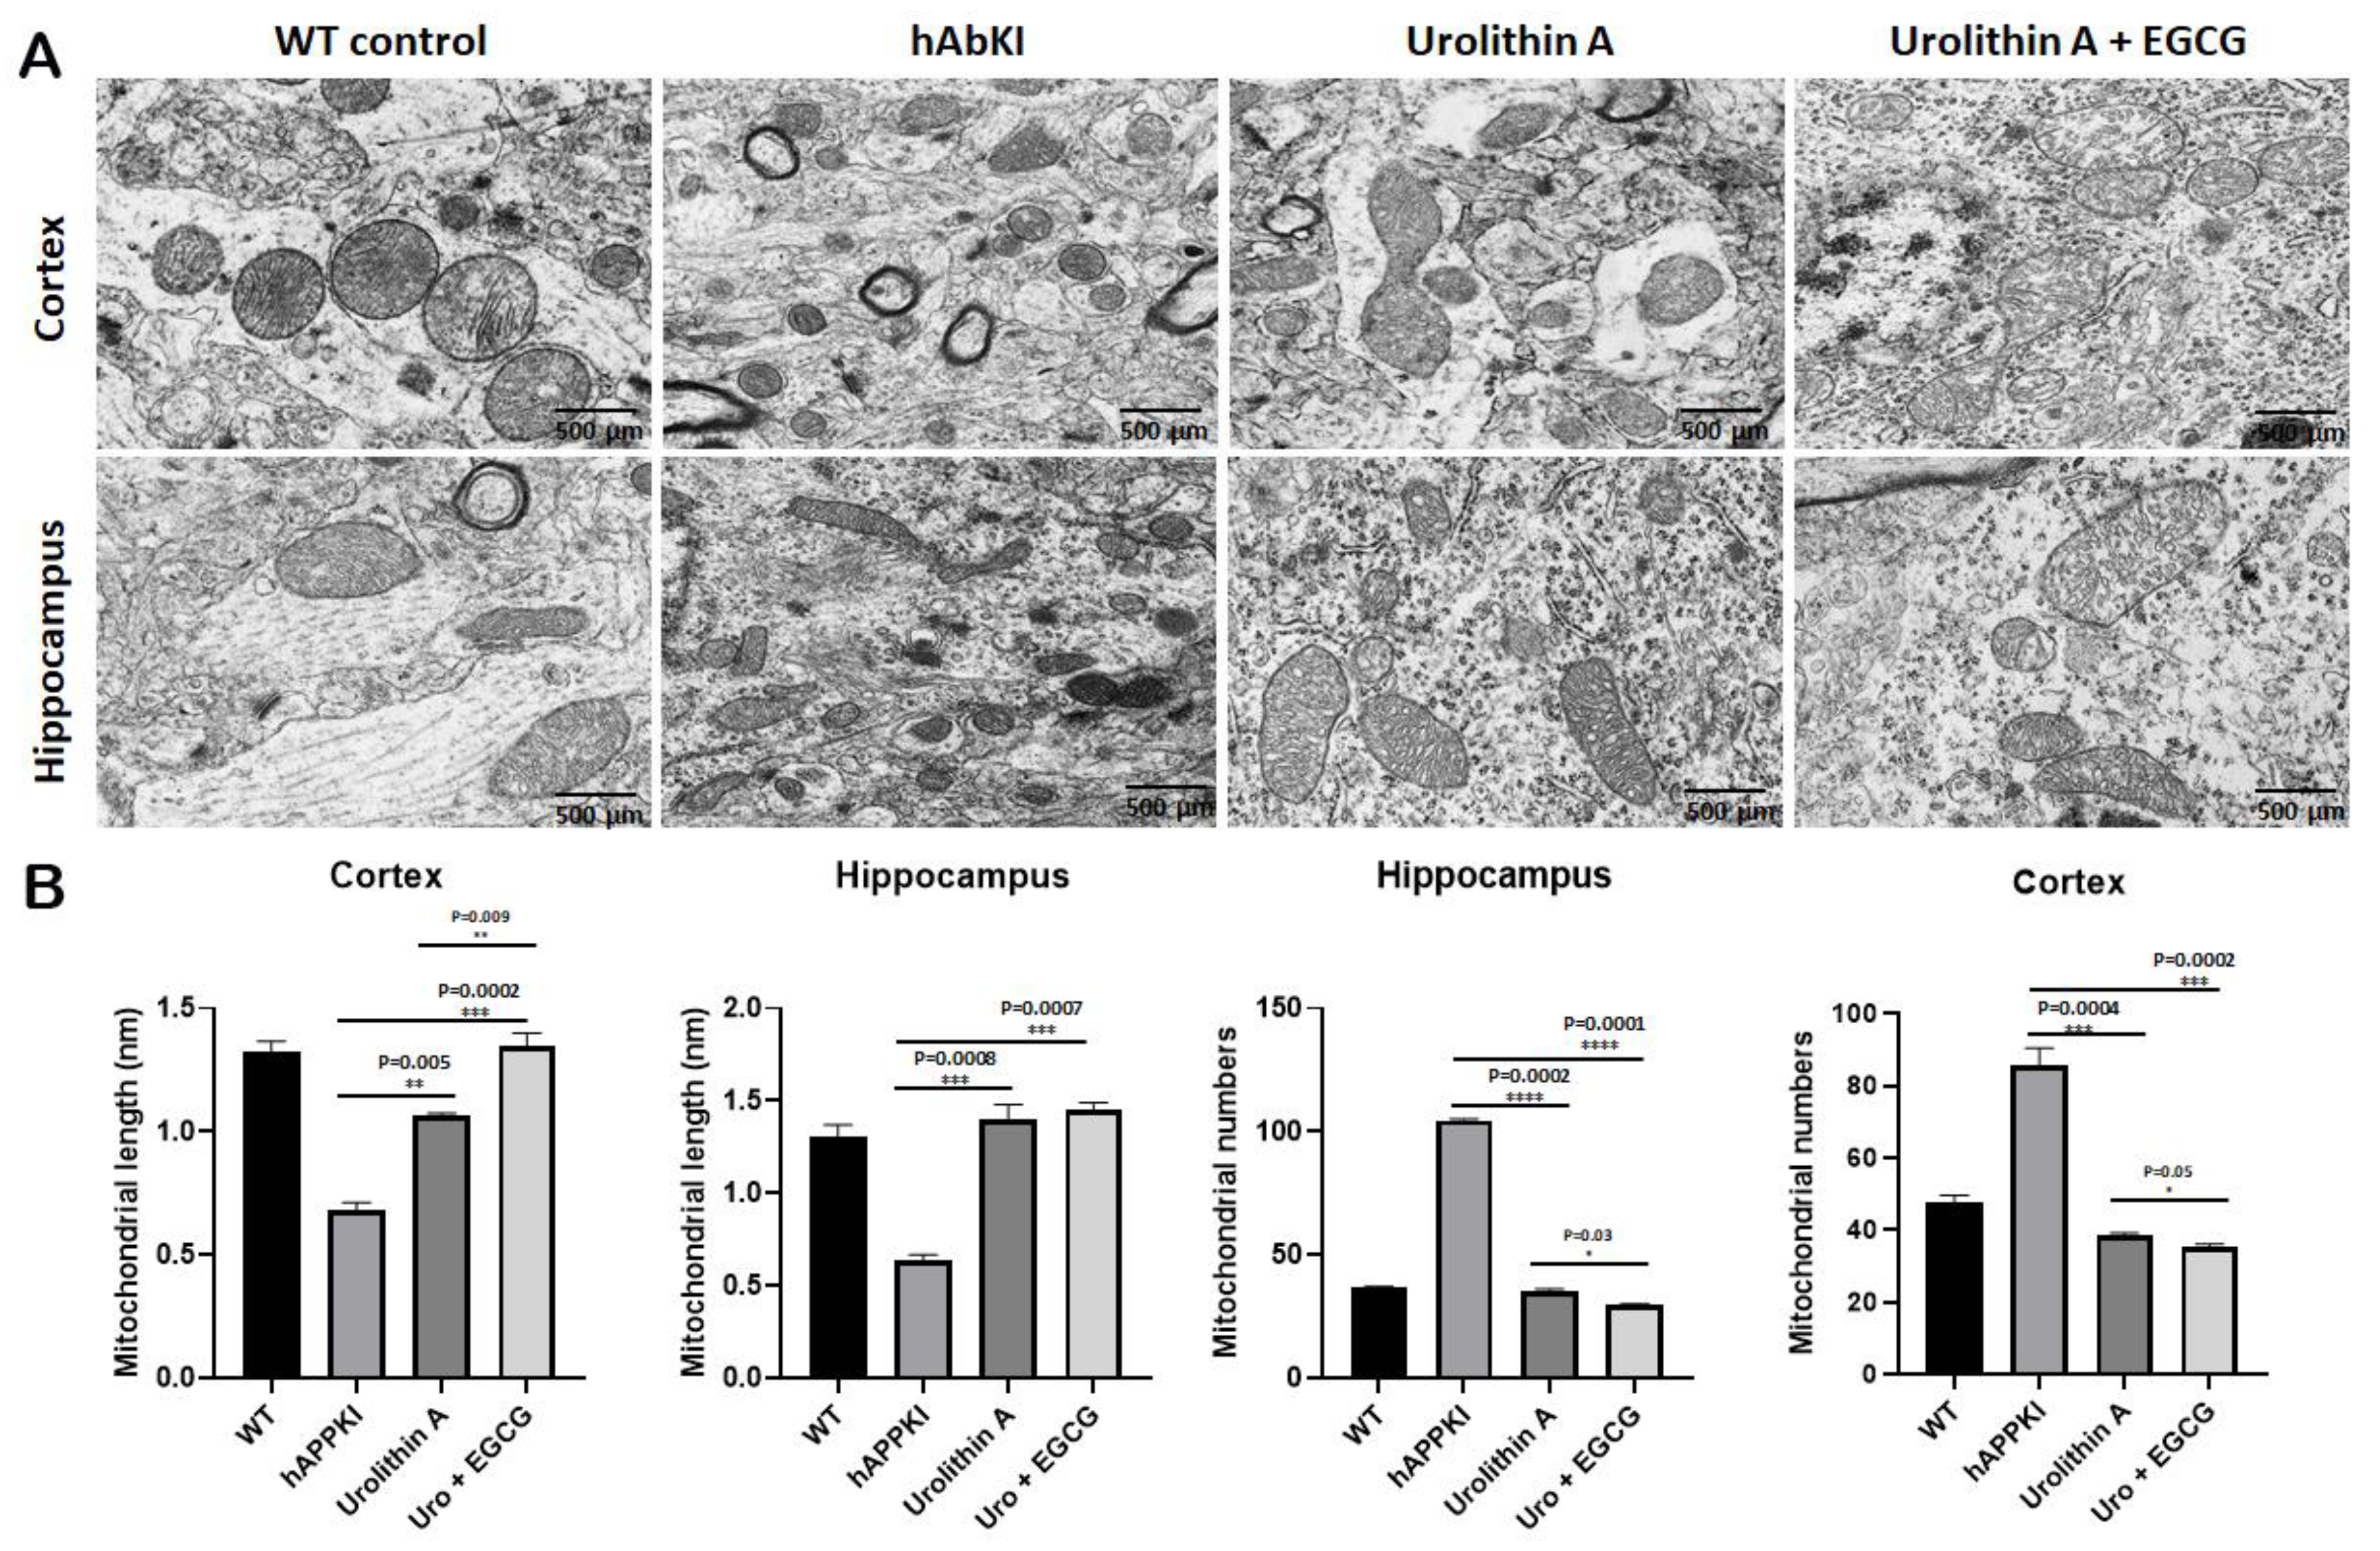
3.1.5. Transmission Electron Microscopy—Mitochondrial Number and Length

To determine mitochondrial morphology, primarily number and length, using cortical and hippocampal tissues from urolithin A and urolithin A+EGCG-treated hAbKI mice and untreated hAbKI mice as controls, we performed transmission electron microscopy. As shown in Figure 12, we found mitochondrial number is significantly reduced in the hippocampus for urolithin A (p = 0.0002) and urolithin A+EGCG (p = 0.0001) and cerebral cortex for urolithin A (p = 0.0004) and urolithin A+EGCG (p = 0.0002) treated hAbKI mice relative to untreated hAbKI mice. Mitochondrial length significantly increased in the hippocampus for urolithin A (p = 0.0008) and for urolithin A+EGCG (p = 0.0007) and cerebral cortex for urolithin A (p = 0.005) and for urolithin A+EGCG (p = 0.0002) treated hAbKI mice relative to untreated hAbKI mice. In hAbKI mice treated with urolithin A, compared to the combination treatment of urolithin A+EGCG, the mitochondrial number was significantly reduced in the hippocampus (p = 0001), the cerebral cortex (p = 0.0002) and the mitochondrial length significantly increased in the cerebral cortex (p = 0.009), indicating that the combination treatment is better and stronger than urolithin A.

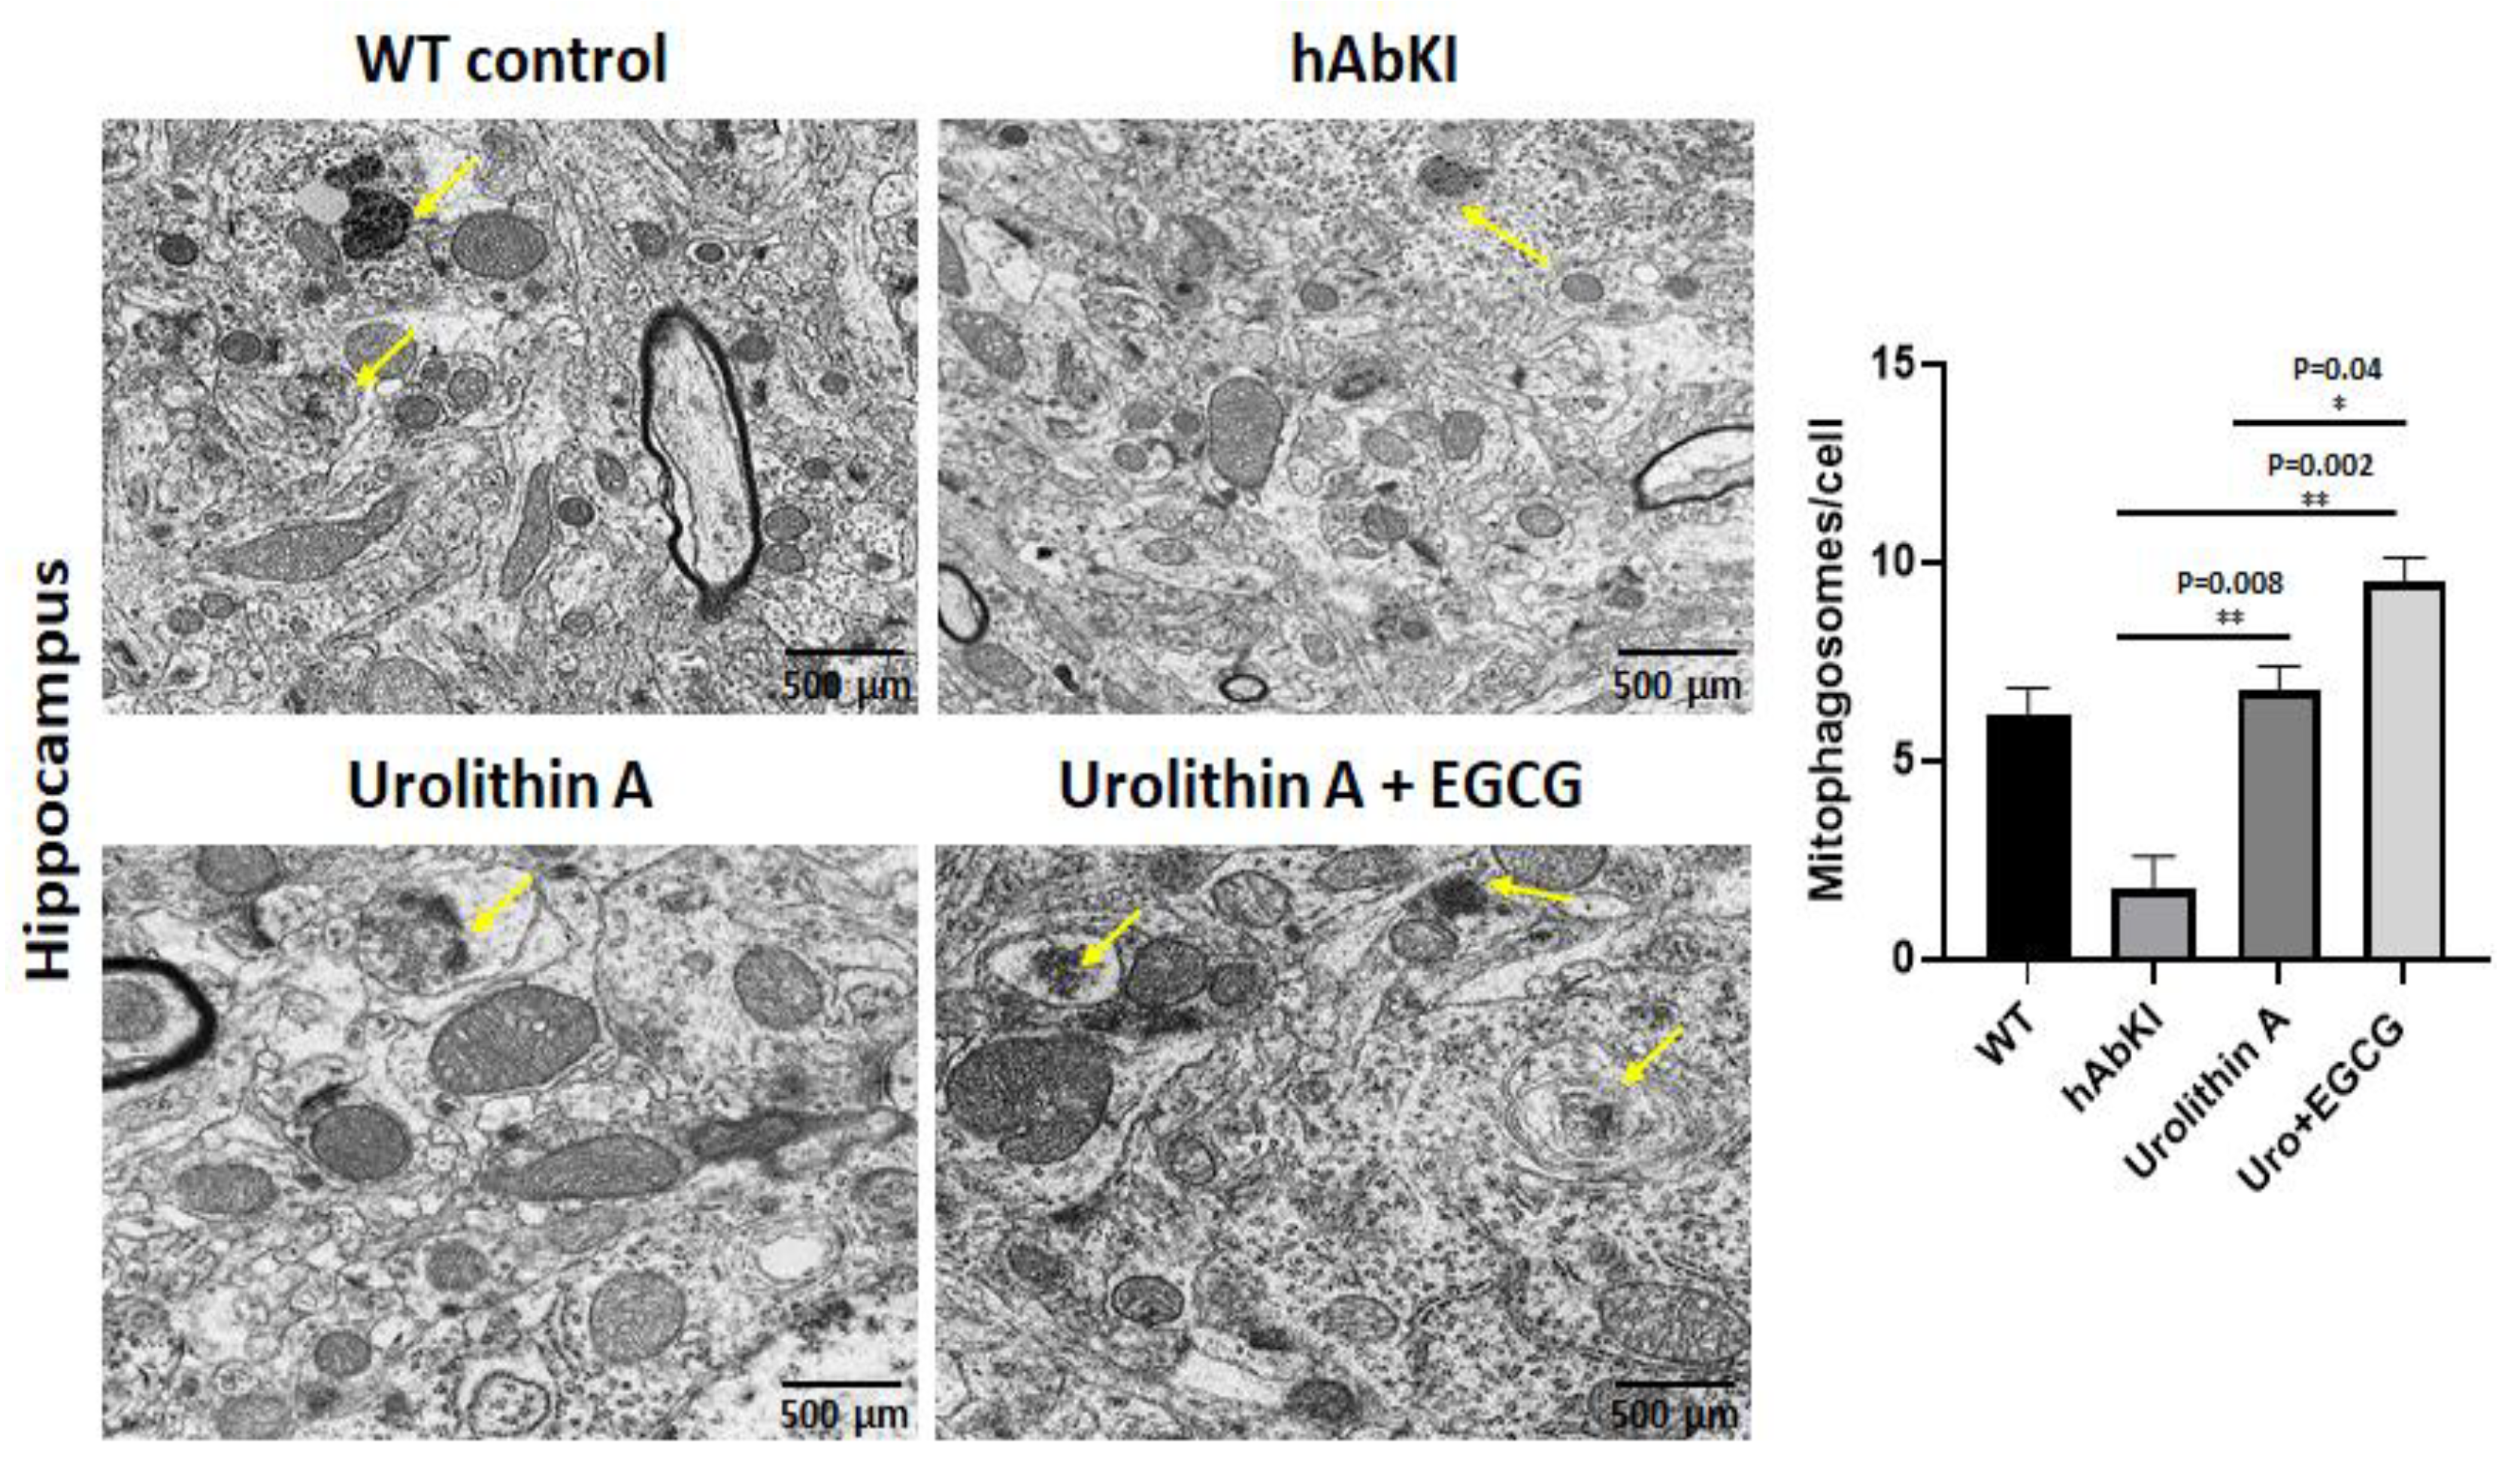
3.1.6. Transmission Electron Microscopy—Mitophagosomal Formations

To determine the mitophagy activity in hippocampal tissues from urolithin A and urolithin A+EGCG-treated hAbKI mice and untreated hAbKI mice as controls, we performed transmission electron microscopy and counted the number of mitophagosomal formations (Figure 13). Mitophagosomal formations were significantly increased in urolithin (p = 0.008) and combined treatment of urolithin A+EGCG (p = 0.002) in hAbKI mice. Comparative analysis between urolith A and combined treatment of urolithin A+EGCG revealed significantly increased mitophagosomal formations in combined treatment than urolithin A (Figure 13). These observations strongly suggest that combined treatment is effective and stronger than a single treatment for mitophagy activity.

3.1.7. Mitochondrial Function

To determine the impact of urolithin A and urolithin A+EGCG treatment on mitochondrial function in hAbKI mice, we assessed free radical production (hydrogen peroxide), lipid peroxidation (4-hydroxy-nonenols) and mitochondrial ATP using cortical tissues from urolithin A and urolithin A+EGCG-treated hAbKI mice relative to untreated hAbKI mice.
Hydrogen peroxide: As shown in Figure 14C, we found hydrogen peroxide levels were reduced in urolithin A (p = 0.0008) and urolithin A+EGCG (p = 0.0004) treated hAbKI mice relative to untreated mice. In hAbKI mice treated with urolithin A compared to the combination treatment of urolithin A+EGCG, the hydrogen peroxide levels were significantly reduced (p = 0.006), indicating that urolithin A and EGCG act as free radical scavengers in hAbKI mice, and combined treatment showed a stronger scavenging property.
Lipid peroxidation: As shown in Figure 14A, 4-hydroxy-nonenols (lipid peroxidation) were also significantly reduced in urolithin A (p = 0.0003) and urolithin A+EGCG (p = 0.0002) treated hAbKI mice relative to untreated hAbKI mice. In hAbKI mice treated with urolithin A compared to the combination treatment of urolithin A+EGCG, the lipid peroxide levels were significantly reduced (p = 0.03).
Mitochondrial ATP: As shown in Figure 14B, mitochondrial ATP levels were increased in urolithin A (p = 0.007) and urolithin A+EGCG (p = 0.0002) treated hAbKI mice relative to hAbKI untreated mice. In hAbKI mice treated with urolithin A compared to the combination treatment of urolithin A+EGCG, the ATP levels were significantly increased (p = 0.009).
Indicating that urolithin A and urolithin A+EGCG boost mitochondrial ATP.
Overall, these observations indicate that mitochondrial function is enhanced in urolithin A-treated hAbKI mice, and this enhancement is higher in combined treatment.

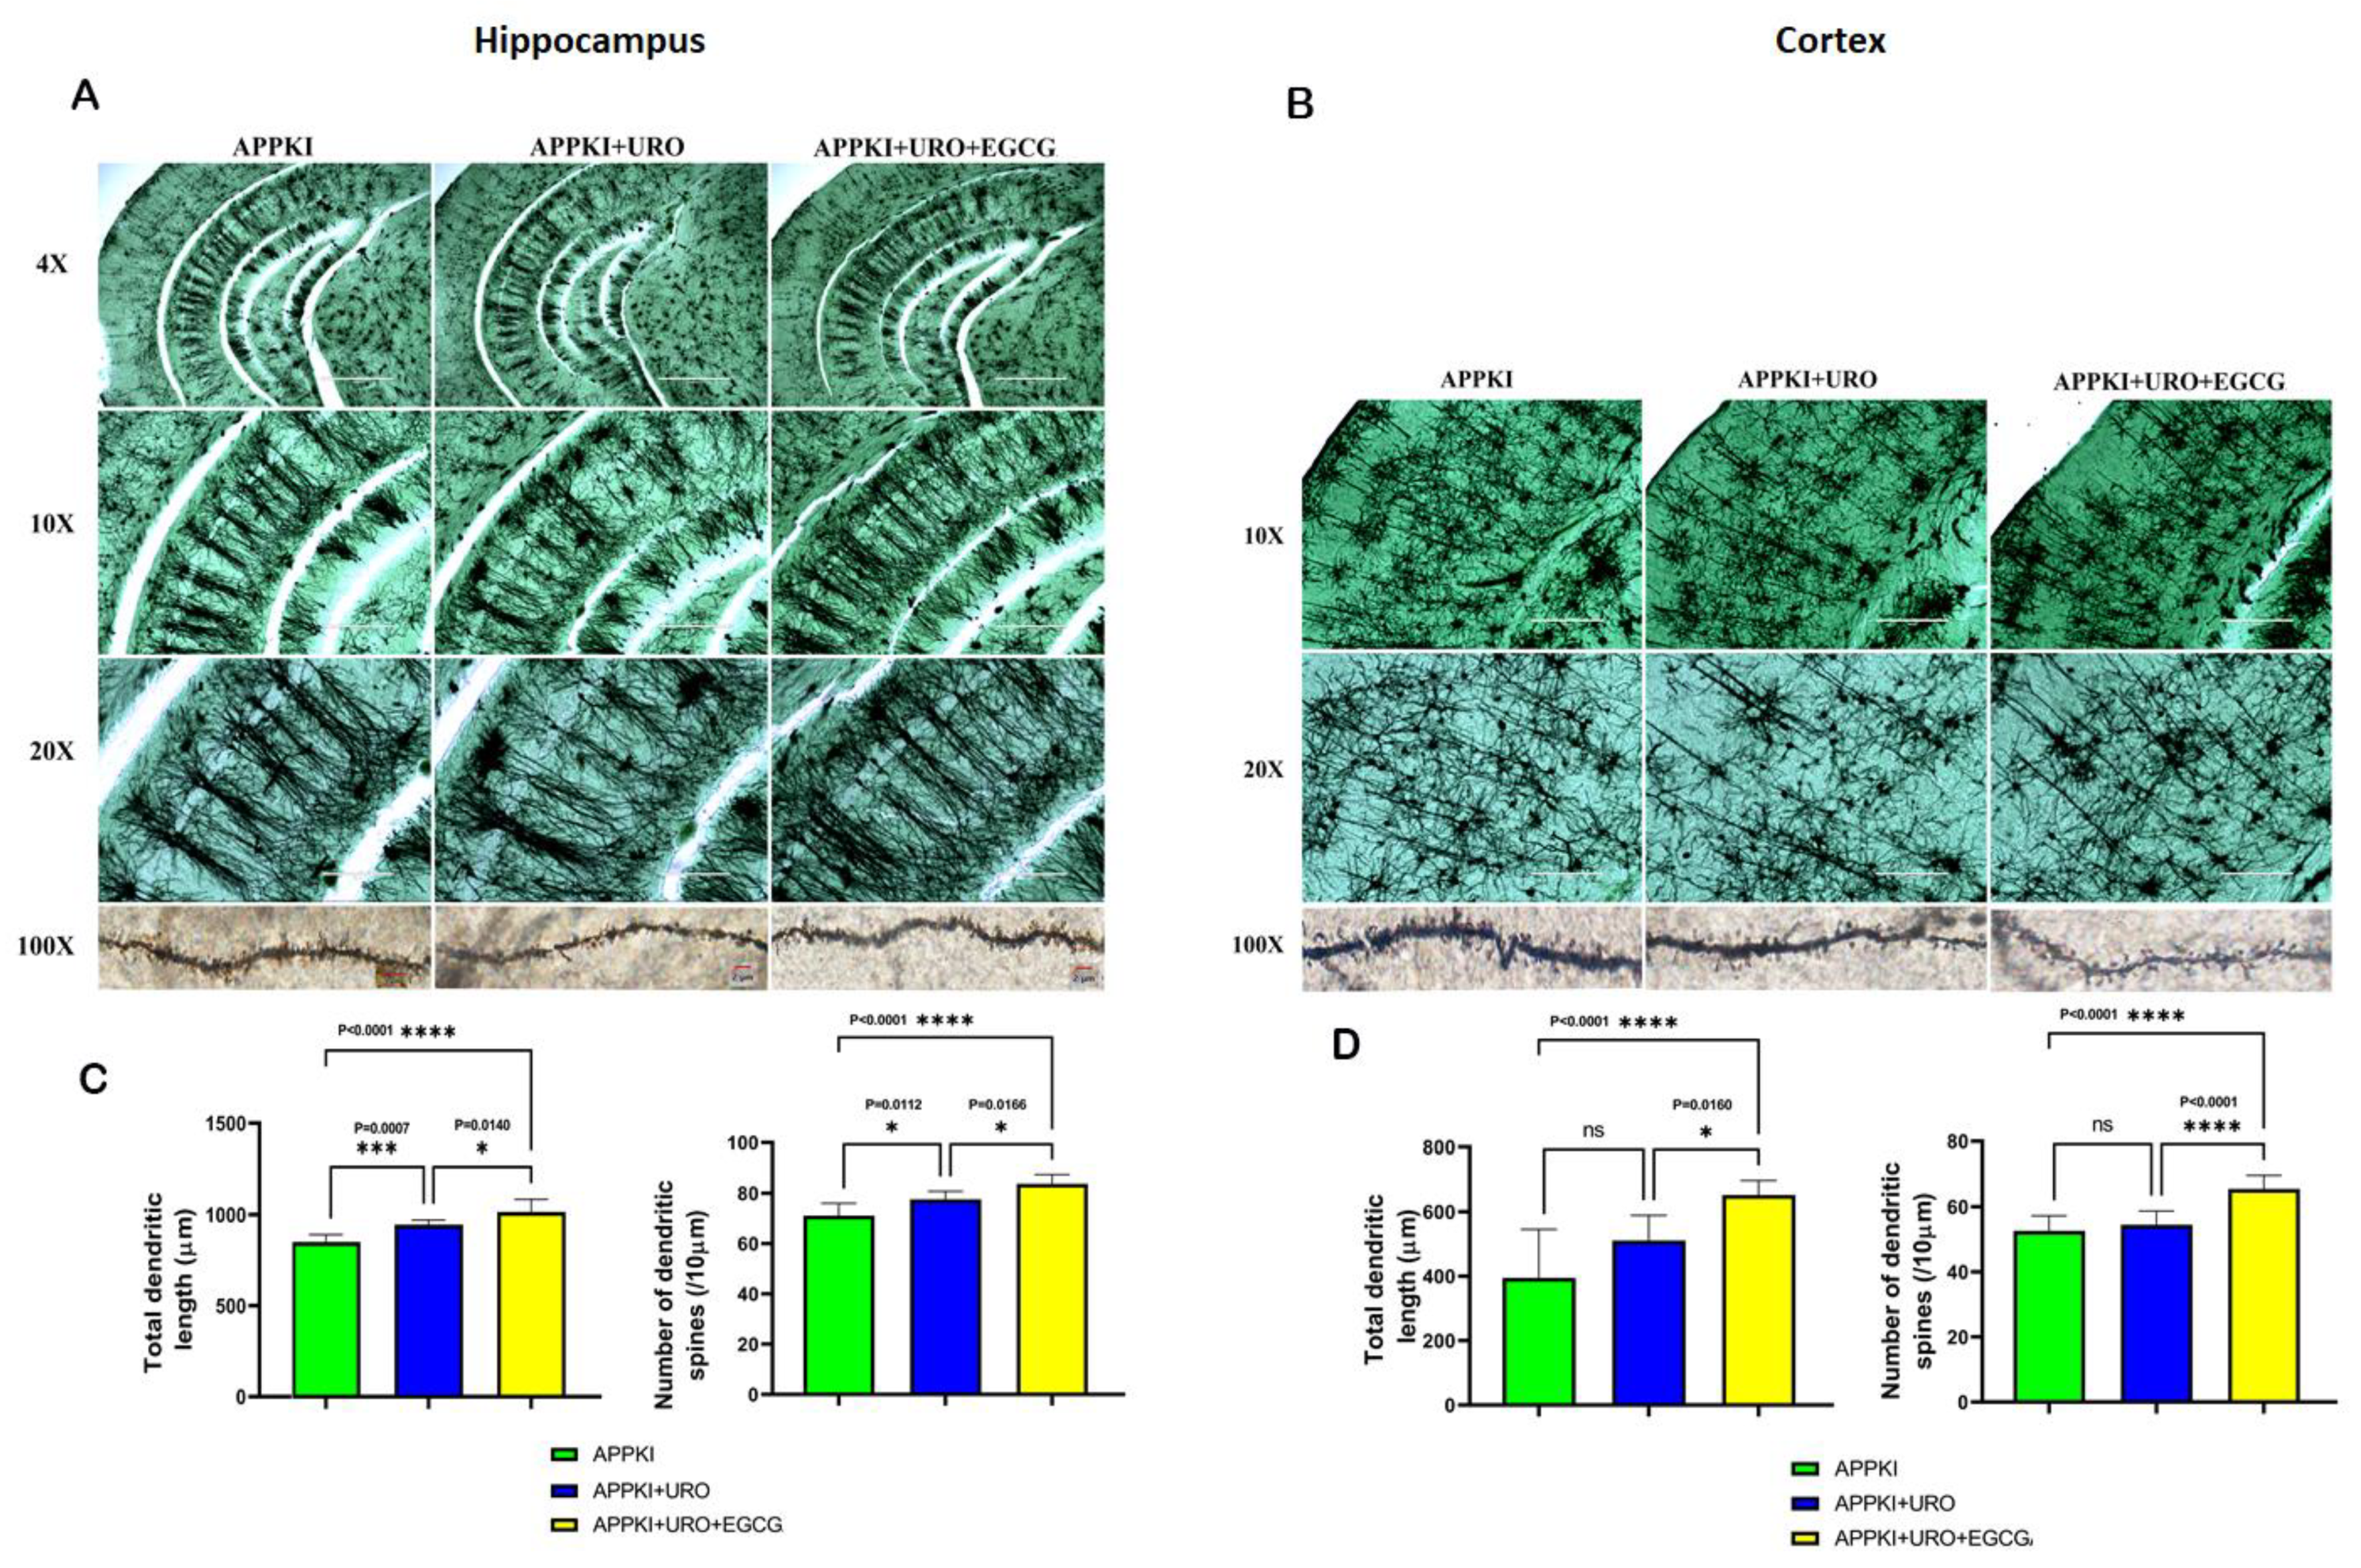
3.1.8. Golgi–Cox Staining and Dendritic Spines

To determine the impact of urolithin A and urolithin A+EGCG, we conducted Golgi–Cox staining analysis and assessed dendritic length and number in hippocampal and cortical tissues from brain tissues from urolithin A and urolithin A+EGCG-treated hAbKI mice and also untreated hAbKI mice.
Dendritic Number: As shown in Figure 15, we found an increased number of dendrites in the hippocampi of urolithin A (p = 0.0112) and urolithin A+EGCG-treated hAbKI mice relative to untreated hAbKI mice. We also found a significantly increased number of dendrites in the cortices of urolithin A+EGCG-treated hAbKI mice (p < 0.0001) relative to untreated hAbKI mice. We found an increased number of dendrites in the cortices of urolithin A-treated hAbKI mice, but not significant. These observations strongly suggest that combined treatment is more effective and stronger than single drug treatment.
Dendritic Length: Dendritic length was significantly increased in the hippocampi (p = 0.0007) of urolithin A-treated hAbKI mice relative to untreated mice (Figure 15). Significance was higher in urolithin A+EGCG-treated the hippocampi (p = 0.0001) and cerebral cortices (p < 0.0001) of hAbKI mice. These observations suggest that dendritic length is positively impacted in combined treatment rather than in single drug treatment.

3.1.9. Amyloid Beta Levels

To understand the impact of urolithin A and urolithin A+EGCG, we measured Aβ40 and 42 levels in the cerebral cortices of urolithin A and urolithin A+EGCG-treated hAbKI mice relative to untreated mice. As shown in Figure 16, both Aβ40 (p = 0.001) and Aβ42 (p = 0.04) levels were significantly reduced in urolithin A-treated hAbKI mice relative to untreated mice. Similar results were found in urolithin A+EGCG-treated hAbKI mice for Aβ40 (p = 0.0008) and Aβ42 (p = 0.02). In hAbKI mice treated with urolithin A compared to the combination treatment of urolithin A+EGCG, both Aβ40 (p = 0.05) and Aβ42 (p = 0.01) were significantly reduced. These observations strongly suggest that combined treatment is effective and stronger in reducing both Aβ40 and Aβ42 levels.

4. Discussion

The overall objectives of our study are to determine the protective effects of (1) the mitophagy enhancer urolithin A and (2) a combination treatment of urolithin A+green tea extract EGCG in humanized amyloid beta knockin mice that represent late-onset Alzheimer’s disease. Using a Seahorse Bioanalyzer, we assessed mitochondrial respiration in mutant APPHT22 cells treated with urolithin A, EGCG and a combination treatment of urolithin A+EGCG. Seahorse Bioanalyzer data revealed that (1) combined treatment is better than single drug treatment and (2) urolithin A showed stronger protective effects than EGCG against mutant APP/Aβ-induced toxicities. In the drug discovery field, Seahorse Bioanalyzer analysis is widely accepted to determine mitochondrial respiration, bioenergetics and cellular homeostasis. With this rationale, we decided to treat hAbKI mice with urolithin A and urolithin A+EGCG. Our study is the first to investigate (1) the combined treatment of urolithin A+EGCG and (2) studies conducted in the late-onset AD mouse model, hAbKI mice.
A recent behavioral study of 7-month-old hAbKI mice revealed defects in motor coordination, locomotor activity, spatial and learning/working memory [41]. Our current study findings of the behavioral phenotype are improved in urolithin A and a combination of urolithin A+EGCG-treated hAbKI mice; however, protective effects are stronger in combination treatment. Defective motor coordination, abnormal locomotion and exploratory behavior, reduced learning and memory and working memory, in addition to anxiety behaviors, are extensively reported in AD patients (49). Our study phenotypic observations of hAbKI mice treated and untreated with urolithin A and the combination treatment of urolithin A+EGCG are close to humans with AD.
Using hAbKI mice, for the first time, mitochondrial function (lipid peroxidation-4-hydroxy-nonenol and free radicals-hydrogen peroxide and mitochondrial ATP) was assessed in urolithin A and urolithin A+EGCG-treated hAbKI mice. Increased mitochondrial ATP and reduced lipid peroxidation and free radicals were found in hAbKI mice, and the effect was stronger in combined treatment, in late-onset AD. Using Golgi–Cox staining, the current study assessed dendritic spines and their lengths in urolithin A and urolithin A+EGCG-treated hAbKI mice. Significantly increased dendritic spines and their lengths were observed in urolithin A and urolithin A+EGCG-treated hAbKI mice, and the effect was higher in the combined treatment of urolithin A and urolithin A+EGCG, strongly indicating factors associated with dendritic spines are positively impacted in late-onset AD mice. Ultrastructural analysis using transmission electron microscopy in urolithin A and urolithin A+EGCG-treated hAbKI mice revealed that fragmented mitochondria are fewer in number and mitochondrial length is increased, and more importantly, increased mitophagosomal formations in urolithin A and urolithin A+EGCG-treated hAbKI mice; however, combined treatment is effective and stronger, meaning damaged mitochondria are actively removed from the cells with increased autosomal formations compared to single drug treatment. Soluble Aβ40 and Aβ42 levels were reduced in both treatment groups of mice; however, the reduction was higher for combined treatment, indicating that combined treatment is more effective than single drug treatment in the late-onset AD mouse model, hAbKI mice.
Our observations of urolithin A treatment in hAbKI mice agree with previous study findings of APP/PS1 by Gong et al. 2019 [33] and Fang et al. 2019 [32], in which urolithin A enhances cognitive behavior and reduces Aβ pathology.
Furthermore, the earlier individual in vitro and in vivo studies of urolithin A (28–33) and EGCG (34–40) in AD and other neurological conditions have shown increased beneficial effects, meaning enhanced mRNA and protein levels of mitophagy/autophagy, synaptic genes and reduced inflammation and Aβ levels. These observations agree with our prior in vitro [28,29] and current study findings.
It is worth noting that we observed improved behavioral phenotypes in our current study, primarily due to effective removal of dead or dying mitochondria, as evidenced by significantly increased mitophagosomal formations in urolithin A and combined treatment of urolithin A+EGCG. Combined treatment did show higher removal of dead or dying mitochondria than single drug treatment, urolithin A. The other lines of evidence, such as mRNA, protein and immunofluorescence data of mitochondrial biogenesis, dynamics, synaptic and autophagy/mitophagy and mitochondrial functions, support our hypothesis that ‘enhanced mitophagy in combined treatment is more effective than single drug treatment for AD’. Continuous removal of dead or dying mitochondria is the key factor to reduce Aβ-induced toxicities, including mitochondrial, synaptic and inflammatory responses in the brain, particularly in AD-affected regions. Further, Aβ(40 and 42) levels were also significantly reduced in both urolithin A and the combined treatment of urolithin A+EGCG in hAbKI mice, but the effect was much stronger in the combined treatment. Furthermore, both urolithin A and EGCG are reported to cross the blood–brain barrier. Therefore, we propose that combined treatment is good for human clinical trials of urolithin A and EGCG.
Limitations: Our study findings are mainly from an early stage of late-onset AD mice. It is important to study the beneficial effects of urolithin A and the combined treatment of urolithin A+EGCG in the late-stage disease process (20 months of age) in hAbKI mice. Further, it is equally important to assess the beneficial effects of urolithin A, EGCG and combination treatments in different stages of early-onset familial AD mice such as APP/PS1 and/or 5XFAD. In addition, it is important to study different age groups of transgenic Tau mice, which represent another major pathological hallmark of AD.
Conclusions: For the first time, our current study findings of the late-onset AD mouse model, hAbKI mice revealed (1) ameliorated behavioral impairments, (2) improved mitochondrial and synaptic activity, enhanced mitophagy/autophagy and increased mitophagosomal formations, (3) dendritic activities and (4) enhanced mitochondrial function. These positive effects occurred because of multiple factors, including anti-amyloid, anti-inflammatory, antioxidant, anti-aging, increased synaptic sprouting and enhanced mitophagy and autophagy properties of urolithin A and EGCG. Overall, current study observations strongly suggest that combined treatment of urolithin A+EGCG is a promising approach to treat mild cognitive impaired subjects and early AD patients.

Author Contributions

S.K. (Sudhir Kshirsagar) and P.H.R. contributed to the conceptualization and formatting of the article. S.K (Sudhir Kshirsagar), and R.V.A., J.A.P., A.H., M.V., B.R., S.K. (Subodh Kumar), conducted experiments and S.K. (Sudhir Kshirsagar). A.P.R. and P.H.R. are responsible for writing, original draft preparation and finalization of the manuscript. A.P.R., S.K. (Subodh Kumar) and P.H.R. is responsible for funding acquisition. All authors have read and agreed to the published version of the manuscript.

Funding

The research presented in this article was supported by NIH grants AG042178, AG047812, NS205473, AG060767, AG069333 and AG066347 (to P.H.R.), Alzheimer’s Association through a SAGA grant, Garrison Family Foundation Grant and NIH grants AG063162 and AG071560 (to A.P.R.) and K99AG065645 (S.K.-Subodh Kumar).

Institutional Review Board Statement

All experimental protocols were approved by Texas Tech University Health Sciences Center, Institutional Animal Care and Use Committee (TTUHSC-IACUC), protocol number 14024.

Informed Consent Statement

All authors have agreed to publish the contents of the article.

Data Availability Statement

Not applicable.

Conflicts of Interest

The authors declare no conflict of interest.

Abbreviations

AAALACAccreditation of laboratory animal care international
ABADAmyloid beta induced alcohol dehydrogenase
ADAlzheimer’s disease
APPAmyloid beta precursor protein
Amyloid beta
BBBBlood–brain barrier
CHOChinese hamster ovary
CypDCyclophilin D
Drp1Dynamin-related protein 1
EGCGEgpigallocatechin gallate
Fis1Fission 1
hAbKIHumanized homozygous amyloid beta knockin
IL-1βInterleukin 1 beta
IL-6Interleukin 6
Mfn1Mitochondrial fusion 1
Mfn2Mitochondrial fusion 2
Nrf1Nuclear transcription factor 1
Nrf2Nuclear transcription factor 2
Opa1Optic atrophy 1
p-TauPhosphorylated tau
PGC1aPeroxisome proliferation-activated receptor gamma coactivator 1-alpha
PINK1PTEN-induced kinase 1
PPARγPeroxisome proliferator-activated receptor gamma
PS1Presinilin 1
PS2Presinilin 2
TNFαTumor necrosis factor alpha
VDAC1Voltage-dependent anion channel 1

References

  1. Selkoe, D.J. Alzheimer’s disease: Genes, proteins, and therapy. Physiol. Rev. 2001, 81, 741–766. [Google Scholar] [CrossRef] [PubMed]
  2. John, A.; Reddy, P.H. Synaptic basis of Alzheimer’s disease: Focus on synaptic amyloid beta, P-tau and mitochondria. Ageing Res. Rev. 2021, 65, 101208. [Google Scholar] [CrossRef] [PubMed]
  3. Reddy, P.H.; Manczak, M.; Mao, P.; Calkins, M.J.; Reddy, A.P.; Shirendeb, U. Amyloid-beta and mitochondria in aging and Alzheimer’s disease: Implications for synaptic damage and cognitive decline. J. Alzheimer’s Dis. 2010, 20, S499–S512. [Google Scholar] [CrossRef]
  4. Oliver, D.M.A.; Reddy, P.H. Molecular Basis of Alzheimer’s Disease: Focus on Mitochondria. J. Alzheimer’s Dis. 2019, 72, S95–S116. [Google Scholar] [CrossRef] [PubMed]
  5. Morton, H.; Kshirsagar, S.; Orlov, E.; Bunquin, L.E.; Sawant, N.; Boleng, L.; George, M.; Basu, T.; Ramasubramanian, B.; Pradeepkiran, J.A.; et al. Defective mitophagy and synaptic degeneration in Alzheimer’s disease: Focus on aging, mitochondria and synapse. Free Radic. Biol. Med. 2021, 172, 652–667. [Google Scholar] [CrossRef]
  6. Wang, W.; Zhao, F.; Ma, X.; Perry, G.; Zhu, X. Mitochondria dysfunction in the pathogenesis of Alzheimer’s disease: Recent advances. Mol. Neurodegener. 2020, 15, 30. [Google Scholar] [CrossRef]
  7. Pradeepkiran, J.A.; Reddy, P.H. Defective mitophagy in Alzheimer’s disease. Ageing Res. Rev. 2020, 64, 101191. [Google Scholar] [CrossRef]
  8. Mattson, M.P. Pathways towards and away from Alzheimer’s disease. Nature 2004, 430, 631–639. [Google Scholar] [CrossRef]
  9. Swerdlow, R.H.; Burns, J.M.; Khan, S.M. The Alzheimer’s disease mitochondrial cascade hypothesis: Progress and perspectives. Biochim. Biophys. Acta 2014, 1842, 1219–1231. [Google Scholar] [CrossRef]
  10. Reddy, P.H.; Manczak, M.; Kandimalla, R. Mitochondria-targeted small molecule SS31: A potential candidate for the treatment of Alzheimer’s disease. Hum. Mol. Genet. 2017, 26, 1597. [Google Scholar] [CrossRef] [Green Version]
  11. Reddy, P.H.; McWeeney, S. Mapping cellular transcriptosomes in autopsied Alzheimer’s disease subjects and relevant animal models. Neurobiol. Aging. 2006, 8, 1060–1077. [Google Scholar] [CrossRef] [PubMed]
  12. Reddy, P.H.; Tripathi, R.; Troung, Q.; Tirumala, K.; Reddy, T.P.; Anekonda, V.; Shirendeb, U.P.; Calkins, M.J.; Reddy, A.P.; Mao, P.; et al. Abnormal mitochondrial dynamics and synaptic degeneration as early events in Alzheimer’s disease: Implications to mitochondria-targeted antioxidant therapeutics. Biochim. Biophys. Acta. 2012, 1822, 639–649. [Google Scholar] [CrossRef] [PubMed]
  13. Hirai, K.; Aliev, G.; Nunomura, A.; Fujioka, H.; Russell, R.L.; Atwood, C.S.; Johnson, A.B.; Kress, Y.; Vinters, H.V.; Tabaton, M.; et al. Mitochondrial Abnormalities in Alzheimer’s Disease. J. Neurosci. 2001, 21, 3017–3023. [Google Scholar] [CrossRef] [PubMed]
  14. Swerdlow, R.H.; Khan, S.M. The Alzheimer’s disease mitochondrial cascade hypothesis: An update. Exp. Neuro. 2009, 218, 308–315. [Google Scholar] [CrossRef]
  15. Silva, D.F.; Selfridge, J.E.; Lu, J.; E, L.; Roy, N.; Hutfles, L.; Burns, J.M.; Michaelis, E.K.; Yan, S.; Cardoso, S.M.; et al. Bioenergetic flux, mitochondrial mass and mitochondrial morphology dynamics in AD and MCI cybrid cell lines. Hum. Mol. Genet. 2013, 22, 3931–3946. [Google Scholar] [CrossRef]
  16. Wang, X.; Su, B.; Lee, H.G.; Li, X.; Perry, G.; Smith, M.A.; Zhu, X. Impaired balance of mitochondrial fission and fusion in Alzheimer’s disease. J. Neurosci. 2009, 29, 9090–9103. [Google Scholar] [CrossRef]
  17. Wang, X.; Su, B.; Siedlak, S.L.; Moreira, P.I.; Fujioka, H.; Wang, Y.; Casadesus, G.; Zhu, X. Amyloid-beta overproduction causes abnormal mitochondrial dynamics via differential modulation of mitochondrial fission/fusion proteins. Proc. Natl. Acad. Sci. USA 2008, 105, 19318–19323. [Google Scholar] [CrossRef]
  18. Manczak, M.; Calkins, M.J.; Reddy, P.H. Impaired mitochondrial dynamics and abnormal interaction of amyloid beta with mitochondrial protein Drp1 in neurons from patients with Alzheimer’s disease: Implications for neuronal damage. Hum. Mol. Genet. 2011, 20, 2495–2509. [Google Scholar] [CrossRef]
  19. Manczak, M.; Reddy, P.H. Abnormal interaction between the mitochondrial fission protein Drp1 and hyperphosphorylated tau in Alzheimer’s disease neurons: Implications for mitochondrial dysfunction and neuronal damage. Hum. Mol. Genet. 2012, 21, 2538–2547. [Google Scholar] [CrossRef]
  20. Manczak, M.; Reddy, P.H. Abnormal interaction of VDAC1 with amyloid beta and phosphorylated tau causes mitochondrial dysfunction in Alzheimer’s disease. Hum. Mol. Genet. 2012, 21, 5131–5146. [Google Scholar] [CrossRef]
  21. Lustbader, J.W.; Cirilli, M.; Lin, C.; Xu, H.W.; Takuma, K.; Wang, N.; Caspersen, C.; Chen, X.; Pollak, S.; Chaney, M.; et al. ABAD directly links Abeta to mitochondrial toxicity in Alzheimer’s disease. Science 2004, 304, 448–452. [Google Scholar] [CrossRef]
  22. Du, H.; Guo, L.; Fang, F.; Chen, D.; Sosunov, A.A.; McKhann, G.M.; Yan, Y.; Wang, C.; Zhang, H.; Molkentin, J.D.; et al. Cyclophilin D deficiency attenuates mitochondrial and neuronal perturbation and ameliorates learning and memory in Alzheimer’s disease. Nat. Med. 2008, 14, 1097–1105. [Google Scholar] [CrossRef] [PubMed]
  23. Reddy, P.H.; Yin, X.; Manczak, M.; Kumar, S.; Pradeepkiran, J.A.; Vijayan, M.; Reddy, A.P. Mutant APP and amyloid beta-induced defective autophagy, mitophagy, mitochondrial structural and functional changes and synaptic damage in hippocampal neurons from Alzheimer’s disease. Hum. Mol. Genet. 2018, 27, 2502–2516. [Google Scholar] [CrossRef] [PubMed]
  24. Kandimalla, R.; Manczak, M.; Yin, X.; Wang, R.; Reddy, P.H. Hippocampal phosphorylated tau induced cognitive decline, dendritic spine loss and mitochondrial abnormalities in a mouse model of Alzheimer’s disease. Hum. Mol. Genet. 2018, 27, 30–40. [Google Scholar] [CrossRef] [PubMed]
  25. Manczak, M.; Kandimalla, R.; Yin, X.; Reddy, P.H. Hippocampal mutant APP and amyloid beta-induced cognitive decline, dendritic spine loss, defective autophagy, mitophagy and mitochondrial abnormalities in a mouse model of Alzheimer’s disease. Hum. Mol. Genet. 2018, 27, 1332–1342. [Google Scholar] [CrossRef] [PubMed]
  26. Reddy, A.P.; Sawant, N.; Morton, H.; Kshirsagar, S.; Bunquin, L.E.; Yin, X.; Reddy, P.H. Selective serotonin reuptake inhibitor citalopram ameliorates cognitive decline and protects against amyloid beta-induced mitochondrial dynamics, biogenesis, autophagy, mitophagy and synaptic toxicities in a mouse model of Alzheimer’s disease. Hum. Mol. Genet. 2021, 30, 789–810. [Google Scholar] [CrossRef]
  27. Reddy, A.P.; Yin, X.; Sawant, N.; Reddy, P.H. Protective effects of antidepressant citalopram against abnormal APP processing and amyloid beta-induced mitochondrial dynamics, biogenesis, mitophagy and synaptic toxicities in Alzheimer’s disease. Hum. Mol. Genet. 2021, 30, 847–864. [Google Scholar] [CrossRef]
  28. Kshirsagar, S.; Sawant, N.; Morton, H.; Reddy, A.P.; Reddy, P.H. Protective effects of mitophagy enhancers against amyloid beta-induced mitochondrial and synaptic toxicities in Alzheimer disease. Hum. Mol. Genet. 2022, 31, 423–439. [Google Scholar] [CrossRef]
  29. Kshirsagar, S.; Sawant, N.; Morton, H.; Reddy, A.P.; Reddy, P.H. Mitophagy enhancers against phosphorylated Tau-induced mitochondrial and synaptic toxicities in Alzheimer disease. Pharmacol. Res. 2021, 174, 105973. [Google Scholar] [CrossRef]
  30. Reddy, P.H.; Oliver, D.M. Amyloid Beta and Phosphorylated Tau-Induced Defective Autophagy and Mitophagy in Alzheimer’s Disease. Cells 2019, 8, 488. [Google Scholar] [CrossRef] [Green Version]
  31. Manczak, M.; Kandimalla, R.; Yin, X.; Reddy, P.H. Mitochondrial division inhibitor 1 reduces dynamin-related protein 1 and mitochondrial fission activity. Hum. Mol. Genet. 2019, 28, 177–199. [Google Scholar] [CrossRef] [PubMed]
  32. Fang, E.F.; Hou, Y.; Palikaras, K.; Adriaanse, B.A.; Kerr, J.S.; Yang, B.; Lautrup, S.; Hasan-Olive, M.M.; Caponio, D.; Dan, X.; et al. Mitophagy inhibits amyloid-β and tau pathology and reverses cognitive deficits in models of Alzheimer’s disease. Nat. Neurosci. 2019, 22, 401–412. [Google Scholar] [CrossRef] [PubMed]
  33. Gong, Z.; Huang, J.; Xu, B.; Ou, Z.; Zhang, L.; Lin, X.; Ye, X.; Kong, X.; Long, D.; Sun, X.; et al. Urolithin A attenuates memory impairment and neuroinflammation in APP/PS1 mice. J. Neuroinflammation 2019, 16, 62. [Google Scholar] [CrossRef] [PubMed]
  34. Cascella, M.; Bimonte, S.; Muzio, M.R.; Schiavone, V.; Cuomo, A. The efficacy of Epigallocatechin-3-gallate (green tea) in the treatment of Alzheimer’s disease: An overview of pre-clinical studies and translational perspectives in clinical practice. Infect. Agents Cancer 2017, 12, 36. [Google Scholar] [CrossRef]
  35. Wei, Y.; Liu, D.; Zheng, Y.; Hao, C.; Li, H.; Ouyang, W. Neuroprotective Effects of Kinetin Against Glutamate-Induced Oxidative Cytotoxicity in HT22 Cells: Involvement of Nrf2 and Heme Oxygenase-1. Neurotox. Res. 2018, 33, 725–737. [Google Scholar] [CrossRef]
  36. Ehrnhoefer, D.E.; Bieschke, J.; Boeddrich, A.; Herbst, M.; Masino, L.; Lurz, R.; Engemann, S.; Pastore, A.; Wanker, E.E. EGCG redirects amyloidogenic polypeptides into unstructured, off-pathway oligomers. Nat. Struct. Mol. Biol. 2008, 15, 558–566. [Google Scholar] [CrossRef]
  37. Bieschke, J.; Russ, J.; Friedrich, R.P.; Ehrnhoefer, D.E.; Wobst, H.; Neugebauer, K.; Wanker, E.E. EGCG remodels mature α-synuclein and amyloid-β fibrils and reduces cellular toxicity. Proc. Natl. Acad. Sci. USA 2010, 107, 7710–7715. [Google Scholar] [CrossRef]
  38. Chesser, A.S.; Ganeshan, V.; Yang, J.; Johnson, G.V. Epigallocatechin-3-gallate enhances clearance of phosphorylated tau in primary neurons. Nutr. Neurosci. 2016, 19, 21–31. [Google Scholar] [CrossRef]
  39. Chang, X.; Rong, C.; Chen, Y.; Yang, C.; Hu, Q.; Mo, Y.; Zhang, C.; Gu, X.; Zhang, L.; He, W.; et al. (−)-Epigallocatechin-3-gallate attenuates cognitive deterioration in Alzheimer’s disease model mice by upregulating neprilysin expression. Exp. Cell Res. 2015, 334, 136–145. [Google Scholar] [CrossRef]
  40. Zhang, Z.X.; Li, Y.B.; Zhao, R.P. Epigallocatechin Gallate attenuates β-Amyloid generation and oxidative stress involvement of PPARγ in N2a/APP695 cells. Neurochem. Res. 2017, 42, 468–480. [Google Scholar] [CrossRef]
  41. Kshirsagar, S.; Alvir, R.V.; Hindle, A.; Kumar, S.; Vijayan, M.; Pradeepkiran, J.A.; Reddy, A.P.; Ramasubramanian, B.; Reddy, P.H. Early Cellular, Molecular, Morphological and Behavioral Changes in the Humanized Amyloid-Beta-Knock-In Mouse Model of Late-Onset Alzheimer’s Disease. Cells 2022, 11, 733. [Google Scholar] [CrossRef] [PubMed]
  42. Baglietto-Vargas, D.; Forner, S.; Cai, L.; Martini, A.C.; Trujillo-Estrada, L.; Swarup, V.; Nguyen, M.M.T.; do Huynh, K.; Javonillo, D.I.; Tran, K.M.; et al. Generation of a humanized Aβ expressing mouse demonstrating aspects of Alzheimer’s disease-like pathology. Nat. Commun. 2021, 12, 2421. [Google Scholar] [CrossRef] [PubMed]
  43. Kandimalla, R.; Manczak, M.; Fry, D.; Suneetha, Y.; Sesaki, H.; Reddy, P.H. Reduced dynamin-related protein 1 protects against phosphorylated Tau-induced mitochondrial dysfunction and synaptic damage in Alzheimer’s disease. Hum. Mol. Genet. 2016, 25, 4881–4897. [Google Scholar] [CrossRef] [PubMed]
  44. Kandimalla, R.; Manczak, M.; Pradeepkiran, J.A.; Morton, H.; Reddy, P.H. A partial reduction of Drp1 improves cognitive behavior and enhances mitophagy, autophagy and dendritic spines in a transgenic Tau mouse model of Alzheimer disease. Hum. Mol. Genet. 2022, 31, 1788–1805. [Google Scholar] [CrossRef] [PubMed]
  45. Vijayan, M.; Bose, C.; Reddy, P.H. Protective effects of a small molecule inhibitor, DDQ against amyloid beta in Alzheimer’s disease. Mitochondrion 2021, 59, 17–29. [Google Scholar] [CrossRef] [PubMed]
  46. Kumar, S.; Morton, H.; Sawant, N.; Orlov, E.; Bunquin, L.E.; Pradeepkiran, J.A.; Alvir, R.; Reddy, P.H. MicroRNA-455-3p improves synaptic, cognitive functions and extends lifespan: Relevance to Alzheimer’s disease. Redox Biol. 2021, 48, 102182. [Google Scholar] [CrossRef] [PubMed]
  47. Vijayan, M.; George, M.; Bunquin, L.E.; Bose, C.; Reddy, P.H. Protective effects of a small-molecule inhibitor DDQ against tau-induced toxicities in a transgenic tau mouse model of Alzheimer’s disease. Hum. Mol. Genet. 2022, 31, 1022–1034. [Google Scholar] [CrossRef]
  48. Manczak, M.; Kandimalla, R.; Fry, D.; Sesaki, H.; Reddy, P.H. Protective effects of reduced dynamin-related protein 1 against amyloid beta-induced mitochondrial dysfunction and synaptic damage in Alzheimer’s disease. Hum. Mol. Genet. 2016, 23, 5148–5166. [Google Scholar] [CrossRef]
  49. Mega, M.S.; Cummings, J.L.; Fiorello, T.; Gornbein, J. The spectrum of behavioral changes in Alzheimer’s disease. Neurology 1996, 46, 130–305. [Google Scholar] [CrossRef]
  50. Abdulrahman, A.O.; Alzubaidi, M.Y.; Nadeem, M.S.; Khan, J.A.; Rather, I.A.; Khan, M.I. The Utilization of Urolithin A—A Natural Polyphenol Metabolite of Ellagitannins as a Modulator of the Gut Microbiota for Its Potential Use in Obesity Therapy. Proceedings 2021, 79, 12. [Google Scholar]
Figure 1. Urolithin A, EGCG and a combination of urolithin A+EGCG. The mitochondrial respiration was evaluated using Seahorse Bioanalyzer in HT22 cells transfected with mutant APP cDNA and treated with urolithin A, EGCG and a combination of both urolithin A+EGCG. The maximal OCR was reduced in muantAPPHT22 cells in comparison to HT22 cells. On the contrary, OCR was increased in mAPPHT22 cells treated with urolithin A, EGCG and a combination of urolithin A+EGCG compared to untreated mAPPHT22 cells. * p < 0.05; ** p < 0.01; *** p < 0.001.
Cells 11 02660 g001
Figure 2. Cognitive behavior of seven-month-old hAbKI and hAbKI mice treated with Urolithin A and EGCG. Phenotypic behavior is evaluated using rotarod for motor coordination, open field for locomotor activity/exploration abilities, Y-maze for working memory and Morris water maze for spatial learning and memory in seven-month-old hAbKI mice and hAbKI mice treated with Urolithin A and EGCG. (A) On an accelerating rotarod test, hAbKI mice did not stay longer compared to treated mice with Urolithin A and EGCG. (B) In open field, hAbKI mice showed reduced total distance traveled and average speed compared to treated mice. (C) In the Morris water maze test, hAbKI mice showed an increased time to find the platform, and increased distance traveled compared with treated mice. (D) In the Y-Maze test the total number of arm entries was significantly reduced and the percentage of spontaneous alternation between the arms of the Y-maze was significantly decreased for seven-month-old hAbKI compared treated mice.
Cells 11 02660 g002
Figure 3. Immunoblotting analysis of mitochondrial dynamic proteins. Immunoblotting analysis was assessed using lysates prepared from post-mortem brains of seven-month-old hAbKI mice and treated hAbKI mice with Uralithin A and EGCG. (A) Representative immunoblots for hAbKI mice and treated hAbKI mice with Urolithin A and EGCG. (B) Quantitative-densitometry analysis for mitochondrial fission genes Drp1 and Fis1 and fusion proteins, which were significantly decreased in the treated hAbKI mice Urolithin A and EGCG as compared to the hAbKI mice. Mitochondrial fusion proteins Mfn1, Mfn2 and Opa1 were significantly increased in urolithin A-treated hAbKI mice and combined treatment of urolithin A+EGCG in 7-month-old hAbKI mice.
Cells 11 02660 g003
Figure 4. Immunoblotting analysis of mitochondrial biogenesis. (A) Representative immunoblots for mitochondrial biogenesis proteins in hAbKI mice and treated hAbKI mice with Urolithin A and EGCG. (B) Quantitative-densitometry analysis of mitochondrial biogenesis proteins PGC1α, NRF1, NRF2 and TFAM. PGC1α, NRF1, NRF2 and TFAM were significantly increased in the treated hAbKI mice Urolithin A and EGCG.
Cells 11 02660 g004
Figure 5. Immunoblotting analysis of mitochondrial mitophagy and synaptic proteins. (A) Representative immunoblots for untreated and hAbKI mice and treated hAbKI Urolithin A and EGCG. (B) Quantitative-densitometry analysis of PINK1, Parkin, synaptophysin and PSD95, which shows significant reduction in the hAbKI mice compared to the treated hAbKI mice Urolithin A and EGCG.
Cells 11 02660 g005
Figure 6. Immunoblotting analysis of autophagy proteins in lysates obtained from brains of seven-month-old hAbKI and treated hAbKI mice with Urolithin A and EGCG. (A) Representative autophagy immunoblots for hAbKI mice and treated hAbKI mice with Urolithin A and EGCG. (B) Quantitative-densitometry analysis for autophagy proteins ATG5, Beclin, BCL2, LC3B-I and LC3B-II showed they were significantly increased in the treated hAbKI mice with Urolithin A and EGCG as compared to hAbKI mice.
Cells 11 02660 g006
Figure 7. Immunoblotting analysis ofInflammatory and neuronal proteins NeuN, microglial marker Iba and astrocytic marker GFAP. (A) Representative immunoblots for microglia Iba, astrocytes GFAP and neuronal marker NeuN in hAbKI mice and treated hAbKI. (B) Significantly increased levels of the neuronal marker NeuN and decreased levels of microglial marker Iba and astrocytic marker GFAP in -seven-month-old hAbKI mice treated with Urolithin A and EGCG.
Cells 11 02660 g007
Figure 8. Immunofluorescence analysis of hippocampal mitochondrial fission and mitochondrial dynamic proteins in seven-month-old hAbKI mice and treated hAbKI mice with Urolithin A and EGCG. (A) Immunofluorescence staining and quantitative immunofluorescence analysis of hAbKI mice treated hAbKI mice with Urolithin A and EGCG. (B) Drp1 and Fis1 levels were significantly decreased in the treated hAbKI mice with Urolithin A and EGCG.
Cells 11 02660 g008
Figure 9. Immunofluorescence analysis of hippocampal mitochondrial biogenesis proteins in seven-month-old hAbKI mice and treated hAbKI mice with Urolithin A and EGCG. (A) Representative immunofluorescence images and (B) quantitative analysis of mitochondrial biogenesis proteins, PGC1a, Nrf1, Nrf2 and TFAM in hAbKI mice and treated hAbKI mice with Urolithin A and EGCG.
Cells 11 02660 g009
Figure 10. Immunofluorescence analysis of hippocampal synaptic proteins (synaptophysin and PSD95) and mitophagy proteins. (A) Immunofluorescence staining and quantitative immunofluorescence analysis of hAbKI mice and treated hAbKI mice with Urolithin A and EGCG. (B) PINK1 and Parkin levels were significantly elevated (PINK1 and Parkin in the hAbKI mice with Urolithin A and EGCG. (A) Representative images of immunofluorescence and (B) quantitative immunofluorescence analysis of synaptic proteins, synaptophysin and PSD95 in hAbKI mice and treated hAbKI mice with Urolithin A and EGCG. (B) Representative images of immunofluorescence analysis of synaptic proteins, synaptophysin and PSD95 proteins.
Cells 11 02660 g010
Figure 11. Immunofluorescence analysis of hippocampal microglial, astrocytic and neuronal proteins in seven-month-old hAbKI mice and treated hAbKI mice with Urolithin A and EGCG. (A) Representative immunofluorescence images and (B) quantitative immunofluorescence analysis of microglial Iba1 and astrocytic protein GFAP and neuronal protein NeuN in hAbKI mice relative to treated hAbKI mice with Urolithin A and EGCG.
Cells 11 02660 g011
Figure 12. Transmission electron microscopy of cortical and hippocampal tissues from seven-month-old hAbKI mice and treated hAbKI mice with Urolithin A and EGCG. Using transmission electron microscopy, we assessed mitochondrial number and length in cortical and hippocampal tissues from seven-month-old hAbKI and treated hAbKI mice with Urolithin A and EGCG. (A) shows representative images of mitochondrial morphology in cortical and hippocampal areas of hAbKI and treated hAbKI mice brains. (B) shows significantly increased mitochondrial number in the cortices and hippocampi of hAbKI mice relative to treated hAbKI mice with Urolithin A and EGCG. Mitochondrial length is reduced in the cortices and hippocampi of hAbKI mice relative to treated hAbKI mice with Urolithin A and EGCG.
Cells 11 02660 g012
Figure 13. Mitophagosoma formations assessment using transmission electron microscopy in hippocampal tissues from urolithin A and urolithin A+EGCG-treated hAbKI mice and untreated hAbKI mice as controls. Mitophagosomal formations were increased in urolithin and combined treatment of urolithin A+EGCG in hAbKI mice. Mitophagosomal formations were increased for combined treatment of urolithin A+EGCG compared to urolithin A-treated hAbKI mice.
Cells 11 02660 g013
Figure 14. Mitochondrial function. Mitochondrial functional parameters, including lipid peroxidation (4-hydroxy-nonenol) (A), mitochondrial ATP (B) and hydrogen peroxide (C) were measured in the cortices of 7-month-old hAbKI and treated hAbKI mice with Urolithin A and EGCG. Data are mean ± SD (n = 5 for each group). Significantly increased levels of 4-hydroxy-nonenol (lipid peroxidation), hydrogen peroxide and significantly decreased mitochondrial ATP levels were found in hAbKI mice relative to treated hAbKI mice with Urolithin A and EGCG.
Cells 11 02660 g014
Figure 15. Golgi–Cox staining representing hippocampal and cortical dendritic spine density in the brains of seven-month-old hAbKI mice and treated hAbKI mice with Urolithin A and EGCG. (A,B) Represents Golgi–Cox staining at 4×, 10×, 20× and high magnification at 100×. (C,D) Represents quantification of spine density in the untreated hAbKI and treated hAbKI mice with Urolithin A and EGCG. Significantly reduced dendritic spines were found in untreated hAbKI mice relative to treated hAbKI mice with Urolithin A and EGCG.
Cells 11 02660 g015
Figure 16. Amyloid-beta levels in three- and seven-month-old hAbKI mice. Using sandwich ELISA kit (IBL), we measured soluble Aβ1–40 and 1–42 levels in seven-month-old homozygous hAbKI mice and treated hAbKI mice with Urolithin A and EGCG. Both Aβ40 and Aβ42 levels were progressively decreased in treated hAbKI mice with Urolithin A and EGCG.
Cells 11 02660 g016
Table 1. Summary of q RT-PCR oligonucleotide primers used in measuring mRNA expression in mitochondrial structural, biogenesis, synaptic genes and autophagy and mitophagy genes.
Gene DNA Sequence (5′-3′)PCR Product Size
Mitochondrial Structural Genes
Drp1Forward Primer ATGCCAGCAAGTCCACAGAA86
Reverse Primer TGTTCTCGGGCAGACAGTTT
Fis1Forward Primer CAAAGAGGAACAGCGGGACT95
Reverse Primer ACAGCCCTCGCACATACTTT
Mfn1Forward Primer GCAGACAGCACATGGAGAGA83
Reverse Primer GATCCGATTCCGAGCTTCCG
Mfn2Forward Primer TGCACCGCCATATAGAGGAAG78
Reverse Primer TCTGCAGTGAACTGGCAATG
Opa1Forward Primer ACCTTGCCAGTTTAGCTCCC82
Reverse Primer TTGGGACCTGCAGTGAAGAA
Mitochondrial Biogenesis Genes
PGC1α Forward Primer GCAGTCGCAACATGCTCAAG83
Reverse Primer GGGAACCCTTGGGGTCATTT
Nrf1Forward Primer AGAAACGGAAACGGCTCAT96
Reverse Primer CATCCAACGTGGCTCTGAGT
Nrf2Forward Primer ATGGAGCAAGTTTGGCAGGA96
Reverse Primer GCTGGGAACAGAGGTAGTAT
TFAMForward Primer TCCACAGAACAGCTACCCAA84
Reverse Primer CCACAGGGCTGCAATTTTCC
Synaptic Genes
SynaptophysinForward Primer CTGCGTTAAAGGGGGCACTA81
Reverse Primer ACAGCCACGGTGACAAAGAA
PSD95Forward Primer CTTCATCCTTGCTGGGGGTC90
Reverse Primer TTGCGGAGGTCAACACCATT
Synapsin 1Forward Primer TGAGGACATCAGTGTCGGGTAA64
Reverse Primer GGCAATCTGCTCAAGCATAGC
Synapsin 2Forward Primer TCCCACTCATTGAGCAGACATACT
Reverse Primer GGGAACGTAGGAAGCGTAAGC
Synaptobrevin 1Forward Primer TGCTGCCAAGCTAAAAAGGAA68
Reverse Primer CAGATAGCTCCCAGCATGATCA
Synaptobrevin 2Forward Primer GGGACCAGAAGTTGTCGGAG89
Reverse Primer CTTGAGCTTGGCTGCACTTG
NeurograninForward Primer CTCCAAGCCAGACGACGATA83
Reverse Primer AACTCGCCTGGATTTTGGCT
Mitophagy genes
PINK1Forward Primer CCATCGGGATCTCAAGTCCG70
Reverse Primer GATCACTAGCCAGGGACAGC
ParkinForward Primer AGAGGTCCAGTTAAACCCACC90
Reverse Primer GAGGGTTGCTTGTTTGCAGG
ATG5Forward Primer TCCATCCAAGGATGCGGTTG95
Reverse Primer TCTGCATTTCGTTGATCACTTGAC
BCL2Forward Primer TCCTTCCAGCCTGAGAGCAA73
Reverse Primer GCCTGAGAGGAGACGTCCTG
LC3BForward Primer TCCACTCCCATCTCCGAAGT94
Reverse Primer TTGCTGTCCCGAATGTCTCC
Table 2. Summary of antibody dilutions and conditions used in the immunofluorescence analysis of mitochondrial dynamics, mitochondrial biogenesis, synaptic mitophagy and autophagy proteins in mitophagy enhancer-treated and -untreated hAbKI mice.
Marker Primary Antibody—Species
and Dilution
Purchased from Company,
City and State
Secondary Antibody, DilutionPurchased from Company, City and State
Drp1 Rabbit polyclonal (#NB110-55288) 1:100Novus Biological, Littleton, CODonkey anti-rabbit HRP 1:200Invitrogen
Fis1 Rabbit polyclonal (#10956-1-AP) 1:100Protein Tech Group, Inc., Chicago, ILDonkey anti-rabbit HRP 1:200GE Healthcare Amersham, Piscataway, NJ
Mfn1 Rabbit polyclonal (#ab191853) 1:100Abcam, Cambridge, MADonkey anti-rabbit HRP 1:200GE Healthcare Amersham, Piscataway, NJ
Mfn2 Rabbit polyclonal (#Ab205236) 1:100 Abcam, Cambridge, MADonkey anti-rabbit HRP 1:200GE Healthcare Amersham, Piscataway, NJ
OPA1 Rabbit polyclonal (#NBP2-59770) 1:100Novus Biological, Littleton, CODonkey anti-rabbit HRP 1:200GE Healthcare Amersham, Piscataway, NJ
SYN Rabbit monoclonal (#Ab32127) 1:400Abcam, Cambridge, MADonkey anti-rabbit HRP 1:200GE Healthcare Amersham, Piscataway, NJ
PGC1a Rabbit polyclonal (#NBP1-04676) 1:100Novus Biological, Littleton, CODonkey anti-rabbit HRP 1:200GE Healthcare Amersham, Piscataway, NJ
NRF1 Rabbit polyclonal (#NBP1-77822) 1:100Novus Biological, Littleton, CODonkey anti-rabbit HRP 1:200GE Healthcare Amersham, Piscataway, NJ
NRF2 Rabbit polyclonal (#NBP1-32822) 1:100Novus Biological, Littleton, CODonkey anti-rabbit HRP 1:200GE Healthcare Amersham, Piscataway, NJ
TFAM Rabbit polyclonal (#NBP2-59770) 1:100Novus Biological, Littleton, CODonkey anti-rabbit HRP 1:200GE Healthcare Amersham, Piscataway, NJ
PINK1 Rabbit polyclonal (#BC100-494) 1:100Novus Biological, Littleton, CODonkey anti-rabbit HRP 1:200GE Healthcare Amersham, Piscataway, NJ
Parkin Mouse polyclonal (#NBP2-29838) 1:100Novus Biological, Littleton, COSheep anti-mouse HRP 1:200GE Healthcare Amersham, Piscataway, NJ
Iba1/AIF-12 Rabbit monoclonal
(#17178S) 1:100
Cell Signaling Technology, Inc., MADonkey Anti-rabbit HRP 1:200GE Healthcare Amersham, Piscataway, NJ
Anti-NeuN Rabbit monoclonal
(#Ab177487) 1:100
Abcam, Cambridge, MADonkey Anti-rabbit HRP 1:200GE Healthcare Amersham, Piscataway, NJ
Table 3. Summary of antibody dilutions and conditions used in the immunoblotting analysis of mitochondrial dynamics, mitochondrial biogenesis, synaptic mitophagy and autophagy proteins in mitophagy enhancer-treated and -untreated hAbKI mice.
Marker Primary Antibody—Species
and Dilution
Purchased from Company,
City and State
Secondary Antibody, DilutionPurchased from Company, City and State
Drp1 Rabbit polyclonal
(#NB110-55288) 1:500
Novus Biological, Littleton, CODonkey anti-rabbit HRP 1:10,000GE Healthcare Amersham, Piscataway, NJ
Fis1 Rabbit polyclonal (#10956-1-AP) 1:500Protein Tech Group, Inc., Chicago, ILDonkey anti-rabbit HRP 1:10,000GE Healthcare Amersham, Piscataway, NJ
Mfn1 Rabbit polyclonal (#Ab221661) 1:400Abcam, Cambridge, MADonkey anti-rabbit HRP 1:10,000GE Healthcare Amersham, Piscataway, NJ
Mfn2 Rabbit polyclonal (#Ab205236) 1:400 Abcam, Cambridge, MADonkey anti-rabbit HRP 1:10,000GE Healthcare Amersham, Piscataway, NJ
OPA1 Rabbit polyclonal (#NBP2-59770) 1:500 Novus Biological, Littleton, CODonkey anti-rabbit HRP 1:10,000GE Healthcare Amersham, Piscataway, NJ
SYN Rabbit monoclonal (#Ab32127) 1:400Abcam, Cambridge, MADonkey anti-rabbit HRP 1:10,000GE Healthcare Amersham, Piscataway, NJ
PGC1a Rabbit polyclonal (#NBP1-04676) 1:500Novus Biological, Littleton, CODonkey anti-rabbit HRP 1:10,000GE Healthcare Amersham, Piscataway, NJ
NRF1 Rabbit polyclonal (#NBP1-77822) 1:300Novus Biological, Littleton, CODonkey anti-rabbit HRP 1:10,000GE Healthcare Amersham, Piscataway, NJ
NRF2 Rabbit polyclonal (#NBP1-32822) 1:300Novus Biological, Littleton, CODonkey anti-rabbit HRP 1:10,000GE Healthcare Amersham, Piscataway, NJ
TFAM Rabbit polyclonal (#NBP2-59770) 1:300Novus Biological, Littleton, CODonkey anti-rabbit HRP 1:10,000GE Healthcare Amersham, Piscataway, NJ
PINK1 Rabbit polyclonal (#BC100-494) 1:500Novus Biological, Littleton, CODonkey anti-rabbit HRP 1:10,000GE Healthcare Amersham, Piscataway, NJ
Parkin Mouse polyclonal (#NBP2-29838) 1:500Novus Biological, Littleton, COSheep anti-mouse HRP 1:10,000GE Healthcare Amersham, Piscataway, NJ
ATG5 Rabbit Polyclonal (#NBP2-54702) 1:1000 Novus Biological, Littleton, CODonkey Anti-rabbit HRP 1:10,000GE Healthcare Amersham, Piscataway, NJ
LC3B Rabbit Polyclonal (#NB100-2220) 1:1000Novus Biological, Littleton, CODonkey Anti-rabbit HRP 1:10,000GE Healthcare Amersham, Piscataway, NJ
Beclin1 Rabbit Polyclonal (#NB500-249) 1:1000Novus Biological, Littleton, CODonkey Anti-rabbit HRP 1:10,000GE Healthcare Amersham, Piscataway, NJ
Bcl-2 Rabbit Polyclonal
(#NB100-56098) 1:1000
Novus Biological, Littleton, CODonkey Anti-rabbit HRP 1:10,000GE Healthcare Amersham, Piscataway, NJ
Iba1/AIF-12 Rabbit monoclonal
(#17178S) 1:1000
Cell Signaling Technology, Inc., MADonkey Anti-rabbit HRP 1:10,000GE Healthcare Amersham, Piscataway, NJ
Anti-NeuN Rabbit monoclonal
(#Ab177487) 1:1000
Abcam, Cambridge, MADonkey Anti-rabbit HRP 1:10,000GE Healthcare Amersham, Piscataway, NJ
Table 4. Summary of mRNA fold changes comparison in Urolithin A-treated hAbKI mice and Urolithin A+EGCG treated hAbKI mice.
GenesmRNA Fold Change in Urolithin A-Treated hAbKI MicemRNA Fold Change in Urolithin A+EGCG-Treated hAbKI Mice
Mitochondrial genesDrp1−1.96 *−2.12 *
Fis1−2.32 **−2.6 **
Mfn12.03 *8.9 **
Mfn23.4 **5.23 **
OPA12.91 *3.76 *
Biogenesis genesPGC1 alpha3.03 **4.1 **
Nrf11.46 *2.76 ***
Nrf22.39 **3.25 ***
TFAM1.8 *2.2 **
Synaptic genesSynaptophysin3.45 *3.9 *
PSD952.9 *3.5 **
Snap253.7 **6.34 **
Synapsin 1
Synapsin 2
2.25
10.2 ***
17.03 ***
14.6 ***
Synaptobrevin 1
Synaptobrevin 2
2.7 *
6.6 **
4.67 **
7.87 ***
Neurogranin3.81 **8.5 ***
Mitophagy genesPINK12.63 **3.24 **
Parkin2.3 *2.33 *
Autophagy genesATG52.07 *2.23 *
LC3B2.08 **4.34 ***
BCL22.25 *4.8 **
* = p < 0.05. ** = p < 0.005. *** = p < 0.0005.
Publisher’s Note: MDPI stays neutral with regard to jurisdictional claims in published maps and institutional affiliations.

