
CerS1 but Not CerS5 Gene Silencing, Improves Insulin Sensitivity and Glucose Uptake in Skeletal Muscle

 , and
, and
Abstract
:
1. Introduction
2. Materials and Methods
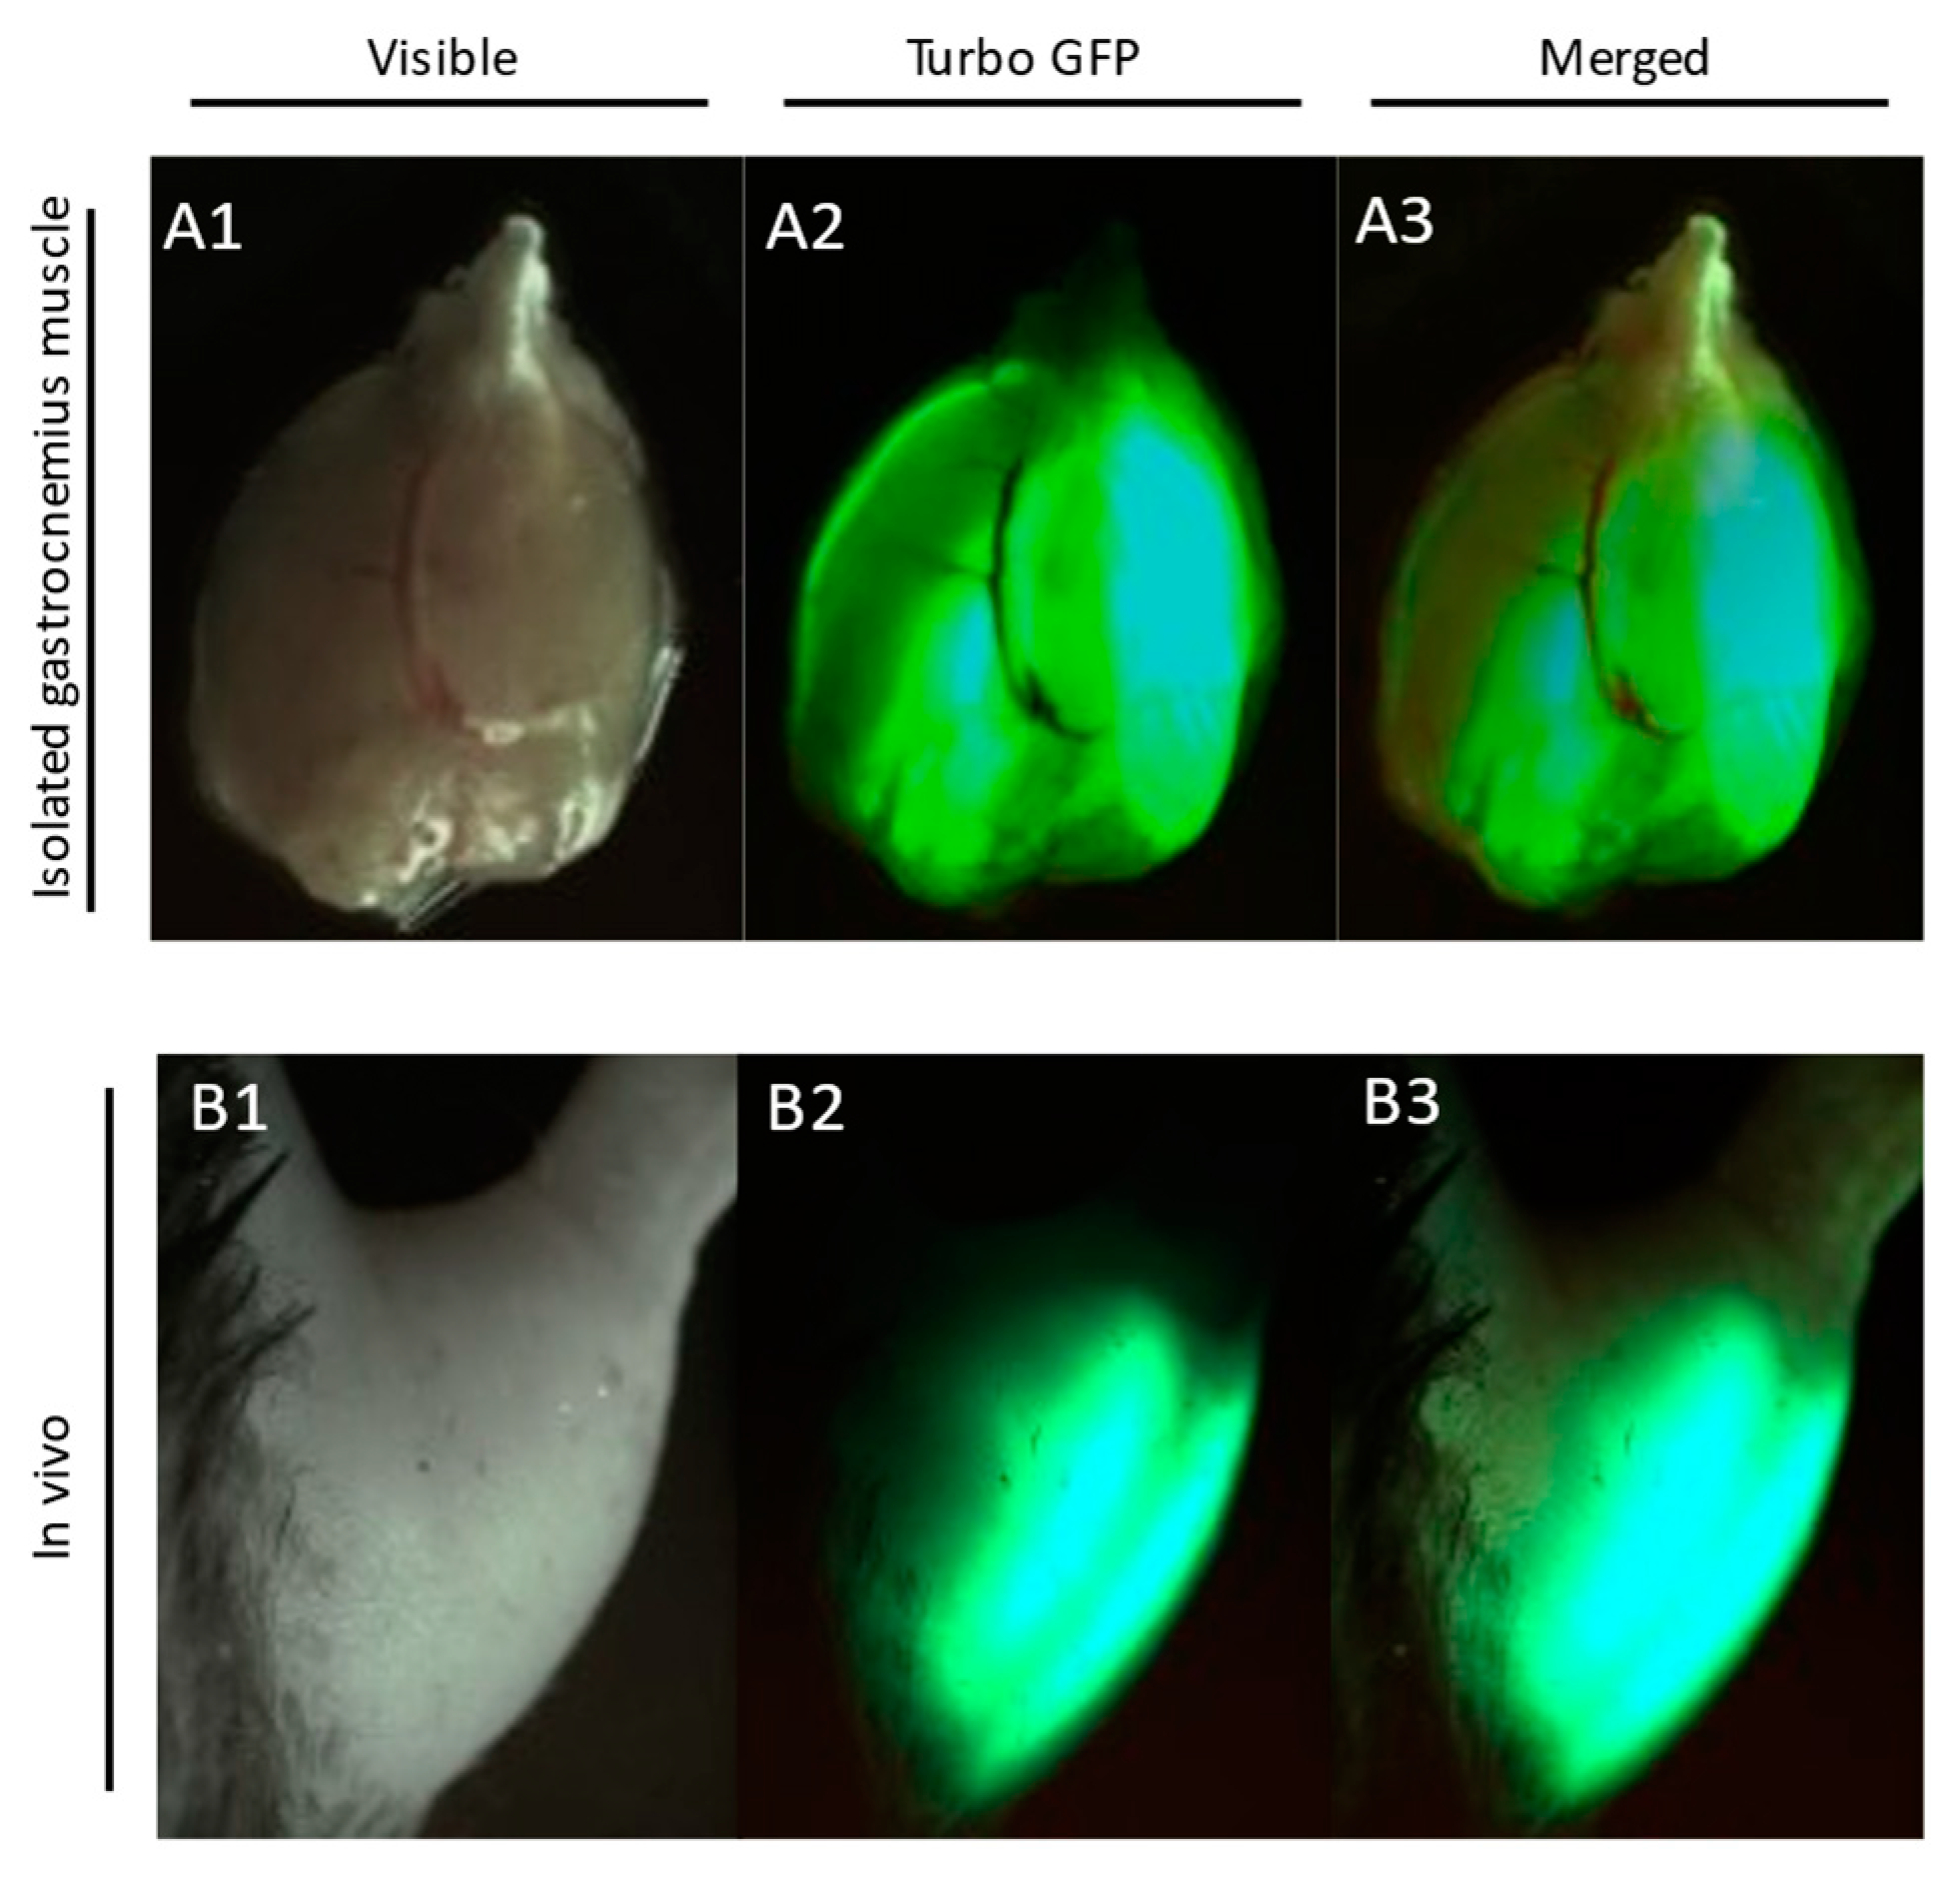
2.1. Plasmids and In Vivo Electroporation
2.2. Lipid Measurements
2.2.1. Plasma FFA
2.2.2. Sphingolipids
2.2.3. Diacylglycerols
2.2.4. Long-Chain Acyl-CoA
2.2.5. Acyl-Carnitines
2.2.6. Triacylglycerols
2.3. Western Blotting
2.4. Real-Time PCR
2.5. Insulin-Stimulated Glucose Uptake
2.6. Plasma Insulin and Glucose Concentration
2.7. Oral Glucose Tolerance Test (OGTT)
2.8. Insulin Tolerance Test (ITT)
2.9. HOMA-IR (Homeostatic Model Assessment)
2.10. Statistical Analysis
3. Results
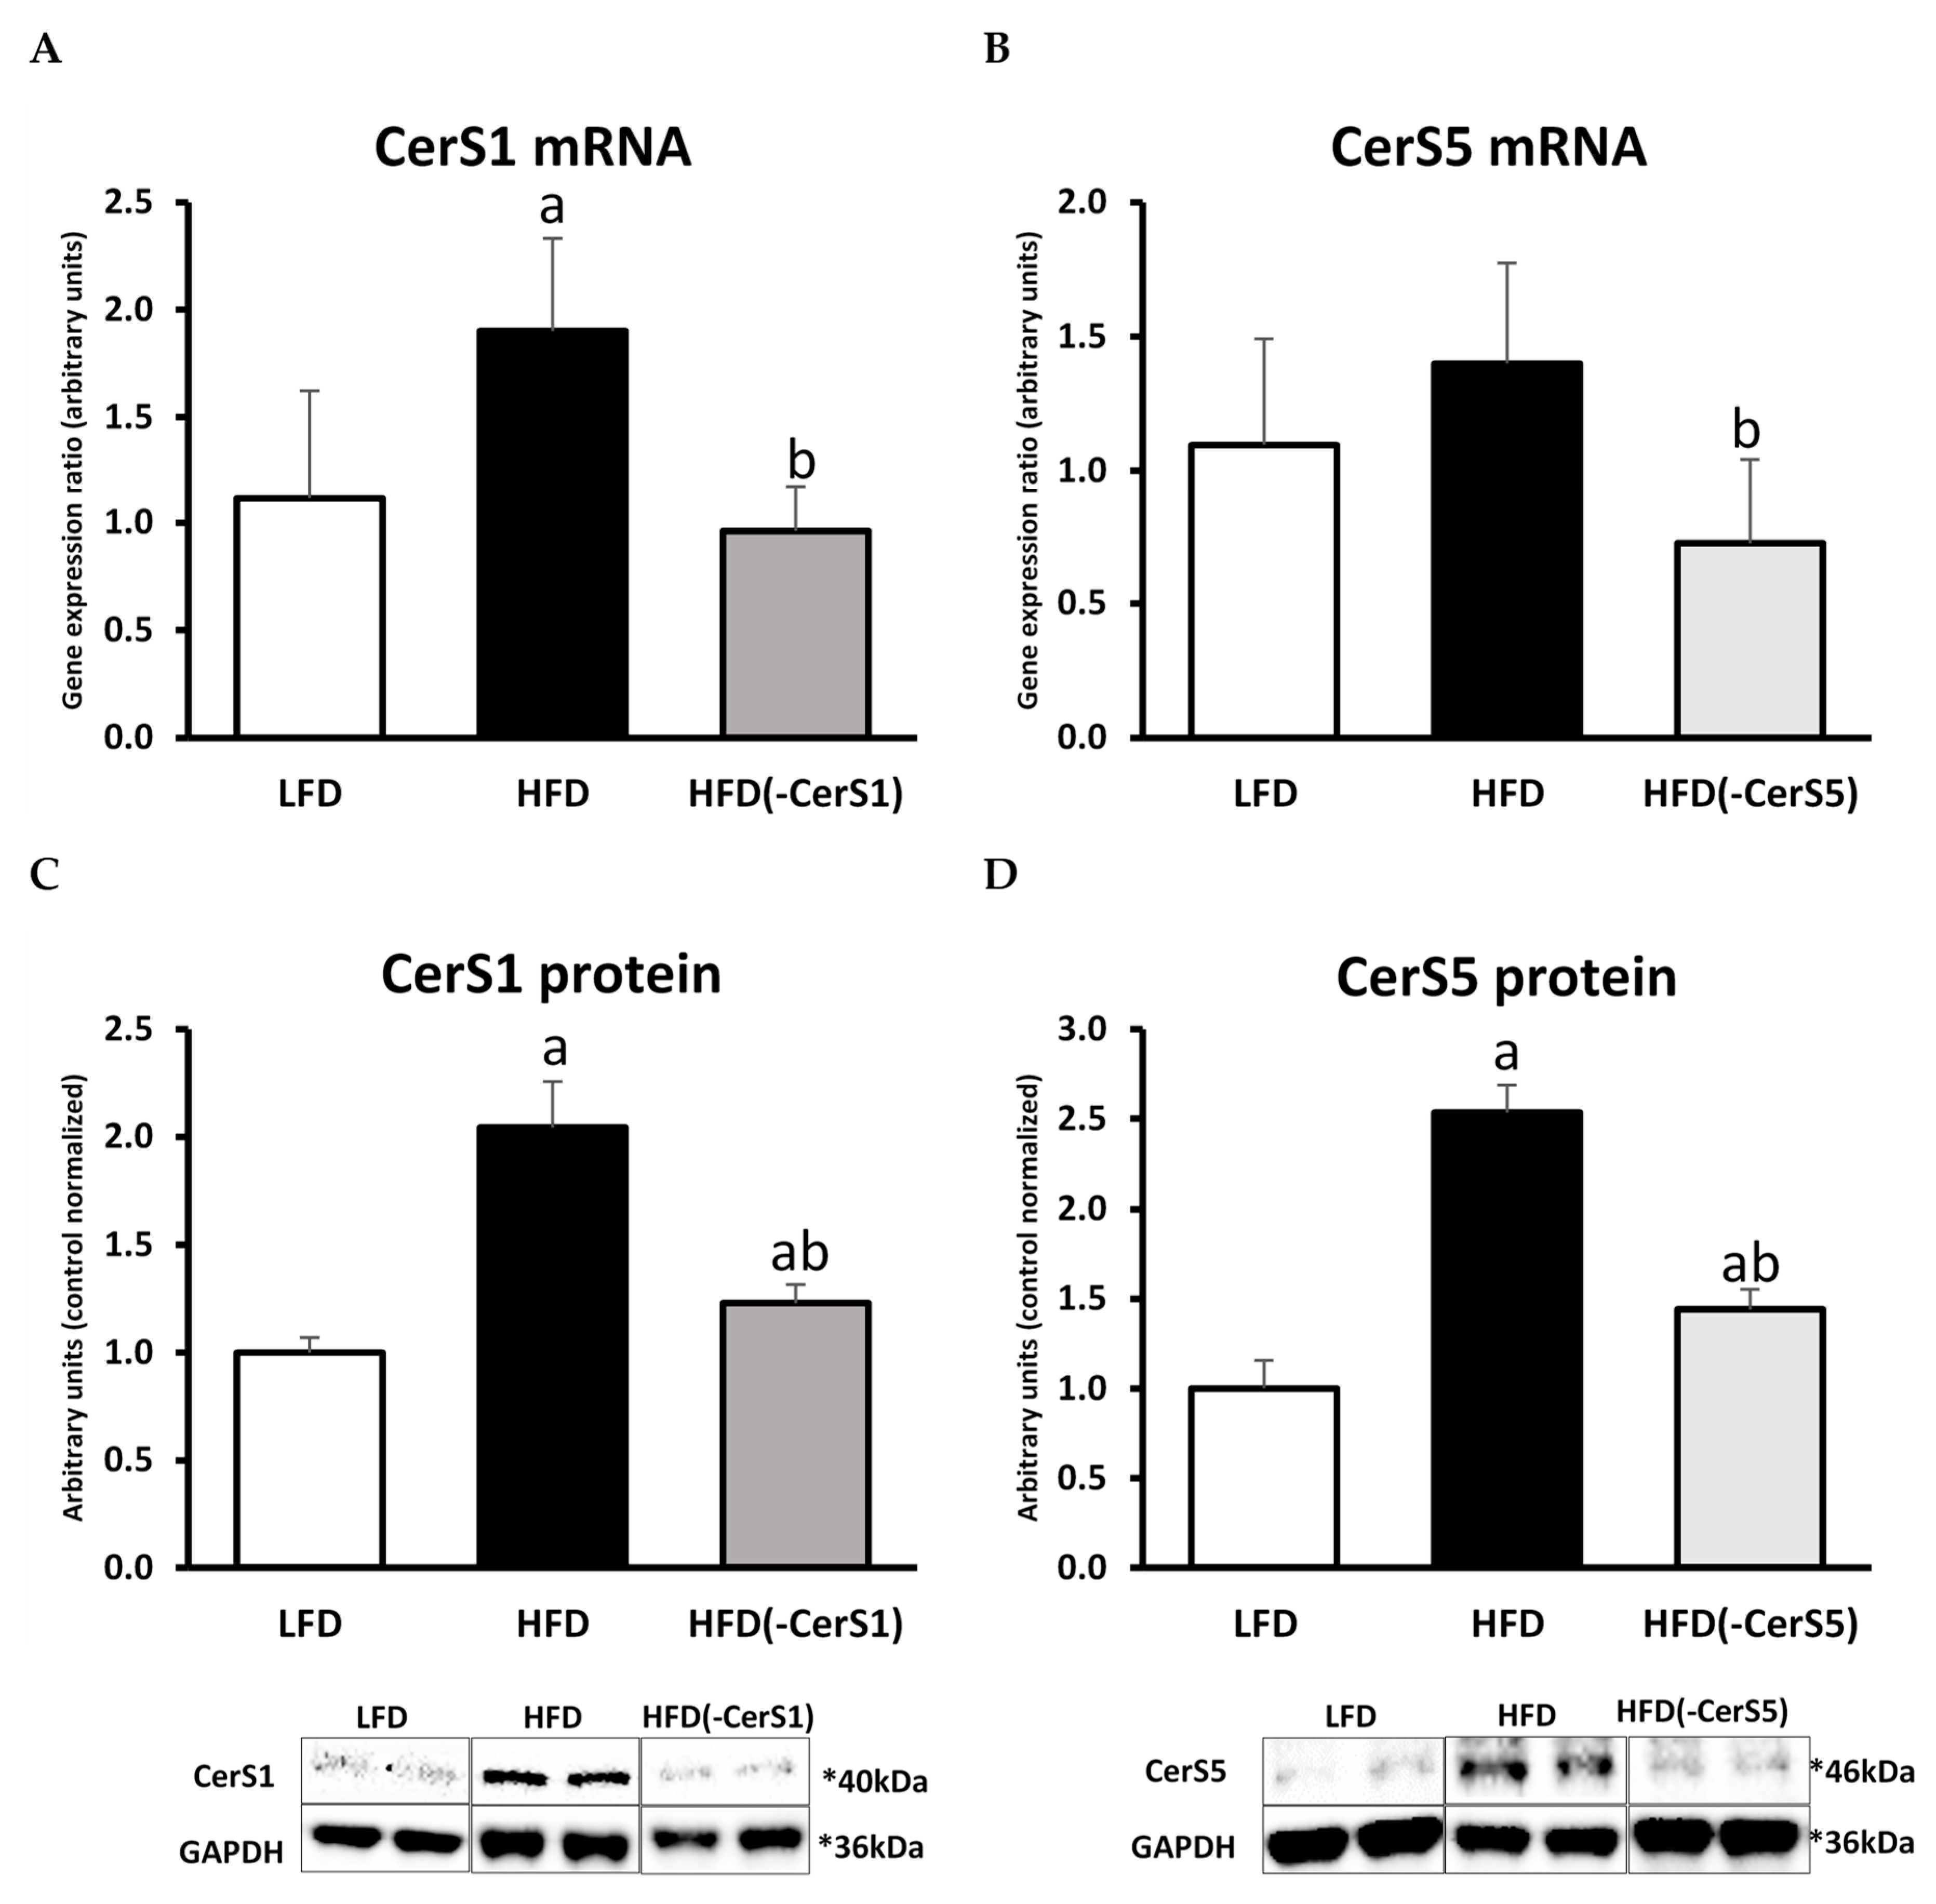
3.1. Gene Silencing of CerS1 and CerS5
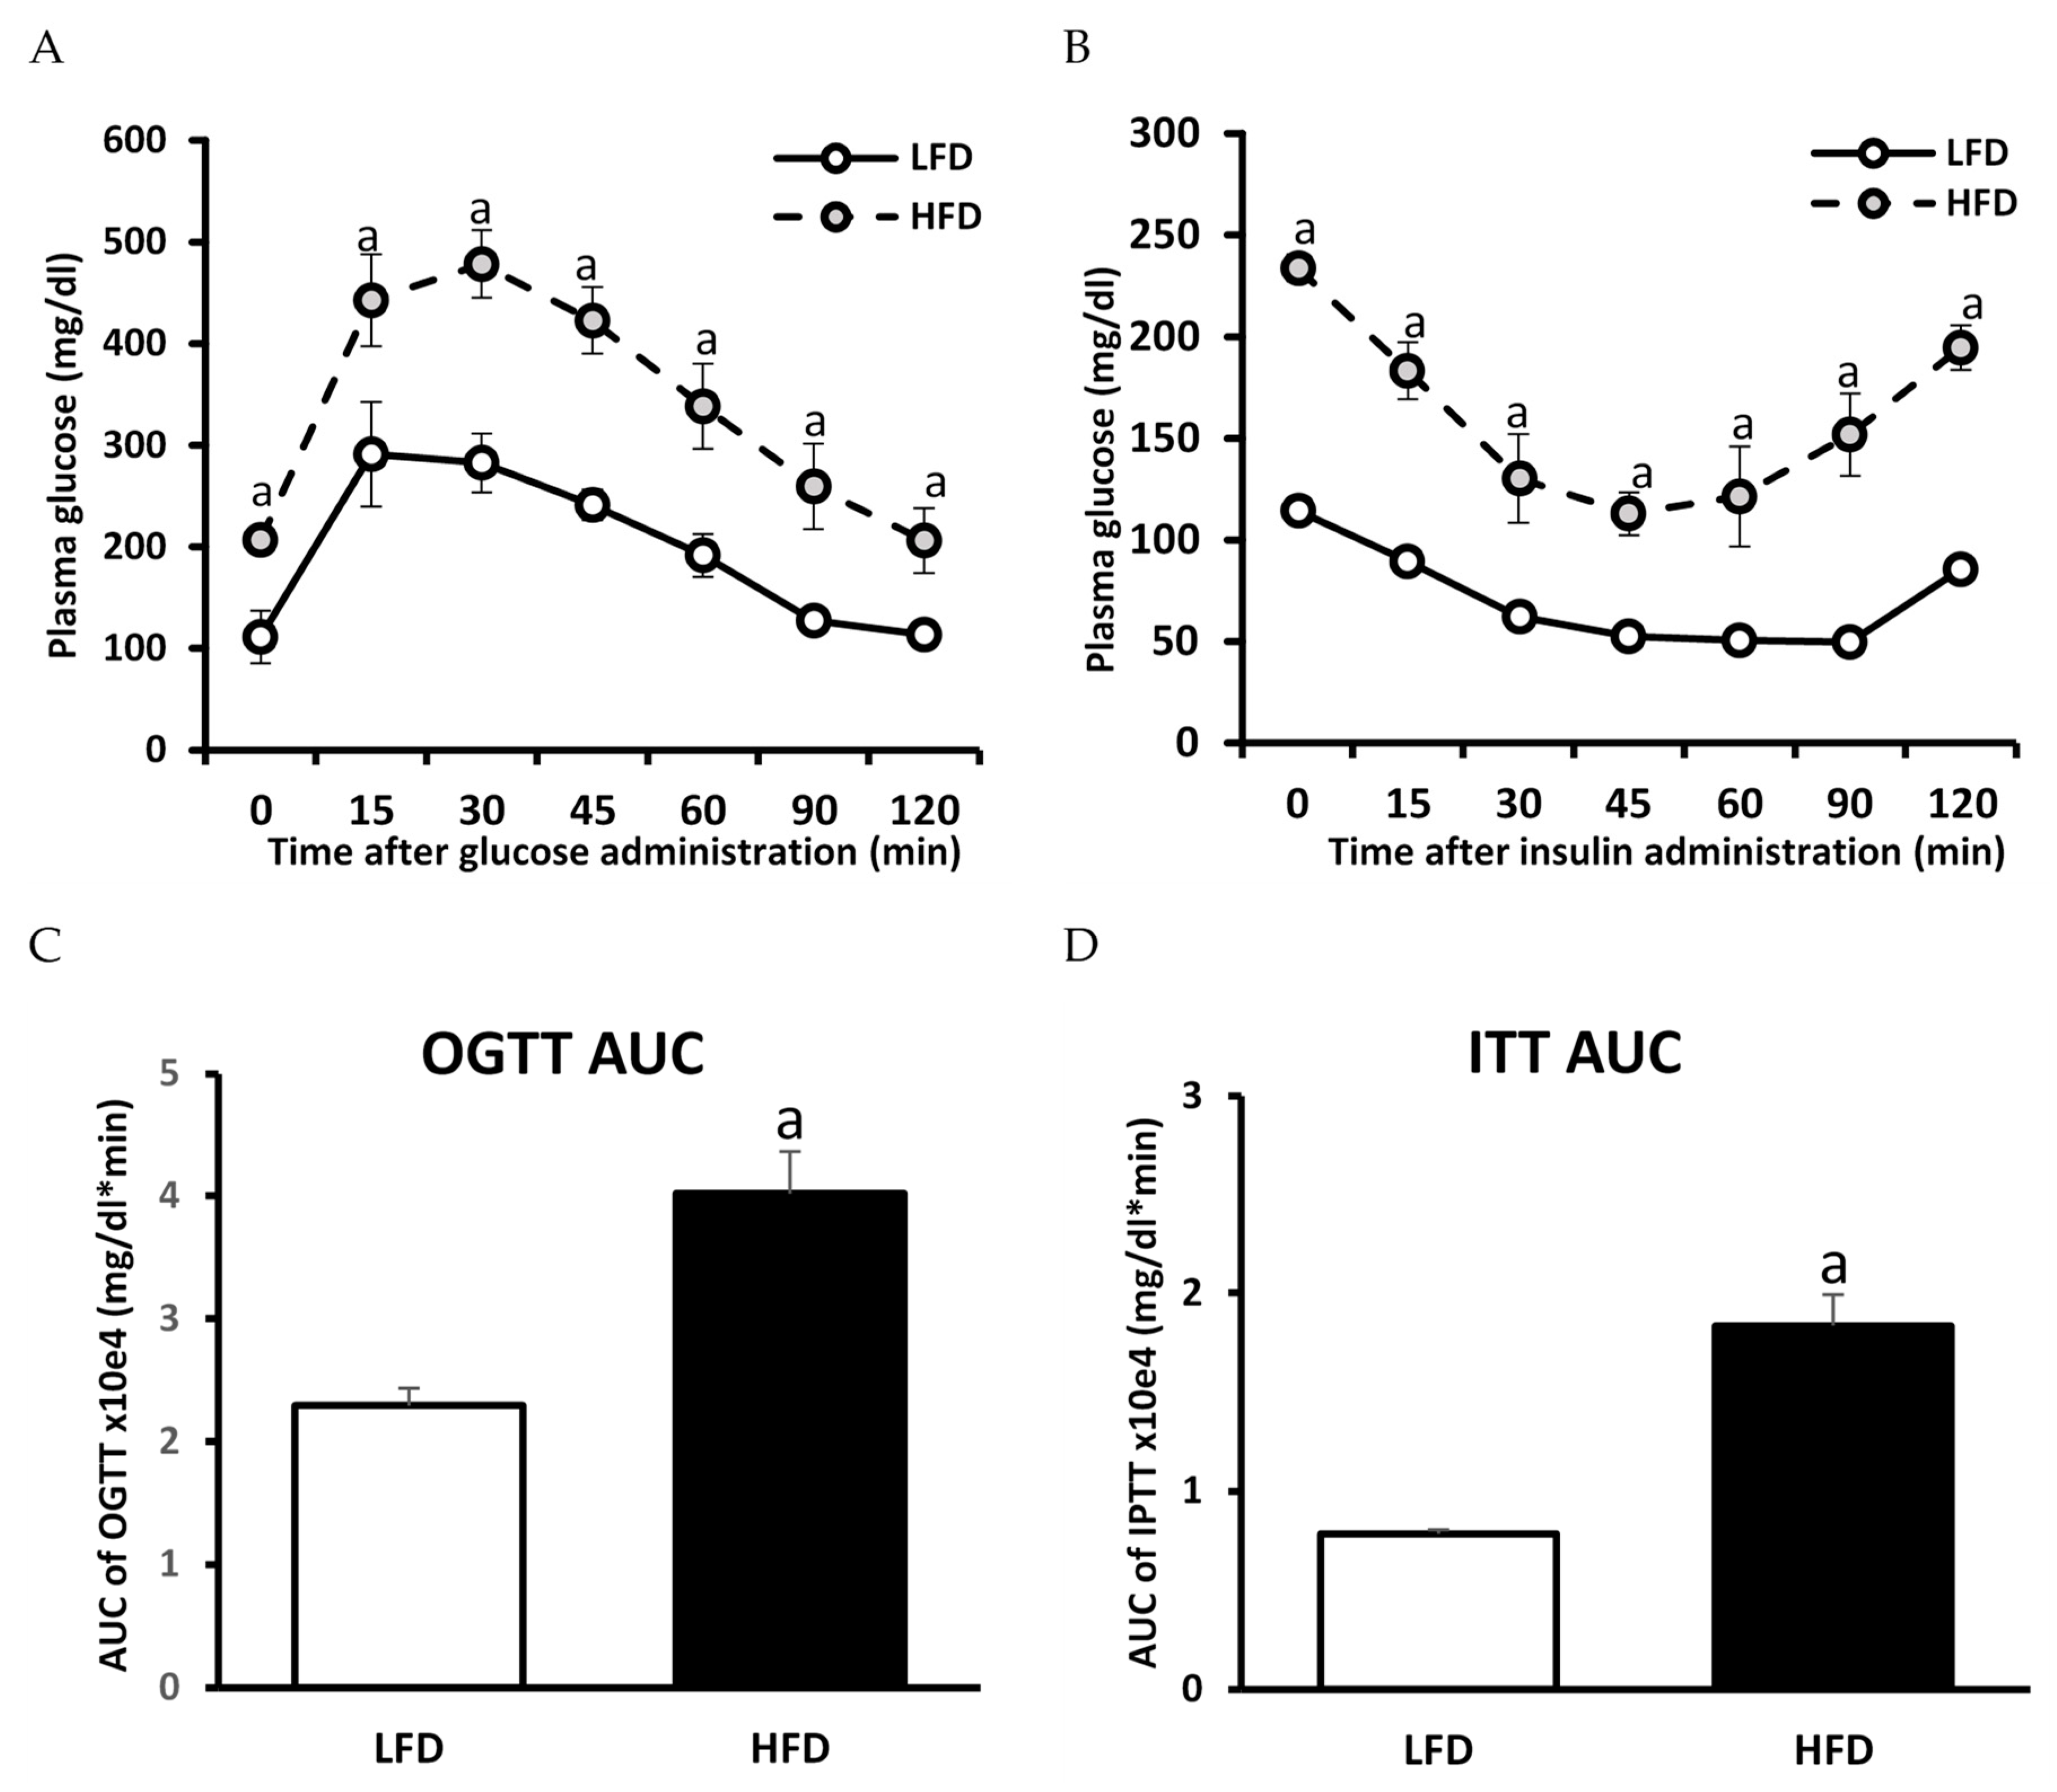
3.2. The Effect of HFD on Glucose and Insulin Concentration and HOMA-IR Value
3.3. Plasma FFA Concentration
3.4. Skeletal Muscle Fatty Acid Transporters
3.4.1. CD36
3.4.2. FATP1
3.4.3. FABPpm
3.5. Lipids
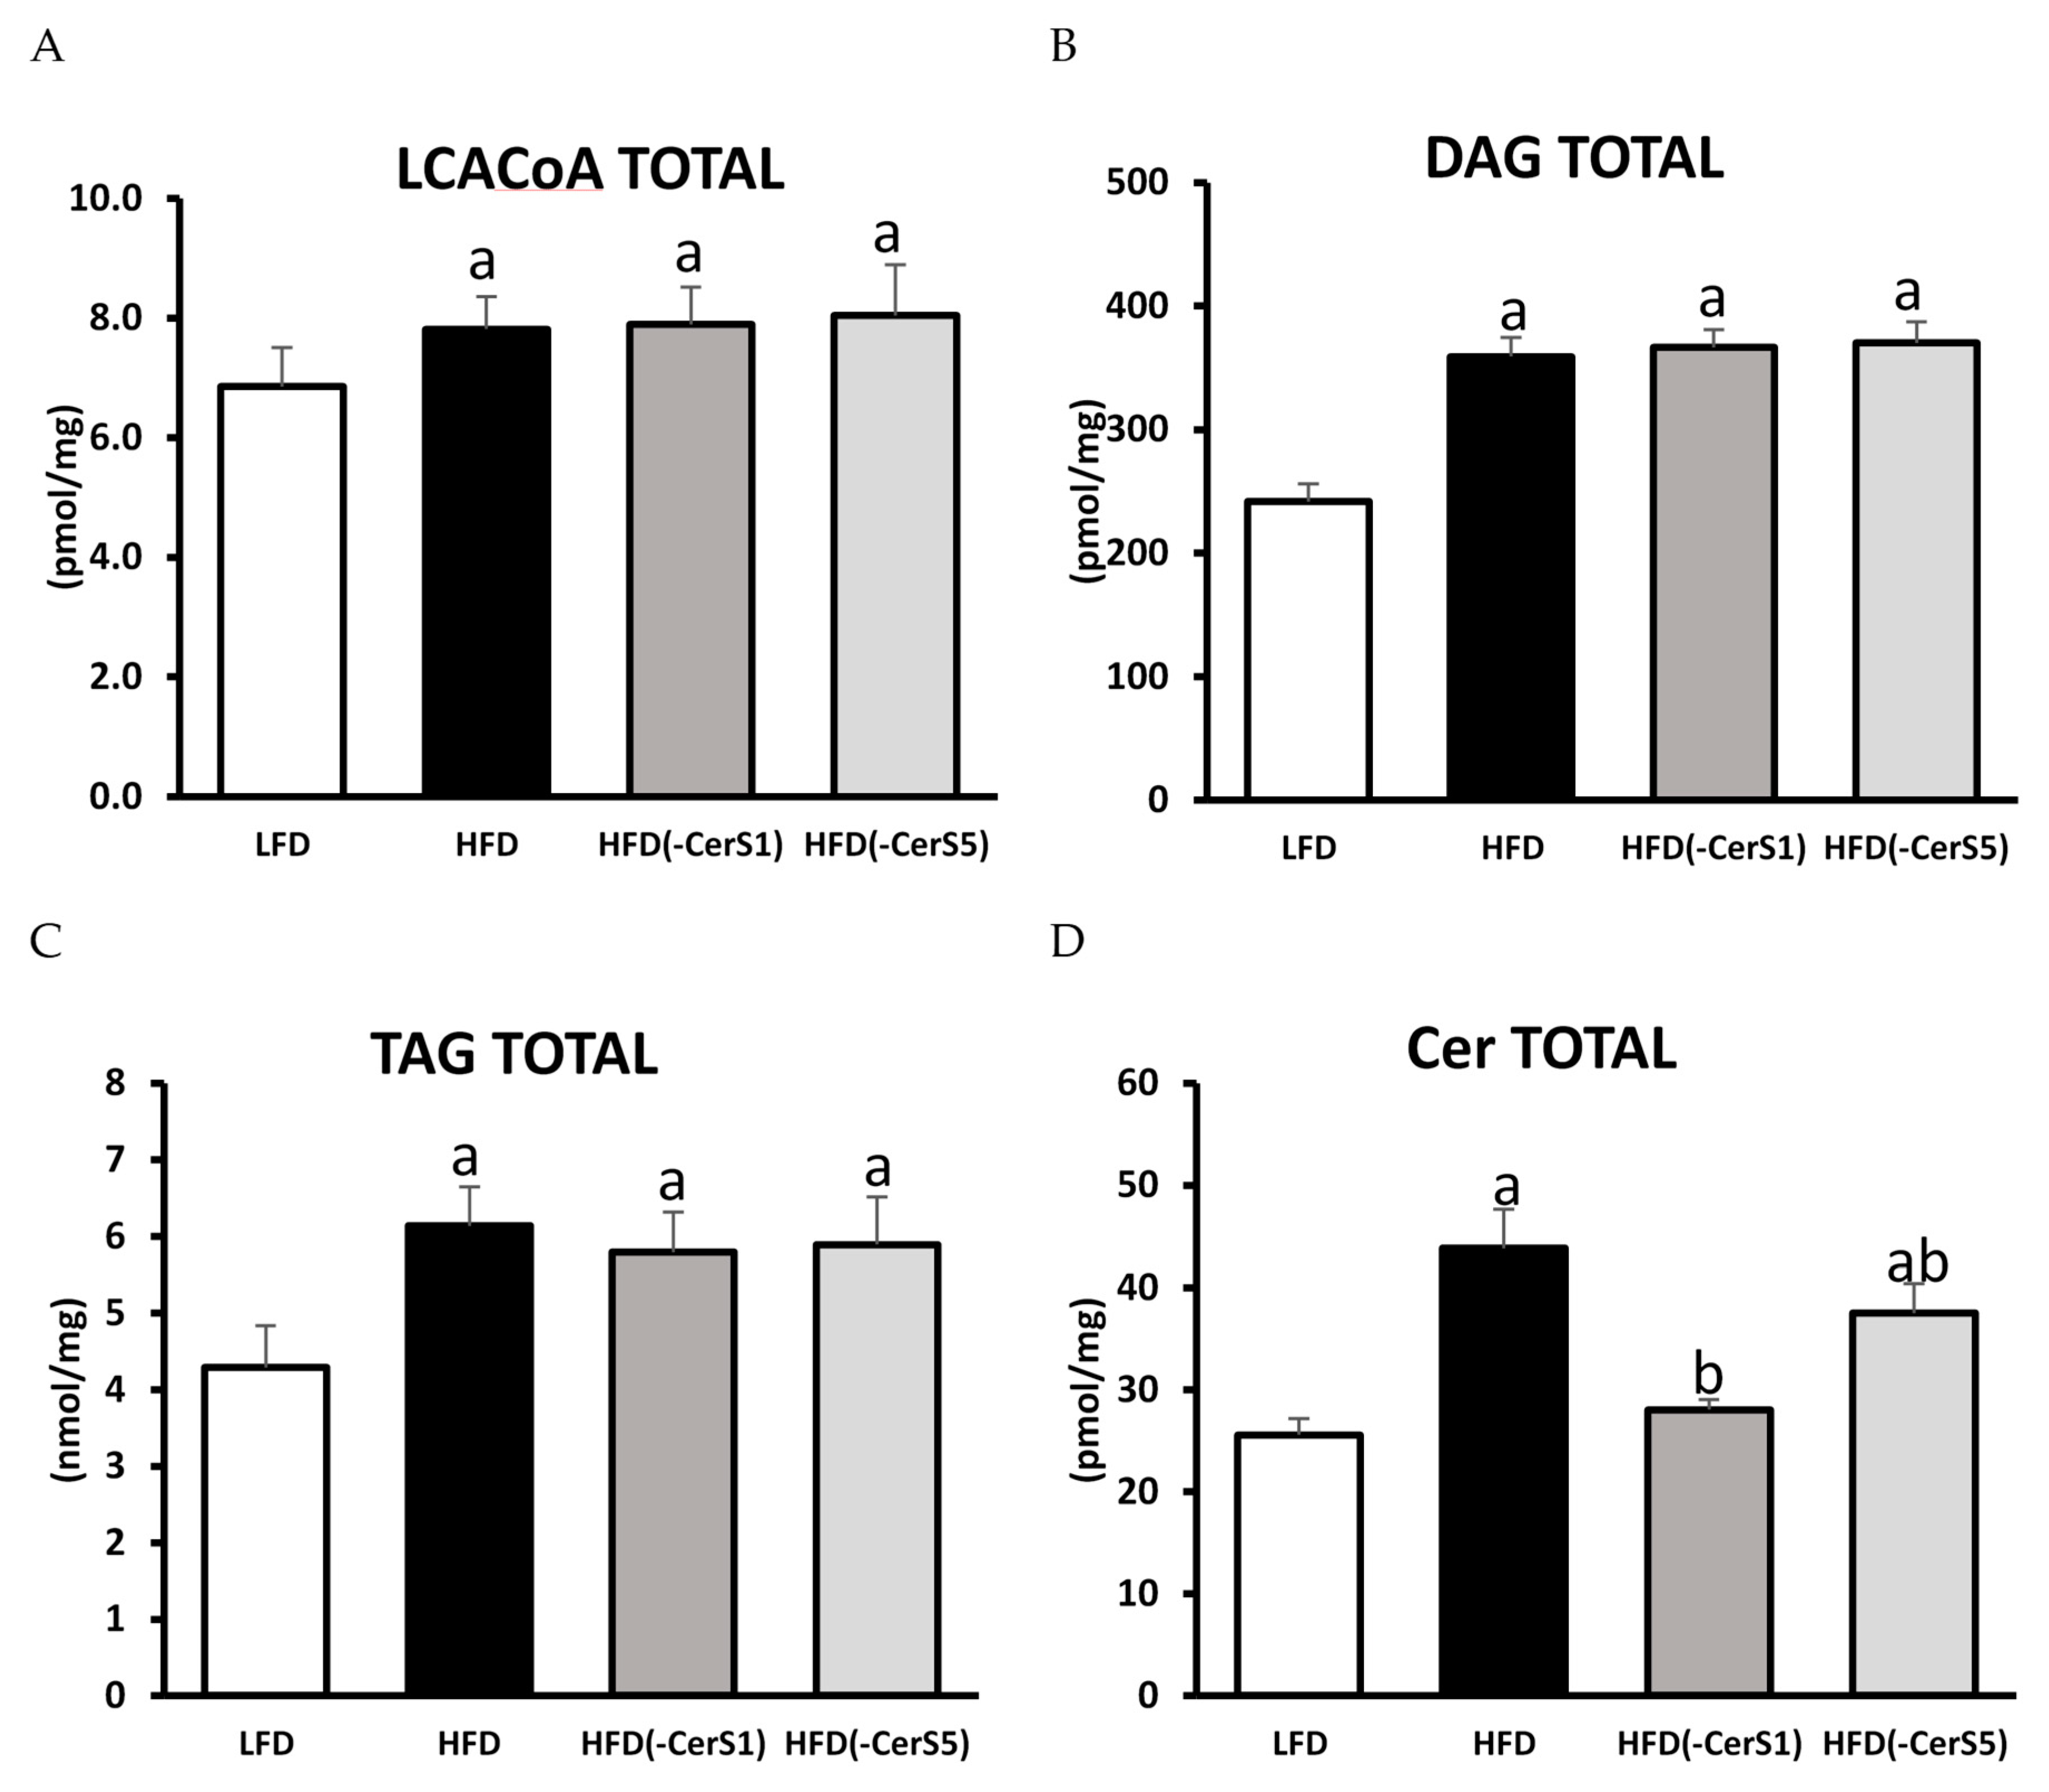
3.5.1. LCACoA
3.5.2. DAG and TAG
3.5.3. Sphingolipids
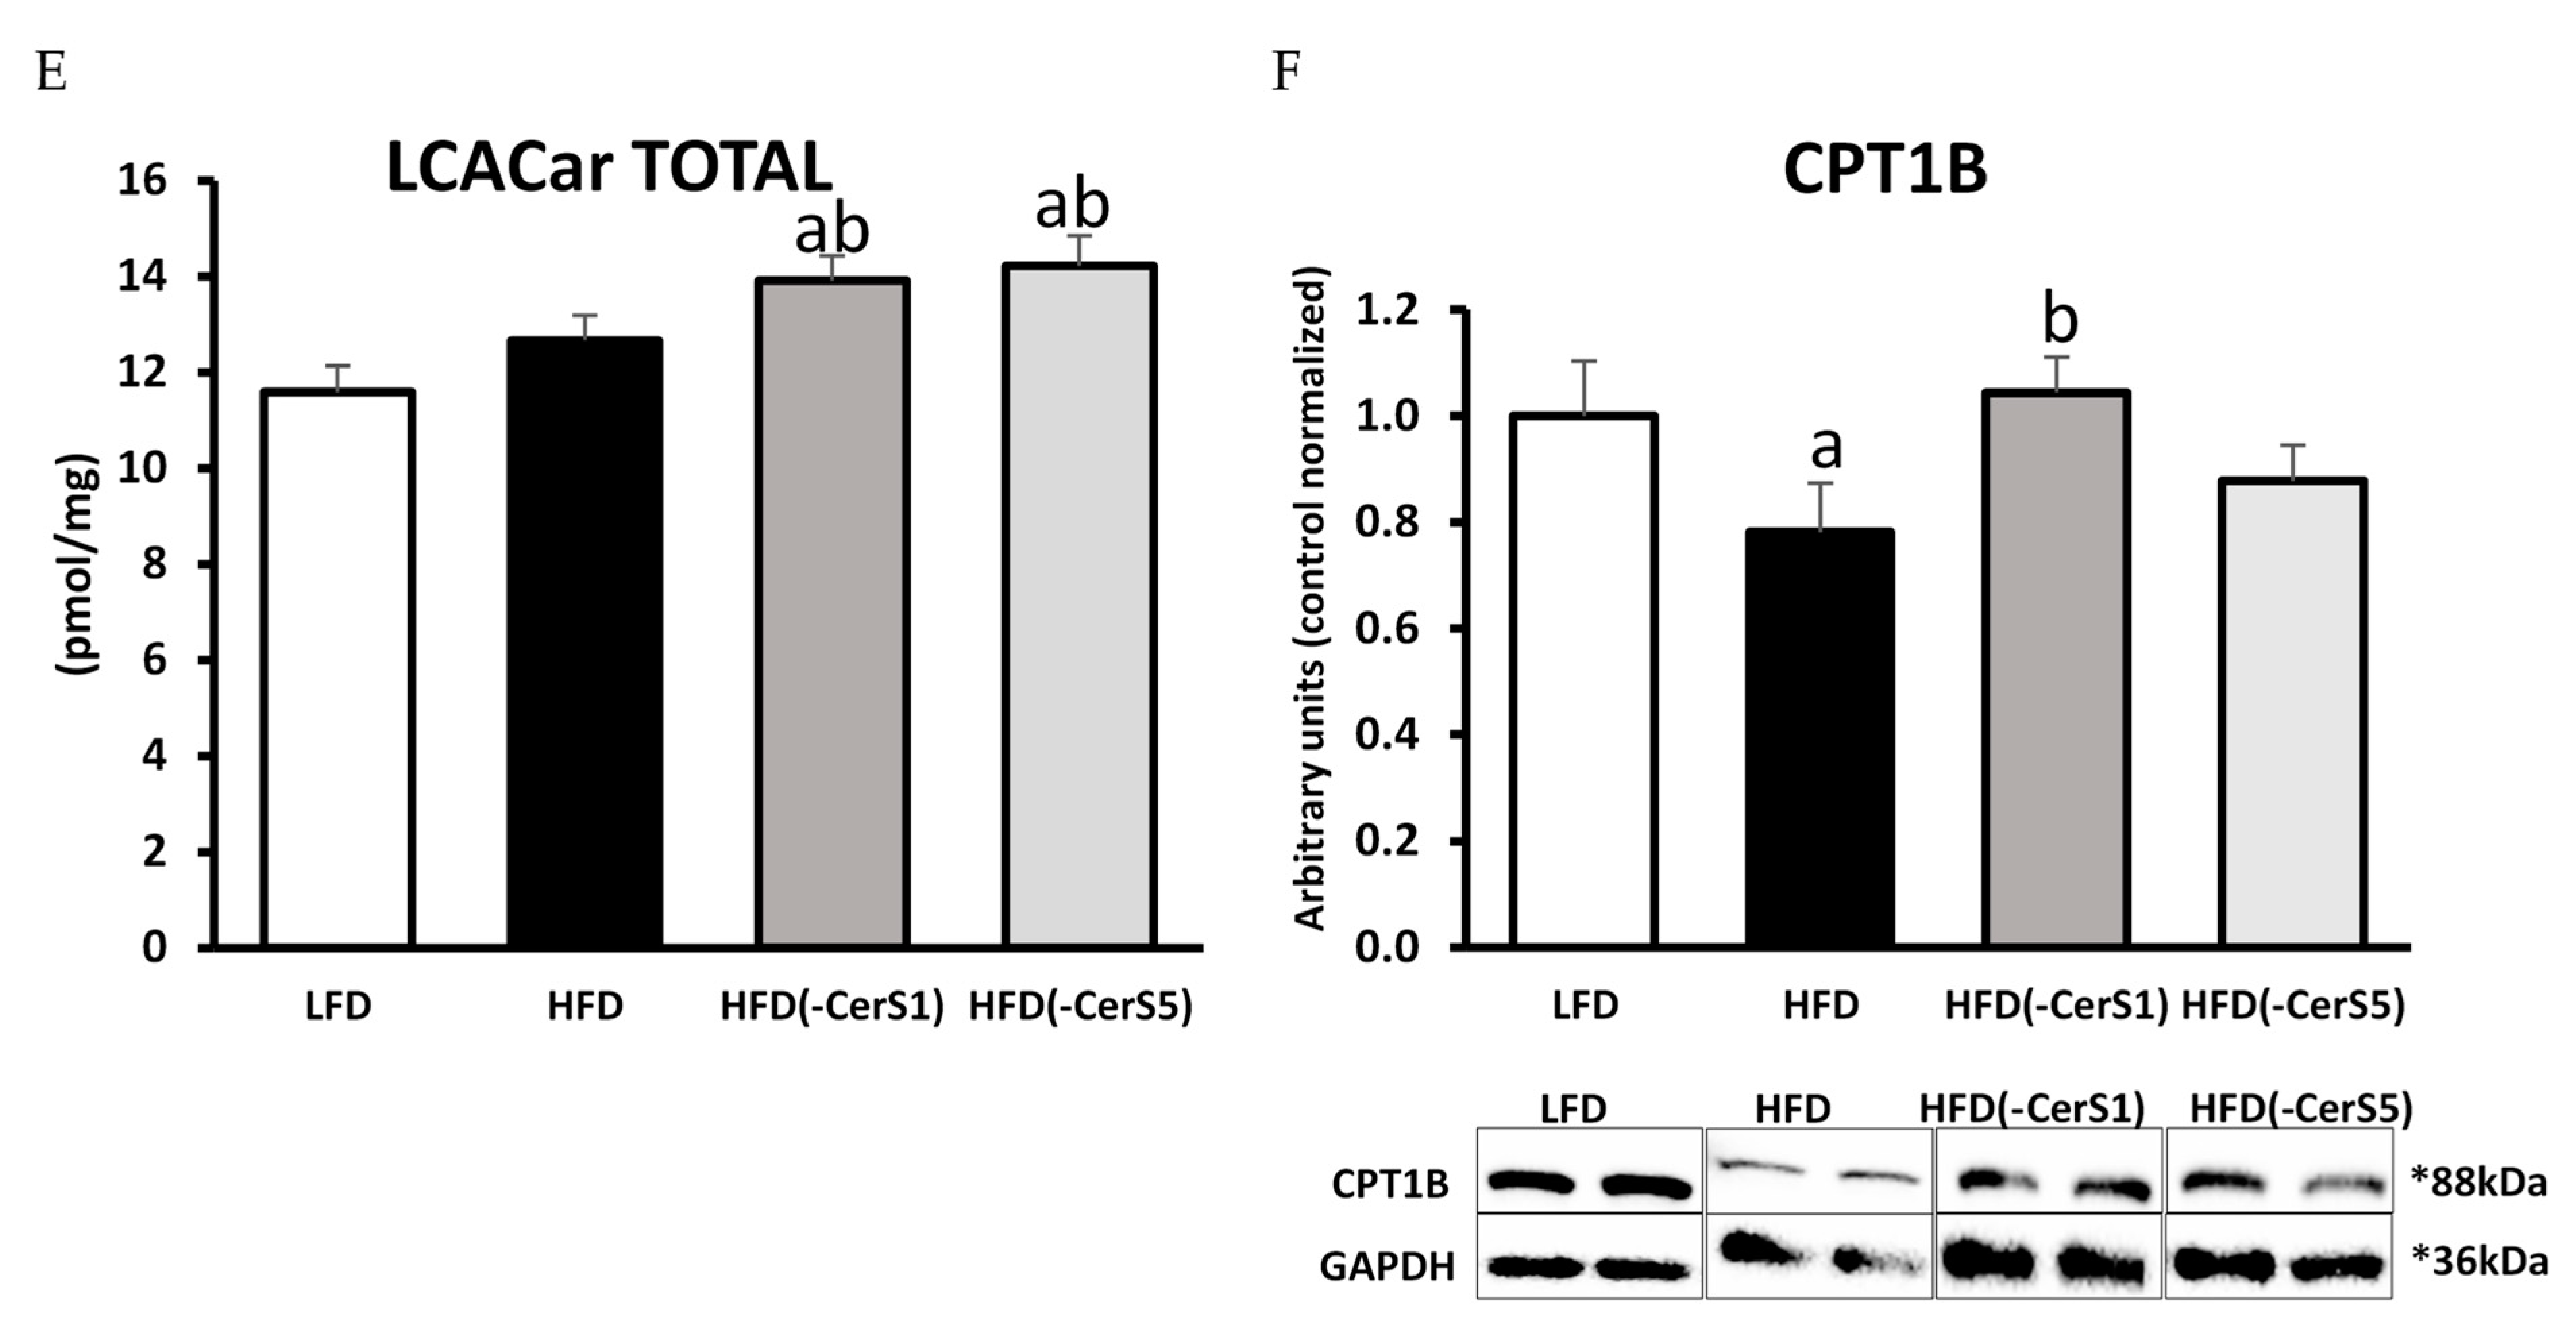
3.5.4. Acyl-Carnitines
3.6. CPT1
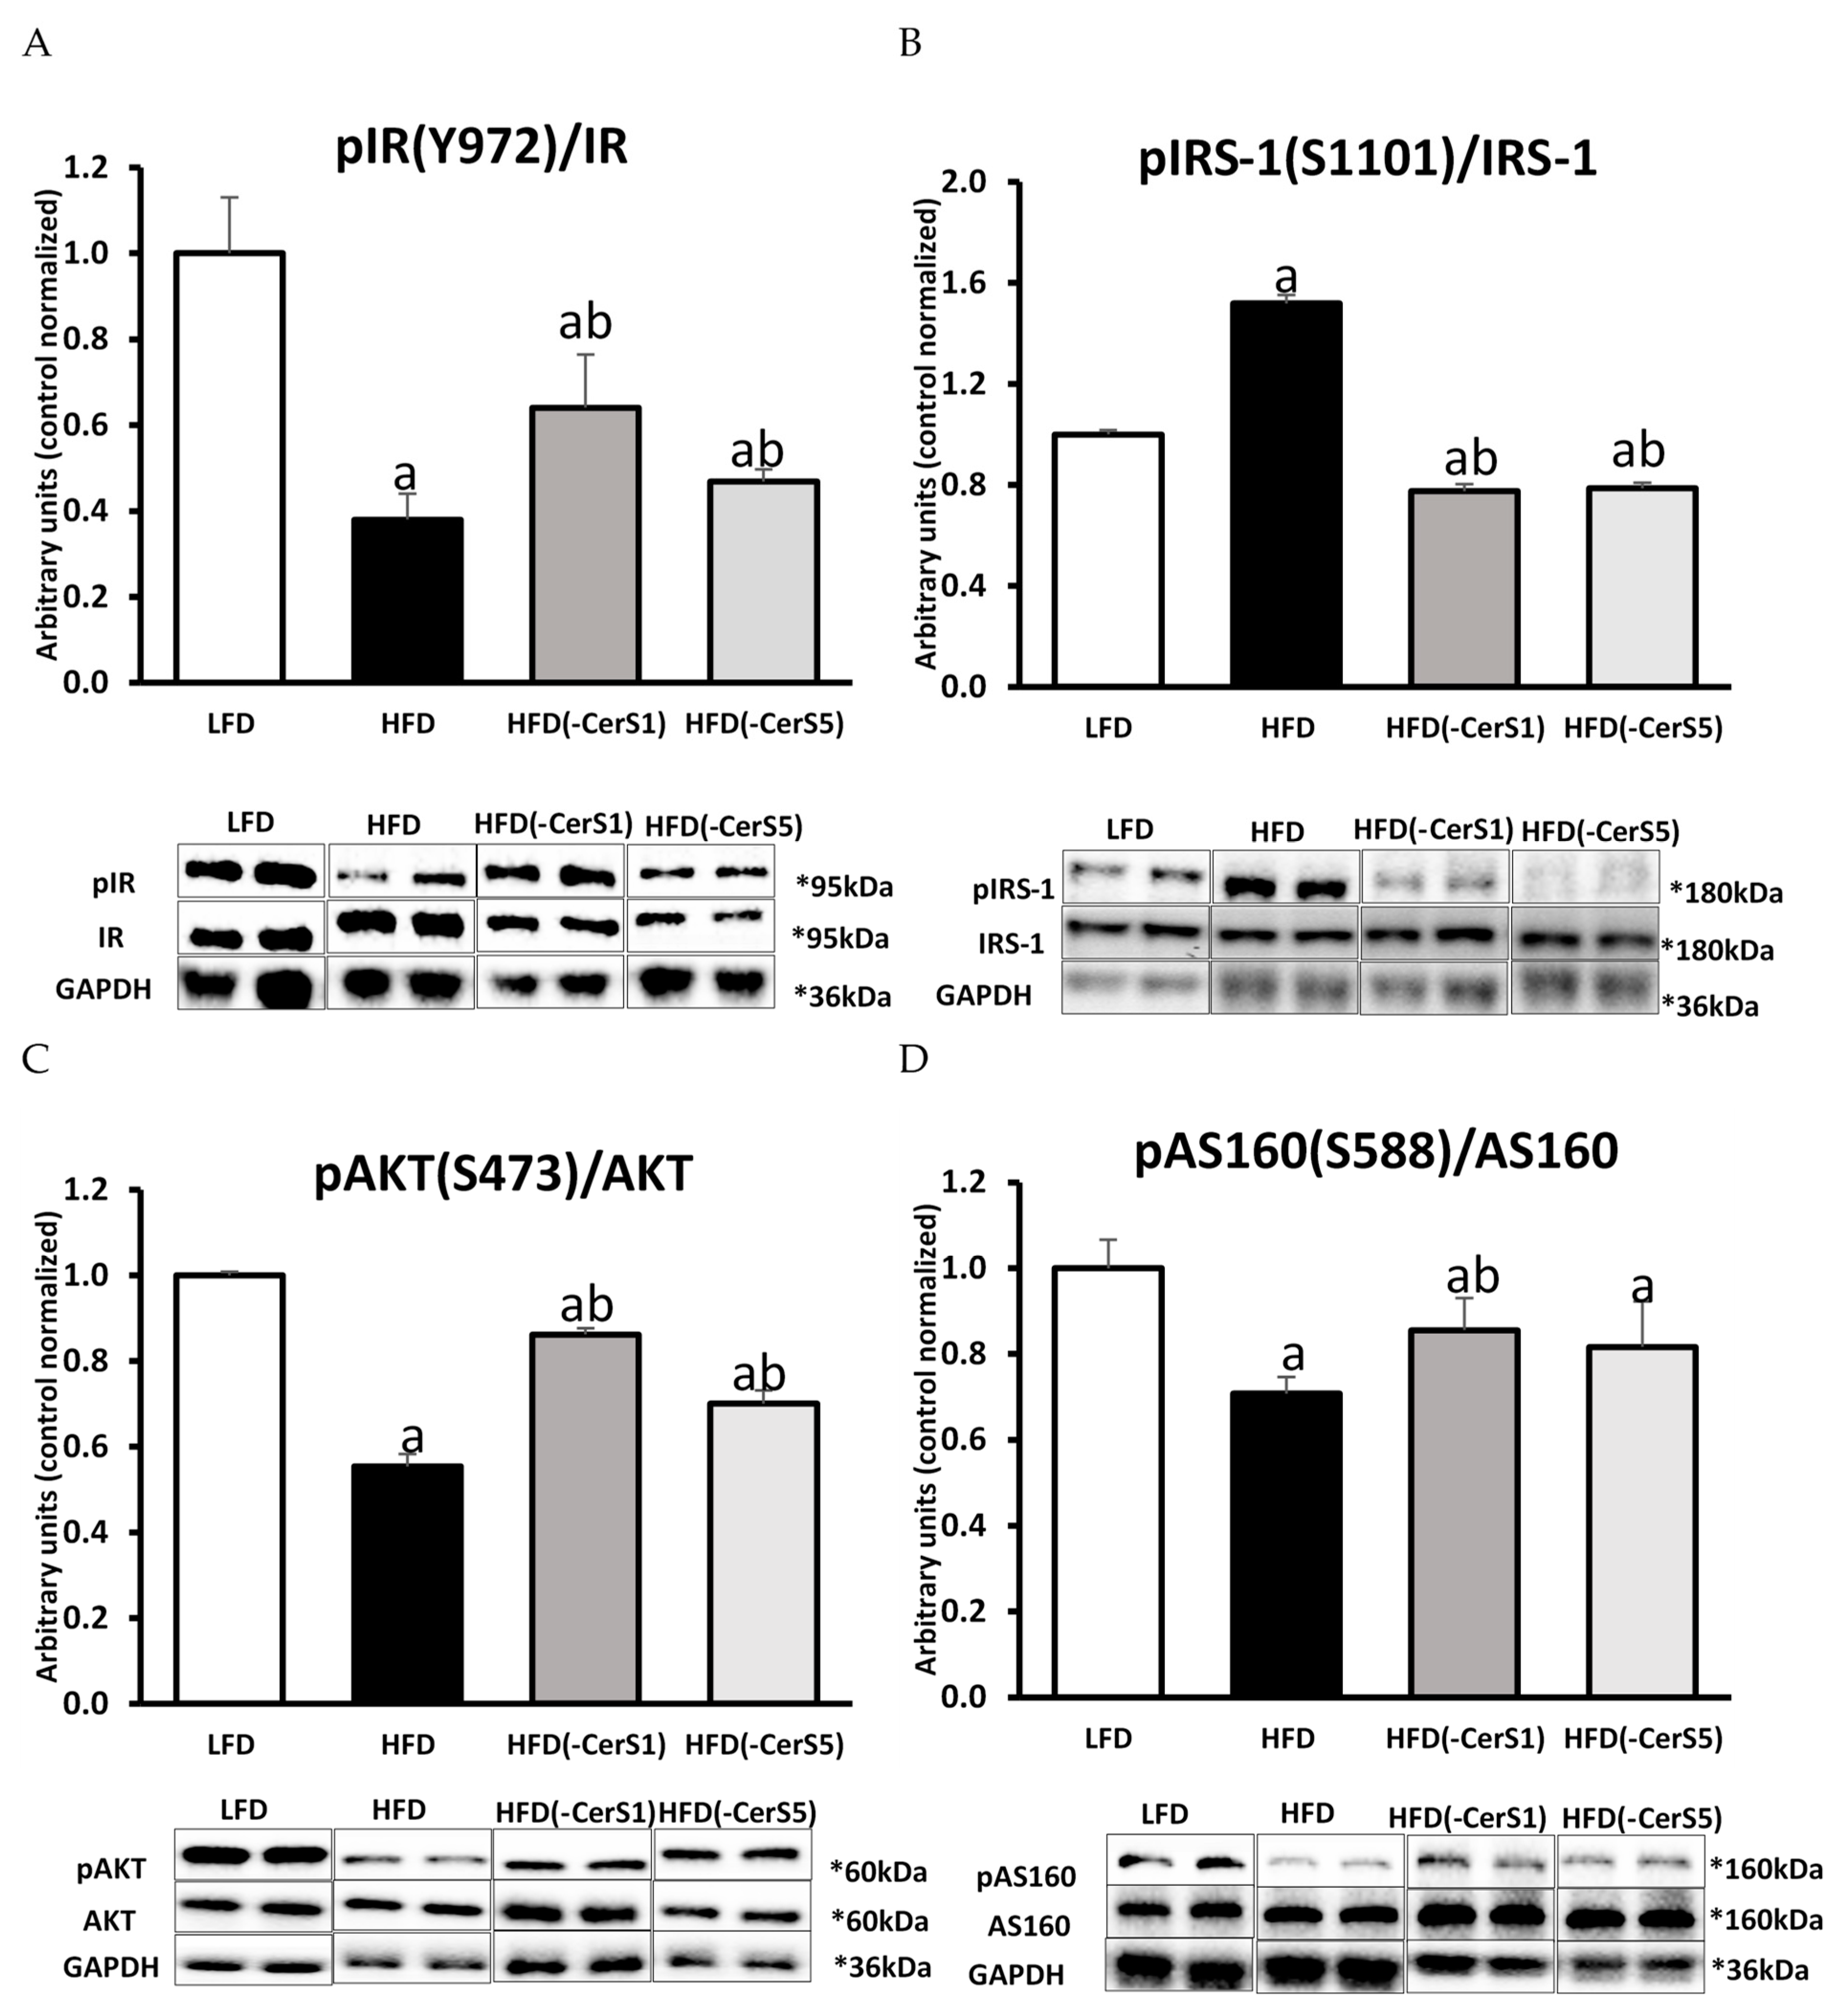
3.7. Insulin Signaling Pathway
3.7.1. Insulin Receptor (IR)
3.7.2. Insulin Receptor Substrate 1 (IRS-1)
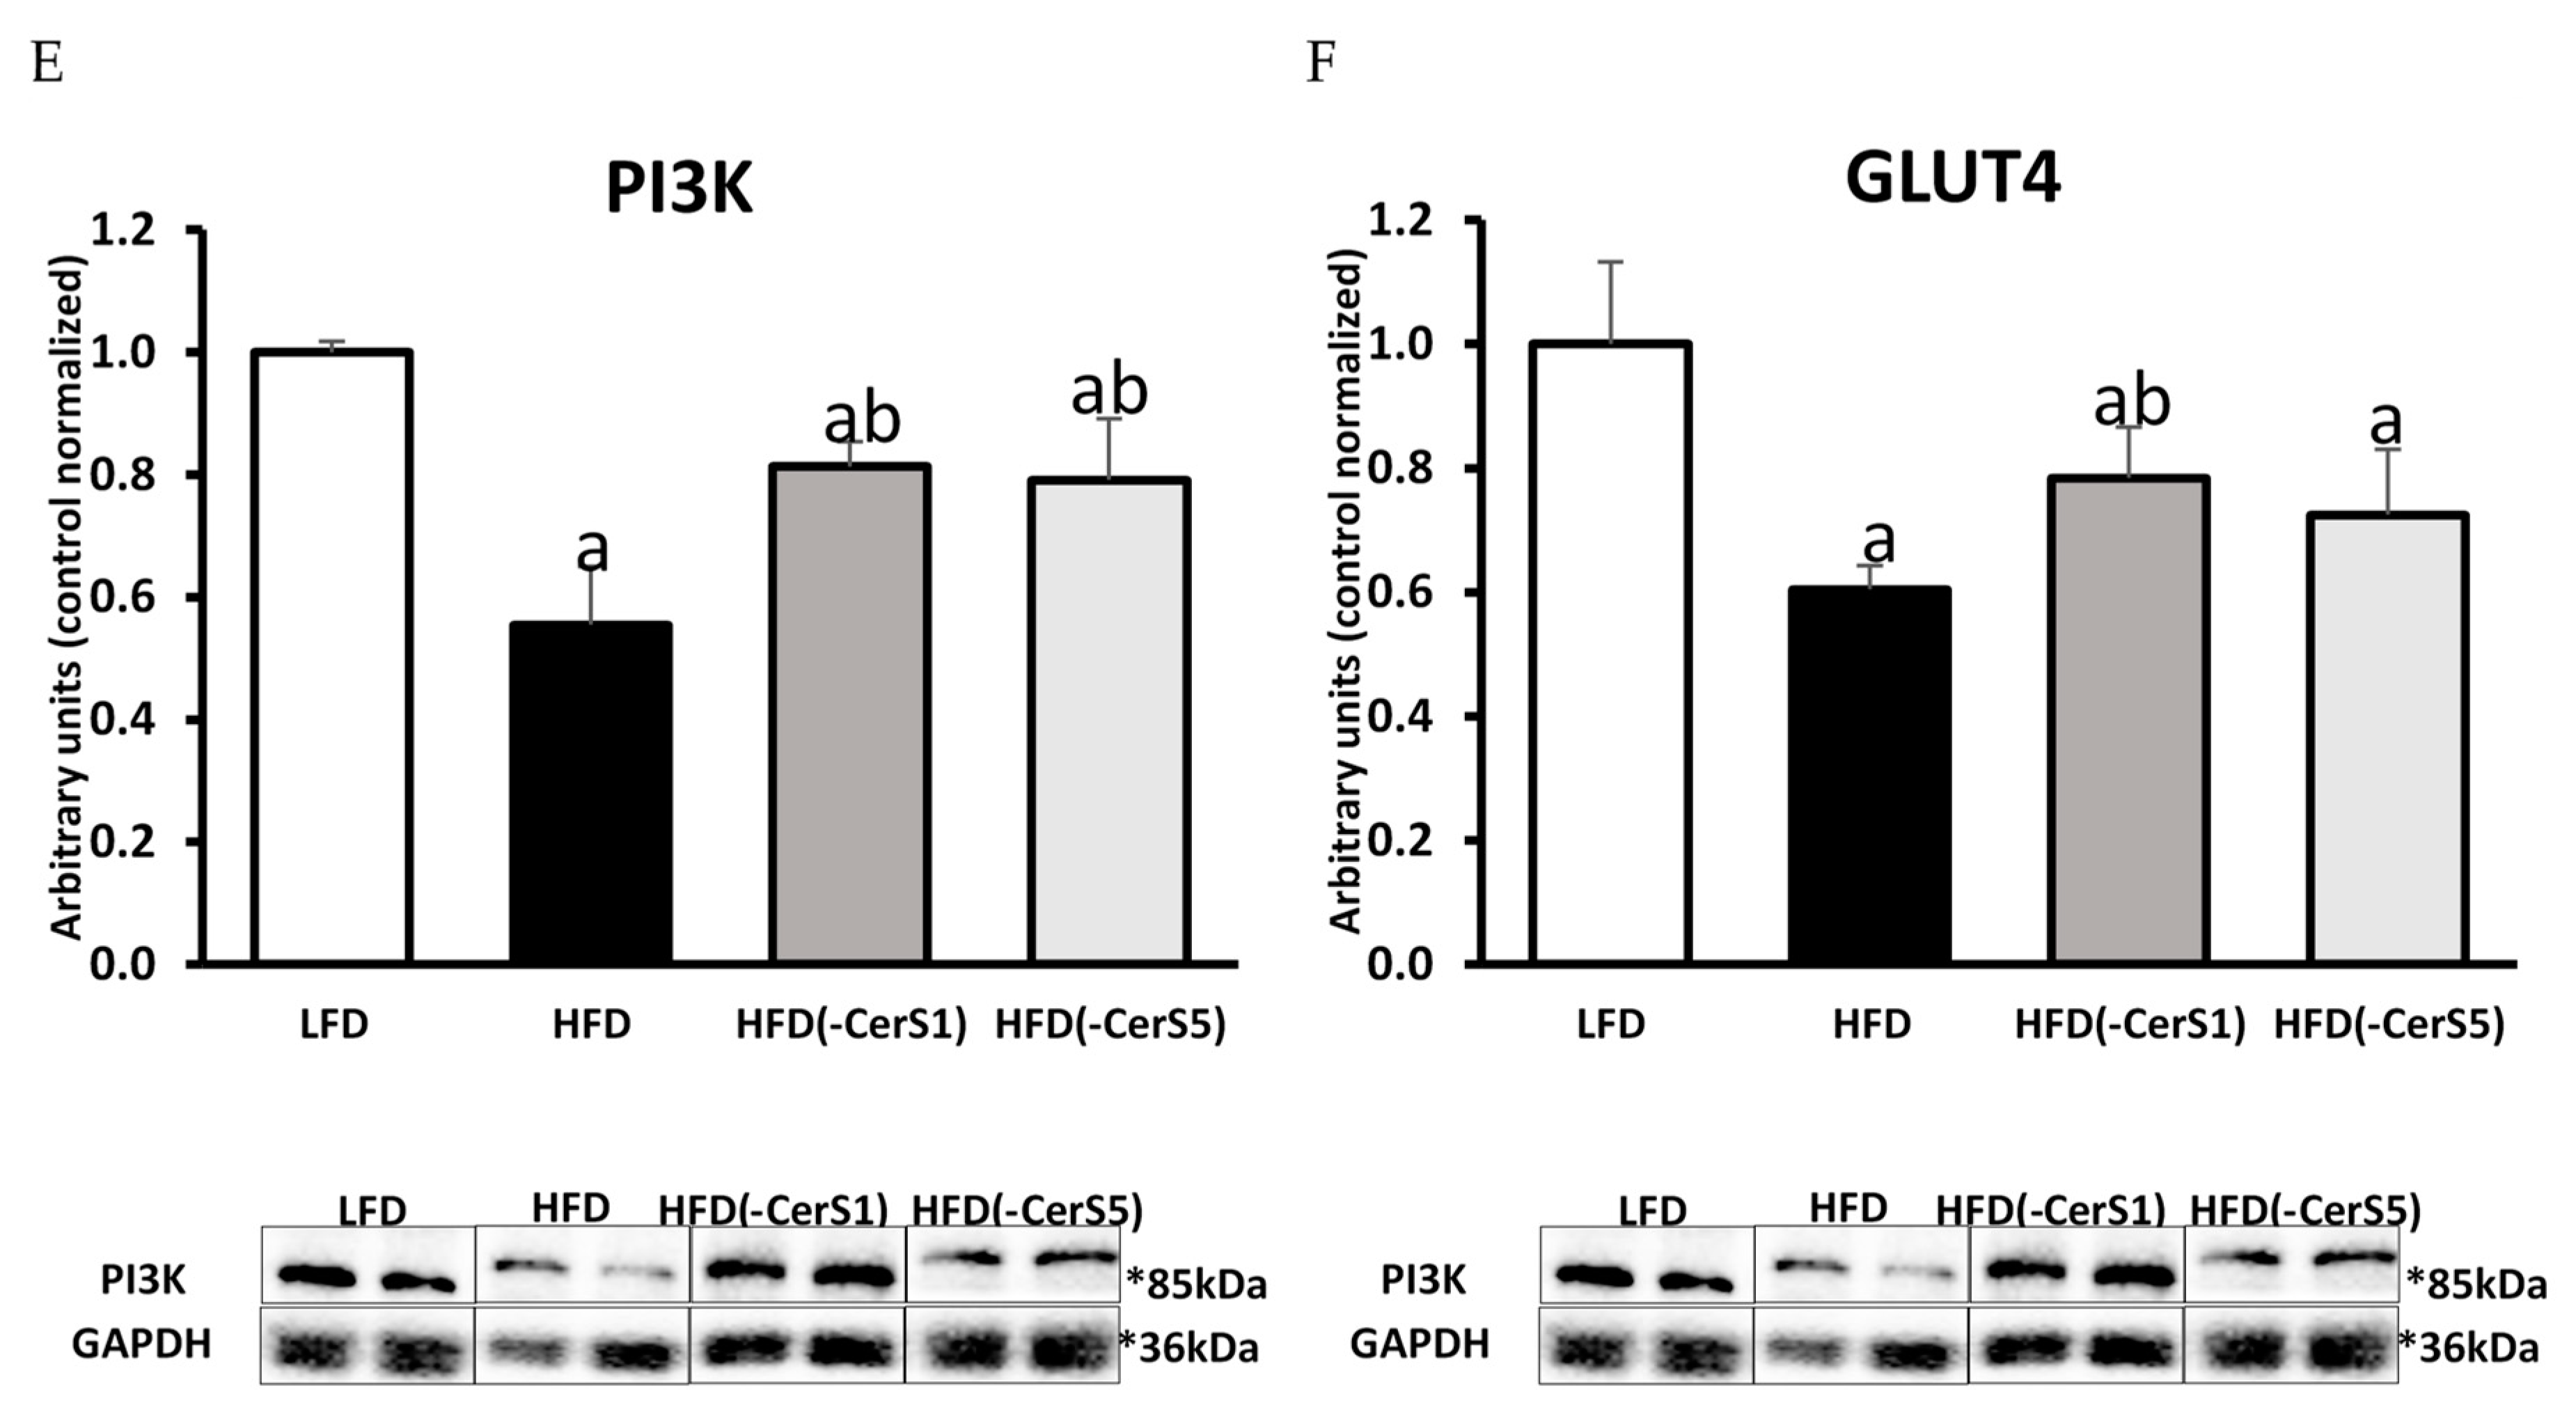
3.7.3. Phosphoinositide 3-Kinase (PI3K)
3.7.4. Protein Kinase B/Akt
3.7.5. Protein AS160
3.7.6. Glucose Transporter Type 4 (GLUT-4)
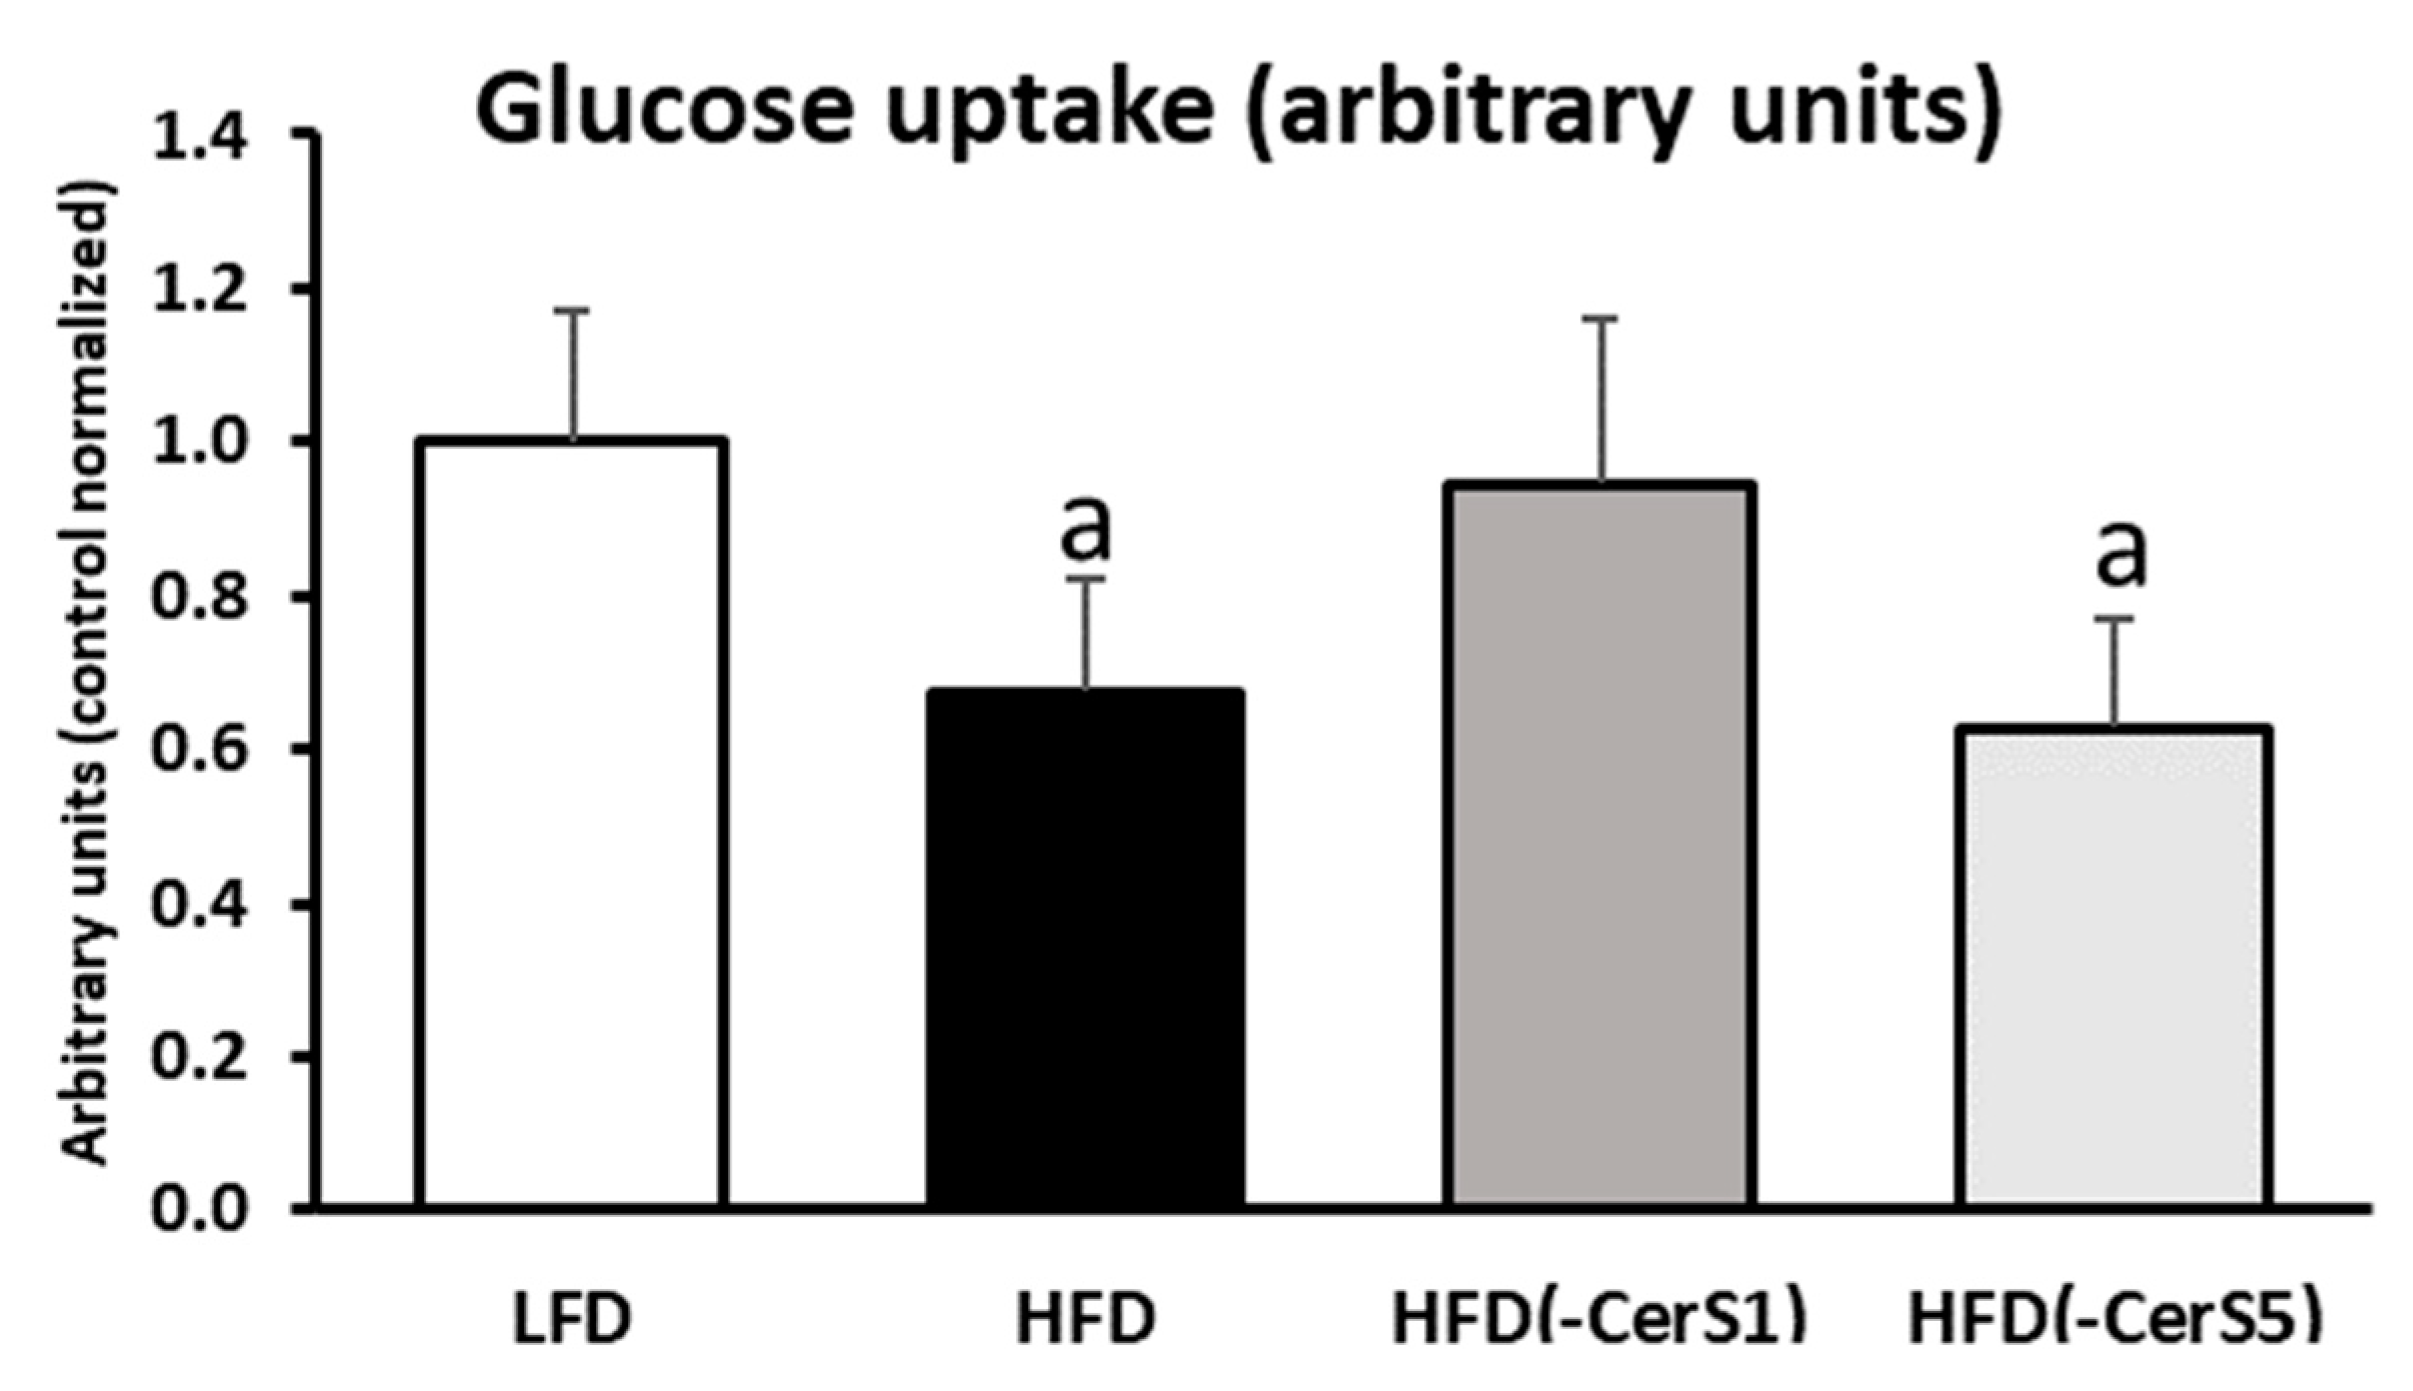
3.8. Insulin-Stimulated Glucose Uptake
4. Discussion
5. Conclusions
Supplementary Materials
Author Contributions
Funding
Institutional Review Board Statement
Informed Consent Statement
Data Availability Statement
Conflicts of Interest
References
- Kojta, I.; Chacińska, M.; Błachnio-Zabielska, A. Obesity, bioactive lipids, and adipose tissue inflammation in insulin resistance. Nutrients 2020, 12, 1305. [Google Scholar] [CrossRef] [PubMed]
- Sarma, S.; Sockalingam, S.; Dash, S. Obesity as a multisystem disease: Trends in obesity rates and obesity-related complications. Diabetes Obes. Metab. 2021, 23 (Suppl. S1), 3–16. [Google Scholar] [CrossRef] [PubMed]
- Belfort, R.; Mandarino, L.; Kashyap, S.; Wirfel, K.; Pratipanawatr, T.; Berria, R.; Defronzo, R.A.; Cusi, K. Dose-response effect of elevated plasma free fatty acid on insulin signaling. Diabetes 2005, 54, 1640–1648. [Google Scholar] [CrossRef] [Green Version]
- Abumrad, N.; Harmon, C.; Ibrahimi, A. Membrane transport of long-chain fatty acids: Evidence for a facilitated process. J. Lipid Res. 1998, 39, 2309–2318. [Google Scholar] [CrossRef]
- Schwieterman, W.; Sorrentino, D.; Potter, B.J.; Rand, J.; Kiang, C.L.; Stump, D.; Berk, P.D. Uptake of oleate by isolated rat adipocytes is mediated by a 40-kDa plasma membrane fatty acid binding protein closely related to that in liver and gut. Proc. Natl. Acad. Sci. USA 1988, 85, 359–363. [Google Scholar] [CrossRef] [Green Version]
- Grevengoed, T.J.; Klett, E.L.; Coleman, R.A. Acyl-CoA metabolism and partitioning. Annu. Rev. Nutr. 2014, 34, 1–30. [Google Scholar] [CrossRef] [Green Version]
- Turner, N.; Cooney, G.J.; Kraegen, E.W.; Bruce, C.R. Fatty acid metabolism, energy expenditure and insulin resistance in muscle. J. Endocrinol. 2014, 220, T61–T79. [Google Scholar] [CrossRef] [Green Version]
- Blachnio-Zabielska, A.U.; Hady, H.R.; Markowski, A.R.; Kurianiuk, A.; Karwowska, A.; Górski, J.; Zabielski, P. Inhibition of ceramide de novo synthesis affects adipocytokine secretion and improves systemic and adipose tissue insulin sensitivity. Int. J. Mol. Sci. 2018, 19, 3995. [Google Scholar] [CrossRef] [PubMed] [Green Version]
- Grycel, S.; Markowski, A.R.; Hady, H.R.; Zabielski, P.; Kojta, I.; Imierska, M.; Górski, J.; Blachnio-Zabielska, A.U. Metformin treatment affects adipocytokine secretion and lipid composition in adipose tissues of diet-induced insulin-resistant rats. Nutrition 2019, 63–64, 126–133. [Google Scholar] [CrossRef]
- Zabielski, P.; Hady, H.R.; Chacinska, M.; Roszczyc, K.; Gorski, J.; Blachnio-Zabielska, A.U. The effect of high fat diet and metformin treatment on liver lipids accumulation and their impact on insulin action. Sci. Rep. 2018, 8, 7249. [Google Scholar] [CrossRef] [Green Version]
- Zabielski, P.; Daniluk, J.; Hady, H.R.; Markowski, A.R.; Imierska, M.; Górski, J.; Blachnio-Zabielska, A.U. The effect of high-fat diet and inhibition of ceramide production on insulin action in liver. J. Cell Physiol. 2018, 234, 1851–1861. [Google Scholar] [CrossRef] [PubMed]
- Kurek, K.; Piotrowska, D.M.; Wiesiołek-Kurek, P.; Łukaszuk, B.; Chabowski, A.; Górski, J.; Zendzian-Piotrowska, M. Inhibition of ceramide de novo synthesis reduces liver lipid accumulation in rats with nonalcoholic fatty liver disease. Liver Int. 2014, 34, 1074–1083. [Google Scholar] [CrossRef] [PubMed]
- Blachnio-Zabielska, A.U.; Chacinska, M.; Vendelbo, M.H.; Zabielski, P. The crucial role of C18-Cer in fat-induced skeletal muscle insulin resistance. Cell Physiol. Biochem. 2016, 40, 1207–1220. [Google Scholar] [CrossRef]
- Zabielski, P.; Chacinska, M.; Charkiewicz, K.; Baranowski, M.; Gorski, J.; Blachnio-Zabielska, A.U. Effect of metformin on bioactive lipid metabolism in insulin-resistant muscle. J. Endocrinol. 2017, 233, 329–340. [Google Scholar] [CrossRef] [Green Version]
- Turinsky, J.; O’Sullivan, D.M.; Bayly, B.P. 1,2-Diacylglycerol and ceramide levels in insulin-resistant tissues of the rat in vivo. J. Biol. Chem. 1990, 265, 16880–16885. [Google Scholar] [CrossRef]
- Adams, J.M., 2nd; Pratipanawatr, T.; Berria, R.; Wang, E.; DeFronzo, R.A.; Sullards, M.C.; Mandarino, L.J. Ceramide content is increased in skeletal muscle from obese insulin-resistant humans. Diabetes 2004, 53, 25–31. [Google Scholar] [CrossRef] [Green Version]
- Schmitz-Peiffer, C.; Craig, D.L.; Biden, T.J. Ceramide generation is sufficient to account for the inhibition of the insulin-stimulated PKB pathway in C2C12 skeletal muscle cells pretreated with palmitate. J. Biol. Chem. 1999, 274, 24202–24210. [Google Scholar] [CrossRef] [Green Version]
- Levy, M.; Futerman, A.H. Mammalian ceramide synthases. IUBMB Life 2010, 62, 347–356. [Google Scholar] [CrossRef]
- Turpin-Nolan, S.M.; Hammerschmidt, P.; Chen, W.; Jais, A.; Timper, K.; Awazawa, M.; Brodesser, S.; Brüning, J.C. CerS1-Derived C. Cell Rep. 2019, 26, 1–10.e7. [Google Scholar] [CrossRef] [Green Version]
- Turner, N.; Lim, X.Y.; Toop, H.D.; Osborne, B.; Brandon, A.E.; Taylor, E.N.; Fiveash, C.E.; Govindaraju, H.; Teo, J.D.; McEwen, H.P.; et al. A selective inhibitor of ceramide synthase 1 reveals a novel role in fat metabolism. Nat. Commun. 2018, 9, 3165. [Google Scholar] [CrossRef]
- Sokołowska, E.; Błachnio-Zabielska, A.U. A critical review of electroporation as a plasmid delivery system in mouse skeletal muscle. Int. J. Mol. Sci. 2019, 20, 2776. [Google Scholar] [CrossRef] [PubMed] [Green Version]
- Persson, X.M.; Blachnio-Zabielska, A.U.; Jensen, M.D. Rapid measurement of plasma free fatty acid concentration and isotopic enrichment using LC/MS. J. Lipid Res. 2010, 51, 2761–2765. [Google Scholar] [CrossRef] [PubMed] [Green Version]
- Blachnio-Zabielska, A.U.; Persson, X.M.; Koutsari, C.; Zabielski, P.; Jensen, M.D. A liquid chromatography/tandem mass spectrometry method for measuring the in vivo incorporation of plasma free fatty acids into intramyocellular ceramides in humans. Rapid Commun. Mass Spectrom. 2012, 26, 1134–1140. [Google Scholar] [CrossRef] [PubMed] [Green Version]
- Blachnio-Zabielska, A.U.; Zabielski, P.; Jensen, M.D. Intramyocellular diacylglycerol concentrations and [U-13C]palmitate isotopic enrichment measured by LC/MS/MS. J. Lipid Res. 2013, 54, 1705–1711. [Google Scholar] [CrossRef] [Green Version]
- Blachnio-Zabielska, A.U.; Koutsari, C.; Jensen, M.D. Measuring long-chain acyl-coenzyme A concentrations and enrichment using liquid chromatography/tandem mass spectrometry with selected reaction monitoring. Rapid Commun. Mass Spectrom. 2011, 25, 2223–2230. [Google Scholar] [CrossRef] [PubMed] [Green Version]
- Minkler, P.E.; Kerner, J.; Ingalls, S.T.; Hoppel, C.L. Novel isolation procedure for short-, medium-, and long-chain acyl-coenzyme A esters from tissue. Anal. Biochem. 2008, 376, 275–276. [Google Scholar] [CrossRef] [Green Version]
- Giesbertz, P.; Ecker, J.; Haag, A.; Spanier, B.; Daniel, H. An LC-MS/MS method to quantify acylcarnitine species including isomeric and odd-numbered forms in plasma and tissues. J. Lipid Res. 2015, 56, 2029–2039. [Google Scholar] [CrossRef] [Green Version]
- Kojta, I.; Zabielski, P.; Roszczyc-Owsiejczuk, K.; Imierska, M.; Sokołowska, E.; Błachnio-Zabielska, A. GPAT gene silencing in muscle reduces diacylglycerols content and improves insulin action in diet-induced insulin resistance. Int. J. Mol. Sci. 2020, 21, 7369. [Google Scholar] [CrossRef]
- Fueger, P.T.; Shearer, J.; Bracy, D.P.; Posey, K.A.; Pencek, R.R.; McGuinness, O.P.; Wasserman, D.H. Control of muscle glucose uptake: Test of the rate-limiting step paradigm in conscious, unrestrained mice. J. Physiol. 2005, 562, 925–935. [Google Scholar] [CrossRef]
- Cacho, J.; Sevillano, J.; de Castro, J.; Herrera, E.; Ramos, M.P. Validation of simple indexes to assess insulin sensitivity during pregnancy in Wistar and Sprague-Dawley rats. Am. J. Physiol. Endocrinol. Metab. 2008, 295, E1269–E1276. [Google Scholar] [CrossRef]
- Dohm, G.L.; Tapscott, E.B.; Pories, W.J.; Dabbs, D.J.; Flickinger, E.G.; Meelheim, D.; Fushiki, T.; Atkinson, S.M.; Elton, C.W.; Caro, J.F. An in vitro human muscle preparation suitable for metabolic studies. Decreased insulin stimulation of glucose transport in muscle from morbidly obese and diabetic subjects. J. Clin. Invest. 1988, 82, 486–494. [Google Scholar] [CrossRef] [Green Version]
- Hulver, M.W.; Berggren, J.R.; Cortright, R.N.; Dudek, R.W.; Thompson, R.P.; Pories, W.J.; MacDonald, K.G.; Cline, G.W.; Shulman, G.I.; Dohm, G.L.; et al. Skeletal muscle lipid metabolism with obesity. Am. J. Physiol. Endocrinol. Metab. 2003, 284, E741–E747. [Google Scholar] [CrossRef]
- Nishizuka, Y. Protein kinase C and lipid signaling for sustained cellular responses. FASEB J. 1995, 9, 484–496. [Google Scholar] [CrossRef] [PubMed]
- Szendroedi, J.; Yoshimura, T.; Phielix, E.; Koliaki, C.; Marcucci, M.; Zhang, D.; Jelenik, T.; Muller, J.; Herder, C.; Nowotny, P.; et al. Role of diacylglycerol activation of PKCtheta in lipid-induced muscle insulin resistance in humans. Proc. Natl. Acad. Sci. USA 2014, 111, 9597–9602. [Google Scholar] [CrossRef] [PubMed] [Green Version]
- Hegarty, B.D.; Furler, S.M.; Ye, J.; Cooney, G.J.; Kraegen, E.W. The role of intramuscular lipid in insulin resistance. Acta Physiol. Scand. 2003, 178, 373–383. [Google Scholar] [CrossRef] [PubMed]
- Sokolowska, E.; Blachnio-Zabielska, A. The role of ceramides in insulin resistance. Front. Endocrinol. 2019, 10, 577. [Google Scholar] [CrossRef] [PubMed] [Green Version]
- Reidy, P.T.; Mahmassani, Z.S.; McKenzie, A.I.; Petrocelli, J.J.; Summers, S.A.; Drummond, M.J. Influence of exercise training on skeletal muscle insulin resistance in aging: Spotlight on muscle ceramides. Int. J. Mol. Sci. 2020, 21, 1514. [Google Scholar] [CrossRef] [Green Version]
- Górski, J. Ceramide and insulin resistance: How should the issue be approached? Diabetes 2012, 61, 3081–3083. [Google Scholar] [CrossRef] [Green Version]
- Bandet, C.L.; Tan-Chen, S.; Bourron, O.; Le Stunff, H.; Hajduch, E. Sphingolipid metabolism: New insight into ceramide-induced lipotoxicity in muscle cells. Int. J. Mol. Sci. 2019, 20, 479. [Google Scholar] [CrossRef] [Green Version]
- Fillmore, N.; Keung, W.; Kelly, S.E.; Proctor, S.D.; Lopaschuk, G.D.; Ussher, J.R. Accumulation of ceramide in slow-twitch muscle contributes to the development of insulin resistance in the obese JCR:LA-cp rat. Exp. Physiol. 2015, 100, 730–741. [Google Scholar] [CrossRef]
- Bergman, B.C.; Brozinick, J.T.; Strauss, A.; Bacon, S.; Kerege, A.; Bui, H.H.; Sanders, P.; Siddall, P.; Wei, T.; Thomas, M.K.; et al. Muscle sphingolipids during rest and exercise: A C18:0 signature for insulin resistance in humans. Diabetologia 2016, 59, 785–798. [Google Scholar] [CrossRef] [PubMed] [Green Version]
- Mahfouz, R.; Khoury, R.; Blachnio-Zabielska, A.; Turban, S.; Loiseau, N.; Lipina, C.; Stretton, C.; Bourron, O.; Ferré, P.; Foufelle, F.; et al. Characterising the inhibitory actions of ceramide upon insulin signaling in different skeletal muscle cell models: A mechanistic insight. PLoS ONE 2014, 9, e101865. [Google Scholar] [CrossRef]
- Summers, S.A.; Chaurasia, B.; Holland, W.L. Metabolic Messengers: Ceramides. Nat. Metab. 2019, 1, 1051–1058. [Google Scholar] [CrossRef] [PubMed]
- Stratford, S.; Hoehn, K.L.; Liu, F.; Summers, S.A. Regulation of insulin action by ceramide—Dual mechanisms linking ceramide accumulation to the inhibition of Akt/protein kinase B. J. Biol. Chem. 2004, 279, 36608–36615. [Google Scholar] [CrossRef] [PubMed] [Green Version]
- Chavez, J.A.; Knotts, T.A.; Wang, L.P.; Li, G.; Dobrowsky, R.T.; Florant, G.L.; Summers, S.A. A role for ceramide, but not diacylglycerol, in the antagonism of insulin signal transduction by saturated fatty acids. J. Biol. Chem. 2003, 278, 10297–10303. [Google Scholar] [CrossRef] [PubMed] [Green Version]
- Hsieh, C.T.; Chuang, J.H.; Yang, W.C.; Yin, Y.; Lin, Y. Ceramide inhibits insulin-stimulated Akt phosphorylation through activation of Rheb/mTORC1/S6K signaling in skeletal muscle. Cell. Signal. 2014, 26, 1400–1408. [Google Scholar] [CrossRef] [PubMed]
- Holland, W.L.; Brozinick, J.T.; Wang, L.P.; Hawkins, E.D.; Sargent, K.M.; Liu, Y.; Narra, K.; Hoehn, K.L.; Knotts, T.A.; Siesky, A.; et al. Inhibition of ceramide synthesis ameliorates glucocorticoid-, saturated-fat-, and obesity-induced insulin resistance. Cell Metab. 2007, 5, 167–179. [Google Scholar] [CrossRef] [Green Version]
- Thrush, A.B.; Harasim, E.; Chabowski, A.; Gulli, R.; Stefanyk, L.; Dyck, D.J. A single prior bout of exercise protects against palmitate-induced insulin resistance despite an increase in total ceramide content. Am. J. Physiol. Regul. Integr. Comp. Physiol. 2011, 300, R1200–R1208. [Google Scholar] [CrossRef] [Green Version]
- Turpin, S.M.; Nicholls, H.T.; Willmes, D.M.; Mourier, A.; Brodesser, S.; Wunderlich, C.M.; Mauer, J.; Xu, E.; Hammerschmidt, P.; Bronneke, H.S.; et al. Obesity-induced CerS6-dependent C16:0 ceramide production promotes weight gain and glucose intolerance. Cell. Metab. 2014, 20, 678–686. [Google Scholar] [CrossRef] [Green Version]
- Lair, B.; Laurens, C.; Van Den Bosch, B.; Moro, C. Novel insights and mechanisms of lipotoxicity-driven insulin resistance. Int. J. Mol. Sci. 2020, 21, 6358. [Google Scholar] [CrossRef]
- Raichur, S.; Brunner, B.; Bielohuby, M.; Hansen, G.; Pfenninger, A.; Wang, B.; Bruning, J.C.; Larsen, P.J.; Tennagels, N. The role of C16:0 ceramide in the development of obesity and type 2 diabetes: CerS6 inhibition as a novel therapeutic approach. Mol. Metab. 2019, 21, 36–50. [Google Scholar] [CrossRef] [PubMed]

| LFD | HFD | |
|---|---|---|
| Glucose (mg/dL) | 101 ± 7.9 | 186 ± 25.2 a |
| Insulin (ng/mL) | 0.82 ± 0.11 | 1.68 ± 0.07 a |
| OGTT AUC (×104) | 2.29 ± 0.14 | 4.02 ± 0.34 a |
| ITT AUC (×104) | 0.78 ± 0.02 | 1.84 ± 0.16 a |
| HOMA-IR | 1.09 ± 0.09 | 3.17 ± 0.44 a |
| FFA (nmol/mL) | 266.8 ± 13.0 | 503.7 ± 18.4 a |
| C14:0-CoA | C16:0-CoA | C16:1-CoA | C18:0-CoA | C18:1-CoA | C18:2-CoA | C20:0-CoA | C22:0-CoA | C24:0-CoA | C24:1-CoA | |
|---|---|---|---|---|---|---|---|---|---|---|
| LFD | 0.11 ± 0.03 | 0.85 ± 0.10 | 0.78 ± 0.11 | 0.73 ± 0.08 | 2.59 ± 0.30 | 1.71 ± 0.29 | 0.017 ± 0.003 | 0.022 ± 0.003 | 0.028 ± 0.004 | 0.016 ± 0.005 |
| HFD | 0.20 ± 0.03 a | 0.99 ± 0.13 | 0.68 ± 0.07 | 1.20 ± 0.15 a | 2.69 ± 0.43 | 1.96 ± 0.27 | 0.019 ± 0.004 | 0.033 ± 0.005 a | 0.031 ± 0.005 | 0.009 ± 0.001 a |
| HFD(-CerS1) | 0.21 ± 0.02 a | 1.03 ± 0.23 | 0.71 ± 0.08 | 1.18 ± 0.16 a | 2.61 ± 0.32 | 2.07 ± 0.27 | 0.019 ± 0.002 | 0.035 ± 0.004 a | 0.032 ± 0.003 | 0.009 ± 0.002 a |
| HFD(-CerS5) | 0.21 ± 0.06 a | 0.99 ± 0.39 | 0.70 ± 0.08 | 1.18 ± 0.17 a | 2.67 ± 0.32 | 2.20 ± 0.32 a | 0.020 ± 0.002 | 0.035 ± 0.003 a | 0.031 ± 0.003 | 0.010 ± 0.002 a |
| 16:0/16:0 | 16:0/18:0 | 16:0/18:1 | 16:0/18:2 | 18:0/18:0 | 18:0/18:1 | 18:0/18:2 | 18:1/18:1 | 18:2/18:2 | 18:0/20:0 | |
|---|---|---|---|---|---|---|---|---|---|---|
| LFD | 13.41 ± 1.74 | 83.47 ± 10.99 | 32.18 ± 4.60 | 38.09 ± 5.47 | 2.10 ± 0.22 | 21.88 ± 2.88 | 0.96 ± 0.17 | 20.98 ± 2.14 | 24.91 ± 2.43 | 3.85 ± 0.53 |
| HFD | 16.15 ± 2.47 | 144.52 ± 16.79 a | 39.36 ± 4.67 | 66.52 ± 11.60 a | 2.92 ± 0.23 a | 22.90 ± 3.65 | 1.98 ± 0.33 a | 23.37 ± 2.21 | 34.00 ± 5.15 a | 7.23 ± 0.96 a |
| HFD(-CerS1) | 18.42 ± 2.24 a | 152.99 ± 8.93 a | 36.68 ± 5.84 | 68.10 ± 10.15 a | 2.74 ± 0.28 a | 24.04 ± 1.96 | 2.19 ± 0.29 a | 22.12 ± 4.19 | 32.27 ± 3.34 a | 6.88 ± 0.88 a |
| HFD(-CerS5) | 18.79 ± 3.12 a | 156.04 ± 12.08 a | 36.98 ± 6.09 | 68.87 ± 6.31 a | 2.81 ± 0.26 a | 23.98 ± 3.72 | 2.19 ± 0.28 a | 22.01 ± 1.81 | 31.35 ± 4.94 a | 7.12 ± 0.62 a |
| C14:0-Cer | C16:0-Cer | C18:0-Cer | C18:1-Cer | C20:0-Cer | C22:0-Cer | C24:0-Cer | C24:1-Cer | Sph | SPA | S1P | |
|---|---|---|---|---|---|---|---|---|---|---|---|
| LFD | 0.029 ± 0.002 | 1.94 ± 0.22 | 16.9 ± 1.4 | 0.56 ± 0.08 | 0.27 ± 0.04 | 0.77 ± 0.12 | 1.23 ± 0.14 | 3.8 ± 0.4 | 0.38 ± 0.05 | 0.2 ± 0.02 | 0.04 ± 0.01 |
| HFD | 0.034 ± 0.008 | 3.20 ± 0.35 a | 30.3 ± 3.4 a | 0.67 ± 0.05 a | 0.57 ± 0.09 a | 1.45 ± 0.21 a | 2.55 ± 0.32 a | 5.1 ± 0.6 a | 0.54 ± 0.12 a | 0.3 ± 0.05 a | 0.27 ± 0.01 a |
| HFD(-CerS1) | 0.033 ± 0.005 | 2.80 ± 0.36 ab | 16.5 ± 0.9 b | 0.40 ± 0.05 ab | 0.56 ± 0.09 a | 1.49 ± 0.19 a | 2.05 ± 0.24 ab | 4.2 ± 0.4 b | 0.55 ± 0.11 a | 0.3 ± 0.04 a | 0.05 ± 0.01 b |
| HFD(-CerS5) | 0.038 ± 0.010 | 1.99 ± 0.18 b | 26.5 ± 2.6 ab | 0.48 ± 0.07 b | 0.51 ± 0.07 a | 1.40 ± 0.15 a | 2.45 ± 0.27 a | 4.1 ± 0.5 b | 0.84 ± 0.14 ab | 0.3 ± 0.03 a | 0.31 ± 0.01 a |
Publisher’s Note: MDPI stays neutral with regard to jurisdictional claims in published maps and institutional affiliations. |
© 2022 by the authors. Licensee MDPI, Basel, Switzerland. This article is an open access article distributed under the terms and conditions of the Creative Commons Attribution (CC BY) license (https://creativecommons.org/licenses/by/4.0/).
Share and Cite
Błachnio-Zabielska, A.U.; Roszczyc-Owsiejczuk, K.; Imierska, M.; Pogodzińska, K.; Rogalski, P.; Daniluk, J.; Zabielski, P. CerS1 but Not CerS5 Gene Silencing, Improves Insulin Sensitivity and Glucose Uptake in Skeletal Muscle. Cells 2022, 11, 206. https://doi.org/10.3390/cells11020206
Błachnio-Zabielska AU, Roszczyc-Owsiejczuk K, Imierska M, Pogodzińska K, Rogalski P, Daniluk J, Zabielski P. CerS1 but Not CerS5 Gene Silencing, Improves Insulin Sensitivity and Glucose Uptake in Skeletal Muscle. Cells. 2022; 11(2):206. https://doi.org/10.3390/cells11020206
Chicago/Turabian StyleBłachnio-Zabielska, Agnieszka U., Kamila Roszczyc-Owsiejczuk, Monika Imierska, Karolina Pogodzińska, Paweł Rogalski, Jarosław Daniluk, and Piotr Zabielski. 2022. "CerS1 but Not CerS5 Gene Silencing, Improves Insulin Sensitivity and Glucose Uptake in Skeletal Muscle" Cells 11, no. 2: 206. https://doi.org/10.3390/cells11020206
APA StyleBłachnio-Zabielska, A. U., Roszczyc-Owsiejczuk, K., Imierska, M., Pogodzińska, K., Rogalski, P., Daniluk, J., & Zabielski, P. (2022). CerS1 but Not CerS5 Gene Silencing, Improves Insulin Sensitivity and Glucose Uptake in Skeletal Muscle. Cells, 11(2), 206. https://doi.org/10.3390/cells11020206