
Liposome-Mediated Gene Transfer in Differentiated HepaRG™ Cells: Expression of Liver Specific Functions and Application to the Cytochrome P450 2D6 Expression
 , , and
Abstract
:1. Introduction
2. Materials and Methods
2.1. Hepatoma Cell and Primary Human Hepatocyte Cultures
2.2. Plasmids, Liposome Preparation and Lipofection
2.3. Fluorescence Microscopy and Flow Cytometry
2.4. Cell Viability
2.5. RNA Expression and RT-qPCR
2.6. Determination of Catalytic Activities of Phase I and II Enzymes by LC/MS-MS
2.7. DNA Replication Assay
2.8. Protein Expression by Immunoblotting
2.9. Statistical Analyses
3. Results
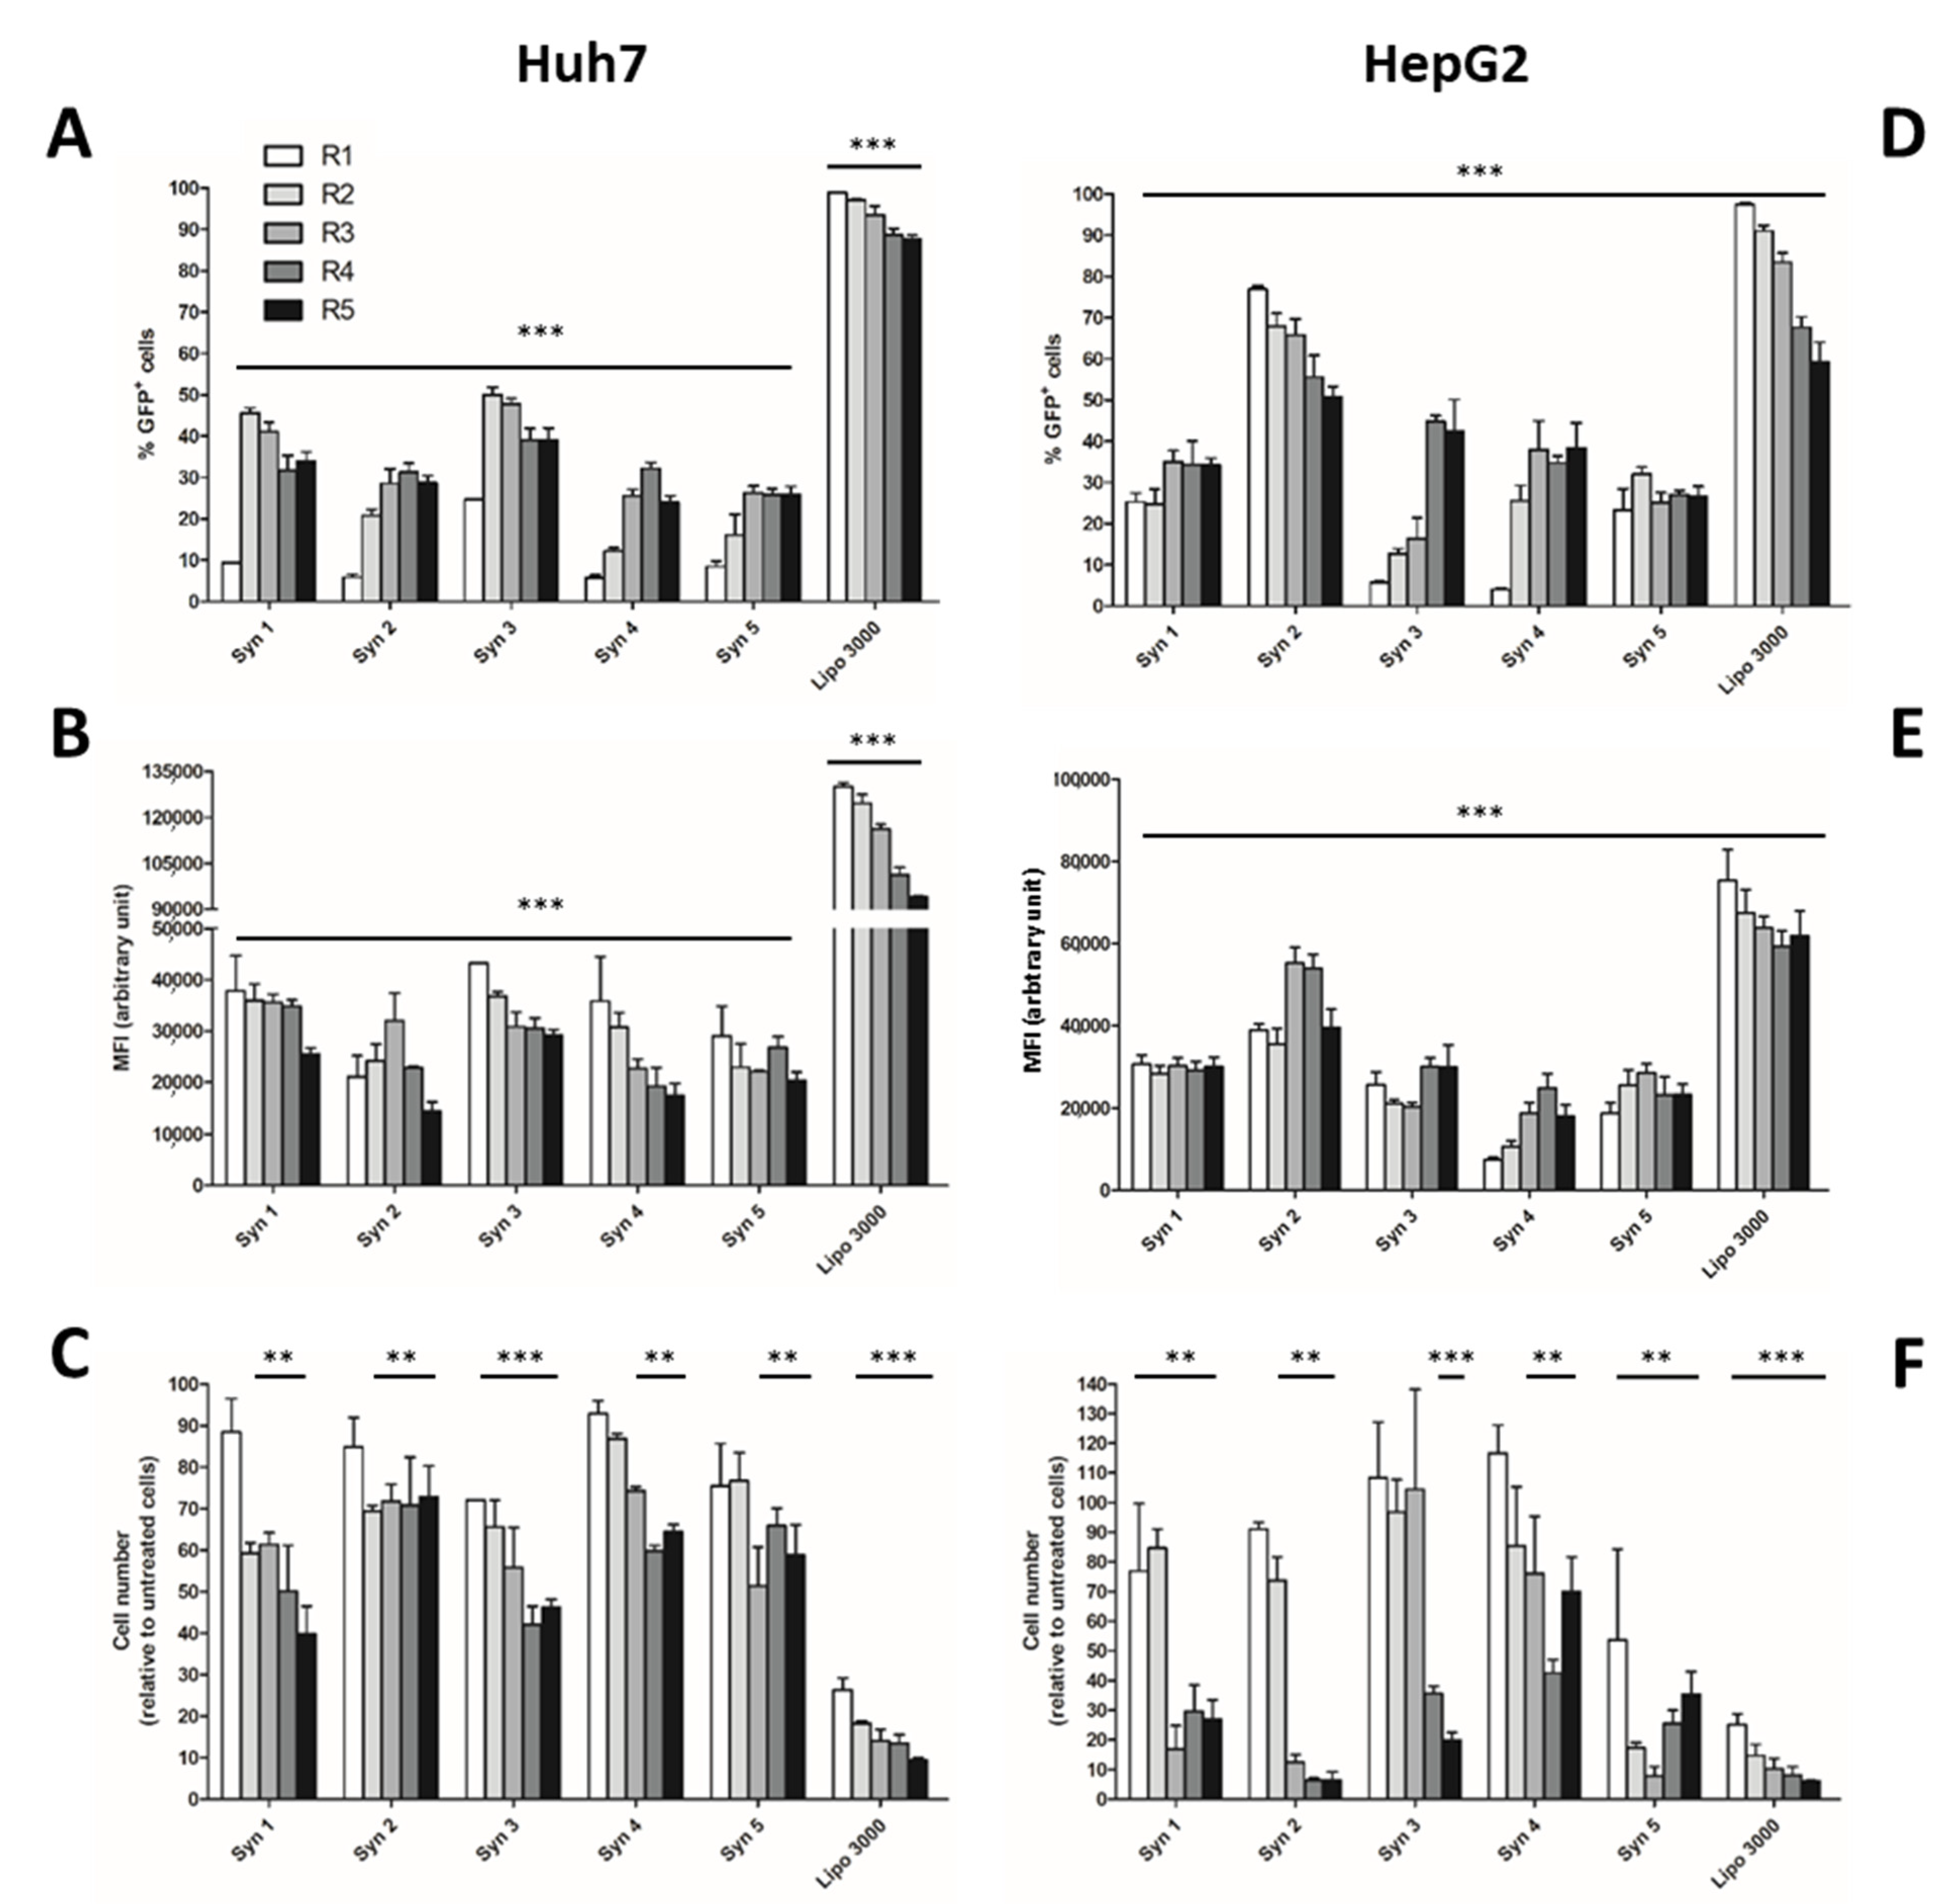
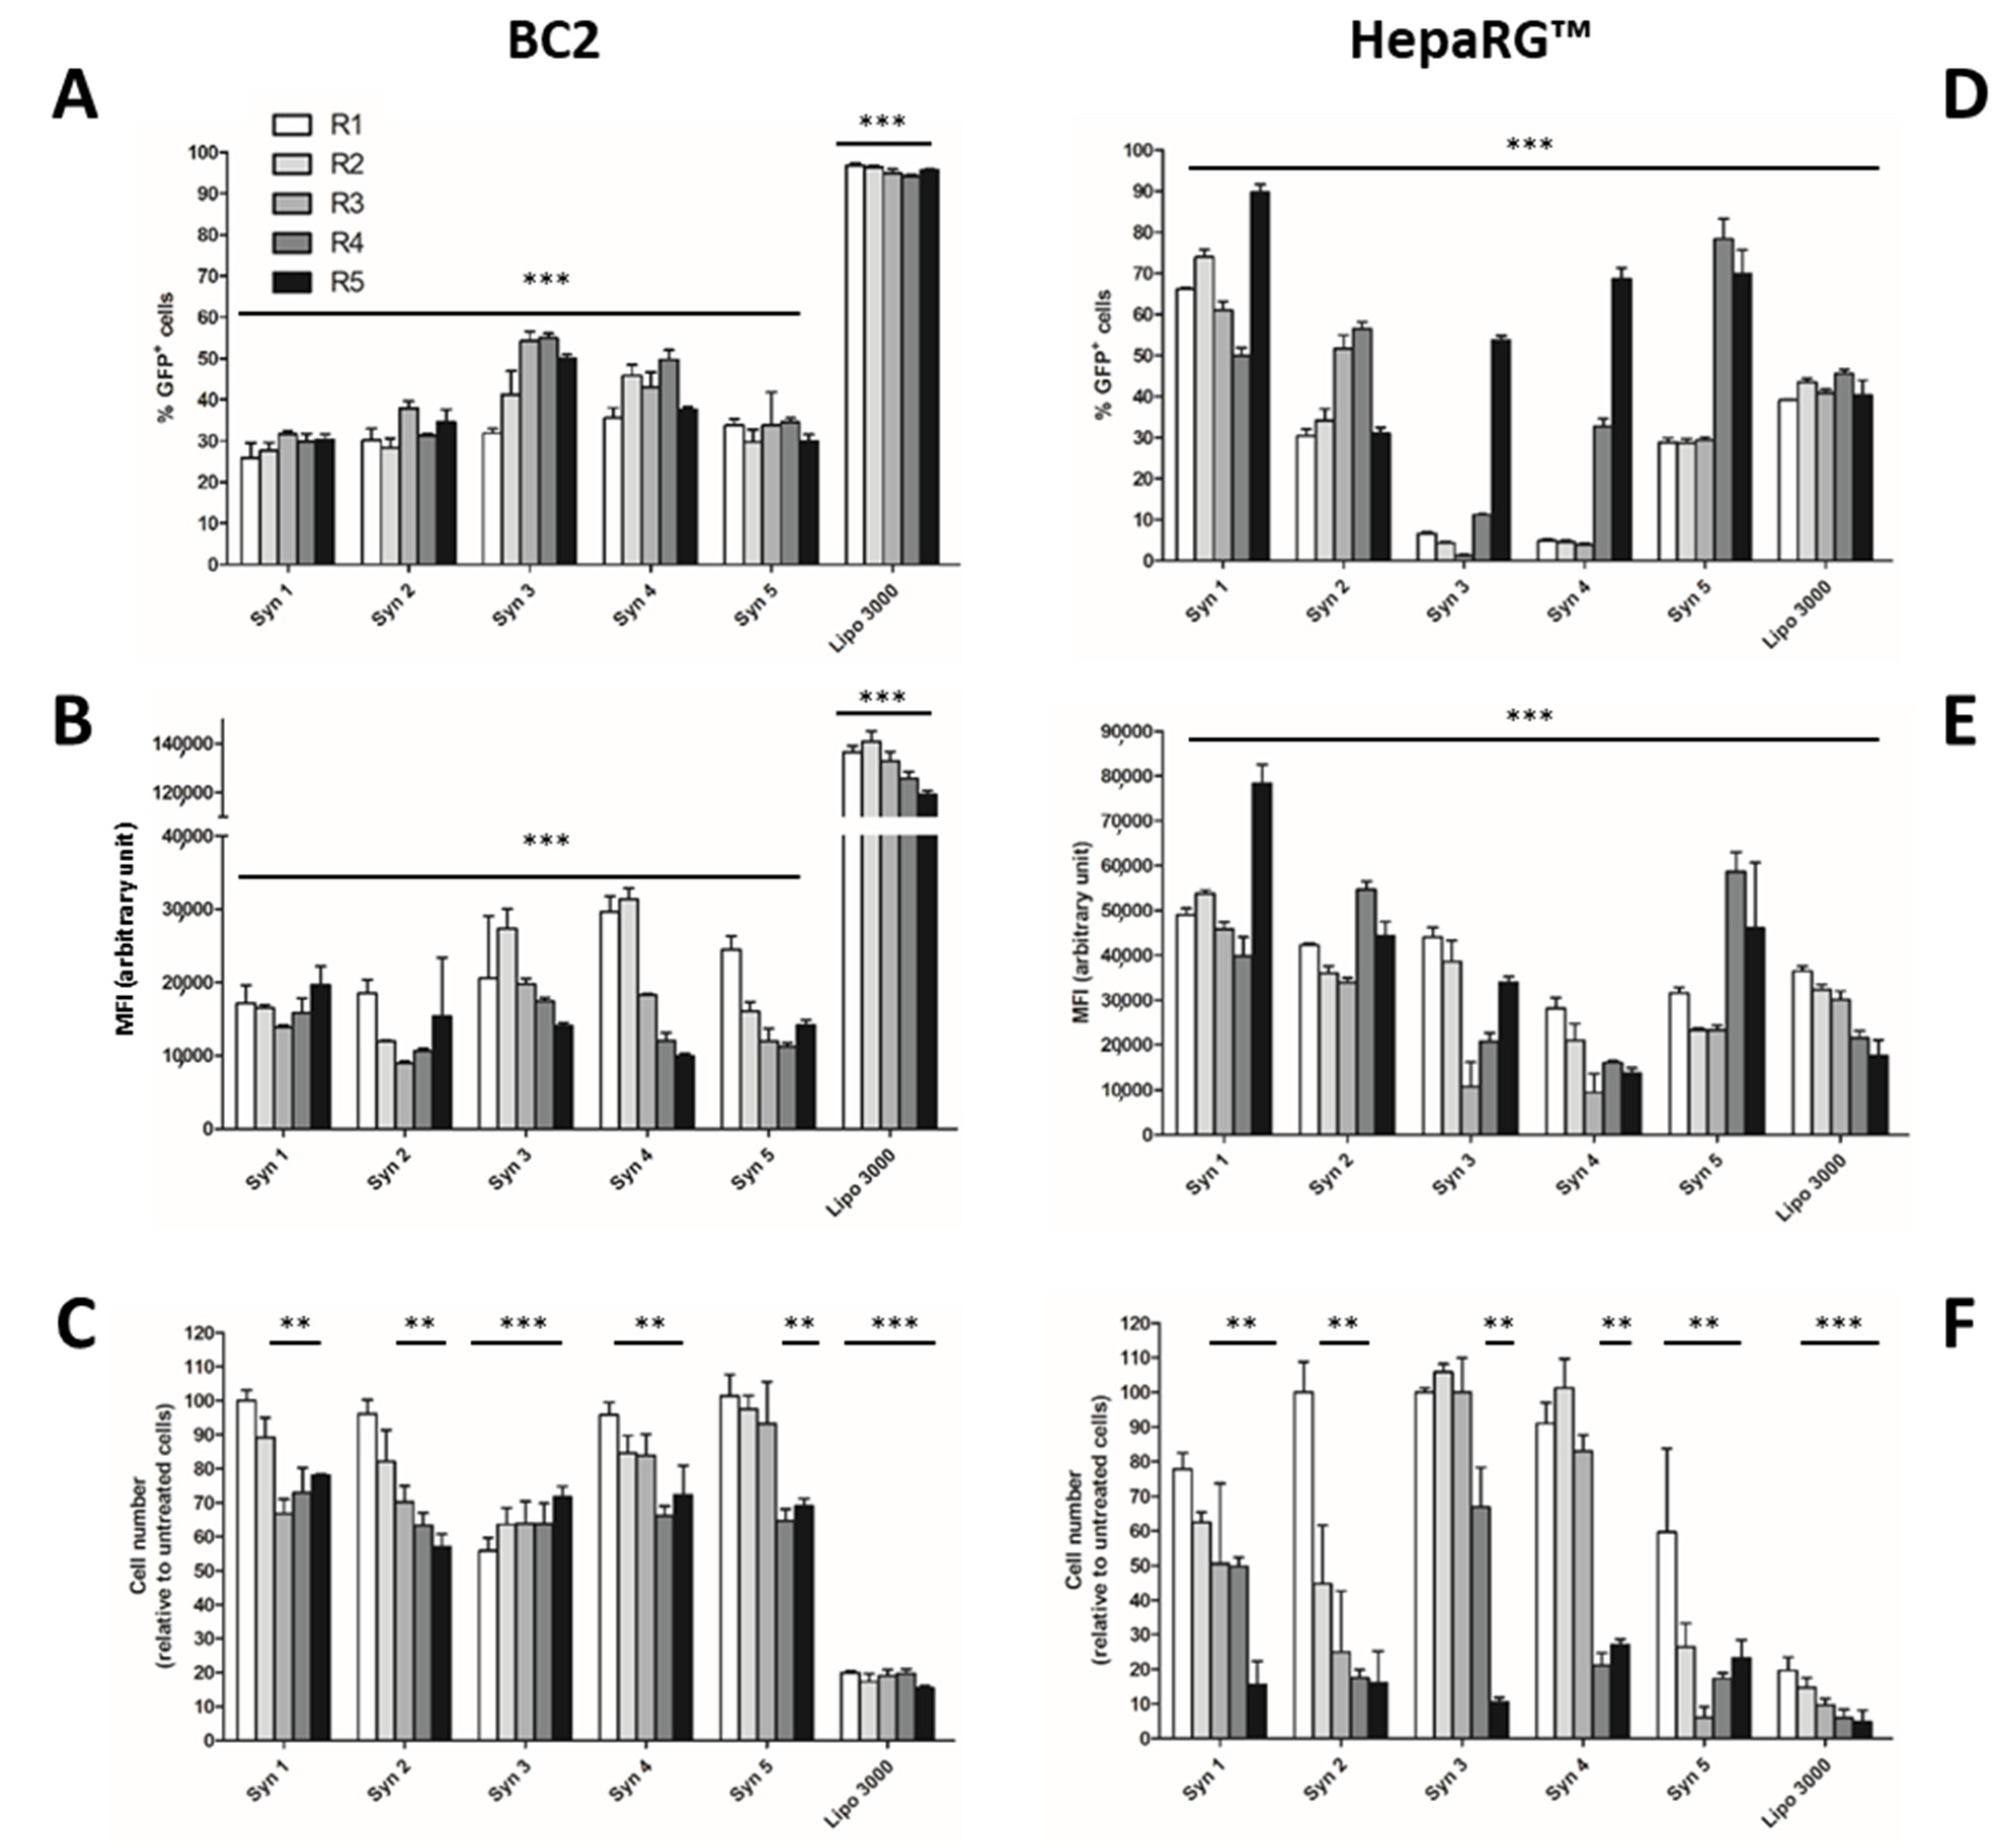
3.1. Screening of Efficient and Non-Toxic Liposomes for Lipofection of Human Hepatoma Cells
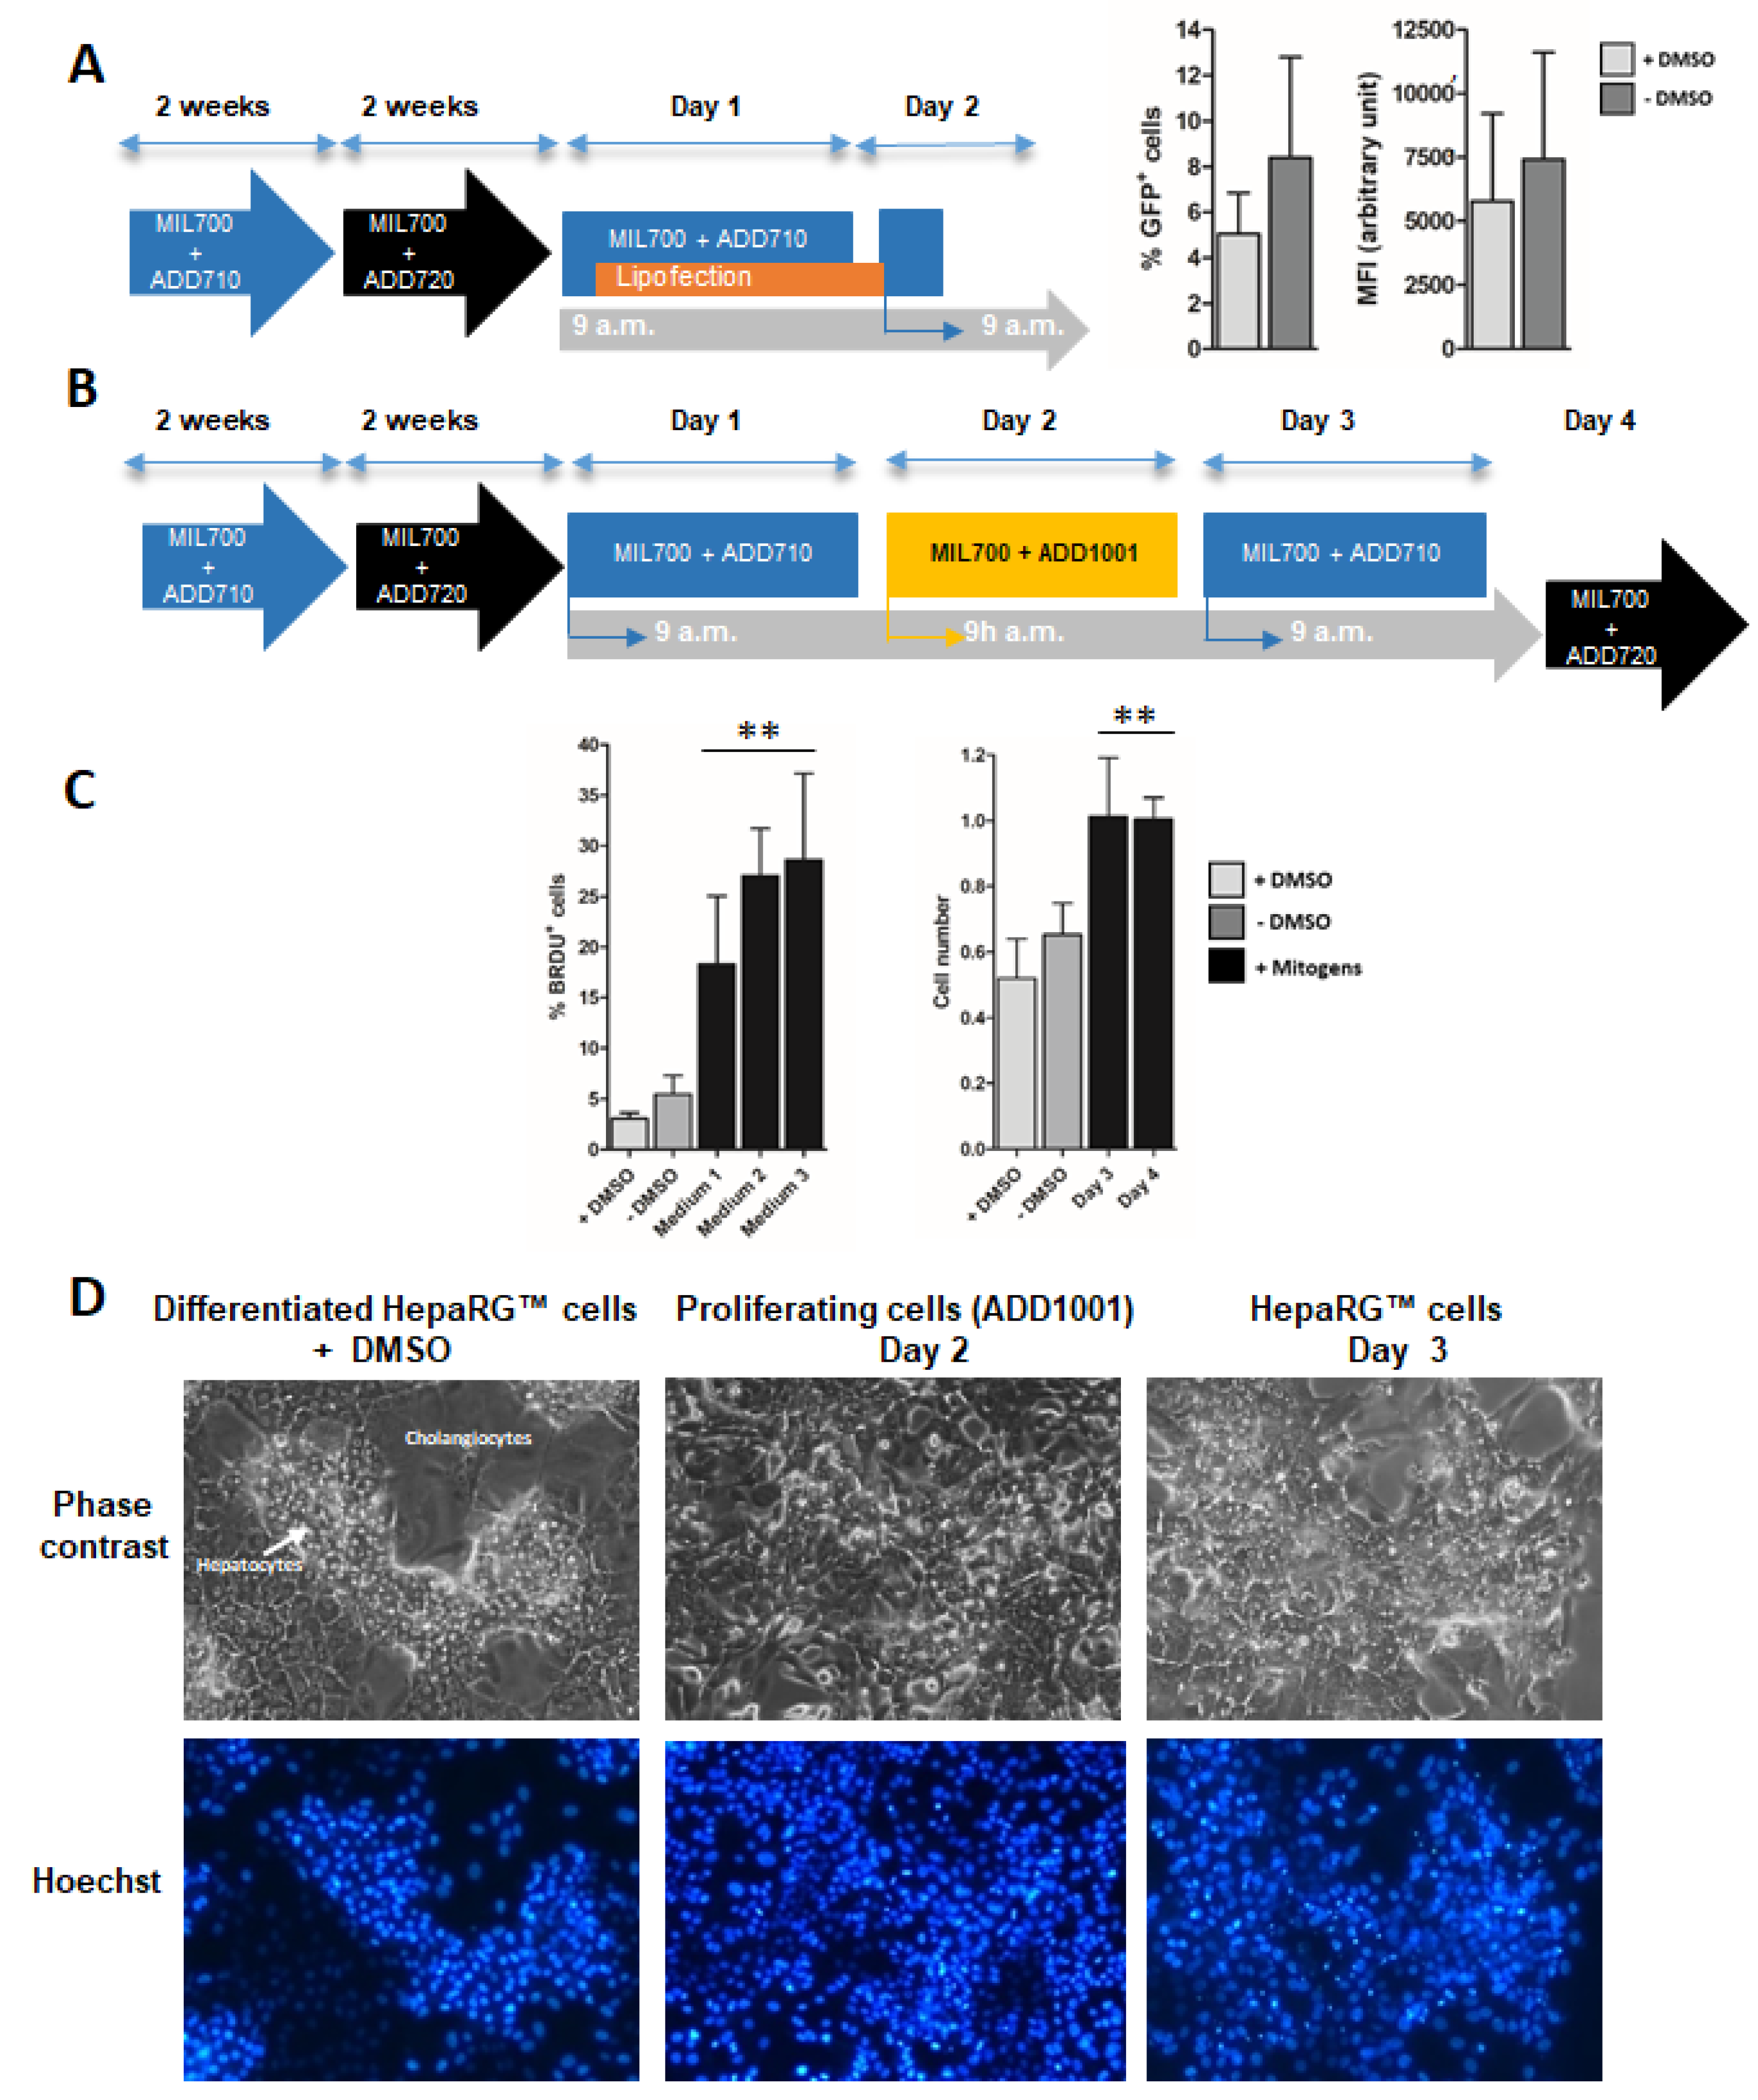
3.2. Proliferation of Differentiated HepaRG™ Hepatoma Cells
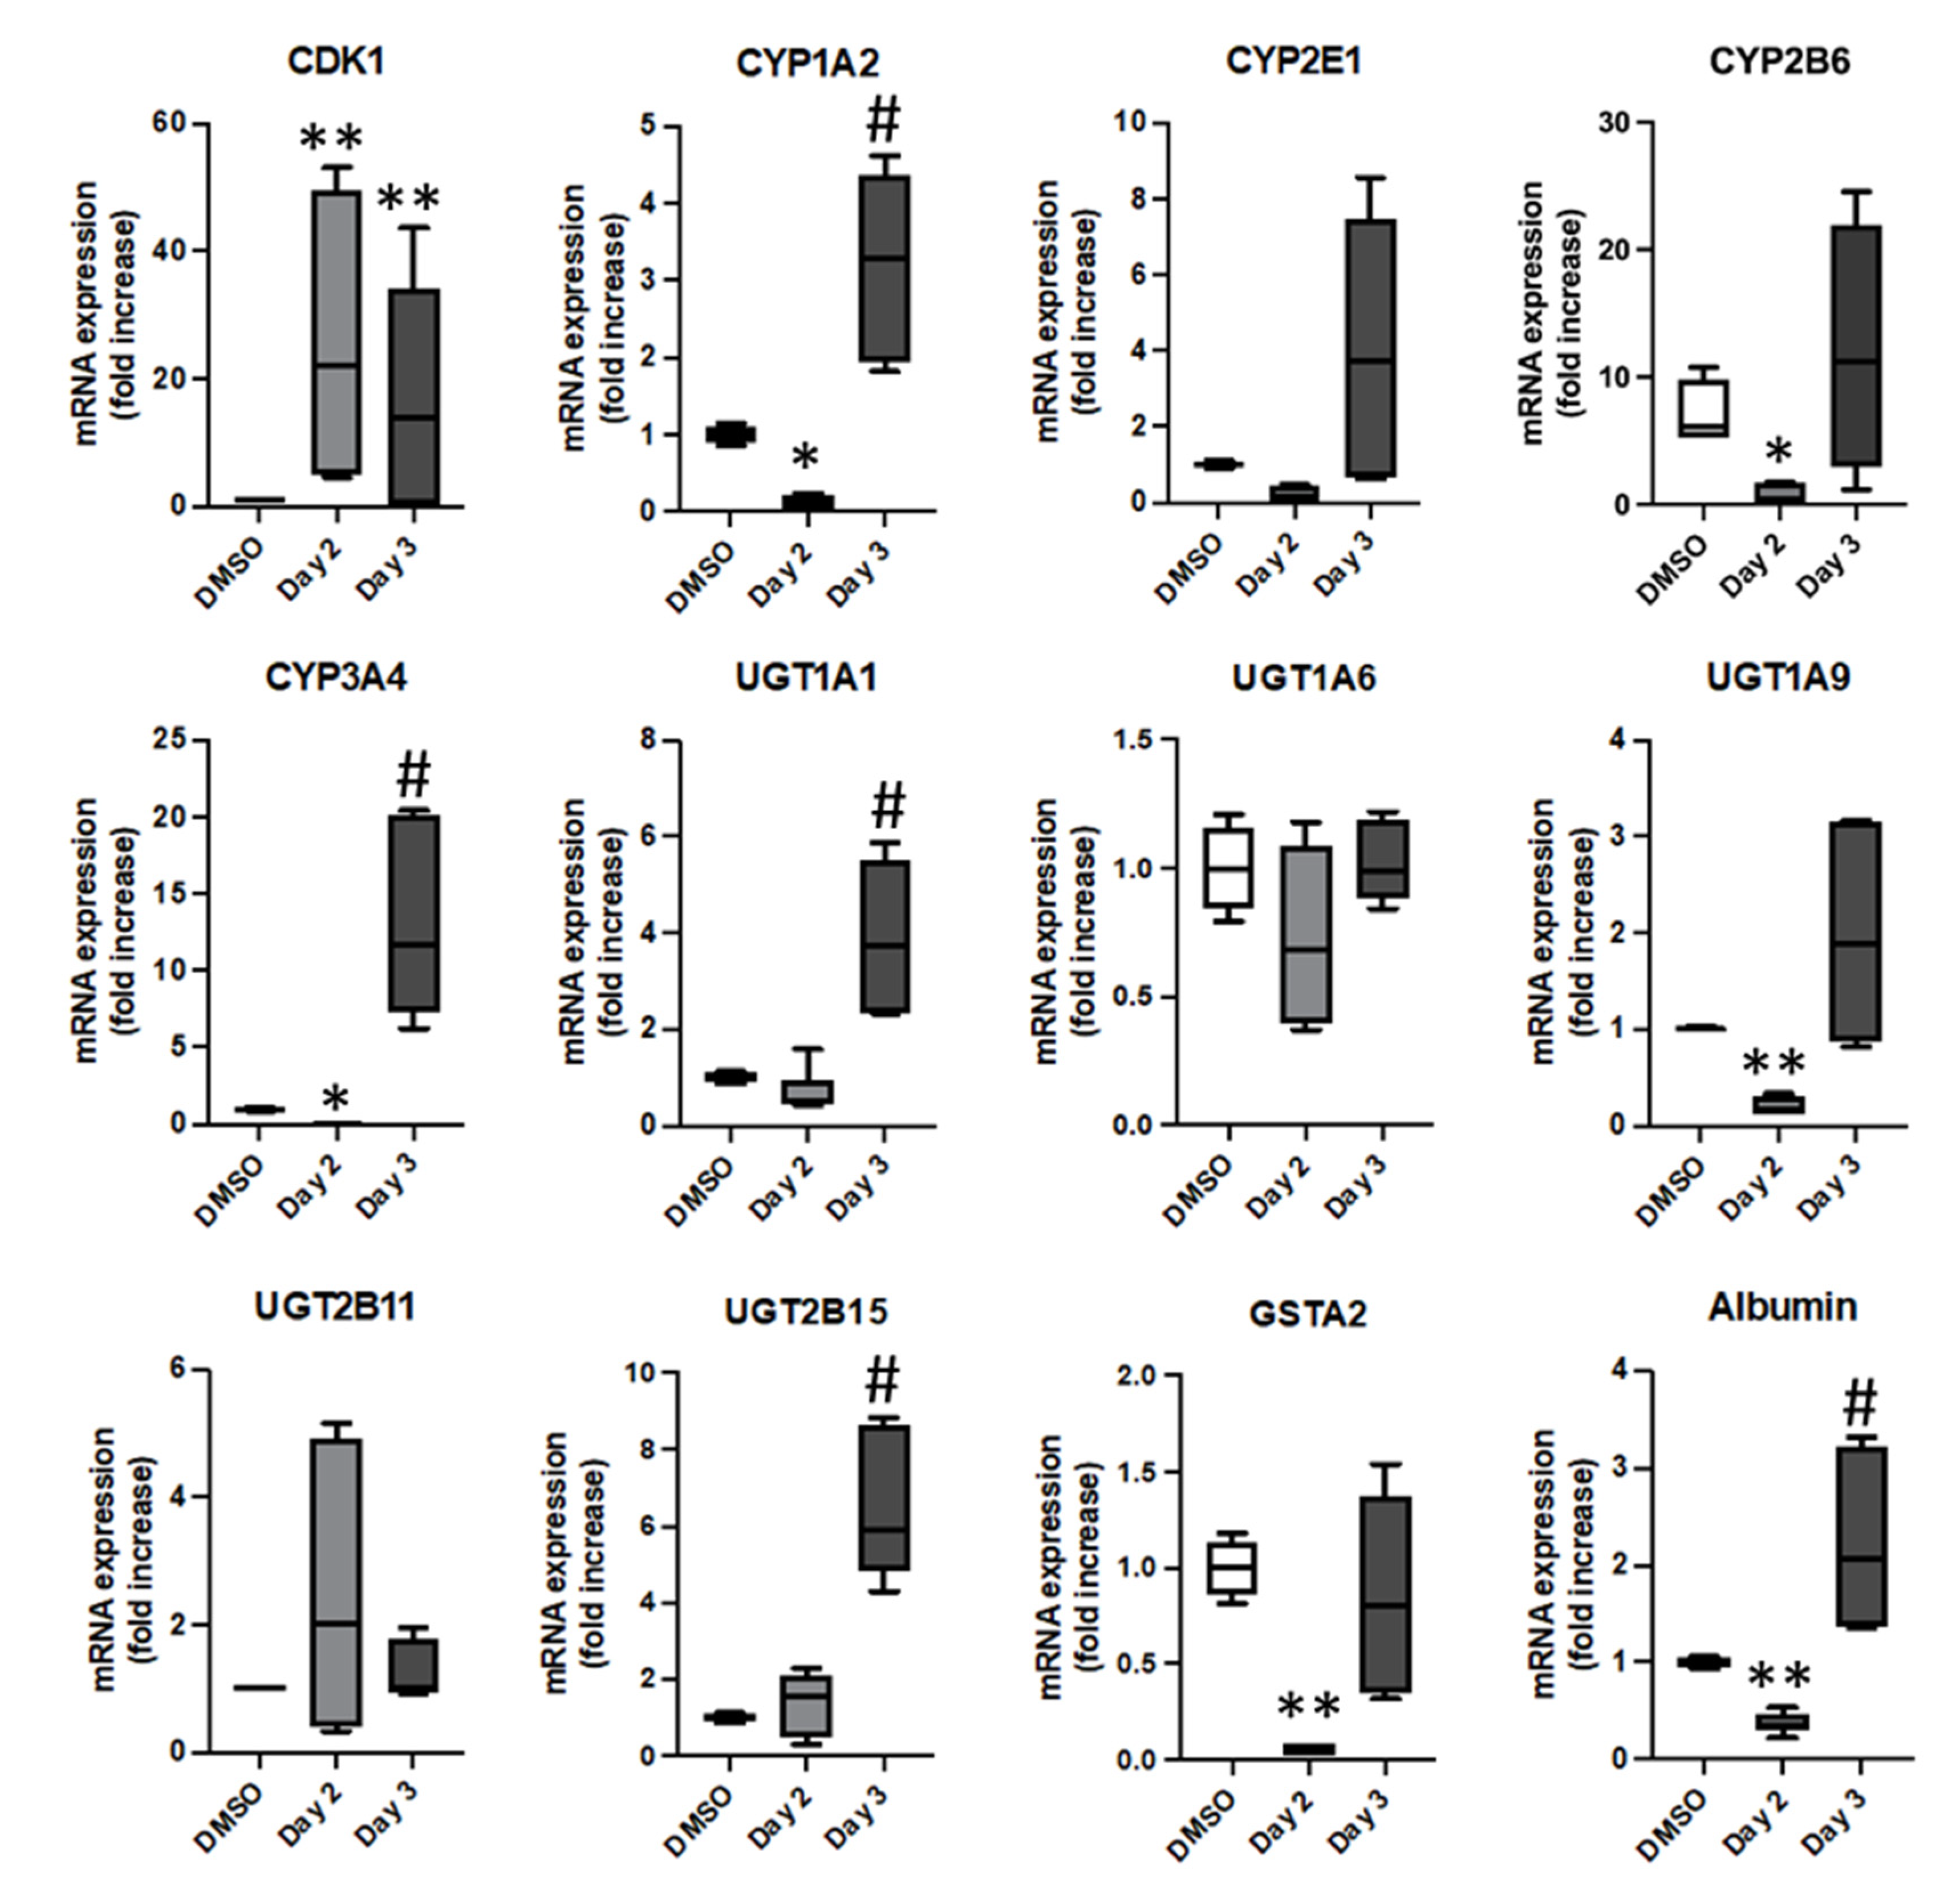
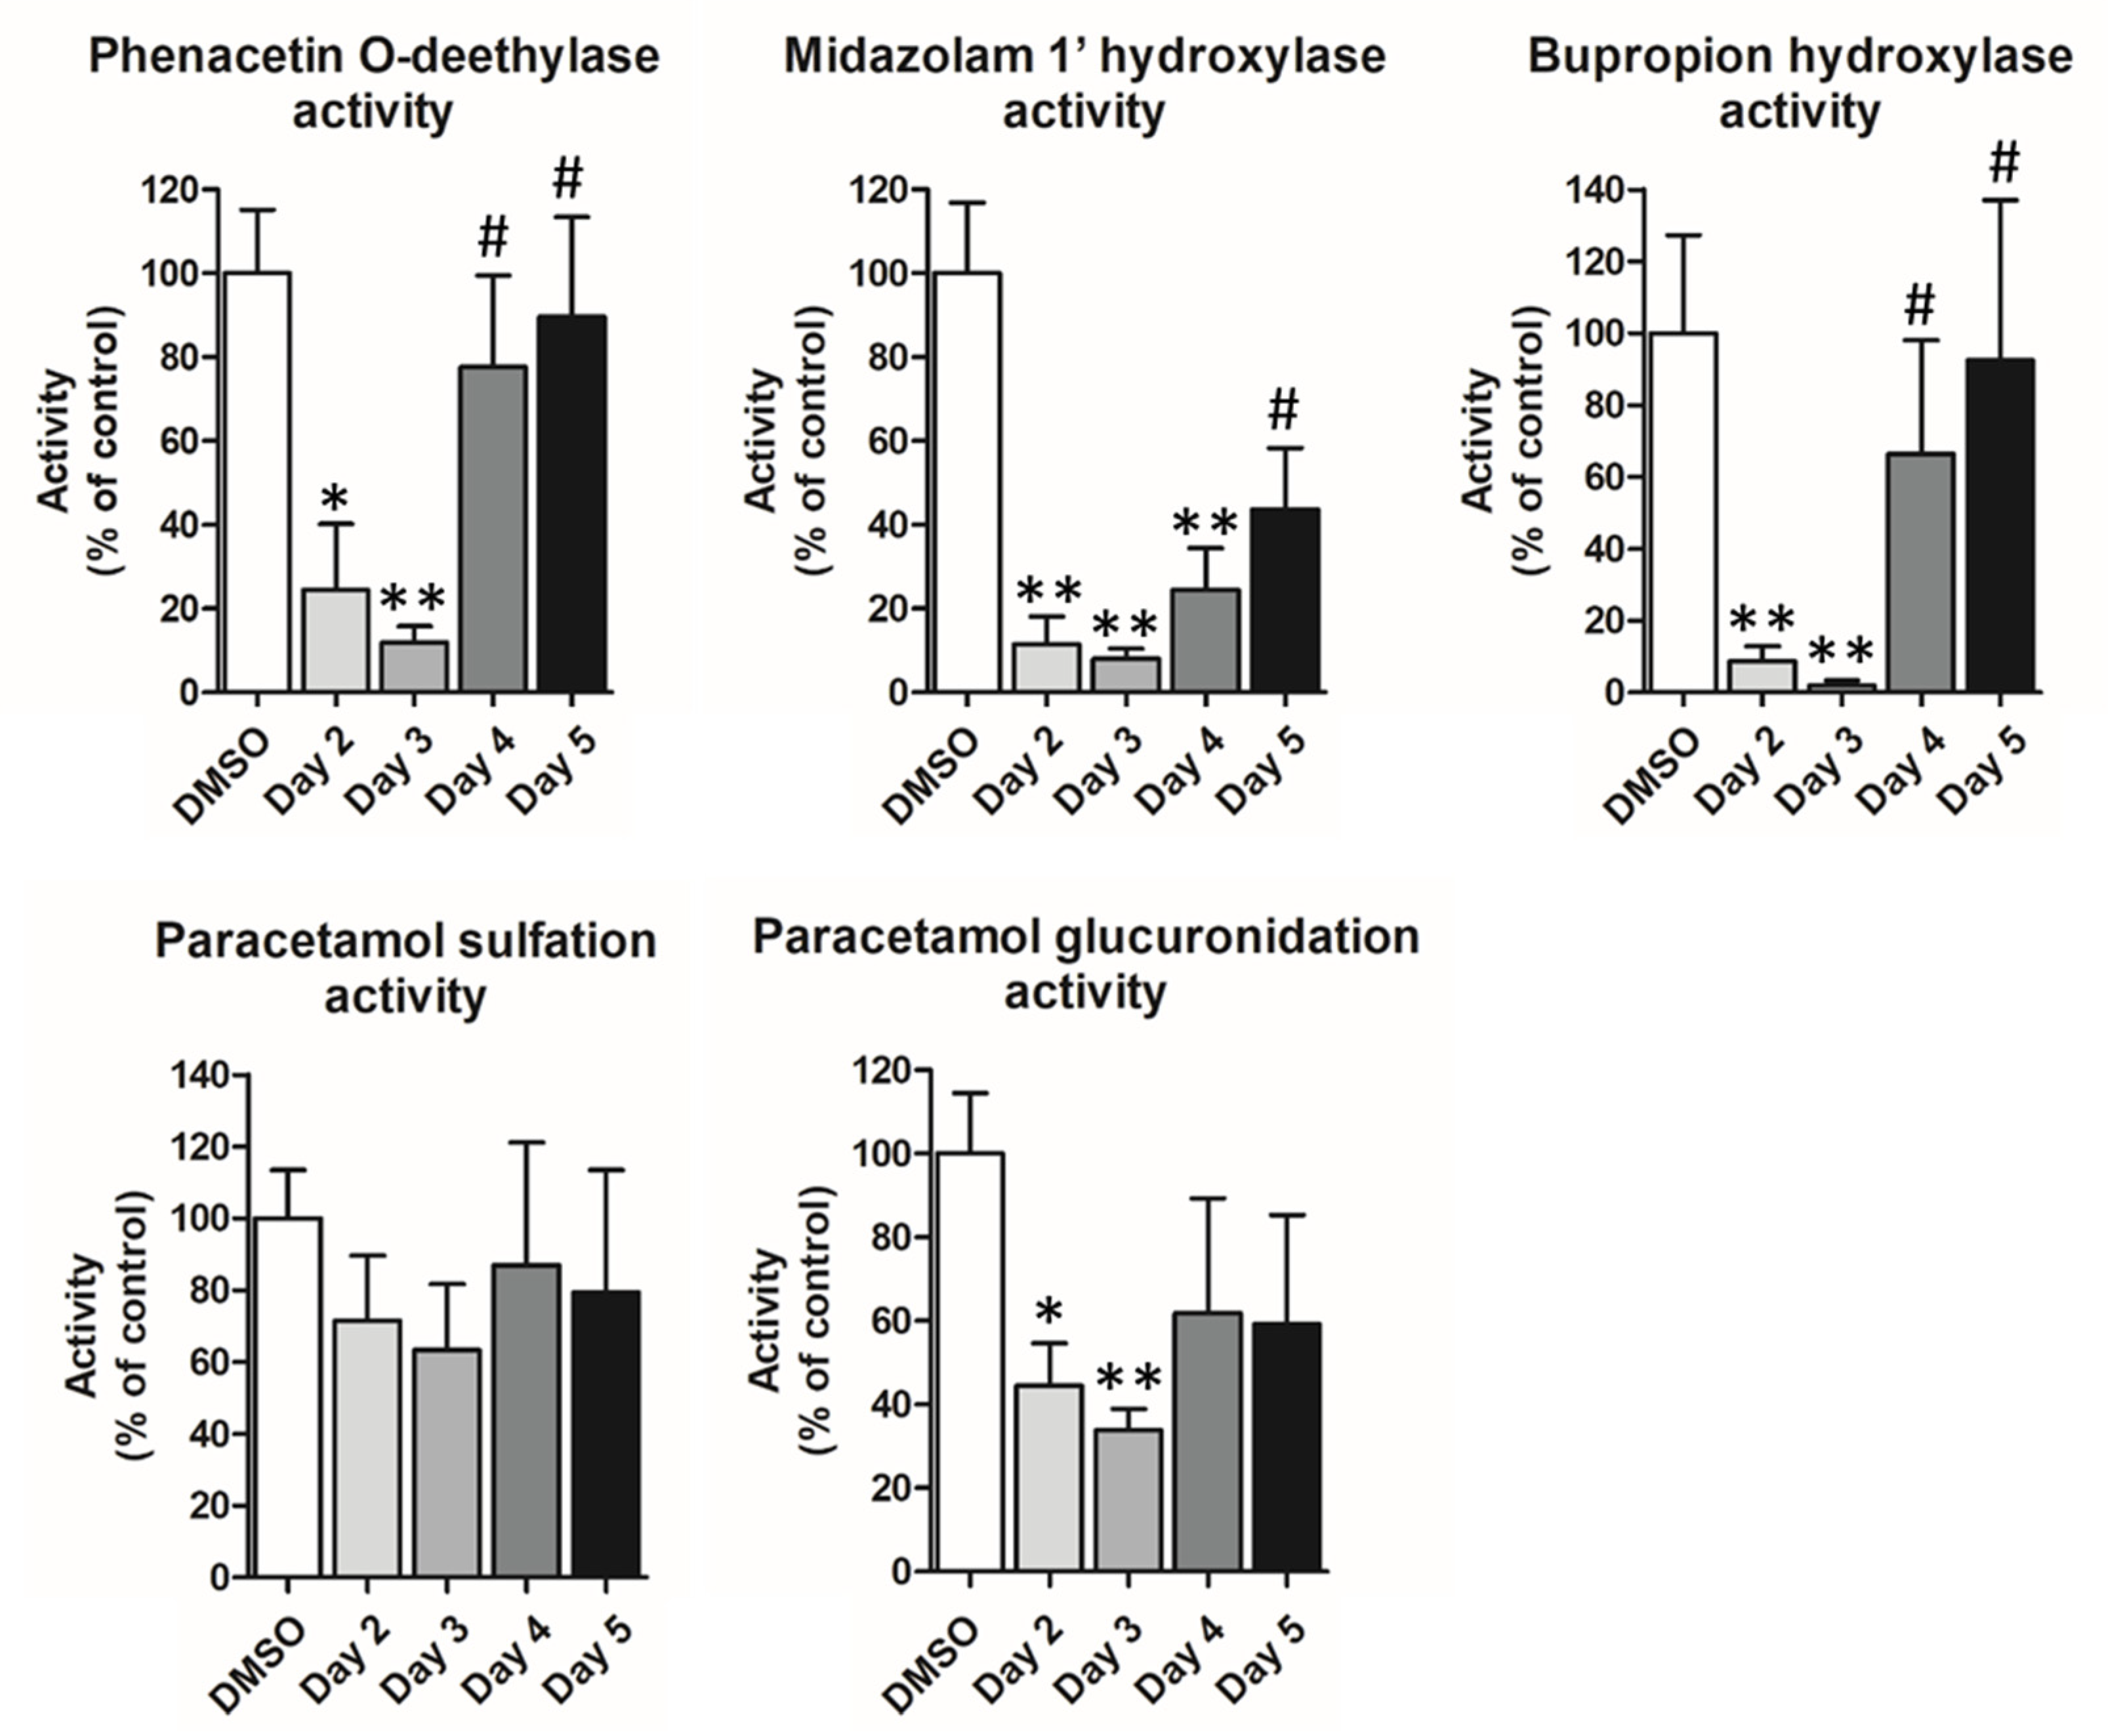
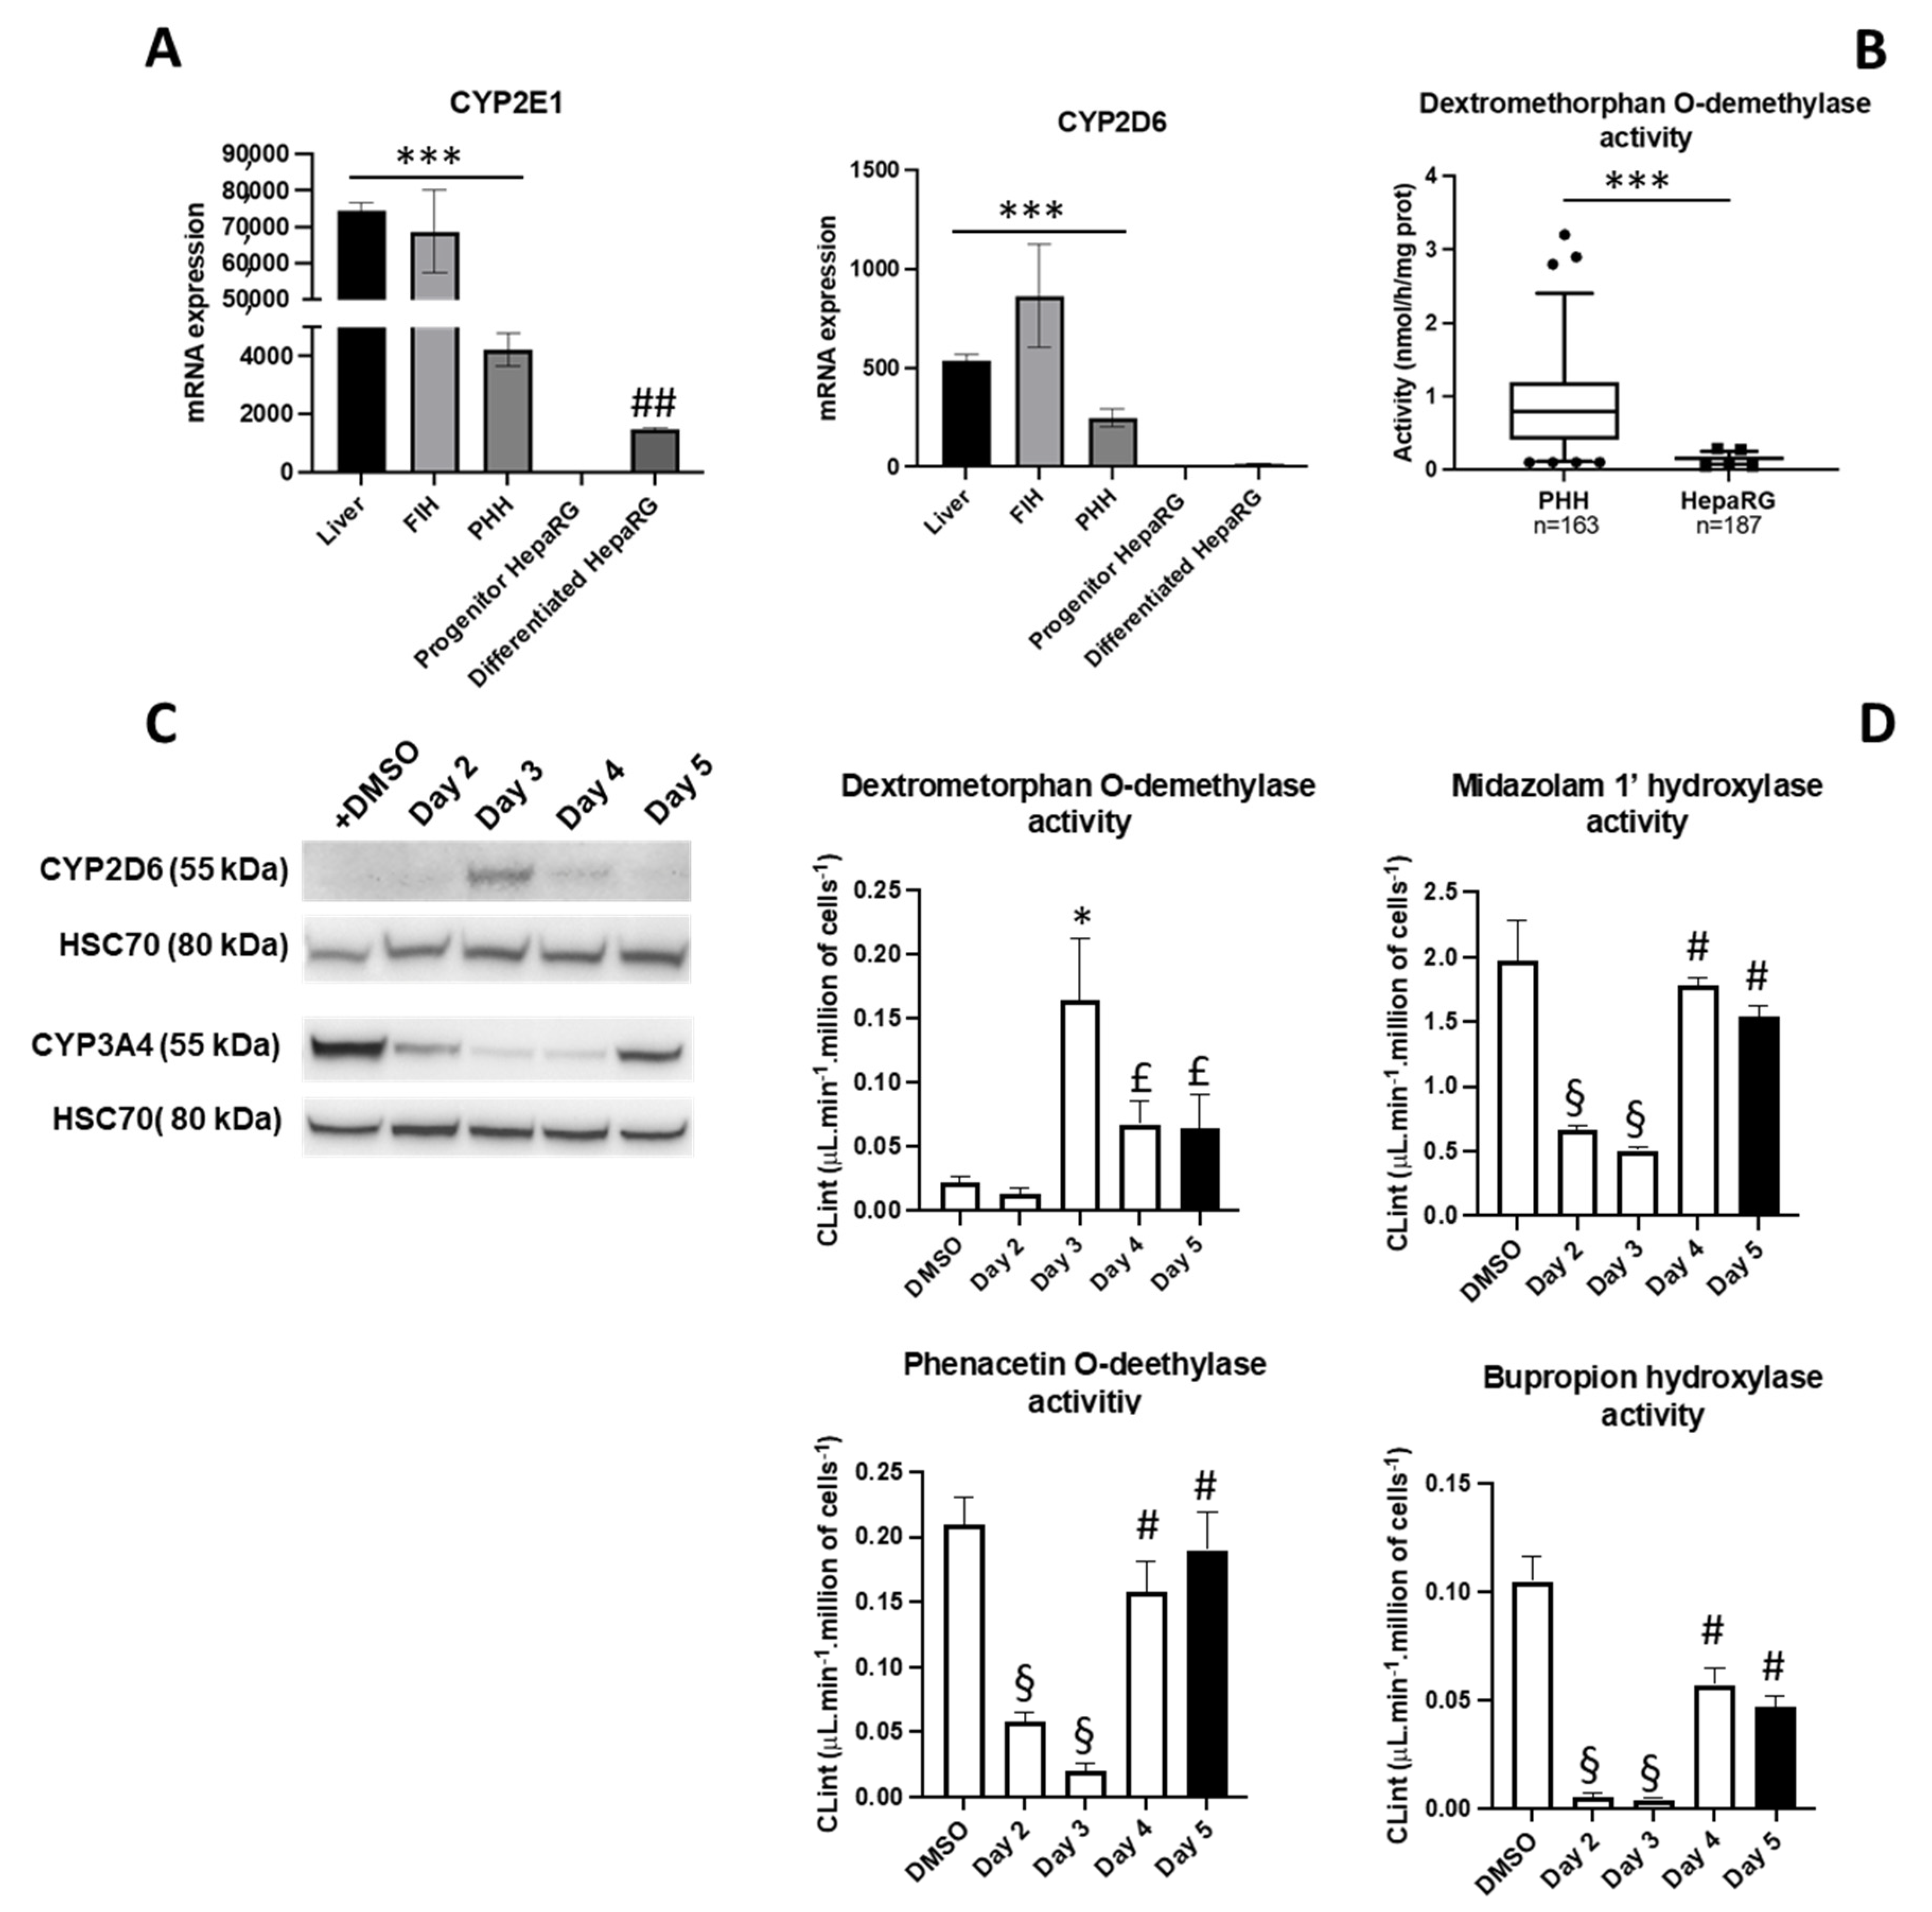
3.3. Phenotypical Changes of HepaRG™ Hepatoma Cells during Proliferation
3.4. Lipofection of Proliferating HepaRG™ Hepatoma Cells
4. Discussion
5. Patents
Supplementary Materials
Author Contributions
Funding
Institutional Review Board Statement
Informed Consent Statement
Data Availability Statement
Acknowledgments
Conflicts of Interest
References
- Guillouzo, A.; Guguen-Guillouzo, C. Evolving concepts in liver tissue modeling and implications for in vitro toxicology. Expert Opin. Drug Metab. Toxicol. 2008, 4, 1279–1294. [Google Scholar] [CrossRef] [PubMed]
- Corlu, A.; Ilyin, G.; Cariou, S.; Lamy, I.; Loyer, P.; Guguen-Guillouzo, C. The coculture: A system for studying the regulation of liver differentiation/proliferation activity and its control. Cell Biol. Toxicol. 1997, 13, 235–242. [Google Scholar] [CrossRef] [PubMed]
- Sato, K.; Zhang, W.; Safarikia, S.; Isidan, A.; Chen, A.M.; Li, P.; Francis, H.; Kennedy, L.; Baiocchi, L.; Alvaro, D.; et al. Organoids and Spheroids as Models for Studying Cholestatic Liver Injury and Cholangiocarcinoma. Hepatology 2021, 74, 491–502. [Google Scholar] [CrossRef] [PubMed]
- Wilkening, S.; Stahl, F.; Bader, A. Comparison of primary human hepatocytes and hepatoma cell line HepG2 with regard to their biotransformation properties. Drug Metab. Dispos. 2003, 31, 1035–1042. [Google Scholar] [CrossRef] [PubMed]
- Jover, R.; Bort, R.; Gomez-Lechon, M.J.; Castell, J.V. Re-expression of C/EBP alpha induces CYP2B6, CYP2C9 and CYP2D6 genes in HepG2 cells. FEBS Lett. 1998, 431, 227–230. [Google Scholar] [CrossRef] [PubMed] [Green Version]
- Hashizume, T.; Yoshitomi, S.; Asahi, S.; Uematsu, R.; Matsumura, S.; Chatani, F.; Oda, H. Advantages of human hepatocyte-derived transformants expressing a series of human cytochrome P450 isoforms for genotoxicity examination. Toxicol. Sci. 2010, 116, 488–497. [Google Scholar] [CrossRef] [Green Version]
- Fery, Y.; Mueller, S.O.; Schrenk, D. Development of stably transfected human and rat hepatoma cell lines for the species-specific assessment of xenobiotic response enhancer module (XREM)-dependent induction of drug metabolism. Toxicology 2010, 277, 11–19. [Google Scholar] [CrossRef]
- Steinbrecht, S.; König, R.; Schmidtke, K.U.; Herzog, N.; Scheibner, K.; Krüger-Genge, A.; Jung, F.; Kammerer, S.; Küpper, J.H. Metabolic activity testing can underestimate acute drug cytotoxicity as revealed by HepG2 cell clones overexpressing cytochrome P450 2C19 and 3A4. Toxicology 2019, 412, 37–47. [Google Scholar] [CrossRef]
- Steinbrecht, S.; Pfeifer, N.; Herzog, N.; Katzenberger, N.; Schulz, C.; Kammerer, S.; Küpper, J.H. HepG2-1A2 C2 and C7: Lentivirus vector-mediated stable and functional overexpression of cytochrome P450 1A2 in human hepatoblastoma cells. Toxicol. Lett. 2020, 319, 155–159. [Google Scholar] [CrossRef]
- Li, X.; Chen, S.; Guo, X.; Wu, Q.; Seo, J.E.; Guo, L.; Manjanatha, M.G.; Zhou, T.; Witt, K.L.; Mei, N. Development and Application of TK6-derived Cells Expressing Human Cytochrome P450s for Genotoxicity Testing. Toxicol. Sci. 2020, 175, 251–265. [Google Scholar] [CrossRef]
- Glaise, D.; Ilyin, G.P.; Loyer, P.; Cariou, S.; Bilodeau, M.; Lucas, J.; Puisieux, A.; Ozturk, M.; Guguen-Guillouzo, C. Cell cycle gene regulation in reversibly differentiated new human hepatoma cell lines. Cell Growth Differ. 1998, 9, 165–176. [Google Scholar]
- Gripon, P.; Rumin, S.; Urban, S.; Le Seyec, J.; Glaise, D.; Cannie, I.; Guyomard, C.; Lucas, J.; Trepo, C.; Guguen-Guillouzo, C. Infection of a human hepatoma cell line by hepatitis B virus. Proc. Natl. Acad. Sci. USA 2002, 99, 15655–15660. [Google Scholar] [CrossRef] [Green Version]
- Cerec, V.; Glaise, D.; Garnier, D.; Morosan, S.; Turlin, B.; Drenou, B.; Gripon, P.; Kremsdorf, D.; Guguen-Guillouzo, C.; Corlu, A. Transdifferentiation of differentiated cells from the human hepatoma HepaRG cell line through bipotent progenitor. Hepatology 2007, 45, 957–967. [Google Scholar] [CrossRef]
- Dubois-Pot-Schneider, H.; Fekir, K.; Coulouarn, C.; Glaise, D.; Aninat, C.; Jouarnen, K.; Le Guével, R.; Kubo, T.; Ishida, S.; Morel, F.; et al. Inflammatory cytokines promote the retrodifferentiation of tumor-derived differentiated cells to progenitor cells. Hepatology 2014, 60, 2077–2090. [Google Scholar] [CrossRef]
- Aninat, C.; Piton, A.; Glaise, D.; Le Charpentier, T.; Langouet, S.; Morel, F.; Guguen-Guillouzo, C.; Guillouzo, A. Expression of cytochrome P450, conjugating enzymes and nuclear receptors in human hepatoma HepaRG cells. Drug Metab. Dispos. 2006, 34, 75–83. [Google Scholar] [CrossRef] [Green Version]
- Anthérieu, S.; Chesné, C.; Li, R.; Camus, S.; Lahoz, A.; Picazo, L.; Turpeinen, M.; Tolonen, A.; Uusitalo, J.; Guguen-Guillouzo, C.; et al. Stable expression, activity, and inducibility of cytochromes P450 in differentiated HepaRG cells. Drug Metab. Dispos. 2010, 38, 516–525. [Google Scholar] [CrossRef]
- Vlach, M.; Quesnot, N.; Dubois-Pot-Schneider, H.; Ribault, C.; Verres, Y.; Petitjean, K.; Rauch, C.; Morel, F.; Robin, M.-A.; Corlu, A.; et al. Cytochrome P450 1A1/2, 2B6 and 3A4 HepaRG Cell-Based Biosensors to Monitor Hepatocyte Differentiation, Drug Metabolism and Toxicity. Sensors 2019, 19, 2245. [Google Scholar] [CrossRef] [Green Version]
- Kanebratt, K.P.; Andersson, T.B. Evaluation of HepaRG cells as an in vitro model for human drug metabolism studies. Drug Metab. Dispos. 2008, 36, 1444–1452. [Google Scholar] [CrossRef] [Green Version]
- Jossé, R.; Aninat, C.; Glaise, D.; Dumont, J.; Fessard, V.; Morel, F.; Poul, J.M.; Guguen-Guillouzo, C.; Guillouzo, A. Long-term functional stability of HepaRG hepatocytes and use for chronic toxicity and genotoxicity studies. Drug Metab. Dispos. 2008, 36, 1111–1118. [Google Scholar] [CrossRef] [Green Version]
- Quesnot, N.; Rondel, K.; Martinais, S.; Audebert, M.; Glaise, D.; Morel, F.; Loyer, P.; Robin, M.-A. Evaluation of genotoxicity using automated detection of gammaH2AX in metabolically competent HepaRG cells. Mutagenesis 2016, 1, 43–50. [Google Scholar] [CrossRef] [Green Version]
- Ashraf, M.N.; Asghar, M.W.; Rong, Y.; Doschak, M.R.; Kiang, T.K.L. Advanced In Vitro HepaRG Culture Systems for Xenobiotic Metabolism and Toxicity Characterization. Eur. J. Drug Metab. Pharmacokinet. 2019, 44, 437–458. [Google Scholar] [CrossRef] [PubMed]
- Allard, J.; Bucher, S.; Massart, J.; Ferron, P.J.; Le Guillou, D.; Loyant, R.; Daniel, Y.; Launay, Y.; Buron, N.; Begriche, K.; et al. Drug-induced hepatic steatosis in absence of severe mitochondrial dysfunction in HepaRG cells: Proof of multiple mechanism-based toxicity. Cell Biol. Toxicol. 2021, 37, 151–175. [Google Scholar] [CrossRef] [PubMed]
- Rose, S.; Cuvellier, M.; Ezan, F.; Carteret, J.; Bruyère, A.; Legagneux, V.; Nesslany, F.; Baffet, G.; Langouët, S. DMSO-free highly differentiated HepaRG spheroids for chronic toxicity, liver functions and genotoxicity studies. Arch. Toxicol. 2022, 96, 243–258. [Google Scholar] [CrossRef] [PubMed]
- Quesnot, N.; Bucher, S.; Gade, C.; Vlach, M.; Vène, E.; Valença, S.; Gicquel, T.; Holst, H.; Robin, M.-A.; Loyer, P. Production of chlorzoxazone glucuronides via cytochrome P4502E1 dependent and independent pathways in human hepatocytes. Arch. Toxicol. 2018, 92, 3077–3091. [Google Scholar] [CrossRef] [PubMed]
- Okuyama, S.; Mine, A.; Nakamura, T.; Ohasi, Y.; Seto, M.; Tada, M. Transgenic HepaRG cells expressing CYP2D6 as an improved model of primary human hepatocytes. Pharmacol. Res. Perspect. 2022, 10, e00939. [Google Scholar] [CrossRef]
- Laurent, V.; Fraix, A.; Montier, T.; Cammas-Marion, S.; Ribault, C.; Benvengu, T.; Jaffres, P.-A.; Loyer, P. Highly efficient gene transfer into differentiated HepaRG cells: New means for drug metabolism and toxicity studies. Biotechnol. J. 2010, 5, 314–320. [Google Scholar] [CrossRef] [Green Version]
- Laurent, V.; Glaise, D.; Nubel, T.; Gilot, D.; Corlu, A.; Loyer, P. Highly Efficient SiRNA and Gene Transfer into Differentiated HepaRG Cells and Primary Human Hepatocytes: New Means for Drug Metabolism and Toxicity Studies. Methods Mol. Biol. 2013, 987, 295–314. [Google Scholar] [CrossRef]
- Gilot, D.; Miramon, M.L.; Benvegnu, T.; Ferrières, V.; Loréal, O.; Guguen-Guillouzo, C.; Loyer, P. Cationic lipids derived from glycine betaine promote efficient and non-toxic gene transfection in cultured hepatocytes. J. Gene Med. 2002, 4, 415–427. [Google Scholar] [CrossRef]
- Demazeau, M.; Quesnot, N.; Ripoche, N.; Rauch, C.; Jeftica, J.; Morel, F.; Gauffre, F.; Benvegnu, T.; Loyer, P. Efficient transfection of Xenobiotic Responsive Element-biosensor plasmid using diether lipid and phosphatidylcholine liposomes in differentiated HepaRG cells. Int. J. Pharm. 2017, 524, 268–278. [Google Scholar] [CrossRef]
- Zabner, J.; Fasbender, A.J.; Moninger, T.; Poellinger, K.A.; Welsh, M.J. Cellular and molecular barriers to gene transfer by a cationic lipid. J. Biol. Chem. 1995, 270, 18997–19007. [Google Scholar] [CrossRef] [Green Version]
- Mortimer, I.; Tam, P.; MacLachlan, I.; Graham, R.W.; Saravolac, E.G.; Joshi, P. Cationic lipid-mediated transfection of cells in culture requires mitotic activity. Gene Ther. 1999, 6, 403–411. [Google Scholar] [CrossRef]
- Tseng, W.C.; Haselton, F.R.; Giorgio, T.D. Mitosis enhances transgene expression of plasmid delivered by cationic liposomes. Biochim. Biophys. Acta 1999, 1445, 53–64. [Google Scholar] [CrossRef]
- Le Corre, S.S.; Berchel, M.; Belmadi, N.; Denis, C.; Haelters, J.-P.; Le Gall, T.; Lehn, P.; Montier, T.; Jaffrès, P.A. Cationic lipophosphoramidates with two different lipid chains: Synthesis and evaluation as gene carriers. Org. Biomol. Chem. 2014, 12, 1463–1474. [Google Scholar] [CrossRef]
- Picquet, E.; Le Ny, K.; Delépine, P.; Montier, T.; Yaouanc, J.-J.; Cartier, D.; des Abbayes, H.; Férec, C.; Clément, J.-C. Cationic lipophosphoramidates and lipophosphoguanidines are very efficient for in vivo DNA delivery. Bioconjug. Chem. 2005, 16, 1051–1053. [Google Scholar] [CrossRef]
- Berchel, M.; Le Gall, T.; Haelters, J.-P.; Lehn, P.; Montier, T.; Jaffrès, P.-A. Cationic lipophosphoramidates containing a hydroxylated polar headgroup for improving gene delivery. Mol. Pharm. 2015, 12, 1902–1910. [Google Scholar] [CrossRef]
- Mével, M.; Breuzard, G.; Yaouanc, J.-J.; Clément, J.-C.; Lehn, P.; Pichon, C.; Jaffrès, P.A.; Midoux, P. Synthesis and transfection activity of new cationic phosphoramidate lipids: High efficiency of an imidazolium derivative. ChemBioChem 2008, 9, 1462–1471. [Google Scholar] [CrossRef]
- Yu, A.; Haining, R.L. Comparative contribution to dextromethorphan metabolism by cytochrome P450 isoforms in vitro: Can dextromethorphan be used as a dual probe for both CTP2D6 and CYP3A activities? Drug Metab. Dispos. 2001, 29, 1514–1520. [Google Scholar]
- Von Moltke, L.L.; Greenblatt, D.J.; Grassi, J.M.; Granda, B.W.; Venkatakrishnan, K.; Schmider, J.; Harmatz, J.S.; Shader, R.I. Multiple human cytochromes contribute to biotransformation of dextromethorphan in-vitro: Role of CYP2C9, CYP2C19, CYP2D6, and CYP3A. J. Pharm. Pharmacol. 1998, 50, 997–1004. [Google Scholar] [CrossRef]
- Rogue, A.; Lambert, C.; Spire, C.; Claude, N.; Guillouzo, A. Interindividual variability in gene expression profiles in human hepatocytes and comparison with HepaRG cells. Drug Metab. Dispos. 2012, 40, 151–158. [Google Scholar] [CrossRef] [Green Version]
- Isom, H.C.; Secott, T.; Georgoff, I.; Woodworth, C.; Mummaw, J. Maintenance of differentiated rat hepatocytes in primary culture. Proc. Natl. Acad. Sci. USA 1985, 82, 3252–3256. [Google Scholar] [CrossRef] [Green Version]
- Dubois-Pot-Schneider, H.; Aninat, C.; Kattler, K.; Fekir, K.; Jarnouen, K.; Cerec, V.; Glaise, D.; Salhab, A.; Gasparoni, G.; Takashi, K.; et al. Transcriptional and epigenetic consequences of DMSO treatment on HepaRG cells. Cells 2022, 11, 2298. [Google Scholar] [CrossRef] [PubMed]
- Fausto, N. Liver regeneration. J. Hepatol. 2000, 32, 19–31. [Google Scholar] [CrossRef] [PubMed]
- Block, G.D.; Locker, J.; Bowen, W.C.; Petersen, B.E.; Katyal, S.; Strom, S.C.; Riley, T.; Howard, T.A.; Michalopoulos, G.K. Population expansion, clonal growth, and specific differentiation patterns in primary cultures of hepatocytes induced by HGF/SF, EGF and TGF alpha in a chemically defined (HGM) medium. J. Cell Biol. 1996, 132, 1133–1149. [Google Scholar] [CrossRef] [PubMed] [Green Version]
- Webber, E.M.; Bruix, J.; Pierce, R.H.; Fausto, N. Tumor necrosis factor primes hepatocytes for DNA replication in the rat. Hepatology 1998, 28, 1226–1234. [Google Scholar] [CrossRef] [PubMed]
- Sérandour, A.L.; Loyer, P.; Garnier, D.; Courselaud, B.; Théret, N.; Glaise, D.; Guguen-Guillouzo, C.; Corlu, A. TNFalpha-mediated extracellular matrix remodelling is required for multiple division cycles in rat hepatocytes. Hepatology 2005, 41, 478–486. [Google Scholar] [CrossRef] [PubMed]
- Aliabadi, H.M.; Bahadur, K.C.R.; Bousoik, E.; Hall, R.; Barbarino, A.; Thapa, B.; Coyle, M.; Mahdipoor, P.; Uludağ, H. A systematic comparison of lipopolymers for siRNA delivery to multiple breast cancer cell lines: In vitro studies. Acta Biomater. 2020, 102, 351–366. [Google Scholar] [CrossRef]
- Vène, E.; Jarnouen, K.; Ribault, C.; Vlach, M.; Verres, Y.; Bourgeois, M.; Lepareur, N.; Cammas-Marion, S.; Loyer, P. Circumsporozoite Protein of Plasmodium berghei- and George Baker Virus A-Derived Peptides Trigger Efficient Cell Internalization of Bioconjugates and Functionalized Poly(ethylene glycol)-b-poly(benzyl malate)-Based Nanoparticles in Human Hepatoma Cells. Pharmaceutics 2022, 14, 804. [Google Scholar] [CrossRef]
- Wiethoff, C.M.; Middaugh, C.R. Barriers to nonviral gene delivery. J. Pharm. Sci. 2003, 92, 203–217. [Google Scholar] [CrossRef]
- Hill, A.B.; Chen, M.; Chen, C.K.; Pfeifer, B.A.; Jones, C.H. Overcoming Gene-Delivery Hurdles: Physiological Considerations for Nonviral Vectors. Trends Biotechnol. 2016, 34, 91–105. [Google Scholar] [CrossRef] [Green Version]
- Graceffa, V. Physical and mechanical cues affecting biomaterial-mediated plasmid DNA delivery: Insights into non-viral delivery systems. J. Genet. Eng. Biotechnol. 2021, 19, 90. [Google Scholar] [CrossRef]
- Belmadi, N.; Midoux, P.; Loyer, P.; Passirani, C.; Pichon, C.; Le Gall, T.; Jaffres, P.-A.; Lehn, P.; Montier, T. Synthetic vectors for gene delivery: An overview of their evolution depending on routes of administration. Biotechnol. J. 2015, 10, 1370–1389. [Google Scholar] [CrossRef] [PubMed]
- Gilleron, J.; Querbes, W.; Zeigerer, A.; Borodovsky, A.; Marsico, G.; Schubert, U.; Manygoats, K.; Seifert, S.; Andree, C.; Stöter, M.; et al. Image-based analysis of lipid nanoparticle-mediated siRNA delivery, intracellular trafficking and endosomal escape. Nat. Biotechnol. 2013, 31, 638–646. [Google Scholar] [CrossRef] [PubMed]
- ur Rehman, Z.; Hoekstra, D.; Zuhorn, I.S. Mechanism of polyplex- and lipoplex-mediated delivery of nucleic acids: Real-time visualization of transient membrane destabilization without endosomal lysis. ACS Nano 2013, 7, 3767–3777. [Google Scholar] [CrossRef] [PubMed]
- Tenzer, S.; Docter, D.; Kuharev, J.; Musyanovych, A.; Fetz, V.; Hecht, R.; Schlenk, F.; Fischer, D.; Kiouptsi, K.; Reinhardt, C.; et al. Rapid formation of plasma protein corona critically affects nanoparticle pathophysiology. Nat. Nanotechnol. 2013, 8, 772–781. [Google Scholar] [CrossRef] [PubMed]
- Abbina, S.; Takeuchi, L.E.; Anilkumar, P.; Yu, K.; Rogalski, J.C.; Shenoi, R.A.; Constantinescu, I.; Kizhakkedathu, J.N. Blood circulation of soft nanomaterials is governed by dynamic remodeling of protein opsonins at nano-biointerface. Nat. Commun. 2020, 11, 3048. [Google Scholar] [CrossRef] [PubMed]
- Vene, E.; Barouti, G.; Jarnouen, K.; Gicquel, T.; Rauch, C.; Ribault, C.; Guillaume, S.M.; Cammas-Marion, S.; Loyer, P. Opsonisation of nanoparticles prepared from poly(β-hydroxybutyrate) and poly(trimethylene carbonate)-b-poly(malic acid) amphiphilic diblock copolymers: Impact on the in vitro cell uptake by primary human macrophages and HepaRG hepatoma cells. Int. J. Pharm. 2016, 513, 438–452. [Google Scholar] [CrossRef] [PubMed]
- Brunner, S.; Sauer, T.; Carotta, S.; Cotton, M.; Saltik, M.; Wagner, E. Cell cycle dependence of gene transfer by lipoplex, polyplex and recombinant adenovirus. Gene Ther. 2000, 7, 401–407. [Google Scholar] [CrossRef]
- Lechardeur, D.; Lukacs, G. Nucleocytoplasmic transport of plasmid DNA: A perilous journey from the cytoplasm to the nucleus. Hum. Gene Ther. 2006, 17, 882–889. [Google Scholar] [CrossRef]
- Van der Aa, M.A.E.M.; Mastrobattista, E.; Oosting, R.S.; Hennink, W.E.; Koning, G.A.; Crommelin, D.J.A. The nuclear pore complex: The gateway to successful nonviral gene delivery. Pharm. Res. 2006, 23, 447–459. [Google Scholar] [CrossRef]
- Yu, J.N.; Ma, S.F.; Miao, D.Q.; Tan, X.W.; Liu, X.Y.; Lu, J.H.; Tan, J.H. Effects of cell cycle status on the efficiency of liposome-mediated gene transfection in mouse fetal fibroblasts. J. Reprod. Dev. 2006, 52, 373–382. [Google Scholar] [CrossRef] [Green Version]
- Prasmickaite, L.; Høgset, A.; Berg, K. The role of the cell cycle on the efficiency of photochemical gene transfection. Biochim. Biophys. Acta 2002, 1570, 210–218. [Google Scholar] [CrossRef]
- Zou, S.; Scarfo, K.; Nantz, M.H.; Hecker, J.G. Lipid-mediated delivery of RNA is more efficient than delivery of DNA in non-dividing cells. Int. J. Pharm. 2010, 389, 232–243. [Google Scholar] [CrossRef]
- Jackson, N.A.C.; Kester, K.E.; Casimiro, D.; Gurunathan, S.; DeRosa, F. The promise of mRNA vaccines: A biotech and industrial perspective. NPJ Vaccines 2020, 5, 11. [Google Scholar] [CrossRef] [Green Version]
- Aldosari, B.N.; Alfagih, I.M.; Almurshedi, A.S. Lipid Nanoparticles as Delivery Systems for RNA-Based Vaccines. Pharmaceutics 2021, 13, 206. [Google Scholar] [CrossRef] [PubMed]
- Polack, F.P.; Thomas, S.J.; Kitchin, N.; Absalon, J.; Gurtman, A.; Lockhart, S.; Perez, J.L.; Pérez Marc, G.; Moreira, E.D.; Zerbini, C.; et al. C4591001 Clinical Trial Group. Safety and Efficacy of the BNT162b2 mRNA Covid-19 Vaccine. N. Engl. J. Med. 2020, 383, 2603–2615. [Google Scholar] [CrossRef] [PubMed]
- Ourlin, J.C.; Vilarem, M.J.; Daujat, M.; Harricane, M.C.; Domergue, J.; Joyeux, H.; Baulieux, J.; Maurel, P. Lipid-mediated transfection of normal adult human hepatocytes in primary culture. Anal. Biochem. 1997, 247, 34–44. [Google Scholar] [CrossRef]
- Park, J.-S.; Surendran, S.; Kamendulis, L.M.; Morral, N. Comparative nucleic acid transfection efficacy in primary hepatocytes for gene silencing and functional studies. BMC Res. Notes 2011, 4, 8. [Google Scholar] [CrossRef] [PubMed] [Green Version]
- Abdel-Razzak, Z.; Loyer, P.; Fautrel, A.; Gautier, J.-C.; Corcos, L.; Turlin, B.; Beaune, P.; Guillouzo, A. Cytokines down-regulate expression of major cytochrome P-450 enzymes in adult human hepatocytes in primary culture. Mol. Pharmacol. 1993, 44, 707–715. [Google Scholar]
- De Smet, K.; Loyer, P.; Gilot, D.; Vercruysse, A.; Rogiers, V.; Guguen-Guillouzo, C. Effects of epidermal growth factor on CYP inducibility by xenobiotics, DNA replication, and caspase activations in collagen I gel sandwich cultures of rat hepatocytes. Biochem. Pharmacol. 2001, 61, 1293–1303. [Google Scholar] [CrossRef]
- Desmots, F.; Rissel, M.; Gilot, D.; Lagadic-Gossmann, D.; Morel, F.; Guguen-Guillouzo, C.; Guillouzo, A.; Loyer, P. Pro-inflammatory cytokines tumor necrosis factor alpha and interleukin-6 and survival factor epidermal growth factor positively regulate the murine GSTA4 enzyme in hepatocytes. J. Biol. Chem. 2002, 277, 17892–17900. [Google Scholar] [CrossRef] [Green Version]
- Patel, A.; Aslam, R.; Jamil, M.; Ansari, A.; Khan, S. The Effects of Growth Factors and Cytokines on Hepatic Regeneration: A Systematic Review. Cureus 2022, 14, e24539. [Google Scholar] [CrossRef]
- Valentine, C.C.; Young, R.R.; Fielden, M.R.; Kulkarni, R.; Williams, L.N.; Li, T.; Minocherhomji, S.; Salk, J.J. Direct quantification of in vivo mutagenesis and carcinogenesis using duplex sequencing. Proc. Natl. Acad. Sci. USA 2020, 117, 33414–33425. [Google Scholar] [CrossRef]
- Buick, J.K.; Williams, A.; Meier, M.J.; Swartz, C.D.; Recio, L.; Gagné, R.; Ferguson, S.S.; Engelward, B.P.; Yauk, C.L. A Modern Genotoxicity Testing Paradigm: Integration of the High-Throughput CometChip® and the TGx-DDI Transcriptomic Biomarker in Human HepaRG™ Cell Cultures. Front. Public Health 2021, 9, 694834. [Google Scholar] [CrossRef]


| Lipid Names | Chemical Structures | Dh [a] [nm] | PDI [b] | [c] [mV] | References |
|---|---|---|---|---|---|
| Syn 1 | 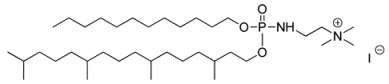 | 270 ± 108 | 0.23 | +49 ± 6 | [33] |
| Syn 2/KLN47 |  | 201 ± 108 | 0.197 | +34 ± 7 | [34] |
| Syn 3/BSV107 | 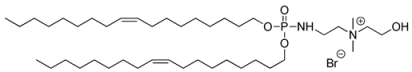 | 217 ± 113 | 0.232 | +31 ± 9 | [35] |
| Syn 4/KLN25 | 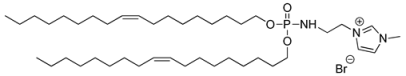 | 90 ± 61 | 0.348 | +52 ± 9 | [36] |
| Syn 5/BSV36 | 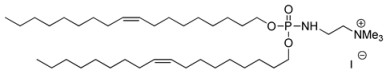 | 197 ± 100 | 0.385 | +41 ± 9 | [35] |
| Genes | Forward | Reverse |
|---|---|---|
| CDK1 | CCCTTTAGCGCGGATCTACC | AGGAACCCCTTCCTCTTCACT |
| Albumin | TGCTTGAATGTGCTGATGACAGG | AAGGCAAGTCAGCAGGCATCTCATC |
| UGT1A1 | TGACGCCTCGTTGTACATCAG | CCTCCCTTTGGAATGGCAC |
| UGT1A6 | CAGTGCCGTATGACCAAGAA | GTCTGAGGAGCAGTTAGGAATG |
| UGT1A9 | TGTCTTTAAACAAACTCCTGCAA | TGGAAAGCACAAGTACGAAGTATATA |
| UGT2B11 | AGGTTCTGTGGAGATTTGACG | TGCCTCATAGATGCCATTGG |
| UGT2B15 | GTGTTGGGAATATTATGACTACAGTAAC | GGGGTTAAATAGTTCAGCCAGT |
| GSTA2 | TGCAACAATTAAGTGCTTTACCTAAGTG | TTAACTAAGTGGGTGAATAGGAGTTGTATT |
| CYP1A2 | GGTTCAAGGCCTTCAACCAG | ACATGAGGCTCCAGGAGATG |
| CYP2B6 | TTCCTACTGCTTCCGTCTATC | GTGCAGAATCCCACAGCTCA |
| CYP2E1 | TTGAAGCCTCTCGTTGACCC | CGTGGTGGGATACAGCCA |
| CYP2D6 | TAAGGGAACGACACTCATCAC | TCACCAGGAAAGCAAAGACAC |
| CYP3A4 | CTTCATCCAATGGACTGCATAAA | TCCCAAGTATAACACTCTACACACACA |
| CK19 | TTTGAGACGGAACAGGCTCT | AATCCACCTCCACACTGACC |
| GFP | ACAACAGCCACAACGTCTAT | GGGTGTTCTGCTGGTAGTG |
| TBP | GAGCTGTGATGTGAAGTTTCC | TCTGGGTTTGATCATTCTGTA |
Publisher’s Note: MDPI stays neutral with regard to jurisdictional claims in published maps and institutional affiliations. |
© 2022 by the authors. Licensee MDPI, Basel, Switzerland. This article is an open access article distributed under the terms and conditions of the Creative Commons Attribution (CC BY) license (https://creativecommons.org/licenses/by/4.0/).
Share and Cite
Vlach, M.; Coppens-Exandier, H.; Jamin, A.; Berchel, M.; Scaviner, J.; Chesné, C.; Montier, T.; Jaffrès, P.-A.; Corlu, A.; Loyer, P. Liposome-Mediated Gene Transfer in Differentiated HepaRG™ Cells: Expression of Liver Specific Functions and Application to the Cytochrome P450 2D6 Expression. Cells 2022, 11, 3904. https://doi.org/10.3390/cells11233904
Vlach M, Coppens-Exandier H, Jamin A, Berchel M, Scaviner J, Chesné C, Montier T, Jaffrès P-A, Corlu A, Loyer P. Liposome-Mediated Gene Transfer in Differentiated HepaRG™ Cells: Expression of Liver Specific Functions and Application to the Cytochrome P450 2D6 Expression. Cells. 2022; 11(23):3904. https://doi.org/10.3390/cells11233904
Chicago/Turabian StyleVlach, Manuel, Hugo Coppens-Exandier, Agnès Jamin, Mathieu Berchel, Julien Scaviner, Christophe Chesné, Tristan Montier, Paul-Alain Jaffrès, Anne Corlu, and Pascal Loyer. 2022. "Liposome-Mediated Gene Transfer in Differentiated HepaRG™ Cells: Expression of Liver Specific Functions and Application to the Cytochrome P450 2D6 Expression" Cells 11, no. 23: 3904. https://doi.org/10.3390/cells11233904