Article

SWI/SNF Antagonism of PRC2 Mediates Estrogen-Induced Progesterone Receptor Expression

1
Department of Obstetrics, Gynecology and Reproductive Biology, College of Human Medicine, Michigan State University, Grand Rapids, MI 49503, USA
2
Genomics Core Facility, Van Andel Research Institute, Grand Rapids, MI 49503, USA
3
Department of Women’s Health, Spectrum Health System, Grand Rapids, MI 49341, USA
4
Center for Epigenetics, Van Andel Research Institute, Grand Rapids, MI 49503, USA
*
Author to whom correspondence should be addressed.
These authors contributed equally.
Cells 2022, 11(6), 1000; https://doi.org/10.3390/cells11061000
Submission received: 3 February 2022 / Revised: 8 March 2022 / Accepted: 12 March 2022 / Published: 15 March 2022
(This article belongs to the Special Issue Progesterone Receptor Signaling)

Abstract

:
Endometrial cancer (EC) is characterized by high estrogen levels unopposed by progesterone. Treatment with progestins is standard for early EC, but the response to progestins is dependent on progesterone receptor (PGR) expression. Here, we show that the expression of PGR in endometrial epithelial cells is dependent on ARID1A, a DNA-binding subunit of the SWI/SNF chromatin-remodeling complex that is commonly mutated in EC. In endometrial epithelial cells with estrogen receptor overexpression, we find that ARID1A promotes estrogen signaling and regulates common gene expression programs. Normally, endometrial epithelial cells expressing estrogen receptors respond to estrogen by upregulating the PGR. However, when ARID1A expression is lost, upregulation of PGR expression is significantly reduced. This phenomenon can also occur following the loss of the SWI/SNF subunit BRG1, suggesting a role for ARID1A- and BRG1-containing complexes in PGR regulation. We find that PGR is regulated by a bivalent promoter, which harbors both H3K4me3 and H3K27me3 histone tail modifications. H3K27me3 is deposited by EZH2, and inhibition of EZH2 in the context of ARID1A loss results in restoration of estrogen-induced PGR expression. Our results suggest a role for ARID1A deficiency in the loss of PGR in late-stage EC and a therapeutic utility for EZH2 inhibitors in this disease.

1. Introduction

Endometrial cancer (EC) is the most commonly diagnosed gynecologic malignancy, with an estimated 66,570 new cases diagnosed in 2021 [1]. The incidence of EC is increasing at a rate of 1% year on year [1]. Although EC is historically a disease of post-menopausal women, the incidence is also increasing in pre-menopausal women, a phenomenon attributed to increasing rates of obesity [2,3]. EC is derived from the endometrium, the cells that form the inner lining of the uterus and undergo monthly proliferation, differentiation, and shedding in response to ovarian steroid hormones [4]. Hyperproliferation of the endometrium results in endometrial hyperplasia, and complex atypical endometrial hyperplasia (CAH) is associated with increased risk for EC [5,6].
The functions of the endometrium are highly regulated through steroid hormone signaling. During the menstrual cycle, estrogen, through estrogen receptor α (ESR1), promotes proliferation of the endometrium, while progesterone inhibits estrogen-induced proliferation and promotes secretory differentiation through progesterone receptor (PGR) [7]. ESR1 and PGR belong to a superfamily of nuclear receptors that respond to extracellular ligands, translocate to the nucleus, bind DNA and modulate transcription [8]. Under normal conditions, PGR expression represents a critical feedback mechanism to temper the proliferative effects driven by estrogen [8].
In several endometrial pathologies, including EC and endometriosis, the balance between estrogen signaling and progesterone signaling becomes perturbed, either through increased reliance on estrogen or diminished responsiveness to progesterone [9,10]. In the case of EC, peripheral aromatization of androgens in the adipose tissue results in increased estrogen in obese women [2]. Most endometrial hyperplasias and 50–70% of endometrial cancers are responsive to progestin therapy, which is a current standard of care treatment for CAH and early EC [5,6,11]. Expression of PGR is an important prognostic factor in determining whether EC will respond to progestin therapy or if the tumor has become progesterone resistant [11,12]. Poor progestin response rates are correlated with disease recurrence [11]. Loss of PGR is observed in both CAH and EC [13,14]. Additionally, PGR expression is predictive of progestin response in endometriosis [15].
Genetic factors are associated with increased EC risk, including somatic mutations in ARID1A, a DNA-binding subunit of the SWI/SNF chromatin-remodeling complex. ARID1A is mutated in up to 16% of CAH and 40% of EC, and ARID1A mutations are more frequent in women diagnosed with EC at a younger age [16,17,18,19,20,21]. ARID1A is also associated with malignant transformation [17]. SWI/SNF chromatin remodeling alters the epigenome of cells, leading to transcriptional activation or repression of genes [22]. Previously, we have shown that SWI/SNF is an important regulator of cell identity in the endometrial epithelium, such that loss of ARID1A or the SWI/SNF catalytic subunit BRG1 can contribute to invasive endometrial pathologies [23,24,25,26,27]. This study aims to understand the role of SWI/SNF in regulating steroid hormone processes in the endometrial epithelium and the effect this may have on endometrial cancer pathogenesis. We performed transcriptome analysis of ESR1-positive endometrial epithelial cells, with and without ARID1A expression, and found that 55% of estrogen-altered genes are also affected by ARID1A loss. Among co-altered genes, we show that ARID1A is required for the estrogen-dependent activation of estrogen target genes, including PGR. We further show that a subset of estrogen and ARID1A co-regulated gene promoters contain histone post-translational modifications associated with bivalent chromatin. Bivalent chromatin-containing genes are repressed by the polycomb repressive complex 2 (PRC2) yet remain poised for transcriptional activation [28]. Drug inhibition of PRC2 methyltransferase subunit EZH2 partially rescues the effects of ARID1A loss on estrogen-dependent activation of PGR, supporting a role for PRC2 activity in PGR gene repression. Our results suggest that when ARID1A is mutated, estrogen-dependent transcription of the critical estrogen target gene, PGR, does not occur because of PRC2 activity at the PGR locus, resulting in progesterone resistance and increased EC cancer risk.

2. Methods

2.1. Cell Lines

12Z immortalized human endometrial epithelial cells [29] were maintained in DMEM/F12 media without phenol red (Gibco, Billings, MT, USA; cat# 11039-021) supplemented with 10% charcoal-stripped fetal bovine serum (FBS) (Gibco; cat# A33821-01), 1% L-glutamine and 1% penicillin/streptomycin (P/S). 12Z cells were transfected with the ESR1 plasmid from the Precision LentiORF Collection (Horizon Discovery Biosciences, Cambridge, UK) and grown under Blasticidin conditions. Stable expression was confirmed by western blot.

2.2. Transfection and Treatment of 12Z Cells with siRNA

12Z-ESR1 cells were seeded at a density of 40,000 cells/mL DMEM/F12 media without phenol red supplemented with 10% FBS and 1% L-glutamine. The following day, the media was refreshed, and cells were transfected with 50 pmol/mL of siRNA (Dharmacon, Lafayette, CO, USA; ON-TARGETplus Non-targeting Pool and human ARID1A #8289 SMARTpool) using the RNAiMax (ThermoFisher, Waltham, MA, USA) lipofectamine reagent according to the manufacturer’s instructions at a ratio of 1:1 volume:volume in OptiMEM (Gibco, Billings, MT, USA). After 24 h, the media was replaced with DMEM/F12 media without phenol red supplemented with 10% charcoal-stripped FBS 1% L-glutamine. The following day, the media was replaced with DMEM/F12 media without phenol red supplemented with 0.5% charcoal-stripped FBS, 1% L-glutamine containing either 10 nM β-Estradiol (Sigma, St. Louis, MO, USA; cat# E2758) or 0.1% ethanol vehicle.

2.3. Western Blotting

Protein lysates were quantified using the Micro BCA Protein Assay Kit (ThermoFisher) and a FlexSystem3 plate reader. Protein lysates were run on a 4–15% gradient SDS-PAGE gel (BioRad, Hercules, CA, USA) and transferred to the PVDF membrane using the TransBlot Turbo system (BioRad). Primary antibodies were used at the following dilutions: 1:1000 ARID1A (D2A8U) (12354, Cell Signaling, Danvers, MA, USA); 1:1000 β-Actin (8457, Cell Signaling); 1:1000 PGR (SAB5500165, Sigma); 1:1000 ESR1 (MCA1799, Bio-Rad), 1:100 BRG1 (sc-17796, Santa Cruz Biotechnology, Dallas, TX, USA); 1:1000 ARID1B (92964, Cell Signaling). Horseradish peroxidase (HRP) conjugated secondary antibodies (Cell Signaling) were used at a dilution of 1:2000. Clarity Western ECL Substrate (BioRad) was used for protein band visualization, and western blot exposures were captured using the ChemiDoc XRS+ imaging system (BioRad). Uncropped western blots are shown in Supplementary Figure S4.

2.4. RNA Isolation and qRT-PCR

RNA samples were collected 72h-post siRNA transfection using the Quick-RNA Miniprep Kit (Zymo Research, Irvine, CA, USA). cDNA was synthesized from RNA, and qRT-PCR was performed using PowerUp SYBR Green Master Mix (ThermoFisher, Waltham, MA, USA) and the Applied Biosystems (Waltham, MA, USA) ViiA7 real-time PCR system.

2.5. Construction and Sequencing of Directional mRNA-seq Libraries

Libraries were prepared by the Van Andel Genomics Core from 500 ng of total RNA using the KAPA mRNA HyperPrep kit (v4.17) (Kapa Biosystems, Wilmington, MA, USA). RNA was sheared to 300–400 bp. Prior to PCR amplification, cDNA fragments were ligated to Bioo Scientific NEXTflex dual indexing adapters (Bioo Scientific, Austin, TX, USA). Quality and quantity of the finished libraries were assessed using a combination of Agilent DNA High Sensitivity chip (Agilent Technologies, Inc, Santa Clara, CA, USA.), QuantiFluor® dsDNA System (Promega Corp., Madison, WI, USA), and Kapa Illumina Library Quantification qPCR assays (Kapa Biosystems, Wilmington, MA, USA). Individually indexed libraries were pooled and 75 bp, single-end sequencing was performed on a NextSeq500 sequencer using a 75-cycle high output kit (v2) (Illumina Inc., San Diego, CA, USA) and each library was sequenced to an average raw depth of 35 M reads. Base-calling was done by Illumina NextSeq Control Software (NCS) v2.0 and the output of NCS was demultiplexed and converted to FastQ format with Illumina Bcl2fastq v1.9.0.

2.6. RNA-seq Analysis

Raw 75 bp reads were trimmed with cutadapt [30] and Trim Galore! (http://www.bioinformatics.babraham.ac.uk/projects/trim_galore/, accessed on 11 March 2022) followed by quality control analysis via FastQC [31]. Trimmed reads were aligned to GRCh38.p12 and indexed to GENCODE [32] v28 annotation via STAR [33] aligner with the flag ‘--quantMode GeneCounts’ for feature counting. Output gene count files were constructed into an experimental read count matrix in R. Low count genes were filtered (1 count per sample on average) prior to DESeq2 [34,35] count normalization and subsequent differential expression analysis. Calculated differential expression probabilities were corrected for multiple testing by independent hypothesis weighting (IHW) [36] for downstream analysis. Differentially expressed gene thresholds were set at FDR < 0.0001. Principal component analysis was calculated using DESeq2 from the top 500 genes by variance across samples. Relative gene expression heatmaps were produced using relative regularized logarithm (rlog) [34] counts by subtracting mean rlog counts of the control group. Relative linear gene expression bar plots were produced from the DESeq2 normalized counts table.

2.7. Analysis of PGR Chromatin from Roadmap

NIH Roadmap Epigenomics data were used to explore the relationship between H3K27me3 and PGR expression in human tissues [37]. Broad H3K27me3 domains were analyzed on the Roadmap Web Portal (https://egg2.wustl.edu/roadmap/web_portal/ accessed on 28 December 2021), and samples were binarized by presence or absence of any H3K27me3 peak calls within 3 kb of the PGR gene TSS. Among the 56 samples with matched RNA-seq data, PGR gene expression (quantified by RPKM, Reads Per Kilobase of transcript, per Million mapped reads) was then compared between samples with vs. without promoter H3K27me3.

2.8. Bioinformatics and Statistics

Wild-type 12Z cell ARID1A ChIP-seq data and siARID1A vs. control 12Z cell total RNA-seq data were re-analyzed from GSE121198 as previously described [24]. Genes exhibiting bivalent promoter chromatin in 12Z cells were identified from previously reported H3K4me3 and H3K27me3 ChIP-seq data GSE148474 [25]. Active super-enhancer regions were previously defined [25] from H3K27ac ChIP-seq data which overlapped with accessibility (ATAC) [38] in control 12Z cells using the ROSE algorithm [39,40]. GeneHancer [41] database was used to associate enhancers to genes with a GeneHancer score > 1 threshold. HOMER [42] was used to count sequencing reads at genomic sites of interest and quantify signal and count reads at sites of interest for tag density heatmaps and meta peak plots. Chromatin analyses involving ChIP signal quantification at regions of interest used pooled reads from both IP replicates, per feature. TxDb.Hsapiens.UCSC.hg38.knownGene [43] was used to define gene promoters for all standard hg38 genes as 3 kilobase regions surrounding the primary TSS. MACS2 [44] was used to produce genome-wide signal log-likelihood ratio (logLR) tracks for IGV [45] visualization. ClusterProfiler [46] was used to compute and visualize pathway enrichment from a list of gene symbols with respective gene universes. Hallmark pathways and GO Biological Process gene sets were retrieved from MSigDB [47]. ComplexHeatmap [48] was used for hierarchical clustering by Euclidean distance and general heatmap visualization. GenomicRanges [49] functions were frequently used to intersect and manipulate genomic coordinates, for example, for genome-wide association tests. eulerr [50] was used to produce proportional Euler diagrams. biomaRt [51,52] was used for all gene nomenclature and ortholog conversions. ggplot2 [53] was used for certain plotting applications. The statistical computing language R [54] was used for many applications. ImageJ software (National Institutes of Health, Bethesda, MD, USA) was used to calculate western blot densitometry. GraphPad Prism 8 software was used to perform t-tests.
Endometrial cancer cell line data for 40 cell lines were collected from the Cancer Cell Line Encyclopedia (CCLE) [55] using the CCLE DepMap tool. Endometrial and breast cancer patient sample mRNA and protein data from The Cancer Genome Atlas PanCancer Atlas dataset [56] were accessed through cBioPortal [57,58].

2.9. Cell Growth Assay

12Z cells were seeded at a density of 4000 cells per well in a 96-well plate. After 24 h, cells were treated with EPZ-6438 at concentrations from 100 nM to 100 μM, or 0.1% DMSO vehicle. After 48 h, cells were incubated with 2 μg/mL calcein-AM for 1 h, and fluorescence was measured using a SpectraMax i3x (Molecular Devices, San Jose, CA, USA).

3. Results

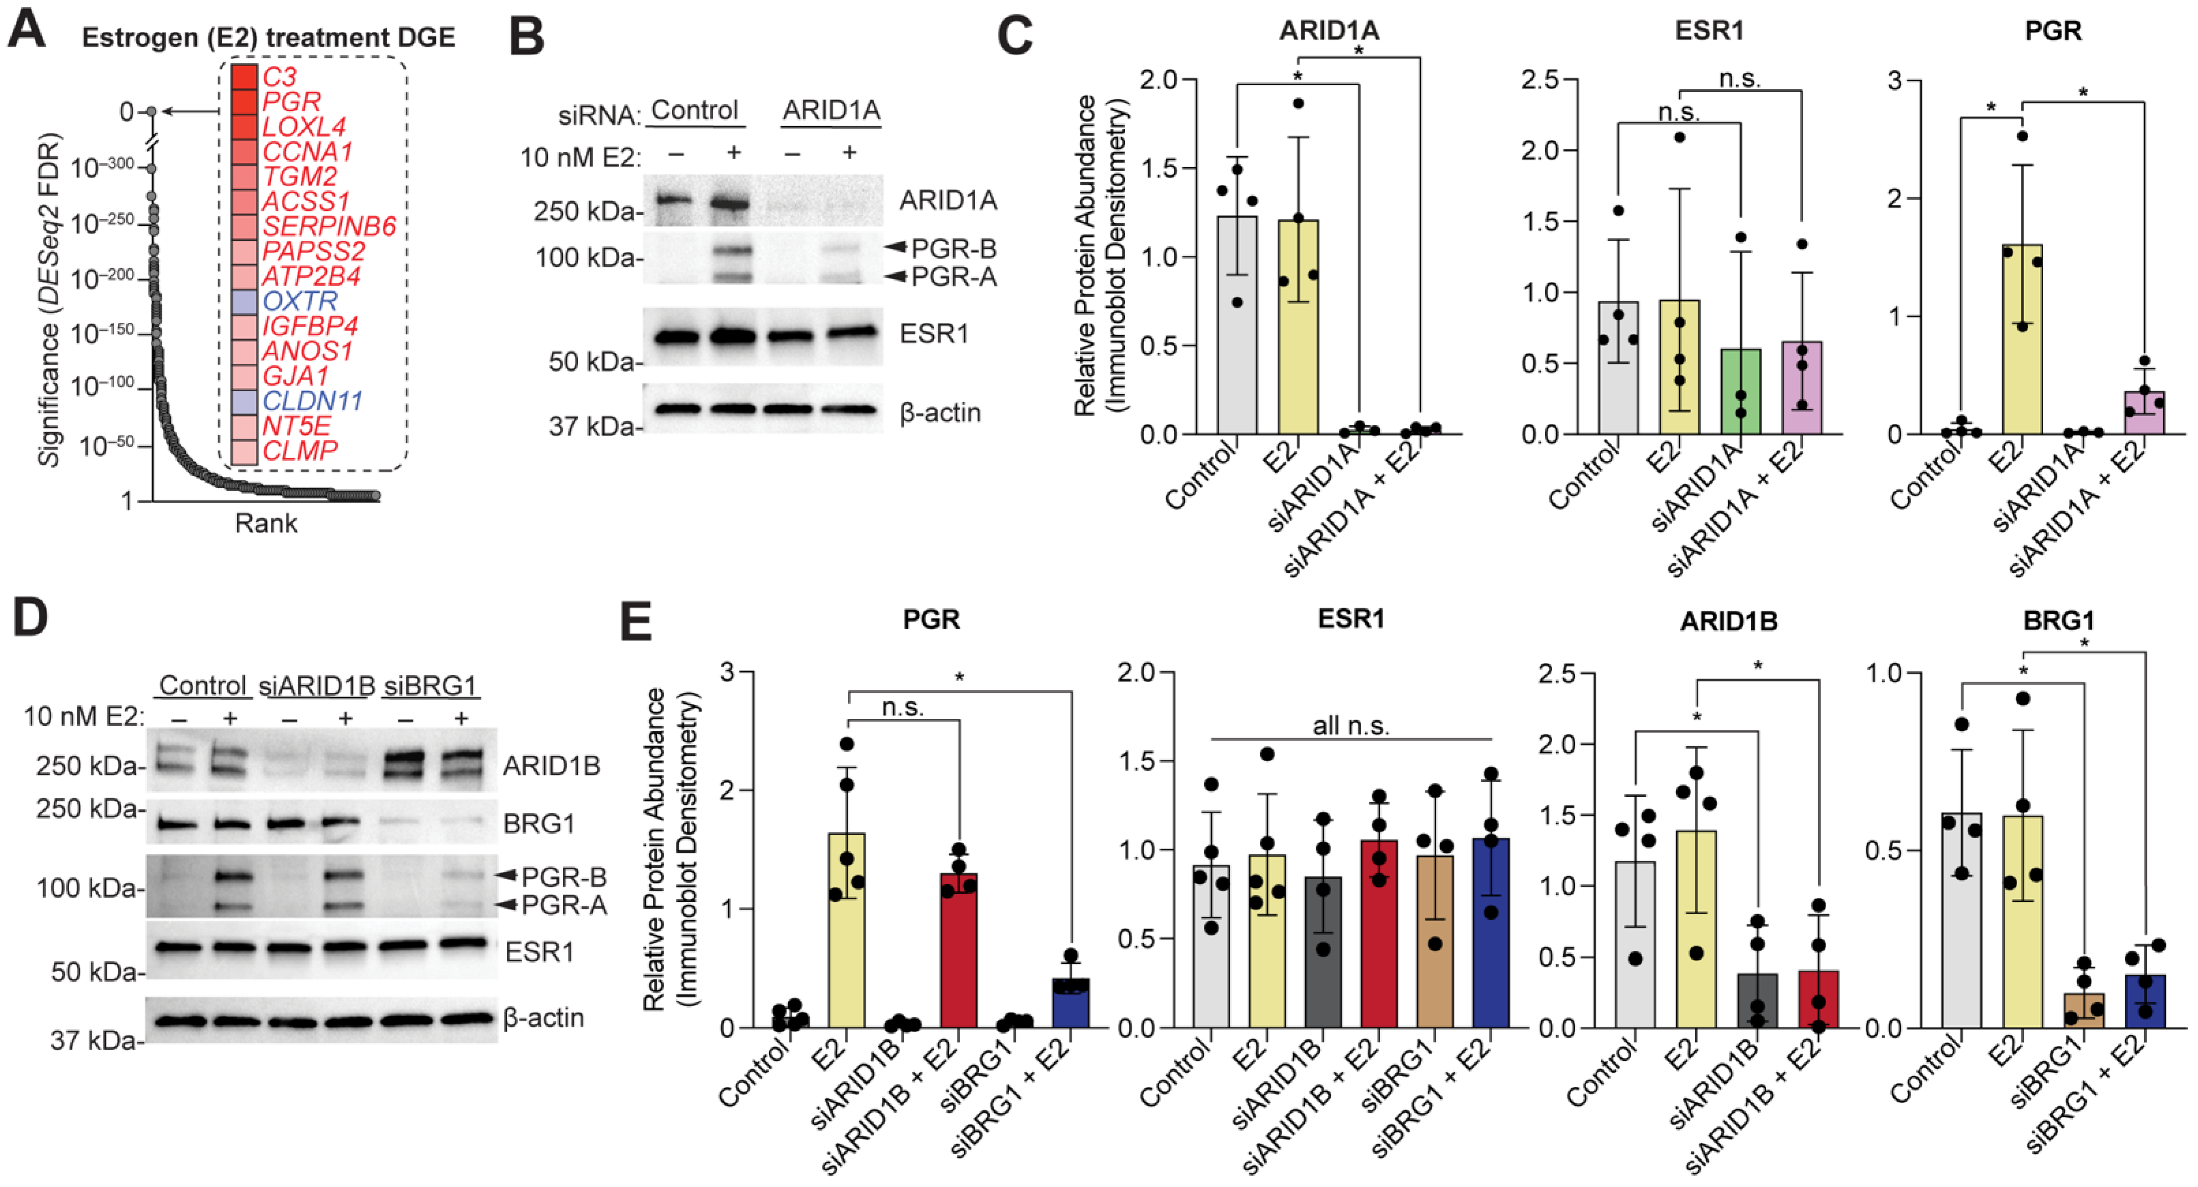
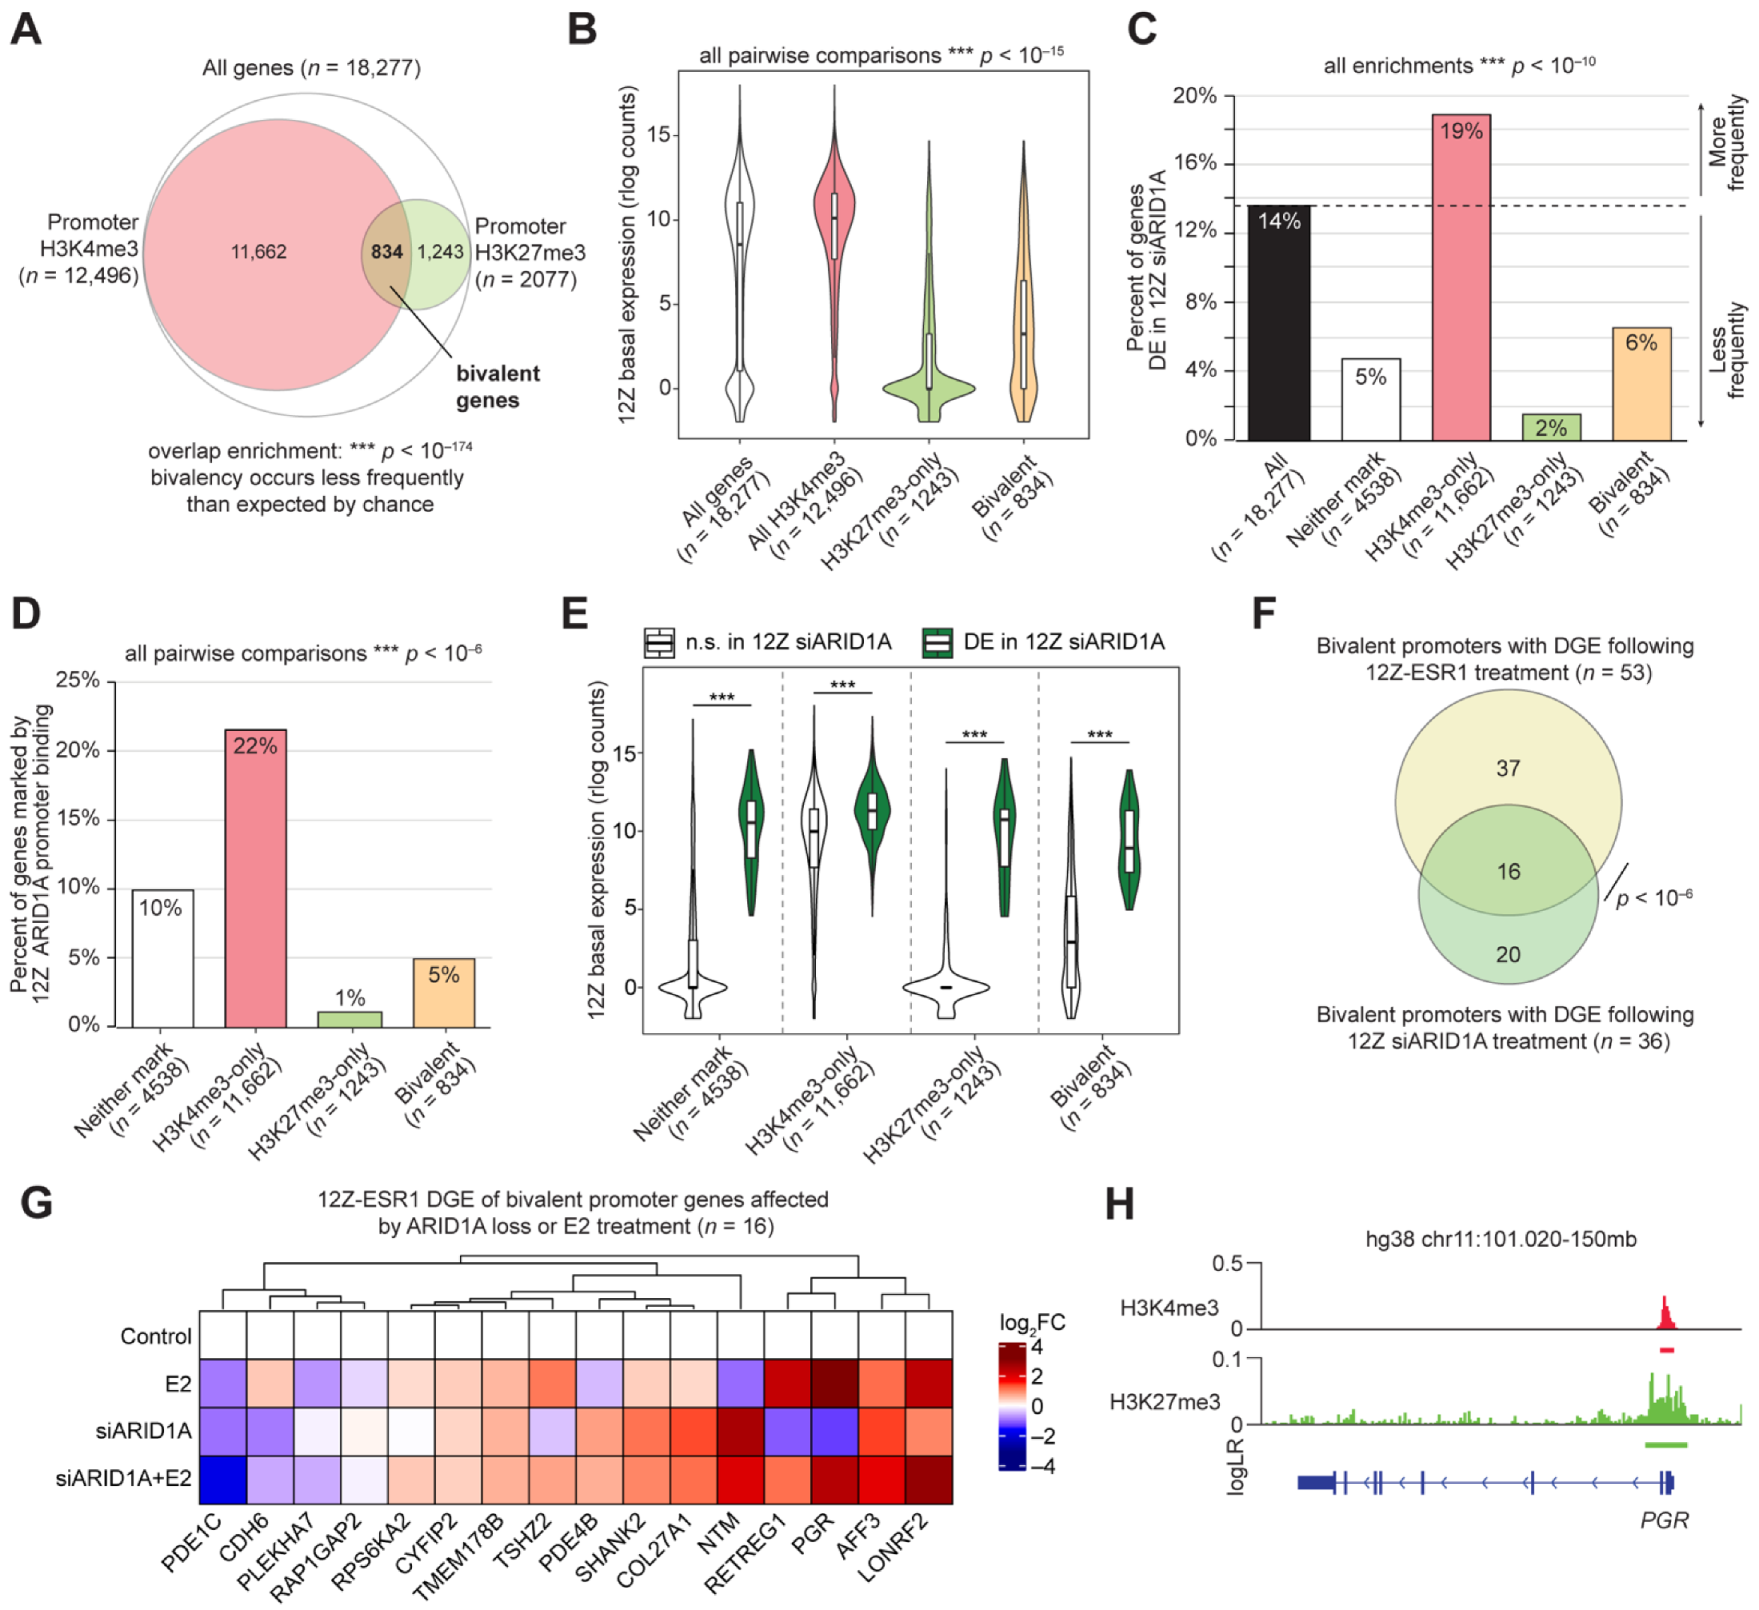
3.1. ARID1A and Estrogen Signaling Cooperatively Regulate Biological Processes in the Endometrial Epithelium

Most endometrial cancer cell lines do not express ESR1 and harbor ARID1A mutations (Figure S1) as well as other cancer-driver mutations [55]. Therefore, to investigate the role of estrogen signaling in endometrial epithelial cells, we utilized the immortalized 12Z cell line [29]. 12Z cells were transfected with the Precision LentiORF (horizon) plasmid containing a human ESR1 open reading frame cDNA to develop a cell line with stable ESR1 expression. Stable expression of ESR1 was developed under selection with Blasticidin. Protein expression of ESR1 was confirmed by western blot (Figure 1A). Then, 12Z cells with stable expression of ESR1 (henceforth, 12Z-ESR1 cells) were transiently transfected with ARID1A siRNAs (siARID1A) or non-targeting RNAs [24]. After transfections, 12Z-ESR1 cells were treated with 10 nM estrogen (estradiol, E2) or vehicle for 24 h. At this time, RNAs were collected for transcriptome analysis by RNA-seq. Principal component analysis based on gene expression revealed clear segregation by ARID1A knockdown or E2 treatment (Figure 1B). Unsupervised clustering of 2032 variable genes revealed that ARID1A loss had a larger effect on gene expression than E2 (Figure 1C). However, numerous patterns of estrogen-regulated gene expression were observed, including genes that are dependent upon ARID1A for estrogen-mediated induction (PGR), not augmented by ARID1A loss (C3), or augmented by ARID1A loss (CCNA1) (Figure 1D). As with PGR, C3 is a well-defined ESR1 target gene [59,60,61], suggesting high variability in the role of ARID1A in regulating estrogen-induced, ESR1-dependent gene expression. We performed Broad Gene Set Enrichment Analysis (GSEA) on these RNA-seq data and observed that many of the MSigDB Hallmark pathways were significantly upregulated by E2 treatment independent of ARID1A loss (Table 1). Pathways related to estrogen signaling itself (estrogen response early, estrogen response late) appeared to be upregulated upon E2 treatment but reduced in ARID1A knockdown cells treated with E2 compared to E2 treatment alone (Figure 2A). We examined the expression of each gene in these pathways and identified 43 Hallmark estrogen response genes that display ARID1A-dependent induction by estrogen (Figure 2B). These results suggest that ARID1A is required for the expression of certain estrogen target genes in response to estrogen stimulation.
Among the 1699 genes significantly differentially expressed upon E2 treatment of 12Z-ESR1 cells (FDR < 0.0001), 939 were further affected by the loss of ARID1A (Figure 3A). Most overlapping genes (64.4%) were normally cooperatively regulated by E2 and ARID1A (i.e., different direction of perturbation with ARID1A loss and E2 treatment, suggesting that normal ARID1A function is cooperative with E2), with the remaining 35.6% of genes classified as exhibiting antagonistic regulatory activity (Figure 3B). Gene set enrichment analysis was then performed for MsigDB Hallmark pathways and GO Biological Processes. Strikingly, Hallmark estrogen target genes were enriched among genes cooperatively activated by E2 and ARID1A, while EMT, cell adhesion, and wound healing responses were often cooperatively downregulated in response to estrogen (Figure 3C). Furthermore, E2 and ARID1A appear to regulate metabolic pathways, including glycolysis and cholesterol homeostasis, antagonistically (Figure 3C). These results suggest ARID1A facilitates estrogen-mediated gene expression, both among genes induced and repressed by estrogen signaling. Known pathological processes regulated by ARID1A in endometrial models [23,24,25,26], like EMT, migration, adhesion, and wound healing, are indicated as being normally suppressed by estrogen signaling, which supports cooperative roles for ARID1A and estrogen signaling in the maintenance of endometrial epithelial identity.

3.2. Cell Identity of the Endometrial Epithelium Depends on ARID1A Expression and Regulation by Estrogen

We next considered the role of ARID1A binding in regulating estrogen-induced genes. We utilized our ARID1A ChIP-seq data from 12Z cells [24] and identified 436 genes with detected ARID1A promoter binding and differential gene expression following ARID1A loss or E2 treatment in 12Z-ESR1 cells (Figure 4A). As expected, the ARID1A binding at these gene promoters was higher than expected by chance (Figure 4B). Among these 436 genes, treatment with E2 generally decreased gene expression, while siARID1A treatment generally increased gene expression (Figure 4C). As such, most of these genes displayed a cooperative relationship in their regulation by ARID1A and E2 (Figure 4D). Intriguingly, ARID1A binding appeared highest at genes that downregulated following E2 treatment, regardless of the effect of differential gene expression following ARID1A loss (Figure 4E). Using these 436 genes, we performed gene set enrichment analysis for GO Biological Processes and MsigDB Hallmark pathways and identified cell adhesion and EMT as the top enriched pathways (Figure 4F,G). We identified 36 Hallmark EMT genes among the 436 intersect genes, and these genes also displayed mostly cooperative regulation by ARID1A and E2, suggesting that estrogen stimulation may lead to EMT downregulation or re-epithelialization (Figure 4H). Among these, we observed differential expression of SERPINE1, a gene regulated by ARID1A through repression of hyperacetylation of the SERPINE1 super-enhancer [25]. SERPINE1 expression is upregulated following ARID1A loss but repressed following E2 treatment (Figure 4H), suggesting ARID1A may normally be involved in its repression following estrogen stimulation. Furthermore, genes that were differentially expressed following E2 treatment, ARID1A knockdown, or both were enriched for genes regulated by active super-enhancers in 12Z cells (Figure 4I), as previously defined [25], which are known to regulate genes related to cell identity [39,40]. These results suggest that ARID1A and estrogen may govern epithelial cell identity in the endometrium by co-regulating cell identity genes governed by super-enhancers, where estrogen stimulation suppresses mesenchymal gene expression, assisted by ARID1A-SWI/SNF chromatin regulation, to promote epithelialization.

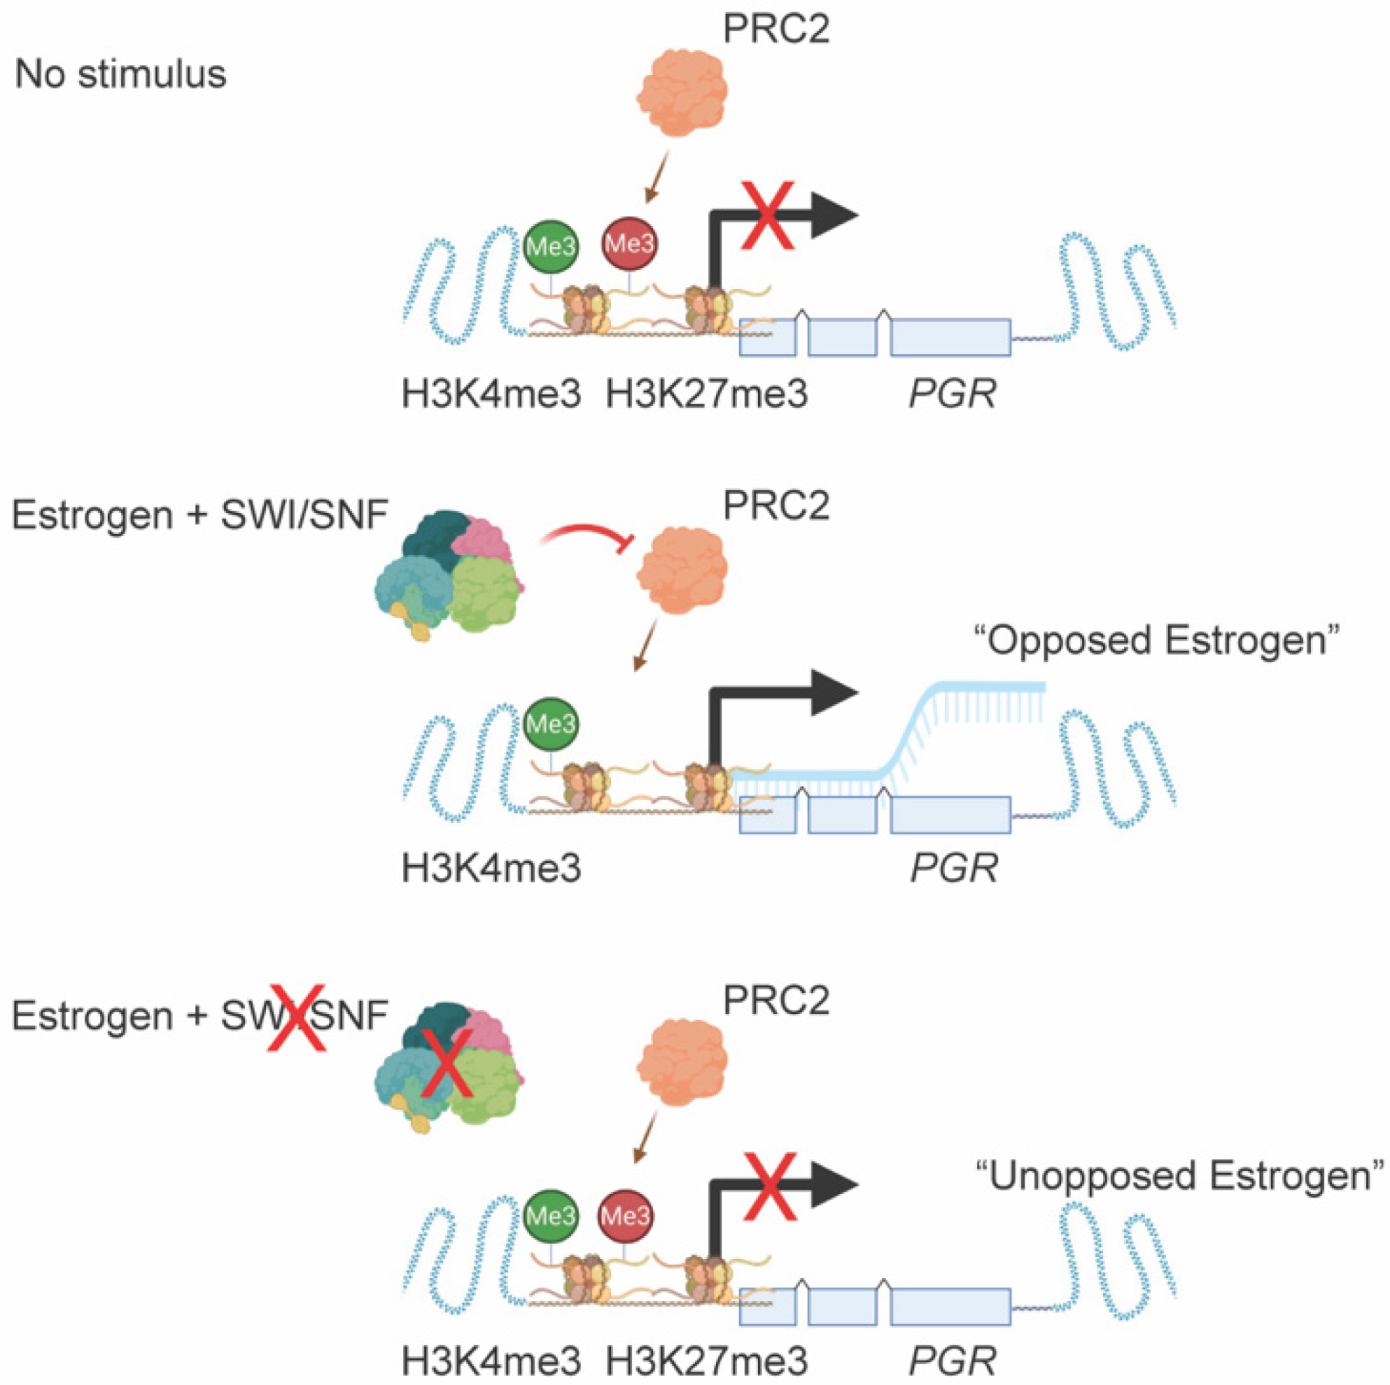
3.3. ARID1A Opposes PRC2-Mediated Repression of Estrogen-Mediated Progesterone Receptor Expression

We further investigated the role of ARID1A in the regulation of the progesterone receptor. Out of the 1699 genes empirically defined as estrogen-mediated in 12Z ESR1+ cells, PGR is one of the most highly induced estrogen target genes (Figure 5A), consistent with previous findings [7]. In EC patient samples, PGR expression is significantly correlated with ESR1 expression but is not correlated with the alternative estrogen receptor, ESR2 (Figure S2). However, following ARID1A loss in 12Z-ESR1 cells, PGR transcript induction by E2 is reduced (see Figure 1D). We confirmed the change in PGR protein expression by western blot, observing a ~75% reduction in PGR protein expression following ARID1A loss (Figure 5B,C). ARID1A loss had a similar effect on both PGR isoforms, the ~120 kDa PGR-B and the ~90 kDa PGR-A (Figure 5B). This result confirms that the decrease in PGR transcript following ARID1A loss translates to a decrease in PGR protein expression.
ARID1A is one of multiple SWI/SNF subunits implicated in human disease, as alternative SWI/SNF subunit configurations regulate chromatin in a tissue-dependent manner [62,63]. The catalytic subunit BRG1 is also mutated in EC and reduced expression has also been observed [64,65]. SWI/SNF complexes often contain both ARID1A and BRG1 [66], and these subunits co-regulate epithelial identity in the endometrial epithelium [27]. Therefore, we tested whether BRG1 loss also reduced estrogen-induced PGR expression. By using siRNA knockdown of BRG1 in 12Z-ESR1 cells, we observed a reduction in estrogen-induced PGR expression (Figure 5D,E). As an alternative to ARID1A, SWI/SNF complexes can incorporate the paralogous DNA-binding subunit, ARID1B [63], so we tested whether loss of ARID1B also affected PGR expression. Through knockdown of ARID1B by siRNA transfection into 12Z-ESR1 cells, we observed no change in estrogen-induced PGR expression (Figure 5D,E), suggesting a specific role for ARID1A-containing SWI/SNF complexes in regulating PGR upon estrogen stimulation in the endometrial epithelium.
We next considered the regulation of PGR by ARID1A at the chromatin level. The SWI/SNF complex plays a role in developmental and cell identity processes through opposition to chromatin silencing by the Polycomb Repressive Complexes (PRCs) [67,68,69]. PRCs often play important roles in disease pathogenesis, and the catalytic subunit of PRC2, EZH2 (Enhancer of Zeste Homolog 2), is overexpressed in several cancers [70,71,72,73,74,75,76]. In normal cells, SWI/SNF actively removes PRC2 from chromatin via its remodeling activity [67,77,78,79]. Notably, inhibition of EZH2 has been suggested as a treatment for ARID1A-deficient ovarian clear cell carcinoma through a synthetic lethal relationship with ARID1A [80]. EZH2 acts specifically as a histone H3 lysine 27 (H3K27) methyltransferase, resulting in the H3K27 trimethyl (me3) histone modification at target chromatin [81]. The H3K27me3 mark is a repressive histone modification deposited by PRC2, while H3K4me3 is an activating chromatin modification that may prevent permanent silencing [82,83]. During development, chromatin can be modified with both H3K27me3 and H3K4me3, allowing for gene repression until activation is required [84,85]. Chromatin modified with both H3K27me3 and H3K4me3 is canonically referred to as bivalent chromatin [84,85]. We previously characterized the chromatin environment of 12Z cells through a survey of 5 histone modifications, including both H3K27me3 and H3K4me3, identifying an association between ARID1A and the activating modification H3K4me3 but not the repressive modification H3K27me3 [25]. Among promoters with either H3K4me3 or H3K27me3, bivalency occurred less frequently than expected by chance, with only ~7% of H3K4me3 promoters also marked with H3K27me3 (Figure 6A). As expected, gene promoters marked with H3K4me3 display high basal gene expression in 12Z cells, while promoter H3K27me3 is associated with low expression (Figure 6B). Bivalent gene promoters were associated with higher basal expression than H3K27me3 alone and lower expression than all H3K4me3 genes (Figure 6B). Genes marked with bivalent promoters were less likely than chance to be promoter-bound by ARID1A or differentially expressed upon ARID1A loss, though bivalent genes were more likely to be regulated by ARID1A than those marked by H3K27me3 alone (Figure 6C,D). Among genes with bivalent promoters, genes affected by ARID1A knockdown in 12Z cells have higher basal gene expression, although this is true for genes without bivalent promoters (Figure 6E). Overall, these results suggest that ARID1A is not associated with bivalent promoters globally. However, by comparing genes with bivalent promoters to our differential gene expression following E2 treatment or ARID1A loss, we observed 53 bivalent genes regulated by E2 and 36 bivalent genes affected by ARID1A loss (Figure 6F). These genes are summarized in Table 2. Among these, 16 genes with bivalent promoters were affected by both ARID1A loss and E2 treatment, including PGR (Figure 6G,H). These results suggest that a subset of genes regulated by both ARID1A and E2 may be antagonized by PCR2 upon ARID1A loss.
Following our observation that PGR is regulated by a bivalent promoter in 12Z cells, we utilized the NIH Epigenomics Roadmap data to investigate if bivalent chromatin may be a mechanism regulating PGR expression across human tissues. Among 56 tissue samples that had both H3K27me3 ChIP data and matched transcript data, we found that those samples with H3K27me3 at the PGR promoter had significantly lower PGR expression than those without promoter H3K27me3 (Figure 7A), further suggesting that PGR expression can be repressed by H3K27me3. As H3K27me3 is deposited by EZH2, we next tested whether PGR induction following E2 stimulation was being repressed by EZH2 enzymatic activity following ARID1A loss. To do so, we utilized a small molecule inhibitor of EZH2, EPZ-6438, which inhibits methyltransferase activity in a dose-dependent manner [86,87]. EPZ-6438 had no effect on 12Z cell growth at concentrations of 30 μM or below (Figure 7B). At a concentration of 10 μM, EPZ-6438 treatment of 12Z-ESR1 cells partially rescued the expression of both PGR protein and PGR mRNA in ARID1A knockdown cells treated with E2 (Figure 7C–E). These results are recapitulated in EC patient samples, as ARID1A expression is positively correlated with PGR expression (Figure 8A,B), while EZH2 expression is negatively correlated with both PGR and ESR1 expression (Figure 8A). These results support a role for EZH2 in repressing PGR in the context of ARID1A loss in the endometrial epithelium, leading to progesterone resistance and an “unopposed estrogen” phenotype in endometrial cancer (Figure 9).

4. Discussion

Here, we described roles for ARID1A and EZH2 in the regulation of PGR upon E2 stimulation. ARID1A co-regulates a large subset of genes regulated by estrogen, which may explain why ARID1A mutations are common in estrogen-dependent gynecologic diseases and cancers, wherein ARID1A mutations are observed in the epithelial compartment. Estrogen is a master regulator of the endometrial epithelium, and we found that both ARID1A and estrogen co-regulate epithelial identity genes, with ARID1A playing non-conventional roles in repression. ARID1A loss leads to EMT and invasion in the endometrial epithelium, and the results presented here suggest a role for wild-type ARID1A and estrogen signaling in the co-operative maintenance of epithelial identity. At other genes, ARID1A plays traditional activating roles following estrogen stimulation, which includes counteracting the repressive effects of PRC2 complexes at critical genes like PGR. Loss of either ARID1A or BRG1 SWI/SNF subunits is frequently observed in diseases in which PGR expression is lost, including breast cancer, in which ARID1A is mutated in 5% of cases [88] and ARID1A and BRG1 are known to play a role in response to ESR1 antagonists [89]. Positive correlations between ARID1A and PGR expression, and negative correlations between EZH2 and PGR/ESR1 expression, were also observed in breast cancer patient samples (Figure S3). Our results suggest a potential therapeutic application for EZH2 inhibitors in the restoration of progesterone sensitivity in these contexts.
The exact role of PGR in the epithelial component of the endometrium remains unclear. PGR is expressed in both the epithelial and stromal compartments of the endometrium. However, in vivo mouse studies and in vitro human cell line studies have demonstrated a role for stroma PGR, rather than epithelial PGR, in reducing epithelial proliferation following estrogen stimulation or apoptosis following ovariectomy [90,91,92,93,94]. Still, other mouse studies have demonstrated roles for epithelial PGR in regulating gene expression and reducing proliferation [95,96]. Epithelial PGR is reduced in progesterone-resistant ectopic endometriotic lesions [15], although it is unclear if the lesions showing PGR loss have impaired SWI/SNF activity. PGR expression correlates with the response of CAH and EC to progestin therapy, suggesting an important role for PGR in pathologies derived from the endometrial epithelium itself, as would be observed in endometrial cancer.
Previous studies have shown that PGR expression is regulated through epigenetic mechanisms. The PGR promoter is rich in CpG islands [97]. DNA methylation leads to silencing of PGR-B in the eutopic endometrium of women with endometriosis [97,98], a phenomenon that may occur due to aberrant expression of DNA methyltransferases in endometriosis [99]. However, the regulation of PGR expression through histone methylation is relatively understudied. Expression of histone demethylase JARID1A can repress PGR expression through the removal of activating H3K4me3 marks [100,101]. PGR itself has been shown to upregulate EZH2 in the mammary epithelium [102]. EZH2 has been reported as a transcriptional activator of ESR1 expression in breast cancer cells [103]. In the 12Z-ESR1 model, in which ESR1 was stably overexpressed, we did not explore the regulation of ESR1 by EZH2, although EZH2 expression is negatively correlated with ESR1 expression in patient tumor tissues (Figure 8A,B). Endometriotic lesions have been characterized as hypermethylated at H3K4 relative to eutopic endometrium, and higher numbers of cells within lesions express nuclear H3K27me3 [104,105]. Our results show that endometrial pathologies harboring ARID1A mutations have altered steroid hormone signaling driven by EZH2 methyltransferase activity. This suggests a role for ARID1A and EZH2 in the regulation of PGR during normal endometrial cycling in response to estrogen and progesterone signaling, with differential expression being mediated by facultative chromatin modifications.
In EC, EZH2 expression is increased in tumor samples compared to normal tissue, and high EZH2 expression correlates with decreased progression-free survival or overall survival [106,107,108,109]. Increases in EZH2 expression have also been observed in CAH, but not simple hyperplasia [108]. Positive correlations have been demonstrated between EZH2 protein expression and stage, grade, and depth of invasion in endometrial cancer patients [110]. Knockdown of EZH2 in EC cell lines has been shown to reduce proliferation and invasion [108,110,111,112]. In the mouse uterus, epithelial EZH2 expression is induced by estrogen and inhibited by progesterone [113]. Knockout of both epithelial and stromal EZH2 in the mouse using a Pgr-Cre system [114] resulted in endometrial hyperplasia [113]. RNA-seq was performed on bulk uterine tissue from this model, and loss of EZH2 appeared to enhance estrogen-regulated pathways [115], although a later study found that only 7 genes were differentially expressed in a comparison of the wild-type epithelium and EZH2 knockout epithelium in this model [116]. Additional studies are needed to characterize the specific role of EZH2 in the endometrial epithelium and its relevance as a therapeutic target in EC.
In the past decade, targeting of EZH2 in SWI/SNF-deficient cancers has been the focus of many studies. The synthetic lethal relationship was first identified in SMARCB1 deficient rhabdoid tumors and lymphomas, in which tumor phenotypes could be rescued by inhibition of EZH2 [67,86]. EPZ-6438 (also called tazemetostat) has been tested in a phase 1 study for refractory B-cell non-Hodgkin lymphoma and advanced solid tumors harboring somatic SWI/SNF mutations in which it was shown to have both antitumor activity and a favorable safety profile [117]. The therapeutic utility of EZH2 has been explored extensively in ovarian clear-cell cancer (OCCC), another gynecologic cancer with high rates of ARID1A mutation [118,119]. In epithelial OC, high expression of BRG1 expression is associated with improved survival, while high expression of EZH2 is predictive of poor outcome [120]. Loss of BRG1 in ARID1A-mutant OCCC cell line, TOV21G, promotes resistance to EZH2 inhibitors [121]. Endometriosis is a known risk factor for the endometroid and clear cell subtypes of OC [122,123], and the peritoneal fluid from women with endometriosis has been shown to induce expression of EZH2 and H3K27me3 in OC cell lines [124]. EZH2 has also been shown to mediate mesenchymal-to-epithelial transition of OC-associated stromal stem cells, which promote metastasis [125]. EZH2 inhibition restores the expression of ESR1 in high-grade serous OC cells [126]. Histone deacetylase (HDAC) inhibitors and EZH2 inhibitors have been shown to synergize in BRG1-deficient small cell carcinoma of the ovary, hypercalcemic type cells through increased H3K27 acetylation [127]. In the present study, we utilized sub-lethal concentrations of EPZ-6438 and showed an effect on PGR expression, suggesting that EZH2 inhibition may restore progesterone sensitivity in EC and other progesterone-resistant, SWI/SNF deficient gynecologic pathologies, thus blocking the growth-promoting effects of estrogen.

Supplementary Materials

The following supporting information can be downloaded at: https://www.mdpi.com/article/10.3390/cells11061000/s1, Figure S1: Expression of ESR1 among ARID1A wild-type and ARID1A mutant endometrial cancer cell lines; Figure S2: Correlations between steroid hormone receptors among endometrial cancer patient tumor samples; Figure S3: Correlations between PGR, ESR1, ARID1A and EZH2 among breast cancer patient tumor samples, Figure S4: Uncropped western blots.

Author Contributions

Conceptualization, M.R.W., J.J.R. and R.L.C.; Investigation, M.R.W. and J.J.R.; Methodology, M.R.W., J.J.R., M.A., N.R.J. and R.L.C.; Resources, J.K., N.R.J. and A.T.F.; Formal Analysis, M.R.W. and J.J.R.; Data Curation, M.R.W. and J.J.R.; Writing—Original Draft, M.R.W., J.J.R. and R.L.C.; Writing—Review & Editing, M.R.W., J.J.R., M.A., A.T.F. and R.L.C.; Funding Acquisition, M.R.W. and R.L.C.; Supervision, R.L.C. All authors have read and agreed to the published version of the manuscript.

Funding

This project was financially supported by the National Cancer Institute (NCI) Transition to Independence Award K99 CA252152 to M.R.W. and the Eunice Kennedy Shriver National Institute of Child Health and Human Development (NICHD) R21 HD099383 to R.L.C.

Data Availability Statement

All new data generated in this study have been deposited to GEO at accession GSE195503. Previously generated and re-analyzed data were retrieved from GEO at accessions GSE121198 and GSE148474.

Acknowledgments

We thank the Van Andel Genomics Core for providing sequencing facilities and services.

Conflicts of Interest

The authors declare no conflict of interest.

References

  1. Siegel, R.L.; Miller, K.D.; Fuchs, H.E.; Jemal, A. Cancer Statistics, 2021. CA Cancer J. Clin. 2021, 71, 7–33. [Google Scholar] [CrossRef]
  2. Kaaks, R.; Lukanova, A.; Kurzer, M.S. Obesity, endogenous hormones, and endometrial cancer risk: A synthetic review. Cancer Epidemiol. Biomarkers Prev. 2002, 11, 1531–1543. [Google Scholar]
  3. Bianchini, F.; Kaaks, R.; Vainio, H. Overweight, obesity, and cancer risk. Lancet Oncol. 2002, 3, 565–574. [Google Scholar] [CrossRef]
  4. Mihm, M.; Gangooly, S.; Muttukrishna, S. The normal menstrual cycle in women. Anim. Reprod. Sci. 2011, 124, 229–236. [Google Scholar] [CrossRef]
  5. Morice, P.; Leary, A.; Creutzberg, C.; Abu-Rustum, N.; Darai, E. Endometrial cancer. Lancet 2016, 387, 1094–1108. [Google Scholar] [CrossRef]
  6. Urick, M.E.; Bell, D.W. Clinical actionability of molecular targets in endometrial cancer. Nat. Rev. Cancer 2019, 19, 510–521. [Google Scholar] [CrossRef]
  7. Marquardt, R.M.; Kim, T.H.; Shin, J.H.; Jeong, J.W. Progesterone and Estrogen Signaling in the Endometrium: What Goes Wrong in Endometriosis? Int. J. Mol. Sci. 2019, 20, 3822. [Google Scholar] [CrossRef] [Green Version]
  8. Moutsatsou, P.; Sekeris, C.E. Estrogen and progesterone receptors in the endometrium. Ann. N. Y. Acad. Sci. 1997, 816, 99–115. [Google Scholar] [CrossRef]
  9. Al-Sabbagh, M.; Lam, E.W.; Brosens, J.J. Mechanisms of endometrial progesterone resistance. Mol. Cell. Endocrinol. 2012, 358, 208–215. [Google Scholar] [CrossRef] [PubMed]
  10. Siiteri, P.K. Steroid hormones and endometrial cancer. Cancer Res. 1978, 38, 4360–4366. [Google Scholar] [PubMed]
  11. Kim, J.J.; Chapman-Davis, E. Role of progesterone in endometrial cancer. Semin. Reprod. Med. 2010, 28, 81–90. [Google Scholar] [CrossRef] [Green Version]
  12. Ehrlich, C.E.; Young, P.C.; Stehman, F.B.; Sutton, G.P.; Alford, W.M. Steroid receptors and clinical outcome in patients with adenocarcinoma of the endometrium. Am. J. Obstet. Gynecol. 1988, 158, 796–807. [Google Scholar] [CrossRef]
  13. Nunobiki, O.; Taniguchi, E.; Ishii, A.; Tang, W.; Utsunomiya, H.; Nakamura, Y.; Mori, I.; Kakudo, K. Significance of hormone receptor status and tumor vessels in normal, hyperplastic and neoplastic endometrium. Pathol. Int. 2003, 53, 846–852. [Google Scholar] [CrossRef]
  14. Uchikawa, J.; Shiozawa, T.; Shih, H.C.; Miyamoto, T.; Feng, Y.Z.; Kashima, H.; Oka, K.; Konishi, I. Expression of steroid receptor coactivators and corepressors in human endometrial hyperplasia and carcinoma with relevance to steroid receptors and Ki-67 expression. Cancer 2003, 98, 2207–2213. [Google Scholar] [CrossRef]
  15. Flores, V.A.; Vanhie, A.; Dang, T.; Taylor, H.S. Progesterone Receptor Status Predicts Response to Progestin Therapy in Endometriosis. J. Clin. Endocrinol. Metab. 2018, 103, 4561–4568. [Google Scholar] [CrossRef] [PubMed] [Green Version]
  16. Werner, H.M.; Berg, A.; Wik, E.; Birkeland, E.; Krakstad, C.; Kusonmano, K.; Petersen, K.; Kalland, K.H.; Oyan, A.M.; Akslen, L.A.; et al. ARID1A loss is prevalent in endometrial hyperplasia with atypia and low-grade endometrioid carcinomas. Mod. Pathol. 2013, 26, 428–434. [Google Scholar] [CrossRef] [Green Version]
  17. Yen, T.T.; Miyamoto, T.; Asaka, S.; Chui, M.H.; Wang, Y.; Lin, S.F.; Stone, R.L.; Fader, A.N.; Asaka, R.; Kashima, H.; et al. Loss of ARID1A expression in endometrial samplings is associated with the risk of endometrial carcinoma. Gynecol. Oncol. 2018, 150, 426–431. [Google Scholar] [CrossRef]
  18. Mao, T.L.; Ardighieri, L.; Ayhan, A.; Kuo, K.T.; Wu, C.H.; Wang, T.L.; Shih, I.M. Loss of ARID1A expression correlates with stages of tumor progression in uterine endometrioid carcinoma. Am. J. Surg. Pathol. 2013, 37, 1342–1348. [Google Scholar] [CrossRef] [PubMed] [Green Version]
  19. Cancer Genome Atlas Research Network; Kandoth, C.; Schultz, N.; Cherniack, A.D.; Akbani, R.; Liu, Y.; Shen, H.; Robertson, A.G.; Pashtan, I.; Shen, R.; et al. Integrated genomic characterization of endometrial carcinoma. Nature 2013, 497, 67–73. [Google Scholar] [CrossRef] [Green Version]
  20. Guan, B.; Mao, T.L.; Panuganti, P.K.; Kuhn, E.; Kurman, R.J.; Maeda, D.; Chen, E.; Jeng, Y.M.; Wang, T.L.; Shih, I.M. Mutation and loss of expression of ARID1A in uterine low-grade endometrioid carcinoma. Am. J. Surg. Pathol. 2011, 35, 625–632. [Google Scholar] [CrossRef] [PubMed] [Green Version]
  21. Wiegand, K.C.; Lee, A.F.; Al-Agha, O.M.; Chow, C.; Kalloger, S.E.; Scott, D.W.; Steidl, C.; Wiseman, S.M.; Gascoyne, R.D.; Gilks, B.; et al. Loss of BAF250a (ARID1A) is frequent in high-grade endometrial carcinomas. J. Pathol. 2011, 224, 328–333. [Google Scholar] [CrossRef] [PubMed]
  22. Becker, P.B.; Workman, J.L. Nucleosome remodeling and epigenetics. Cold Spring Harb. Perspect. Biol. 2013, 5, a017905. [Google Scholar] [CrossRef] [PubMed] [Green Version]
  23. Wilson, M.R.; Holladay, J.; Chandler, R.L. A mouse model of endometriosis mimicking the natural spread of invasive endometrium. Hum. Reprod. 2020, 35, 58–69. [Google Scholar] [CrossRef] [PubMed]
  24. Wilson, M.R.; Reske, J.J.; Holladay, J.; Wilber, G.E.; Rhodes, M.; Koeman, J.; Adams, M.; Johnson, B.; Su, R.W.; Joshi, N.R.; et al. ARID1A and PI3-kinase pathway mutations in the endometrium drive epithelial transdifferentiation and collective invasion. Nat. Commun. 2019, 10, 3554. [Google Scholar] [CrossRef]
  25. Wilson, M.R.; Reske, J.J.; Holladay, J.; Neupane, S.; Ngo, J.; Cuthrell, N.; Wegener, M.; Rhodes, M.; Adams, M.; Sheridan, R.; et al. ARID1A Mutations Promote P300-Dependent Endometrial Invasion through Super-Enhancer Hyperacetylation. Cell Rep. 2020, 33, 108366. [Google Scholar] [CrossRef] [PubMed]
  26. Reske, J.J.; Wilson, M.R.; Holladay, J.; Siwicki, R.A.; Skalski, H.; Harkins, S.; Adams, M.; Risinger, J.I.; Hostetter, G.; Lin, K.; et al. Co-existing TP53 and ARID1A mutations promote aggressive endometrial tumorigenesis. PLoS Genet. 2021, 17, e1009986. [Google Scholar] [CrossRef]
  27. Reske, J.J.; Wilson, M.R.; Holladay, J.; Wegener, M.; Adams, M.; Chandler, R.L. SWI/SNF inactivation in the endometrial epithelium leads to loss of epithelial integrity. Hum. Mol. Genet. 2020, 29, 3412–3430. [Google Scholar] [CrossRef]
  28. Voigt, P.; Tee, W.W.; Reinberg, D. A double take on bivalent promoters. Genes Dev. 2013, 27, 1318–1338. [Google Scholar] [CrossRef] [Green Version]
  29. Zeitvogel, A.; Baumann, R.; Starzinski-Powitz, A. Identification of an invasive, N-cadherin-expressing epithelial cell type in endometriosis using a new cell culture model. Am. J. Pathol. 2001, 159, 1839–1852. [Google Scholar] [CrossRef] [Green Version]
  30. Martin, M. Cutadapt removes adapter sequences from high-throughput sequencing reads. EMBnet. J. 2011, 17, 10–12. [Google Scholar] [CrossRef]
  31. Andrews, S. FastQC: A quality control tool for high throughput sequence data. Babraham Institute. 2010. Available online: http://www.bioinformatics.babraham.ac.uk/projects/fastqc (accessed on 11 March 2022).
  32. Harrow, J.; Frankish, A.; Gonzalez, J.M.; Tapanari, E.; Diekhans, M.; Kokocinski, F.; Aken, B.L.; Barrell, D.; Zadissa, A.; Searle, S.; et al. GENCODE: The reference human genome annotation for The ENCODE Project. Genome Res. 2012, 22, 1760–1774. [Google Scholar] [CrossRef] [PubMed] [Green Version]
  33. Dobin, A.; Davis, C.A.; Schlesinger, F.; Drenkow, J.; Zaleski, C.; Jha, S.; Batut, P.; Chaisson, M.; Gingeras, T.R. STAR: Ultrafast universal RNA-seq aligner. Bioinformatics 2013, 29, 15–21. [Google Scholar] [CrossRef] [PubMed]
  34. Love, M.I.; Huber, W.; Anders, S. Moderated estimation of fold change and dispersion for RNA-seq data with DESeq2. Genome Biol. 2014, 15, 550. [Google Scholar] [CrossRef] [Green Version]
  35. Love, M.I.; Anders, S.; Kim, V.; Huber, W. RNA-Seq workflow: Gene-level exploratory analysis and differential expression. F1000Research 2015, 4, 1070. [Google Scholar] [CrossRef]
  36. Ignatiadis, N.; Klaus, B.; Zaugg, J.B.; Huber, W. Data-driven hypothesis weighting increases detection power in genome-scale multiple testing. Nat. Methods 2016, 13, 577–580. [Google Scholar] [CrossRef] [Green Version]
  37. Roadmap Epigenomics Consortium; Kundaje, A.; Meuleman, W.; Ernst, J.; Bilenky, M.; Yen, A.; Heravi-Moussavi, A.; Kheradpour, P.; Zhang, Z.; Wang, J.; et al. Integrative analysis of 111 reference human epigenomes. Nature 2015, 518, 317–330. [Google Scholar] [CrossRef] [Green Version]
  38. Buenrostro, J.D.; Giresi, P.G.; Zaba, L.C.; Chang, H.Y.; Greenleaf, W.J. Transposition of native chromatin for fast and sensitive epigenomic profiling of open chromatin, DNA-binding proteins and nucleosome position. Nat. Methods 2013, 10, 1213–1218. [Google Scholar] [CrossRef] [PubMed]
  39. Whyte, W.A.; Orlando, D.A.; Hnisz, D.; Abraham, B.J.; Lin, C.Y.; Kagey, M.H.; Rahl, P.B.; Lee, T.I.; Young, R.A. Master transcription factors and mediator establish super-enhancers at key cell identity genes. Cell 2013, 153, 307–319. [Google Scholar] [CrossRef] [PubMed] [Green Version]
  40. Loven, J.; Hoke, H.A.; Lin, C.Y.; Lau, A.; Orlando, D.A.; Vakoc, C.R.; Bradner, J.E.; Lee, T.I.; Young, R.A. Selective inhibition of tumor oncogenes by disruption of super-enhancers. Cell 2013, 153, 320–334. [Google Scholar] [CrossRef] [Green Version]
  41. Fishilevich, S.; Nudel, R.; Rappaport, N.; Hadar, R.; Plaschkes, I.; Iny Stein, T.; Rosen, N.; Kohn, A.; Twik, M.; Safran, M.; et al. GeneHancer: Genome-wide integration of enhancers and target genes in GeneCards. Database 2017, 2017, bax028. [Google Scholar] [CrossRef] [PubMed] [Green Version]
  42. Heinz, S.; Benner, C.; Spann, N.; Bertolino, E.; Lin, Y.C.; Laslo, P.; Cheng, J.X.; Murre, C.; Singh, H.; Glass, C.K. Simple combinations of lineage-determining transcription factors prime cis-regulatory elements required for macrophage and B cell identities. Mol. Cell 2010, 38, 576–589. [Google Scholar] [CrossRef] [PubMed] [Green Version]
  43. Bioconductor Core Team; Bioconductor Package Maintainer. TxDb.Hsapiens.UCSC.hg38.knownGene: Annotation Package for TxDb Object(s), R Package Version 3.4.0; Bioconductor; 2016. Available online: https://bioconductor.org/packages/release/data/annotation/html/TxDb.Hsapiens.UCSC.hg38.knownGene.html (accessed on 11 March 2022).
  44. Zhang, Y.; Liu, T.; Meyer, C.A.; Eeckhoute, J.; Johnson, D.S.; Bernstein, B.E.; Nusbaum, C.; Myers, R.M.; Brown, M.; Li, W.; et al. Model-based analysis of ChIP-Seq (MACS). Genome Biol. 2008, 9, R137. [Google Scholar] [CrossRef] [PubMed] [Green Version]
  45. Robinson, J.T.; Thorvaldsdottir, H.; Winckler, W.; Guttman, M.; Lander, E.S.; Getz, G.; Mesirov, J.P. Integrative genomics viewer. Nat. Biotechnol. 2011, 29, 24–26. [Google Scholar] [CrossRef] [Green Version]
  46. Yu, G.; Wang, L.G.; Han, Y.; He, Q.Y. clusterProfiler: An R package for comparing biological themes among gene clusters. OMICS 2012, 16, 284–287. [Google Scholar] [CrossRef] [PubMed]
  47. Liberzon, A.; Birger, C.; Thorvaldsdottir, H.; Ghandi, M.; Mesirov, J.P.; Tamayo, P. The Molecular Signatures Database (MSigDB) hallmark gene set collection. Cell Syst. 2015, 1, 417–425. [Google Scholar] [CrossRef] [PubMed] [Green Version]
  48. Gu, Z.; Eils, R.; Schlesner, M. Complex heatmaps reveal patterns and correlations in multidimensional genomic data. Bioinformatics 2016, 32, 2847–2849. [Google Scholar] [CrossRef] [Green Version]
  49. Lawrence, M.; Huber, W.; Pages, H.; Aboyoun, P.; Carlson, M.; Gentleman, R.; Morgan, M.T.; Carey, V.J. Software for computing and annotating genomic ranges. PLoS Comput. Biol. 2013, 9, e1003118. [Google Scholar] [CrossRef] [PubMed]
  50. Larsson, J. eulerr: Area-Proportional Euler and Venn Diagrams with Ellipses. R package version 6.1.0. CRAN 2020. Available online: https://cran.r-project.org/package=eulerr (accessed on 11 March 2022).
  51. Durinck, S.; Spellman, P.T.; Birney, E.; Huber, W. Mapping identifiers for the integration of genomic datasets with the R/Bioconductor package biomaRt. Nat. Protoc. 2009, 4, 1184–1191. [Google Scholar] [CrossRef] [PubMed] [Green Version]
  52. Durinck, S.; Moreau, Y.; Kasprzyk, A.; Davis, S.; De Moor, B.; Brazma, A.; Huber, W. BioMart and Bioconductor: A powerful link between biological databases and microarray data analysis. Bioinformatics 2005, 21, 3439–3440. [Google Scholar] [CrossRef] [Green Version]
  53. Wickham, H. ggplot2: Elegant Graphics for Data Analysis; Springer: New York, NY, USA, 2016. [Google Scholar]
  54. R Core Team. R: A Language and Environment for Statistical Computing; R Foundation for Statistical Computing: Vienna, Austria, 2018. [Google Scholar]
  55. Barretina, J.; Caponigro, G.; Stransky, N.; Venkatesan, K.; Margolin, A.A.; Kim, S.; Wilson, C.J.; Lehar, J.; Kryukov, G.V.; Sonkin, D.; et al. The Cancer Cell Line Encyclopedia enables predictive modelling of anticancer drug sensitivity. Nature 2012, 483, 603–607. [Google Scholar] [CrossRef]
  56. Hoadley, K.A.; Yau, C.; Hinoue, T.; Wolf, D.M.; Lazar, A.J.; Drill, E.; Shen, R.; Taylor, A.M.; Cherniack, A.D.; Thorsson, V.; et al. Cell-of-Origin Patterns Dominate the Molecular Classification of 10,000 Tumors from 33 Types of Cancer. Cell 2018, 173, 291–304.e296. [Google Scholar] [CrossRef] [PubMed] [Green Version]
  57. Cerami, E.; Gao, J.; Dogrusoz, U.; Gross, B.E.; Sumer, S.O.; Aksoy, B.A.; Jacobsen, A.; Byrne, C.J.; Heuer, M.L.; Larsson, E.; et al. The cBio cancer genomics portal: An open platform for exploring multidimensional cancer genomics data. Cancer Discov. 2012, 2, 401–404. [Google Scholar] [CrossRef] [Green Version]
  58. Gao, J.; Aksoy, B.A.; Dogrusoz, U.; Dresdner, G.; Gross, B.; Sumer, S.O.; Sun, Y.; Jacobsen, A.; Sinha, R.; Larsson, E.; et al. Integrative analysis of complex cancer genomics and clinical profiles using the cBioPortal. Sci. Signal. 2013, 6, pl1. [Google Scholar] [CrossRef] [PubMed] [Green Version]
  59. Sundstrom, S.A.; Komm, B.S.; Xu, Q.; Boundy, V.; Lyttle, C.R. The stimulation of uterine complement component C3 gene expression by antiestrogens. Endocrinology 1990, 126, 1449–1456. [Google Scholar] [CrossRef] [PubMed]
  60. Hasty, L.A.; Lambris, J.D.; Lessey, B.A.; Pruksananonda, K.; Lyttle, C.R. Hormonal regulation of complement components and receptors throughout the menstrual cycle. Am. J. Obstet. Gynecol. 1994, 170, 168–175. [Google Scholar] [CrossRef]
  61. Ace, C.I.; Okulicz, W.C. Differential gene regulation by estrogen and progesterone in the primate endometrium. Mol. Cell. Endocrinol. 1995, 115, 95–103. [Google Scholar] [CrossRef]
  62. Kadoch, C.; Hargreaves, D.C.; Hodges, C.; Elias, L.; Ho, L.; Ranish, J.; Crabtree, G.R. Proteomic and bioinformatic analysis of mammalian SWI/SNF complexes identifies extensive roles in human malignancy. Nat. Genet. 2013, 45, 592–601. [Google Scholar] [CrossRef]
  63. Kadoch, C.; Crabtree, G.R. Mammalian SWI/SNF chromatin remodeling complexes and cancer: Mechanistic insights gained from human genomics. Sci. Adv. 2015, 1, e1500447. [Google Scholar] [CrossRef] [Green Version]
  64. Ramalingam, P.; Croce, S.; McCluggage, W.G. Loss of expression of SMARCA4 (BRG1), SMARCA2 (BRM) and SMARCB1 (INI1) in undifferentiated carcinoma of the endometrium is not uncommon and is not always associated with rhabdoid morphology. Histopathology 2017, 70, 359–366. [Google Scholar] [CrossRef]
  65. Kolin, D.L.; Quick, C.M.; Dong, F.; Fletcher, C.D.M.; Stewart, C.J.R.; Soma, A.; Hornick, J.L.; Nucci, M.R.; Howitt, B.E. SMARCA4-deficient Uterine Sarcoma and Undifferentiated Endometrial Carcinoma Are Distinct Clinicopathologic Entities. Am. J. Surg. Pathol. 2020, 44, 263–270. [Google Scholar] [CrossRef]
  66. Clapier, C.R.; Cairns, B.R. The biology of chromatin remodeling complexes. Annu. Rev. Biochem. 2009, 78, 273–304. [Google Scholar] [CrossRef] [PubMed]
  67. Wilson, B.G.; Wang, X.; Shen, X.; McKenna, E.S.; Lemieux, M.E.; Cho, Y.J.; Koellhoffer, E.C.; Pomeroy, S.L.; Orkin, S.H.; Roberts, C.W. Epigenetic antagonism between polycomb and SWI/SNF complexes during oncogenic transformation. Cancer Cell 2010, 18, 316–328. [Google Scholar] [CrossRef] [PubMed] [Green Version]
  68. Ho, L.; Miller, E.L.; Ronan, J.L.; Ho, W.Q.; Jothi, R.; Crabtree, G.R. esBAF facilitates pluripotency by conditioning the genome for LIF/STAT3 signalling and by regulating polycomb function. Nat. Cell Biol. 2011, 13, 903–913. [Google Scholar] [CrossRef] [Green Version]
  69. Stanton, B.Z.; Hodges, C.; Calarco, J.P.; Braun, S.M.; Ku, W.L.; Kadoch, C.; Zhao, K.; Crabtree, G.R. Smarca4 ATPase mutations disrupt direct eviction of PRC1 from chromatin. Nat. Genet. 2017, 49, 282–288. [Google Scholar] [CrossRef] [PubMed]
  70. Simon, J.A.; Lange, C.A. Roles of the EZH2 histone methyltransferase in cancer epigenetics. Mutat. Res. 2008, 647, 21–29. [Google Scholar] [CrossRef]
  71. Varambally, S.; Cao, Q.; Mani, R.S.; Shankar, S.; Wang, X.; Ateeq, B.; Laxman, B.; Cao, X.; Jing, X.; Ramnarayanan, K.; et al. Genomic loss of microRNA-101 leads to overexpression of histone methyltransferase EZH2 in cancer. Science 2008, 322, 1695–1699. [Google Scholar] [CrossRef] [Green Version]
  72. Varambally, S.; Dhanasekaran, S.M.; Zhou, M.; Barrette, T.R.; Kumar-Sinha, C.; Sanda, M.G.; Ghosh, D.; Pienta, K.J.; Sewalt, R.G.; Otte, A.P.; et al. The polycomb group protein EZH2 is involved in progression of prostate cancer. Nature 2002, 419, 624–629. [Google Scholar] [CrossRef]
  73. Kleer, C.G.; Cao, Q.; Varambally, S.; Shen, R.; Ota, I.; Tomlins, S.A.; Ghosh, D.; Sewalt, R.G.; Otte, A.P.; Hayes, D.F.; et al. EZH2 is a marker of aggressive breast cancer and promotes neoplastic transformation of breast epithelial cells. Proc. Natl. Acad. Sci. USA 2003, 100, 11606–11611. [Google Scholar] [CrossRef] [PubMed] [Green Version]
  74. Wagener, N.; Macher-Goeppinger, S.; Pritsch, M.; Husing, J.; Hoppe-Seyler, K.; Schirmacher, P.; Pfitzenmaier, J.; Haferkamp, A.; Hoppe-Seyler, F.; Hohenfellner, M. Enhancer of zeste homolog 2 (EZH2) expression is an independent prognostic factor in renal cell carcinoma. BMC Cancer 2010, 10, 524. [Google Scholar] [CrossRef] [Green Version]
  75. Takawa, M.; Masuda, K.; Kunizaki, M.; Daigo, Y.; Takagi, K.; Iwai, Y.; Cho, H.S.; Toyokawa, G.; Yamane, Y.; Maejima, K.; et al. Validation of the histone methyltransferase EZH2 as a therapeutic target for various types of human cancer and as a prognostic marker. Cancer Sci. 2011, 102, 1298–1305. [Google Scholar] [CrossRef] [PubMed]
  76. Li, H.; Cai, Q.; Godwin, A.K.; Zhang, R. Enhancer of zeste homolog 2 promotes the proliferation and invasion of epithelial ovarian cancer cells. Mol. Cancer Res. 2010, 8, 1610–1618. [Google Scholar] [CrossRef] [PubMed] [Green Version]
  77. Kadoch, C.; Williams, R.T.; Calarco, J.P.; Miller, E.L.; Weber, C.M.; Braun, S.M.; Pulice, J.L.; Chory, E.J.; Crabtree, G.R. Dynamics of BAF-Polycomb complex opposition on heterochromatin in normal and oncogenic states. Nat. Genet. 2017, 49, 213–222. [Google Scholar] [CrossRef] [PubMed]
  78. Kennison, J.A.; Tamkun, J.W. Dosage-dependent modifiers of polycomb and antennapedia mutations in Drosophila. Proc. Natl. Acad. Sci. USA 1988, 85, 8136–8140. [Google Scholar] [CrossRef] [PubMed] [Green Version]
  79. Hodges, C.; Kirkland, J.G.; Crabtree, G.R. The Many Roles of BAF (mSWI/SNF) and PBAF Complexes in Cancer. Cold Spring Harb. Perspect. Med. 2016, 6, a026930. [Google Scholar] [CrossRef] [PubMed] [Green Version]
  80. Bitler, B.G.; Aird, K.M.; Garipov, A.; Li, H.; Amatangelo, M.; Kossenkov, A.V.; Schultz, D.C.; Liu, Q.; Shih, I.M.; Conejo-Garcia, J.R.; et al. Synthetic lethality by targeting EZH2 methyltransferase activity in ARID1A-mutated cancers. Nat. Med. 2015, 21, 231–238. [Google Scholar] [CrossRef] [PubMed] [Green Version]
  81. Cao, R.; Zhang, Y. The functions of E(Z)/EZH2-mediated methylation of lysine 27 in histone H3. Curr. Opin. Genet. Dev. 2004, 14, 155–164. [Google Scholar] [CrossRef] [PubMed]
  82. Ruthenburg, A.J.; Allis, C.D.; Wysocka, J. Methylation of lysine 4 on histone H3: Intricacy of writing and reading a single epigenetic mark. Mol. Cell 2007, 25, 15–30. [Google Scholar] [CrossRef] [PubMed]
  83. Barski, A.; Cuddapah, S.; Cui, K.; Roh, T.Y.; Schones, D.E.; Wang, Z.; Wei, G.; Chepelev, I.; Zhao, K. High-resolution profiling of histone methylations in the human genome. Cell 2007, 129, 823–837. [Google Scholar] [CrossRef] [Green Version]
  84. Vastenhouw, N.L.; Schier, A.F. Bivalent histone modifications in early embryogenesis. Curr. Opin. Cell Biol. 2012, 24, 374–386. [Google Scholar] [CrossRef] [Green Version]
  85. Kumar, D.; Cinghu, S.; Oldfield, A.J.; Yang, P.; Jothi, R. Decoding the function of bivalent chromatin in development and cancer. Genome Res. 2021, 31, 2170–2184. [Google Scholar] [CrossRef] [PubMed]
  86. Knutson, S.K.; Warholic, N.M.; Wigle, T.J.; Klaus, C.R.; Allain, C.J.; Raimondi, A.; Porter Scott, M.; Chesworth, R.; Moyer, M.P.; Copeland, R.A.; et al. Durable tumor regression in genetically altered malignant rhabdoid tumors by inhibition of methyltransferase EZH2. Proc. Natl. Acad. Sci. USA 2013, 110, 7922–7927. [Google Scholar] [CrossRef] [PubMed] [Green Version]
  87. Knutson, S.K.; Kawano, S.; Minoshima, Y.; Warholic, N.M.; Huang, K.C.; Xiao, Y.; Kadowaki, T.; Uesugi, M.; Kuznetsov, G.; Kumar, N.; et al. Selective inhibition of EZH2 by EPZ-6438 leads to potent antitumor activity in EZH2-mutant non-Hodgkin lymphoma. Mol. Cancer Ther. 2014, 13, 842–854. [Google Scholar] [CrossRef] [PubMed] [Green Version]
  88. Pierre, R.S.; Kadoch, C. Mammalian SWI/SNF complexes in cancer: Emerging therapeutic opportunities. Curr. Opin. Genet. Dev. 2017, 42, 56–67. [Google Scholar] [CrossRef] [PubMed] [Green Version]
  89. Nagarajan, S.; Rao, S.V.; Sutton, J.; Cheeseman, D.; Dunn, S.; Papachristou, E.K.; Prada, J.G.; Couturier, D.L.; Kumar, S.; Kishore, K.; et al. ARID1A influences HDAC1/BRD4 activity, intrinsic proliferative capacity and breast cancer treatment response. Nat. Genet. 2020, 52, 187–197. [Google Scholar] [CrossRef]
  90. Kurita, T.; Young, P.; Brody, J.R.; Lydon, J.P.; O’Malley, B.W.; Cunha, G.R. Stromal progesterone receptors mediate the inhibitory effects of progesterone on estrogen-induced uterine epithelial cell deoxyribonucleic acid synthesis. Endocrinology 1998, 139, 4708–4713. [Google Scholar] [CrossRef]
  91. Li, Q.; Kannan, A.; DeMayo, F.J.; Lydon, J.P.; Cooke, P.S.; Yamagishi, H.; Srivastava, D.; Bagchi, M.K.; Bagchi, I.C. The antiproliferative action of progesterone in uterine epithelium is mediated by Hand2. Science 2011, 331, 912–916. [Google Scholar] [CrossRef] [Green Version]
  92. Kurita, T.; Wang, Y.Z.; Donjacour, A.A.; Zhao, C.; Lydon, J.P.; O’Malley, B.W.; Isaacs, J.T.; Dahiya, R.; Cunha, G.R. Paracrine regulation of apoptosis by steroid hormones in the male and female reproductive system. Cell Death Differ. 2001, 8, 192–200. [Google Scholar] [CrossRef] [Green Version]
  93. Pierro, E.; Minici, F.; Alesiani, O.; Miceli, F.; Proto, C.; Screpanti, I.; Mancuso, S.; Lanzone, A. Stromal-epithelial interactions modulate estrogen responsiveness in normal human endometrium. Biol. Reprod. 2001, 64, 831–838. [Google Scholar] [CrossRef] [Green Version]
  94. Blauer, M.; Heinonen, P.K.; Martikainen, P.M.; Tomas, E.; Ylikomi, T. A novel organotypic culture model for normal human endometrium: Regulation of epithelial cell proliferation by estradiol and medroxyprogesterone acetate. Hum. Reprod. 2005, 20, 864–871. [Google Scholar] [CrossRef] [Green Version]
  95. Kurita, T.; Lee, K.J.; Cooke, P.S.; Lydon, J.P.; Cunha, G.R. Paracrine regulation of epithelial progesterone receptor and lactoferrin by progesterone in the mouse uterus. Biol. Reprod. 2000, 62, 831–838. [Google Scholar] [CrossRef] [Green Version]
  96. Franco, H.L.; Rubel, C.A.; Large, M.J.; Wetendorf, M.; Fernandez-Valdivia, R.; Jeong, J.W.; Spencer, T.E.; Behringer, R.R.; Lydon, J.P.; Demayo, F.J. Epithelial progesterone receptor exhibits pleiotropic roles in uterine development and function. FASEB J. 2012, 26, 1218–1227. [Google Scholar] [CrossRef] [PubMed] [Green Version]
  97. Wu, Y.; Strawn, E.; Basir, Z.; Halverson, G.; Guo, S.W. Promoter hypermethylation of progesterone receptor isoform B (PR-B) in endometriosis. Epigenetics 2006, 1, 106–111. [Google Scholar] [CrossRef] [PubMed] [Green Version]
  98. Rocha-Junior, C.V.; Da Broi, M.G.; Miranda-Furtado, C.L.; Navarro, P.A.; Ferriani, R.A.; Meola, J. Progesterone Receptor B (PGR-B) Is Partially Methylated in Eutopic Endometrium From Infertile Women With Endometriosis. Reprod. Sci. 2019, 26, 1568–1574. [Google Scholar] [CrossRef] [PubMed]
  99. Wu, Y.; Strawn, E.; Basir, Z.; Halverson, G.; Guo, S.W. Aberrant expression of deoxyribonucleic acid methyltransferases DNMT1, DNMT3A, and DNMT3B in women with endometriosis. Fertil. Steril. 2007, 87, 24–32. [Google Scholar] [CrossRef] [PubMed]
  100. Stratmann, A.; Haendler, B. The histone demethylase JARID1A regulates progesterone receptor expression. FEBS J. 2011, 278, 1458–1469. [Google Scholar] [CrossRef] [PubMed]
  101. Chai, S.Y.; Smith, R.; Fitter, J.T.; Mitchell, C.; Pan, X.; Ilicic, M.; Maiti, K.; Zakar, T.; Madsen, G. Increased progesterone receptor A expression in labouring human myometrium is associated with decreased promoter occupancy by the histone demethylase JARID1A. Mol. Hum. Reprod. 2014, 20, 442–453. [Google Scholar] [CrossRef] [PubMed] [Green Version]
  102. Pal, B.; Bouras, T.; Shi, W.; Vaillant, F.; Sheridan, J.M.; Fu, N.; Breslin, K.; Jiang, K.; Ritchie, M.E.; Young, M.; et al. Global changes in the mammary epigenome are induced by hormonal cues and coordinated by Ezh2. Cell Rep. 2013, 3, 411–426. [Google Scholar] [CrossRef] [PubMed] [Green Version]
  103. Shi, B.; Liang, J.; Yang, X.; Wang, Y.; Zhao, Y.; Wu, H.; Sun, L.; Zhang, Y.; Chen, Y.; Li, R.; et al. Integration of estrogen and Wnt signaling circuits by the polycomb group protein EZH2 in breast cancer cells. Mol. Cell. Biol. 2007, 27, 5105–5119. [Google Scholar] [CrossRef] [Green Version]
  104. Monteiro, J.B.; Colon-Diaz, M.; Garcia, M.; Gutierrez, S.; Colon, M.; Seto, E.; Laboy, J.; Flores, I. Endometriosis is characterized by a distinct pattern of histone 3 and histone 4 lysine modifications. Reprod. Sci. 2014, 21, 305–318. [Google Scholar] [CrossRef] [Green Version]
  105. Colon-Caraballo, M.; Monteiro, J.B.; Flores, I. H3K27me3 is an Epigenetic Mark of Relevance in Endometriosis. Reprod. Sci. 2015, 22, 1134–1142. [Google Scholar] [CrossRef] [Green Version]
  106. Krill, L.; Deng, W.; Eskander, R.; Mutch, D.; Zweizig, S.; Hoang, B.; Ioffe, O.; Randall, L.; Lankes, H.; Miller, D.S.; et al. Overexpression of enhance of Zeste homolog 2 (EZH2) in endometrial carcinoma: An NRG Oncology/Gynecologic Oncology Group Study. Gynecol. Oncol. 2020, 156, 423–429. [Google Scholar] [CrossRef] [PubMed]
  107. Zhou, J.; Roh, J.W.; Bandyopadhyay, S.; Chen, Z.; Munkarah, A.R.; Hussein, Y.; Alosh, B.; Jazaerly, T.; Hayek, K.; Semaan, A.; et al. Overexpression of enhancer of zeste homolog 2 (EZH2) and focal adhesion kinase (FAK) in high grade endometrial carcinoma. Gynecol. Oncol. 2013, 128, 344–348. [Google Scholar] [CrossRef] [PubMed]
  108. Jia, N.; Li, Q.; Tao, X.; Wang, J.; Hua, K.; Feng, W. Enhancer of zeste homolog 2 is involved in the proliferation of endometrial carcinoma. Oncol. Lett. 2014, 8, 2049–2054. [Google Scholar] [CrossRef] [PubMed] [Green Version]
  109. Oki, S.; Sone, K.; Oda, K.; Hamamoto, R.; Ikemura, M.; Maeda, D.; Takeuchi, M.; Tanikawa, M.; Mori-Uchino, M.; Nagasaka, K.; et al. Oncogenic histone methyltransferase EZH2: A novel prognostic marker with therapeutic potential in endometrial cancer. Oncotarget 2017, 8, 40402–40411. [Google Scholar] [CrossRef] [PubMed] [Green Version]
  110. Eskander, R.N.; Ji, T.; Huynh, B.; Wardeh, R.; Randall, L.M.; Hoang, B. Inhibition of enhancer of zeste homolog 2 (EZH2) expression is associated with decreased tumor cell proliferation, migration, and invasion in endometrial cancer cell lines. Int. J. Gynecol. Cancer 2013, 23, 997–1005. [Google Scholar] [CrossRef] [Green Version]
  111. Roh, J.W.; Choi, J.E.; Han, H.D.; Hu, W.; Matsuo, K.; Nishimura, M.; Lee, J.S.; Kwon, S.Y.; Cho, C.H.; Kim, J.; et al. Clinical and biological significance of EZH2 expression in endometrial cancer. Cancer Biol. Ther. 2020, 21, 147–156. [Google Scholar] [CrossRef]
  112. Wang, J.; Ai, Z.; Chen, J.; Teng, Y.; Zhu, J. Enhancer of zeste homolog 2 blockade by RNA interference is implicated with inhibited proliferation, invasion and promoted apoptosis in endometrial carcinoma. Oncol. Lett. 2018, 15, 9429–9435. [Google Scholar] [CrossRef] [Green Version]
  113. Nanjappa, M.K.; Mesa, A.M.; Medrano, T.I.; Jefferson, W.N.; DeMayo, F.J.; Williams, C.J.; Lydon, J.P.; Levin, E.R.; Cooke, P.S. The histone methyltransferase EZH2 is required for normal uterine development and function in micedagger. Biol. Reprod. 2019, 101, 306–317. [Google Scholar] [CrossRef]
  114. Soyal, S.M.; Mukherjee, A.; Lee, K.Y.; Li, J.; Li, H.; DeMayo, F.J.; Lydon, J.P. Cre-mediated recombination in cell lineages that express the progesterone receptor. Genesis 2005, 41, 58–66. [Google Scholar] [CrossRef]
  115. Mesa, A.M.; Mao, J.; Nanjappa, M.K.; Medrano, T.I.; Tevosian, S.; Yu, F.; Kinkade, J.; Lyu, Z.; Liu, Y.; Joshi, T.; et al. Mice lacking uterine enhancer of zeste homolog 2 have transcriptomic changes associated with uterine epithelial proliferation. Physiol. Genom. 2020, 52, 81–95. [Google Scholar] [CrossRef]
  116. Mesa, A.M.; Mao, J.; Medrano, T.I.; Bivens, N.J.; Jurkevich, A.; Tuteja, G.; Cooke, P.S.; Rosenfeld, C.S. Spatial transcriptomics analysis of uterine gene expression in enhancer of zeste homolog 2 conditional knockout micedagger. Biol. Reprod. 2021, 105, 1126–1139. [Google Scholar] [CrossRef] [PubMed]
  117. Italiano, A.; Soria, J.C.; Toulmonde, M.; Michot, J.M.; Lucchesi, C.; Varga, A.; Coindre, J.M.; Blakemore, S.J.; Clawson, A.; Suttle, B.; et al. Tazemetostat, an EZH2 inhibitor, in relapsed or refractory B-cell non-Hodgkin lymphoma and advanced solid tumours: A first-in-human, open-label, phase 1 study. Lancet Oncol. 2018, 19, 649–659. [Google Scholar] [CrossRef]
  118. Jones, S.; Wang, T.L.; Shih, I.M.; Mao, T.L.; Nakayama, K.; Roden, R.; Glas, R.; Slamon, D.; Diaz, L.A., Jr.; Vogelstein, B.; et al. Frequent mutations of chromatin remodeling gene ARID1A in ovarian clear cell carcinoma. Science 2010, 330, 228–231. [Google Scholar] [CrossRef] [PubMed] [Green Version]
  119. Wiegand, K.C.; Shah, S.P.; Al-Agha, O.M.; Zhao, Y.; Tse, K.; Zeng, T.; Senz, J.; McConechy, M.K.; Anglesio, M.S.; Kalloger, S.E.; et al. ARID1A mutations in endometriosis-associated ovarian carcinomas. N. Engl. J. Med. 2010, 363, 1532–1543. [Google Scholar] [CrossRef] [PubMed] [Green Version]
  120. Leitner, K.; Tsibulak, I.; Wieser, V.; Knoll, K.; Reimer, D.; Marth, C.; Fiegl, H.; Zeimet, A.G. Clinical impact of EZH2 and its antagonist SMARCA4 in ovarian cancer. Sci. Rep. 2020, 10, 20412. [Google Scholar] [CrossRef]
  121. Wu, S.; Fatkhutdinov, N.; Fukumoto, T.; Bitler, B.G.; Park, P.H.; Kossenkov, A.V.; Trizzino, M.; Tang, H.Y.; Zhang, L.; Gardini, A.; et al. SWI/SNF catalytic subunits’ switch drives resistance to EZH2 inhibitors in ARID1A-mutated cells. Nat. Commun. 2018, 9, 4116. [Google Scholar] [CrossRef] [PubMed] [Green Version]
  122. Karnezis, A.N.; Cho, K.R.; Gilks, C.B.; Pearce, C.L.; Huntsman, D.G. The disparate origins of ovarian cancers: Pathogenesis and prevention strategies. Nat. Rev. Cancer 2017, 17, 65–74. [Google Scholar] [CrossRef]
  123. Heidemann, L.N.; Hartwell, D.; Heidemann, C.H.; Jochumsen, K.M. The relation between endometriosis and ovarian cancer—A review. Acta Obstet. Gynecol. Scand. 2014, 93, 20–31. [Google Scholar] [CrossRef]
  124. Brunty, S.; Clower, L.; Mitchell, B.; Fleshman, T.; Zgheib, N.B.; Santanam, N. Peritoneal Modulators of Endometriosis-Associated Ovarian Cancer. Front. Oncol. 2021, 11, 793297. [Google Scholar] [CrossRef]
  125. Fan, H.; Atiya, H.I.; Wang, Y.; Pisanic, T.R.; Wang, T.H.; Shih, I.M.; Foy, K.K.; Frisbie, L.; Buckanovich, R.J.; Chomiak, A.A.; et al. Epigenomic Reprogramming toward Mesenchymal-Epithelial Transition in Ovarian-Cancer-Associated Mesenchymal Stem Cells Drives Metastasis. Cell Rep. 2020, 33, 108473. [Google Scholar] [CrossRef]
  126. Han, Y.; Wei, Y.; Yao, J.; Chu, Y.Y.; Li, C.W.; Hsu, J.L.; Nie, L.; Hung, M.C. Inhibition of CDK2 reduces EZH2 phosphorylation and reactivates ERalpha expression in high-grade serous ovarian carcinoma. Am. J. Cancer Res. 2020, 10, 1194–1206. [Google Scholar] [PubMed]
  127. Wang, Y.; Chen, S.Y.; Colborne, S.; Lambert, G.; Shin, C.Y.; Santos, N.D.; Orlando, K.A.; Lang, J.D.; Hendricks, W.P.D.; Bally, M.B.; et al. Histone Deacetylase Inhibitors Synergize with Catalytic Inhibitors of EZH2 to Exhibit Antitumor Activity in Small Cell Carcinoma of the Ovary, Hypercalcemic Type. Mol. Cancer Ther. 2018, 17, 2767–2779. [Google Scholar] [CrossRef] [PubMed] [Green Version]
Figure 1. Differential gene expression response to estrogen signaling following the loss of ARID1A expression. (A) Confirmation of ESR1 expression in 12Z-ERS1 cells by western blot. β-Actin was used as a loading control. (B) Principal component analysis on top 500 variable genes from RNA-seq on 12Z-ESR1 cells following treatment with 10 nM estrogen (E2, yellow), siRNA knockdown of ARID1A (siARID1A, green) or E2 + siARID1A (pink) compared to control (silver). (C) Unsupervised clustering of samples based on the expression of 2032 genes (rows) selected by variance across the experimental design (rlog variance > 0.05). Heatmap displays relative expression as Z-scored rlog counts. Red values indicate high relative gene expression, and blue values indicate low expression. (D) Examples of gene expression alterations following treatment with E2 (yellow), siARID1A (green) or E2 + siARID1A (pink) compared to control (silver). Y-axis represents linear relative gene expression with respect to the control condition. Means ± SDs, n = 3. The statistic is DESeq2 FDR. * FDR < 0.05, *** FDR < 0.001, n.s. is non-significant.
Cells 11 01000 g001
Figure 2. Perturbations in estrogen response following ARID1A loss. (A) Broad Gene Set Enrichment Analysis (GSEA) across RNA-seq conditions. Samples were tested for enrichment of the MsigDB hallmark pathways in the described comparisons, and Normalized Enrichment Scores (NES) are plotted to highlight differences between E2 vs. Control (x-axis) and siARID1A + E2 vs. siARID1A (y-axis, top) or siARID1A + E2 vs. E2 (y-axis, bottom). A full list of individual pathway values are provided in Table 1. E2 Early Response (red) and E2 Late Response (cyan) pathways are indicated. (B) 43 genes within the MsigDB Hallmark early or late estrogen response pathways that are significantly induced by E2 treatment but to a significantly less extent in the context of ARID1A knockdown. Left, clustered heatmap of expression log2FC values in siARID1A, E2, or siARID1A + E2 conditions compared to control cells. siARID1A Δ represents the change in expression between siARID1A + E2 vs. siARID1A conditions. Blue cells indicate downregulation, and red cells indicate upregulation. Right, black cells indicate membership to Hallmark estrogen response early and late pathway gene sets.
Cells 11 01000 g002
Figure 3. Exploring ARID1A-mediated estrogen response. (A) Overlap of 1699 empirical estrogen response genes and siARID1A DGE in 12Z-ESR1 cells. Those further affected by ARID1A loss (red) or not affected by ARID1A loss (white). (B) Directional classification of perturbed genes mutually regulated by E2 and ARID1A. Normal ARID1A regulation is inferred as the opposite effect of siARID1A treatment. Genes upregulated in both conditions (red), downregulated in both conditions (blue), upregulated by E2 and downregulated by siARID1A (yellow) or downregulated by E2 and upregulated by ARID1A (green). (C) Gene set enrichment analysis for MsigDB Hallmark pathways (top) and GO Biological Processes (bottom) among E2-ARID1A regulated gene classes.
Cells 11 01000 g003
Figure 4. ARID1A directly regulates estrogen-induced changes to cell identity. (A) Overlap between differentially expressed genes from E2 vs. Control (n = 1699, yellow) and siARID1A vs. Control (n = 4128, green) in 12Z-ESR1 cells and genes with ARID1A promoter binding by ChIP-seq in 12Z cells (n = 3843, pink) as previously described [24]. (B) Violin plot of ChIP signal for ARID1A binding at 436 intersect genes (as in A) compared to all genes. The unpaired, 2-tailed Wilcoxon was used for analysis. (C) Expression log2 fold-change values of 436 intersect genes following treatment with E2, siARID1A, or both E2 and siARID1A. The paired, 2-tailed Wilcoxon test was used for analysis. Box-and-whiskers plotted in the style of Tukey without outliers. (D) Clustering of 436 genes based on relative gene expression in each condition. Clusters have been labeled as antagonistic (red for upregulted or blue for downregulated) or cooperative (purple) in their regulation by E2 and ARID1A. (E) ARID1A binding among intersect genes segregated into 4 groups based on their direction of gene expression change following E2 or siARID1A treatment. (F) Pathway enrichment analysis of 436 intersect genes for Gene Ontology (GO) Biological Process. (G) Pathway enrichment analysis of 436 intersect genes for MSigDB Hallmark pathways. (H) Left, fold-change values of 36 Hallmark EMT genes found among the 436 intersect genes following treatment with E2, siARID1A, or both E2 and siARID1A. The statistic represented is from the paired, 2-tailed Wilcoxon test. Box-and-whiskers plotted in the style of Tukey without outliers. Right, relative expression of individual 36 EMT intersect genes as a clustered heatmap. (I) Enrichment of DE genes affected by E2 treatment, ARID1A loss, or both for genes with active promoters directly inside of super-enhancer (SE, pink) (n = 163) (left), promoters within 50 kb of a super-enhancer (n = 493) (center), or genes linked to super-enhancer by the GeneHancer database (n = 1576) (right) compared to enrichment for all active genes (black). Hypergeometric enrichment was used for analysis.
Cells 11 01000 g004
Figure 5. SWI/SNF mediates activation of PGR expression following E2 stimulation. (A) Rank visualization of top estrogen-regulated genes in 12Z-ESR1 cells. Red indicates upregulated genes, blue indicates downregulated genes. (B) Western blot analysis in 12Z-ESR1 cells following treatment with E2, siARID1A, or both E2 and siARID1A for ARID1A, PGR, and ESR1. PGR isoforms are indicated by arrowheads. β-Actin was used as a loading control. Blot is representative of 4 independent experiments. (C) Densitometry analysis of protein expression of ARID1A, PGR, and ESR1 following western blot as in panel B for control (silver), E2 (yellow), siARID1A (green) and siARID1A + E2 (pink). Densitometry values were normalized to β-Actin. Means ± SDs, n = 3–4. The paired t-test was used for analysis. (D) Western blot analysis in 12Z-ESR1 cells following treatment with E2, siBRG1, siARID1B, siBRG1+E2, or siARID1B+E2 for ARID1B, BRG1, PGR, and ESR1. PGR isoforms are indicated by arrowheads. β-Actin was used as a loading control. Blot is representative of 4 independent experiments. (E) Densitometry analysis of protein expression of ARID1B, BRG1, PGR, and ESR1 following western blot as in panel D for control (silver), E2 (yellow), siARID1B (charcoal), siARID1B + E2 (red), siBRG1 (brown) and siBRG1 + E2 (purple). Densitometry values were normalized to β-Actin. Means ± SDs, n = 4–5. The statistic is paired t-test. * p < 0.05; n.s. is non-significant.
Cells 11 01000 g005
Figure 6. ARID1A regulation of bivalent gene promoters. (A) Proportional Euler diagram displaying overlap between genes with promoter H3K4me3 (n = 12,496, red) or H3K27me3 (n = 2077, green) among all expressed genes (n = 18,277, white). Hypergeometric enrichment was used for analysis. (B) Violin plot of 12Z basal expression of all genes with H3K4me3 at the promoter (red), genes with both H3K4me3 and H3K27me3 at the promoter (bivalent, yellow), and genes with only H3K27me3 at the promoter (green) relative to all genes (white). The unpaired, 2-tailed Wilcoxon test was used for analysis. 12Z gene expression from GSE121198 [24]. (C) Percent of genes with differential gene expression following siARID1A treatment of 12Z cells among genes with bivalent promoters (yellow), H3K4me3 only (red), H3K27me3 only (green), or neither (white) relative to all genes (black). Hypergeometric enrichment was used for analysis. (D) Percent of genes with ARID1A binding at the promoter among genes with bivalent promoters (yellow), H3K4me3 only (red), H3K27me3 only (green), or neither (white). The 2-tailed Fisher’s exact test was used for analysis. (E) Violin plot of basal expression of all genes with bivalent promoters, H3K4me4 only, H3K27me3 only, or neither, further segregated based on whether the gene exhibited differential gene expression following ARID1A loss (green) or not (white) in 12Z cells. The unpaired, 2-tailed Wilcoxon test was used for analysis. (F) Proportional Euler diagram displaying overlap between bivalent genes with differential gene expression in 12Z-ESR1 cells following E2 treatment (n = 53, yellow) and 12Z cells following ARID1A loss (n = 36, green) Hypergeometric enrichment was used for analysis (G) Differential expression heatmap of 16 genes from an overlapping group of panel F. (H) Genomic snapshot of ChIP signals for H3K4me3 (red) and H3K27me3 (green) at the PGR locus of 12Z cells. For signal tracks, the y-axis represents the assay signal-to-noise presented as the log-likelihood ratio (logLR) as reported by MACS2, and the small bars below the tracks represent replicate overlapping peaks. *** p < 0.001.
Cells 11 01000 g006
Figure 7. SWI/SNF antagonizes PCR2 to promote PGR expression following estrogen stimulation. (A) PGR gene expression (quantified by RPKM (Reads Per Kilobase of transcript, per Million mapped reads) at 95% confidence interval (CI)) in human tissue samples with (purple) vs. without (grey) promoter H3K27me3, taken from the NIH Epigenomics Roadmap. (B) Cell growth assay of 12Z cells treated with EPZ-6438 at concentrations from 100 nM to 100 μM. M is moles.(C) Western blot analysis in 12Z-ESR1 cells following treatment with E2, siARID1A or both, with or without 10 µM EPZ-6438 treatment, for ARID1A, PGR and ESR1. PGR isoforms are indicated by arrowheads. β-Actin was used as a loading control. Blot is representative of 2 independent experiments. (D) Densitometry analysis of protein expression of PGR following western blot as in panel C for siARID1A + E2 (pink) or siARID1A + E2 + EPZ-6428 (orange). Densitometry values were normalized to β-Actin are relative to the E2 only condition. Means ± SDs, n = 2. The statistic is paired t-test. (E) Quantitative PCR (qPCR) analysis of PGR gene expression 12Z-ESR1 cells following treatment with 10 nM E2 (yellow), 10 nM E2 + 10 µM EPZ-6438 (blue), siARID1A (green), siARID1A + E2 (pink), and siARID1A + 10 nM E2 + 10 µM EPZ-6438 (orange) relative to control (grey). Data represents 3 biological replicates, means ± SD. The unpaired t-test was used for analysis. * p < 0.05; *** p < 0.001.
Cells 11 01000 g007
Figure 8. Correlations between PGR, ESR1, ARID1A, and EZH2 among endometrial cancer patient tumor samples. (A) Endometrial cancer tumor sample mRNA expression from 507 samples for ARID1A and PGR (upper left), ARID1A and ESR1 (upper right), EZH2 and PGR (lower left), and EZH2 and ESR1 (lower right). The red dashed line represents a linear regression. The statistical test used is the Pearson’s test. (B) Endometrial cancer tumor sample protein expression from 371 samples for ARID1A and PGR (left) and ARID1A and ESR1 (right). The red dashed line represents a linear regression. The statistical test used is the Pearson’s test. n.s. is non-significant.
Cells 11 01000 g008
Figure 9. Model diagram representation of PGR (progesterone receptor) regulation by SWI/SNF (SWItch/Sucrose Non-Fermentable), PRC2 (polycomb repressive complex 2) and estrogen at sites with H3K27me3 (histone H3 lysine 27 trimethylation) and H3K4me3 (histone H3 lysine 4 trimethylation).
Cells 11 01000 g009
Table 1. Gene Set Enrichment Analysis for MsigDB Hallmark Pathways. Positive values indicate pathway upregulation in the respective treatment condition, and negative values indicate pathway downregulation. * p < 0.05.
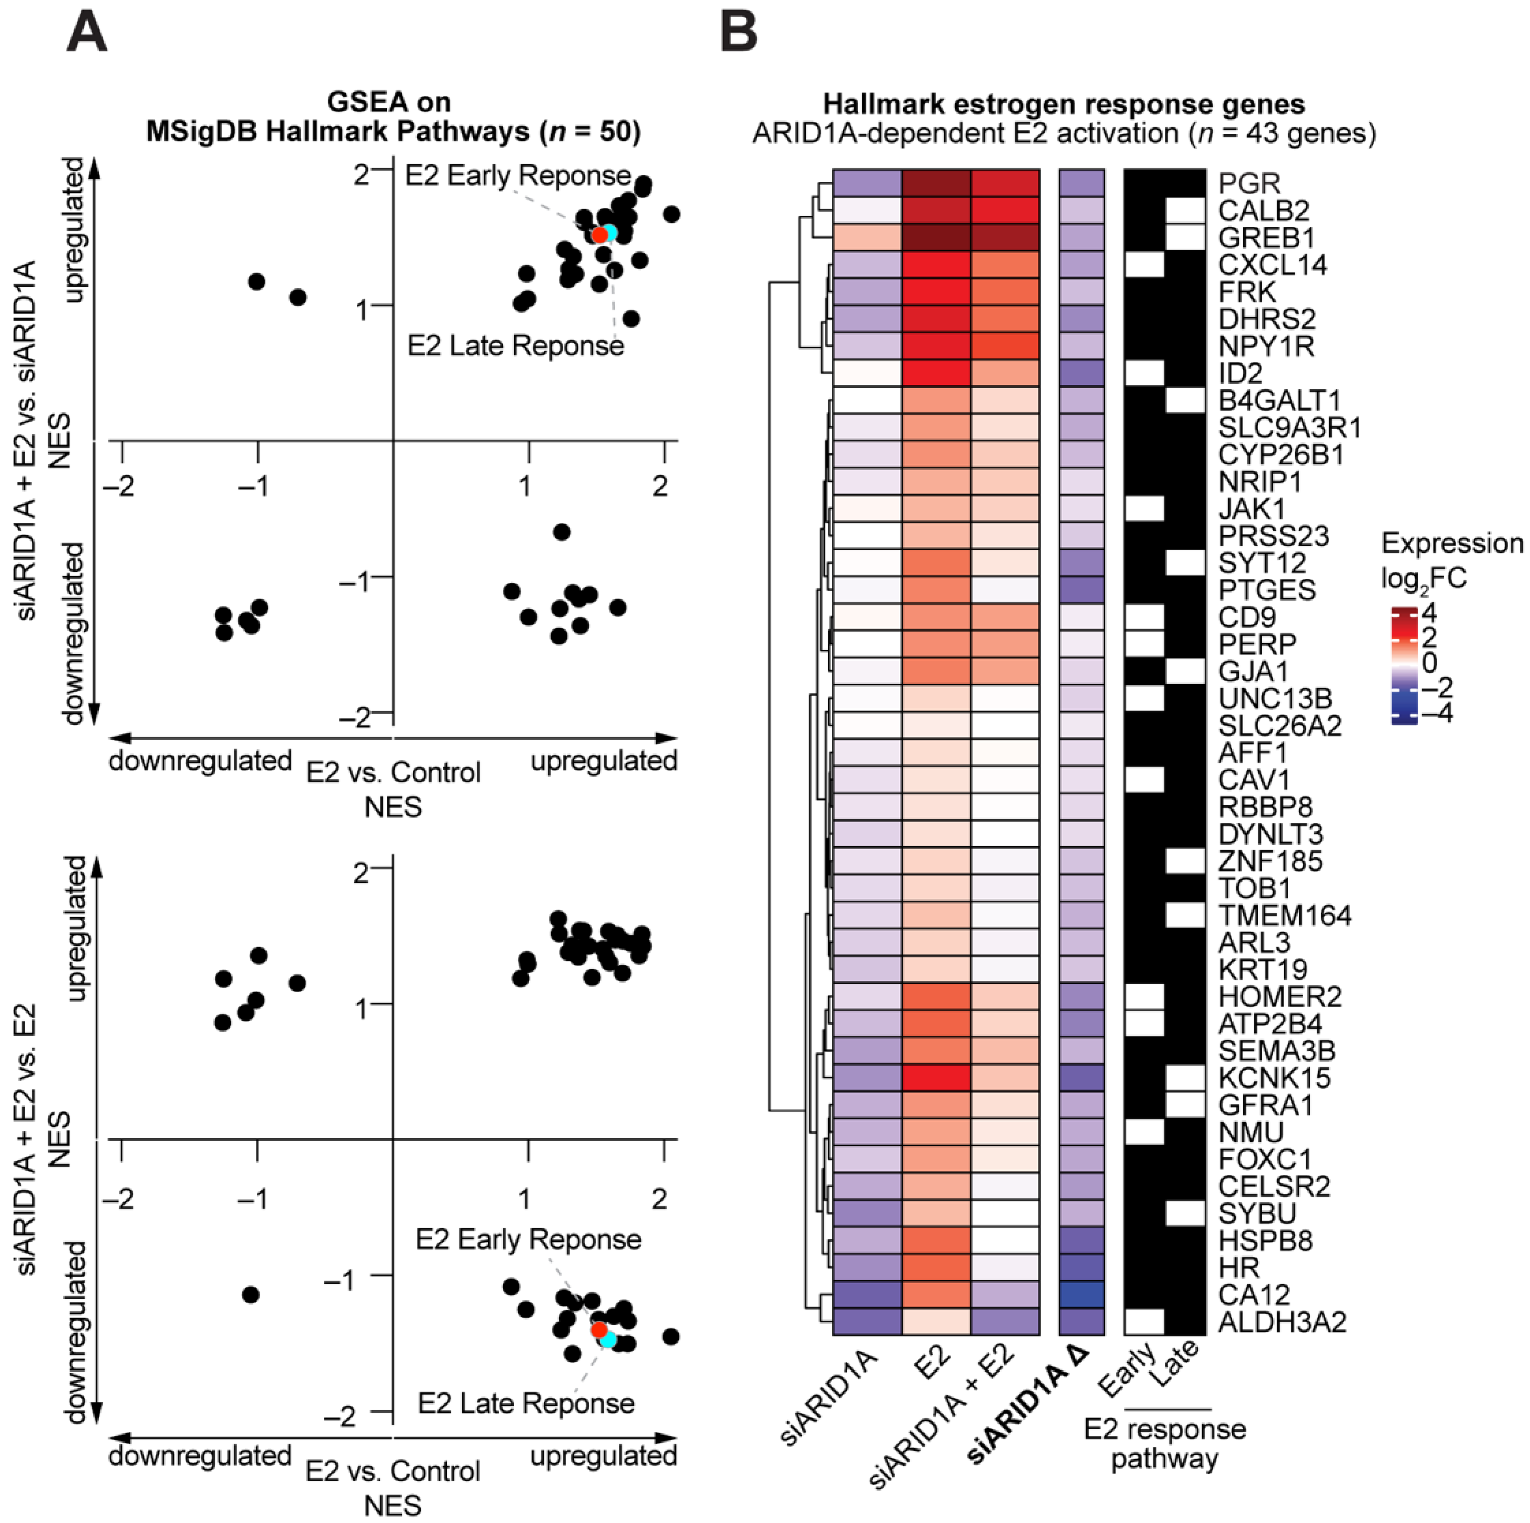
Normalized Enrichment Score (NES)
Hallmark PathwayE2
vs. Control
siARID1A + E2 vs. siARID1AsiARID1A + E2 vs. E2
Adipogenesis1.73 *1.77 *–1.50 *
Allograft Rejection1.00 *–1.30*1.29 *
Androgen Response1.56 *1.65 *–1.46 *
Angiogenesis1.70 *1.65 *1.23
Apical Junction1.37 *–1.171.34 *
Apical Surface1.45 *–1.131.42 *
Apoptosis1.55 *1.38 *1.40 *
Bile Acid Metabolism1.52 *1.16–1.33
Cholesterol Homeostasis1.34 *1.23–1.20
Coagulation1.41 *1.61 *1.54 *
Complement1.59 *1.62 *1.54 *
DNA Repair–1.05–1.36 *–1.14
E2F Targets–1.25–1.280.86
Epithelial Mesenchymal Transition1.38 *–1.36 *1.54 *
Estrogen Response Early1.52 *1.52 *–1.40 *
Estrogen Response Late1.59 *1.54 *–1.47 *
Fatty Acid Metabolism2.05 *1.67 *–1.45 *
G2M Checkpoint–0.701.061.15
Glycolysis1.57 *1.62 *1.35 *
Hedgehog Signaling–0.99–1.23 *1.35 *
Heme Metabolism1.70 *1.55 *–1.24
Hypoxia1.60 *1.57 *1.30
Il2 Stat5 Signaling1.64 *1.62 *1.47 *
Il6 Jak Stat3 Signaling1.22–1.44 *1.63 *
Inflammatory Response1.23 *–1.231.52 *
Interferon Alpha Response1.32–1.121.43
Interferon Gamma Response1.291.27 *1.38 *
Kras Signaling Dn1.29 *1.19–1.32
Kras Signaling Up1.82 *1.33 *1.36 *
Mitotic Spindle0.951.011.19
MTORC1 Signaling1.63 *1.26–1.30
Myc Targets V1–1.08–1.32 *0.94
Myc Targets V2–1.25 *–1.41 *1.19 *
Myogenesis1.261.41 *–1.16
Notch Signaling0.991.051.32 *
Oxidative Phosphorylation0.981.23–1.25
P53 Pathway1.85 *1.90*1.43 *
Pancreas Beta Cells1.471.51*1.20
Peroxisome1.74 *1.65*–1.33 *
PI3K Akt MTOR Signaling1.331.36*–1.58 *
Protein Secretion1.24–0.67–1.40 *
Oxygen Species Pathway0.87–1.11–1.08
Spermatogenesis1.47 *1.53 *–1.19
TGF-Beta Signaling1.84 *1.86 *1.51 *
TNF-Alpha Signaling Via NFkB1.70 *1.51 *1.46 *
Unfolded Protein Response1.75 *0.901.45 *
UV Response Dn1.66 *–1.23 *1.51 *
UV Response Up1.41 *1.65 *1.42 *
Wnt Beta Catenin Signaling–1.011.171.03
Xenobiotic Metabolism1.67 *1.73 *–1.50 *
Table 2. Genes with bivalent promoters affected by E2 treatment or ARID1A knockdown.
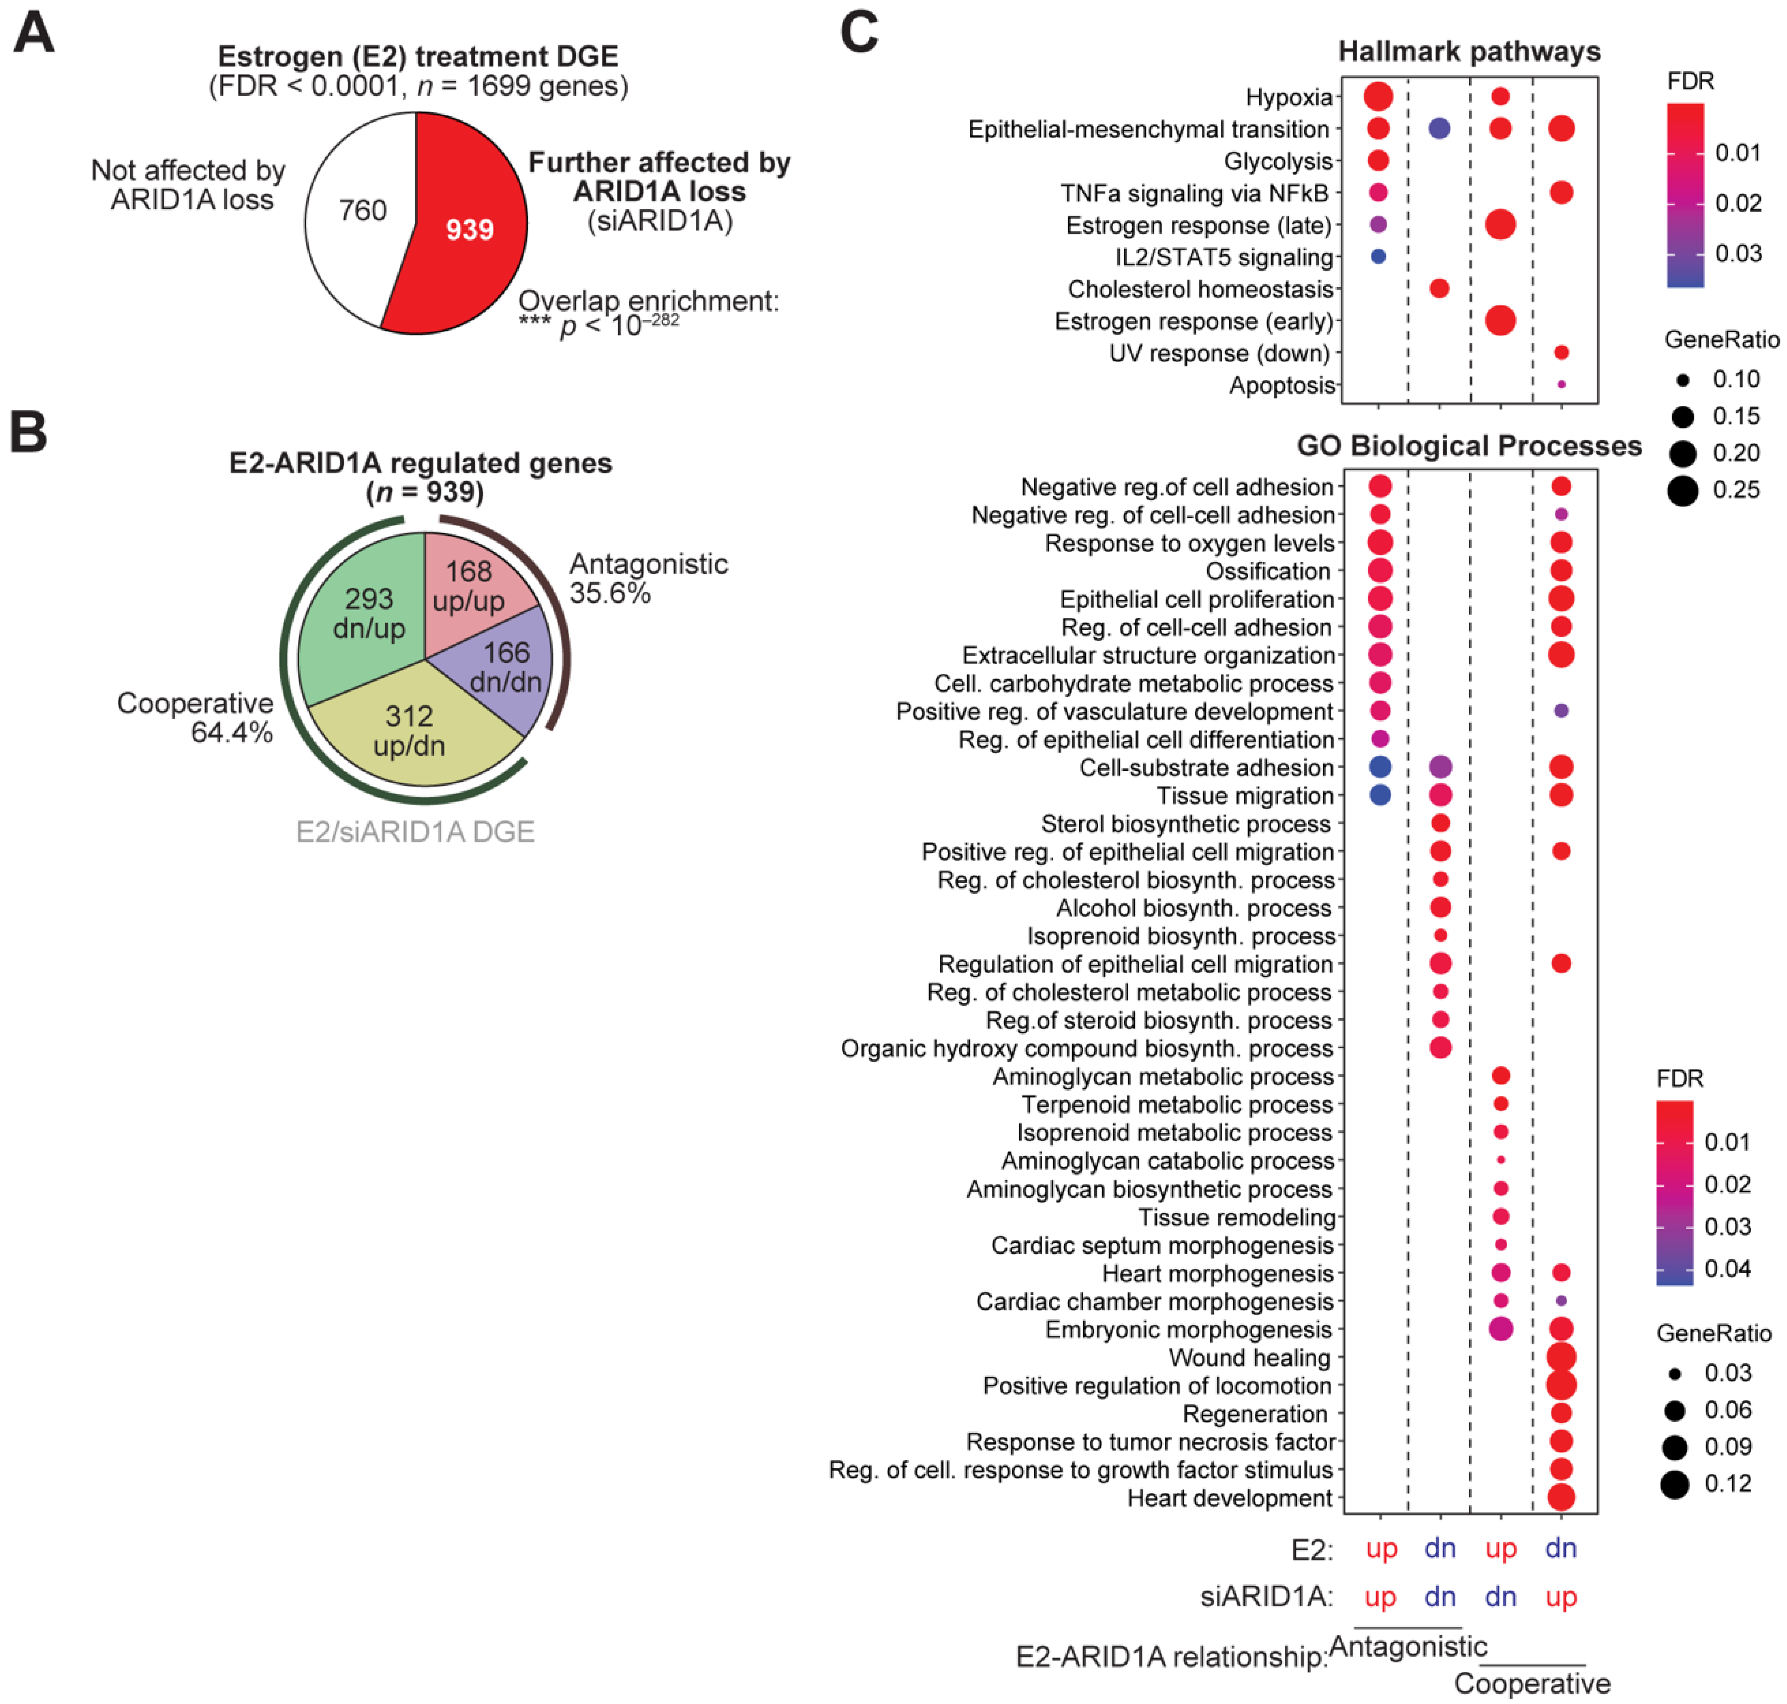
Genes with Bivalent Promoters Differentially Expressed Upon E2 Treatment of 12Z-ESR1 Cells (n = 53)
AFF3CYFIP2LDHBPDE4BRAP1GAP2SVEP1
APCDD1ERGLONRF2PDE4DRETREG1SYBU
ASIC2ESR1LPIN1PDGFDRNF152TGFA
BMP6GFRA2MAST4PGRRPS6KA2TMEM178B
C4orf19GUCY1A2MKXPLCB1SHANK2TMOD1
C4orf3HAND1NPY1RPLEKHA7SLC47A1TPD52L1
CACNB4ISM1NRXN3PRKAG2SLCO5A1TSHZ2
CDH6ISOC1NTMPRR15SNCAIPWNT16
COL27A1KIAA1217PDE1CPTGER4SOX5
Genes withBivalent Promoters Differentially Expressed Upon ARID1A Knockdown in 12Z Cells (n = 36)
AFF3COL27A1FAM131BMOCS1PLAGL1RPS6KA2
ANK3CYFIP2FMN1NR3C2PLEKHA7SHANK2
C17orf51DEPDC1BFOXQ1NTMRAP1GAP2STOX2
CDH6DLGAP4GJB2PDE1CRETREG1TMEM178B
CELF2EIF4E3LONRF2PDE4BRNF220TSHZ2
CHRM3ELOVL7MAD2L2PGRRPL38VDR
Overlapping Genes (n = 16)
AFF3CYFIP2PDE1CPLEKHA7RPS6KA2TSHZ2
CDH6LONRF2PDE4BRAP1GAP2SHANK2
COL27A1NTMPGRRETREG1TMEM178B
Publisher’s Note: MDPI stays neutral with regard to jurisdictional claims in published maps and institutional affiliations.

