
HPLC-PDA-ESI-HRMS-Based Profiling of Secondary Metabolites of Rindera graeca Anatomical and Hairy Roots Treated with Drought and Cold Stress

 , ,
, ,  ,
,
Abstract
:1. Introduction
2. Materials and Methods
2.1. Root Cultures
Experimental Design
2.2. Extraction of Plant Material
2.3. HPLC-PDA-ESI-HRMS Analysis
2.3.1. Chemicals
2.3.2. HPLC-PDA-ESI-HRMS Analysis
2.3.3. Standard Sample Preparation
2.3.4. HPLC Method Validation
2.4. Determination of Total Flavonoid Content (TFC)
2.5. Determination of Total Phenolic Compounds Content (TPC)
2.6. Determination of Ions Concentration
2.7. Statistical Analysis
3. Results and Discussion
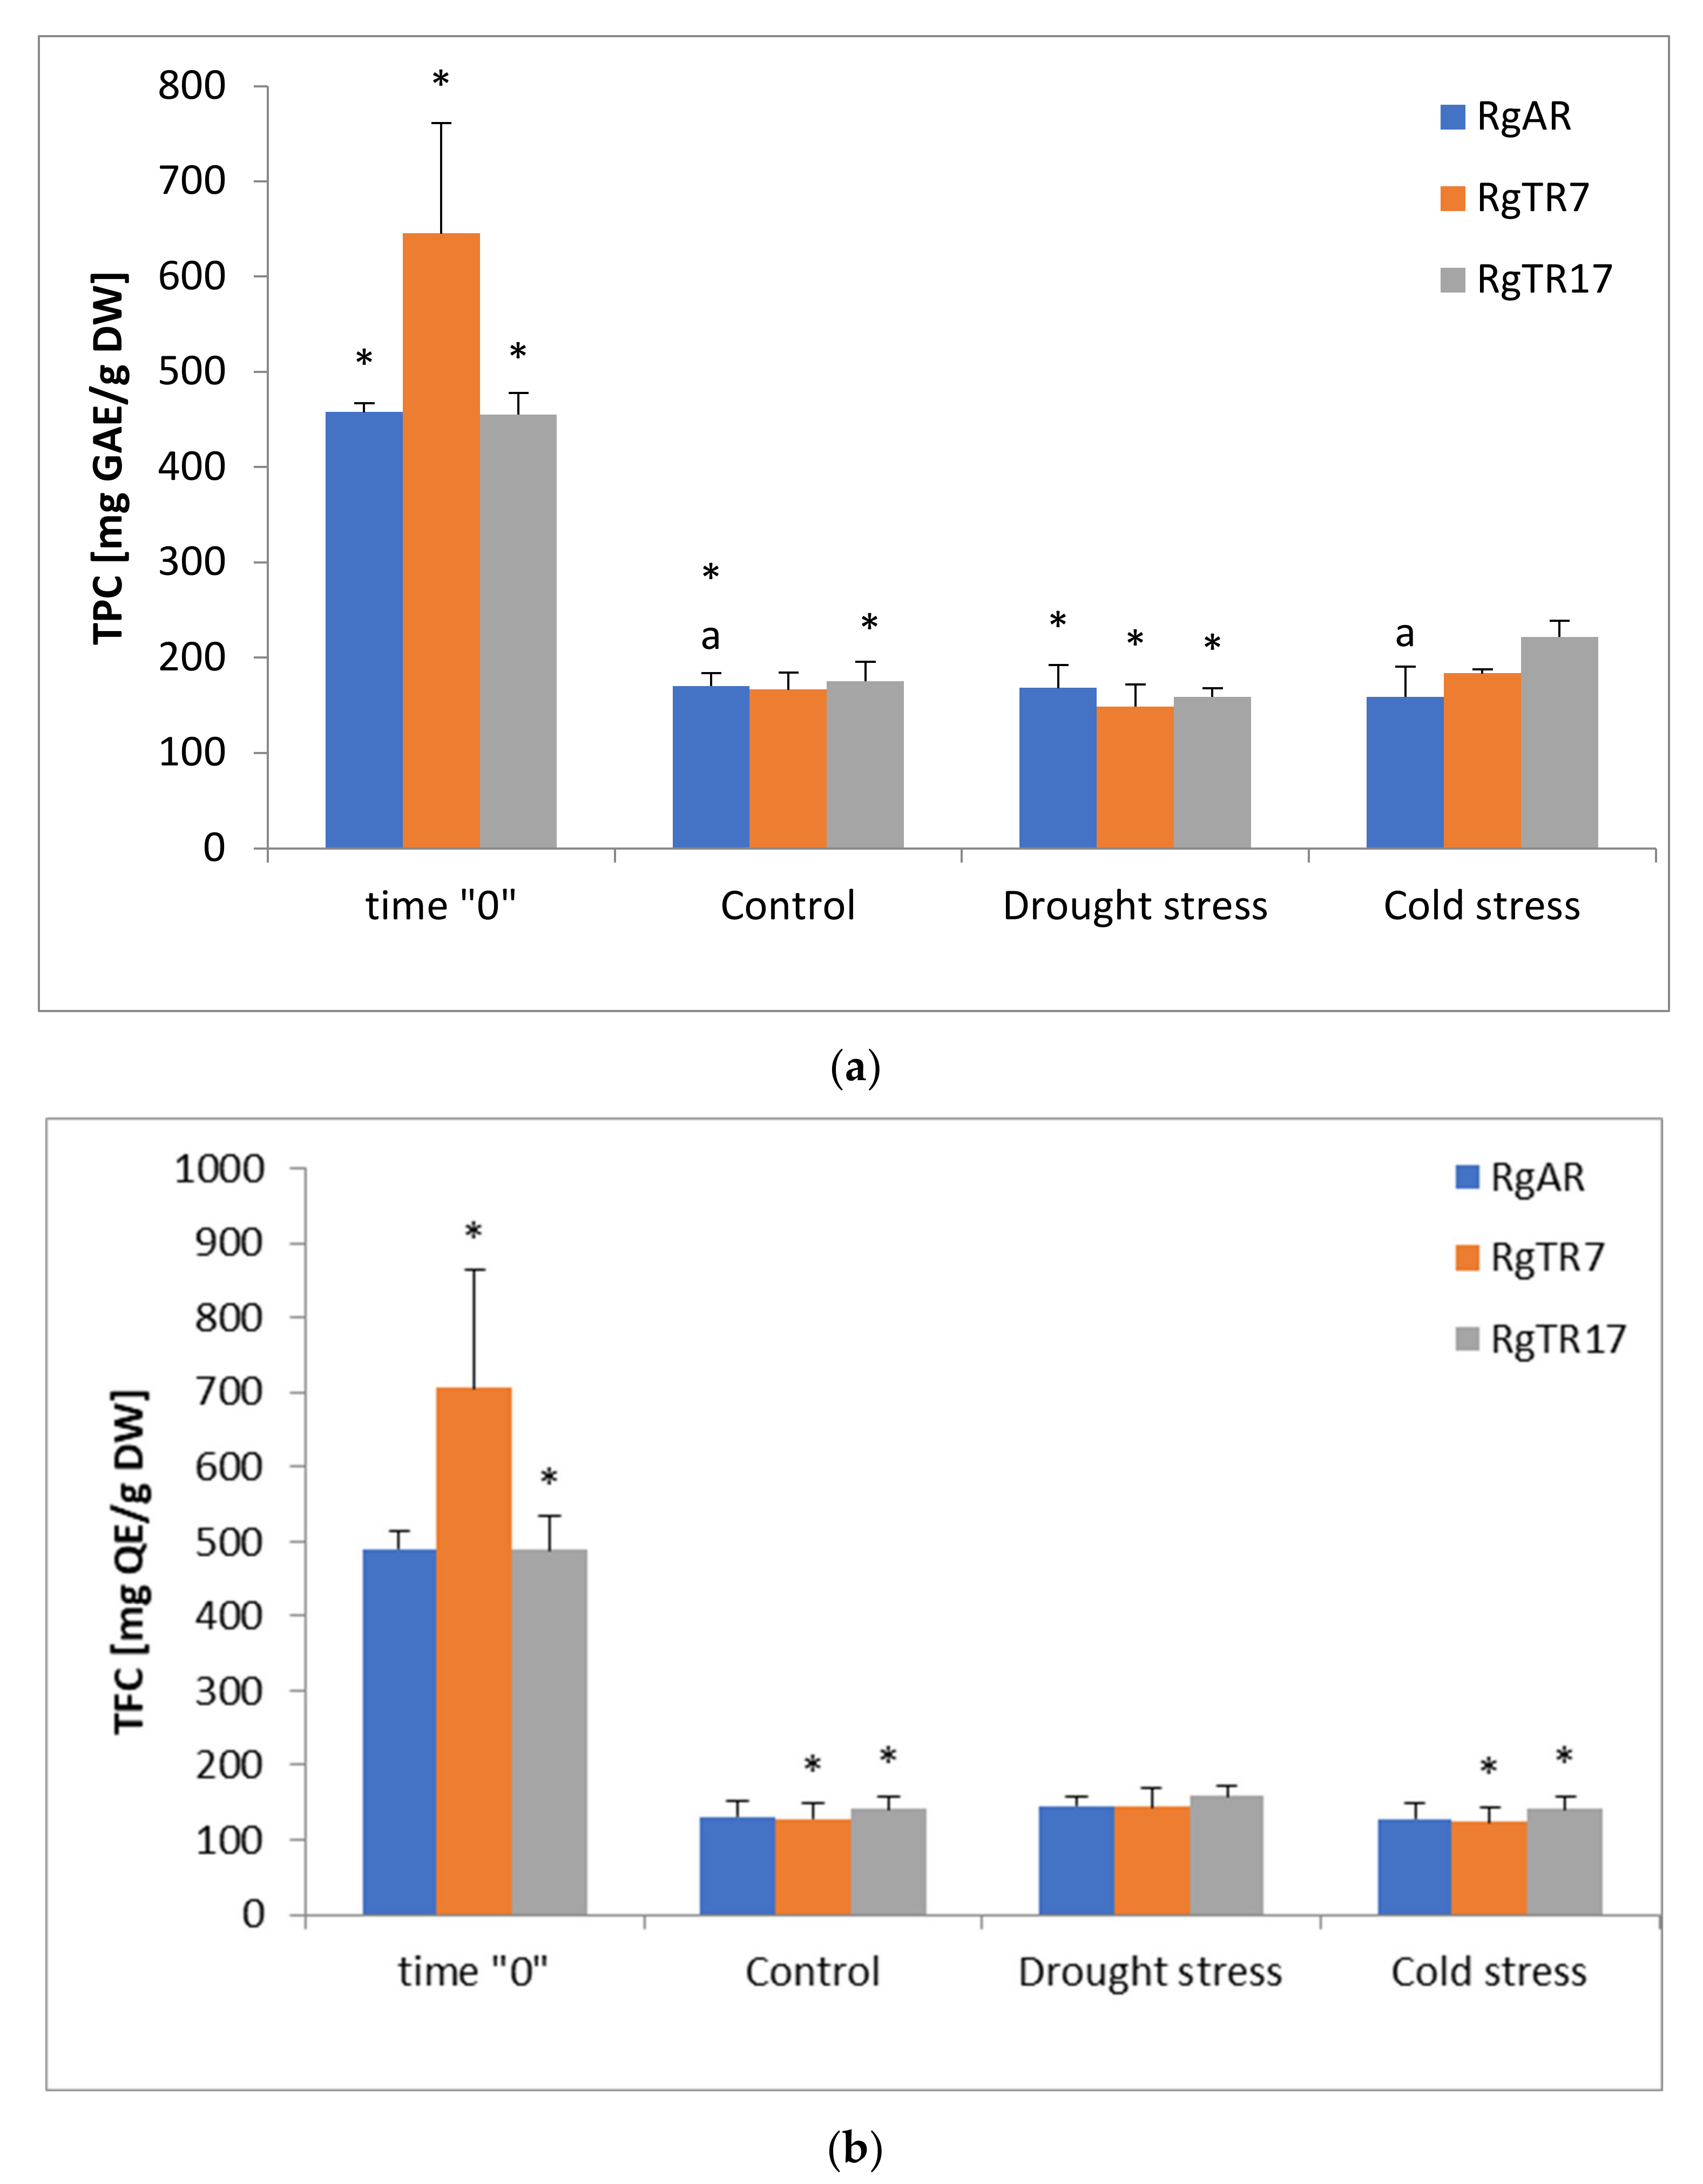
3.1. Biomass, Total Phenols and Flavonoids as Well as Ions Concentration
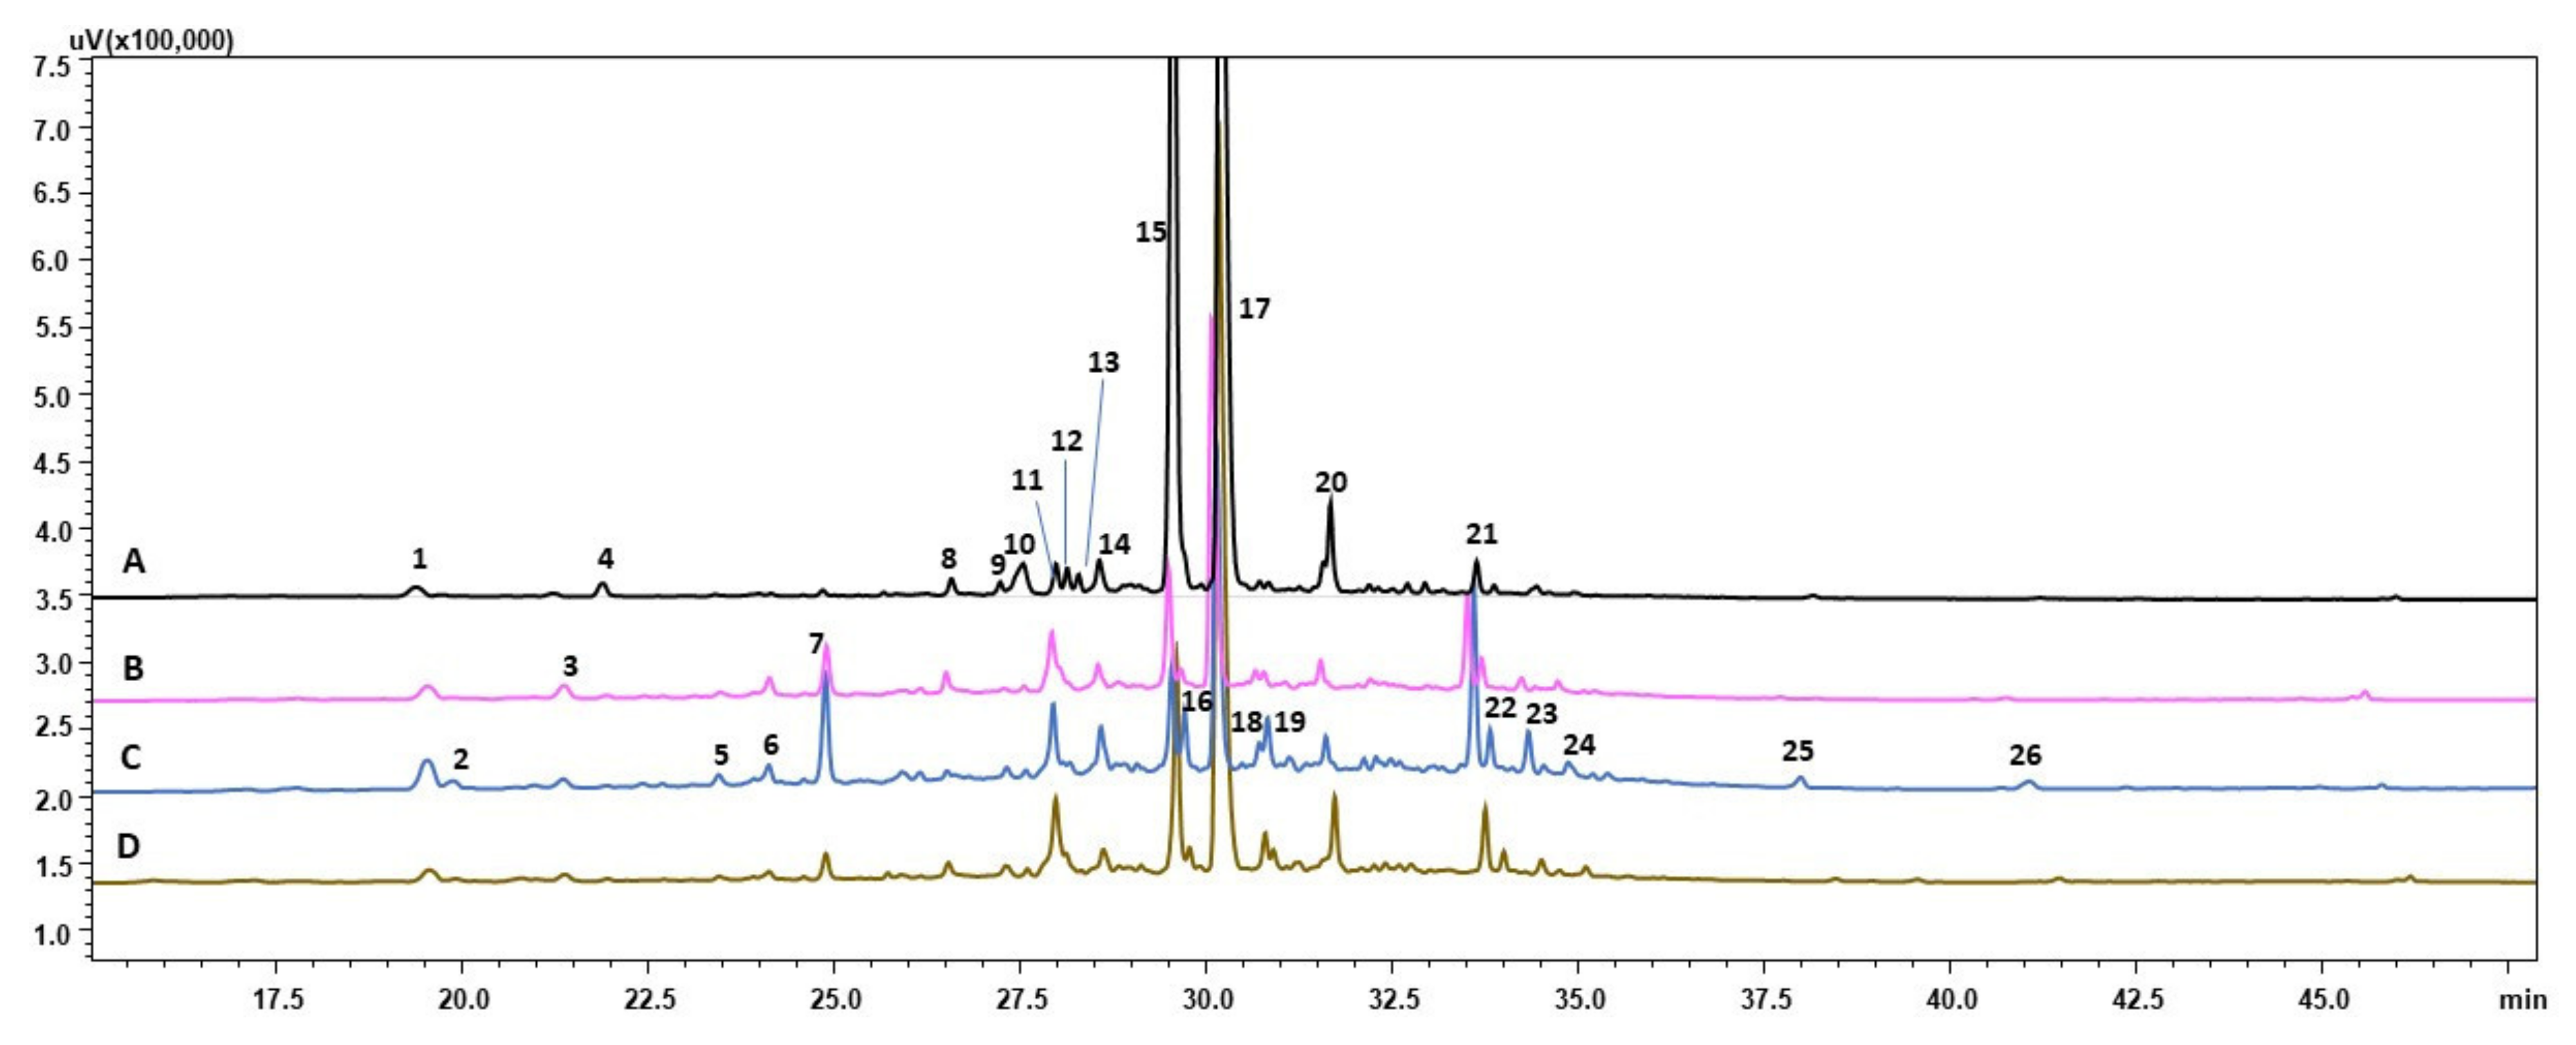
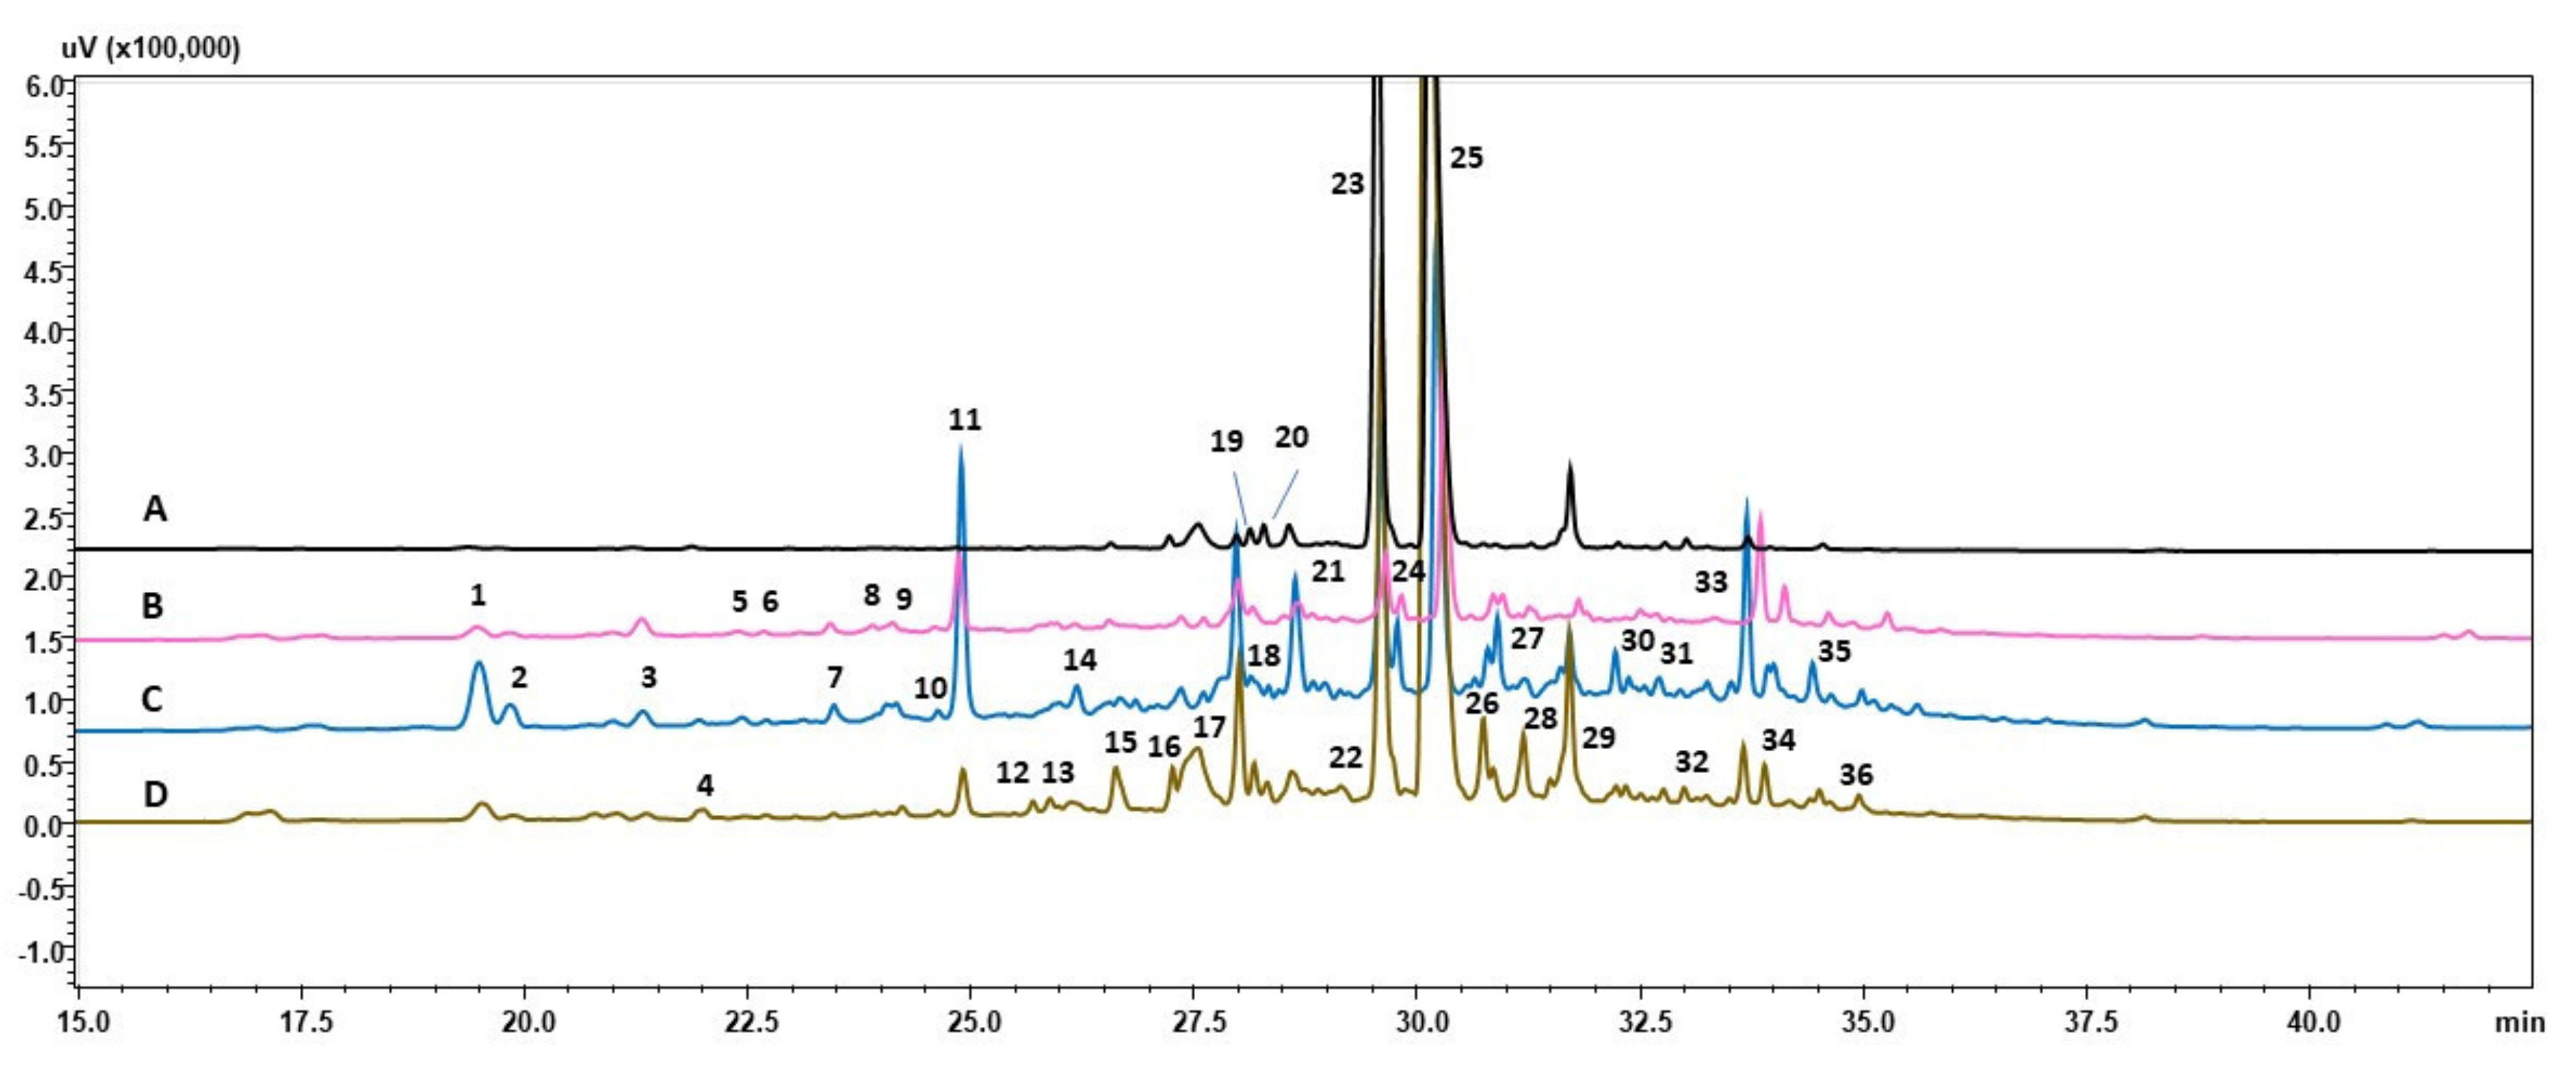
3.2. HPLC-PDA-ESI-HRMS Analysis
Supplementary Materials
Author Contributions
Funding
Institutional Review Board Statement
Informed Consent Statement
Data Availability Statement
Acknowledgments
Conflicts of Interest
References
- Wilson, S.A.; Roberts, S.C. Recent advances towards development and commercialization of plant cell culture processes for the synthesis of biomolecules. Plant Biotechnol. J. 2012, 10, 249–268. [Google Scholar] [CrossRef] [PubMed]
- Georgiev, V.; Slavov, A.; Vasileva, I.; Pavlov, A. Plant cell culture as emerging technology for production of active cosmetic ingredients. Eng. Life Sci. 2018, 18, 779–798. [Google Scholar] [CrossRef]
- Babich, O.; Sukhikh, S.; Pungin, A.; Ivanova, S.; Asyakina, L.; Prosekov, A. Modern trends in the in vitro production and use of callus, suspension cells and root cultures of medicinal plants. Molecules 2020, 25, 5805. [Google Scholar] [CrossRef] [PubMed]
- Li, Y.; Kong, D.; Fu, Y.; Sussman, M.R.; Wu, H. The effect of developmental and environmental factors on secondary metabolites in medicinal plants. Plant Physiol. Biochem. 2020, 148, 80–89. [Google Scholar] [CrossRef] [PubMed]
- Kamari, G.; Blanché, C.; Siljak-Yakovlev, S. Mediterranean chromosome number reports—24. Flora Mediterr. 2014, 24, 286–291. [Google Scholar] [CrossRef] [Green Version]
- Walter, K.S.; Gillett, H.J. 1997 IUCN Red List of Threatened Plants; Walter, K.S., Gillett, H.J., Eds.; Complied by the World Conservation Monitoring Centre; IUCN—The World Conservation Union: Gland, Switzerland; Cambridge, UK, 1998; ISBN 2-8317-0328-X. [Google Scholar]
- Ganos, C.; Aligiannis, N.; Chinou, I.; Naziris, N.; Chountoulesi, M.; Mroczek, T.; Graikou, K. Rindera graeca (Boraginaceae) phytochemical profile and biological activities. Molecules 2020, 25, 3625. [Google Scholar] [CrossRef]
- Sykłowska-Baranek, K.; Pietrosiuk, A.; Graikou, K.; Damianakos, H.; Jeziorek, M.; Chinou, I. Phenolic compounds from in vitro cultures of Rindera graeca Boiss. & Feldr. Planta Med. 2013, 79, 1187. [Google Scholar] [CrossRef]
- Sykłowska-Baranek, K.; Pietrosiuk, A.; Szyszko, E.; Graikou, K.; Jeziorek, M.; Kuźma, Ł.; Chinou, I. Phenolic compounds from in vitro cultures of Rindera graeca Boiss. & Heldr. Planta Med. 2012, 78, 1221. [Google Scholar] [CrossRef]
- Sykłowska-Baranek, K.; Pietrosiuk, A.; Kuźma, Ł.; Chinou, I.; Kongel, M.; Jeziorek, M. Establishment of Rindera graeca transgenic root culture as a source of shikonin derivatives. Planta Med. 2008, 74, 1161. [Google Scholar] [CrossRef]
- Graikou, K.; Damianakos, H.; Ganos, C.; Sykłowska-Baranek, K.; Jeziorek, M.; Pietrosiuk, A.; Roussakis, C.; Chinou, I. Chemical profile and screening of bioactive metabolites of Rindera graeca (A. DC.) Bois. & Heldr. (Boraginaceae) in vitro cultures. Plants 2021, 10, 834. [Google Scholar] [CrossRef]
- Jeziorek, M.; Damianakos, H.; Kawiak, A.; Laudy, A.E.; Zakrzewska, K.; Sykłowska-Baranek, K.; Chinou, I.; Pietrosiuk, A. Bioactive rinderol and cynoglosol isolated from Cynoglossum columnae Ten. in vitro root culture. Ind. Crop. Prod. 2019, 137, 446–452. [Google Scholar] [CrossRef]
- Kawka, M.; Bubko, I.; Koronkiewicz, M.; Gruber-Bzura, B.; Graikou, K.; Chinou, I.; Jeziorek, M.; Pietrosiuk, A.; Sykłowska-Baranek, K. Polyurethane foam rafts supported in vitro cultures of Rindera graeca roots for enhanced production of rinderol, potent proapoptotic naphthoquinone compound. Int. J. Mol. Med. 2022, 23, 56. [Google Scholar] [CrossRef] [PubMed]
- Altundag, E.; Ozturk, M. Ethnomedicinal studies on the plant resources of east Anatolia, Turkey. Procedia Soc. Behav. Sci. 2011, 19, 756–777. [Google Scholar] [CrossRef] [Green Version]
- Civra, A.; Francese, R.; Sinato, D.; Donalisio, M.; Cagno, V.; Rubiolo, P.; Ceylan, R.; Uysal, A.; Zengin, G.; Lembo, D. In vitro screening for antiviral activity of Turkish plants revealing methanolic extract of Rindera lanata var. lanata active against human rotavirus. BMC Complement. Altern. Med. 2017, 17, 1–8. [Google Scholar] [CrossRef] [Green Version]
- Yücel, T.B.; Karaoğlu, Ş.A.; Yaylı, N. Antimicrobial activity and composition of Rindera lanata (LAM.) Bunge var. canescens (A.D.C.) Kosn. essential oil obtained by hydrodistillation and microwave assisted distillation. Rec. Nat. Prod. 2017, 11, 328–333. [Google Scholar]
- Selmar, D.; Kleinwächter, M. Influencing the product quality by deliberately applying drought stress during the cultivation of medicinal plants. Ind. Crops Prod. 2013, 42, 558–566. [Google Scholar] [CrossRef]
- Taiz, L.; Zeiger, E. Secondary metabolites and plant defense. In Plant Physiology; Taiz, L., Zeiger, E., Eds.; Sinauer: Sunderland, MA, USA, 2002; Volume 3, pp. 283–308. ISBN 0878938230. [Google Scholar]
- Aguirre-Becerra, H.; Vazquez-Hernandez, M.C.; Saenz de la O, D.; Alvarado-Mariana, A.G.; Guevara-Gonzalez, R.; Fernando Garcia-Trejo, J.; Feregrino-Perez, A.A. Role of Stress and Defense in Plant Secondary Metabolites Production. In Bioactive Natural Products for Pharmaceutical Applications; Pal, D., Nayak, A.K., Eds.; Springer Nature: Cham, Switzerland, 2021; Volume 140, pp. 151–195. [Google Scholar] [CrossRef]
- Gupta, P.K.; Durzan, D.J. Shoot multiplication from mature trees of Douglas-fir (Pseudotsuga menziesii) and sugar pine (Pinus lambertiana). Plant Cell Rep. 1985, 4, 177–179. [Google Scholar] [CrossRef]
- Pękal, A.; Pyrzynska, K. Evaluation of aluminium complexation reaction for flavonoid content Assay. Food Anal. Methods 2014, 7, 1776–1782. [Google Scholar] [CrossRef] [Green Version]
- Aghaee, A.; Moradi, F.; Zare-Maivan, H.; Zarinkamar, F.; Irandoost, H.P.; Sharifi, P. Physiological responses of two rice (Oryza sativa L.) genotypes to chilling stress at seedling stage. African J. Biotechnol. 2011, 10, 7617–7621. [Google Scholar] [CrossRef]
- Örvar, B.L.; Sangwan, V.; Omann, F.; Dhindsa, R.S. Early steps in cold sensing by plant cells: The role of actin cytoskeleton and membrane fluidity. Plant J. 2000, 23, 785–794. [Google Scholar] [CrossRef]
- Dai, J.; Mumper, R.J. Plant phenolics: Extraction, analysis and their antioxidant and anticancer properties. Molecules 2010, 15, 7313–7352. [Google Scholar] [CrossRef] [PubMed]
- Dias, M.I.; Sousa, M.J.; Alves, R.C.; Ferreira, I.C.F.R. Exploring plant tissue culture to improve the production of phenolic compounds: A review. Ind. Crops Prod. 2016, 82, 9–22. [Google Scholar] [CrossRef] [Green Version]
- Bulgakov, V.P.; Vereshchagina, Y.V.; Veremeichik, G.N. Anticancer polyphenols from cultured plant cells: Production and new bioengineering strategies. Curr. Med. Chem. 2018, 25, 4671–4692. [Google Scholar] [CrossRef] [PubMed]
- Yamamoto, H.; Yazaki, K.; Inoue, K. Simultaneous analysis of shikimate-derived secondary metabolites in Lithospermum erythrorhizon cell suspension cultures by high-performance liquid chromatography. J. Chromatogr. B Biomed. Sci. Appl. 2000, 738, 3–15. [Google Scholar] [CrossRef]
- Ramakrishna, A.; Ravishankar, G.A. Influence of abiotic stress signals on secondary metabolites in plants. Plant Signal. Behav. 2011, 6, 1720–1731. [Google Scholar]
- Isah, T. Stress and defense responses in plant secondary metabolites production. Biol. Res. 2019, 52, 39. [Google Scholar] [CrossRef] [Green Version]
- Kleinwächter, M.; Selmar, D. New insights explain that drought stress enhances the quality of spice and medicinal plants: Potential applications. Agron. Sustain. Dev. 2015, 35, 121–131. [Google Scholar] [CrossRef] [Green Version]
- Mierziak, J.; Kostyn, K.; Kulma, A. Flavonoids as important molecules of plant interactions with the environment. Molecules 2014, 19, 16240–16265. [Google Scholar] [CrossRef]
- Kapoor, D.; Bhardwaj, S.; Landi, M.; Sharma, A.; Ramakrishnan, M.; Sharma, A. The impact of drought in plant metabolism: How to exploit tolerance mechanisms to increase crop production. Appl. Sci. 2020, 10, 5692. [Google Scholar] [CrossRef]
- Simic, M.R.; Vuckovic, I.; Trifunovic, S.S. Pyrrolizidine alkaloids and fatty acids from the endemic plant species Rindera umbellata and the effect of lindelofine-N-oxide on tubulin polymerization. Molecules 2014, 18, 10694–10706. [Google Scholar] [CrossRef] [Green Version]
- Mandić, B.M.; Vlajić, M.D.; Trifunović, S.S.; Simić, R.; Vujisić, L.V.; Vučković, I.M.; Novaković, M.M.; Nikolić-Mandić, S.D.; Teševic, V.V.; Vajs, V.V.; et al. Optimisation of isolation procedure for pyrrolizidine alkaloids from Rindera umbellata Bunge. Nat. Prod. Res. Former. Nat. Prod. Lett. 2015, 29, 887–890. [Google Scholar] [CrossRef]
- Yamamoto, H.; Zhao, P.; Yazaki, K.; Inoue, K. Regulation of lithospermic acid B and shikonin production in Lithospermum erythrorhizon cell suspension cultures. Chem. Pharm. Bull. 2002, 50, 1086–1090. [Google Scholar] [CrossRef] [PubMed] [Green Version]
- Bednarek, P.T.; Orłowska, R. Plant tissue culture environment as a switch-key of (epi)genetic changes. Plant Cell. Tissue Organ Cult. 2020, 140, 245–257. [Google Scholar] [CrossRef] [Green Version]
- Fu, C.; Li, L.; Wu, W.; Li, M.; Yu, X.; Yu, L. Assessment of genetic and epigenetic variation during long-term Taxus cell culture. Plant Cell Rep. 2012, 31, 1321–1331. [Google Scholar] [CrossRef]
- Kang, D.G.; Oh, H.; Chung, H.T.; Lee, H.S. Inhibition of angiotensin converting enzyme by lithospermic acid B isolated from Radix Salviae miltiorrhiza Bunge. Phytother. Res. 2003, 17, 917–920. [Google Scholar] [CrossRef]
- Lee, B.W.; Chun, S.W.; Kim, S.H.; Lee, Y.; Kang, E.S.; Cha, B.S.; Lee, H.C. Lithospermic acid B protects beta-cells from cytokine-induced apoptosis by alleviating apoptotic pathways and activating anti-apoptotic pathways of Nrf2-HO-1 and Sirt1. Toxicol. Appl. Pharmacol. 2011, 252, 47–54. [Google Scholar] [CrossRef]
- Jin, C.J.; Yu, S.H.; Wang, X.M.; Woo, S.J.; Park, H.J.; Lee, H.C.; Choi, S.H.; Kim, K.M.; Kim, J.H.; Park, K.S.; et al. The effect of lithospermic acid, an antioxidant, on development of diabetic retinopathy in spontaneously obese diabetic rats. PLoS ONE 2014, 9, e98232. [Google Scholar] [CrossRef]
- Wang, J.; Xiong, X.; Feng, B. Cardiovascular effects of salvianolic acid B. Evidence-based Complement. Altern. Med. 2013, 2013, 247948. [Google Scholar] [CrossRef]


| Treatment | 28 Day Old Roots-Time “0” | Control | Drought Stress | Cold Stress | ||||||||
|---|---|---|---|---|---|---|---|---|---|---|---|---|
| Root Line | ||||||||||||
| FW/DW | RgAR | RgTR7 | RgTR17 | RgAR | RgTR7 | RgTR17 | RgAR | RgTR7 | RgTR17 | RgAR | RgTR7 | RgTR17 |
| FW | 1835.7 ± 103.0 * | 1040.3 ± 387.6 * | 2068.1 ± 239.7 * | 2138.7 ± 573.8 a* | 3550.7 ± 854.7 b* | 4708.4 ± 421.1 c* | 3344.3 ± 454.3 * | 3280.8 ± 879.9 * | 3732.6 ± 525.8 | 2241.2 ± 254.7 a | 1683.6 ± 685.2 b | 2740.0 ± 408.5 c |
| DW | 360.9 ± 23.6 | 229.9 ± 92.1 | 359.5 ± 13.5 | 664.3 ± 79.6 | 621.7 ± 144.2 | 767.8 ± 35.7 | 654.9 ± 61.4 | 646.2 ± 153.1 | 700.3 ± 62.2 | 408.1 ± 41.7 | 305.7 ± 134.7 | 470.2 ± 55.5 |
| Treatment | 28 Day Old Roots-Time “0” | Control | Drought Stress | Cold Stress | ||||||||
|---|---|---|---|---|---|---|---|---|---|---|---|---|
| Root Line | ||||||||||||
| Ion | RgAR | RgTR7 | RgTR17 | RgAR | RgTR7 | RgTR17 | RgAR | RgTR7 | RgTR17 | RgAR | RgTR7 | RgTR17 |
| Ca | 3.37 ± 0.81 | 1.64 ± 0.12 | 2.81 ± 0.55 | 2.64 ± 0.42 | 2.12 ± 0.20 | 2.90 ± 0.17 a | 2.50 ± 0.25 | 2.27 ± 0.34 | 2.24 ± 0.40 | 2.50 ± 0.31 | 1.90 ± 0.19 a | 2.66 ± 0.27 |
| Mg | 1.36 ± 0.27 | 0.76 ± 0.03 | 1.29 ± 0.29 | 1.17 ± 0.19 | 1.06 ± 0.14 | 1.41 ± 0.09 *a,b | 1.04 ± 0.11 | 0.87 ± 0.15 a | 0.90 ± 0.17 | 1.06 ± 0.06 | 0.87 ± 0.06 b | 1.20 ± 0.11 |
| Na | 2.53 ± 0.16 | 2.51 ± 0.28 | 2.37 ± 0.07 | 2.47 ± 0.11 | 2.33 ± 0.18 | 2.19 ± 0.07 | 2.20 ± 0.10 | 2.11 ± 0.70 | 2.09 ± 0.07 a,b | 2.82 ± 0.18 a | 2.78 ± 0.36 b | 2.52 ± 0.12 |
| K | 11.29 ± 1.09 | 11.25 ± 0.29 | 11.11 ± 1.85 | 13.37 ± 0.68 a,b | 12.35 ± 0.53 | 11.42 ± 0.54 | 10.93 ± 0.41 | 10.29 ± 0.77 a | 9.57 ± 1.15 b | 10.91 ± 2.57 | 12.89 ± 0.70 | 12.74 ± 1.41 |
| Fe | 0.35 ± 0.04 | 0.30 ± 0.04 | 0.27 ± 0.01 | 0.26 ± 0.02 | 0.21 ± 0.02 | 0.23 ± 0.02 | 0.22 ± 0.03 | 0.23 ± 0.04 | 0.17 ± 0.02 a,b,c | 0.29 ± 0.05 a | 0.33 ± 0.05 b | 0.29 ± 0.03 c,b |
| Mn | 0.38 ± 0.04 | 0.33 ± 0.01 | 0.34 ± 0.02 | 0.31 ± 0.03 | 0.29 ± 0.01 | 0.30 ± 0.01 | 0.27 ± 0.01 | 0.25 ± 0.03 a,b | 0.22 ± 0.03 | 0.34 ± 0.01 a | 0.32 ± 0.02 | 0.34 ± 0.02 b |
| Treatment | 28 Day Old Roots-Time “0” | Control | Drought Stress | Cold Stress | ||||||||
|---|---|---|---|---|---|---|---|---|---|---|---|---|
| Root Line | ||||||||||||
| Compound | RgAR | RgTR7 | RgTR17 | RgAR | RgTR7 | RgTR17 | RgAR | RgTR7 | RgTR17 | RgAR | RgTR7 | RgTR17 |
| Caffeic acid | + | + | + | + | + | + | + | + | + | + | + | + |
| Chlorogenic acid | − | − | − | − | − | − | − | − | − | − | − | − |
| p-coumaric acid | − | − | − | − | − | − | − | − | − | − | − | − |
| 5-O-feruoylo-quinic acid | − | − | − | − | − | − | − | − | − | − | − | − |
| Sinapic acid | − | − | − | − | − | − | − | − | − | − | − | − |
| 3,5-dicaffeoyl-quinic acid | − | − | − | − | − | − | − | − | − | − | − | − |
| Rosmarinic acid | + | + | + | + | + | + | + | + | + | + | + | + |
| Lithospermic acid | − | − | + | − | − | + | − | − | + | − | − | + |
| Lithospermic B acid | + | + | + | + | + | + | + | + | + | + | + | + |
| Shikonin | − | − | − | − | − | − | − | − | − | − | − | − |
| Acetylshikonin | − | − | − | − | − | − | − | − | − | − | − | − |
| Isobutyrylshikonin | − | − | − | − | − | − | − | − | − | − | − | − |
| Deoxyshikonin | − | − | − | − | − | − | − | − | − | − | − | − |
| Isovalerylshikonin | − | − | − | − | − | − | − | − | − | − | − | − |
| Dimethylacrylshikonin | − | − | − | − | − | − | − | − | − | − | − | − |
| Rinderol | + | − | + | − | − | − | − | − | − | − | − | − |
| Treatment | 28 Day Old Roots-Time “0” | Control | Drought Stress | Cold Stress | ||||||||
|---|---|---|---|---|---|---|---|---|---|---|---|---|
| Root Line | ||||||||||||
| Compound | RgAR | RgTR7 | RgTR17 | RgAR | RgTR7 | RgTR17 | RgAR | RgTR7 | RgTR17 | RgAR | RgTR7 | RgTR17 |
| Caffeic acid | 0.20 ± 0.01 | 0.01 ± 0.01 | 0.24 ± 0.04 | 0.03 ± 0.005 | 0.03 ± 0.005 * | 0.04 ± 0.01 * | 0.06 ± 0.15 | 0.05 ± 0.01 * | 0.09 ± 0.02 * | 0.08 ± 0.02 | 0.05 ± 0.01 | 0.08 ± 0.01 a |
| Rosmarinic acid | 12.74 ± 0.12 | 33.69 ± 15.11 | 10.97 ± 1.24 | 0.95 ± 0.08 | 0.90 ± 2.45 | 0.52 ± 0.23 | 0.87 ± 0.10 | 0.99 ± 0.60 | 0.48 ± 0.24 | 2.50 ± 0.98 * | 0.60 ± 0.14* | 1.31 ± 0.50 |
| Lithospermic B acid | 63.17 ± 17.68 | 106.07 ± 10.65 | 87.77 ± 14.71 | 2.05 ± 0.43 a | 1.68 ± 0.79 b | 2.01 ± 0.32 c | 2.13 ± 0.34 | 1.76 ± 0.67 | 1.71 ± 0.08 c | 31.78 ± 7.08 a,* | 5.67 ± 2.37 b,* | 7.39 ± 1.12 c,* |
| Peak No. | Tr | [M–H]- | Molecular Formula | Compound | Conditions |
|---|---|---|---|---|---|
| 1 | 19.39 | 179 | C9H8O4 | Caffeic acid | DZ; control; DS; CS |
| 2 | 19.88 | 329 341 | C15H22O8 C15H18O9 | Bartsioside Caffeic acid 3-glucoside | DS |
| 3 | 21.22 | 431 | C20H24N4O7 | Unidentified | DZ; control; DS; CS |
| 4 | 21.90 | 375 | C18H16O9 | Limocitrol | DZ |
| 5 | 23.46 | 499 | C22H28O13 | Haploperoside | DS |
| 6 | 24.13 | 509 553 | C33H18O6 C27H22O13 | Unidentified Unidentified | control; DS |
| 7 | 24.89 | 269 313 627 715 | C16H14O4 C17H14O6 C34H28O12 C36H28O16 | Imperatorin Crisimaritin Unidentified Dehydrorabdosiin | DZ; control; DS; CS |
| 8 | 26.58 | 733 | C54H22O4 | Unidentified | DZ; control; DS; CS |
| 9 | 27.24 | 515 | C26H32N2O9 | Strictosidinic acid? | DZ; DS; CS |
| 10 | 27.54 | 436 | C25H31N3O4 | N1,N10-Bis(p-coumaroyl)spermidine | DZ |
| 11 | 27.99 | 537 545 | C27H22O12 C32H34O8 | Globoidnan B Vittarin E | DZ; control; DS; CS |
| 12 | 28.14 | 439 (2-) | C28H32N16O8 | Unidentified | DZ |
| 13 | 28.29 | 435 521 | C20H20O11 C24H26O13 | Irisxanthone Iridin | DZ |
| 14 | 28.57 | 359 369 483 | C18H16O8 C21H18N6O or C20H22N2O5 C22H28O12 | Irigenin Unidentified or Apabetalone Rubinaphthin B/7-methyl-1,4,5-naphthalenetriol-4-[xylosyl-(1→6)-glucoside]/MEGxp0_002017 | DZ; control; DS; CS |
| 15 | 29.55 | 359 | C18H16O8 | Rosmarinic acid | DZ; control; DS; CS |
| 16 | 29.71 | 447 461 627 | C22H24O10 C22H22O11 C28H36O16 | Sakuranin or Androechin Azalein or Tectoridin Piloside A | DS; CS |
| 17 | 30.11 | 717 | C36H30O16 | Lithospermic B acid | DZ; control; DS; CS |
| 18 | 30.71 | 383 | C21H24N2O5 or C22H20N6O | Unidentified | DZ; control; DS; CS |
| 19 | 30.83 | 335 461 557 | C17H20O7 C22H22O11 C25H34O14 | Unidentified Azalein Peujaponiside or Macrophylloside D | DZ; control; DS; CS |
| 20 | 31.66 | 551 | C28H24O12 | Schizotenuin F | DZ; control; DS; CS |
| 21 | 33.63 | 465 613 | C22H26O11 C29H42O14 | Curculigoside Unidentified | DZ; control; DS; CS |
| 22 | 33.82 | 611 669 765 | C29H40O14 C35H24O14 C48H46O9 | Unidentified S-(+)-skyrin-6-O-alpha- arabinofuranoside Unidentified | control; DS; CS |
| 23 | 34.33 | 449 | C22H26O10 | Auriculoside or 4-methoxyphlorizin | DS; CS |
| 24 | 34.87 | 451 | C23H32O9 | Unidentified | DS; CS |
| 25 | 37.99 | 303 | C16H16O6 | Unidentified | DS |
| 26 | 41.07 | 215 | C13H12O3 | Unidentified | DS |
| Peak No. | Tr | [M–H]- | Molecular Formula | Compound | Sample No. |
|---|---|---|---|---|---|
| 1 | 19.43 | 179 | C9H8O4 | Caffeic acid | DZ, control, DS, CS |
| 2 | 19.78 | 329 341 | C15H22O8 C15H18O9 | Bartsioside Caffeic acid 3-glucoside | control, DS, CS |
| 3 | 21.27 | 431 | C19H28O11 | Zizybeoside I | control, DS, CS |
| 4 | 21.90 | 519 | C29H28O9 | Unidentified | DS, CS |
| 5 | 22.40 | 271 297 299 415 553 | C15H12O5 C16H10O6 C14H12N4O4 C18H24O11 C25H30O14 | Naringenin Irilone or Trifoliol or 3,8-dihydroxy-1-methylanthraquinone-2-caroxylic acid Unidentified Regaloside L or Carbomethoxyferuoyl sorbitol Isoligusrosidic acid or Aquilarisinin | control |
| 6 | 22.69 | 431 483 579 | C18H24O12 C22H28O12 C32H36O10 | Griselinoside Rubinaphthin B Unidentified | control, DS |
| 7 | 23.41 | 373 399 475 519 | C16H22O10 C18H24O10 C23H24O11 C24H24O13 | Unidentified Regaloside Cirsimarin Eujambolin or Purifolin | control, DS, CS |
| 8 | 23.90 | 499 | C22H28O13 | Haploperoside | control, DS |
| 9 | 24.23 | 337 467 509 553 | C16H18O8 C15H32O16 C26H22O11 C27H22O13 | Coumaroylquinic acid I or II Unidentified Unidentified Unidentified | control, DS, CS |
| 10 | 24.57 | 501 597 699 | C24H22O12 C26H30O16 C33H32O17 | Malonyldaidzin Swertiapuniside Unidentified | control, DS, CS |
| 11 | 24.83 | 269 313 627 671 715 | C16H14O4 C17H14O6 C34H28O12 C30H28N2O16 C36H28O16 | Imperatorin Crisimaritin Unidentified Unidentified Dehydrorabdosiin | control, DS, CS |
| 12 | 25.70 | 531 | C38H28O3 | Unidentified | CS |
| 13 | 25.89 | 501 | C22H30O13 | Ferulic acid rutinoside | CS |
| 14 | 26.13 | 547 581 729 | C25H28N2O12 C26H30O15 C36H26O17 | Unidentified Gentiabavaroside or Sophodibenzenoside A Unidentified | DS |
| 15 | 26.63 | 733 | C36H30O17 | Unidentified | CS |
| 16 | 27.26 | 515 581 717 | C26H32N2O9 C26H30O15 C36H30O16 | Strictosidinic acid? Gentiabavaroside or Sophodibenzenoside A Rabdosiin | DZ, control, CS |
| 17 | 27.54 | 436 479 | C25H31N3O4 C22H24O12 | N1,N10-Bis(p-coumaroyl)spermidine | DZ, control, DS, CS |
| 18 | 28.01 | 537 | C27H22O12 | Globoidnan B | DZ, control, DS, CS |
| 19 | 28.17 | 459 879 | C20H28O12 C38H36ON6O19 | Paeonolide or Apiopaeonoside Unidentified | DZ, control, DS, CS |
| 20 | 28.32 | 435 | C20H20O11 | Irisxanthone or Homomangiferin or Swertianolin | DZ, CS |
| 21 | 28.57 | 369 521 715 | C19H16O9 C24H26O13 C36H28O16 or C42H24O11 | Unidentified Rosmarinic acid hexoside Dehydrorabdosiin | DZ, control, DS, CS |
| 22 | 29.14 | 435 | C20H20O11 | Irisxanthone or Homomangiferin or Swertianolin | CS |
| 23 | 29.65 | 359 493 | C18H16O8 C26H22O10 | Rosmarinic acid Salvianolic acid A | DZ, control, DS, CS |
| 24 | 29.71 | 447 627 | C22H24O10 C28H36O16 | Sakuranin or Androechin Piloside A | control, DS |
| 25 | 30.30 | 717 | C36H30O16 | Lithospermic B acid | DZ, control, DS, CS |
| 26 | 30.74 | 383 | C21H24N2O5 | Unidentified | control, DS, CS |
| 27 | 30.83 | 461 | C22H22O11 | Azalein | control, DS, CS |
| 28 | 31.20 | 445 | C22H22O10 | Swertisin or Glycitin or Sissotrin | DZ, control, DS, CS |
| 29 | 31.71 | 551 | C28H24O12 | Schizoteniun F | DZ, control, DS, CS |
| 30 | 32.15 | 493 641 | C26H22O10 C31H30O15 | Dihydrogloboidnan A Unidentified | DS, CS |
| 31 | 32.64 | 311 | C16H8O7 | Unidentified | control, DS, CS |
| 32 | 32.99 | 635 | C38H36O9 | Unidentified | DS, CS |
| 33 | 33.66 | 613 | C29H42O14 | Unidentified | control, DS, CS |
| 34 | 33.90 | 451 765 | C23H32O9 C41H50O14 | Unidentified Unidentified | control, DS, CS |
| 35 | 34.36 | 449 | C22H26O10 | Auriculoside | control, DS, CS |
| 36 | 34.95 | 275 313 451 | C15H16O5 C17H14O6 C23H32O9 | Unidentified Pityrogrammin Unidentified | control, DS, CS |
| Peak No. | Tr | [M–H]- | Molecular Formula | Compound | Sample No. |
|---|---|---|---|---|---|
| 1 | 19.58 | 179 | C9H8O4 | Caffeic acid | DZ, control, DS, CS |
| 2 | 19.91 | 329 341 | C15H22O8 C15H18O9 | Bartsioside Caffeic acid 3-glucoside | control, DS, CS |
| 3 | 21.10 | 431 | C19H28O11 | Zizybeoside I | DZ, control, DS, CS |
| 4 | 21.40 | 499 | C22H28O13 | 4-Methylumbelliferyl-beta-D-lactoside or Haploperoside | DZ, control, DS,CS |
| 5 | 21.97 | 519 | C22H32O14 | Segetoside A | DZ, control, DS, CS |
| 6 | 22.46 | 271 553 | C15H12O5 C25H30O14 | Naringenin Isoligusrosidicacid or Aquilarisinin | control, DS, CS |
| 7 | 22.72 | 483 | C22H28O12 | Rubinaphthin B | control, DS, DC |
| 8 | 23.46 | 443 | C26H20O7 | Artomunoxanthentrione | DZ, control, DS, DC |
| 9 | 23.96 | 499 | C22H28O13 | 4-Methylumbelliferyl-beta-D-lactoside or Haploperoside | control, DS, DC |
| 10 | 24.10 | 509 553 | C26H22O11 C27H22O13 | Pseudonocardone C Unidentified | control, DS, DC |
| 11 | 24.58 | 505 | C21H30O14 | Echisoside | DZ, control, DS, DC |
| 12 | 24.85 | 269 313 627 715 | C16H14O4 C17H14O6 C34H28O12 C36H28O16 | Unidentified Crisimaritin Unidentified Dehydrorabdosiin | DZ, control, DS, DC |
| 13 | 25.95 | 501 | C22H30O13 | Ferulic acid rutinoside | control, DS |
| 14 | 26.13 | 227 547 581 729 | C12H12N4O C30H28O10 C26H30O15 C36H26O17 | Unidentified 3,5-dihydroxyrottlerin Gentiabavaroside or Sophodibenzenoside A Unidentified | control, DS |
| 15 | 26.50 | 733 | C36H30O17 | Unidentified | DZ, control, DS, DC |
| 16 | 26.77 | 439 459 501 534 | C22H32O9 C20H28O12 C22H30O13 C21H17NO7 | Unidentified Paeonolide or Apiopaeonoside Micromelumoside B Unidentified | control, DS |
| 17 | 27.23 | 515 | C31H32O7 | Pannokin A | DZ, control, DS, DC |
| 18 | 27.53 | 436 | C25H31N3O4 | Unidentified | DZ, control, DS, DC |
| 19 | 27.93 | 339 459 537 | C18H12O7 C20H28O12 C27H22O12 | Grevilline B Paeonolide or Apiopaeonoside Globoidnan B | DZ, control, DS, DC |
| 20 | 28.14 | 439(2+) | C60H32O8 | Unidentified | DZ, DS, DC |
| 21 | 28.30 | 435 | C20H20O11 | Irisxanthone or Homomangiferin or Swertianolin | DZ, DS, DC |
| 22 | 28.58 | 359 483 715 | C18H16O8 C22H28O12 C36H28O16 | Irigenin Rubinaphthin B or 3,4-dihydrocatalposide Unidentified | DZ, control, DS, DC |
| 23 | 29.16 | 435 | C20H20O11 | Irisxanthone or Homomangiferin or Swertianolin | DZ, DC |
| 24 | 29.55 | 359 493 537 | C18H16O8 C26H22O10 C27H22O12 | Rosmarinic acid Salvianolic acid A Lithospermic acid | DZ, control, DS, DC |
| 25 | 29.72 | 419 447 449 627 | C20H20O10 C22H24O10 C17H26N2O12 C28H36O16 | Isogentisin 3-O-glucoside Sakuranin or Androechin Unidentified Piloside A | control, DS, DC |
| 26 | 30.17 | 717 | C36H30O16 | Lithospermic B acid | DZ, control, DS, DC |
| 27 | 30.74 | 383 | C26H24O3 | Unidentified | DZ, control, DS, DC |
| 28 | 30.86 | 335 465 497 533 557 611 | C17H20O7 C22H26O11 C16H34O17 C29H26O10 C25H34O14 C27H32O16 | Unidentified Curculigoside Unidentified Unidentified Peujaponiside Hydroxysafflor yellow A | DZ, control, DS, DC |
| 29 | 31.26 | 445 | C22H22O10 | Swertisin or Glycitin or Sissotrin | control, DS, DC |
| 30 | 31.55 | 475 701 | C23H24O11 C35H30N2O14 | Crisimarin or Kakkalidone Unidentified | DC |
| 31 | 31.69 | 551 | C28H24O12 | Schizoteniun F | DZ, control, DS, DC |
| 32 | 32.28 | 320 335 507 539 641 | C31H30O15 C27H44O19 C24H28O12 C25H32O13 C31H30O15 | Unidentified Unidentified Specioside or 10-O-cis-p-Coumaorylcatalpol Oleuropein Unidentified | DS, DC |
| 33 | 32.41 | 465 | C22H26O11 | Curculigoside | DC |
| 34 | 32.59 | 453 | C22H30O19 | Unidentified | DS, DC |
| 35 | 33.67 | 613 | C29H42O14 | Unidentified | DZ, control, DS, DC |
| 36 | 33.90 | 435 451 669 765 | C17H12N10O5 C19H28N6O7 C36H26O14 C41H50O14 | Unidentified Unidentified Unidentified Unidentified | DZ, control, DS, DC |
| 37 | 34.36 | 449 | C22H26O10 | Auriculoside | DZ, control, DS, DC |
| 38 | 34.57 | 463 | C22H24O11 | Lanceolin or Scuteamoenoside | DZ, control, DS, DC |
| 39 | 34.91 | 451 | C23H32O9 | Unidentified | DZ, control, DS, DC |
| 40 | 38.01 | 303 479 543 | C16H16O6 C23H28O11 C29H36O10 | 3‘-O-Methylcatechin Unidentified Unidentified | DZ, control, DS, DC |
Publisher’s Note: MDPI stays neutral with regard to jurisdictional claims in published maps and institutional affiliations. |
© 2022 by the authors. Licensee MDPI, Basel, Switzerland. This article is an open access article distributed under the terms and conditions of the Creative Commons Attribution (CC BY) license (https://creativecommons.org/licenses/by/4.0/).
Share and Cite
Naliwajski, M.R.; Wileńska, B.; Misicka, A.; Pietrosiuk, A.; Sykłowska-Baranek, K. HPLC-PDA-ESI-HRMS-Based Profiling of Secondary Metabolites of Rindera graeca Anatomical and Hairy Roots Treated with Drought and Cold Stress. Cells 2022, 11, 931. https://doi.org/10.3390/cells11060931
Naliwajski MR, Wileńska B, Misicka A, Pietrosiuk A, Sykłowska-Baranek K. HPLC-PDA-ESI-HRMS-Based Profiling of Secondary Metabolites of Rindera graeca Anatomical and Hairy Roots Treated with Drought and Cold Stress. Cells. 2022; 11(6):931. https://doi.org/10.3390/cells11060931
Chicago/Turabian StyleNaliwajski, Marcin Robert, Beata Wileńska, Aleksandra Misicka, Agnieszka Pietrosiuk, and Katarzyna Sykłowska-Baranek. 2022. "HPLC-PDA-ESI-HRMS-Based Profiling of Secondary Metabolites of Rindera graeca Anatomical and Hairy Roots Treated with Drought and Cold Stress" Cells 11, no. 6: 931. https://doi.org/10.3390/cells11060931
APA StyleNaliwajski, M. R., Wileńska, B., Misicka, A., Pietrosiuk, A., & Sykłowska-Baranek, K. (2022). HPLC-PDA-ESI-HRMS-Based Profiling of Secondary Metabolites of Rindera graeca Anatomical and Hairy Roots Treated with Drought and Cold Stress. Cells, 11(6), 931. https://doi.org/10.3390/cells11060931