
Investigation of Colonic Regeneration via Precise Damage Application Using Femtosecond Laser-Based Nanosurgery

 , , ,
, , , 
Abstract
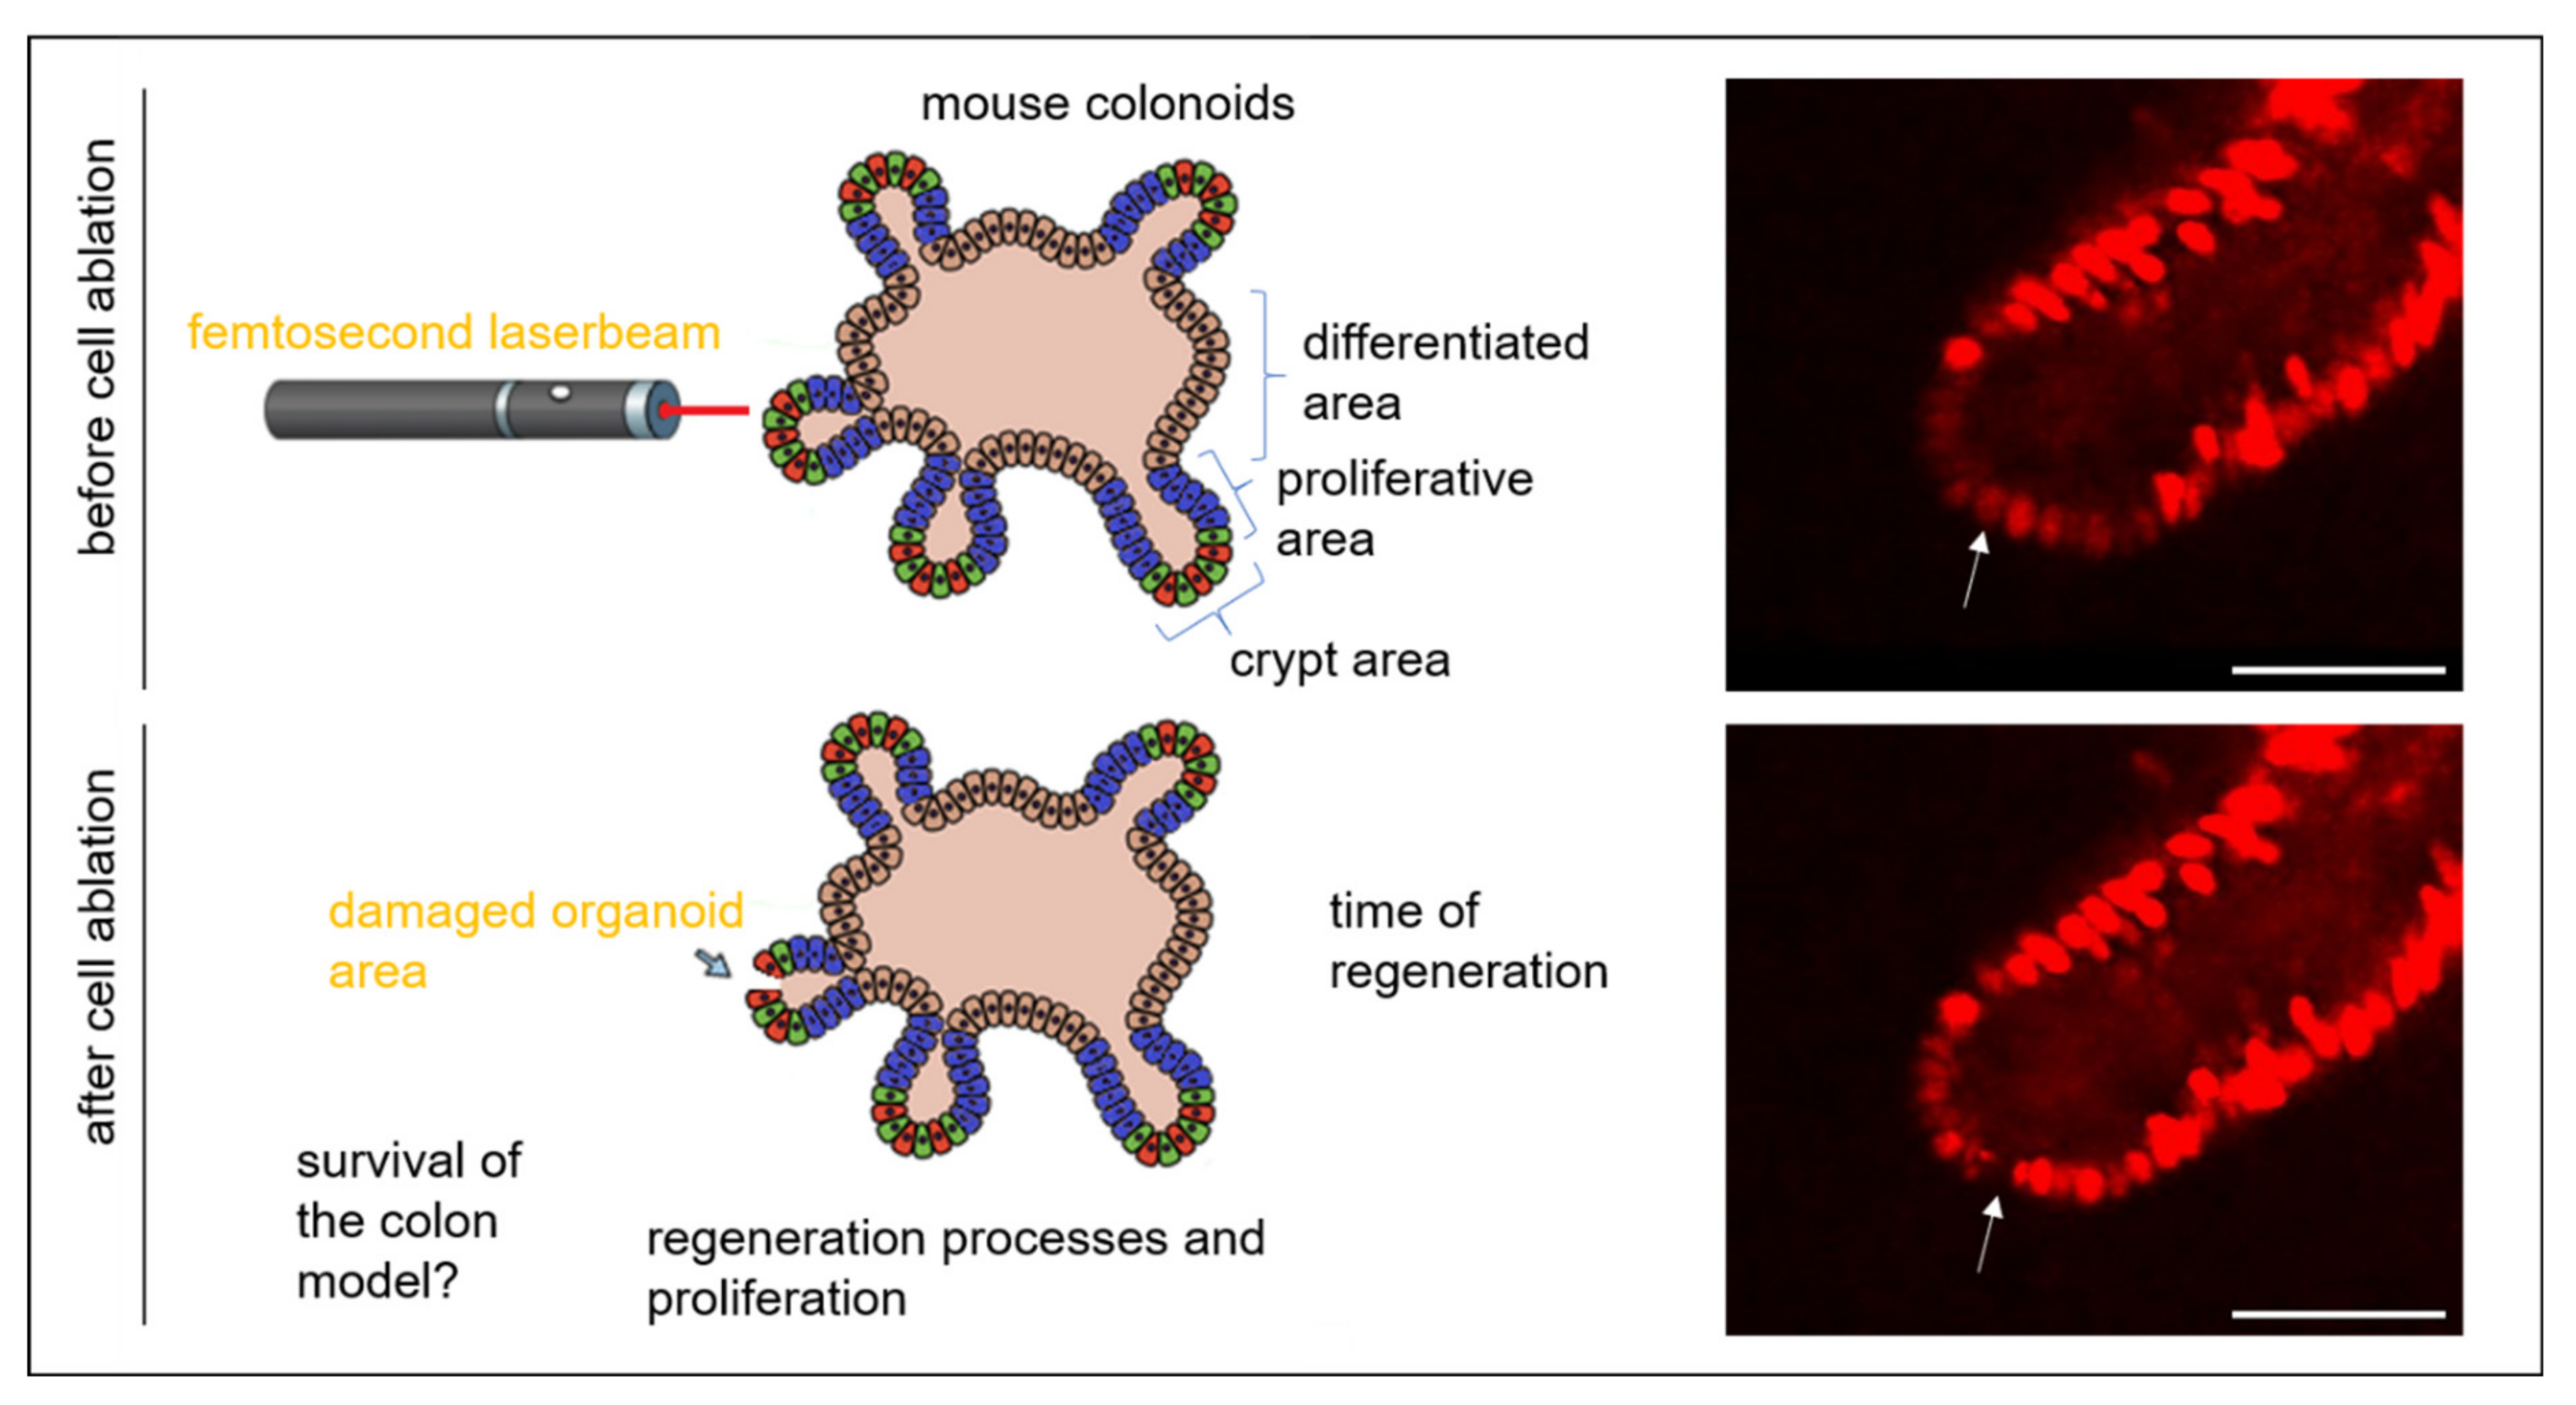
:1. Introduction
2. Materials and Methods
2.1. Isolation and Preparation of Colonoids
2.2. Colonoid Culture and Transduction
2.3. Laser Setup, Imaging, and Manipulation
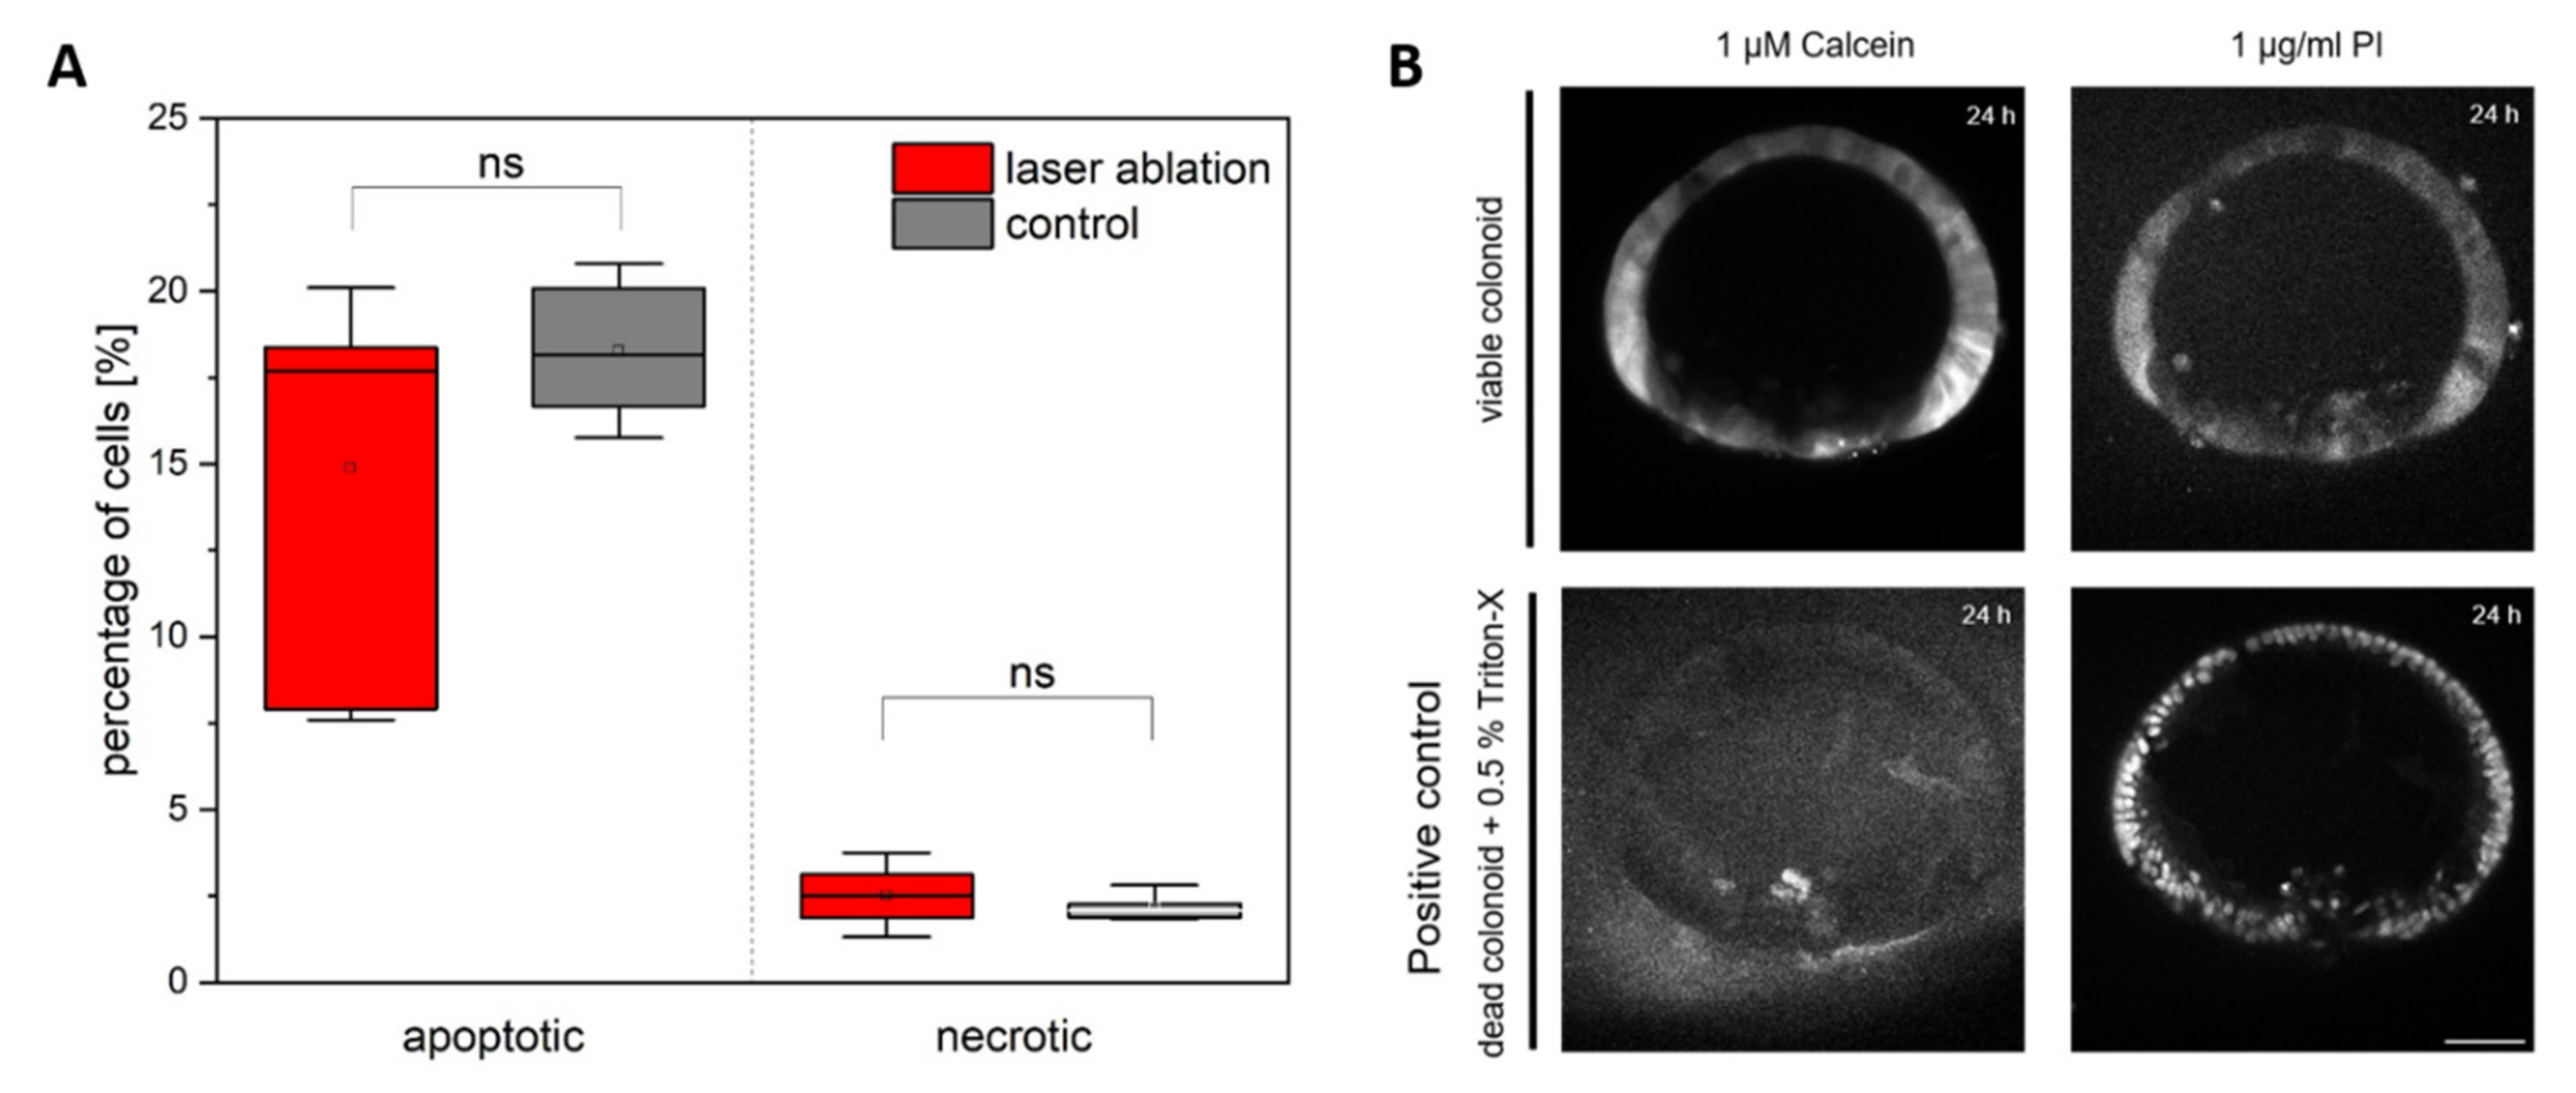
2.4. Analysis of Cell Viability and Cell Proliferation
2.5. RT-qPCR
2.6. Image Analysis and Statistics
3. Results and Discussion
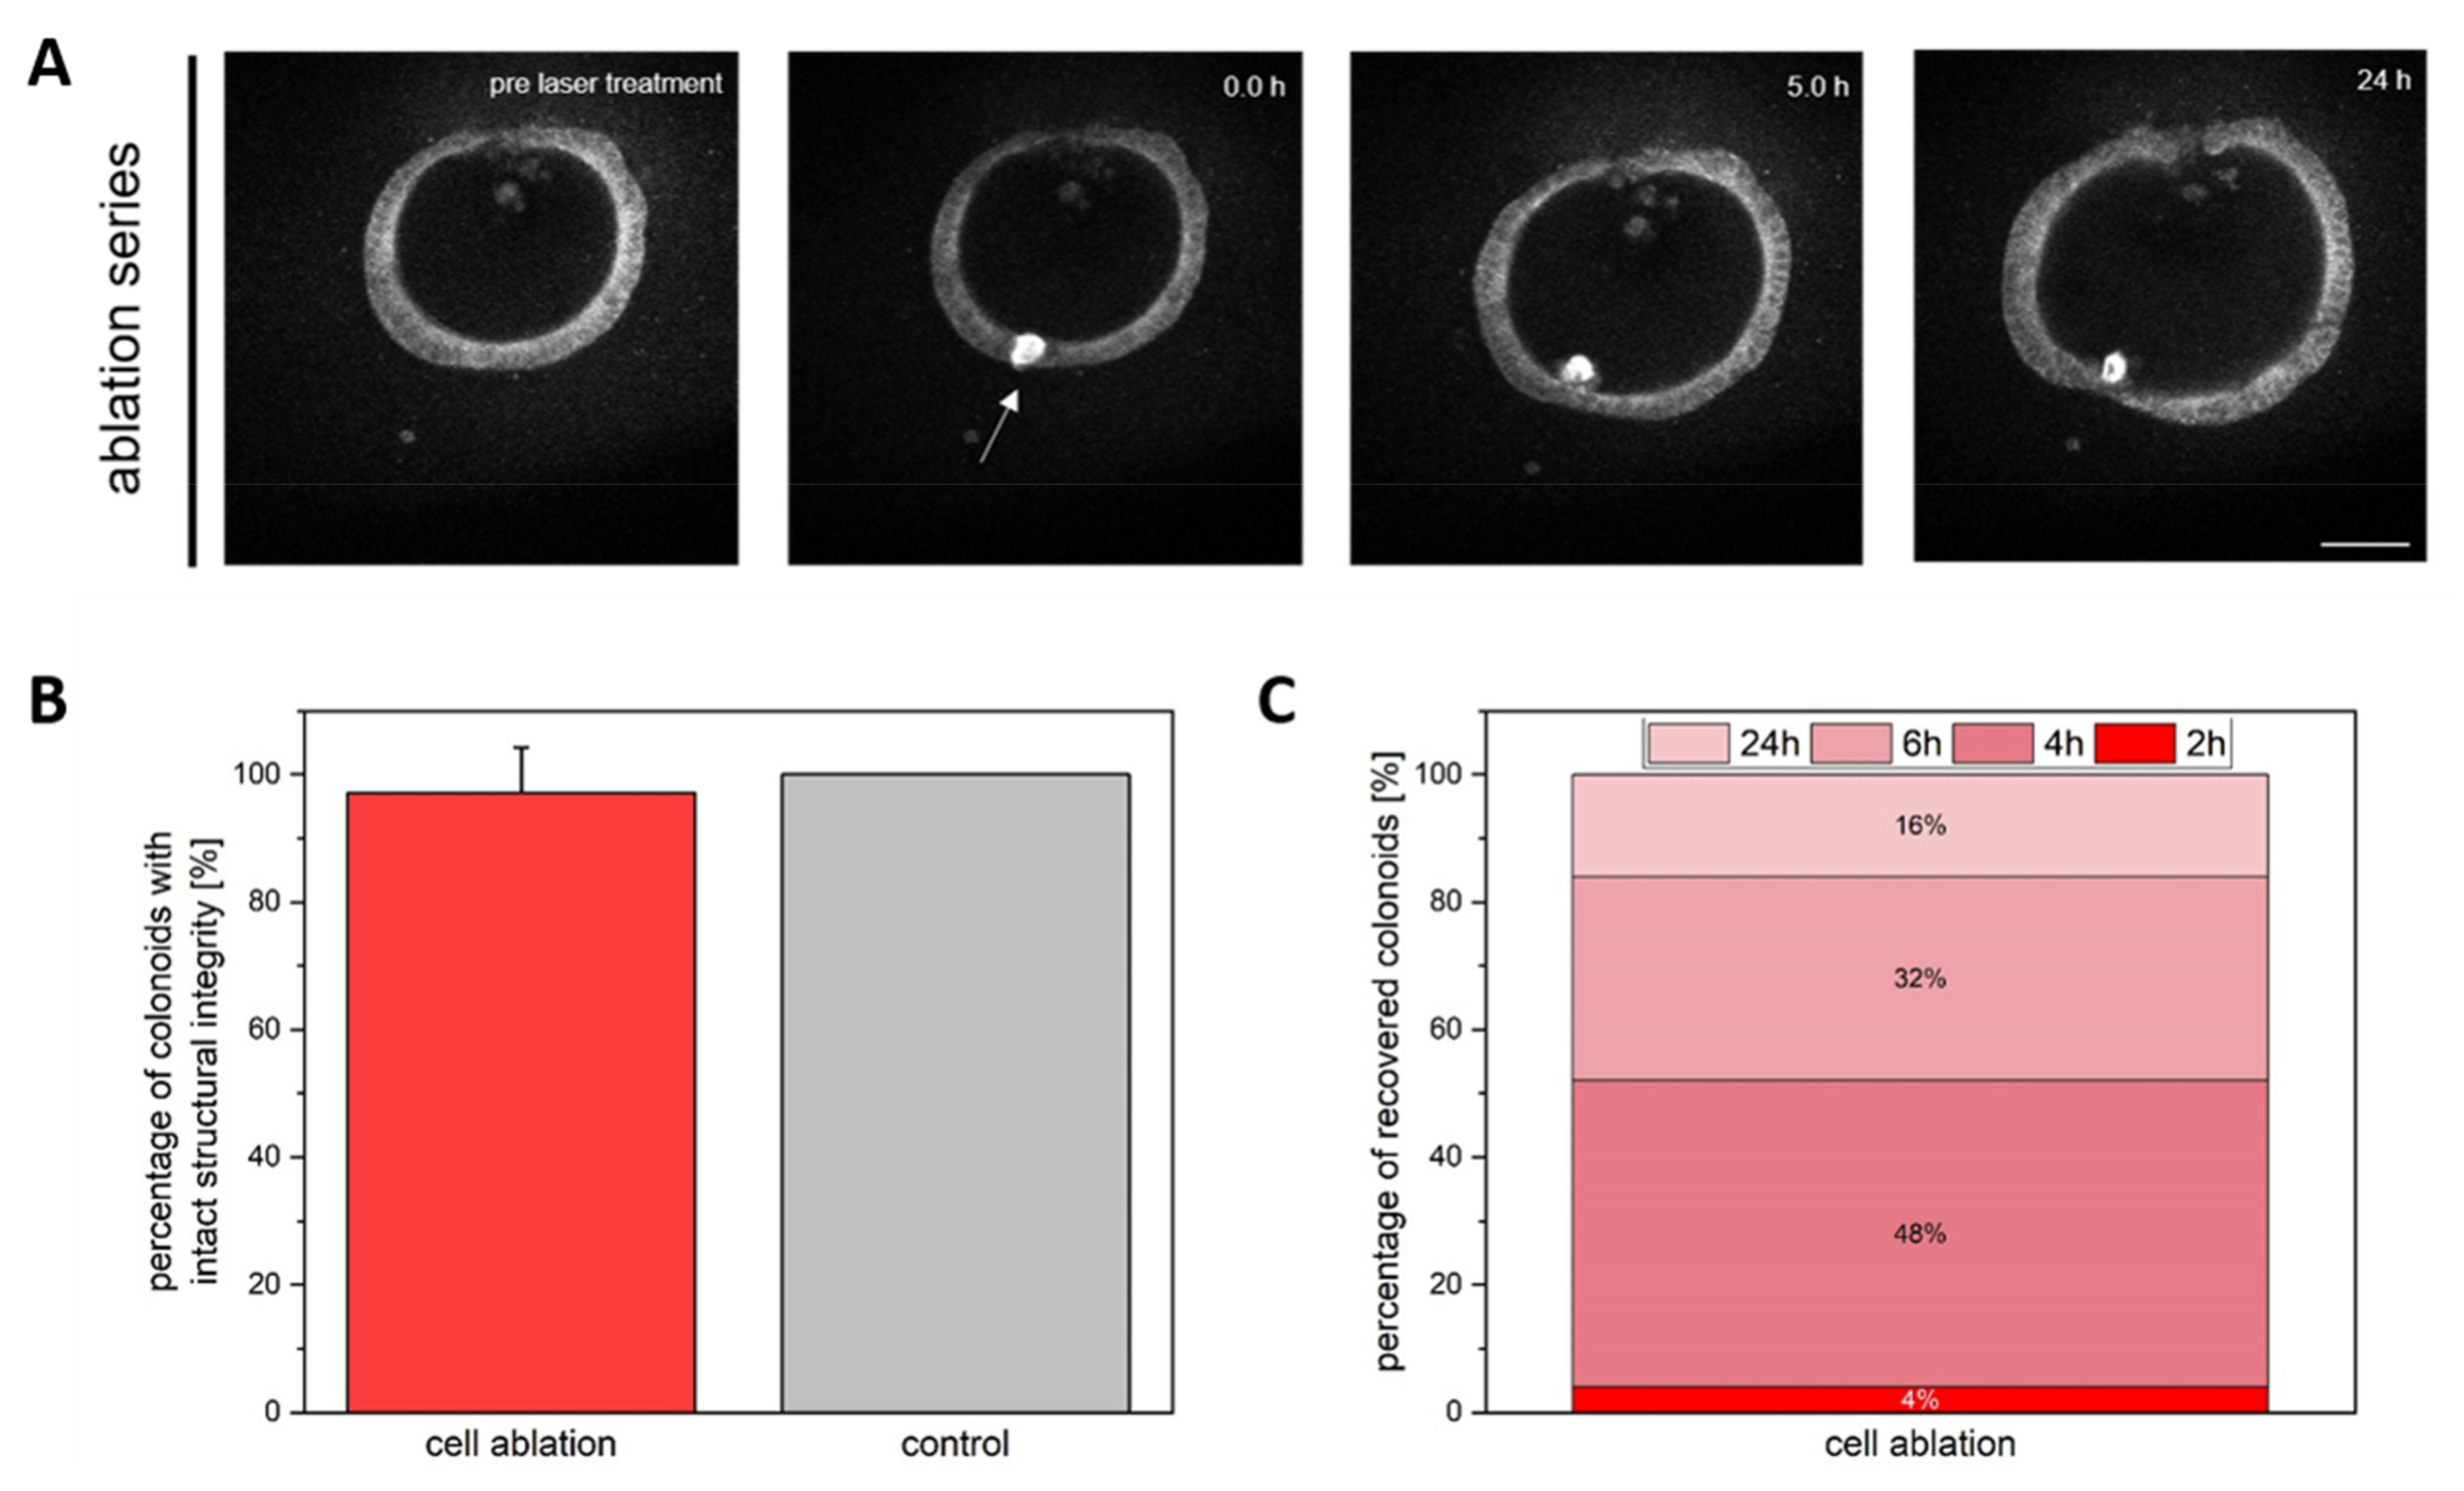
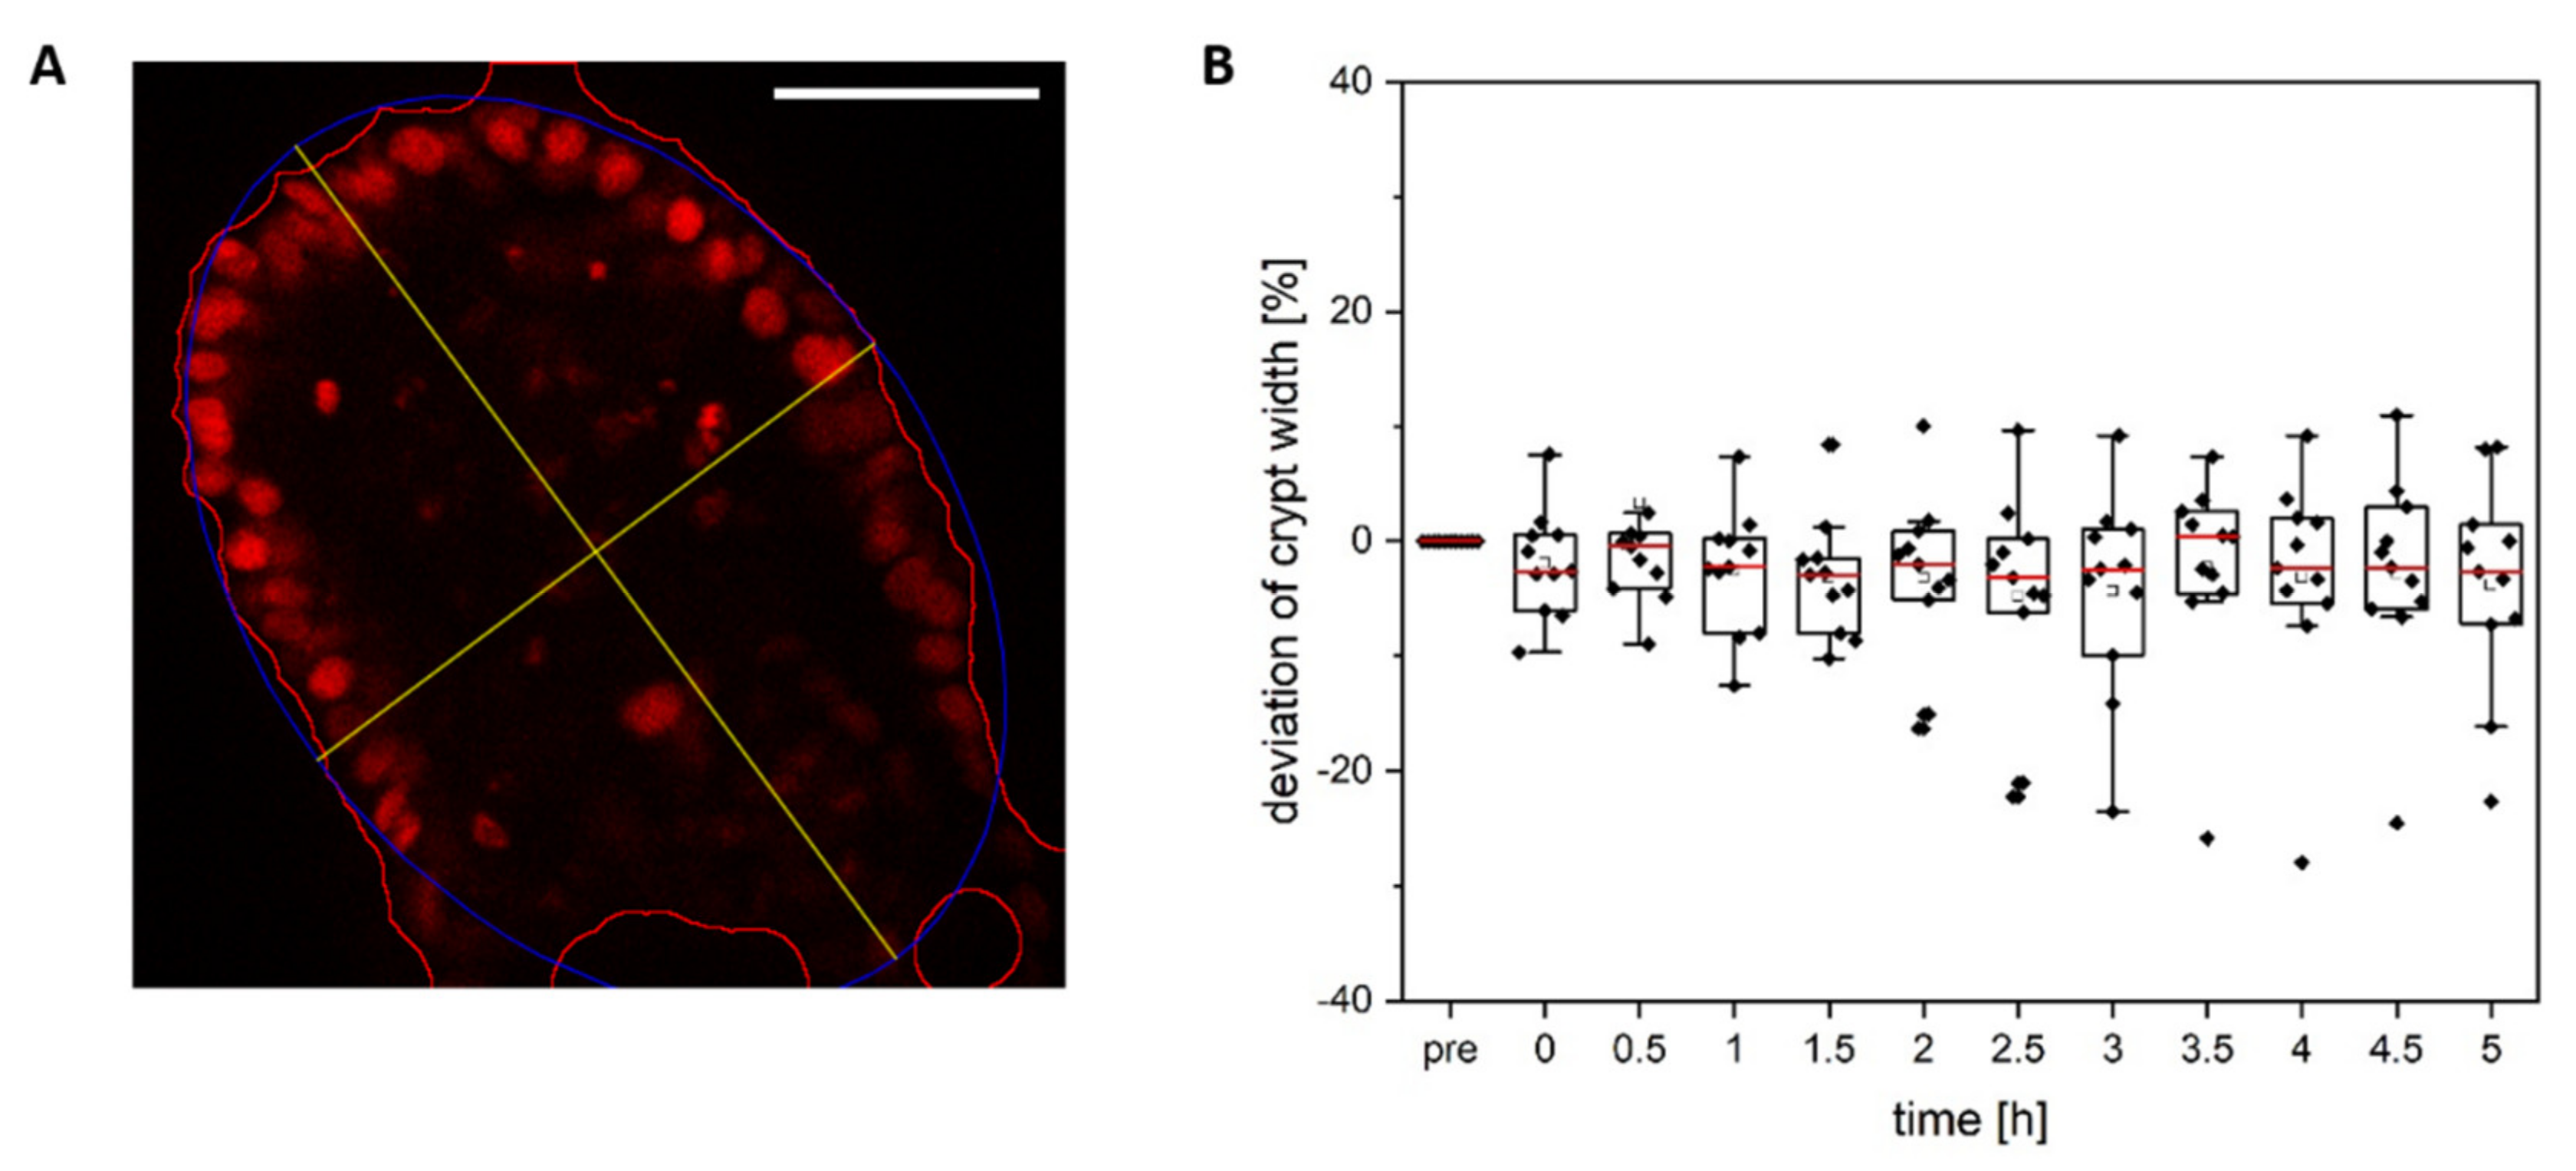
3.1. Colonoid Viability Is Unaffected by Cell Ablation
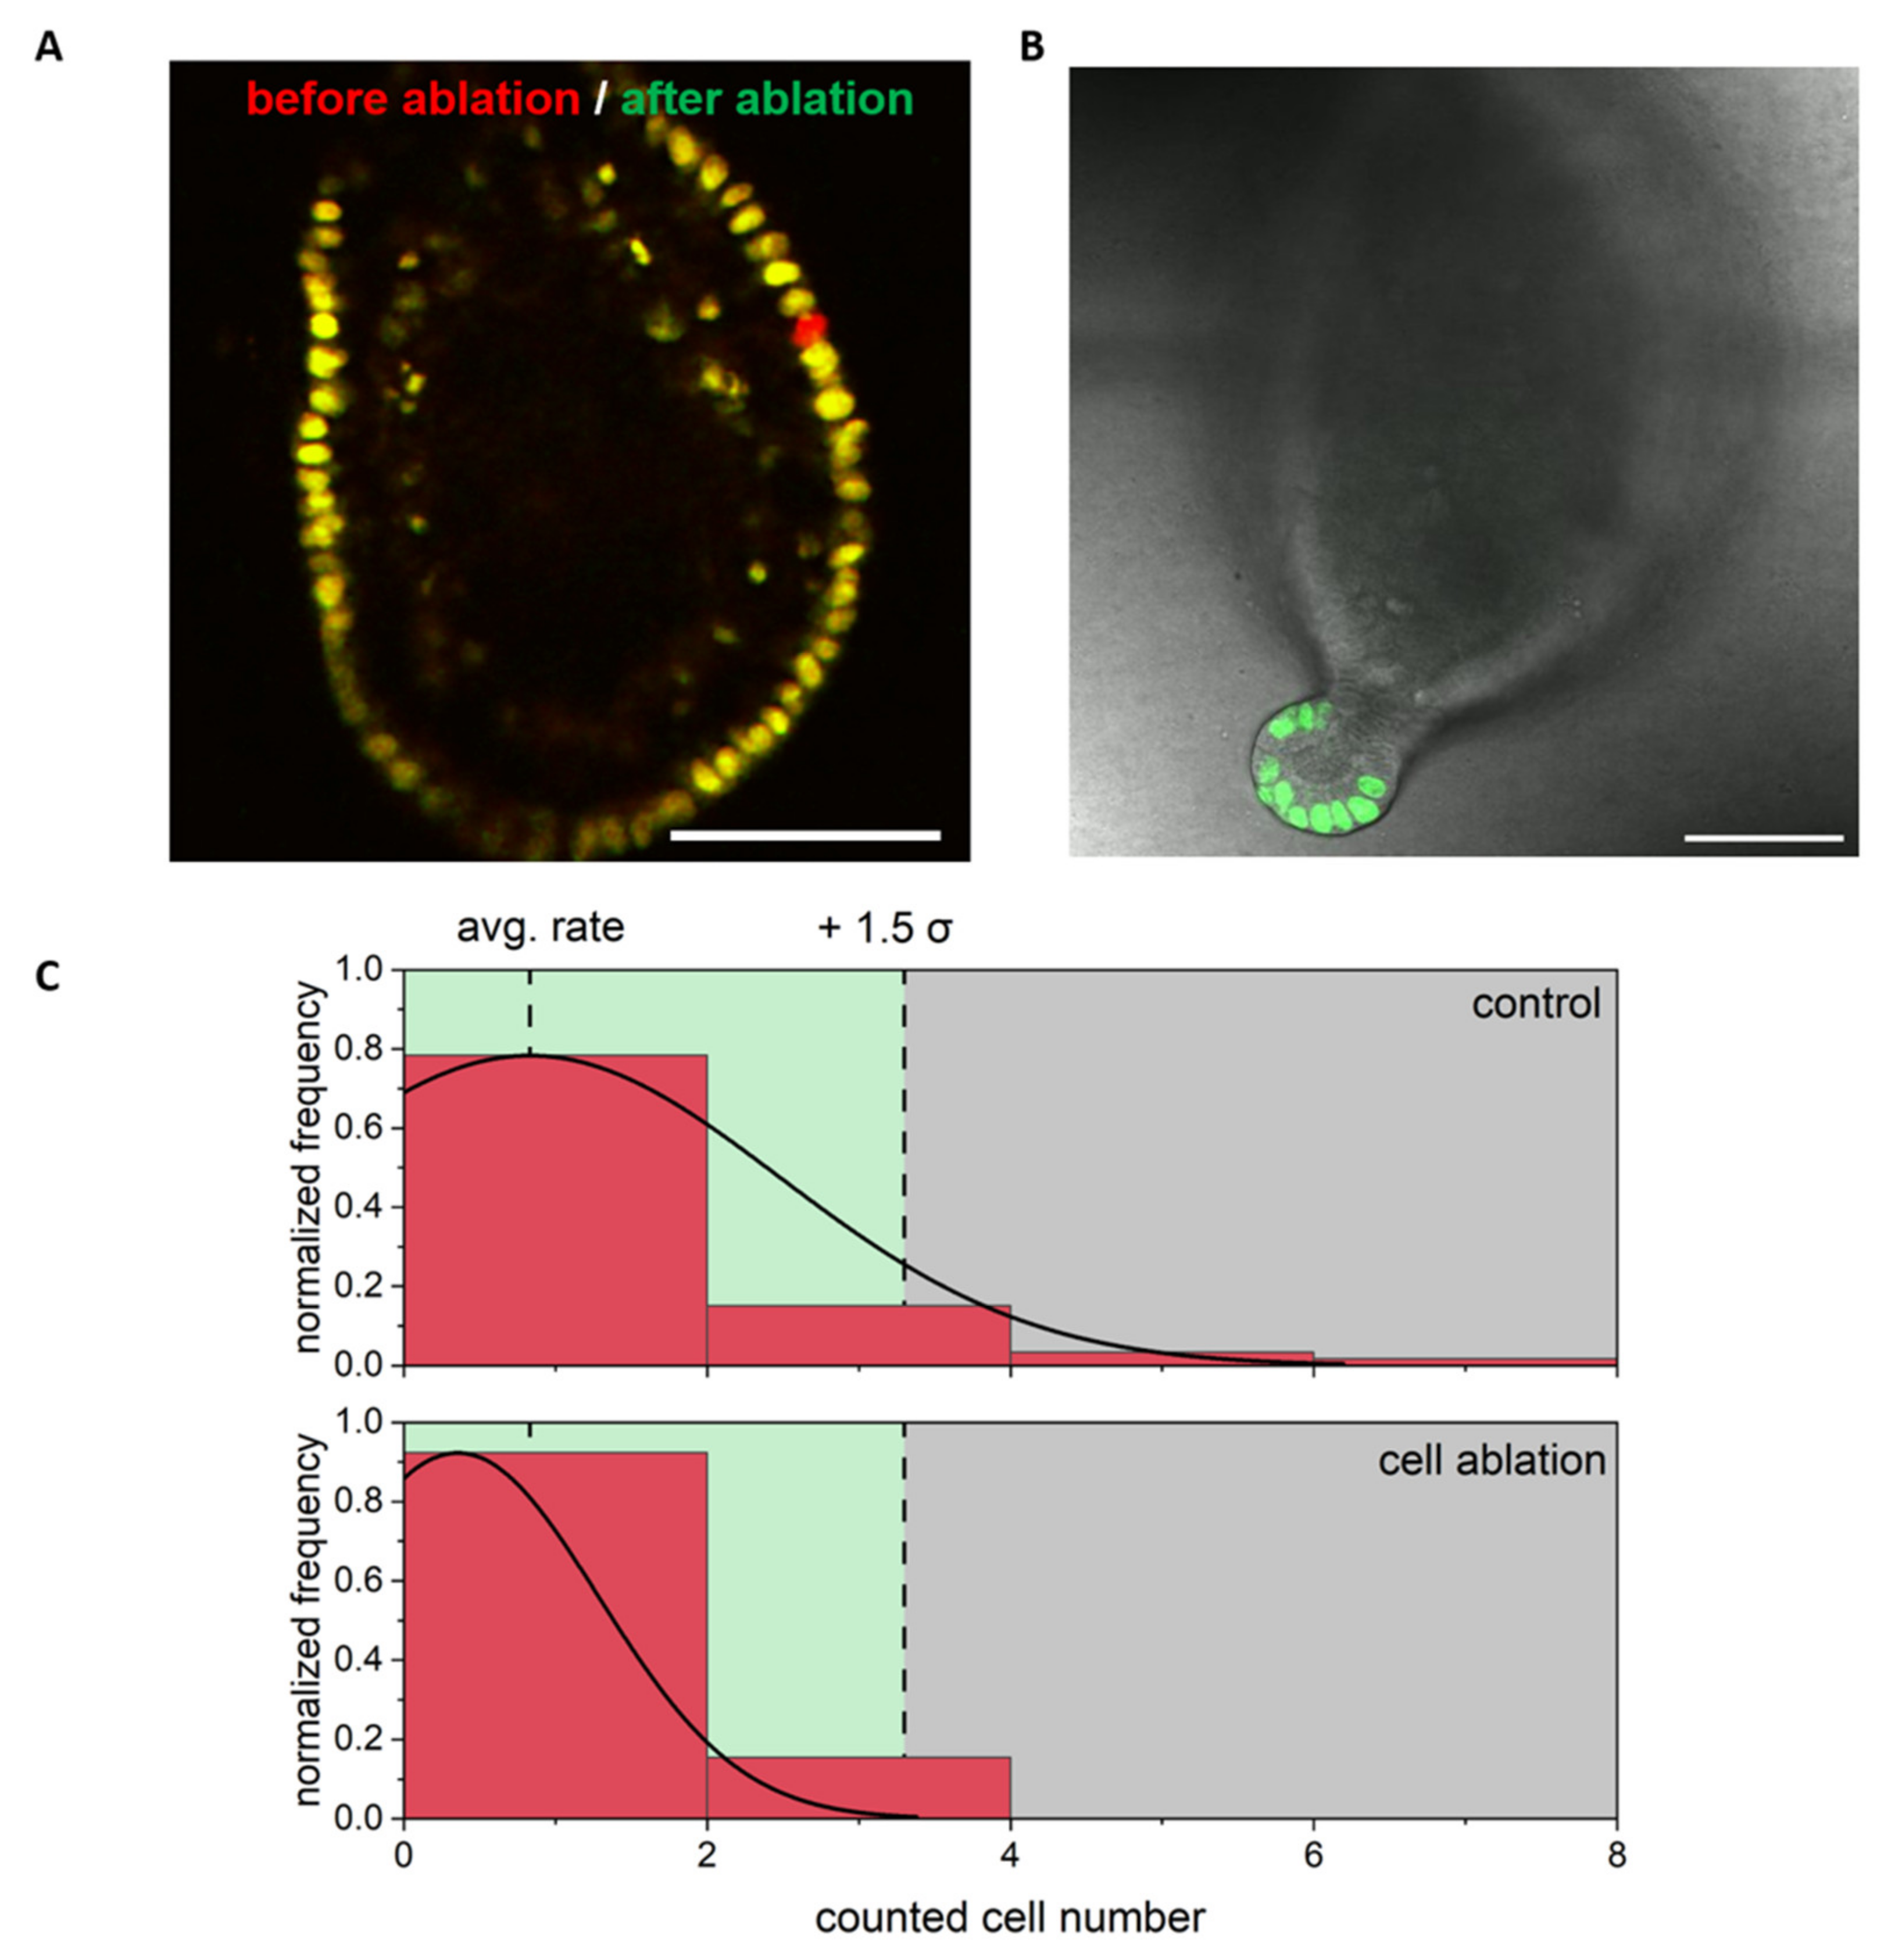
3.2. Single Cell Ablation Did Not Increase Proliferation in the Differentiated Zone of Colonoids
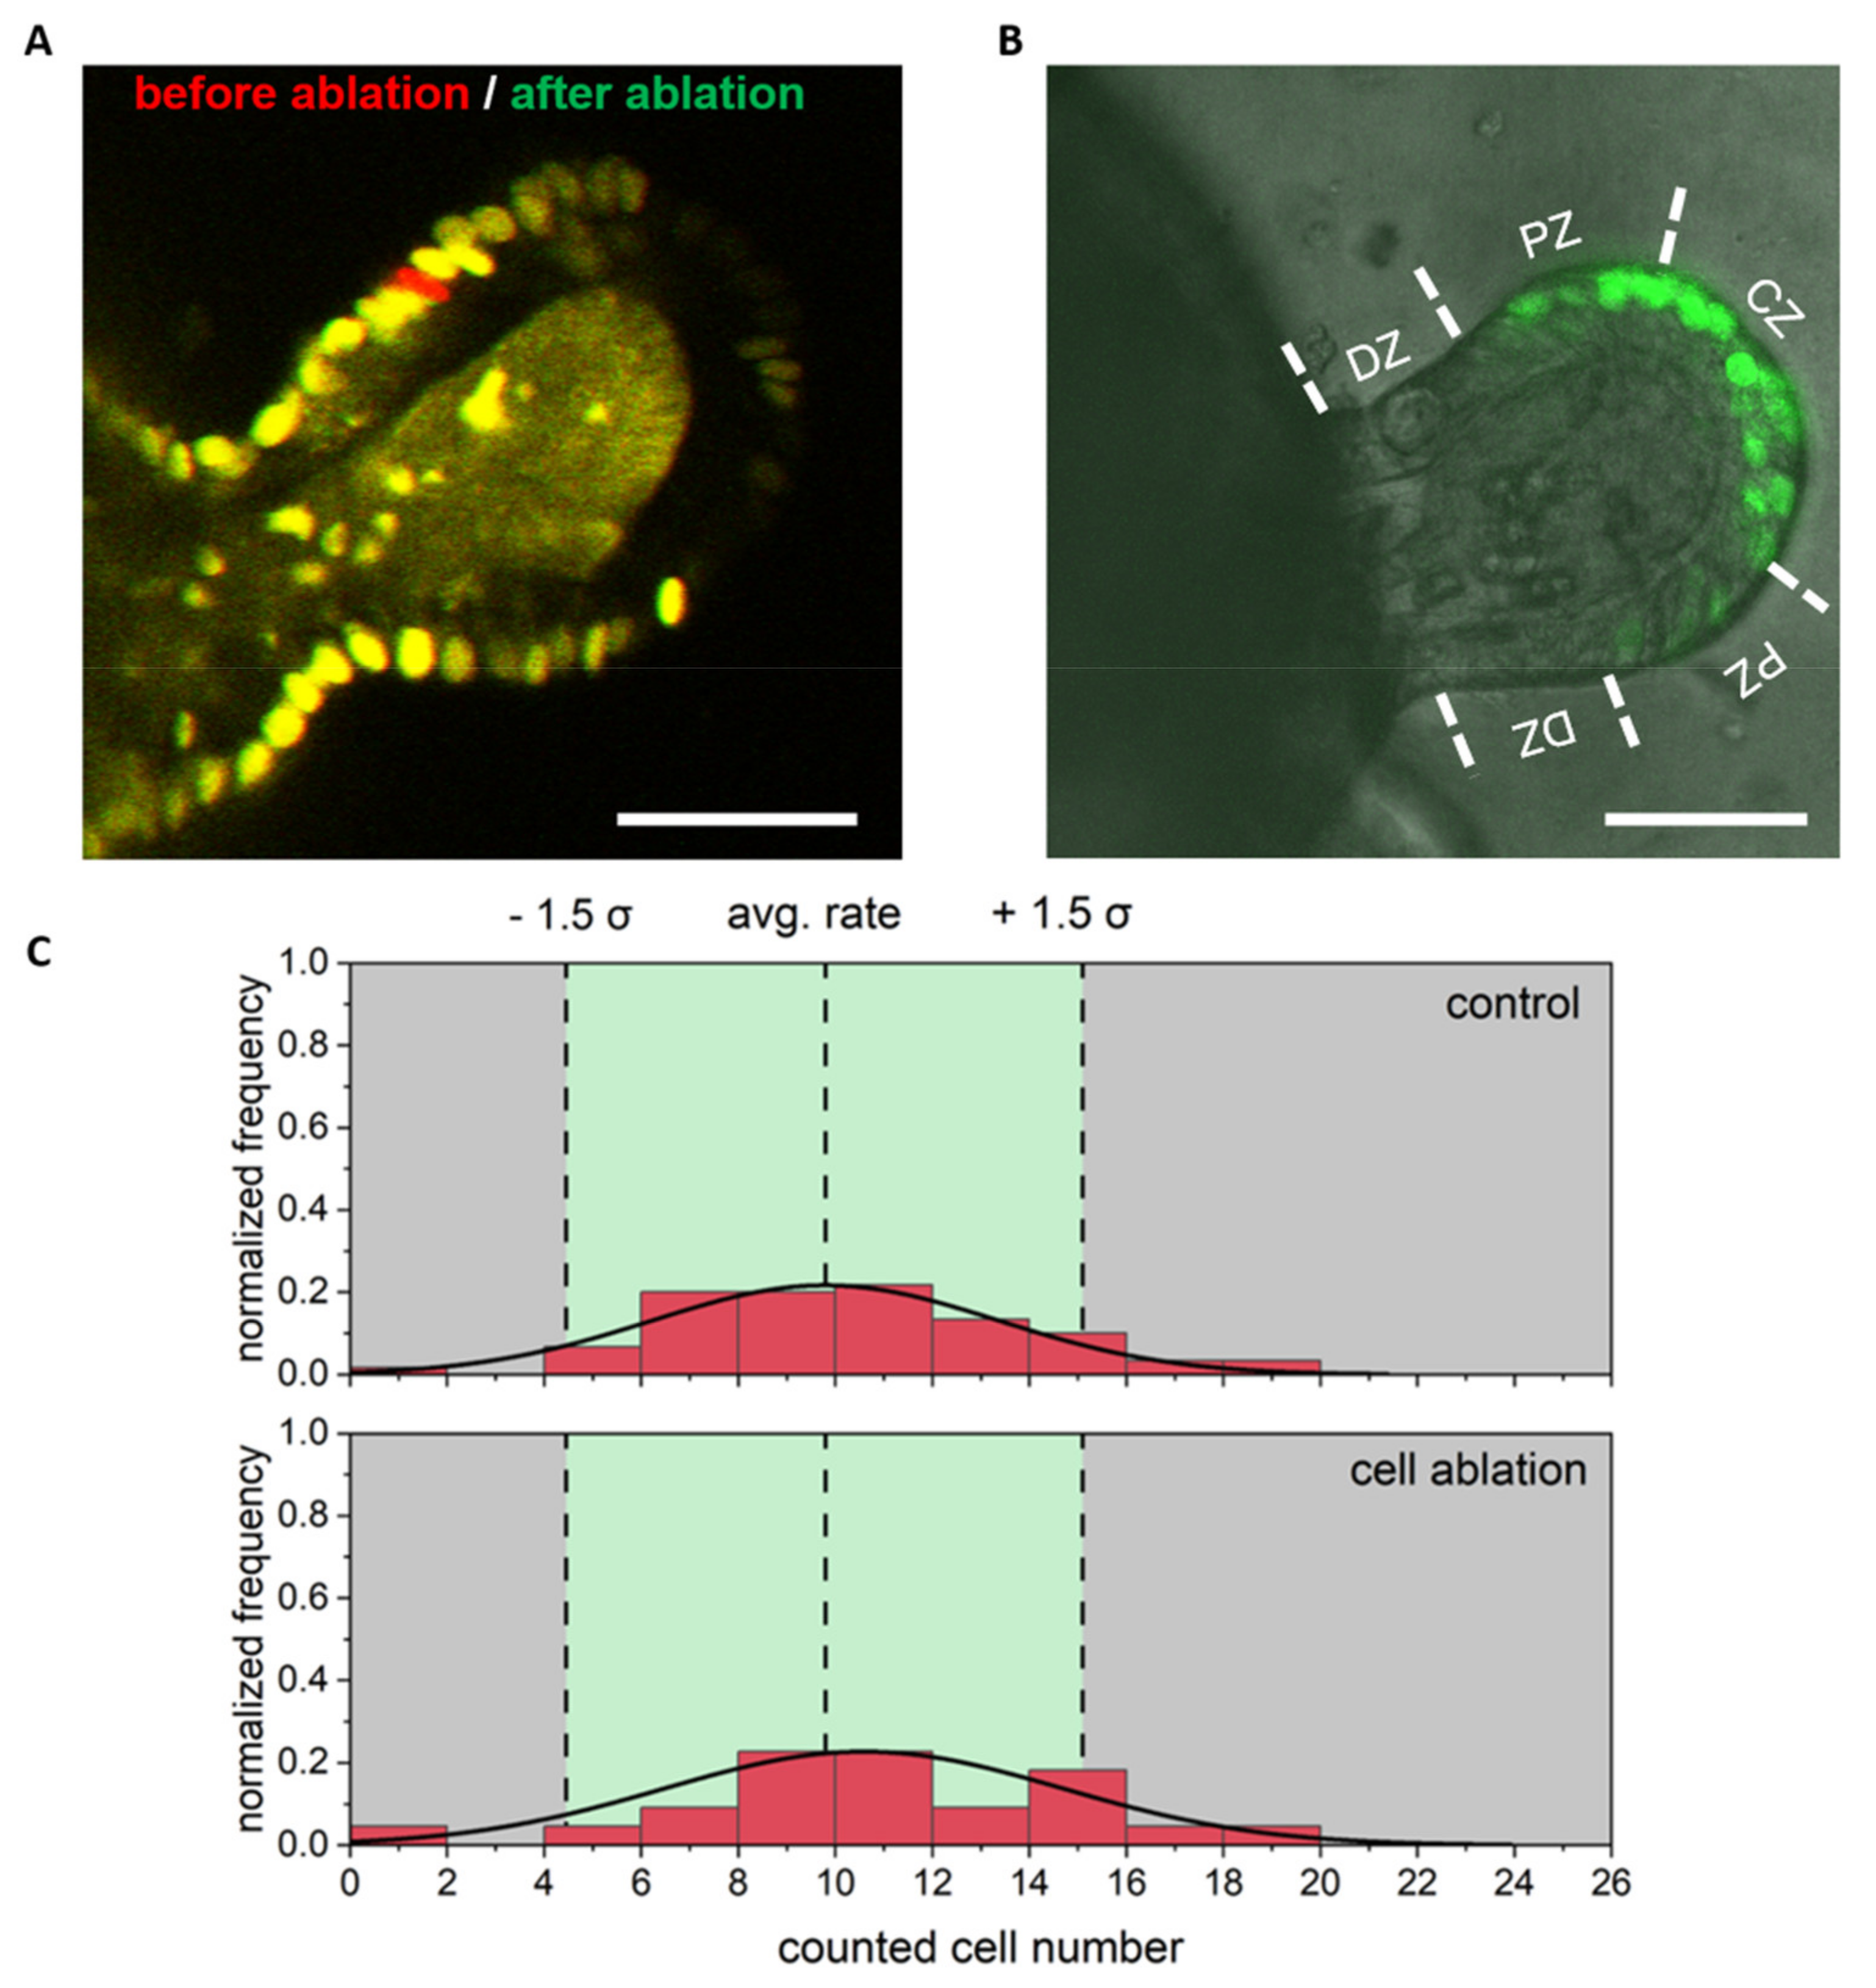
3.3. Single Cell Ablation Did Not Increase Proliferation in the Proliferative Zone of Colonoids
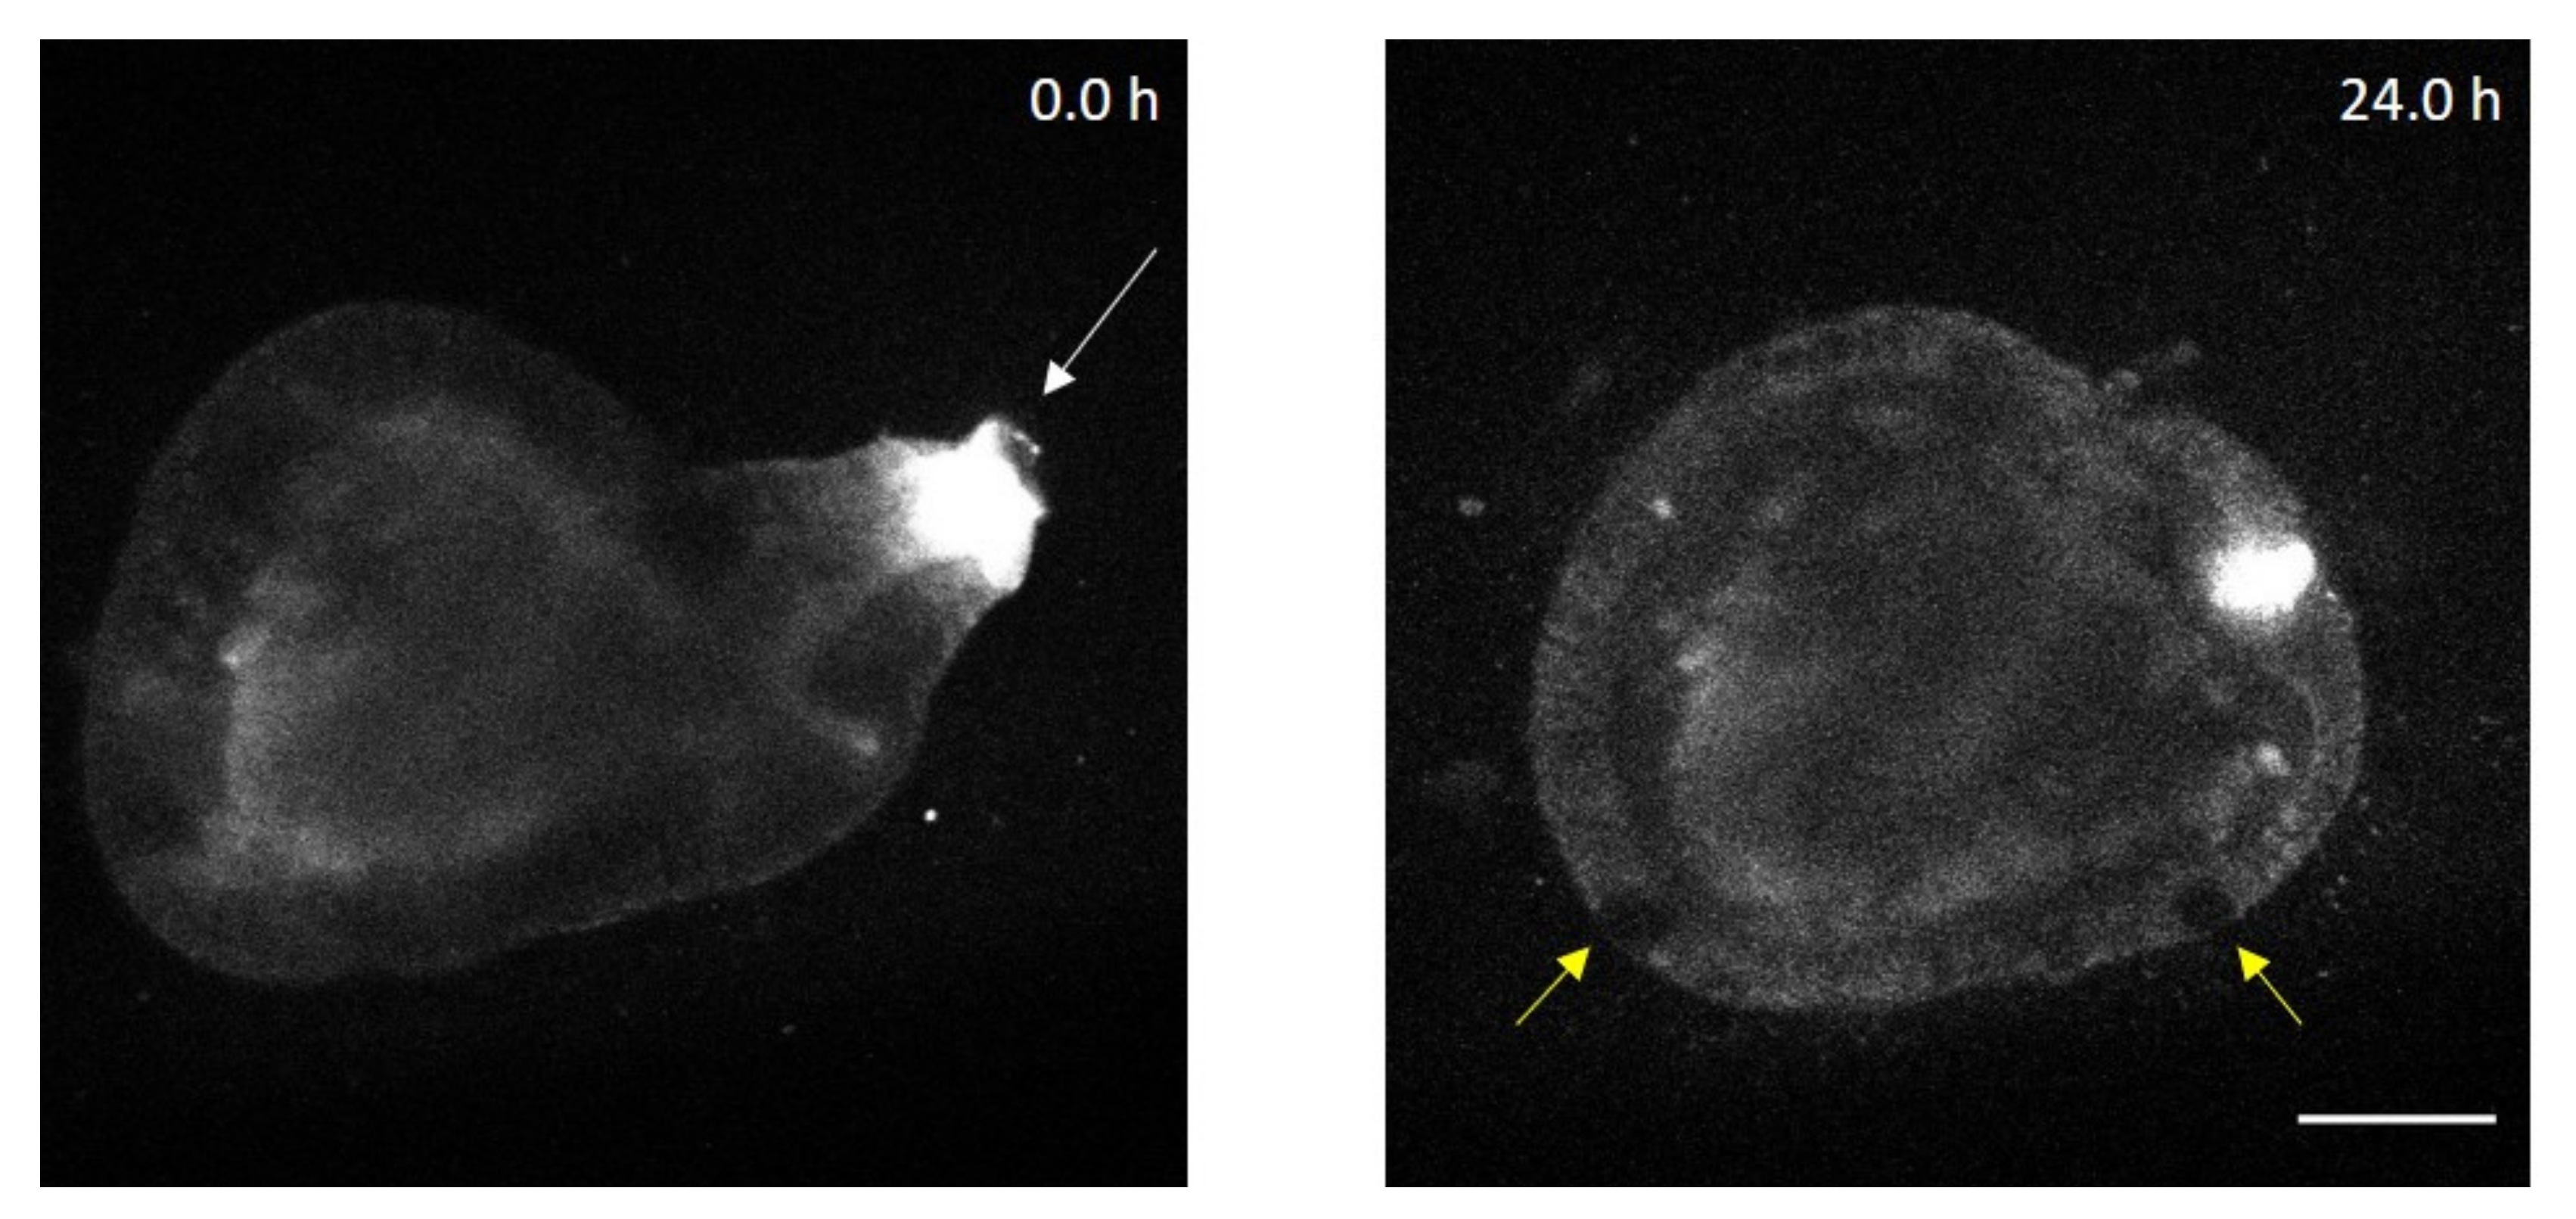
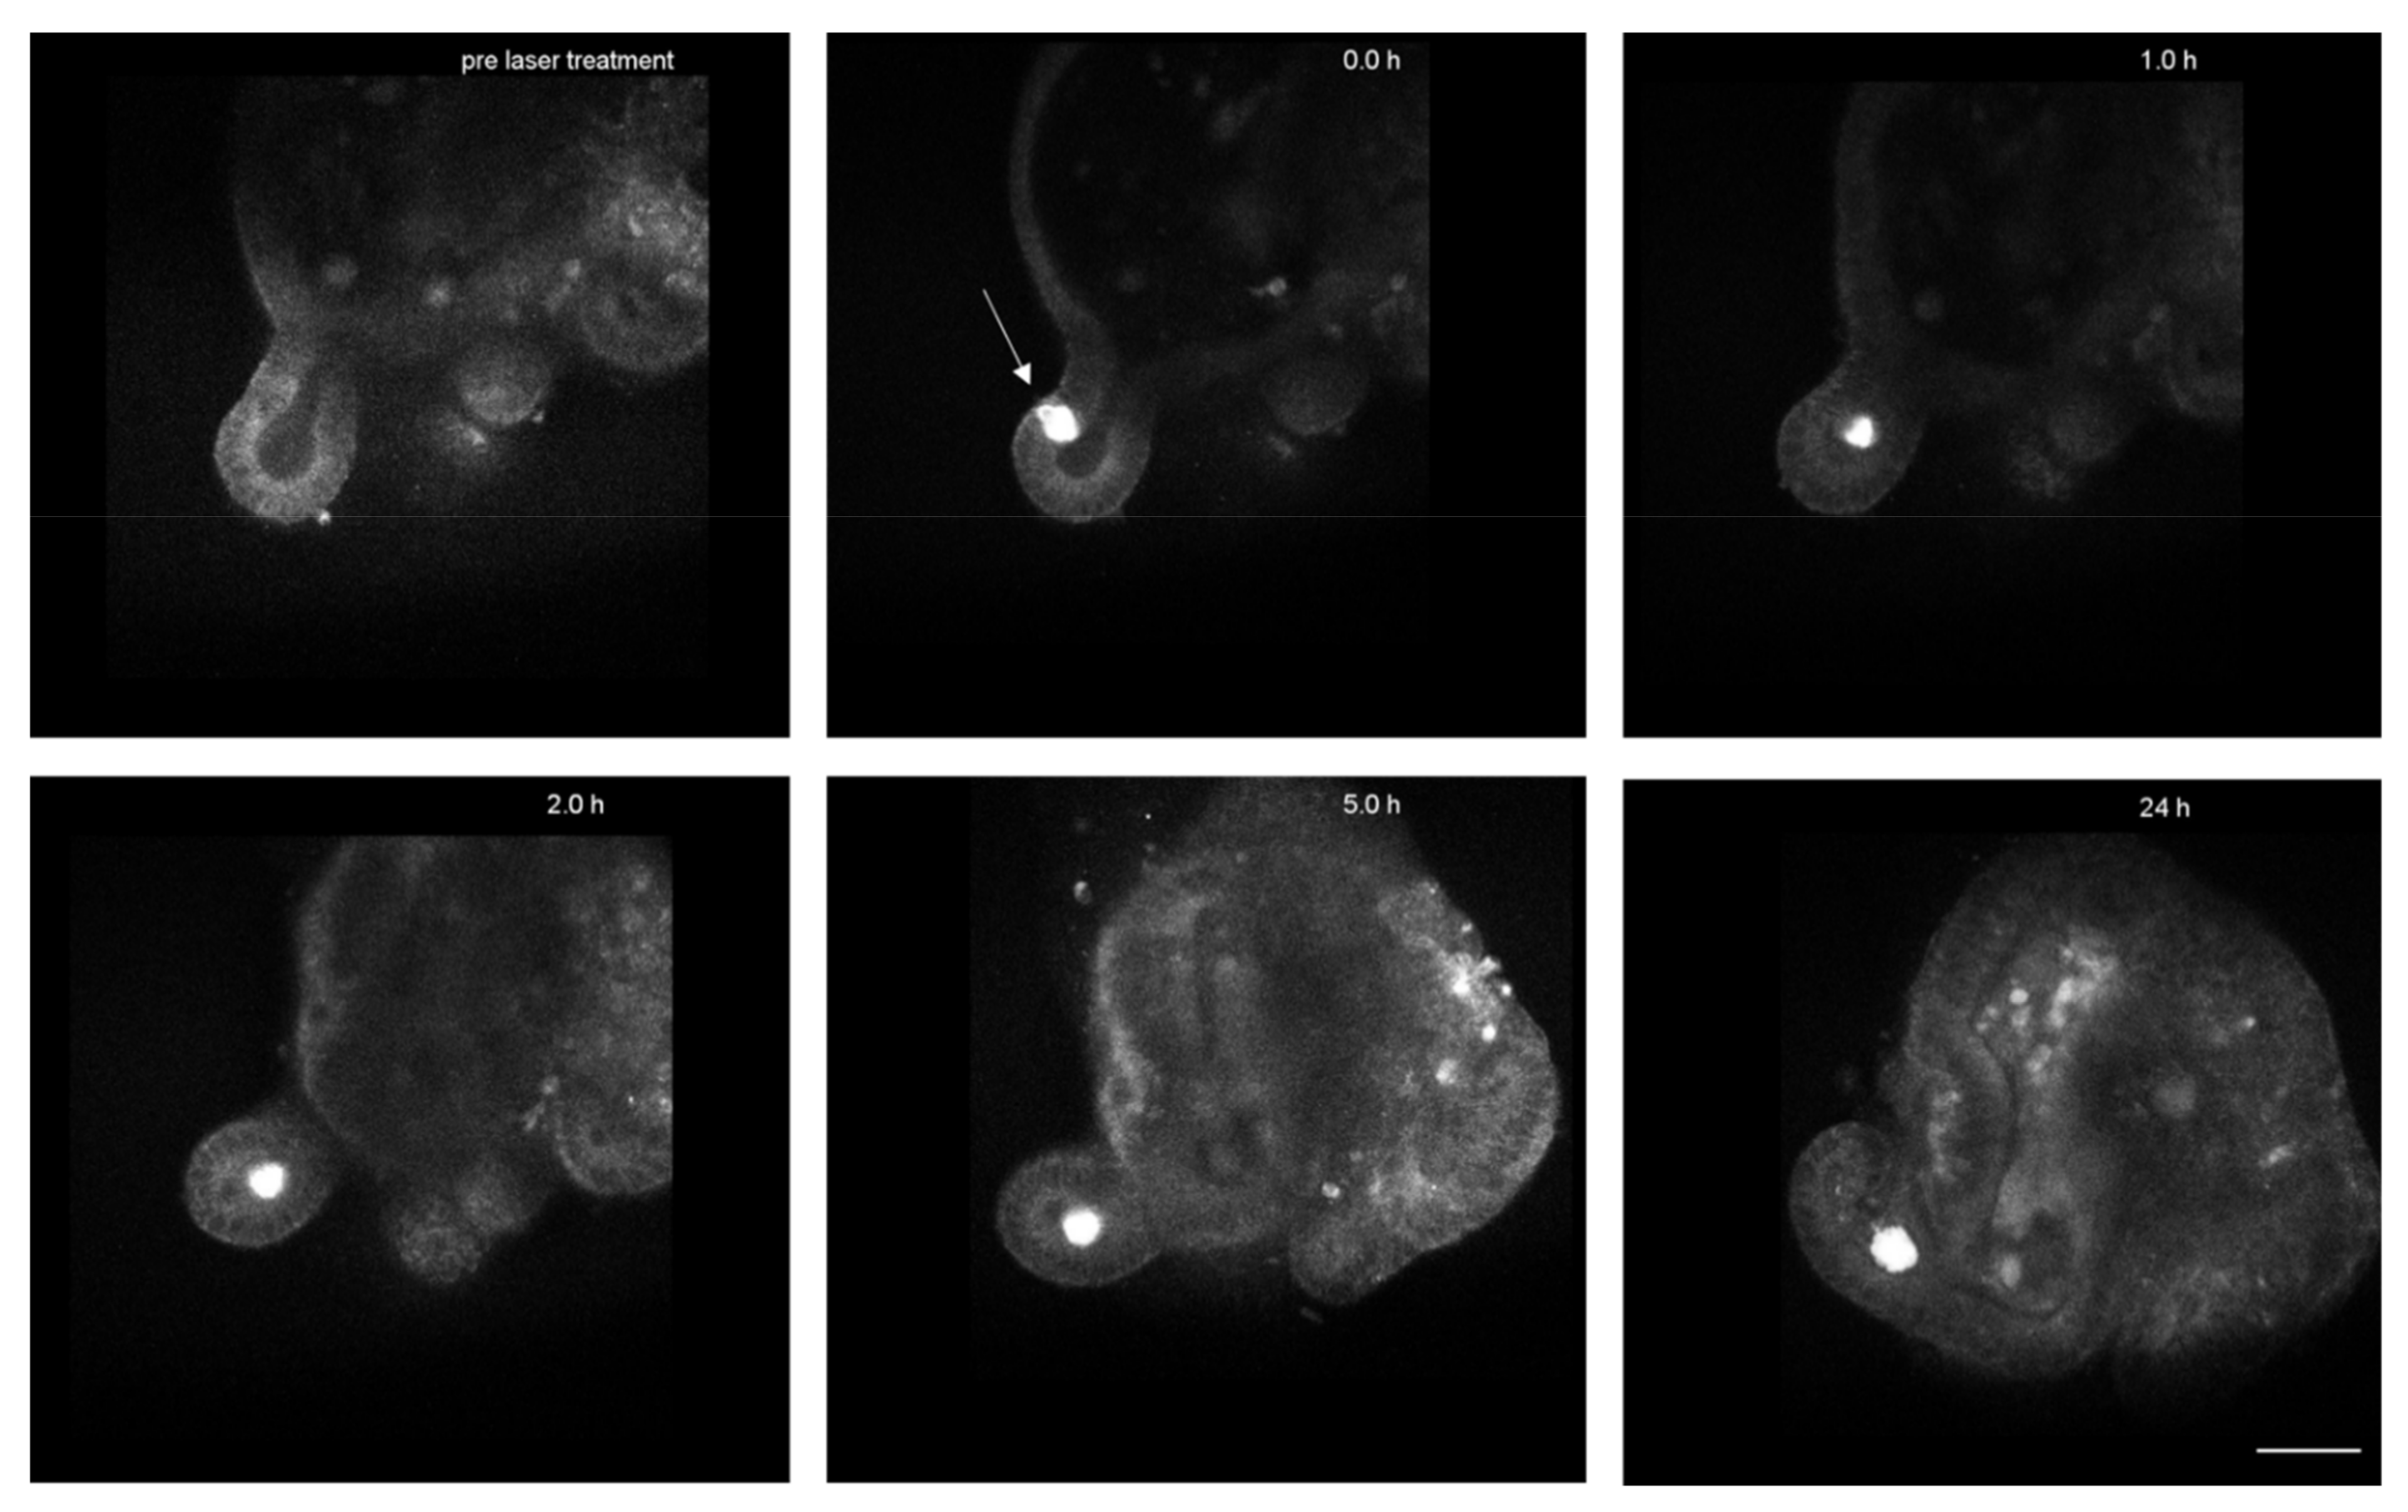
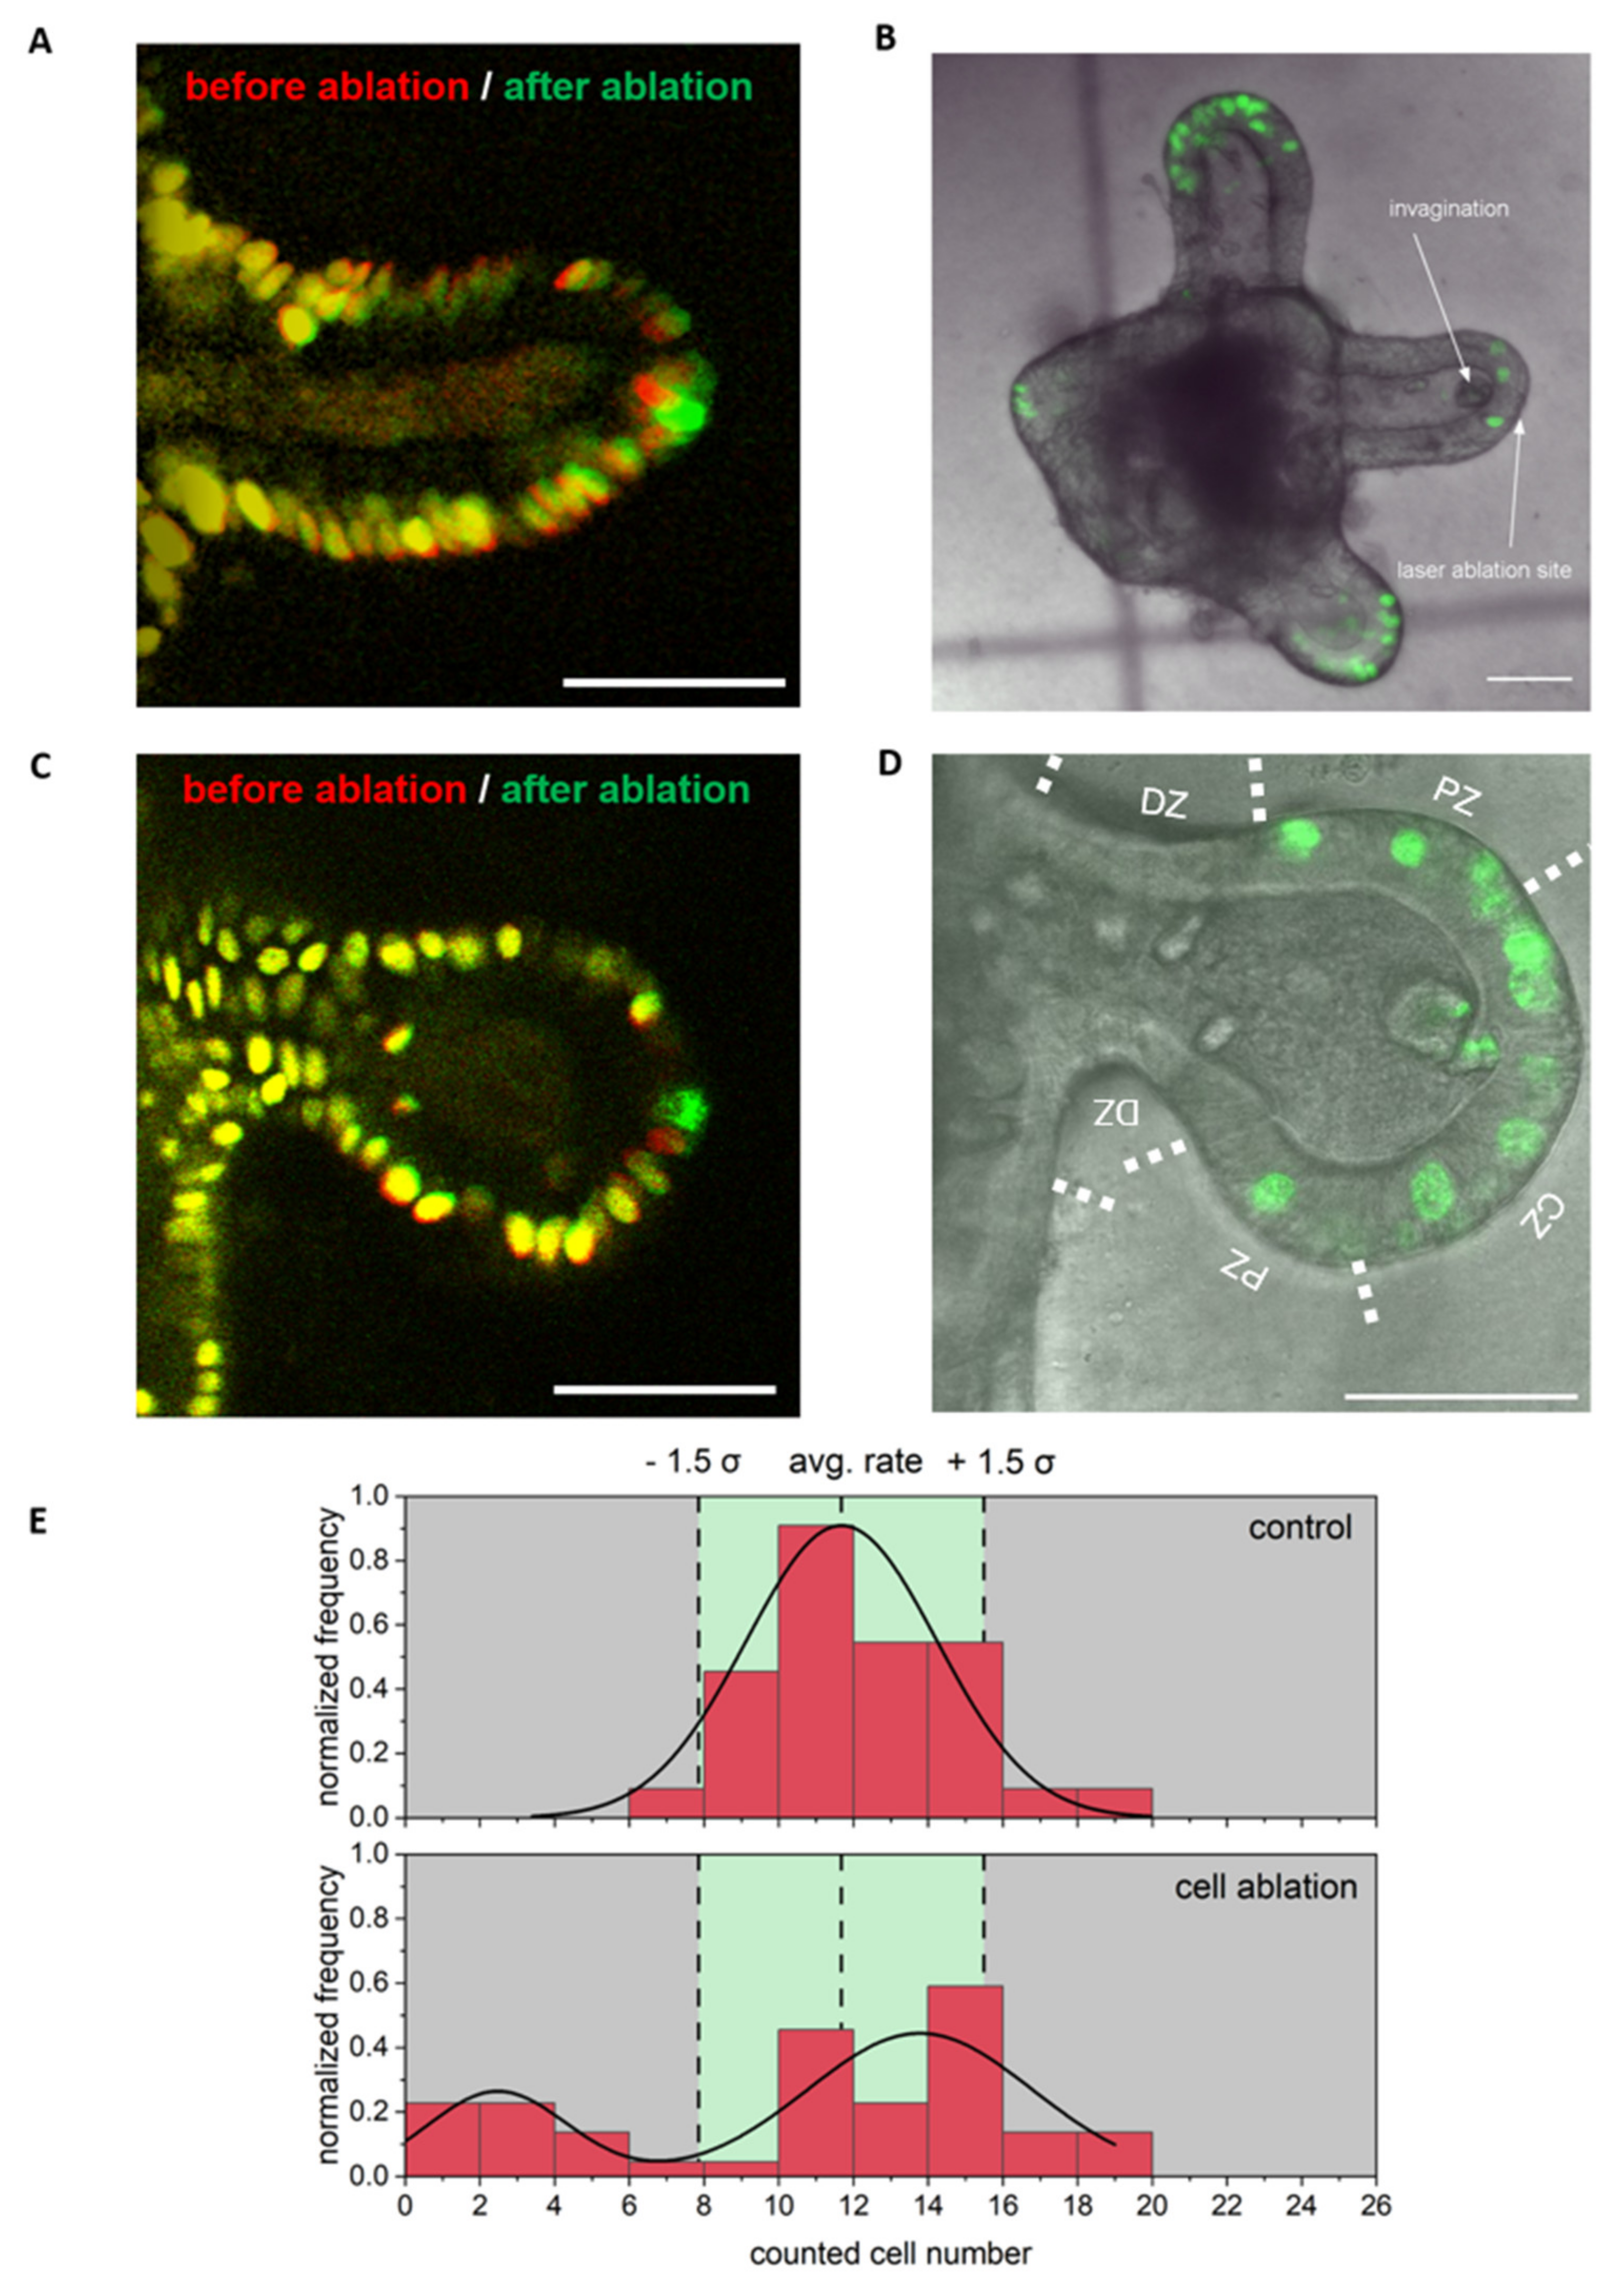
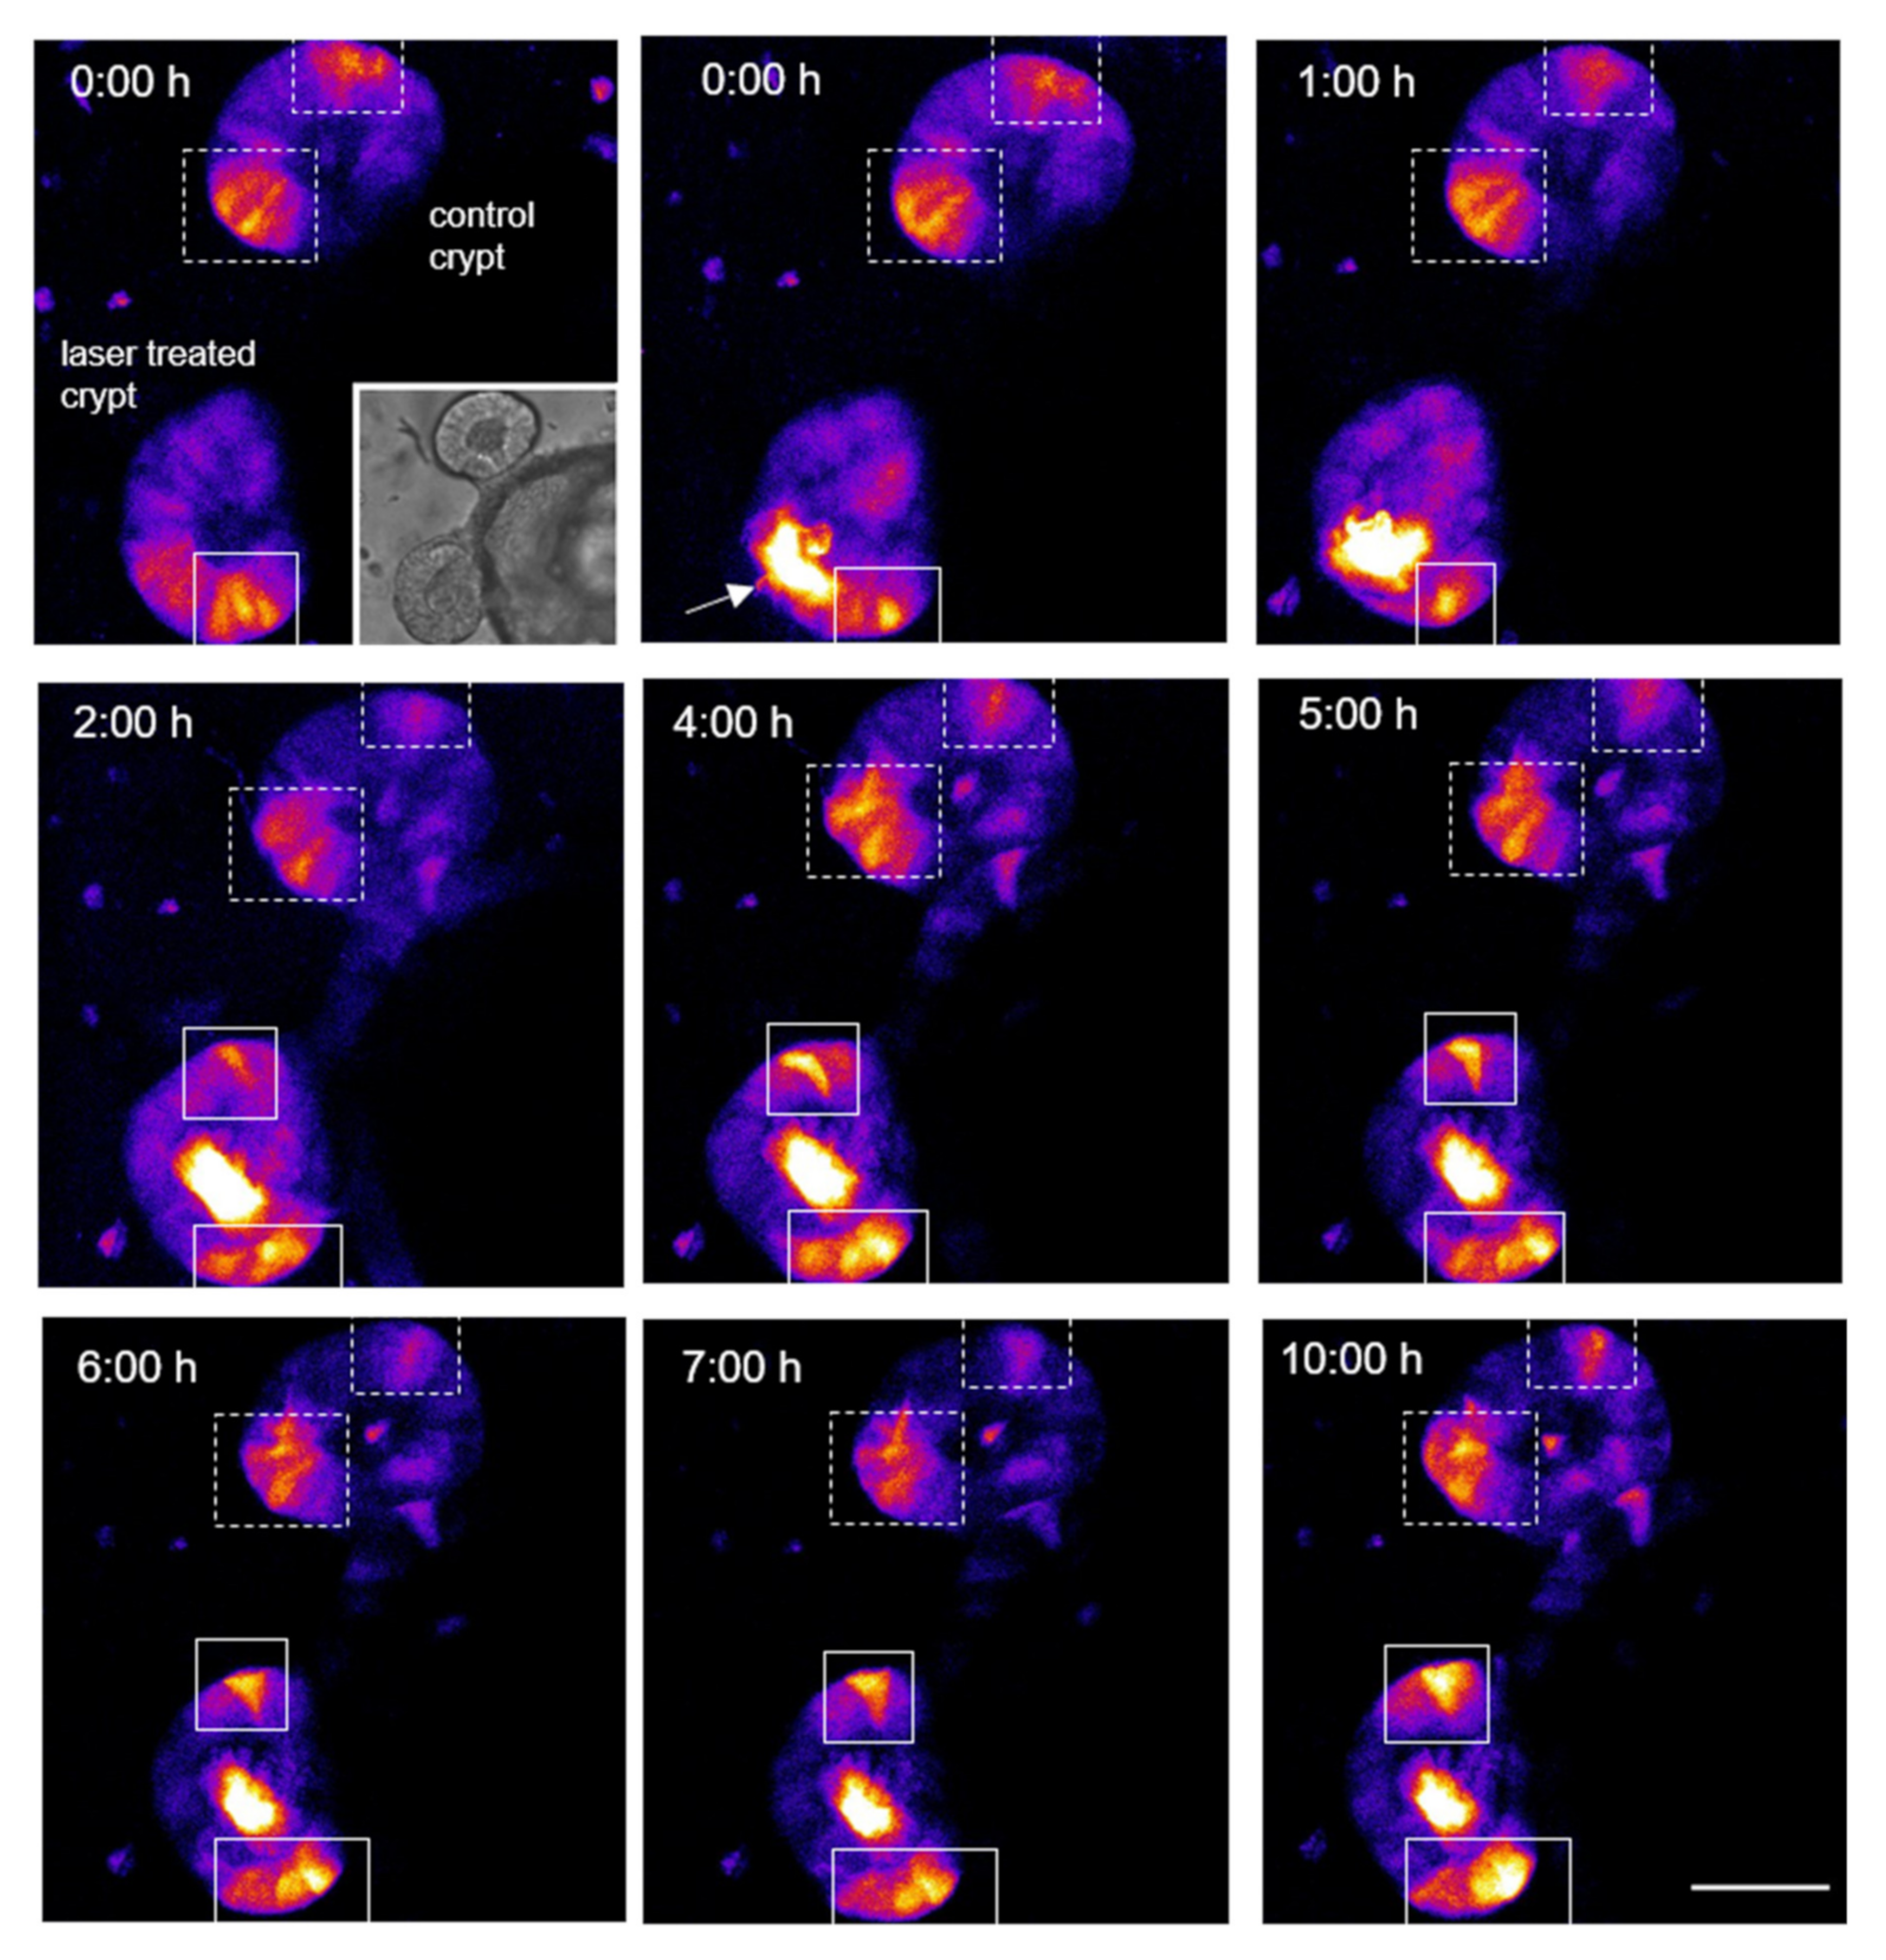
3.4. Single Cell Ablation Can Induce Two Different Scenarios in the Crypt Zone of Colonoids
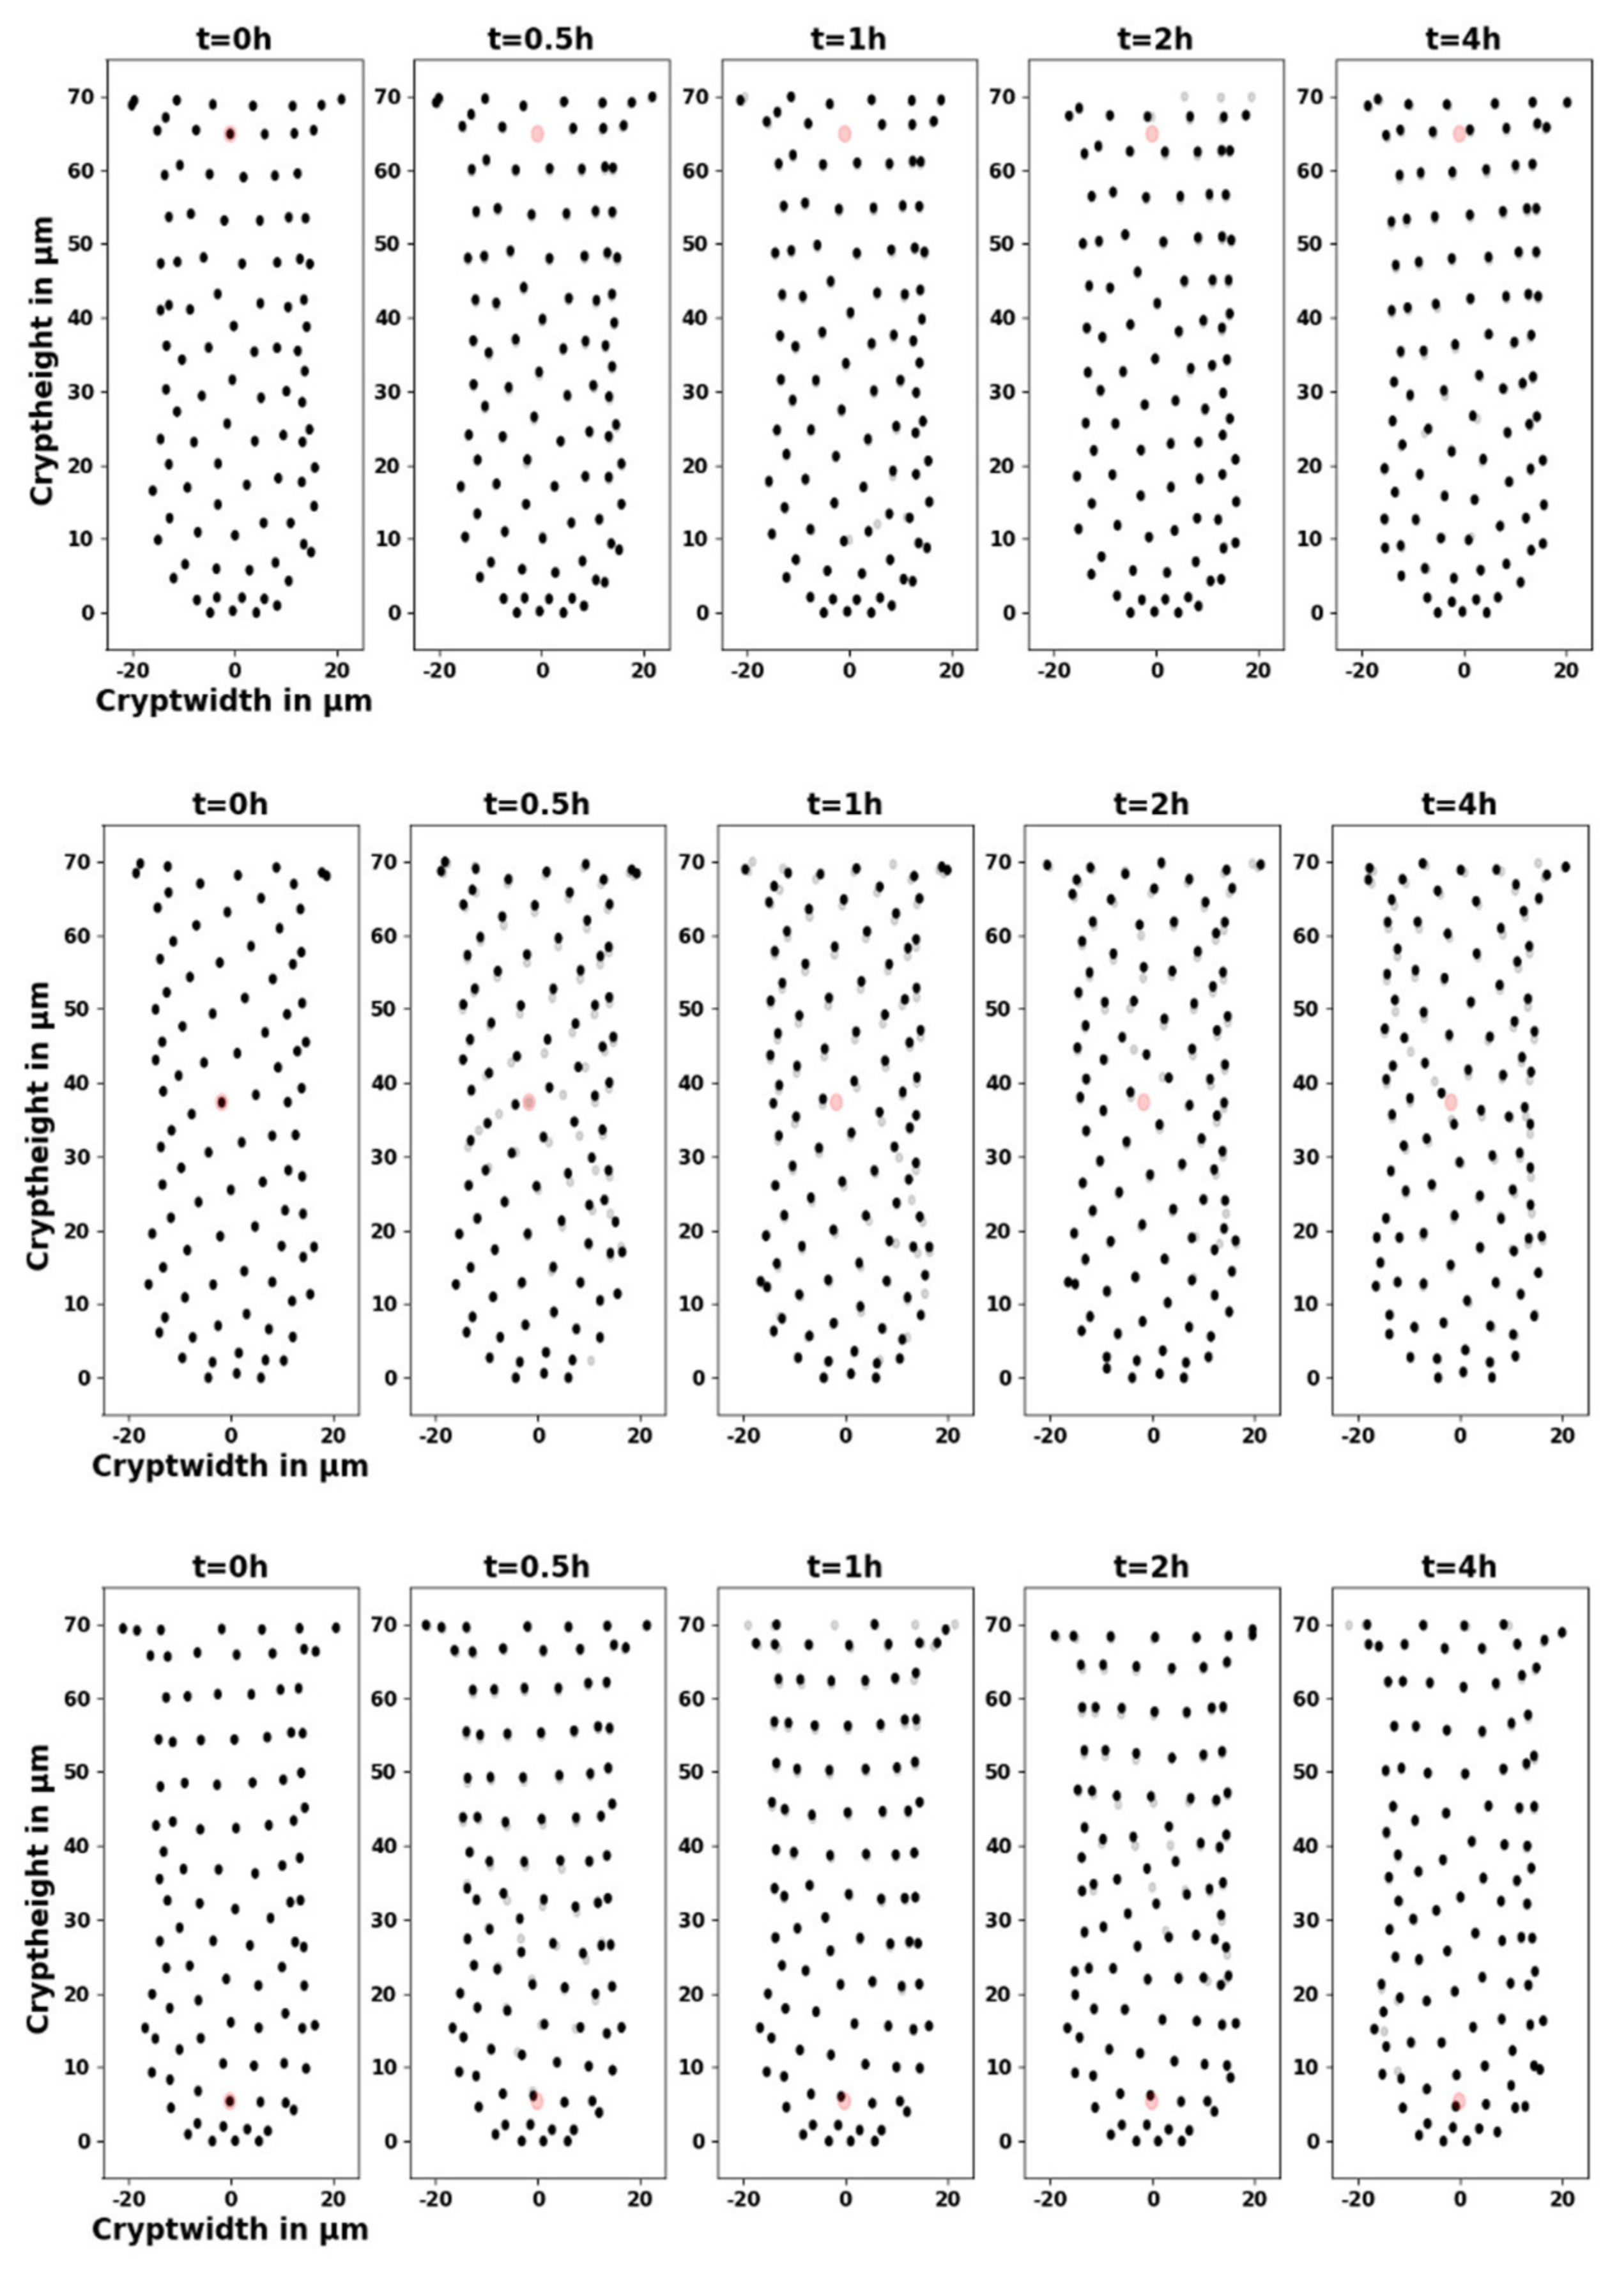
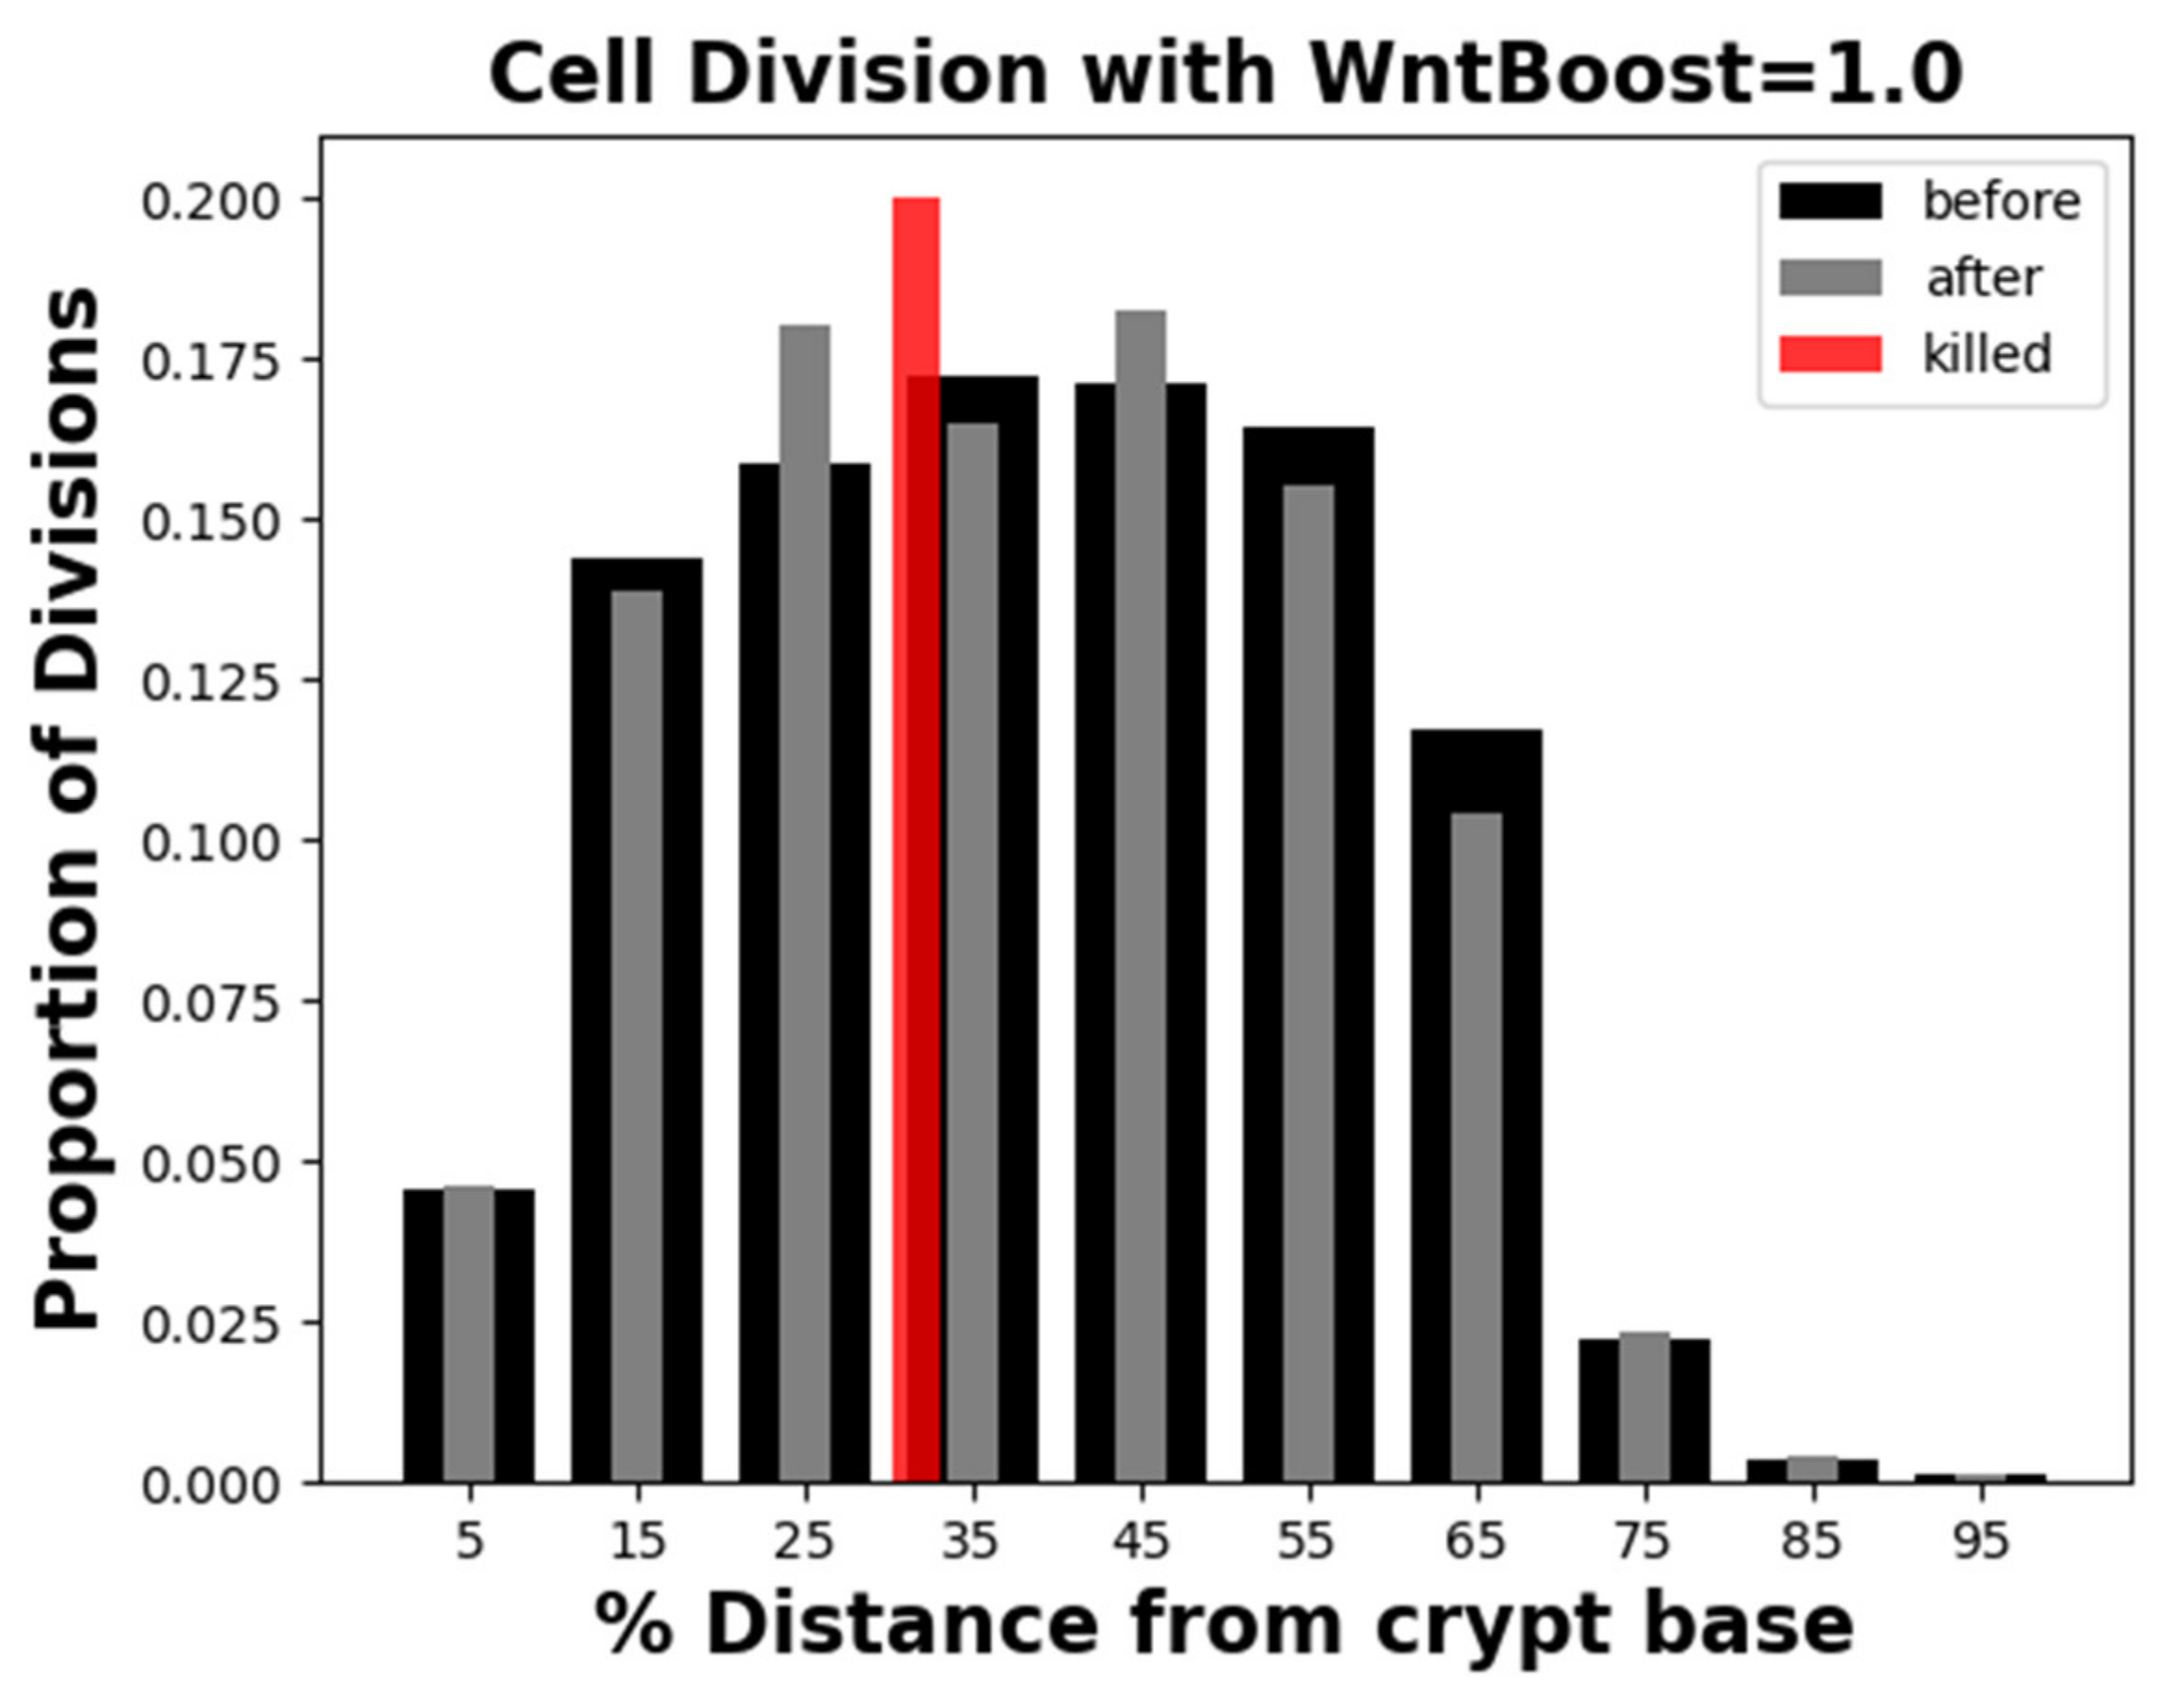
3.5. Local Wnt Pathway Changes after Single Cell Ablation in the Crypt Zone of Colonoids
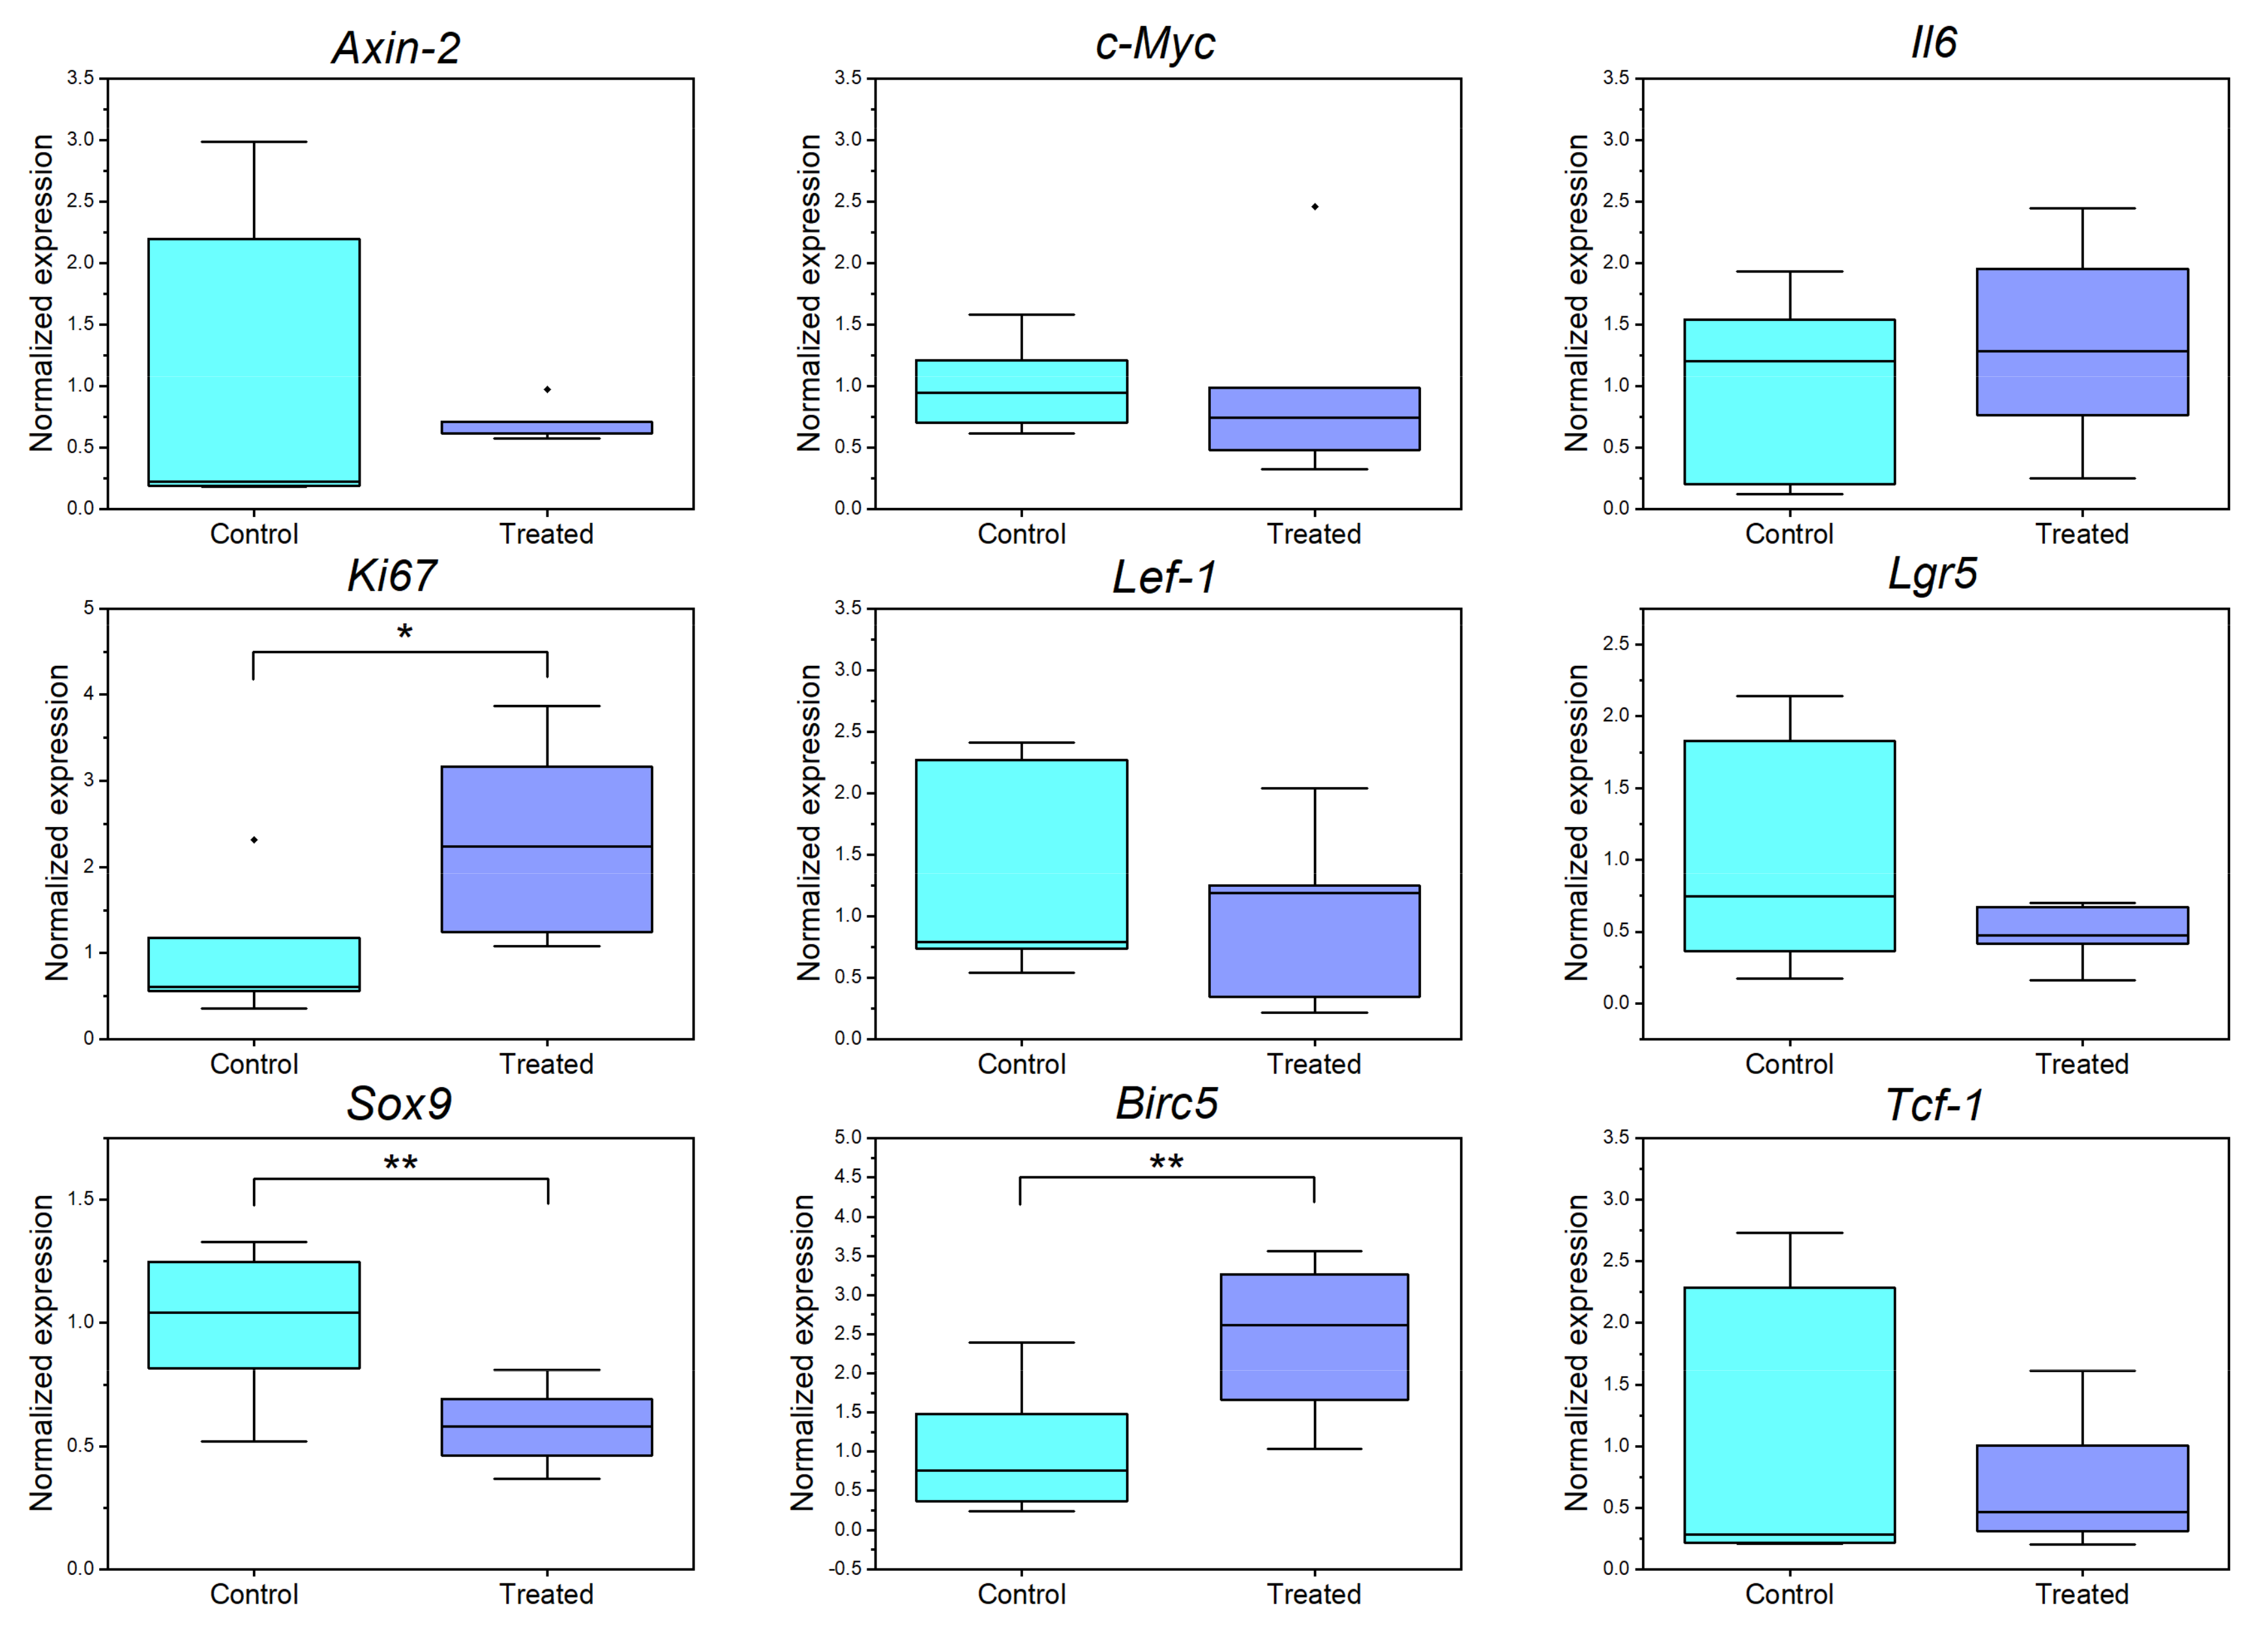
3.6. Single Cell Ablation in the Crypt Zone Changes Expression Levels of Different Proliferation and Wnt Associated Genes
4. Conclusions
Supplementary Materials
Author Contributions
Funding
Institutional Review Board Statement
Data Availability Statement
Acknowledgments
Conflicts of Interest
Appendix A
Appendix B

| Gene | Primer Forward 5′-3′ | Primer Reverse 5′3′ |
|---|---|---|
| c-Myc | TCGCTGCTGTCCTCCGAGTCC | GGTTTGCCTCTTCTCCACAGAC |
| Tcf-1 Lef-1 | CAAGGCAGAGAAGGAGGCTAAG ACCTACAGCGACGAGCACTT | GGCAGCGCTCTCCTTGAG GGGTAGAAGGTGGGGATTTC |
| Axin2 | CTGCTGGTCAGGCAGGAG | TGCCAGTTTCTTTGGCTCTT |
| Sox9 | GAGCCCGATCTGAAGAAGGA | GCTTGACGTGCGGCTTGTTC |
| Birc5 | TCCCGGCATGCTCTGC | TCCGCCATTCGCTCTGG |
| Ki67 | AATCCAACTCAAGTAAACGGGG | TTGGCTTGCTTCCATCCTCA |
| Lgr5 | CCTACTCGAAGACTTACCCAGT | GCATTGGGGTGAATGATAGCA |
| Il6 | TAGTCCTTCCTACCCCAATTTCC | TTGGTCCTTAGCCACTCCTTC |
Appendix C
References
- Sato, T.; Vries, R.G.; Snippert, H.J.; Van De Wetering, M.; Barker, N.; Stange, D.E.; Van Es, J.H.; Abo, A.; Kujala, P.; Peters, P.J.; et al. Single Lgr5 stem cells build crypt-villus structures in vitro without a mesenchymal niche. Nature 2009, 459, 262–265. [Google Scholar] [CrossRef] [PubMed]
- Sato, T.; Clevers, H. Growing self-organizing mini-guts from a single intestinal stem cell: Mechanism and applications. Science 2013, 340, 1190–1194. [Google Scholar] [CrossRef] [PubMed] [Green Version]
- Jung, P.; Sato, T.; Merlos-Suárez, A.; Barriga, F.M.; Iglesias, M.; Rossell, D.; Auer, H.; Gallardo, M.; Blasco, M.A.; Sancho, E.; et al. Isolation and in vitro expansion of human colonic stem cells. Nat. Med. 2011, 17, 1225–1227. [Google Scholar] [CrossRef] [PubMed]
- Barker, N. Adult intestinal stem cells: Critical drivers of epithelial homeostasis and regeneration. Nat. Rev. Mol. Cell Biol. 2014, 15, 19–33. [Google Scholar] [CrossRef] [PubMed] [Green Version]
- Grabinger, T.; Luks, L.; Kostadinova, F.; Zimberlin, C.; Medema, J.P.; Leist, M.; Brunner, T. Ex vivo culture of intestinal crypt organoids as a model system for assessing cell death induction in intestinal epithelial cells and enteropathy. Cell Death Dis. 2014, 5, e1228-10. [Google Scholar] [CrossRef] [PubMed] [Green Version]
- Suzuki, K.; Murano, T.; Shimizu, H.; Ito, G.; Nakata, T.; Fujii, S.; Ishibashi, F.; Kawamoto, A.; Anzai, S.; Kuno, R.; et al. Single cell analysis of Crohn’s disease patient-derived small intestinal organoids reveals disease activity-dependent modification of stem cell properties. J. Gastroenterol. 2018, 53, 1035–1047. [Google Scholar] [CrossRef] [Green Version]
- Drost, J.; Van Jaarsveld, R.H.; Ponsioen, B.; Zimberlin, C.; Van Boxtel, R.; Buijs, A.; Sachs, N.; Overmeer, R.M.; Offerhaus, G.J.; Begthel, H.; et al. Sequential cancer mutations in cultured human intestinal stem cells. Nature 2015, 521, 43–47. [Google Scholar] [CrossRef]
- Yoo, J.H.; Donowitz, M. Intestinal enteroids/organoids: A novel platform for drug discovery in inflammatory bowel diseases. World J. Gastroenterol. 2019, 25, 4125–4147. [Google Scholar] [CrossRef]
- Matano, M.; Date, S.; Shimokawa, M.; Takano, A.; Fujii, M.; Ohta, Y.; Watanabe, T.; Kanai, T.; Sato, T. Modeling colorectal cancer using CRISPR-Cas9-mediated engineering of human intestinal organoids. Nat. Med. 2015, 21, 256–262. [Google Scholar] [CrossRef]
- Drost, J.; Clevers, H. Translational applications of adult stem cell-derived organoids. Development 2017, 144, 968–975. [Google Scholar] [CrossRef] [Green Version]
- Yui, S.; Nakamura, T.; Sato, T.; Nemoto, Y.; Mizutani, T.; Zheng, X.; Ichinose, S.; Nagaishi, T.; Okamoto, R.; Tsuchiya, K.; et al. Functional engraftment of colon epithelium expanded in vitro from a single adult Lgr5+ stem cell. Nat. Med. 2012, 18, 618–623. [Google Scholar] [CrossRef] [PubMed]
- Korinek, V.; Barker, N.; Moerer, P.; Van Donselaar, E.; Huls, G.; Peters, P.J.; Clevers, H. Depletion of epithelial stem-cell compartments in the small intestine of mice lacking Tcf-4. Nat. Genet. 1998, 19, 379–383. [Google Scholar] [CrossRef] [PubMed]
- Beumer, J.; Clevers, H. Regulation and plasticity of intestinal stem cells during homeostasis and regeneration. Development 2016, 143, 3639–3649. [Google Scholar] [CrossRef] [PubMed] [Green Version]
- Omerzu, M.; Fenderico, N.; De Barbanson, B.; Sprangers, J.; De Ridder, J.; Maurice, M.M. Three-dimensional analysis of single molecule FISH in human colon organoids. Biol. Open 2019, 8, 1–8. [Google Scholar] [CrossRef] [Green Version]
- Lindeboom, R.G.; Voorthuijsen, L.; Oost, K.C.; Rodríguez-Colman, M.J.; Luna-Velez, M.V.; Furlan, C.; Baraille, F.; Jansen, P.W.; Ribeiro, A.; Burgering, B.M.; et al. Integrative multi-omics analysis of intestinal organoid differentiation. Mol. Syst. Biol. 2018, 14, 1–16. [Google Scholar] [CrossRef]
- König, K.; Riemann, I.; Fritzsche, W. Nanodissection of human chromosomes with near-infrared femtosecond laser pulses. Opt. Lett. 2001, 26, 819. [Google Scholar] [CrossRef]
- Vogel, A.; Noack, J.; Hüttman, G.; Paltauf, G. Mechanisms of femtosecond laser nanosurgery of cells and tissues. Appl. Phys. B Lasers Opt. 2005, 81, 1015–1047. [Google Scholar] [CrossRef]
- Müller, D.; Hagenah, D.; Biswanath, S.; Coffee, M.; Kampmann, A.; Zweigerdt, R.; Heisterkamp, A.; Kalies, S.M.K. Femtosecond laser-based nanosurgery reveals the endogenous regeneration of single Z-discs including physiological consequences for cardiomyocytes. Sci. Rep. 2019, 9, 1–10. [Google Scholar] [CrossRef] [Green Version]
- Kuetemeyer, K.; Rezgui, R.; Lubatschowski, H.; Heisterkamp, A. Influence of laser parameters and staining on femtosecond laser-based intracellular nanosurgery. Biomed. Opt. 2010, 1, 1047–1052. [Google Scholar] [CrossRef] [Green Version]
- Watanabe, W.; Arakawa, N.; Matsunaga, S.; Higashi, T.; Fukui, K.; Isobe, K.; Itoh, K. Femtosecond laser disruption of subcellular organelles in a living cell. Opt. Express 2004, 12, 4203. [Google Scholar] [CrossRef]
- Heisterkamp, A.; Maxwell, I.Z.; Mazur, E.; Underwood, J.M.; Nickerson, J.A.; Kumar, S.; Ingber, D.E. Pulse energy dependence of subcellular dissection by femtosecond laser pulses. Opt. Express 2005, 13, 3690–3696. [Google Scholar] [CrossRef] [PubMed] [Green Version]
- DeTemple, D.E.; Cammann, S.; Bahlmann, J.; Buettner, M.; Heisterkamp, A.; Vondran, F.W.R.; Kalies, S.K. Longitudinal imaging and femtosecond laser manipulation of the liver: How to generate and trace single-cell-resolved micro-damage in vivo. PLoS ONE 2020, 15, e0240405. [Google Scholar] [CrossRef] [PubMed]
- Mahe, M.M.; Aihara, E.; Schumacher, M.A.; Zavros, Y.; Montrose, M.H.; Helmrath, M.A.; Sato, T.; Shroyer, N.F. Establishment of Gastrointestinal Epithelial Organoids. Curr. Protoc. Mouse Biol. 2013, 3, 217–240. [Google Scholar] [CrossRef] [PubMed] [Green Version]
- Brooks, P.; Zur Bruegge, T.; Boyle, E.C.; Kalies, S.; Villarreal, S.N.; Liese, A.; Bleich, A.; Buettner, M. CD14 and ALPK1 Affect Expression of Tight Junction Components and Proinflammatory Mediators upon Bacterial Stimulation in a Colonic 3D Organoid Model. Stem Cells Int. 2020, 2020, 4069354. [Google Scholar] [CrossRef]
- Schambach, A.; Galla, M.; Modlich, U.; Will, E.; Chandra, S.; Reeves, L.; Colbert, M.; Williams, D.A.; von Kalle, C.; Baum, C. Lentiviral vectors pseudotyped with murine ecotropic envelope: Increased biosafety and convenience in preclinical research. Exp. Hematol. 2006, 34, 588–592. [Google Scholar] [CrossRef]
- Fuerer, C.; Nusse, R. Lentiviral vectors to probe and manipulate the Wnt signaling pathway. PLoS ONE 2010, 5, e9370. [Google Scholar] [CrossRef]
- De Van Lidth Jeude, J.F.; Vermeulen, J.L.M.; Montenegro-Miranda, P.S.; Van Den Brink, G.R.; Heijmans, J. A protocol for lentiviral transduction and downstream analysis of intestinal organoids. J. Vis. Exp. 2015, 2015, 52531. [Google Scholar] [CrossRef] [Green Version]
- Hong, V.; Presolski, S.; Ma, C.; Finn, M.G. Analysis and Optimization of CuAAC for Bioconjugation. Angew. Chem. Int. Ed. Engl. 2009, 48, 9879–9883. [Google Scholar] [CrossRef] [Green Version]
- Oladeinde, O.A.; Hong, S.Y.; Holland, R.J.; MacIag, A.E.; Keefer, L.K.; Saavedra, J.E.; Nandurdikar, R.S. “Click” reaction in conjunction with diazeniumdiolate chemistry: Developing high-load nitric oxide donors. Org. Lett. 2010, 12, 4256–4259. [Google Scholar] [CrossRef] [Green Version]
- Rostovtsev, V.V.; Green, L.G.; Fokin, V.V.; Sharpless, K.B. A stepwise huisgen cycloaddition process: Copper(I)-catalyzed regioselective “ligation” of azides and terminal alkynes. Angew. Chem. Int. Ed. 2002, 41, 2596–2599. [Google Scholar] [CrossRef]
- Taylor, S.C.; Nadeau, K.; Abbasi, M.; Lachance, C.; Nguyen, M.; Fenrich, J. The Ultimate qPCR Experiment: Producing Publication Quality, Reproducible Data the First Time. Trends Biotechnol. 2019, 37, 761–774. [Google Scholar] [CrossRef] [PubMed] [Green Version]
- Liang, J.; Wu, W.L.; Liu, Z.H.; Mei, Y.J.; Cai, R.X.; Shen, P. Study the oxidative injury of yeast cells by NADH autofluorescence. Spectrochim. Acta Part A Mol. Biomol. Spectrosc. 2007, 67, 355–359. [Google Scholar] [CrossRef] [PubMed]
- Wang, H.-W.; Gukassyan, V.; Chen, C.-T.; Wei, Y.-H.; Guo, H.-W.; Yu, J.-S.; Kao, F.-J. Differentiation of apoptosis from necrosis by dynamic changes of reduced nicotinamide adenine dinucleotide fluorescence lifetime in live cells. J. Biomed. Opt. 2008, 13, 054011. [Google Scholar] [CrossRef] [PubMed]
- Kozlova, A.A.; Verkhovskii, R.A.; Ermakov, A.V.; Bratashov, D.N. Changes in Autofluorescence Level of Live and Dead Cells for Mouse Cell Lines. J. Fluoresc. 2020, 30, 1483–1489. [Google Scholar] [CrossRef]
- Hennings, L.; Kaufmann, Y.; Griffin, R.; Siegel, E.; Corry, P.; Moros, E.G.; Shafirstein, G. Dead or alive? Autofluorescence distinguishes heat-fixed from viable cells. NIH Public Access 2010, 25, 355–363. [Google Scholar] [CrossRef] [Green Version]
- Levitt, J.M.; Baldwin, A.; Papadakis, A.; Puri, S.; Xylas, J.; Münger, K.; Georgakoudi, I. Intrinsic fluorescence and redox changes associated with apoptosis of primary human epithelial cells. J. Biomed. Opt. 2006, 11, 064012. [Google Scholar] [CrossRef] [Green Version]
- Oehring, H.; Riemann, I.; Fischer, P.; Halbhuber, K.J.; König, K. Ultrastructure and reproduction behaviour of single CHO-K1 cells exposed to near infrared femtosecond laser pulses. Scanning 2000, 22, 263–270. [Google Scholar] [CrossRef]
- König, K.; Becker, T.W.; Fischer, P.; Riemann, I.; Halbhuber, K.J. Pulse-length dependence of cellular response to intense near-infrared laser pulses in multiphoton microscopes. Opt. Lett. 1999, 24, 113–115. [Google Scholar] [CrossRef]
- König, K.; So, P.T.C.; Mantulin, W.W.; Tromberg, B.J.; Gratton, E. Two-photon excited lifetime imaging of autofluorescence in cells during UVA and NIR photostress. J. Microsc. 1996, 183, 197–204. [Google Scholar] [CrossRef]
- Dunn, S.J.; Osborne, J.M.; Appleton, P.L.; Näthke, I. Combined changes in Wnt signaling response and contact inhibition induce altered proliferation in radiation-treated intestinal crypts. Mol. Biol. Cell 2016, 27, 1863–1874. [Google Scholar] [CrossRef] [Green Version]
- Cooper, F.; Baker, R.; Bernabeu, M.; Bordas, R.; Bowler, L.; Bueno-Orovio, A.; Byrne, H.; Carapella, V.; Cardone-Noott, L.; Cooper, J.; et al. Chaste: Cancer, Heart and Soft Tissue Environment. J. Open Source Softw. 2020, 5, 1848. [Google Scholar] [CrossRef]
- Mirams, G.R.; Arthurs, C.J.; Bernabeu, M.O.; Bordas, R.; Cooper, J.; Corrias, A.; Davit, Y.; Dunn, S.J.; Fletcher, A.G.; Harvey, D.G.; et al. Chaste: An Open Source C++ Library for Computational Physiology and Biology. PLoS Comput. Biol. 2013, 9, 2970. [Google Scholar] [CrossRef] [PubMed] [Green Version]
- Choi, J.; Rakhilin, N.; Gadamsetty, P.; Joe, D.J.; Tabrizian, T.; Lipkin, S.M.; Huffman, D.M.; Shen, X.; Nishimura, N. Intestinal crypts recover rapidly from focal damage with coordinated motion of stem cells that is impaired by aging. Sci. Rep. 2018, 8, 1–12. [Google Scholar] [CrossRef] [PubMed] [Green Version]
- Cordero, J.B.; Sansom, O.J. Wnt signalling and its role in stem cell-driven intestinal regeneration and hyperplasia. Acta Physiol. 2012, 204, 137–143. [Google Scholar] [CrossRef]
- Duschl, R.; Schweingruber, H.; Shouse, A.; Michaels, S.; Schweinberger, H.; Donovan, M.S.; Bransford, J.; Kirschner, P.A.; Sweller, J.; Clark, R.; et al. Wnt5a Potentiates TGF- b Signaling—First LWNR conditioned media. Science 2012, 338, 108–113. [Google Scholar]
- Clevers, H.; Nusse, R. Wnt/β-catenin signaling and disease. Cell 2012, 149, 1192–1205. [Google Scholar] [CrossRef] [Green Version]
- Liu, Z.; Habener, J.F. Stromal cell-derived factor-1 promotes survival of pancreatic beta cells by the stabilisation of beta-catenin and activation of transcription factor 7-like 2 (TCF7L2). Diabetologia 2009, 52, 1589–1598. [Google Scholar] [CrossRef] [Green Version]
- Balleza, E.; Kim, J.M.; Cluzel, P. Systematic characterization of maturation time of fluorescent proteins in living cells. Nat. Methods 2018, 15, 47–51. [Google Scholar] [CrossRef]
- Niotis, A.; Tsiambas, E.; Fotiades, P.P.; Ragos, V. ki-67 and Topoisomerase IIa proliferation markers in colon adenocarcinoma. J. BUON 2018, 23, 24–27. [Google Scholar]
- Wheatley, S.P.; Altieri, D.C. Survivin at a glance. J. Cell Sci. 2019, 132, jcs223826. [Google Scholar] [CrossRef] [Green Version]
- O’Hara, R.E.; Arsenault, M.G.; Esparza Gonzalez, B.P.; Patriquen, A.; Hartwig, S. Three Optimized Methods for In Situ Quantification of Progenitor Cell Proliferation in Embryonic Kidneys Using BrdU, EdU, and PCNA. Can. J. Kidney Heal. Dis. 2019, 6, 1–13. [Google Scholar] [CrossRef] [PubMed]
- Sobecki, M.; Mrouj, K.; Colinge, J.; Gerbe, F.; Jay, P.; Krasinska, L.; Dulic, V.; Fisher, D. Cell-cycle regulation accounts for variability in Ki-67 expression levels. Cancer Res. 2017, 77, 2722–2734. [Google Scholar] [CrossRef] [Green Version]
- Topol, L.; Chen, W.; Song, H.; Day, T.F.; Yang, Y. Sox9 Inhibits Wnt Signaling by Promoting β-Catenin Phosphorylation in the Nucleus. J. Biol. Chem. 2009, 284, 3323–3333. [Google Scholar] [CrossRef] [PubMed] [Green Version]
- Ramalingam, S.; Daughtridge, G.W.; Johnston, M.J.; Gracz, A.D.; Magness, S.T.; Carolina, N.; Ramalingam, S.; Gw, D.; Mj, J.; Ad, G.; et al. Intestinal Stem Cells in GI Physiology and Disease Distinct levels of Sox9 expression mark colon epithelial stem cells that form colonoids in culture. J. Physiol. Gastrointest. Liver Physiol. 2021, 302, 10–20. [Google Scholar] [CrossRef] [PubMed] [Green Version]
- Bodine, P.V.N.; Komm, B.S. Wnt signaling and osteoblastogenesis. Rev. Endocr. Metab. Disord. 2006, 7, 33–39. [Google Scholar] [CrossRef] [PubMed]
- Yu, J.; Liu, D.; Sun, X.; Yang, K.; Yao, J.; Cheng, C.; Wang, C.; Zheng, J. CDX2 inhibits the proliferation and tumor formation of colon cancer cells by suppressing Wnt/β-catenin signaling via transactivation of GSK-3β and Axin2 expression. Cell Death Dis. 2019, 10, 1–14. [Google Scholar] [CrossRef]
- Eng, C.H.L.; Lawson, M.; Zhu, Q.; Dries, R.; Koulena, N.; Takei, Y.; Yun, J.; Cronin, C.; Karp, C.; Yuan, G.C.; et al. Transcriptome-scale super-resolved imaging in tissues by RNA seqFISH+. Nature 2019, 568, 235–239. [Google Scholar] [CrossRef]
- Heinrich, P.C.; Behrmann, I.; Haan, S.; Hermanns, H.M.; Müller-Newen, G.; Schaper, F. Principles of interleukin (IL)-6-type cytokine signalling and its regulation. Biochem. J. 2003, 374, 1–20. [Google Scholar] [CrossRef] [Green Version]
- Martini, E.; Schneider, E.; Neufert, C.; Neurath, M.F.; Becker, C. Survivin is a guardian of the intestinal stem cell niche and its expression is regulated by TGF-β. Cell Cycle 2016, 15, 2875–2881. [Google Scholar] [CrossRef] [Green Version]
- Shao, Q.; Xu, J.; Deng, R.; Wei, W.; Zhou, B.; Yue, C.; Zhu, M.; Zhu, H. The expressions of YAP1, β-catenin and survivin in colon cancer tissues and their clinical significance. Int. J. Clin. Exp. Pathol. 2018, 11, 6032–6038. [Google Scholar]
- Tirier, S.M.; Park, J.; Preußer, F.; Amrhein, L.; Gu, Z.; Steiger, S.; Mallm, J.P.; Krieger, T.; Waschow, M.; Eismann, B.; et al. Pheno-seq—Linking visual features and gene expression in 3D cell culture systems. Sci. Rep. 2019, 9, 12367. [Google Scholar] [CrossRef] [PubMed] [Green Version]
Publisher’s Note: MDPI stays neutral with regard to jurisdictional claims in published maps and institutional affiliations. |
© 2022 by the authors. Licensee MDPI, Basel, Switzerland. This article is an open access article distributed under the terms and conditions of the Creative Commons Attribution (CC BY) license (https://creativecommons.org/licenses/by/4.0/).
Share and Cite
Donath, S.; Angerstein, L.; Gentemann, L.; Müller, D.; Seidler, A.E.; Jesinghaus, C.; Bleich, A.; Heisterkamp, A.; Buettner, M.; Kalies, S. Investigation of Colonic Regeneration via Precise Damage Application Using Femtosecond Laser-Based Nanosurgery. Cells 2022, 11, 1143. https://doi.org/10.3390/cells11071143
Donath S, Angerstein L, Gentemann L, Müller D, Seidler AE, Jesinghaus C, Bleich A, Heisterkamp A, Buettner M, Kalies S. Investigation of Colonic Regeneration via Precise Damage Application Using Femtosecond Laser-Based Nanosurgery. Cells. 2022; 11(7):1143. https://doi.org/10.3390/cells11071143
Chicago/Turabian StyleDonath, Sören, Leon Angerstein, Lara Gentemann, Dominik Müller, Anna E. Seidler, Christian Jesinghaus, André Bleich, Alexander Heisterkamp, Manuela Buettner, and Stefan Kalies. 2022. "Investigation of Colonic Regeneration via Precise Damage Application Using Femtosecond Laser-Based Nanosurgery" Cells 11, no. 7: 1143. https://doi.org/10.3390/cells11071143
APA StyleDonath, S., Angerstein, L., Gentemann, L., Müller, D., Seidler, A. E., Jesinghaus, C., Bleich, A., Heisterkamp, A., Buettner, M., & Kalies, S. (2022). Investigation of Colonic Regeneration via Precise Damage Application Using Femtosecond Laser-Based Nanosurgery. Cells, 11(7), 1143. https://doi.org/10.3390/cells11071143