Article

Evaluation of RAS Mutational Status in Liquid Biopsy to Monitor Disease Progression in Metastatic Colorectal Cancer Patients

1
Department of Experimental and Clinical Medicine, University of Florence, 50134 Florence, Italy
2
Complex Dynamics Study Centre (CSDC), University of Florence, 50100 Florence, Italy
3
Medical Oncology, S. Jacopo Hospital, 51100 Pistoia, Italy
4
Medical Oncology, S.S. Cosma e Damiano Hospital, 51017 Pescia, Italy
5
Medical Oncology Unit, Azienda Ospedaliero-Universitaria Careggi, Largo Brambilla 3, 50134 Florence, Italy
*
Author to whom correspondence should be addressed.
Cells 2023, 12(11), 1458; https://doi.org/10.3390/cells12111458
Submission received: 3 April 2023 / Revised: 9 May 2023 / Accepted: 22 May 2023 / Published: 24 May 2023
(This article belongs to the Special Issue Role of KRAS Mutations in Colorectal Cancer)

Abstract

:
In this study we evaluated both~ K- and N-RAS mutations in plasma samples from patients with metastatic colorectal cancer by means of the BEAMing technology, and we assessed their diagnostic performance compared to RAS analyses performed on tissue. The sensitivity of BEAMing in identifying KRAS mutations was of 89.5%, with a fair specificity. The agreement with tissue analysis was moderate. The sensitivity for NRAS was high with a good specificity, and the agreement between tissue analysis and BEAMing was fair. Interestingly, significantly higher mutant allele fraction (MAF) levels were detected in patients with G2 tumors, liver metastases, and in those who did not receive surgery. NRAS MAF level was significantly higher in patients with mucinous adenocarcinoma and for those with lung metastases. A sharp increase in the MAF values was observed in patients who moved towards disease progression. More strikingly, molecular progression always anticipated the radiological one in these patients. These observations pave the way to the possibility of using liquid biopsy to monitor patients during treatment, and to enable oncologists to anticipate interventions compared to radiological analyses. This will allow time to be saved and ensure a better management of metastatic patients in the near future.

Graphical Abstract

1. Introduction

ColoRectal Cancer (CRC) represents a major public health issue, being the third most frequent malignant tumor in both sexes, accounting for 10% of the cases worldwide and the fourth leading cause of cancer death, causing 9.2% of deceases worldwide [1,2]. The gold standard of treatment for CRC patients is represented by surgery but metastatic (TNM IV, mCRC) patients are also treated by systemic approaches, based on chemotherapy, targeted therapy, and combination therapies, although frequently characterized by reduced effectiveness [3]. For this reason, to achieve treatment optimization, different biomarkers have been proposed [3]. According to the National Comprehensive Cancer Network (NCCN) guidelines updated in 2022, therapeutic selection must take into account molecular features, including RAS, EGFR, and BRAF mutations, MSI, CpG island methylation; P21, SCNA, PTEN, and TS expression [4]. In the clinical practice, KRAS and EGFR mutations are considered the most relevant although they are present roughly in 40 and 3% of mCRC, respectively [5].
It has been clearly shown that the occurrence of RAS and BRAF mutations are the main elements responsible of the failure of anti-EGFR-based therapy, such as cetuximab and panitumumab [6,7]. For this reason, before defining a therapy schedule for mCRC patients, the presence of BRAF, KRAS, and NRAS mutations is routinely investigated in tissue biopsies in order to select the patients most likely to respond to anti-EGFR therapy [8,9,10]. Typically, the evaluation of RAS and BRAF mutational status requires the acquisition of tumor tissue, the subsequent processing to formalin-fixed paraffin-embedded (FFPE) specimens, and molecular testing with various techniques, with consequent limitations in studying a single snapshot of a tumor due to both tumor heterogeneity and treatment associated evolution. Therefore, a single biopsy is likely to underestimate the complexity of the tumor genomic landscape [11]. These issues might be overcome by analyzing circulating tumor DNA (ctDNA) representing a variable and small fraction of the total circulating cell-free DNA (cfDNA) that can be found in the plasma of the patients [12,13]. Notably, the detection of a low amount of mutated ctDNA through the implementation of ultrasensitive assays in clinical routine could reduce the need for second biopsies and anticipate radiological progression.
ctDNA levels are associated with biological and clinicopathological features such as tumor burden, stage, histotype, apoptotic rate, blood vessel proximity, and metastatic potential [14,15,16]. A high proportion of mCRC patients are characterized by measurable ctDNA in plasma and 1.9–27% harbor mutations [15]. Hence, the non-invasive detection of emerging KRAS mutations in cfDNA from peripheral blood can help to detect resistance to anti-EGFR therapy [17]. Specifically, high levels of KRAS mutant allele fraction (MAF) might be associated with a poor outcome for patients treated with cetuximab [18,19]. A fraction of patients without KRAS and NRAS mutations treated with anti-EGFR might develop RAS mutations as soon as the disease progresses [17,20,21,22,23,24,25,26,27]. More importantly, the occurrence of RAS mutations in cfDNA can be detected before clinical progression of the disease [17], and, thus, anti-EGFR treatment should be stopped when RAS mutations are detected and a rechallenge could be carried out when the mutational status becomes wild type again [26].
The aims of the present paper were the following: (a) evaluate the concordance between KRAS and NRAS mutational status in tissue and plasma in a cohort of mCRC patients, and test the diagnostic performance of plasma as compared to tissue analyses; (b) evaluate the mutant allele fraction (MAF) distribution in plasma samples and search for possible clinical correlations; and (c) monitor RAS mutational status at different time points during treatment until disease progression.

2. Materials and Methods

2.1. Study Design, Population, and Setting

The present study is a biological, observational, prospective, multi-center, open-label translational study involving the collection of blood samples and clinical data from mCRC patients treated for metastatic disease. The study was conducted among patients enrolled at the Units of Medical Oncology of the Careggi University Hospital (Florence, Italy), Medical Oncology of the S. Jacopo Hospital (Pistoia, Italy), and Medical Oncology of the S.S. Cosma e Damiano Hospital (Pescia, Italy) between March 2017 and August 2022.
Patients were considered eligible if they had a histological diagnosis of colorectal adenocarcinoma stage IV TNM, were treatment naïve, and had measurable disease (according to Response Evaluation Criteria in Solid Tumours (RECIST) criteria v.1.1) [28].
The study was approved by the local ethical committee (BIO.16.028 released on 5 October 2016 for Careggi hospital and 15858_bio, released on 5 March 2020 for Pistoia and Pescia hospitals); each patient provided informed written consent at the enrollment.

2.2. Patients’ Assessment and Follow-Up

Demographic, clinical, and therapeutic features of the patients were retrieved from the medical charts at time of inclusion in the study.
For all patients, data on tissue KRAS and NRAS status were retrieved; indeed, for all the patients, KRAS and NRAS status had been previously determined in FFPE tumor tissue biopsies of either primary tumors or metastases by next generation sequencing (NGS), conducted by experienced personnel at the abovementioned hospitals as a routine procedure. According to clinical practice, patients with wild type (WT) RAS were treated with anti-EGFR +/− chemotherapy on physician’s choice. mCRC patients with mutated RAS on tissue analyses were treated with anti-VEGF biologics +/− synthetic chemotherapy, depending on the physician’s choice. First-line treatment was given until disease progression or unacceptable toxicity.
Computed tomography (CT) radiological evaluation was performed before starting first-line (baseline) treatment and every 3 months until progression, according to clinical practice, to monitor response. Data on all-cause mortality were also prospectively recorded.

2.3. Sample Collection

Blood samples for ctDNA analysis were collected prior to starting first-line treatment (T0), 4 (T1), 8 weeks (T2) after starting treatment, and every 12 weeks thereafter (T3……n) until disease progression (T PD), as shown in Figure 1. A plasma sample was also collected at the time of radiological progression according to RECIST version 1.1 criteria [28].
For each patient enrolled in the study, 8 mL of peripheral blood was collected in either K2 EDTA BD Vacutainer® collection tubes (BD, Franklin Lakes, NJ, USA) or Cell Free DNA BCT collection tubes (Streck, La Vista, NE, USA) by the nurses of Medical Oncology units of the abovementioned hospitals, and this was taken immediately before starting therapy. Plasma was then prepared within 4 or 72 h, depending on the collection tubes used, and according to the protocol released by Sysmex-Inostics for the determination of KRAS and NRAS status with OncoBEAM® RAS CRC assay (Sysmex Inostics, Hamburg, Germany). Plasma samples were stored at −80 °C.

2.4. ctDNA Extraction and Purification

ctDNA was extracted and purified using Qiagen’s QIAamp® circulating nucleic acid kit and QIAvac24 plus (Qiagen, Hilden, Germany) with modifications to the manufacturer’s protocol, as indicated by Sysmex Inostics.

2.5. BEAMing

For the detection of RAS mutations in ctDNA, the OncoBEAM® RAS CRC kit (Sysmex Inostics, Hamburg, Germany) was used, following the supplier’s protocol. OncoBEAM® RAS CRC kit (Sysmex Inostics, Hamburg, Germany) is able detecting 34 mutations in different codons of KRAS and NRAS. ctDNA extracted from plasma samples were amplified through a multiplex PCR, and samples then pooled and properly diluted were amplified through emulsion PCR. After the completion of the emulsion PCR, the drops were broken and the amplicons were retrieved, since they are bound to the magnetic beads. Subsequently, samples were hybridized with specific fluorescent probes and the fluorescent signals were then detected by Cube16 flow cytometer. Finally, data were analyzed by FCS Express software version 5.0.

2.6. Statistical Analysis

Categorial variables were reported as absolute frequencies and percentages, and continuous variables as median value and interquartile range (IQR). The Shapiro–Wilk test was used to test the normality assumption for data distribution.
The diagnostic performance of plasma BEAMing was assessed, considering tissue KRAS and NRAS analyses as a reference standard; sensitivity, specificity, positive predicted value (PPV), negative predictive value (NPV), and related 95% confidence intervals (CI) were estimated. The level of agreement between plasma and tissue KRAS and NRAS analyses was also evaluated using Cohen’s k test and its 95% CI.
Differences in the therapeutic response or survival in patients with WT or mutated plasma and tissue KRAS and NRAS were assessed using the Fisher exact test for unpaired data. Differences in median MAF KRAS and NRAS levels according to demographic, clinical, therapeutic, and outcome data were assessed, and compared using the Mann–Whitney test or the Kruskal–Wallis test for unpaired data, as appropriate.
In a post-analysis analysis, Receiving Operating Characteristics (ROC) curves were derived to assess the Area Under the ROC Curve (AUC) of MAF KRAS and NRAS levels in discriminating CRC patients with liver and lung metastases, respectively. Empirical estimation of the optimal cut-point for MAF KRAS and NRAS as a possible diagnostic test was computed using the Youden method.
Statistical significance was considered for p-values < 0.05. All analyses were conducted using the software Stata (StataCorp, version 14).

3. Results

Sixty-two patients suffering mCRC were enrolled; of them, 35 were men (56.5%), with a median age at inclusion of 67 (61–74) years. The demographic, clinical, and therapeutic features of the patients are summarized in Table 1.

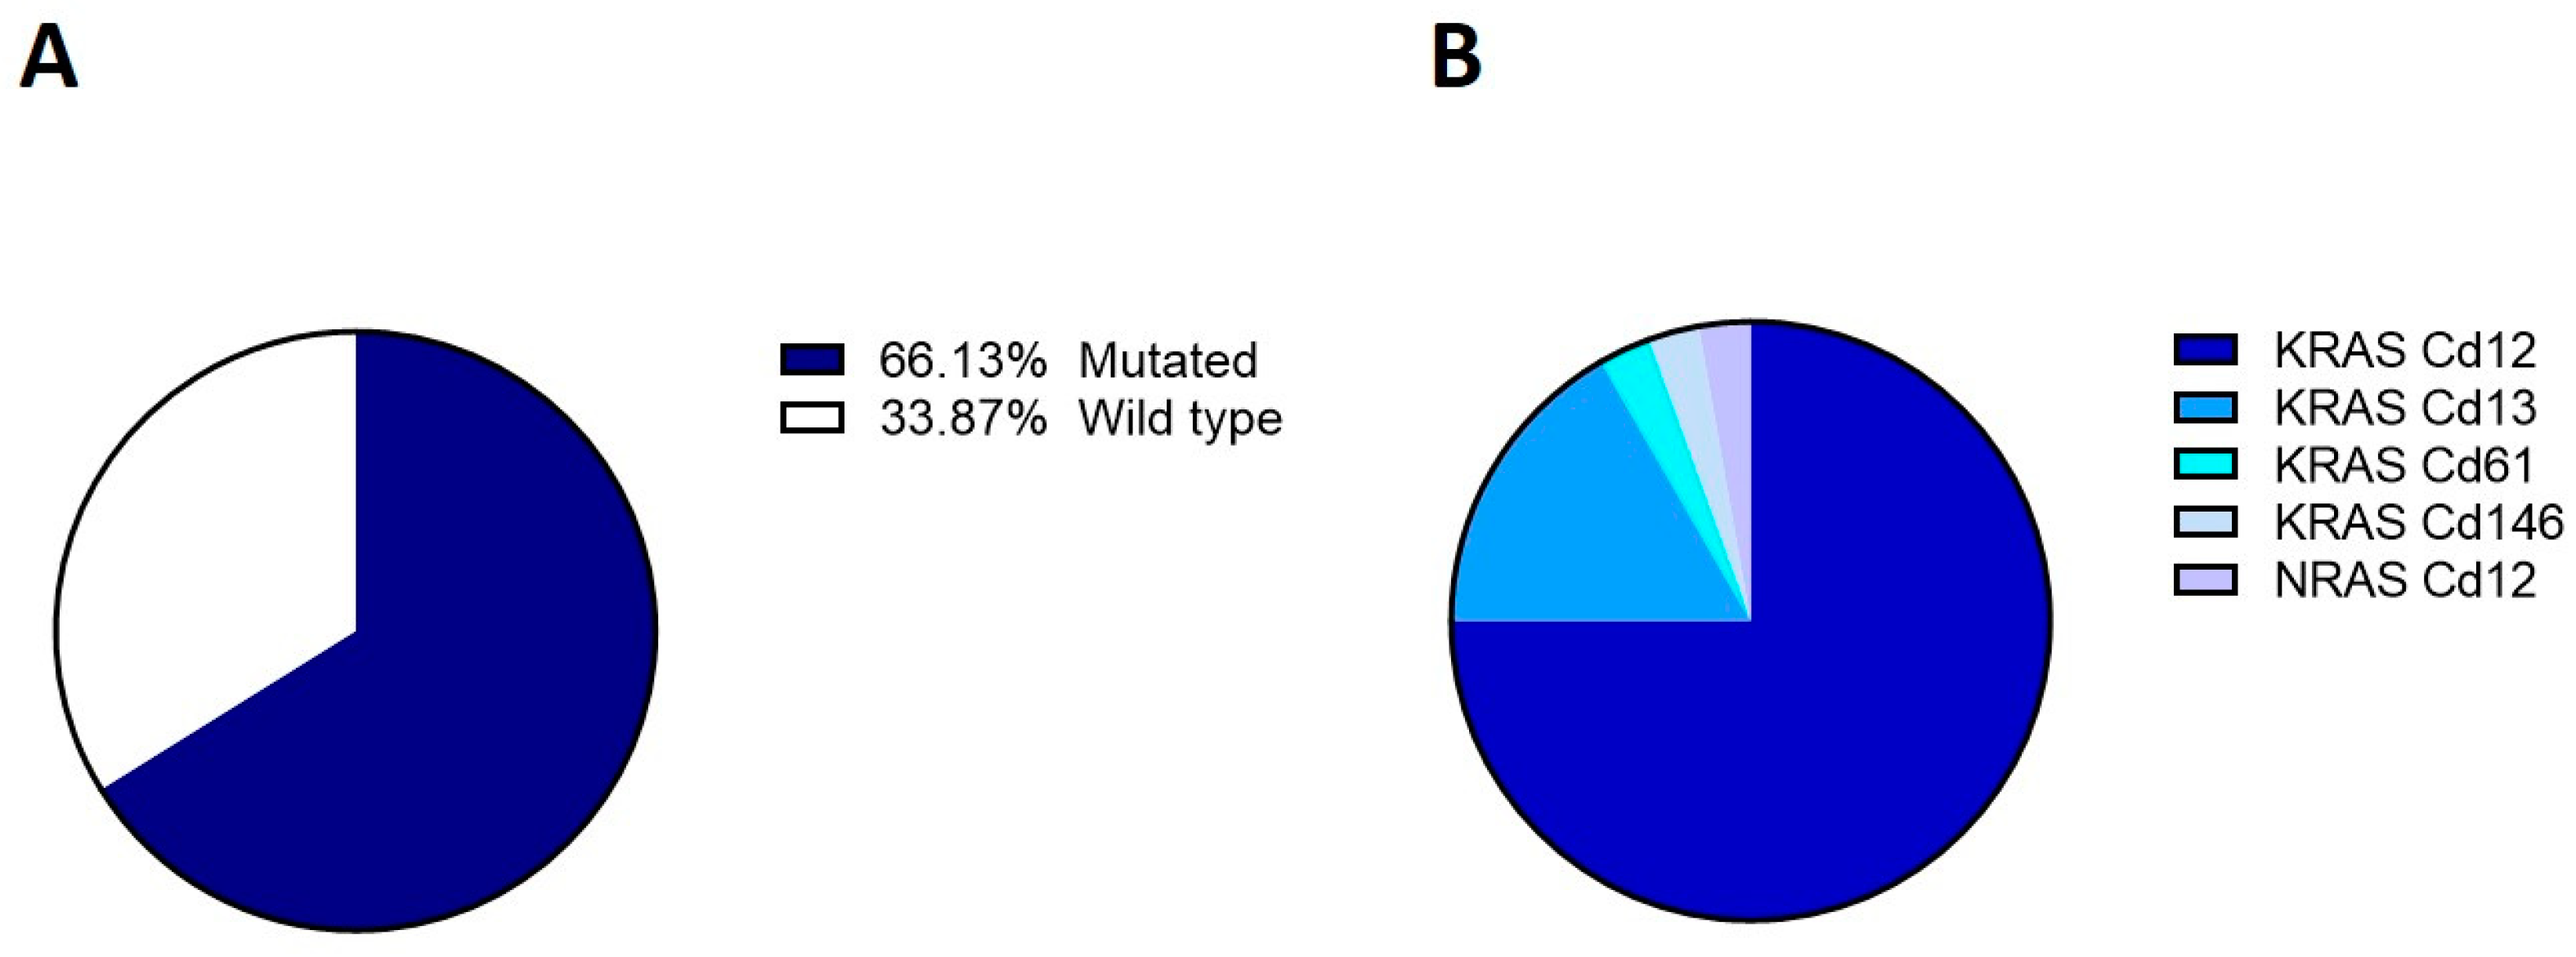
3.1. KRAS and NRAS Mutational Status in Tissue Samples

At molecular analysis of KRAS and NRAS in FFPE tumor tissue biopsies, 41 out of 62 patients (66.1%) harbored RAS mutations, while 21 (33.9%) were classified as WT. Only one patient (1.6%) showed NRAS mutation in the tissue (Figure 2). Information on BRAF mutational status in tissue biopsies was also available for 51/62 patients. Most patients displayed a WT BRAF (n = 46/51; 90.2%), with 5/51 (9.8%) presenting a mutated BRAF; all five patients with mutated BRAF were WT for KRAS and NRAS in tissue biopsies.

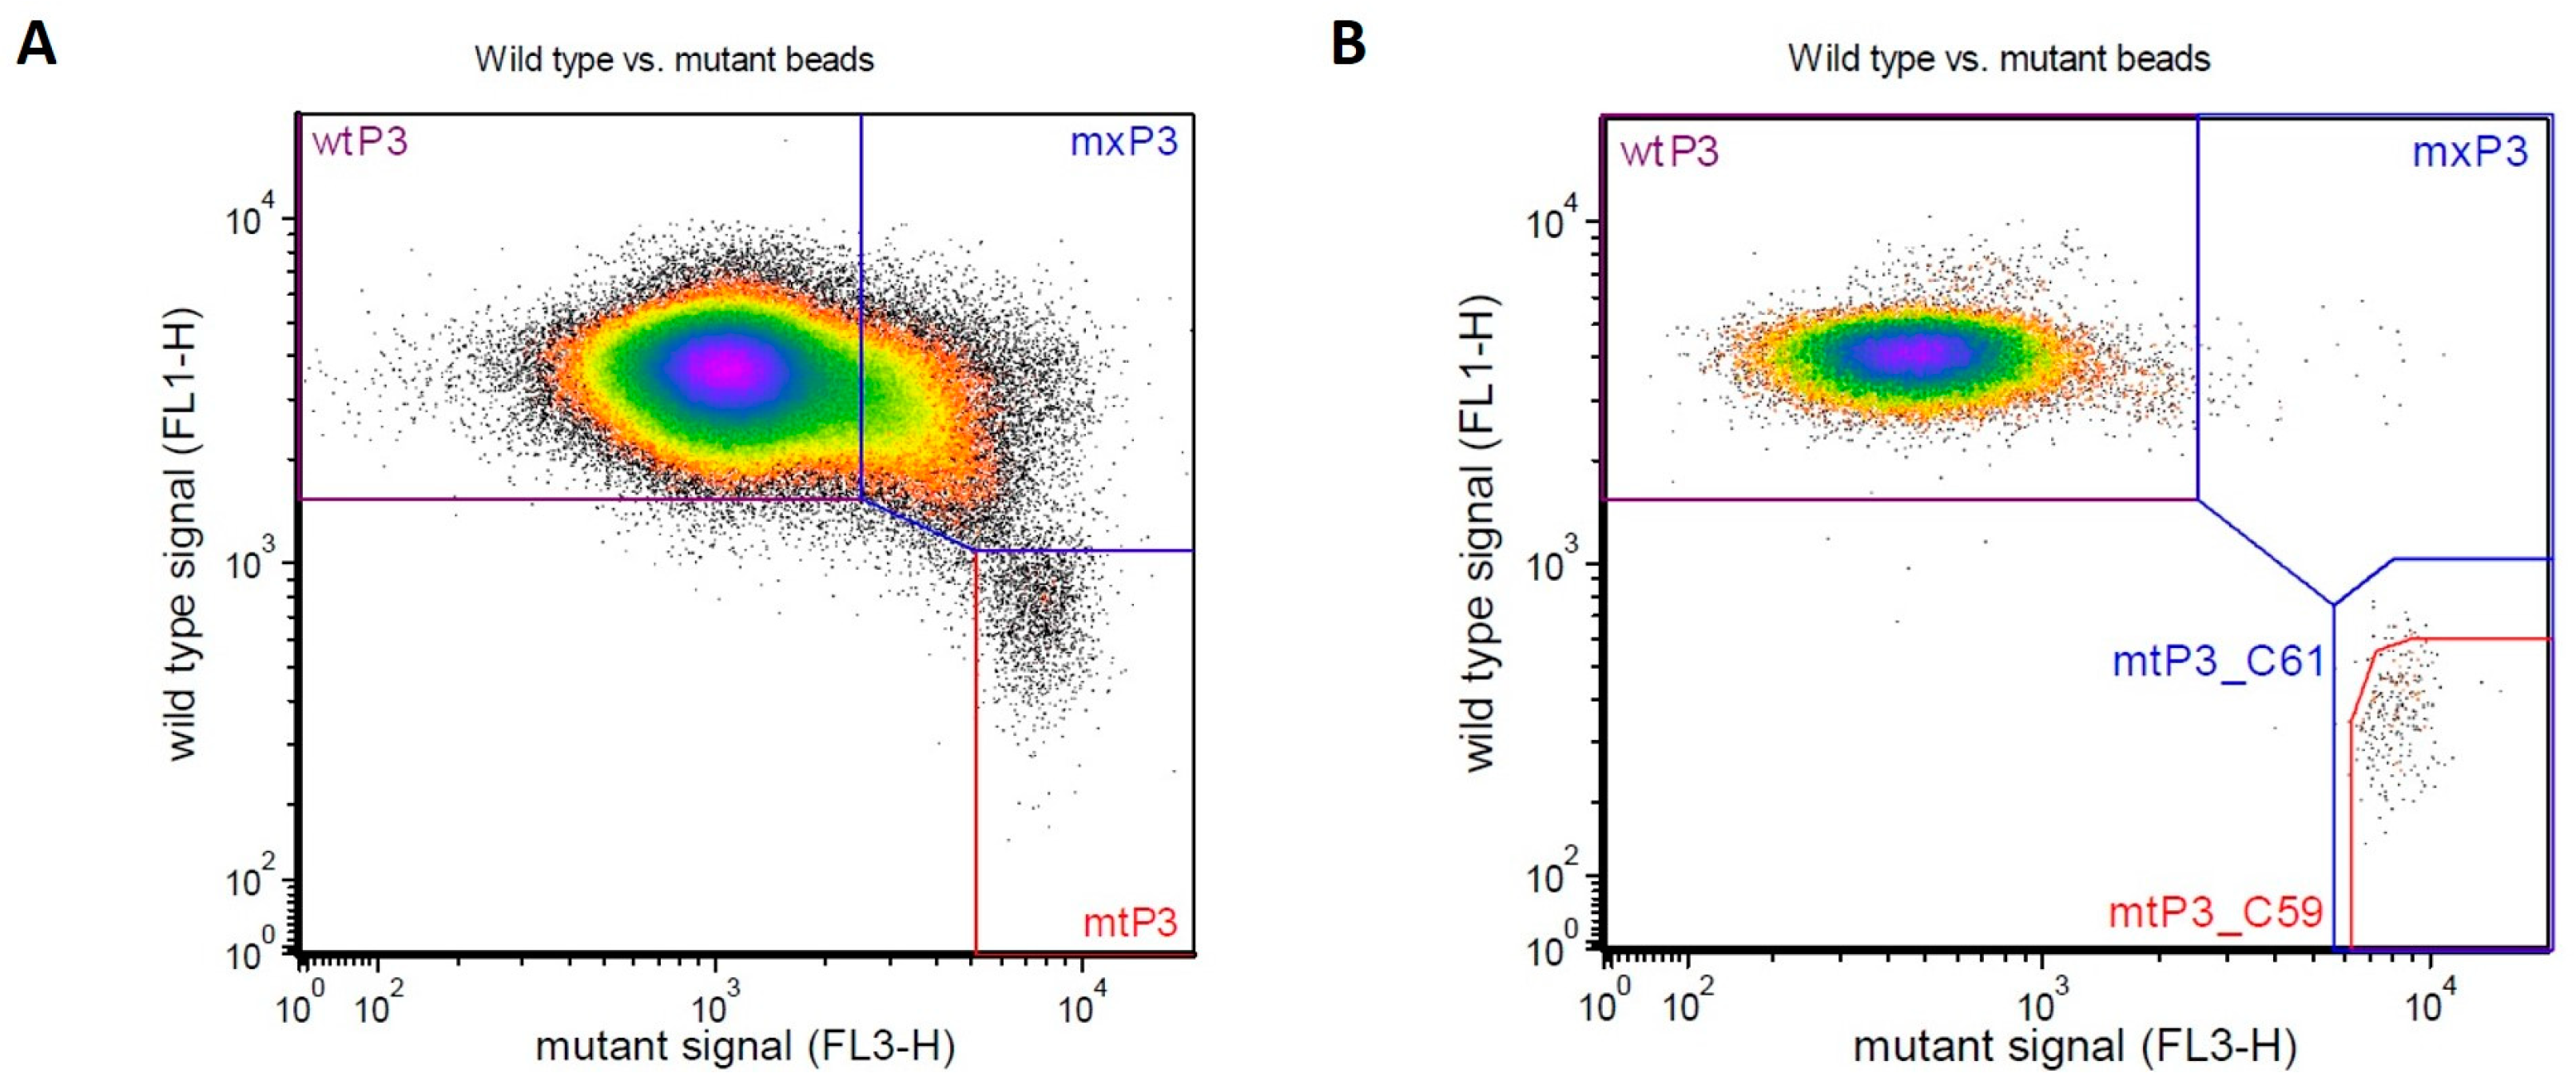
3.2. KRAS and NRAS Mutational Status Evaluation by BEAMing

RAS mutational status at the baseline were evaluated through BEAMing for all the patients whose plasma samples had appropriate quality and quantity (56 for KRAS; 61 for NRAS).
Overall, 43 out of 56 plasma samples were found to harbor KRAS mutations. As expected, KRAS codon 12 was confirmed to be the most frequently affected site in the cohort of patients under study, since mutations at this level were present in 38 out of 43 the mutated baseline samples. As for NRAS, only 6 out of 61 samples were found to harbor mutation at codon 12 (3 samples) and codon 61 (3 samples). Representative plots of samples harboring KRAS (codon 12) and NRAS (codon 61) mutations detected by BEAMing are shown in Figure 3.
In the dot plots obtained through flow cytometry, as for those reported in Figure 3, the mutant beads are present in the bottom right gate at variable extent, depending on the MAF values. The evaluation of the same samples was also carried out by a different technique and similar results were obtained (Lastraioli E et al., manuscript in preparation).

Diagnostic Performance and Concordance between Tissue and Plasma KRAS and NRAS

As a preliminary step, the concordance and diagnostic performance of KRAS and NRAS analysis as compared to tissue analyses was evaluated (Table 2a,b; Table 3a,b).
The sensitivity of BEAMing in identifying mutated KRAS was of 89.5% (95% CI 75.2–97.1%), with a fair specificity [50.0% (26.0–74.0%)], and PPV and NPV of 79.1% (70.2–85.9%) and 69.2% (44.4–86.4%), respectively.
Coherently, the agreement between tissue analysis and BEAMing was moderate [76.8%, Cohen’s k: 0.43 (0.17–0.68)] (Table 2a), with a similar concordance for the identification of the different codons [75.0%, Cohen’s k: 0.54 (0.33–0.75)] (Table 2b).
As for NRAS, the sensitivity of BEAMing in identifying mutated NRAS was high [100% (2.5–100%)], with a good specificity [91.7% (81.6–97.2%)] and NPV of 100%, but with a low PPV [16.7% (8.0–31.6%)]. The agreement between tissue analysis and BEAMing in identifying WT or mutated NRAS was fair (91.8% Cohen’s k: 0.27 (−0.15–0.68)) (Table 3a), with a similar concordance for the identification of the different codons (93.4%, Cohen’s k: 0.32, 0.15–0.80) (Table 3b).
Notably, the proportion of patients with concordant plasma and tissue KRAS or NRAS did not significantly differ according to sex, histology, grading, site of primary tumor, staging, site of metastasis (liver, peritoneum, lung, lymph nodes, locoregional), number of sites with metastasis, surgery, type of chemotherapy, or outcome or survival.

3.3. KRAS and NRAS Status and Clinical Outcomes

We further investigated whether KRAS or NRAS status was associated with clinical outcomes, including response to treatments and mortality. Information on the response to treatments was available for 43 out of 62 patients. Overall, three patients achieved complete response (7.0%), four partial response (9.3%), and eight maintained a stable disease (18.6%). Conversely, cancer progression was reported in 20 (46.5%), while in eight patients, the evaluation was not performed since it was too early (TE, 18.6%). Survival data were available for 36 out of 62 patients. After a median of 254 days (IQR 95–447) following inclusion in this study, 25 patients were still alive (69.4%) while 11 died (30.6%).
No significant difference in treatment outcome or survival was reported between patients with WT or mutated KRAS or NRAS (Supplementary Tables S1a,b and S2a,b).
As discussed in the introduction to this manuscript, RAS mutational status drives the choice of chemotherapic agents, particularly anti-EGFR, in clinical practice, as RAS mutation is associated with a poor response to anti-EGFR therapies. We therefore assessed the clinical response to anti-EGFR therapies in patients with WT RAS at tissue analyses but with mutated RAS at BEAMing (nine for KRAS and five for NRAS, including two patients with both KRAS and NRAS discordance). Disease progression was reported in four out of nine patients (44.4%) with discordant KRAS, and three out of four patients (75%) with discordant NRAS (for the fifth patient, data on response to treatment was not available). Three patients with discordant KRAS/NRAS received anti-EGFR treatment, and one of them experienced a disease progression. Notably, this patient had WT NRAS at tissue analysis but mutated NRAS at plasma analyses, with a MAF level of 0.516 and codon 61 mutation.

3.4. Assessment of KRAS and NRAS Mutant Allele Fraction

We further quantified the MAF (Table 4). The median MAF level for KRAS was of 0.16 (IQR 0.01–4.79; range 0–28.15). Notably, significantly higher levels were detected in patients with G2 tumor grading [0.49 (0.02–7.37)] as compared to those with G3 [0.01 (0.01–0.14)] or G4 (0.00) (p = 0.025). Higher MAF levels were also found in patients with liver metastasis [0.33 (0.02–6.76), as compared to 0.05 (0.01–0.44) in those without; p = 0.049], and in those who did not undergo surgery at site of primary tumor [5.46 (0.07–9.86), as compared to 0.06 (0.01–0.92) in those who underwent surgery; p = 0.010].
Regarding NRAS, the median level in the overall cohort was of 0.007 (IQ1 0.003–0.010; range 0.001–0.516). This level was significantly higher for patients with mucinous adenocarcinoma [0.027 (0.009–0.310), as compared to 0.006 (0.002–0.008) for those with adenocarcinoma; p = 0.004] and for those with lung metastasis [0.008 (0.006–0.017), as compared to 0.005 (0.002–0.009) for those without; p = 0.025].
We speculated that KRAS and NRAS levels of MAF in plasma might be a biomarker to early detect liver and lung metastases in CRC patients, respectively. Thus, a post hoc analysis was conducted to investigate the performance of MAF KRAS in identifying patients with liver metastasis, but the AUC was poor (0.66, 95% CI: 0.51, 0.80). An empirical cut-off of MAF KRAS of 0.196 was found to be optimal, but displayed a poor sensitivity (0.58) and specificity (0.68). Similarly, we assessed the performance of MAF NRAS in identifying patients with lung metastasis. An AUC of 0.68 (95%CI: 0.54–0.82) was found, the optimal empirical cut-off of MAF NRAS being 0.006, with a moderate sensitivity (0.78) and a poor specificity (0.51).

3.5. Monitoring of KRAS and NRAS Mutational Status over Time

For a subset of patients (n = 31), the MAF status was re-evaluated every 4 weeks from the beginning of the therapy (at 4 weeks, 8 weeks, and 12 weeks, and until the eventual progression of the disease). In the majority of patients, the presence or absence of mutations in KRAS and NRAS was maintained during the course of therapy. However, in some cases, variations are observed. The MAF values are reported in Table 5.
The values of MAF were plotted as a scatter plot for all the patients analyzed at the different follow-up timepoints (Figure 4). As can be observed, there is a wide variability between the samples, although the great majority of them fall into the 0.0–0.5 range.
For some of the patients, at least three evaluations were available, and, thus, MAF values were plotted in the graphs shown in Figure 5, reporting the number of weeks of treatment on the x axis and MAF values on the y axis.
The curves shown in Figure 5 represent four different possible responses to therapy that turned out to be associated with MAF trend. As can be noticed, the patient who received a complete response (blue curve) had quite low MAF levels at the baseline with a sharp increase at four weeks (that might be due to the efficacy of the therapy to eliminate wild type clones) followed by a decrease to zero at eight weeks. Similarly, the patient who got a partial response (green curve) had a similar trend but the MAF levels did not reach zero. The red curve is representative of a patient who had stable disease and in this case the baseline and 8-week MAF were comparable. Finally, the fourth case is that of a patient whose disease progressed (purple curve): the baseline MAF was low and with the treatment and it fell to zero, but after four weeks it started increasing rapidly and sharply.
Based on these observations, we then focused on patients whose disease was progressed to increased malignancy. In Figure 6, graphs of three representative patients are reported: for all of them, a sharp increase in the MAF values can be observed, confirming what was described for the purple curve in Figure 5. Additionally, when the dates of radiological and molecular progression were taken into account, it emerged that molecular progression (purple lines) always anticipated the radiological one (black lines).
Another interesting finding is represented by the detection of a double mutation in four samples (namely, Oncobio001 at 12 weeks, Oncobio017 at 4 weeks, Oncobio021 at baseline, and Oncobio030 at 4 weeks) (see Table 4). For Oncobio001 and 17, both mutations were detected in KRAS (codons 12 + 61 and codons 12 + 117, respectively), while in Oncobio021 and Oncobio030, one mutation was detected in KRAS (codon 12) and the other was in NRAS (codon 12).

4. Discussion

This study evaluated RAS mutations in plasma samples from patients with mCRC by the means of BEAMing technology, and assessed its diagnostic performance as compared to tissue analyses on tumor biopsies. The clinical value of monitoring plasma RAS mutational status during treatment was also investigated.
Assessing K- and NRAS mutational status in tumor biopsies is a common procedure in clinical practice, with relevant implications in the choice of the most appropriate pharmacological approach [8,9,10]. Indeed, mutations in these genes have been associated with a poor response to anti-EGFR therapies, and the assessment of K- and NRAS mutational status can therefore help in maximizing the likelihood of a patient’s response to chemotherapy [6,7]. In our cohort, the molecular evaluation of RAS mutational status in tumor tissue samples, performed by NGS, confirmed a low frequency of both KRAS [29] and NRAS mutations in mCRC patients, which is in agreement with the data reported in the literature for this type of tumor (1–5% for mCRC) [30].
The assessment of the allelic configuration of mutant oncogenes and their MAF in oncologic patients is relevant since mutations in driver oncogenes could influence drug response and resistance. This is, for instance, the case with KRAS [31,32]. In vivo data indicate that KRAS-mutant tumors have increased in proliferation and sensitivity to MEK inhibitors with respect to wild type tumors [32,33]. Nevertheless, it should be pointed out that although mutations in driver oncogenes are associated with diverse outcomes, MAF levels have not been shown to have an impact on survival or to help in predicting the response to targeted therapy in metastatic patients [34].
It is known that K- and NRAS mutational profiles should not only assessed at baseline but also monitored during follow-up in order to anticipate treatment outcomes. However, considering the general health conditions of metastatic patients, it is not bearable to manage it through tissue biopsies. For this reason, in recent years, evidence has been gathered concerning the importance of liquid biopsy as a surrogate of standard tissue biopsies for diagnostic purposes as well as for monitoring mCRC patients. Indeed, liquid biopsy can represent a minimally invasive and valuable tool for monitoring mCRC patients undergoing therapy.
In 2016, a meta-analysis was published showing that ctDNA represents an indicator for poor prognosis (both recurrence free survival, RFS, and overall survival, OS) in CRC patients [35]. In particular, an interesting study performed by Spindler et al. in 2014 [19] demonstrated that cfDNA increase had an impact on both PFS and OS. Moreover, by performing a parallel analysis of ctDNA and Circulating Tumor Cells (CTCs), it was shown that the former represents a better tool for CRC patients’ management, since ctDNA, but not CTCs, were detected in all the samples and a low volume of blood was sufficient for molecular analysis [36].
However, the concordance and diagnostic performance of BEAMing as compared to traditional tissue analyses is still a matter of debate [13,27,37]. Our results indicate a sensitivity for BEAMing in identifying KRAS mutations of 89.5%, with a fair specificity and a moderate agreement with tissue analysis. Conversely, the sensitivity for NRAS was high, with a good specificity, although the agreement was fair. It can be speculated that discordant KRAS or NRAS analyses, particularly in the case of WT tissue and mutated plasma results, can have a relevant clinical implication, as patients who are not candidates for anti-EGFR therapies might be treated with these agents, which are poorly effective in case of RAS mutation.
Regarding the double mutations found in some samples, although such a condition is infrequent and generally K- and NRAS mutations are mutually exclusive, the high sensitivity of BEAMing technology actually made it possible to detect subclonal mutations with extremely low frequency. It is worth noting that two of the three patients in which a double mutation was detected went towards disease progression, as already published by our group for another patient [26].
In addition to mutational status, we also quantified MAF levels in plasma in search of a possible association with clinical features. Significantly higher KRAS MAF levels were detected in patients with G2 tumor grading, liver metastasis, and in those who did not undergo surgery at site of primary tumor; as for NRAS, significantly higher levels were found in patients with mucinous adenocarcinoma or with lung metastasis. Nevertheless, both KRAS and NRAS MAF displayed a poor diagnostic performance in identifying patients with liver and lung metastasis, respectively, and their potential role as a diagnostic biomarker for early detection of metastasis in CRC patients is unclear. As MAF levels were quantified only in plasma and not in tissue biopsies, no correlation analysis could be performed between MAF levels in the two samples, either.
Routine monitoring of RAS mutational status and MAF levels is gaining importance in clinical practice in order to predict treatment outcomes early. In the majority of the patients analyzed in this study, the presence or absence of mutations in KRAS and NRAS was maintained during the course of therapy. However, in some cases, variations were observed, and taking into account the MAF values, more information can be derived. In general, a sharp MAF increase was associated with disease progression, in accordance with the published data, which referred to both RAS and other genes in CRC [24,38,39] and other tumors [40], such as, for example, pancreatic [41,42], lung [43], and breast cancer [44,45,46,47] detected by BEAMing or other techniques. Our data are in accordance with published results, since in CRC, it was shown that ctDNA levels decreased after surgery but might be detectable after 15–50 days, and the presence of mutations correlated to disease recurrence [48]. Our data represent a confirmation of the pilot work carried out by Misale et al. in a small cohort of CRC patients [49], too, since they reported that KRAS mutations could be detected in plasma 10 months before the radiological progression. Our data are obtained in a bigger cohort and with an optimized BEAMing protocol, but the same conclusions are derived from such analysis, as is the paper of Toledo et al. [24].

5. Conclusions

Taken together, our findings show that determining the molecular profile of the tumor becomes essential when dealing with mCRC patient treatment. Therefore, the development of a real-time molecular monitoring of tumor characteristics during sequential therapies could be a successful strategy in the direction of molecularly guided precision therapy, allowing clinicians and patients to gain considerable advantages that avoid unnecessary toxic effects and economic costs for ineffective treatment choices [26]. In fact, the possibility of success of a precision medicine approach therapy, choosing a specific molecular target, such as EGFR, and using monoclonal antibodies against it is strictly associated with the maintenance of a wild type status of RAS genes.
Moreover, the demonstration that molecular progression precedes the radiological one is particularly relevant, since it opens the possibility to use liquid biopsy to monitor patients during treatment and to give the oncologists the opportunity of a rapid intervention when disease starts progressing.
To this purpose, the molecular analysis of ctDNA from plasma, obtained through liquid biopsy, and performed with OncoBEAM RAS CRC assay, represent a great tool in order to study the mutational profile of biomarkers of responsiveness to targeted therapy, employing a minimally invasive approach, which is particularly important when it comes to treating metastatic patients.

Supplementary Materials

The following supporting information can be downloaded at: https://www.mdpi.com/article/10.3390/cells12111458/s1, Supplementary Table S1a,b: Tissue and plasma KRAS, according to survival and response; Supplementary Table S2a,b: Tissue and plasma NRAS, according to survival and response.

Author Contributions

Conceptualization, E.L. (Elena Lastraioli), A.A., F.D.C. and M.D.L.; methodology, E.L. (Elena Lastraioli); formal analysis, E.L. (Elena Lastraioli), A.B. and J.I.; investigation, E.L. (Elena Lastraioli); resources, E.L. (Elvira Limatola), E.P., C.B., D.C., M.I., F.D.C. and M.D.L.; data curation, E.L. (Elena Lastraioli), A.B. and J.I.; writing—original draft preparation, E.L. (Elena Lastraioli) and A.B.; writing—review and editing, E.L. (Elena Lastraioli) and A.B.; visualization, E.L. (Elena Lastraioli), A.B. and J.I.; supervision, F.D.C., M.D.L., A.A. and M.I.; project administration, E.L. (Elvira Limatola); funding acquisition, A.A., F.D.C. and M.D.L. All authors have read and agreed to the published version of the manuscript.

Funding

This research was funded by Fondazione Cassa di Risparmio di Pistoia e Pescia, grant ONCOBIO. A.B. was funded by a fellowship of Fondazione Cassa di Risparmio di Pistoia e Pescia within Giovani@Ricerca Scientifica program. J.I. was supported by Regione Tocana fellowship within the project “Progetti di alta formazione attraverso l’attivazione di Assegni di Ricerca” (MutCoP project) co-funded by Fondazione Cassa di Risparmio di Pistoia e Pescia and was formely funded by a fellowship of Fondazione Cassa di Risparmio di Pistoia e Pescia within Giovani@Ricerca Scientifica program.

Institutional Review Board Statement

The study was conducted in accordance with the Declaration of Helsinki, and approved by the Ethics Committee Comitato Etico Regionale per la Sperimentazione Clinica della Regione Toscana Sezione Area Vasta Centro, CEAVC (BIO.16.028, approved on 5 October 2016 and 15858_bio, approved on 5 March 2020).

Informed Consent Statement

Informed consent was obtained from all subjects involved in the study.

Data Availability Statement

Data are available upon request.

Conflicts of Interest

The authors declare no conflict of interest. The funders had no role in the design of the study; in the collection, analyses, or interpretation of data; in the writing of the manuscript, or in the decision to publish the results.

References

  1. Siegel, R.L.; Miller, K.D.; Goding Sauer, A.; Fedewa, S.A.; Butterly, L.F.; Anderson, J.C.; Cercek, A.; Smith, R.A.; Jemal, A. Colorectal cancer statistics, 2020. CA Cancer J. Clin. 2020, 70, 145–164. [Google Scholar] [CrossRef] [PubMed]
  2. Sung, H.; Ferlay, J.; Siegel, R.L.; Laversanne, M.; Soerjomataram, I.; Jemal, A.; Bray, F. Global Cancer Statistics 2020: GLOBOCAN Estimates of Incidence and Mortality Worldwide for 36 Cancers in 185 Countries. CA Cancer J. Clin. 2021, 71, 209–249. [Google Scholar] [CrossRef] [PubMed]
  3. Xie, Y.H.; Chen, Y.X.; Fang, J.Y. Comprehensive review of targeted therapy for colorectal cancer. Signal Transduct. Target. Ther. 2020, 5, 22. [Google Scholar] [PubMed]
  4. Messersmith, W.A. Systemic Management of Colorectal Cancer. J. Natl. Compr. Cancer Netw. 2017, 15, 699–702. [Google Scholar] [CrossRef]
  5. Li, Z.N.; Zhao, L.; Yu, L.F.; Wei, M.J. BRAF and KRAS mutations in metastatic colorectal cancer: Future perspectives for personalized therapy. Gastroenterol. Rep. 2020, 8, 192–205. [Google Scholar] [CrossRef]
  6. Qiu, L.X.; Mao, C.; Zhang, J.; Zhu, X.D.; Liao, R.Y.; Xue, K.; Li, J.; Chen, Q. Predictive and prognostic value of KRAS mutations in metastatic colorectal cancer patients treated with cetuximab: A meta-analysis of 22 studies. Eur. J. Cancer 2010, 46, 2781–2787. [Google Scholar] [CrossRef] [PubMed]
  7. Morris, V.K.; Bekaii-Saab, T. Improvements in Clinical Outcomes for BRAF V600E -Mutant Metastatic Colorectal Cancer. Clin. Cancer Res. 2020, 26, 4435–4441. [Google Scholar] [CrossRef]
  8. Allegra, C.J.; Rumble, R.B.; Hamilton, S.R.; Mangu, P.B.; Roach, N.; Hantel, A.; Schilsky, R.L. Extended RAS Gene Mutation Testing in Metastatic Colorectal Carcinoma to Predict Response to Anti-Epidermal Growth Factor Receptor Monoclonal Antibody Therapy: American Society of Clinical Oncology Provisional Clinical Opinion Update 2015. J. Clin. Oncol. 2016, 34, 179–185. [Google Scholar] [CrossRef]
  9. Van Cutsem, E.; Cervantes, A.; Adam, R.; Sobrero, A.; Van Krieken, J.H.; Aderka, D.; Aranda Aguilar, E.; Bardelli, A.; Benson, A.; Bodoky, G.; et al. ESMO consensus guidelines for the management of patients with metastatic colorectal cancer. Ann. Oncol. Off. J. Eur. Soc. Med. Oncol. 2016, 27, 1386–1422. [Google Scholar] [CrossRef]
  10. Benson, A.B.; Venook, A.P.; Al-Hawary, M.M.; Arain, M.A.; Chen, Y.J.; Ciombor, K.K.; Cohen, S.; Cooper, H.S.; Deming, D.; Farkas, L.; et al. Colon Cancer, Version 2.2021, NCCN Clinical Practice Guidelines in Oncology. J. Natl. Compr. Canc. Netw. 2021, 19, 329–359. [Google Scholar] [CrossRef]
  11. Gerlinger, M.; Rowan, A.J.; Horswell, S.; Larkin, J.; Endesfelder, D.; Gronroos, E.; Martinez, P.; Matthews, N.; Stewart, A.; Tarpey, P.; et al. Intratumor heterogeneity and branched evolution revealed by multiregion sequencing. N. Engl. J. Med. 2012, 366, 883–892. [Google Scholar] [CrossRef] [PubMed]
  12. Vidal, J.; Muinelo, L.; Dalmases, A.; Jones, F.; Edelstein, D.; Iglesias, M.; Orrillo, M.; Abalo, A.; Rodríguez, C.; Brozos, E.; et al. Plasma ctDNA RAS mutation analysis for the diagnosis and treatment monitoring of metastatic colorectal cancer patients. Ann. Oncol. Off. J. Eur. Soc. Med. Oncol. 2017, 28, 1325–1332. [Google Scholar] [CrossRef]
  13. García-Foncillas, J.; Tabernero, J.; Élez, E.; Aranda, E.; Benavides, M.; Camps, C.; Jantus-Lewintre, E.; López, R.; Muinelo-Romay, L.; Montagut, C.; et al. Prospective multicenter real-world RAS mutation comparison between OncoBEAM-based liquid biopsy and tissue analysis in metastatic colorectal cancer. Br. J. Cancer 2018, 119, 1464–1470. [Google Scholar] [CrossRef]
  14. Diehl, F.; Schmidt, K.; Durkee, K.H.; Moore, K.J.; Goodman, S.N.; Shuber, A.P.; Kinzler, K.W.; Vogelstein, B. Analysis of mutations in DNA isolated from plasma and stool of colorectal cancer patients. Gastroenterology 2008, 135, 489–498. [Google Scholar] [CrossRef] [PubMed]
  15. Bettegowda, C.; Sausen, M.; Leary, R.J.; Kinde, I.; Wang, Y.; Agrawal, N.; Bartlett, B.R.; Wang, H.; Luber, B.; Alani, R.M.; et al. Detection of circulating tumor DNA in early- and late-stage human malignancies. Sci. Transl. Med. 2014, 6, 224ra24. [Google Scholar] [CrossRef] [PubMed]
  16. El Messaoudi, S.; Mouliere, F.; Du Manoir, S.; Bascoul-Mollevi, C.; Gillet, B.; Nouaille, M.; Fiess, C.; Crapez, E.; Bibeau, F.; Theillet, C.; et al. Circulating DNA as a Strong Multimarker Prognostic Tool for Metastatic Colorectal Cancer Patient Management Care. Clin. Cancer Res. 2016, 22, 3067–3077. [Google Scholar] [CrossRef] [PubMed]
  17. Siravegna, G.; Mussolin, B.; Buscarino, M.; Corti, G.; Cassingena, A.; Crisafulli, G.; Ponzetti, A.; Cremolini, C.; Amatu, A.; Lauricella, C.; et al. Clonal evolution and resistance to EGFR blockade in the blood of colorectal cancer patients. Nat. Med. 2015, 21, 795–801. [Google Scholar] [CrossRef]
  18. Spindler, K.L.G.; Pallisgaard, N.; Vogelius, I.; Jakobsen, A. Quantitative cell-free DNA, KRAS, and BRAF mutations in plasma from patients with metastatic colorectal cancer during treatment with cetuximab and irinotecan. Clin. Cancer Res. 2012, 18, 1177–1185. [Google Scholar] [CrossRef]
  19. Spindler, K.L.G.; Appelt, A.L.; Pallisgaard, N.; Andersen, R.F.; Brandslund, I.; Jakobsen, A. Cell-free DNA in healthy individuals, noncancerous disease and strong prognostic value in colorectal cancer. Int. J. cancer 2014, 135, 2984–2991. [Google Scholar] [CrossRef]
  20. Cremolini, C.; Antoniotti, C.; Lonardi, S.; Aprile, G.; Bergamo, F.; Masi, G.; Grande, R.; Tonini, G.; Mescoli, C.; Cardellino, G.G.; et al. Activity and Safety of Cetuximab Plus Modified FOLFOXIRI Followed by Maintenance With Cetuximab or Bevacizumab for RAS and BRAF Wild-type Metastatic Colorectal Cancer: A Randomized Phase 2 Clinical Trial. JAMA Oncol. 2018, 4, 529–536. [Google Scholar] [CrossRef]
  21. Kim, T.W.; Peeters, M.; Thomas, A.; Gibbs, P.; Hool, K.; Zhang, J.; Ang, A.L.; Bach, B.A.; Price, T. Impact of Emergent Circulating Tumor DNA RAS Mutation in Panitumumab-Treated Chemoresistant Metastatic Colorectal Cancer. Clin. Cancer Res. 2018, 24, 5602–5609. [Google Scholar] [CrossRef] [PubMed]
  22. Maurel, J.; Alonso, V.; Escudero, P.; Fernández-Martos, C.; Salud, A.; Méndez, M.; Gallego, J.; Rodriguez, J.R.; Martín-Richard, M.; Fernández-Plana, J.; et al. Clinical Impact of Circulating Tumor RAS and BRAF Mutation Dynamics in Patients with Metastatic Colorectal Cancer Treated with First-Line Chemotherapy Plus Anti-Epidermal Growth Factor Receptor Therapy. JCO Precis. Oncol. 2019, 3, 1–16. [Google Scholar] [CrossRef] [PubMed]
  23. Siena, S.; Sartore-Bianchi, A.; Garcia-Carbonero, R.; Karthaus, M.; Smith, D.; Tabernero, J.; Van Cutsem, E.; Guan, X.; Boedigheimer, M.; Ang, A.; et al. Dynamic molecular analysis and clinical correlates of tumor evolution within a phase II trial of panitumumab-based therapy in metastatic colorectal cancer. Ann. Oncol. Off. J. Eur. Soc. Med. Oncol. 2018, 29, 119–126. [Google Scholar] [CrossRef] [PubMed]
  24. Toledo, R.A.; Cubillo, A.; Vega, E.; Garralda, E.; Alvarez, R.; de la Varga, L.U.; Pascual, J.R.; Sánchez, G.; Sarno, F.; Prieto, S.H.; et al. Clinical validation of prospective liquid biopsy monitoring in patients with wild-type RAS metastatic colorectal cancer treated with FOLFIRI-cetuximab. Oncotarget 2017, 8, 35289–35300. [Google Scholar] [CrossRef]
  25. Van Emburgh, B.O.; Arena, S.; Siravegna, G.; Lazzari, L.; Crisafulli, G.; Corti, G.; Mussolin, B.; Baldi, F.; Buscarino, M.; Bartolini, A.; et al. Acquired RAS or EGFR mutations and duration of response to EGFR blockade in colorectal cancer. Nat. Commun. 2016, 7, 13665. [Google Scholar] [CrossRef]
  26. Lastraioli, E.; Lavacchi, D.; Palmieri, V.E.; Castiglione, F.; Messerini, L.; Di Costanzo, F.; Antonuzzo, L. Evaluation of RAS mutational status through BEAMing assay to monitor disease progression of metastatic colorectal cancer: A case report. Anticancer. Drugs 2020, 31, 979–982. [Google Scholar] [CrossRef]
  27. Lastraioli, E.; Antonuzzo, L.; Fantechi, B.; Di Cerbo, L.; Di Costanzo, A.; Lavacchi, D.; Armenio, M.; Arcangeli, A.; Castiglione, F.; Messerini, L.; et al. KRAS and NRAS mutation detection in circulating DNA from patients with metastatic colorectal cancer using BEAMing assay: Concordance with standard biopsy and clinical evaluation. Oncol. Lett. 2021, 21, 15. [Google Scholar] [CrossRef] [PubMed]
  28. Eisenhauer, E.A.; Therasse, P.; Bogaerts, J.; Schwartz, L.H.; Sargent, D.; Ford, R.; Dancey, J.; Arbuck, S.; Gwyther, S.; Mooney, M.; et al. New response evaluation criteria in solid tumours: Revised RECIST guideline (version 1.1). Eur. J. Cancer 2009, 45, 228–247. [Google Scholar] [CrossRef] [PubMed]
  29. Van Cutsem, E.; Köhne, C.H.; Láng, I.; Folprecht, G.; Nowacki, M.P.; Cascinu, S.; Shchepotin, I.; Maurel, J.; Cunningham, D.; Tejpar, S.; et al. Cetuximab plus irinotecan, fluorouracil, and leucovorin as first-line treatment for metastatic colorectal cancer: Updated analysis of overall survival according to tumor KRAS and BRAF mutation status. J. Clin. Oncol. 2011, 29, 2011–2019. [Google Scholar] [CrossRef]
  30. Cercek, A.; Braghiroli, M.I.; Chou, J.F.; Hechtman, J.F.; Kemeny, N.; Saltz, L.; Capanu, M.; Yaeger, R. Clinical Features and Outcomes of Patients with Colorectal Cancers Harboring NRAS Mutations. Clin. Cancer Res. 2017, 23, 4753–4760. [Google Scholar] [CrossRef]
  31. Bielski, C.M.; Taylor, B.S. Mutant Allele Imbalance in Cancer. Annu. Rev. Cancer Biol. 2020, 5, 221–234. [Google Scholar] [CrossRef]
  32. Burgess, M.R.; Hwang, E.; Mroue, R.; Bielski, C.M.; Wandler, A.M.; Huang, B.J.; Firestone, A.J.; Young, A.; Lacap, J.A.; Crocker, L.; et al. KRAS Allelic Imbalance Enhances Fitness and Modulates MAP Kinase Dependence in Cancer. Cell 2017, 168, 817–829.e15. [Google Scholar] [CrossRef] [PubMed]
  33. Ambrogio, C.; Köhler, J.; Zhou, Z.W.; Wang, H.; Paranal, R.; Li, J.; Capelletti, M.; Caffarra, C.; Li, S.; Lv, Q.; et al. KRAS Dimerization Impacts MEK Inhibitor Sensitivity and Oncogenic Activity of Mutant KRAS. Cell 2018, 172, 857–868.e15. [Google Scholar] [CrossRef] [PubMed]
  34. Dienstmann, R.; Elez, E.; Argiles, G.; Matos, I.; Sanz-Garcia, E.; Ortiz, C.; Macarulla, T.; Capdevila, J.; Alsina, M.; Sauri, T.; et al. Analysis of mutant allele fractions in driver genes in colorectal cancer—Biological and clinical insights. Mol. Oncol. 2017, 11, 1263. [Google Scholar] [CrossRef] [PubMed]
  35. Basnet, S.; Zhang, Z.Y.; Liao, W.Q.; Li, S.H.; Li, P.S.; Ge, H.Y. The Prognostic Value of Circulating Cell-Free DNA in Colorectal Cancer: A Meta-Analysis. J. Cancer 2016, 7, 1105–1113. [Google Scholar] [CrossRef]
  36. Germano, G.; Mauri, G.; Siravegna, G.; Dive, C.; Pierce, J.; Di Nicolantonio, F.; D’Incalci, M.; Bardelli, A.; Siena, S.; Sartore-Bianchi, A. Parallel Evaluation of Circulating Tumor DNA and Circulating Tumor Cells in Metastatic Colorectal Cancer. Clin. Color. Cancer 2018, 17, 80–83. [Google Scholar] [CrossRef]
  37. Schmiegel, W.; Scott, R.J.; Dooley, S.; Lewis, W.; Meldrum, C.J.; Pockney, P.; Draganic, B.; Smith, S.; Hewitt, C.; Philimore, H.; et al. Blood-based detection of RAS mutations to guide anti-EGFR therapy in colorectal cancer patients: Concordance of results from circulating tumor DNA and tissue-based RAS testing. Mol. Oncol. 2017, 11, 208–219. [Google Scholar] [CrossRef]
  38. Valladares-Ayerbes, M.; Garcia-Alfonso, P.; Muñoz Luengo, J.; Pimentel Caceres, P.P.; Castillo Trujillo, O.A.; Vidal-Tocino, R.; Llanos, M.; Llorente Ayala, B.; Limon Miron, M.L.; Salud, A.; et al. Evolution of RAS Mutations in Cell-Free DNA of Patients with Tissue RAS Wild-Type Metastatic Colorectal Cancer Receiving First-Line Treatment: The PERSEIDA Study. Cancers 2022, 14, 6075. [Google Scholar] [CrossRef]
  39. Garciá-Foncillas, J.; Alba, E.; Aranda, E.; Diáz-Rubio, E.; López-López, R.; Tabernero, J.; Vivancos, A. Incorporating BEAMing technology as a liquid biopsy into clinical practice for the management of colorectal cancer patients: An expert taskforce review. Ann. Oncol. Off. J. Eur. Soc. Med. Oncol. 2017, 28, 2943–2949. [Google Scholar] [CrossRef]
  40. Crowley, E.; Di Nicolantonio, F.; Loupakis, F.; Bardelli, A. Liquid biopsy: Monitoring cancer-genetics in the blood. Nat. Rev. Clin. Oncol. 2013, 10, 472–484. [Google Scholar] [CrossRef]
  41. Toledano-Fonseca, M.; Cano, M.T.; Inga, E.; Rodríguez-Alonso, R.; Gómez-España, M.A.; Guil-Luna, S.; Mena-Osuna, R.; de la Haba-Rodríguez, J.R.; Rodríguez-Ariza, A.; Aranda, E. Circulating Cell-Free DNA-Based Liquid Biopsy Markers for the Non-Invasive Prognosis and Monitoring of Metastatic Pancreatic Cancer. Cancers 2020, 12, 1754. [Google Scholar] [CrossRef]
  42. Kruger, S.; Heinemann, V.; Ross, C.; Diehl, F.; Nagel, D.; Ormanns, S.; Liebmann, S.; Prinz-Bravin, I.; Westphalen, C.B.; Haas, M.; et al. Repeated mutKRAS ctDNA measurements represent a novel and promising tool for early response prediction and therapy monitoring in advanced pancreatic cancer. Ann. Oncol. Off. J. Eur. Soc. Med. Oncol. 2018, 29, 2348–2355. [Google Scholar] [CrossRef] [PubMed]
  43. Taus, Á.; Camacho, L.; Rocha, P.; Hardy-Werbin, M.; Pijuan, L.; Piquer, G.; López, E.; Dalmases, A.; Longarón, R.; Clavé, S.; et al. Dynamics of EGFR Mutation Load in Plasma for Prediction of Treatment Response and Disease Progression in Patients With EGFR-Mutant Lung Adenocarcinoma. Clin. Lung Cancer 2018, 19, 387–394.e2. [Google Scholar] [CrossRef] [PubMed]
  44. Davidson, B.A.; Croessmann, S.; Park, B.H. The breast is yet to come: Current and future utility of circulating tumour DNA in breast cancer. Br. J. Cancer 2021, 125, 780–788. [Google Scholar] [CrossRef] [PubMed]
  45. Bortolini Silveira, A.; Bidard, F.C.; Tanguy, M.L.; Girard, E.; Trédan, O.; Dubot, C.; Jacot, W.; Goncalves, A.; Debled, M.; Levy, C.; et al. Multimodal liquid biopsy for early monitoring and outcome prediction of chemotherapy in metastatic breast cancer. NPJ Breast Cancer 2021, 7, 115. [Google Scholar] [CrossRef] [PubMed]
  46. Olsson, E.; Winter, C.; George, A.; Chen, Y.; Howlin, J.; Tang, M.E.; Dahlgren, M.; Schulz, R.; Grabau, D.; Westen, D.; et al. Serial monitoring of circulating tumor DNA in patients with primary breast cancer for detection of occult metastatic disease. EMBO Mol. Med. 2015, 7, 1034–1047. [Google Scholar] [CrossRef]
  47. Hindson, B.J.; Ness, K.D.; Masquelier, D.A.; Belgrader, P.; Heredia, N.J.; Makarewicz, A.J.; Bright, I.J.; Lucero, M.Y.; Hiddessen, A.L.; Legler, T.C.; et al. High-throughput droplet digital PCR system for absolute quantitation of DNA copy number. Anal. Chem. 2011, 83, 8604–8610. [Google Scholar] [CrossRef]
  48. Diehl, F.; Schmidt, K.; Choti, M.A.; Romans, K.; Goodman, S.; Li, M.; Thornton, K.; Agrawal, N.; Sokoll, L.; Szabo, S.A.; et al. Circulating mutant DNA to assess tumor dynamics. Nat. Med. 2008, 14, 985–990. [Google Scholar] [CrossRef]
  49. Misale, S.; Yaeger, R.; Hobor, S.; Scala, E.; Janakiraman, M.; Liska, D.; Valtorta, E.; Schiavo, R.; Buscarino, M.; Siravegna, G.; et al. Emergence of KRAS mutations and acquired resistance to anti-EGFR therapy in colorectal cancer. Nature 2012, 486, 532–536. [Google Scholar] [CrossRef]
Figure 1. Schematic representation of the study design. T (time of blood collection): 0 (baseline, at the enrollment); 1 (at 4 weeks after treatment start); 2 (after 8 weeks of treatment); PD (at disease progression).
Cells 12 01458 g001
Figure 2. K-and NRAS profile in tumor tissue. (A) Frequency of RAS genotype in the cohort under study; (B) Frequency of K-and NRAS mutations.
Cells 12 01458 g002
Figure 3. K-and NRAS mutations detected by OncoBEAM® RAS CRC assay in representative samples. (A) KRAS Codon 12; (B) NRAS Codon 61 (gated along with Codon 59, as per manufacturer’s specifications).
Cells 12 01458 g003
Figure 4. Scatter plot showing the distribution of the Mutant Allele Fraction values during the therapy (at the baseline and after 4, 8, and 12 weeks).
Cells 12 01458 g004
Figure 5. Akima spiline plots showing the distribution of the Mutant Allele Fraction values over time (at the baseline and after 4 and 8 weeks of treatment) for four representative patients with different best response. PD: Progressed Disease; SD: Stable Disease; PR: Partial Response; CR: Complete Response.
Cells 12 01458 g005
Figure 6. Mutant Allele Fraction values over time (at the baseline and after 4, 8, and 12 weeks of treatment) for three representative patients with Progressed Disease.
Cells 12 01458 g006
Table 1. Demographic, clinical, and molecular features of the patients enrolled in the study.
Tot (n = 62) *
Demographics
Male sex35 (56.5%)
Age at inclusion, median (IQR)67 (61–74)
Histology
Adenocarcinoma55 (88.7%)
Mucinous adenocarcinoma7 (11.3%)
Grading
G226 (41.9%)
G311 (17.7%)
G41 (1.6%)
Missing24 (38.7%)
Site of primary lesion
Colon46 (74.2%)
Rectal10 (16.1%)
Transverse colon2 (3.2%)
Missing4 (6.5%)
Staging
IV (new diagnosis)21 (33.9%)
IV (relapse)14 (22.6%)
Missing27 (43.6%)
Number of metastases
128 (45.2%)
224 (38.7%)
3+10 (16.1%)
Site of metastasis
Liver37 (59.7%)
Lung18 (29.0%)
Loco-regional12 (19.4%)
Lymph nodes12 (19.4%)
Peritoneum12 (19.4%)
Pleura5 (8.1%)
Adrenal gland3 (4.8%)
Bone2 (3.2%)
Kidney2 (3.2%)
Pancreas1 (1.6%)
Endometrium1 (1.6%)
Bladder1 (1.6%)
Brain1 (1.6%)
Surgery on primary site48 (77.4%)
Chemotherapy
Yes47 (75.8%)
No1 (1.6%)
Missing14 (22.6%)
Chemotherapy agents
Only synthetic agents17 (27.4%)
Only targeted biologics5 (8.1%)
Combination of synthetic and biologics25 (40.3%)
* n (%) or median (IQR).
Table 2. (a,b) Diagnostic performance of KRAS detected in plasma as compared to KRAS detected in tissue.
(a)
Tissue KRAS
WTMutatedValue (95% CI)
Plasma KRAS
WT9 (14.5%)4 (6.5%)Cohen’s K: 0.43 (0.17–0.68)
Mutated9 (14.5%)34 (54.8%)Sensitivity: 89.5% (75.2–97.1%)
Specificity: 50.0% (26.0–74.0%)
Not Informative3 (4.8%)3 (4.8%)PPV: 79.1% (70.2–85.9%)
NPV: 69.2% (44.4–86.4%)
(b)
Tissue KRAS
Cd12Cd13Cd146WTConcordance
Plasma KRAS
Cd1228 (45.2%)1 (1.6%)09 (14.5%)Kappa: 0.54 (95% CI: 0.33–0.75); % agreement: 75%
Cd1304 (6.5%)00
Cd146001 (1.6%)0
WT3 (4.8%)1 (1.6%)09 (14.5%)
Not Informative3 (4.8%)003 (4.8%)
Table 3. (a,b) Diagnostic performance of plasma NRAS as compared to tissue NRAS.
(a)
Tissue NRAS
WTMutatedValue (95% CI)
Plasma NRAS
WT55 (88.7%)0Cohen’s K: 0.27 (−0.15–0.68)
Mutated5 (8.1%)1 (1.6%)Sensitivity: 100.0% (2.5–100%)
Specificity: 91.7% (81.6–97.2%)
Not Informative1 (1.6%)0PPV: 16.7% (8.0–31.6%)
NPV: 100%
(b)
Tissue NRAS
Cd12WTConcordance
Plasma NRAS
Cd121 (1.6%)2 (3.2%)Kappa: 0.32 (95% CI: −0.15–0.80); % agreement: 93.4%
Cd6103 (4.8%)
WT055 (88.7%)
Not Informative01 (1.6%)
Table 4. Mutant allele fraction (MAF) of KRAS and NRAS, overall and stratified according to the main demographic, clinical, and therapeutic features.
MAF KRAS
(Median, IQR)
p-Value § MAF NRAS
(Median, IQR)
p-Value §
Overalln = 550.16 (IQR 0.01–4.79; range 0–28.15) n = 610.007 (IQ1 0.003–0.010; range 0.001–0.516)
Demographics
Male sex n = 230.22 (0.01–5.46)0.511n = 340.006 (0.003–0.009)0.425
Female sex n = 320.06 (0.01–2.05) n = 270.007 (0.002–0.014)
Histology
ADKn = 480.17 (0.02–3.90)0.990n = 540.006 (0.002–0.008)0.004 *
Colloid ADKn = 70.05 (0.01–13.0) n = 70.027 (0.009–0.310)
Grading
G2n = 2420.49 (0.02–7.37)0.025 *n = 250.005 (0.003–0.010)0.828
G3n = 80.01 (0.01–0.14) n = 110.007 (0.002–0.011)
G4n = 10.00 n = 10.006
Missingn = 220.25 (0.03–3.10) n = 240.007 (0.004–0.009)
Site of primary lesion
Colonn = 430.22 (0.01–5.46)0.660n = 450.007 (0.003–0.010)0.189
Rectaln = 80.06 (0.04–0.60) n = 100.007 (0.003–0.010)
Transverse colonn = 20.04 (0.01–0.06) n = 20.002
Missingn = 21.62 (1.62–3.10) n = 40.007 (0.005–0.007)
Staging
IV (new diagnosis) n = 200.71 (0.04–9.01)0.330n = 200.008 (0.006–0.105)0.575
IV (relapse)n = 120.48 (0.01–5.07) n = 140.011 (0.004–0.030)
Missingn = 230.06 (0.01–0.33) n = 270.004 (0.002–0.007)
Number of metastases
1 n = 260.23 (0.01–1.00)0.776n = 280.005 (0.002–0.008)0.243
2 n = 210.06 (0.01–7.66) n = 230.007 (0.003–0.010)
3+n = 80.15 (0.04–5.07) n = 100.007 (0.004–0.014)
Site of metastasis
LiverNo: n = 22; Yes: n = 33No: 0.05 (0.01–0.44)
Yes: 0.33 (0.02–6.76)
0.049 *No: n = 24; Yes: n = 37No: 0.005 (0.003–0.007)
Yes: 0.007 (0.003–0.13)
0.061
LungNo: n = 41; Yes: n = 14No: 0.05 (0.07–0.77)
Yes: 0.96 (0.04–5.61)
0.113No: n = 43; Yes: n = 18No: 0.005 (0.002–0.009)
Yes: 0.008 (0.006–0.017)
0.025 *
Loco-regional No: n = 45; Yes: n = 10No: 0.16 (0.01–5.26)
Yes: 0.24 (0.02–1.00)
0.785No: n = 49;
Yes: n = 12
No: 0.007 (0.003–0.011)
Yes: 0.007 (0.003–0.007)
0.315
Lymph nodesNo: n = 43; Yes: n = 12No: 0.16 (0.01–1.00)
Yes: 0.23 (0.01–6.11)
0.514No: n = 50; Yes: n = 11No: 0.006 (0.002–0.009)
Yes: 0.009 (0.004–0.014)
0.100
PeritoneumNo: n = 43; Yes: n = 12No: 0.32 (0.01–5.26)
Yes: 0.05 (0.01–0.15)
0.139No: n = 50; Yes: n = 11No: 0.007 (0.003–0.009)
Yes: 0.007 (0.002–0.056)
0.799
BoneNo: n = 53
Yes: n = 2
No: 0.16 (0.01–4.69)
Yes: 0.09 (0.01–0.17)
-No: n = 59
Yes: n = 2
No: 0.007 (0.003–0.010)
Yes: 0.04 (0.004–0.004)
-
Surgery on primary site
Yesn = 420.06 (0.01–0.92)0.010 *n = 470.008 (0.006–0.010)0.126
No n = 135.46 (0.07–9.86) n = 140.006 (0.002–0.010)
Chemotherapy
Non = 10.01-n = 10.007-
Yes (any)n = 420.17 (0.01–5.26) n = 470.007 (0.003–0.010)
Only synthetic agents n = 140.36 (0.01–8.16)0.359 **n = 170.007 (0.005–0.007)0.343 **
Only targeted biologicsn = 40.02 (0.01–0.12) n = 50.013 (0.011–0.469)
Combination of synthetic and biologics n = 240.17 (0.01–3.13) n = 250.005 (0.002–0.10)
Missing n = 120.25 (0.04–3.90) n = 130.006 (0.002–0.009)
Response
Complete responsen = 30.01 (0.01–0.02)0.160n = 30.011 (0.004–0.469)0.552
Partial responsen = 40.03 (0.00–3.58) n = 40.006 (0.004–0.007)
Stable diseasen = 60.09 (0.01–0.23) n = 80.006 (0.003–0.012)
Progressive diseasen = 170.44 (0.03–1.00) n = 200.007 (0.003–0.010)
TEn = 70.33 (0.16–3.10)
Missingn = 180.11 (0.01–5.46) n = 180.005 (0.002–0.008)
Survival
Survivedn = 220.11 (0.01–0.39)0.459n = 250.004 (0.002–0.007)0.182
Deceasedn = 90.22 (0.01–8.16) n = 110.007 (0.003–0.009)
Missingn = 240.53 (0.02–6.18) n = 250.008 (0.004–0.017)
§ excluding missing values; * statistically significant for p < 0.05. ** p-values are referred to the comparison between the three chemotherapy approaches (only synthetic agents, only targeted biologics, and their combination).
Table 5. MAF values of KRAS mutational status at the baseline and during treatment, type of therapy, and response in mCRC patients enrolled in the study. M: mutated; WT: wild type; END: end of the study; PR: partial response; PD: progressed disease; CR: complete response; SD: stable disease.
Baseline4 Weeks8 Weeks12 Weeks48 WeeksTherapyBest Response
Oncobio001M (0.042)Low DNAM (0.340)M (0.418 + 0.156 Cd61)ENDFOLFIRI + BEVACIZUMABPD
Oncobio002M (0.173)WT (0.010)M (0.127) FOLFIRI + BEVACIZUMABSD
Oncobio003M (0.012)M (0.254)Low DNA FOLFIRICR
Oncobio004M (7.103)Low DNAM (0.604) XELOXPR
Oncobio005M (0.060)M (0.530)M (0.082) CAPOX + BEVACIZUMABPR
Oncobio006Low plasma volLow DNA XELOXSD
Oncobio007WT (0.005)WT (0.006)M (0.102) FOLFOX + VECTIBIXPR
Oncobio008WT (0.010)M (0.105)Low plasma vol 0.011FOLFIRI + VECTIBIXSD
Oncobio009WT (0.005)WT (0.010)M (0.503) FOLFIRI + VECTIBIXSD
Oncobio010M (0.012)M (0.040)ENDCAPOX + BEVACIZUMABPD
Oncobio011M (0.233)M (0.038)M (0.451) CAPECITABINE + PANITUMUMABSD
Oncobio012M (0.771)ENDCAPOXPD
Oncobio013M (8.159)M (0.382)ENDFOLFOXIRIPD
Oncobio014Low plasma volLow plasma volM (0.218)M (1.995) CAPOX + BEVACIZUMABSD
Oncobio015WT (0.010)ENDCAPOX + BEVACIZUMABPD
Oncobio016WT (0.005)M (0.050)WT (0.011) FOLFIRI + BEVACIZUMAB
Oncobio017M (0.334)M (0.461 + 0.065 Cd117) FOLFOX
Oncobio018Low plasma volM (0.251)M (0.290)ENDFOLFIRI + BEVACIZUMABPD
Oncobio019M (0.317)M (0.351)M (0.242) CAPECITABINE + BEVACIZUMAB
Oncobio020M (0.026)M (0.045)M (0.137) ENDCAPOX + BEVACIZUMABPD
Oncobio021M (0.038 +
0.056 NRAS Cd12)
M (0.054)Low plasma volENDCAPOX + BEVACIZUMABPD
Oncobio022M (0.437)M (0.112)Low DNA CAPOX + BEVACIZUMABSD
Oncobio023M (0.393)M (0.110)M (0.017) FOLFOXPR
Oncobio024WT (0.003)M (0.018)WT (0.008) OXALIPLATINPR
Oncobio025M (0.162)M (0.063) DEGRAMONT + BEVA
Oncobio026Low plasma volLow plasma volLow plasma vol CAPECITABINE + BEVACIZUMAB
Oncobio027M (1.004)Low plasma volM (1.044)ENDFOLFOX + BEVACIZUMABPD
Oncobio028Low plasma volM (0.015)M (0.038) FOLFOX
Oncobio029M (0.218)WT (0.005)ENDPEMBROLIZUMABPD
Oncobio030M (3.102)M (0.358 + 0.047 NRAS Cd12)
Oncobio031M (0.021)M (0.012)WT (0.008) FOLFIRI + BEVACIZUMAB
Disclaimer/Publisher’s Note: The statements, opinions and data contained in all publications are solely those of the individual author(s) and contributor(s) and not of MDPI and/or the editor(s). MDPI and/or the editor(s) disclaim responsibility for any injury to people or property resulting from any ideas, methods, instructions or products referred to in the content.

