Article

Allyl Isothiocianate Induces Ca2+ Signals and Nitric Oxide Release by Inducing Reactive Oxygen Species Production in the Human Cerebrovascular Endothelial Cell Line hCMEC/D3

1
Department of Biomedicine, School of Medicine, Benemérita Universidad Autónoma de Puebla, Puebla 72410, Mexico
2
Laboratory of General Physiology, Department of Biology and Biotechnology “L. Spallanzani”, University of Pavia, 27100 Pavia, Italy
3
Department of Molecular Medicine, University of Pavia, 27100 Pavia, Italy
4
Department of Health Sciences, University of Magna Graecia, 88100 Catanzaro, Italy
*
Author to whom correspondence should be addressed.
Cells 2023, 12(13), 1732; https://doi.org/10.3390/cells12131732
Submission received: 29 May 2023 / Revised: 20 June 2023 / Accepted: 24 June 2023 / Published: 27 June 2023

Abstract

:
Nitric oxide (NO) represents a crucial mediator to regulate cerebral blood flow (CBF) in the human brain both under basal conditions and in response to somatosensory stimulation. An increase in intracellular Ca2+ concentrations ([Ca2+]i) stimulates the endothelial NO synthase to produce NO in human cerebrovascular endothelial cells. Therefore, targeting the endothelial ion channel machinery could represent a promising strategy to rescue endothelial NO signalling in traumatic brain injury and neurodegenerative disorders. Allyl isothiocyanate (AITC), a major active constituent of cruciferous vegetables, was found to increase CBF in non-human preclinical models, but it is still unknown whether it stimulates NO release in human brain capillary endothelial cells. In the present investigation, we showed that AITC evoked a Ca2+-dependent NO release in the human cerebrovascular endothelial cell line, hCMEC/D3. The Ca2+ response to AITC was shaped by both intra- and extracellular Ca2+ sources, although it was insensitive to the pharmacological blockade of transient receptor potential ankyrin 1, which is regarded to be among the main molecular targets of AITC. In accord, AITC failed to induce transmembrane currents or to elicit membrane hyperpolarization, although NS309, a selective opener of the small- and intermediate-conductance Ca2+-activated K+ channels, induced a significant membrane hyperpolarization. The AITC-evoked Ca2+ signal was triggered by the production of cytosolic, but not mitochondrial, reactive oxygen species (ROS), and was supported by store-operated Ca2+ entry (SOCE). Conversely, the Ca2+ response to AITC did not require Ca2+ mobilization from the endoplasmic reticulum, lysosomes or mitochondria. However, pharmacological manipulation revealed that AITC-dependent ROS generation inhibited plasma membrane Ca2+-ATPase (PMCA) activity, thereby attenuating Ca2+ removal across the plasma membrane and resulting in a sustained increase in [Ca2+]i. In accord, the AITC-evoked NO release was driven by ROS generation and required ROS-dependent inhibition of PMCA activity. These data suggest that AITC could be exploited to restore NO signalling and restore CBF in brain disorders that feature neurovascular dysfunction.

Graphical Abstract

1. Introduction

The central nervous system (CNS) is not able to store energy, and therefore, neuronal activity is maintained by the continuous supply of oxygen and nutrients through the capillary bed [1], which accounts for ~90% of brain vasculature [2]. The mechanisms by which an increase in the firing rate leads to an increase in cerebral blood flow (CBF) to active neurons is known as neurovascular coupling (NVC) or functional hyperemia [1]. Capillary endothelial cells (cECs), which represent the core component of the blood–brain barrier (BBB), are also able to sense neuronal activity and thereby signal upstream arterioles to dilate and increase CBF to firing neurons [3,4,5,6]. In mouse brain cortical vasculature, synaptically released neurotransmitters cause an increase in endothelial Ca2+ concentration by stimulating inositol-1,4,5-trisphosphate (InsP3) receptors (InsP3Rs) and transient receptor potential vanilloid 4 (TRPV4) channels, which are, respectively, located on the endoplasmic reticulum (ER) and the plasma membrane (PM) [4,7,8]. The ensuing Ca2+-dependent recruitment of endothelial nitric oxide (NO) synthase (eNOS) is instrumental to generating the gasotransmitter NO [9], which dilates upstream arterioles and redirects local CBF through the active capillary branches [4]. NO is also fundamental in maintaining basal CBF [10] and initiating NVC upon somatosensory stimulation in the human brain [11]. Human brain cECs can release NO in response to a variety of neurotransmitters and neuromodulators [12,13,14,15,16], which evoke an increase in intracellular Ca2+ concentration to engage the eNOS. The Ca2+ response to neurohumoral mediators is triggered by ER Ca2+ mobilization through InsP3Rs and lysosomal Ca2+ release through two-pore channels (TPCs) and is sustained over time by store-operated Ca2+ entry (SOCE) [12,13,14,15,16]. Conversely, ryanodine receptors are absent in hCMEC/D3 cells and do not contribute to agonist-induced Ca2+ signals [12]. Targeting the endothelial Ca2+-handling machinery could, therefore, provide an alternative approach to rescue NO signalling, CBF and NVC in cerebrovascular disorders [17,18].
Allyl isothiocyanate (AITC) is an organosulfur phytochemical compound that is an abundant constituent of common cruciferous vegetables, such as broccoli, cabbage, mustard, brussels sprouts and cauliflower [19,20]. AITC induced vasodilation in rat cerebral arteries in both ex vivo brain slices [20,21] and the brain of living animals [22] via an endothelial-dependent mechanism. The hemodynamic response to AITC in rat cortical vasculature requires extracellular Ca2+ entry via Transient Receptor Potential Ankyrin 1 (TRPA1) channels [20]. Nevertheless, AITC has also been found to induce intracellular Ca2+ signals via a TRPA1-independent mechanism, which involves the production of reactive oxygen species (ROS). However, the sources(s) of AITC-induced ROS-dependent Ca2+ signals remain(s) to be identified [23,24,25]. Similarly, it is still unknown whether ROS may support the endothelial Ca2+ response to AITC and whether this Ca2+ signal leads to NO release in human brain cECs.
In the present investigation, we sought to assess whether and how AITC evokes Ca2+-dependent NO release in hCMEC/D3 cells, which represent the most widespread model of human cerebrovascular cECs [26,27,28,29]. We found that AITC induced NO production through the ROS-dependent inhibition of plasma membrane Ca2+-ATPase (PMCA) activity, which resulted in the accumulation of intracellular Ca2+ and eNOS engagement. These findings support the view that AITC administration represents a promising strategy to rescue NO signalling in cerebral disorders associated to endothelial dysfunction.

2. Materials and Methods

2.1. Cell Culture

Human cerebral microvascular endothelial cells (hCMEC/D3) were obtained from Institut National de la Santé et de la Recherche Médicale (INSERM, Paris, France). hCMEC/D3 cells cultured between passage 25 and 35 were used. As described in [30], the cells were seeded at a concentration of 27.000 cells/cm2 and grown in tissue culture flasks coated with 0.1 mg/mL rat tail collagen type 1, in the following medium: EBM-2 medium (Lonza, Basel, Switzerland) supplemented with 5% fetal bovine serum, 1% Penicillin-Streptomycin, 1.4 μM hydrocortisone, 5 μg/mL ascorbic acid, 1/100 chemically defined lipid concentrate (Life Technologies, Milan, Italy), 10 mM HEPES and 1 ng/mL basic fibroblast growth factor. The cells were cultured at 37 °C, 5% CO2-saturated humidity.

2.2. Solutions

Physiological salt solution (PSS) had the following composition (in mM): 150 NaCl, 6 KCl, 1.5 CaCl2, 1 MgCl2, 10 glucose, 10 HEPES. In Ca2+-free solution (0Ca2+), Ca2+ was substituted with 2 mM NaCl, and 0.5 mM EGTA was added. Solutions were titrated to pH 7.4 with NaOH. The osmolality of PSS as measured with an osmometer (Wescor 5500, Logan, UT, USA) was 300–310 mOsm/L.

2.3. [Ca2+]i, NO and ROS Imaging

AITC-TRPA1-mediated changes in [Ca2+]i were monitored in hCMEC/D3 cells loaded with the selective Ca2+-fluorophore, loaded with 4 µM fura-2 acetoxymethyl ester (Fura-2/AM; 1 mM stock in dimethyl sulfoxide) in PSS for 30 min at 37 °C and 5% CO2, as described in [12]. After washing in PSS, the coverslip was fixed to the bottom of a Petri dish and the cells were observed by an upright epifluorescence Axiolab microscope (Carl Zeiss, Oberkochen, Germany), usually equipped with a Zeiss ×40 Achroplan objective (water-immersion, 2.0 mm working distance, 0.9 numerical aperture). The cells were excited alternately at 340 and 380 nm, and the emitted light was detected at 510 nm. A first neutral density filter (1 or 0.3 optical density) reduced the overall intensity of the excitation light, and a second neutral density filter (optical density = 0.3) was coupled to the 380 nm filter to approach the intensity of the 340 nm light. A round diaphragm was used to increase the contrast. The excitation filters were mounted on a filter wheel (Lambda 10, Sutter Instrument, Novato, CA, USA). Custom software, working in the LINUX environment, was used to drive the camera (Extended-ISIS Camera, Photonic Science, Millham, UK) and the filter wheel, and to measure and plot online the fluorescence from 10 up to 40 rectangular “regions of interest” (ROIs). Each ROI was identified by a number. Since cell borders were not clearly identifiable, a ROI may not include the whole cell or may include part of an adjacent cell. Adjacent ROIs never superimposed. [Ca2+]i was monitored by measuring, for each ROI, the ratio of the mean fluorescence emitted at 510 nm when exciting alternatively at 340 and 380 nm (F340/F380). An increase in [Ca2+]i causes an increase in the ratio [31]. Ratio measurements were performed and plotted online every 3 s. The experiments were performed at room temperature (22 °C).
To evaluate NO release, hCMEC/D3 cells were loaded with 4-Amino-5-methylamino-2′,7′-difluorofluorescein diacetate (DAF-FM) (1 µM) for 60 min in PSS at 22 °C, as illustrated in [30]. DAF-FM fluorescence was measured by using the same imaging setup described above for Ca2+ measurements but with a different filter set, i.e., excitation at 480 nm and emission at 535 nm wavelength (emission intensity denoted as NOi (F535/F0)). The changes in DAF-FM fluorescence evoked by extracellular stimulation were recorded and plotted online every 5 s. Measurements of NO were performed at 22 °C.
To measure ROS production, hCMEC/D3 cells were loaded with 2′,7′-dichlorodihydrofluorescein diacetate (H2DCF–DA) (2 µM) in PSS for 30 min at 22 °C, as recently described [32,33]. After washout of the excess fluorophore from the extracellular solution, H2DCF-DA fluorescence of the probes was recorded (excitation/emission wavelengths, 490/520 nm) by using the same imaging setup described above (denoted as ROS (F491/F0)). ROS production was measured at 22 °C.
The cellular production of NO and ROS was reported as relative fluorescence (F/F0) of DAF (for NO) and H2DCF-Da (for ROS), where F is the fluorescence intensity obtained during recordings and F0 is the basal fluorescence intensity.

2.4. Electrophysiological Recordings

The presence of AITC-evoked membrane current was assessed by using a Port-a-patch planar patch-clamp system (Nanion Technologies, Munich, Germany) in the whole-cell, voltage-clamp or current-clamp configurations, at room temperature (22 °C), as described in [16]. Cultured cells (2–3 days after plating) were detached with Detachin and suspended at a cell density of 1–5 × 10⁶ cells/mL in external recording solution containing (in mM): 145 NaCl, 2.8 KCl, 2 MgCl2, 10 CaCl2, 10 HEPES and 10 D-glucose (pH = 7.4). Suspended cells were placed on the NPC© chip surface, and the whole-cell configuration was achieved. Internal recording solution, containing (in mM) 10 CsCl, 110 CsF, 10 NaCl, 10 HEPES and 10 EGTA (pH = 7.2, adjusted with CsOH), was deposited in recording chips, having resistances of 3–5 MΩ. The bioelectrical response to agonist (AITC or NS309) stimulation was recorded in the current-clamp mode or in the voltage-clamp mode by using an EPC-10 patch-clamp amplifier (HEKA, Munich, Germany). Changes in the membrane potential were measured in the current-clamp mode, as shown in [34], whereas the current-to-voltage relationship of agonist-evoked membrane current was evaluated in the voltage-clamp mode by applying, every 1 s, voltage ramps ranging from −100 mV to +100 mV from a holding potential of −70 mV, as described in [35,36]. Immediately after the whole-cell configuration was established, the cell capacitance and the series resistances (<10 MΩ) were measured. During recordings, these two parameters were measured, and if exceeding ≥10% with respect to the initial value, the experiment was discontinued [37]. Liquid junction potential and capacitive currents were cancelled using the automatic compensation of the EPC-10. Data were filtered at 10 kHz and sampled at 5 kHz [38].

2.5. Immunoblotting

Total proteins from primary hCMEC/D3 cells were treated with a RIPA buffer (150 mM NaCl, 0.5% sodium deoxycholate, 0.1% SDS, 0.1% Triton X-100 and 50 mM Tris-HCl, pH 8) supplemented with the protease inhibitor cocktail cOmplete (cOmplete Tablets EASYpack, 04693116001; Merck, Milan, Italy). Total proteins were solubilized in a Laemmli buffer, and 20 µg of proteins was separated by SDS-PAGE using precast gel electrophoresis (4–20% Mini-PROTEAN TGX Stain-Free Gels, Bio-Rad, Segrate, Italy) [12,39] and blotted onto the PVDF Membrane (Trans-Blot Turbo Transfer Pack, #1704156, Bio-Rad, Segrate, Italy) with the Trans-Blot Turbo Transfer System (#1704150, Bio-Rad, Segrate, Italy). After blocking for 1 h at RT in Tris-buffered saline containing 5% nonfat dry milk and 0.1% Tween (blocking solution), membranes were incubated overnight with anti-TRPA1 rabbit antibody (PA146159, 1:500 dilution; Thermo Fisher Scientific, Monza, Italy) in a blocking solution. After washing, the membranes were incubated for 1 h with goat anti-rabbit IgG antibody, peroxidase-conjugated (1:100,000; AP132P; Millipore part of Merck S.p.a., Vimodrone, Italy). Chemiluminescence detection of the bands was performed by incubating the blots with the Westar Supernova Western blotting detection system (CYANAGEN, Bologna, Italy), and the molecular weights were identified using pre-stained molecular weight markers (#161-0376, Bio-Rad Laboratories, Hercules, CA, USA). Anti-β2-microglobulin (B2M) rabbit monoclonal (ab75853, 1:10,000; Abcam, Cambridge, UK) was used on the stripped membrane [12]. Protein bands were detected with the iBright™ CL1000 Imaging System (Thermo Fisher Scientific, Monza, Italy).

2.6. Statistics

All the data have been obtained from hCMEC/D3 cells from three independent experiments. The amplitude of agonist-evoked Ca2+ signals was measured as the difference between the ratio at the Ca2+ peak and the mean ratio of 30 s baseline before the peak. The dose–response data in Figure 2B were fitted by using the following equation:
Y = 100 1 + E C 50 A I T C
where Y is the response (relative to the amplitude of the Ca2+ response), [AITC] is the AITC concentration and EC50 is the half-maximal effective concentration. The decay time of cyclopiazonic acid (CPA)-evoked Ca2+ signals was computed as the time in which [Ca2+]i decayed from 80% to 20% of its peak amplitude (t80-20) [40,41]. The amplitude of AITC-induced NO production was evaluated as the difference between the maximal increase in DAF-FM fluorescence and the average of 1 min baseline before the peak. The amplitude of AITC-induced ROS production was evaluated as the difference between the maximal increase in H2DCF-DA fluorescence and the average of 1 min baseline before the peak. Statistical significance (p < 0.05) was evaluated by two-tailed Student’s t-test for unpaired observations or one-way ANOVA analysis followed by the post hoc Dunnett’s test, as appropriate. Data relative to Ca2+, NO and ROS signals are presented as mean ± SE, whereas the number of cells analyzed is indicated in the corresponding bar histograms. The tracings shown in each figure are representative of the Ca2+, NO and ROS signals evoked by each agonist in three independent experiments for each condition.

2.7. Chemicals

Fura-2/AM and DAF-FM/AM were purchased from Molecular Probes (Molecular Probes Europe BV, Leiden, The Netherlands). BTP-2 was obtained from Tocris (Bristol, UK). All other chemicals were of analytical grade and obtained from Sigma Chemical Co. (St. Louis, MO, USA).

3. Results

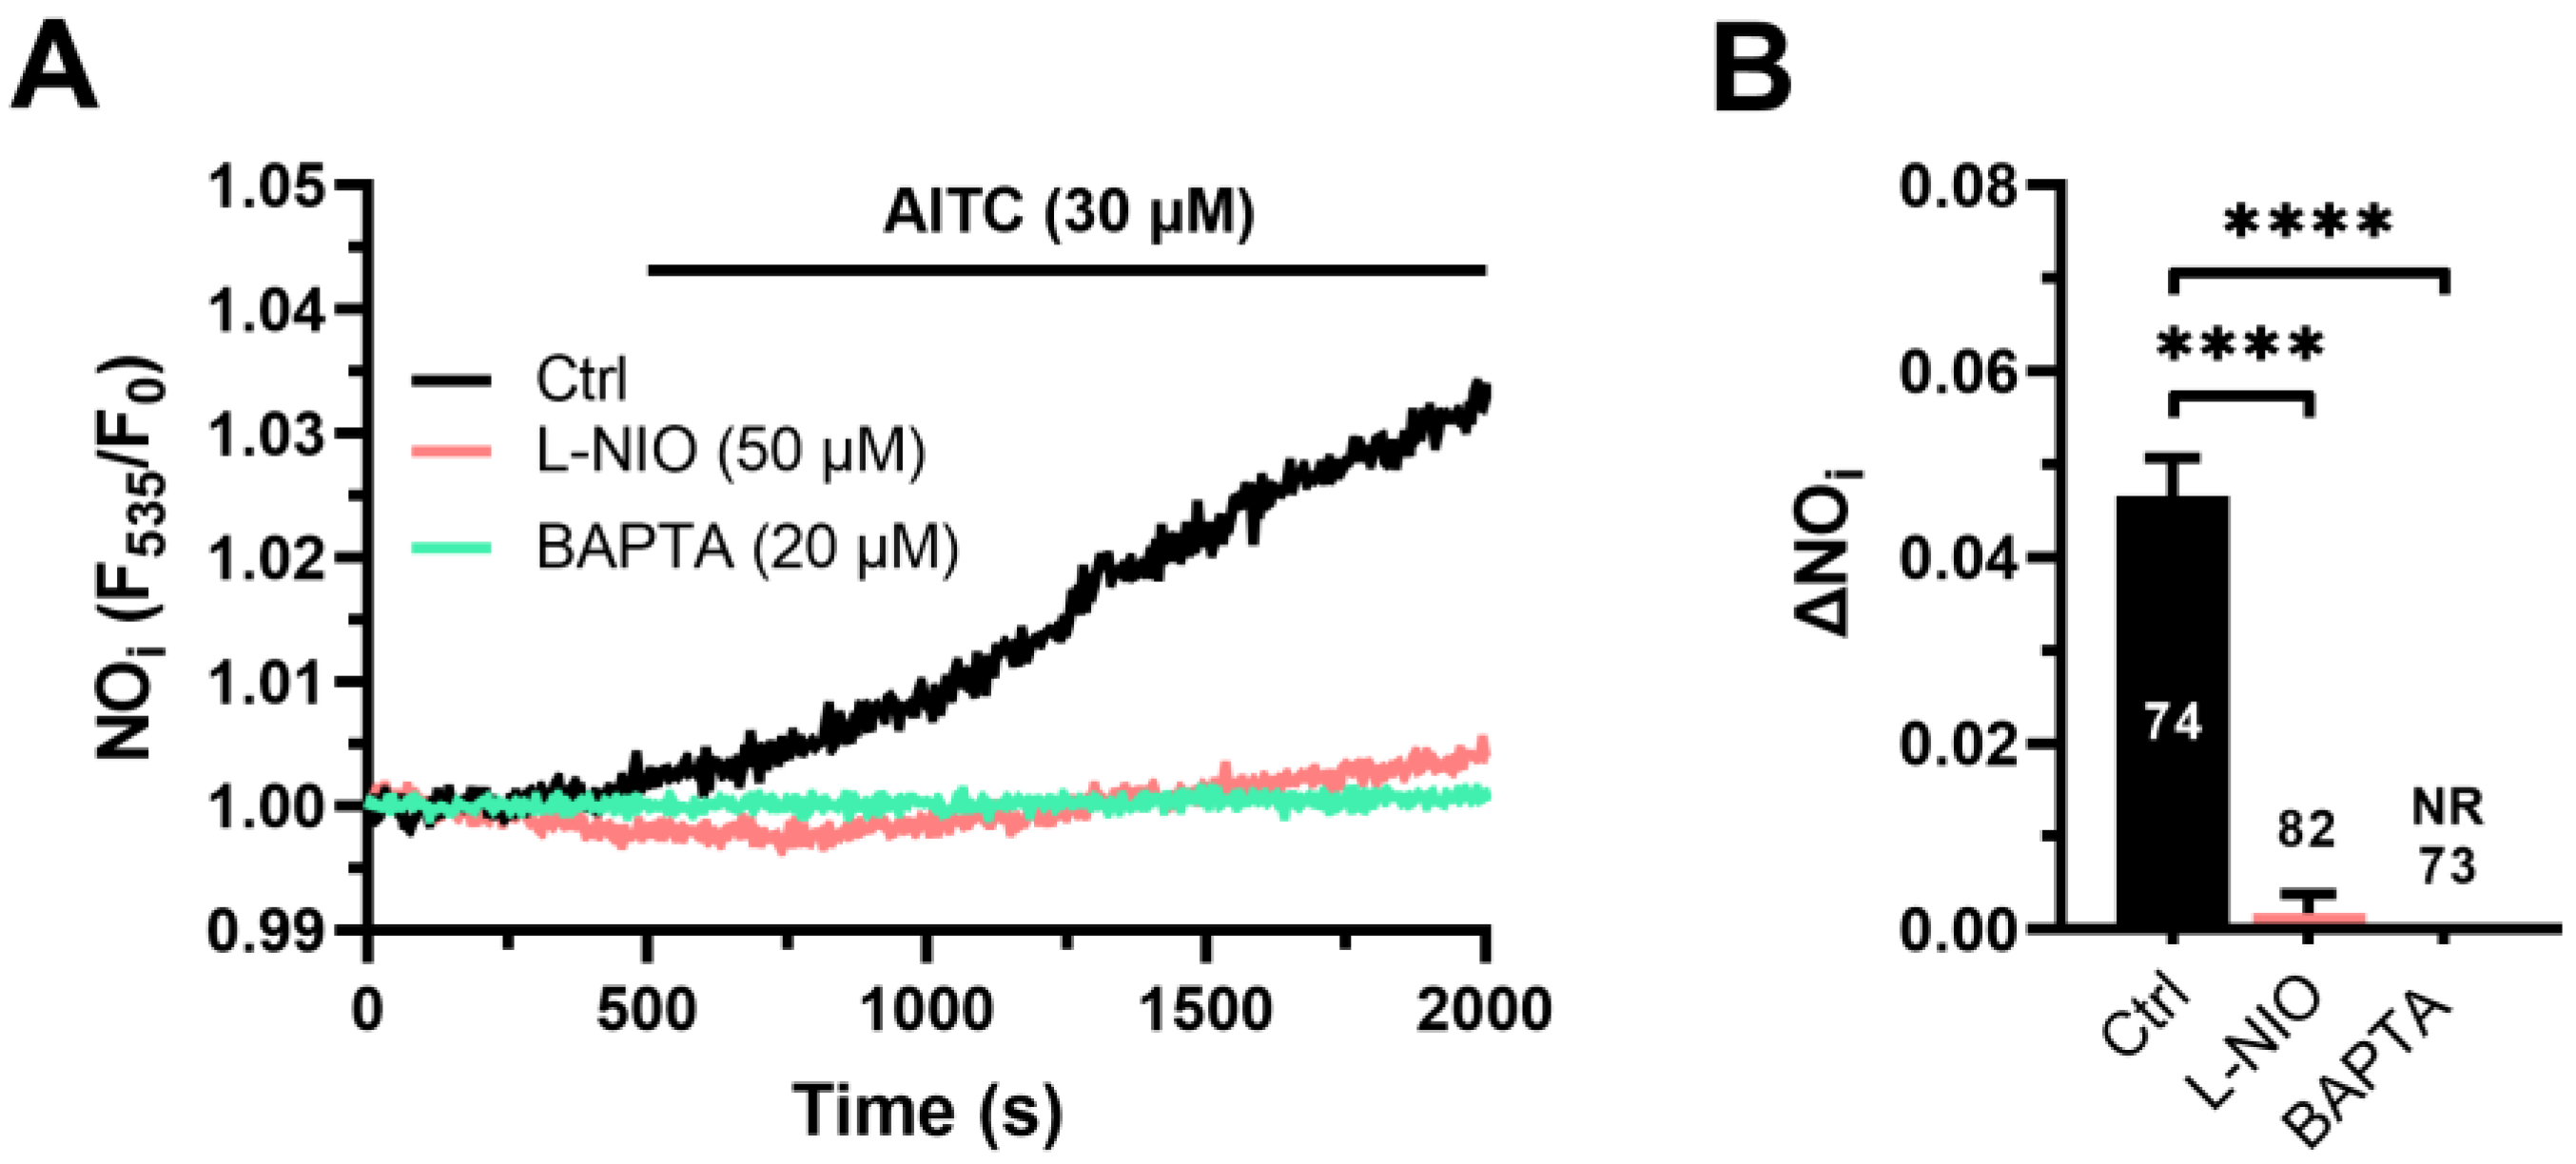
3.1. AITC Evokes Ca2+-Dependent NO Release in hCMEC/D3 Cells

AITC (30 µM) evoked a slowly rising increase in DAF-FM fluorescence (Figure 1A), which reflected NO release and developed after a latency of 299.3 ± 10.8 s (n = 134). AITC-evoked NO release was significantly (p < 0.05) reduced by L-NIO di-hydrochloride (L-NIO; 50 µM), a selective blocker of eNOS activity [15], (Figure 1A,B). Furthermore, AITC-evoked NO release was prevented by buffering intracellular Ca2+ with BAPTA-AM (20 µM) (Figure 1A,B). Overall, these findings indicate that AITC stimulates NO production in a Ca2+-dependent manner in hCMEC/D3 cells.

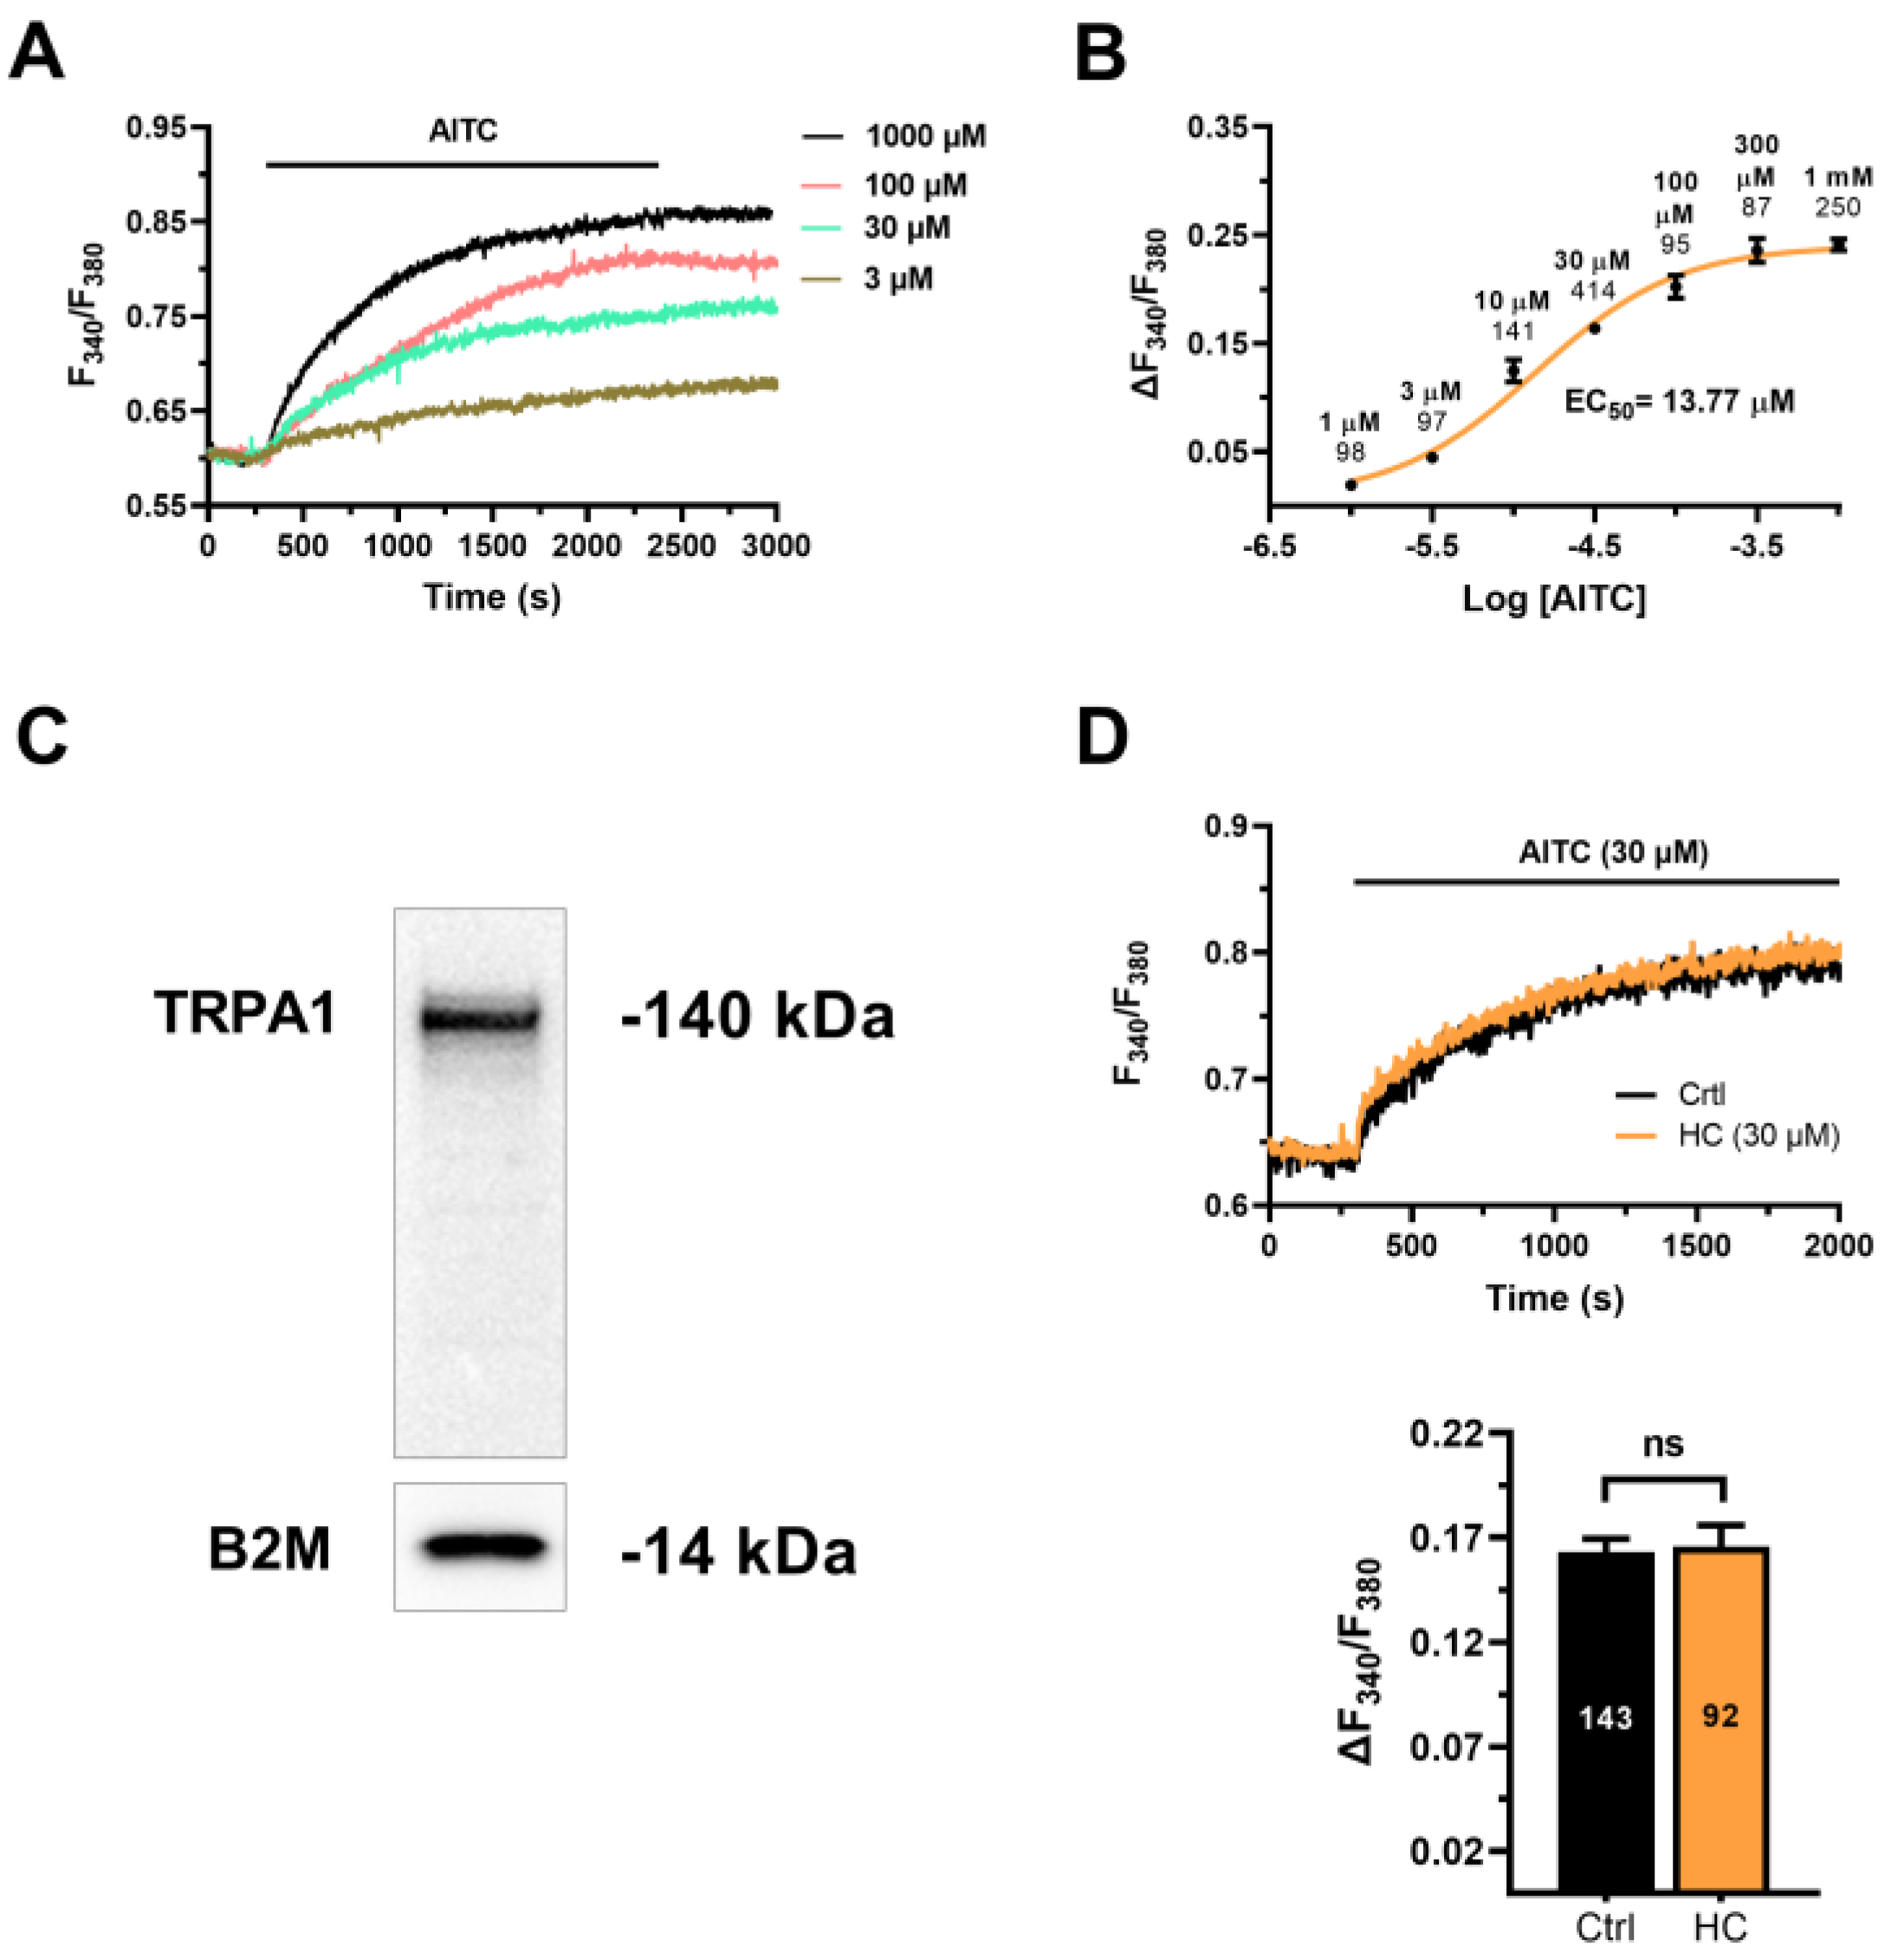
3.2. AITC Evokes TRPA1-Independent Ca2+ Signals in hCMEC/D3 Cells

In order to assess whether AITC evokes an increase in [Ca2+]i, hCMEC/D3 cells were loaded with the Ca2+-sensitive fluorophore Fura-2/AM. AITC induced a slow increase in [Ca2+]i that started at 3 µM (Figure 2A,B), reached the maximal response at between 300 µM and 1 mM (Figure 2A,B) and displayed an EC50 of 13.77 µM (Figure 2B). The latency of the Ca2+ response to 30 µM AITC was 125.2 ± 5.2 s (n = 105), which was significantly (p < 0.0001, Student’s t-test) faster than the latency of the accompanying NO signal (see above). Extensive washout of the agonist from the perfusate did not promote the recovery of the [Ca2+]i to the baseline at each concentration probed (Figure 2A). This observation suggests that AITC promotes an irreversible modification either of the target channel or of the Ca2+-clearing mechanisms. AITC induces an increase in [Ca2+]i by activating TRPA1 channels on the plasma membrane [20,21] or via cytosolic ROS production [23,24,25]. Immunoblotting identified a major band of ~140 kDa, which is the predicted molecular weight of TRPA1 protein [42], in hCMEC/D3 cells (Figure 2C). However, the Ca2+ response to AITC (30 µM) was not affected by HC-030031 (30 µM) (Figure 2D), which is regarded to be among the most selective TRPA1 channel inhibitors [20,42,43]. To further investigate whether the TRPA1 channel was sensitive to AITC in hCMEC/D3 cells, we exploited the planar patch-clamp technique [16]. AITC-dependent Ca2+ entry has been shown to hyperpolarize mouse brain microvascular endothelial cells by recruiting the small-and intermediated conductance Ca2+-activated K+ channels (respectively, SKCa and IKCa) [20,44]. However, AITC (30 µM) failed either to activate transmembrane currents (Figure S1A) or to induce membrane hyperpolarization (Figure S1B) in hCMEC/D3 cells. Nevertheless, NS309 (10 µM), a selective SKCa/IKCa opener [45,46], activated an outwardly rectifying current reverting at ~−70 mV (Figure S1A), which is the predicted equilibrium potential for K+ under our conditions. Furthermore, NS309 (10 µM) caused a rapid and reversible membrane hyperpolarization (Figure S1C), which is consistent with the expression of SKCa/IKCa in hCMEC/D3 cells. Therefore, the lack of effect of AITC is not due to the absence of SKCa/IKCa channels in these cells. Nevertheless, 4-Hydroxy-nonenal (4-HNE), a metabolite of lipid peroxidation that may serve as an endogenous agonist of TRPA1 in mouse brain microcirculation [5,21], evoked a rapid increase in [Ca2+]i in hCMEC/D3 cells that was inhibited by HC-030031 (30 µM) (Figure S2). Overall, these findings indicate that TRPA1 is functional but is unlikely to support AITC-evoked Ca2+ signals in hCMEC/D3 cells.

3.3. Cytosolic ROS Mediate the Ca2+ Response to AITC in hCMEC/D3 Cells

The role of cytosolic ROS in the Ca2+ response to AITC (30 µM) was evaluated in hCMEC/D3 cells pretreated with n-acetylcysteine (NAC; 1 mM, 1 h), a thiol-containing compound that serves as a direct ROS scavenger [47]. The AITC-evoked Ca2+ signal was significantly (p < 0.05) reduced in the presence of NAC, although removal of the synthetic antioxidant from the perfusate fully restored the amplitude of the increase in [Ca2+]i (Figure 3A,B). Conversely, the Ca2+ response to AITC was not impaired by MitoTEMPO (10 µM) (Figure 3C,D), a selective scavenger of mitochondrial ROS [47]. In accord, AITC (30 µM) caused an immediate and long-lasting increase in cytosolic ROS production (Figure 3E), which was evaluated in hCMEC/D3 cells loaded with the ROS-sensitive fluorescent indicator H2DCF–DA and exhibited a latency of 20.7 ± 1.8 s (n = 72). This delay was significantly (p < 0.0001, One-way ANOVA followed by the post hoc Dunnett’s test) faster than the latency of the accompanying Ca2+ and NO signals (see above). AITC-induced ROS production was abolished by NAC (1 mM) (Figure 3E,F), but not MitoTEMPO (10 µM) (Figure 3E,F). Overall, these findings demonstrate that the Ca2+ response to AITC is triggered by cytosolic ROS production.

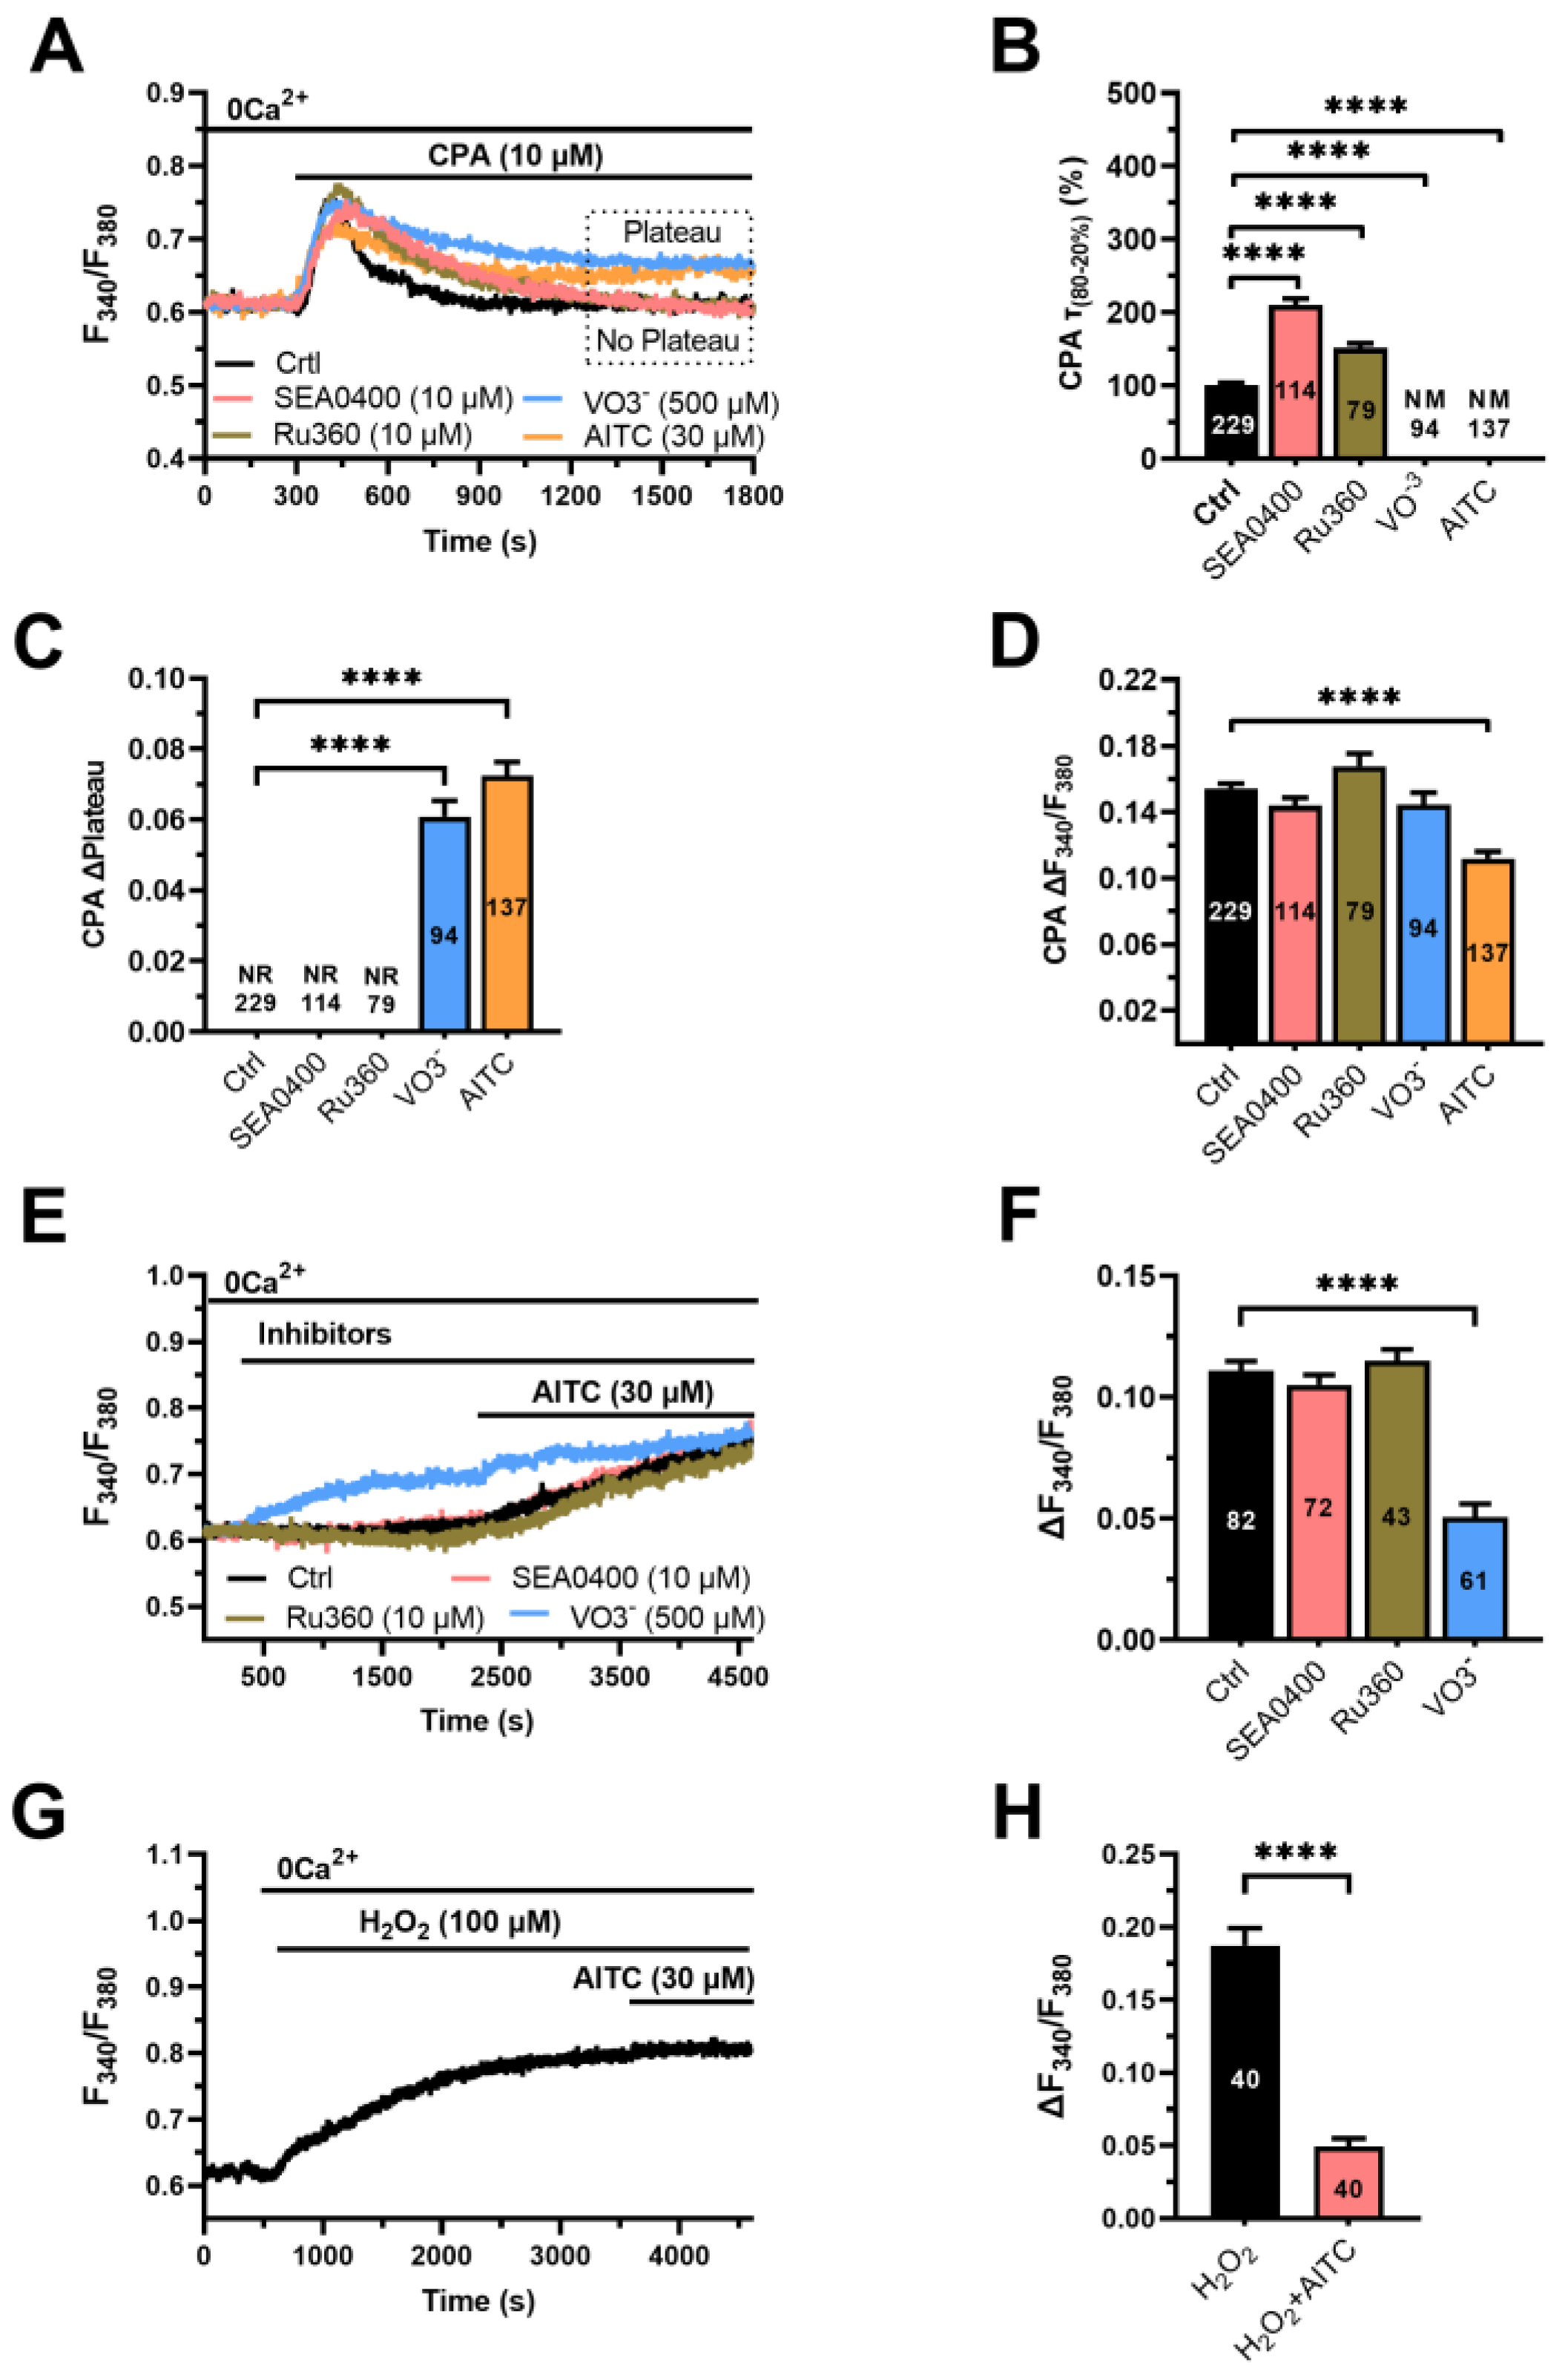
3.4. The Ca2+ Response to AITC Requires Cytosolic Ca2+ and Is Sustained by SOCE

In hCMEC/D3 cells, intracellular Ca2+ signals leading to NO release are shaped by ER Ca2+ release and lysosomal Ca2+ mobilization and sustained over time by SOCE [12,13,14]. Under 0Ca2+ conditions, AITC (30 µM) was still able to evoke a slow increase in [Ca2+]i (Figure 4A), which attained a significantly (p < 0.05) lower amplitude as compared to that measured in the presence of Ca2+ (Figure 4B). Thus, both cytosolic and extracellular Ca2+ sources are required to shape the Ca2+ response to AITC. Intriguingly, also in the absence of extracellular Ca2+, the increase in [Ca2+]i evoked by AITC did not decline to the baseline, as otherwise observed in response to physiological neurotransmitters [12,13].
SOCE represents the main Ca2+-entry pathway that sustains neurotransmitters-induced NO release in hCMEC/D3 cells [12,13]. The Ca2+ response to AITC (30 µM) was reversibly reduced by three distinct SOCE inhibitors (Figure 4C,D): BTP-2 (20 µM), La3+ (10 µM) and Gd3+ (10 µM) [48]. Thus, SOCE also sustains AITC-evoked Ca2+ signals in these cells. Note that removal of the SOCE inhibitors from the perfusate caused an increase in the amplitude of the increase in [Ca2+]i (Figure 4C).
We then focused our attention on the intracellular Ca2+ pool targeted by AITC (30 µM). AITC-evoked intracellular Ca2+ mobilization was not attenuated by depleting either the ER Ca2+ reservoir with CPA (10 µM) or the lysosomal Ca2+ store with nigericin (50 µM) (Figure 4E,F). CPA depletes the ER Ca2+ store by inhibiting SERCA activity and preventing cytosolic Ca2+ sequestration into ER lumen [48], whereas nigericin is a protonophore that prevents cytosolic Ca2+ accumulation into lysosomal lumen by inhibiting the H+-dependent Ca2+ uptake mechanism [49,50]. Additionally, AITC-evoked Ca2+ mobilization was not affected by blocking inositol-1,4,5-trisphosphate receptors (InsP3Rs), which represent the sole ER Ca2+-releasing channel in hCMEC/D3 cells [12], with 2-Aminoethyl Diphenylborinate (2-APB; 50 µM) (Figure 4E,F). Likewise, AITC-evoked Ca2+ release was insensitive to depletion of the mitochondrial Ca2+ pool with the protonophore FCCP (10 µM) (Figure 4E,F). Thus, AITC is unlikely to increase the [Ca2+]i by targeting the main cytosolic Ca2+ reservoirs involved in endothelial Ca2+ signalling. It turns out that AITC-evoked SOCE activation is not driven by ER Ca2+ depletion.

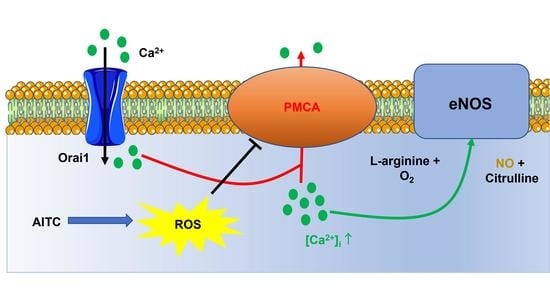
3.5. AITC Inhibits PMCA Activity to Increase the [Ca2+]i in hCMEC/D3 Cells

The observation that the Ca2+ response to AITC does not decline to the baseline either upon removal of the agonist or during prolonged stimulation under 0Ca2+ conditions suggests that AITC inhibits the Ca2+-clearing mechanisms that maintain the resting [Ca2+]i in hCMEC/D3 cells. These include sarco-endoplasmic Ca2+-ATPase (SERCA) in the ER, the plasma membrane Ca2+-ATPase (PMCA) and the Na+/Ca2+ exchanger (NCX) on the plasma membrane [18]. AITC-induced inhibition of the Ca2+-clearing mechanisms would result in the accumulation of cytosolic Ca2+ and thereby in an increase in [Ca2+]i. Nevertheless, SERCA inhibition does not account for the Ca2+ response to AITC since this fully occurs upon inhibition of SERCA activity with CPA (see Figure 4E,F).
To assess whether AITC targets NCX or PMCA or both, we exploited the strategy described to evaluate the H2O2-dependent blockade of PMCA activity in mouse parotid acinar cells [41]. CPA evokes a robust increase in [Ca2+]i by inhibiting SERCA and thereby inducing passive ER Ca2+ efflux in the cytoplasm [12]. Under 0Ca2+ conditions, the Ca2+ response to CPA (10 µM) declines to the baseline because of cytosolic Ca2+ removal by NCX, PMCA or mitochondrial Ca2+ uniporter (MCU) (Figure 5A). Therefore, we first measured the rate of decline of the CPA-evoked increase in [Ca2+]i in the absence and presence of SEA0400 (10 µM), vanadate (VO3; 500 µM) and Ru360 (10 µM), which, respectively, block NCX [51], PMCA [51] and MCU [52] (Figure 5A). Preliminary recordings showed that the green fluorescence of carboxyeosin, which also inhibits endothelial PMCA activity [53], was too bright and interfered with Fura-2 fluorescence in hCMEC/D3 cells. The decay rate of CPA-evoked intracellular Ca2+ release was slightly, although significantly (p < 0.05), slowed by either SEA0400 or Ru360 (Figure 5A,B). Conversely, in the presence of VO3, the increase in [Ca2+]i evoked by CPA did not even return to the baseline and resulted in a long-lasting plateau (Figure 5A). The value of t80-20, therefore, could not be measured under these conditions (Figure 5B). Once assessed that PMCA is the main factor responsible for the decay of the CPA-evoked intracellular Ca2+ release, we evaluated the effect of AITC (30 µM). AITC mimicked the effect of VO3 by converting the transient increase in [Ca2+]i evoked by CPA under 0Ca2+ conditions into a biphasic elevation in [Ca2+]i that did not enable us to measure the τ80-20 (Figure 5B). The amplitude of the long-lasting plateau caused by VO3 and AITC in hCMEC/D3 cells stimulated with CPA is displayed in Figure 5C. Furthermore, pretreatment with AITC significantly (p < 0.05) reduced the amplitude of the Ca2+ response to CPA (Figure 5D). These findings suggest that AITC increases [Ca2+]i by inhibiting PMCA activity. Consistently, VO3 (500 µM) caused a slow increase in [Ca2+]i (Figure 5E) and prevented the intracellular Ca2+ response to AITC (Figure 5E). In contrast, neither SEA0400 (10 µM) nor Ru360 (10 µM) increased the resting [Ca2+]i (Figure 5E) or impaired AITC-induced Ca2+ signals under 0Ca2+ conditions (Figure 5E). The statistical analysis of these data is displayed in Figure 5F. hCMEC/D3 cells were then challenged with hydrogen peroxide (H2O2; 100 µM) under 0Ca2+ conditions. Exogenous administration of H2O2 caused a slow increase in [Ca2+]i that mimicked and prevented the subsequent Ca2+ response to AITC (Figure 5G,H). In addition, AITC failed to slow down and convert into a long-lasting plateau the decay phase of CPA-evoked Ca2+ transient in hCMEC/D3 cells pretreated with NAC (1 mM) (Figure S3). Finally, exposure of hCMEC/D3 cells with H2O2 converted the transient increase in [Ca2+]i induced by CPA (10 µM) into a biphasic Ca2+ signal that presented a long-lasting plateau (Figure S4), as observed with VO3- and AITC.
Overall, these findings confirm that the Ca2+ response evoked by AITC in the absence of extracellular Ca2+ is due to the ROS-dependent inhibition of PMCA activity. This in turn interferes with the extrusion of cytosolic Ca2+ across the plasma membrane and results in a progressive elevation in [Ca2+]i. PMCA can be tightly coupled to store-operated channels and is the main responsible for clearing the incoming Ca2+ across the plasma membrane [54,55]. SOCE is constitutively activated in hCMEC/D3 cells [12]. Therefore, ROS-dependent PMCA inhibition could also unmask this background Ca2+ entry route and thereby explain the blocking effects of BTP-2 and trivalent cations on AITC-evoked Ca2+ signals.

3.6. AITC-Evoked NO Release Requires ROS-Dependent Inhibition of PMCA Activity and SOCE

In agreement with the model described above, AITC (30 µM) failed to cause a detectable NO signal in hCMEC/D3 cells pretreated with NAC (1 mM) (Figure 6A). Furthermore, AITC-evoked NO release was significantly (p < 0.05) reduced in the presence of either VO3 (500 µM) (Figure 6A) or BTP-2 (20 µM) (Figure 6A), which, respectively, inhibit PMCA and SOCE. The statistical analysis of these findings is reported in Figure 6B. Notably, the acute addition of VO3 caused a slow increase in DAF-FM fluorescence (Figure 6C), which was reminiscent of that caused by AITC (30 µM) and was inhibited by L-NIO (50 µM) (Figure 6C,D) and BAPTA (20 µM) (Figure 6C,D). Finally, exogenous administration of H2O2 (100 µM) was also able to induce NO release in hCMEC/D3 cells (Figure 6E) and, as reported for AITC and VO3, H2O2-induced NO production was inhibited by L-NIO (50 µM) (Figure 6C,D) and BAPTA (20 µM). These findings confirm that AITC evokes NO release in hCMEC/D3 cells by causing cytosolic ROS production, which inhibits PMCA to increase the [Ca2+]i and engage eNOS.

4. Discussion

Herein, we demonstrated that AITC, a major active constituent of cruciferous vegetables, elicits NO release in the human cerebrovascular endothelial cell line hCMEC/D3 by generating intracellular ROS that inhibit PMCA activity and thereby cause a slow increase in [Ca2+]i. This is the first demonstration of the signalling pathway whereby AITC-dependent ROS production stimulates intracellular Ca2+ activity in a TRPA1-independent manner [42]. We further showed that the AITC-induced increase in [Ca2+]i leads to NO release, thereby providing the proof-of-concept that AITC administration could represent a promising strategy to prevent deficits in CBF.
It has long been known that AITC elicits vasodilation in rat cerebral arteries in ex vivo brain slices [20,21] and increases meningeal blood flow in the brain of living animals [22]. These studies showed that the hemodynamic response to AITC in rat brain vasculature was accomplished by TRPA1-mediated Ca2+ entry in cECs, which triggered a regenerative Ca2+ wave propagating back to upstream arterioles and recruiting endothelial Ca2+-dependent K+ channels to hyperpolarize adjacent vascular smooth muscle cells [20,21]. AITC-induced vasodilation in rat brain vasculature was insensitive to eNOS inhibition [20]. Nevertheless, the ion signalling machinery that regulates CBF can slightly differ between human and mice cECs [18]. Herein, we found that AITC causes a slow production of NO in hCMEC/D3 cells loaded with DAF-FM, a selective NO-sensitive fluorescent probe that is widely employed to measure NO release in both cultured cECs [12,13] and in brain microvessels [56]. It has previously been shown that AITC stimulates NO production in adult mouse ventricular cardiomyocytes [57], while this is the first demonstration that AITC evokes NO release in endothelial cells. The AITC-induced increase in DAF-FM fluorescence was suppressed by selectively inhibiting eNOS activity with L-NIO and by buffering intracellular Ca2+ levels with BAPTA. Therefore, we hypothesized that AITC was also able to induce NO release through an increase in the [Ca2+]i in hCMEC/D3 cells.
Consistently, we showed that AITC caused a dose-dependent increase in [Ca2+]i that was insensitive to agonist removal from the perfusate. Intriguingly, the EC50 for AITC-evoked Ca2+ signals (13.77 µM) was similar to those reported for AITC-evoked Ca2+ sparklet in rat brain cECs (4.4 µM) [21] and for AITC-evoked vasodilation in rat cerebral arteries (16.4 µM) [44]. Nevertheless, while AITC-evoked Ca2+ signals [21] and vasodilation [44] in rat brain vasculature were sensitive to TRPA1 inhibition, HC-030031 did not affect the Ca2+ response to AITC in hCMEC/D3 cells. Intriguingly, TRPA1 protein was expressed in these cells, thereby suggesting that AITC-dependent TRPA1 activation in hCMEC/D3 cells is strongly inhibited by intracellular modulators, such as phosphatidylinositol-4,5-bisphosphate and inorganic polyphosphates [42]. In addition, AITC was still able to evoke robust, albeit slightly lower, Ca2+ signals under 0Ca2+ conditions in hCMEC/D3 cells, while AITC-evoked Ca2+ sparklets were suppressed by removal of extracellular Ca2+ and TRPA1 inhibition with HC-030031 in rat brain cECs [21]. Therefore, AITC does not increase the [Ca2+]i by activating TRPA1 in hCMEC/D3 cells.
Early studies showed that AITC can induce intracellular Ca2+ signals that are not supported by TRPA1-mediated Ca2+ entry but require cytosolic ROS production in several cancer cell lines [23,24]. Herein, we confirmed that AITC induced rapid cytosolic, but not mitochondrial, ROS production and failed to induce a full increase in [Ca2+]i in hCMEC/D3 cells pretreated with the widely employed antioxidant NAC. Cytosolic ROS could mobilize the intracellular Ca2+ pools that are located in both the ER and the acidic lysosomal compartment by directly gating ER-located InsP3Rs or the lysosomal TRP Mucolipin 1 channel [58,59]. However, AITC still increased the [Ca2+]i in hCMEC/D3 cells bathed in the absence of extracellular Ca2+ and pretreated with either CPA or nigericin that, respectively, deplete the ER and lysosomal Ca2+ stores. Mitochondria represent an additional Ca2+ reservoir, although it is unlikely to support endothelial Ca2+ signalling by mobilizing matrix Ca2+ [60]. In accord, depleting mitochondrial Ca2+ with FCCP did not affect AITC-evoked intracellular Ca2+ mobilization in hCMEC/D3 cells. These unexpected findings led us to hypothesize that AITC did not target an endogenous Ca2+ reservoir to increase the [Ca2+]i under 0Ca2+ conditions, but rather inhibited the Ca2+-clearing machinery. This hypothesis was also supported by the evidence that the Ca2+ influx component of AITC-evoked Ca2+ signals was hampered by the selective blockade of SOCE with La3+, Gd3+ and BTP-2. These compounds inhibit Orai1 [48], which represents the pore-forming subunits of Ca2+-selective store-operated channels [48] and mediates SOCE in hCMEC/D3 cells [12]. However, ROS are not able to directly gate extracellular Ca2+ entry through Orai1 [58]. Intriguingly, Orai1 channels are closely coupled to PMCA in vascular endothelial cells such that incoming Ca2+ is rapidly extruded across the plasma membrane by PMCA-mediated Ca2+ removal [48,55]. SOCE is tonically activated in hCMEC/D3 cells [12]. Therefore, we speculated that AITC-evoked ROS production could inhibit PMCA activity, thereby progressively leading to higher [Ca2+]i and unmasking constitutive SOCE.
Early studies showed that ROS do inhibit PMCA activity and cause a slow and irreversibly sustained increase in [Ca2+]i similar to that elicited by AITC in hCMEC/D3 cells [41,61]. Therefore, we first evaluated whether AITC slowed the decay rate of CPA-evoked intracellular Ca2+ release, which is largely due to PMCA activation in hCMEC/D3 cells, as shown by our preliminary characterization (Figure 5A). Pretreatment with AITC mimicked the effect of VO3 by preventing the [Ca2+]i from returning to basal levels after the initial rise in [Ca2+]i induced by CPA in the absence of extracellular Ca2+. Furthermore, tempering AITC-induced ROS production with NAC did not remarkably affect the recovery of CPA-evoked intracellular Ca2+ release. Moreover, acute addition of VO3 was, per se, able to induce a sustained increase in [Ca2+]i in hCMEC/D3 cells, while blocking NCX with SEA0400 or preventing mitochondrial Ca2+ entry with Ru360 did not alter the basal [Ca2+]i and did not affect the AITC-evoked Ca2+ response. Finally, exogenous H2O2 caused a slow Ca2+ signal that resembled that induced by either AITC or VO3, converted the transient increase in [Ca2+]i induced by CPA into a long-lasting biphasic signal and prevented the subsequent Ca2+ response to AITC. These findings are consistent with a model according to which PMCA is primarily involved in maintaining resting [Ca2+]i, such that its inhibition by AITC-induced cytosolic ROS production or VO3 results in cytosolic Ca2+ accumulation. In accord, the pharmacological [62] or genetic [63] blockade of PMCA activity may increase [Ca2+]i in vascular endothelial cells. Overall, our data indicate that, in hCMEC/D3 cells, AITC inhibits PMCA activity through the production of cytosolic ROS, thereby attenuating Ca2+ extrusion across the plasma membrane and resulting in a slow increase in [Ca2+]i. In addition, PMCA is predicted to remove Ca2+ that enters into the cytosol through basally active store-operated channels [12], such that constitutive SOCE further enhances cytosolic Ca2+ accumulation. This model is supported by evidence that AITC-induced NO release was inhibited by preventing the accompanying increase in [Ca2+]i with (1) NAC, which prevents ROS accumulation; (2) VO3, which inhibits PMCA activity; and (3) BTP-2, which inhibits SOCE. In further accordance with this hypothesis, ROS production precedes the increase in [Ca2+]i that in turn comes first NO release, as testified by the latencies of the corresponding signals. Of note, early studies demonstrated that PMCA1 and PMCA4, which are both expressed in hCMEC/D3 cells [12], negatively regulate eNOS activity in vascular endothelial cells by tethering it to a low Ca2+ microdomain [63,64,65].

5. Conclusions

This investigation demonstrated that AITC stimulates NO release from hCMEC/D3 cells, a widely employed model of human brain cECs, though an increase in [Ca2+]i that is driven by ROS-dependent inhibition of PMCA activity. Targeting the endothelial ion channel machinery might represent an alternative strategy to restore NO signalling and rescue CBF in brain disorders [18]. Preclinical studies confirmed that intracarotid infusion of AITC caused a remarkable dilation of dural arteries and increase meningeal blood flow [22]. Future studies will have to assess whether AITC administration is also able to increase NO production in the human brain. Interestingly, the production of high levels of ROS plays a crucial role in cerebral ischemia-reperfusion injury by causing endothelial dysfunction and BBB disruption [66,67,68]. However, it has long been known that low ROS signalling regulates multiple endothelial functions and could be instrumental in rescuing endothelial dysfunction in cerebrovascular and neurological disorders [58,69,70], including atherosclerosis, acute myocardial infarction, stroke and traumatic brain injury. Therefore, the findings reported in the present investigation suggest that dietary supplementation of AITC could be more efficient to prevent ischemic events in the brain by targeting the endothelial ion signalling machinery when ROS production in cerebral microcirculation is still under tight homeostatic control.

Supplementary Materials

The following supporting information can be downloaded at: https://www.mdpi.com/article/10.3390/cells12131732/s1, Figure S1: AITC does not induce bioelectrical signals in hCMEC/D3 cells. Figure S2: 4-HNE evokes TRPA1-mediated Ca2+ signals in hCMEC/D3 cells. Figure S3: NAC prevents AITC effect on CPA-evoked Ca2+ release in hCMEC/D3 cells. Figure S4: H2O2 prevents the decay to the baseline of CPA-evoked Ca2+ release.

Author Contributions

Conceptualization, R.B.-R. and F.M.; formal analysis, R.B.-R., V.B., G.P., T.S., U.L. and G.S.; investigation, R.B.-R., V.B., G.P., T.S. and G.S.; data curation, R.B.-R., V.B., G.P., T.S. and G.S.; writing—original draft preparation, F.M.; writing—review and editing, R.B.-R.; visualization, R.B.-R., V.B., G.P., T.S., U.L., G.S. and F.M.; project administration, F.M.; funding acquisition, F.M. All authors have read and agreed to the published version of the manuscript.

Funding

This research has been supported by #NEXTGENERATIONEU (NGEU) and funded by the Ministry of University and Research (MUR), National Recovery and Resilience Plan (NRRP), project MNESYS (PE0000006)—A multiscale integrated approach to the study of the nervous system in health and disease (DN. 1553 11.10.2022) (F.M. and G.S.); Regione Lombardia, regional law n° 9/2020, resolution n° 3776/2020” (F.M.); the EU Horizon 2020 FETOPEN-2018-2020 Program under Grant Agreement N. 828984, LION-HEARTED (F.M.); Italian Ministry of Education, University and Research (MIUR): Dipartimenti di Eccellenza Program (2018–2022)—Dept. of Biology and Biotechnology “L. Spallanzani”, University of Pavia (F.M.), and Fondo Ricerca Giovani from the University of Pavia (F.M.). R.B.R. is supported by the National Council of Science and Technology (CONACYT), Identification Number: CVU121216.

Institutional Review Board Statement

Not applicable.

Informed Consent Statement

Not applicable.

Data Availability Statement

Original data are available upon reasonable request to the corresponding author.

Acknowledgments

The authors gratefully acknowledge the Laboratory of Cellular Electrophysiology, Centro Grandi Strumenti of the University of Pavia, for the use of the Port-a-Patch automated system.

Conflicts of Interest

The authors declare no conflict of interest.

References

  1. Schaeffer, S.; Iadecola, C. Revisiting the neurovascular unit. Nat. Neurosci. 2021, 24, 1198–1209. [Google Scholar] [CrossRef]
  2. Longden, T.A.; Zhao, G.; Hariharan, A.; Lederer, W.J. Pericytes and the Control of Blood Flow in Brain and Heart. Annu. Rev. Physiol. 2023, 85, 137–164. [Google Scholar] [CrossRef]
  3. Longden, T.A.; Dabertrand, F.; Koide, M.; Gonzales, A.L.; Tykocki, N.R.; Brayden, J.E.; Hill-Eubanks, D.; Nelson, M.T. Capillary K(+)-sensing initiates retrograde hyperpolarization to increase local cerebral blood flow. Nat. Neurosci. 2017, 20, 717–726. [Google Scholar] [CrossRef] [Green Version]
  4. Longden, T.A.; Mughal, A.; Hennig, G.W.; Harraz, O.F.; Shui, B.; Lee, F.K.; Lee, J.C.; Reining, S.; Kotlikoff, M.I.; Konig, G.M.; et al. Local IP3 receptor-mediated Ca2+ signals compound to direct blood flow in brain capillaries. Sci. Adv. 2021, 7, eabh0101. [Google Scholar] [CrossRef]
  5. Thakore, P.; Alvarado, M.G.; Ali, S.; Mughal, A.; Pires, P.W.; Yamasaki, E.; Pritchard, H.A.; Isakson, B.E.; Tran, C.H.T.; Earley, S. Brain endothelial cell TRPA1 channels initiate neurovascular coupling. eLife 2021, 10, e63040. [Google Scholar] [CrossRef]
  6. Negri, S.; Faris, P.; Soda, T.; Moccia, F. Endothelial signaling at the core of neurovascular coupling: The emerging role of endothelial inward-rectifier K+ (Kir2.1) channels and N-methyl-d-aspartate receptors in the regulation of cerebral blood flow. Int. J. Biochem. Cell Biol. 2021, 135, 105983. [Google Scholar] [CrossRef]
  7. Harraz, O.F.; Longden, T.A.; Hill-Eubanks, D.; Nelson, M.T. PIP2 depletion promotes TRPV4 channel activity in mouse brain capillary endothelial cells. eLife 2018, 7, e38689. [Google Scholar] [CrossRef]
  8. Harraz, O.F.; Longden, T.A.; Dabertrand, F.; Hill-Eubanks, D.; Nelson, M.T. Endothelial GqPCR activity controls capillary electrical signaling and brain blood flow through PIP2 depletion. Proc. Natl. Acad. Sci. USA 2018, 115, E3569–E3577. [Google Scholar] [CrossRef] [Green Version]
  9. Guerra, G.; Lucariello, A.; Perna, A.; Botta, L.; De Luca, A.; Moccia, F. The Role of Endothelial Ca2+ Signaling in Neurovascular Coupling: A View from the Lumen. Int. J. Mol. Sci. 2018, 19, 938. [Google Scholar] [CrossRef] [Green Version]
  10. Carter, K.J.; Ward, A.T.; Kellawan, J.M.; Eldridge, M.W.; Al-Subu, A.; Walker, B.J.; Lee, J.W.; Wieben, O.; Schrage, W.G. Nitric oxide synthase inhibition in healthy adults reduces regional and total cerebral macrovascular blood flow and microvascular perfusion. J. Physiol. 2021, 599, 4973–4989. [Google Scholar] [CrossRef]
  11. Hoiland, R.L.; Caldwell, H.G.; Howe, C.A.; Nowak-Fluck, D.; Stacey, B.S.; Bailey, D.M.; Paton, J.F.R.; Green, D.J.; Sekhon, M.S.; Macleod, D.B.; et al. Nitric oxide is fundamental to neurovascular coupling in humans. J. Physiol. 2020, 598, 4927–4939. [Google Scholar] [CrossRef]
  12. Zuccolo, E.; Laforenza, U.; Negri, S.; Botta, L.; Berra-Romani, R.; Faris, P.; Scarpellino, G.; Forcaia, G.; Pellavio, G.; Sancini, G.; et al. Muscarinic M5 receptors trigger acetylcholine-induced Ca2+ signals and nitric oxide release in human brain microvascular endothelial cells. J. Cell. Physiol. 2019, 234, 4540–4562. [Google Scholar] [CrossRef]
  13. Negri, S.; Faris, P.; Pellavio, G.; Botta, L.; Orgiu, M.; Forcaia, G.; Sancini, G.; Laforenza, U.; Moccia, F. Group 1 metabotropic glutamate receptors trigger glutamate-induced intracellular Ca2+ signals and nitric oxide release in human brain microvascular endothelial cells. Cell. Mol. Life Sci. 2020, 77, 2235–2253. [Google Scholar] [CrossRef]
  14. Berra-Romani, R.; Faris, P.; Pellavio, G.; Orgiu, M.; Negri, S.; Forcaia, G.; Var-Gaz-Guadarrama, V.; Garcia-Carrasco, M.; Botta, L.; Sancini, G.; et al. Histamine induces intracellular Ca2+ oscillations and nitric oxide release in endothelial cells from brain microvascular circulation. J. Cell. Physiol. 2020, 235, 1515–1530. [Google Scholar] [CrossRef]
  15. Negri, S.; Faris, P.; Maniezzi, C.; Pellavio, G.; Spaiardi, P.; Botta, L.; Laforenza, U.; Biella, G.; Moccia, D.F. NMDA receptors elicit flux-independent intracellular Ca2+ signals via metabotropic glutamate receptors and flux-dependent nitric oxide release in human brain microvascular endothelial cells. Cell Calcium 2021, 99, 102454. [Google Scholar] [CrossRef]
  16. Negri, S.; Scolari, F.; Vismara, M.; Brunetti, V.; Faris, P.; Terribile, G.; Sancini, G.; Berra-Romani, R.; Moccia, F. GABA(A) and GABA(B) Receptors Mediate GABA-Induced Intracellular Ca2+ Signals in Human Brain Microvascular Endothelial Cells. Cells 2022, 11, 3860. [Google Scholar] [CrossRef]
  17. Moccia, F.; Negri, S.; Faris, P.; Berra-Romani, R. Targeting the endothelial Ca2+ tool kit to rescue endothelial dysfunction in obesity associated-hypertension. Curr. Med. Chem. 2019, 27, 240–257. [Google Scholar] [CrossRef]
  18. Moccia, F.; Negri, S.; Faris, P.; Angelone, T. Targeting endothelial ion signalling to rescue cerebral blood flow in cerebral disorders. Vascul. Pharmacol. 2022, 145, 106997. [Google Scholar] [CrossRef]
  19. Thakore, P.; Ali, S.; Earley, S. Regulation of vascular tone by transient receptor potential ankyrin 1 channels. Curr. Top. Membr. 2020, 85, 119–150. [Google Scholar] [CrossRef]
  20. Alvarado, M.G.; Thakore, P.; Earley, S. Transient Receptor Potential Channel Ankyrin 1: A Unique Regulator of Vascular Function. Cells 2021, 10, 1167. [Google Scholar] [CrossRef]
  21. Sullivan, M.N.; Gonzales, A.L.; Pires, P.W.; Bruhl, A.; Leo, M.D.; Li, W.; Oulidi, A.; Boop, F.A.; Feng, Y.; Jaggar, J.H.; et al. Localized TRPA1 channel Ca2+ signals stimulated by reactive oxygen species promote cerebral artery dilation. Sci. Signal. 2015, 8, ra2. [Google Scholar] [CrossRef] [Green Version]
  22. Hansted, A.K.; Bhatt, D.K.; Olesen, J.; Jensen, L.J.; Jansen-Olesen, I. Effect of TRPA1 activator allyl isothiocyanate (AITC) on rat dural and pial arteries. Pharmacol. Rep. 2019, 71, 565–572. [Google Scholar] [CrossRef]
  23. Bo, P.; Lien, J.C.; Chen, Y.Y.; Yu, F.S.; Lu, H.F.; Yu, C.S.; Chou, Y.C.; Yu, C.C.; Chung, J.G. Allyl Isothiocyanate Induces Cell Toxicity by Multiple Pathways in Human Breast Cancer Cells. Am. J. Chin. Med. 2016, 44, 415–437. [Google Scholar] [CrossRef]
  24. Chiang, J.H.; Tsai, F.J.; Hsu, Y.M.; Yin, M.C.; Chiu, H.Y.; Yang, J.S. Sensitivity of allyl isothiocyanate to induce apoptosis via ER stress and the mitochondrial pathway upon ROS production in colorectal adenocarcinoma cells. Oncol. Rep. 2020, 44, 1415–1424. [Google Scholar] [CrossRef]
  25. Tusskorn, O.; Senggunprai, L.; Prawan, A.; Kukongviriyapan, U.; Kukongviriyapan, V. Phenethyl isothiocyanate induces calcium mobilization and mitochondrial cell death pathway in cholangiocarcinoma KKU-M214 cells. BMC Cancer 2013, 13, 571. [Google Scholar] [CrossRef] [Green Version]
  26. Weksler, B.; Romero, I.A.; Couraud, P.O. The hCMEC/D3 cell line as a model of the human blood brain barrier. Fluids Barriers CNS 2013, 10, 16. [Google Scholar] [CrossRef] [Green Version]
  27. Bintig, W.; Begandt, D.; Schlingmann, B.; Gerhard, L.; Pangalos, M.; Dreyer, L.; Hohnjec, N.; Couraud, P.O.; Romero, I.A.; Weksler, B.B.; et al. Purine receptors and Ca2+ signalling in the human blood-brain barrier endothelial cell line hCMEC/D3. Purinergic Signal. 2012, 8, 71–80. [Google Scholar] [CrossRef] [Green Version]
  28. Bader, A.; Bintig, W.; Begandt, D.; Klett, A.; Siller, I.G.; Gregor, C.; Schaarschmidt, F.; Weksler, B.; Romero, I.; Couraud, P.O.; et al. Adenosine receptors regulate gap junction coupling of the human cerebral microvascular endothelial cells hCMEC/D3 by Ca2+ influx through cyclic nucleotide-gated channels. J. Physiol. 2017, 595, 2497–2517. [Google Scholar] [CrossRef] [Green Version]
  29. Berra-Romani, R.; Faris, P.; Negri, S.; Botta, L.; Genova, T.; Moccia, F. Arachidonic Acid Evokes an Increase in Intracellular Ca2+ Concentration and Nitric Oxide Production in Endothelial Cells from Human Brain Microcirculation. Cells 2019, 8, 689. [Google Scholar] [CrossRef] [Green Version]
  30. Zuccolo, E.; Kheder, D.A.; Lim, D.; Perna, A.; Nezza, F.D.; Botta, L.; Scarpellino, G.; Negri, S.; Martinotti, S.; Soda, T.; et al. Glutamate triggers intracellular Ca2+ oscillations and nitric oxide release by inducing NAADP- and InsP3 -dependent Ca2+ release in mouse brain endothelial cells. J. Cell. Physiol. 2019, 234, 3538–3554. [Google Scholar] [CrossRef]
  31. Zuccolo, E.; Laforenza, U.; Ferulli, F.; Pellavio, G.; Scarpellino, G.; Tanzi, M.; Turin, I.; Faris, P.; Lucariello, A.; Maestri, M.; et al. Stim and Orai mediate constitutive Ca2+ entry and control endoplasmic reticulum Ca2+ refilling in primary cultures of colorectal carcinoma cells. Oncotarget 2018, 9, 31098–31119. [Google Scholar] [CrossRef] [Green Version]
  32. Lodola, F.; Rosti, V.; Tullii, G.; Desii, A.; Tapella, L.; Catarsi, P.; Lim, D.; Moccia, F.; Antognazza, M.R. Conjugated polymers optically regulate the fate of endothelial colony-forming cells. Sci. Adv. 2019, 5, eaav4620. [Google Scholar] [CrossRef] [Green Version]
  33. Negri, S.; Faris, P.; Tullii, G.; Vismara, M.; Pellegata, A.F.; Lodola, F.; Guidetti, G.; Rosti, V.; Antognazza, M.R.; Moccia, F. Conjugated polymers mediate intracellular Ca2+ signals in circulating endothelial colony forming cells through the reactive oxygen species-dependent activation of Transient Receptor Potential Vanilloid 1 (TRPV1). Cell Calcium 2022, 101, 102502. [Google Scholar] [CrossRef]
  34. Moccia, F.; Frost, C.; Berra-Romani, R.; Tanzi, F.; Adams, D.J. Expression and function of neuronal nicotinic ACh receptors in rat microvascular endothelial cells. Am. J. Physiol. Heart Circ. Physiol. 2004, 286, H486–H491. [Google Scholar] [CrossRef] [Green Version]
  35. Moccia, F.; Berra-Romani, R.; Baruffi, S.; Spaggiari, S.; Adams, D.J.; Taglietti, V.; Tanzi, F. Basal nonselective cation permeability in rat cardiac microvascular endothelial cells. Microvasc. Res. 2002, 64, 187–197. [Google Scholar]
  36. Moccia, F.; Villa, A.; Tanzi, F. Flow-activated Na+ and K+ current in cardiac microvascular endothelial cells. J. Mol. Cell. Cardiol. 2000, 32, 1589–1593. [Google Scholar] [CrossRef]
  37. Sobradillo, D.; Hernandez-Morales, M.; Ubierna, D.; Moyer, M.P.; Nunez, L.; Villalobos, C. A reciprocal shift in transient receptor potential channel 1 (TRPC1) and stromal interaction molecule 2 (STIM2) contributes to Ca2+ remodeling and cancer hallmarks in colorectal carcinoma cells. J. Biol. Chem. 2014, 289, 28765–28782. [Google Scholar] [CrossRef] [Green Version]
  38. Locatelli, F.; Soda, T.; Montagna, I.; Tritto, S.; Botta, L.; Prestori, F.; D’Angelo, E. Calcium Channel-Dependent Induction of Long-Term Synaptic Plasticity at Excitatory Golgi Cell Synapses of Cerebellum. J. Neurosci. 2021, 41, 3307–3319. [Google Scholar] [CrossRef]
  39. Remigante, A.; Morabito, R.; Spinelli, S.; Trichilo, V.; Loddo, S.; Sarikas, A.; Dossena, S.; Marino, A. d-Galactose Decreases Anion Exchange Capability through Band 3 Protein in Human Erythrocytes. Antioxidants 2020, 9, 689. [Google Scholar] [CrossRef]
  40. Moccia, F.; Berra-Romani, R.; Baruffi, S.; Spaggiari, S.; Signorelli, S.; Castelli, L.; Magistretti, J.; Taglietti, V.; Tanzi, F. Ca2+ uptake by the endoplasmic reticulum Ca2+-ATPase in rat microvascular endothelial cells. Biochem. J. 2002, 364, 235–244. [Google Scholar]
  41. Kim, M.J.; Choi, K.J.; Yoon, M.N.; Oh, S.H.; Kim, D.K.; Kim, S.H.; Park, H.S. Hydrogen peroxide inhibits Ca2+ efflux through plasma membrane Ca2+-ATPase in mouse parotid acinar cells. Korean J. Physiol. Pharmacol. 2018, 22, 215–223. [Google Scholar] [CrossRef] [Green Version]
  42. Talavera, K.; Startek, J.B.; Alvarez-Collazo, J.; Boonen, B.; Alpizar, Y.A.; Sanchez, A.; Naert, R.; Nilius, B. Mammalian Transient Receptor Potential TRPA1 Channels: From Structure to Disease. Physiol. Rev. 2020, 100, 725–803. [Google Scholar] [CrossRef]
  43. Moccia, F.; Montagna, D. Transient Receptor Potential Ankyrin 1 (TRPA1) Channel as a Sensor of Oxidative Stress in Cancer Cells. Cells 2023, 12, 1261. [Google Scholar] [CrossRef]
  44. Earley, S.; Gonzales, A.L.; Crnich, R. Endothelium-dependent cerebral artery dilation mediated by TRPA1 and Ca2+-Activated K+ channels. Circ. Res. 2009, 104, 987–994. [Google Scholar] [CrossRef] [Green Version]
  45. Hakim, M.A.; Buchholz, J.N.; Behringer, E.J. Electrical dynamics of isolated cerebral and skeletal muscle endothelial tubes: Differential roles of G-protein-coupled receptors and K+ channels. Pharmacol. Res. Perspect. 2018, 6, e00391. [Google Scholar] [CrossRef]
  46. Longden, T.A.; Dunn, K.M.; Draheim, H.J.; Nelson, M.T.; Weston, A.H.; Edwards, G. Intermediate-conductance calcium-activated potassium channels participate in neurovascular coupling. Br. J. Pharmacol. 2011, 164, 922–933. [Google Scholar] [CrossRef] [Green Version]
  47. Bartekova, M.; Adameova, A.; Gorbe, A.; Ferenczyova, K.; Pechanova, O.; Lazou, A.; Dhalla, N.S.; Ferdinandy, P.; Giricz, Z. Natural and synthetic antioxidants targeting cardiac oxidative stress and redox signaling in cardiometabolic diseases. Free Radic. Biol. Med. 2021, 169, 446–477. [Google Scholar] [CrossRef]
  48. Moccia, F.; Brunetti, V.; Perna, A.; Guerra, G.; Soda, T.; Berra-Romani, R. The Molecular Heterogeneity of Store-Operated Ca2+ Entry in Vascular Endothelial Cells: The Different roles of Orai1 and TRPC1/TRPC4 Channels in the Transition from Ca2+-Selective to Non-Selective Cation Currents. Int. J. Mol. Sci. 2023, 24, 3259. [Google Scholar] [CrossRef]
  49. Moccia, F.; Negri, S.; Faris, P.; Perna, A.; De Luca, A.; Soda, T.; Romani, R.B.; Guerra, G. Targeting Endolysosomal Two-Pore Channels to Treat Cardiovascular Disorders in the Novel COronaVIrus Disease 2019. Front. Physiol. 2021, 12, 629119. [Google Scholar] [CrossRef]
  50. Negri, S.; Faris, P.; Moccia, F. Endolysosomal Ca2+ signaling in cardiovascular health and disease. Int. Rev. Cell Mol. Biol. 2021, 363, 203–269. [Google Scholar] [CrossRef]
  51. Berra-Romani, R.; Guzman-Silva, A.; Vargaz-Guadarrama, A.; Flores-Alonso, J.C.; Alonso-Romero, J.; Trevino, S.; Sanchez-Gomez, J.; Coyotl-Santiago, N.; Garcia-Carrasco, M.; Moccia, F. Type 2 Diabetes Alters Intracellular Ca2+ Handling in Native Endothelium of Excised Rat Aorta. Int. J. Mol. Sci. 2019, 21, 250. [Google Scholar] [CrossRef] [Green Version]
  52. Yanda, M.K.; Tomar, V.; Cole, R.; Guggino, W.B.; Cebotaru, L. The Mitochondrial Ca2+ import complex is altered in ADPKD. Cell Calcium 2022, 101, 102501. [Google Scholar] [CrossRef]
  53. Sheikh, A.Q.; Hurley, J.R.; Huang, W.; Taghian, T.; Kogan, A.; Cho, H.; Wang, Y.; Narmoneva, D.A. Diabetes alters intracellular calcium transients in cardiac endothelial cells. PLoS ONE 2012, 7, e36840. [Google Scholar] [CrossRef] [Green Version]
  54. Klishin, A.; Sedova, M.; Blatter, L.A. Time-dependent modulation of capacitative Ca2+ entry signals by plasma membrane Ca2+ pump in endothelium. Am. J. Physiol. 1998, 274, C1117–C1128. [Google Scholar]
  55. Snitsarev, V.A.; Taylor, C.W. Overshooting cytosolic Ca2+ signals evoked by capacitative Ca2+ entry result from delayed stimulation of a plasma membrane Ca2+ pump. Cell Calcium 1999, 25, 409–417. [Google Scholar] [CrossRef]
  56. Mapelli, L.; Gagliano, G.; Soda, T.; Laforenza, U.; Moccia, F.; D’Angelo, E.U. Granular Layer Neurons Control Cerebellar Neurovascular Coupling Through an NMDA Receptor/NO-Dependent System. J. Neurosci. 2017, 37, 1340–1351. [Google Scholar] [CrossRef] [Green Version]
  57. Andrei, S.R.; Ghosh, M.; Sinharoy, P.; Damron, D.S. Stimulation of TRPA1 attenuates ischemia-induced cardiomyocyte cell death through an eNOS-mediated mechanism. Channels 2019, 13, 192–206. [Google Scholar] [CrossRef] [Green Version]
  58. Negri, S.; Faris, P.; Moccia, F. Reactive Oxygen Species and Endothelial Ca2+ Signaling: Brothers in Arms or Partners in Crime? Int. J. Mol. Sci. 2021, 22, 9821. [Google Scholar] [CrossRef]
  59. Zhang, X.; Cheng, X.; Yu, L.; Yang, J.; Calvo, R.; Patnaik, S.; Hu, X.; Gao, Q.; Yang, M.; Lawas, M.; et al. MCOLN1 is a ROS sensor in lysosomes that regulates autophagy. Nat. Commun. 2016, 7, 12109. [Google Scholar] [CrossRef] [Green Version]
  60. Kluge, M.A.; Fetterman, J.L.; Vita, J.A. Mitochondria and endothelial function. Circ. Res. 2013, 112, 1171–1188. [Google Scholar] [CrossRef] [Green Version]
  61. Bruce, J.I.; Elliott, A.C. Oxidant-impaired intracellular Ca2+ signaling in pancreatic acinar cells: Role of the plasma membrane Ca2+-ATPase. Am. J. Physiol. Cell Physiol. 2007, 293, C938–C950. [Google Scholar] [CrossRef] [Green Version]
  62. Szewczyk, M.M.; Pande, J.; Akolkar, G.; Grover, A.K. Caloxin 1b3: A novel plasma membrane Ca2+-pump isoform 1 selective inhibitor that increases cytosolic Ca2+ in endothelial cells. Cell Calcium 2010, 48, 352–357. [Google Scholar] [CrossRef]
  63. Long, Y.; Chen, S.W.; Gao, C.L.; He, X.M.; Liang, G.N.; Wu, J.; Jiang, C.X.; Liu, X.; Wang, F.; Chen, F. ATP2B1 Gene Silencing Increases NO Production Under Basal Conditions Through the Ca2+/calmodulin/eNOS Signaling Pathway in Endothelial Cells. Hypertens. Res. 2018, 41, 246–252. [Google Scholar] [CrossRef]
  64. Zaidi, A. Plasma membrane Ca-ATPases: Targets of oxidative stress in brain aging and neurodegeneration. World J. Biol. Chem. 2010, 1, 271–280. [Google Scholar] [CrossRef]
  65. Holton, M.; Mohamed, T.M.; Oceandy, D.; Wang, W.; Lamas, S.; Emerson, M.; Neyses, L.; Armesilla, A.L. Endothelial nitric oxide synthase activity is inhibited by the plasma membrane calcium ATPase in human endothelial cells. Cardiovasc. Res. 2010, 87, 440–448. [Google Scholar] [CrossRef]
  66. Guo, X.; Liu, R.; Jia, M.; Wang, Q.; Wu, J. Ischemia Reperfusion Injury Induced Blood Brain Barrier Dysfunction and the Involved Molecular Mechanism. Neurochem. Res. 2023, 48, 2320–2334. [Google Scholar] [CrossRef]
  67. Shaw, R.L.; Norton, C.E.; Segal, S.S. Apoptosis in resistance arteries induced by hydrogen peroxide: Greater resilience of endothelium versus smooth muscle. Am. J. Physiol. Heart Circ. Physiol. 2021, 320, H1625–H1633. [Google Scholar] [CrossRef]
  68. Akki, R.; Siracusa, R.; Morabito, R.; Remigante, A.; Campolo, M.; Errami, M.; La Spada, G.; Cuzzocrea, S.; Marino, A. Neuronal-like differentiated SH-SY5Y cells adaptation to a mild and transient H2O2-induced oxidative stress. Cell Biochem. Funct. 2018, 36, 56–64. [Google Scholar] [CrossRef]
  69. Panieri, E.; Santoro, M.M. ROS signaling and redox biology in endothelial cells. Cell. Mol. Life Sci. 2015, 72, 3281–3303. [Google Scholar] [CrossRef]
  70. Santoro, M.M. Fashioning blood vessels by ROS signalling and metabolism. Semin. Cell Dev. Biol. 2018, 80, 35–42. [Google Scholar] [CrossRef]
Figure 1. AITC-evoked Ca2+-dependent NO release in hCMEC/D3 cells. (A) AITC (30 µM) evoked a slow-rising increase in DAF-FM fluorescence, which reflected NO release and was inhibited by L-NIO (50 µM, 1 h) and BAPTA (20 µM, 2 h). In this and the following figures, AITC has been administered at the time indicated by the black bar that has been drawn above the NO, Ca2+, or ROS tracings. (B) Mean ± SE of the amplitude of AITC-evoked NO release in the absence (Ctrl) or in the presence of L-NIO or BAPTA. One-way ANOVA followed by the post hoc Dunnett’s test: **** p < 0.0001. Ctrl: control. NR: no response.
Cells 12 01732 g001
Figure 2. AITC elicits TRPA1-independent Ca2+ signals in hCMEC/D3 cells. (A) Intracellular Ca2+ signals evoked by increasing concentrations of AITC in hCMEC/D3 cells. The [Ca2+]i never returned to the baseline upon agonist washout. The baseline of the Ca2+ responses has been slightly shifted to avoid tracing overlapping. (B) Dose-response relationship of the amplitude of AITC-evoked Ca2+ signals. The sigmoidal line that fits the dose -response curve was obtained by using Equation (1). (C) TRPA1 protein expression in hCMEC/D3 cells. Blots representative of four independent experiments are shown. Major bands of the expected molecular weights are indicated. (D) Upper panel, AITC-evoked Ca2+ signals were not inhibited by blocking TRPA1 with HC-030031 (30 µM). Lower panel, mean ± SE of the amplitude of AITC-evoked NO in the absence (Ctrl) and presence of HC-030031 (HC). NS: not significant, Student’s t-test.
Cells 12 01732 g002
Figure 3. Cytosolic ROS drive AITC-evoked Ca2+ signals in hCMEC/D3 cells. (A) Intracellular Ca2+ signals evoked by AITC (30 µM) were dampened by the antioxidant NAC (1 mM, 1 h). NAC washout from the perfusate caused a further AITC-dependent elevation in [Ca2+]i. (B) Mean ± SE of the amplitude of the Ca2+ signals evoked by AITC in the absence (AITC) or in the presence of NAC (AITC+NAC) and upon AITC washout from the perfusate (Wash). One-way ANOVA followed by the post hoc Dunnett’s test: **** p < 0.0001. NS: not significant. (C) Intracellular Ca2+ signals evoked by AITC (30 µM) were not affected by scavenging mitochondrial ROS with MitoTEMPO (MitoTEM; 10 µM, 1 h). (D) Mean ± SE of the amplitude of AITC-evoked Ca2+ signals in the absence (Ctrl) or in the presence of MitoTEMPO (MitoTEM). NS: not significant, Student’s t-test. Ctrl: control. (E) AITC (30 µM) evoked robust ROS production in hCMEC/D3 cells that was sensitive to NAC (1 mM), but not to MitoTEMPO (MitoTEM; 10 µM). (F) Mean ± SE of the amplitude of AITC-evoked Ca2+ signals in the absence (Ctrl) or in the presence of MitoTEMPO (MitoTEM) or NAC. One-way ANOVA followed by the post hoc Dunnett’s test: **** p < 0.0001. NR: no response.
Cells 12 01732 g003
Figure 4. AITC-evoked Ca2+ signals require SOCE but not intracellular Ca2+ release. (A) Intracellular Ca2+ signals evoked by AITC (30 µM) were dampened in the absence of extracellular Ca2+ (0Ca2+). (B) Mean ± SE of the amplitude of AITC-evoked Ca2+ signals in the presence (Ca2) or in the absence of extracellular Ca2 (0Ca2). Student’s t-test: *** p < 0.001. (C) Intracellular Ca2+ signals evoked by AITC (30 µM) were dampened upon SOCE inhibition with BTP-2 (20 µM, 20 min), La3+ (10 µM, 20 min) and Gd3+ (10 µM, 20 min). Removal of each inhibitor from the perfusate caused a further AITC-dependent elevation in [Ca2+]i. (D) Mean ± SE of the amplitude of AITC-evoked Ca2+ signals under the following conditions: in the absence of any inhibitor (Ctrl); in the presence of BTP-2 (BTP-2) or after BTP-2 washout from the perfusate (Wash); in the presence of La3+ (La3+) or after La3+ washout from the perfusate (Wash); and in the presence of Gd3+ (Gd3+) or after Gd3+ washout from the perfusate (Wash). One-way ANOVA followed by the post hoc Dunnett’s test: **** p < 0.0001; *** p < 0.001. (E) AITC (30 µM) still evoked robust intracellular Ca2+ signals in the presence of CPA (10 µM, 30 min), nigericin (Nig; 50 µM, 30 min), 2-APB (50 µM, 30 min) and FCCP (10 µM, 30 min). (F) Mean ± SE of the amplitude of AITC-evoked Ca2+ signals in the absence (Ctrl) or in the presence of 2-APB, nigericin (Nig), CPA or FCCP.
Cells 12 01732 g004
Figure 5. AITC-induced ROS production inhibits PMCA activity in hCMEC/D3 cells. (A) Intracellular Ca2+ release evoked by CPA (10 µM) in the absence (Ctrl) and presence of SEA0400 (10 µM, 30 min), VO3 (500 µM, 30 min), Ru360 (10 µM, 30 min) and AITC (30 µM). In the presence of VO3 or AITC, the [Ca2+]i did not return to the baseline, but rather decayed to a sustained plateau level. The baselines of the Ca2+ tracings have been overlapped for representative purposes. (B) Mean ± SE of the percentage change in the value of τ80-20 of CPA-evoked Ca2+ release in the absence (Ctrl) or in the presence of SEA0400, Ru360 or VO3. One-way ANOVA followed by the post hoc Dunnett’s test: **** p < 0.0001. NM: not measurable. (C) Mean ± SE of the amplitude of the long-lasting plateau evoked by CPA in the presence of VO3 or AITC. One-way ANOVA followed by the post hoc Dunnett’s test: **** p < 0.0001. NR: no response (i.e., no plateau arising). (D) Mean ± SE of the amplitude of CPA-evoked intracellular Ca2+ release in the absence (Ctrl) or in the presence of SEA0400, Ru360 or VO3. One-way ANOVA followed by the post hoc Dunnett’s test: **** p < 0.0001. (E) Exogenous administration of VO3 (500 µM), but not of SEA0400 (10 µM) or Ru360 (10 µM), caused a slow increase in [Ca2+]i that dampened the subsequent Ca2+ response to AITC (30 µM). (F) Mean ± SE of the amplitude of the Ca2+ signals evoked by AITC in the absence (Ctrl) or in the presence of SEA0400, Ru360 or VO3. One-way ANOVA followed by the post hoc Dunnett’s test: **** p < 0.0001. (G) Exogenous administration of H2O2 (100 µM) caused a slow increase in [Ca2+]i that dampened the subsequent Ca2+ response to AITC (30 µM). (H) Mean ± SE of the amplitude of the Ca2+ signals evoked by H2O2 (H2O2) or by AITC after H2O2 stimulation (AITC+ H2O2); Student’s t-test: **** p < 0.0001.
Cells 12 01732 g005
Figure 6. The role of AITC-evoked Ca2+ signals in AITC-induced NO release. (A) AITC (30 µM) evokes robust NO production in the absence (Ctrl), but not in the presence, of NAC (1 mM, 1 min), BTP-2 (20 µM, 20 min) and VO3 (500 µM, 30 min). (B) Mean ± SE of the amplitude of NO release induced by AITC in the absence (Ctrl) or in the presence of NAC (NAC), BTP-2 (BTP-2) or VO3. One-way ANOVA followed by the post hoc Dunnett’s test: **** p < 0.0001. (C) VO3 (500 µM) evokes robust NO production in the absence (Ctrl), but not in the presence, of BAPTA (20 µM, 2 h) or L-NIO (50 µM, 1 h). (D) Mean ± SE of the amplitude of NO release induced by VO3 in the absence (Ctrl) or in the presence of L-NIO (L-NIO) or BAPTA (BAPTA). One-way ANOVA followed by the post hoc Dunnett’s test: **** p < 0.0001. (E) Exogenous administration of H2O2 (100 µM) induces NO release in the absence (Ctrl), but not in the presence, of BAPTA (20 µM, 2 h) or L-NIO (50 µM, 1 h). (F) Mean ± SE of the amplitude of NO release induced by VO3 in the absence (Ctrl) or in the presence of L-NIO (L-NIO) or BAPTA (BAPTA). One-way ANOVA followed by the post hoc Dunnett’s test: **** p < 0.0001.
Cells 12 01732 g006
Disclaimer/Publisher’s Note: The statements, opinions and data contained in all publications are solely those of the individual author(s) and contributor(s) and not of MDPI and/or the editor(s). MDPI and/or the editor(s) disclaim responsibility for any injury to people or property resulting from any ideas, methods, instructions or products referred to in the content.

