Article

Molecular Influence of Resiniferatoxin on the Urinary Bladder Wall Based on Differential Gene Expression Profiling

by
Ewa Lepiarczyk
1,*,
Łukasz Paukszto
2,
Marta Wiszpolska
1,
Elżbieta Łopieńska-Biernat
3,
Agnieszka Bossowska
1,
Mariusz Krzysztof Majewski
1 and
Marta Majewska
1
1
Department of Human Physiology and Pathophysiology, School of Medicine, Collegium Medicum, University of Warmia and Mazury in Olsztyn, 10-082 Olsztyn, Poland
2
Department of Botany and Nature Protection, Faculty of Biology and Biotechnology, University of Warmia and Mazury in Olsztyn, 10-727 Olsztyn, Poland
3
Department of Biochemistry, Faculty of Biology and Biotechnology, University of Warmia and Mazury in Olsztyn, 10-719 Olsztyn, Poland
*
Author to whom correspondence should be addressed.
Cells 2023, 12(3), 462; https://doi.org/10.3390/cells12030462
Submission received: 2 January 2023 / Revised: 25 January 2023 / Accepted: 27 January 2023 / Published: 31 January 2023

Abstract

:
Resiniferatoxin (RTX) is a potent capsaicin analog used as a drug for experimental therapy to treat neurogenic disorders associated with enhanced nociceptive transmission, including lower urinary tract symptoms. The present study, for the first time, investigated the transcriptomic profile of control and RTX-treated porcine urinary bladder walls. We applied multistep bioinformatics and discovered 129 differentially expressed genes (DEGs): 54 upregulated and 75 downregulated. Metabolic pathways analysis revealed five significant Kyoto Encyclopedia of Genes and Genomes (KEGG) items (‘folate biosynthesis’, ‘metabolic pathways’, ‘sulfur relay system’, ‘sulfur metabolism’ and ‘serotonergic synapse’) that were altered after RTX intravesical administration. A thorough analysis of the detected DEGs indicated that RTX treatment influenced the signaling pathways regulating nerve growth, myelination, axon specification, and elongation. Many of the revealed DEGs are involved in the nerve degeneration process; however, some of them were implicated in the initiation of neuroprotective mechanisms. Interestingly, RTX intravesical installation was followed by changes in the expression of genes involved in synaptic plasticity and neuromodulation, including 5-HT, H2S, glutamate, and GABA transmission. The obtained results suggest that the toxin may exert a therapeutic, antinociceptive effect not only by acting on TRPV1 receptors.

1. Introduction

Resiniferatoxin (RTX) is an ultrapotent capsaicin analog naturally occurring in the latex of several members of Euphorbia plants. The main mode of RTX action consists of blocking the transient receptor potential vanilloid type 1 (TRPV1) nonspecific Ca2+ channel [1], expressed at the highest level in a subpopulation of primary afferent sensory neurons involved in nociception [2]. Because of its analgesic properties, the toxin has been used in humans for the experimental treatment of several dysfunctions associated with enhanced sensitivity, such as postoperative or postinjury ophthalmic pain [3], skeletal muscle pain [4], and premature ejaculation [5]. Moreover, RTX has been applied in clinical trials for cancer [6,7] and osteoarthritis pain therapy [8] and was even proposed as a possible agent blocking TRPV1-positive pulmonary pathways in patients with advanced COVID-19 disease [9].
As a potent blocker of primary afferent sensory neurons that is able to weaken or even stop an exaggerated C-fiber input-dependent sacral micturition reflex, RTX has received an extensive pharmaceutical interest for the effective management of lower urinary tract symptoms (LUTSs), predominantly those associated with detrusor instability or hyperreflexia, such as neurogenic detrusor overactivity, idiopathic detrusor overactivity, and urgency [10,11,12]. Numerous recent publications have proven that RTX is effective in the treatment of a range of storage LUTSs [11,12,13,14]. Additionally, a systematic review performed by Liu et al. [15] revealed that RTX produced the most effective improvement in the therapy of interstitial cystitis/bladder pain syndrome (from the eight intravesically instilled agents investigated in the experiment). Although the main mechanism of RTX action seems to be clear, the results of some studies suggest that its influence may not be limited to sensory fibers and TRPV1 [16,17,18]. The discovery of specific dysregulated genes may shed new light on the full impact of the drug on the treated organs. Therefore, we decided to explore the specific molecular pathways that underlie the RTX mechanism of action; thus, for the first time, we performed a targeted bioinformatic analysis of control (CTR) and RTX-treated urinary bladder wall samples. We conducted the experiment on domestic pigs because they are considered one of the best animal models for use in biomedical research (due to their anatomical, physiological, and genetic resemblance to humans) [19,20,21]. Moreover, the relevant size of the animal and anatomical structure of the urinary tract allowed us to mimic the intravesical route of RTX administration used in humans.

2. Materials and Methods

2.1. Laboratory Animals

The study was performed on 12 juvenile (8–12 weeks old; 15–20 kg bodyweight (b.w.)) female Large White Polish pigs. The animals were kept under standard laboratory conditions. They were fed standard fodder (Grower Plus, Wipasz, Wadąg, Poland) and had free access to water. To ensure adequate acclimatization, the pigs were transported from the breeder to the animal quarters 5 days before the scheduled procedure. The pigs were divided into two groups. Six pigs served as controls (CTR) and were treated with intravesical instillation of a 5% aqueous solution of ethyl alcohol (60 mL). Another group of 6 pigs was treated with RTX (product code: AG-CN2-0534, AdipoGen Life Sciences, Hamburg, Germany) by intravesical instillation of the toxin (500 nmol per animal in 60 mL of 5% aqueous solution of ethyl alcohol) to mimic the dose and route of its administration used in humans. Both the alcohol and RTX solutions were given under anesthesia. First, all the animals were pretreated with atropine (Atropinum Sulfuricum, Polfa, Warsaw, Poland, 0.05 mg/kg b.w., s.c.) and azaperone (Stresnil, Janssen Pharmaceutica, Beerse, Belgium, 2.5 mg/kg b.w., i.m.). After that, buprenorphine (Bupaq, Richter Pharma AG, Wels, Austria, 20 µg/kg b.w., m.c., i.m.) was given to abolish the visceral pain sensation. Thirty minutes later, anesthesia and analgesia were induced by intramuscular injection of ketamine (Bioketan, Vetoquinol, Gorzów Wielkopolski, Poland, 10 mg/kg b.w.) and xylazine (VetaXyl, Vet Agro, Lublin, Poland, 0.15 mg/kg b.w.) and by propofol (Propofol-Lipuro, B. Braun Melsungen AG, Vienna, Austria, 10 mg/kg b.w.,) given intravenously in a slow, fractionated infusion. The depth of anesthesia was monitored by testing the corneal reflex.
One week after the administration of the aqueous solution of ethyl alcohol or RTX, all the pigs were once again premedicated and deeply anesthetized (the drugs, their doses, and routes of administration were analogous to those previously used), and a midline laparotomy was performed. The urinary bladder was gently exposed in each animal and cut out for transcriptome analysis (the samples of the urinary bladder wall used in this experiment were collected from the middle part of the ventral side of the bladder). The samples were taken in vivo to ensure the acquisition of high-quality and -purity RNA for transcriptome sequencing. Next, all the pigs were euthanized with an overdose of sodium pentobarbital (Euthasol, LeVet B.V., Oudewater, Holland, 140 mg/kg).

2.2. RNA Extraction, Library Construction, and Sequencing

Within both the experimental and CTR groups, total RNA was isolated from the collected parts of the urinary bladder wall. RNA was isolated from the samples taken from all the investigated pigs (n = 12). Based on the manufacturer’s instructions (Thermo Fischer Scientific, Durham, NC, USA), total RNA was extracted using a mirVanaTM kit. The quantity and the quality of the total RNA isolates were evaluated using a Bioanalyzer 2100 (Agilent Technologies, Santa Clara, CA, USA). The samples with the highest RIN values and concentrations were selected for RNA-Seq library construction. Each sample was prepared with 1 μg of total RNA using an Illumina TruSeq mRNA LT Sample Prep kit (Illumina, Inc., San Diego, CA, USA). The first step involved the purification of mRNA molecules using poly-T-attached magnetic beads. Next, the mRNA was cut into small fragments with divalent cations. The cleaved RNA pieces were amplified into first-strand cDNA using SuperScript II reverse transcriptase (Invitrogen, Waltham, MA, USA) and random primers. In the upstream step, second-strand cDNA synthesis using DNA Polymerase I and RNase H was performed. The purified products of the PCR reactions were enriched, and the final cDNAs libraries were constructed. The RNA-Seq libraries were quantified using qPCR according to the qPCR Quantification Protocol Guide (KAPA Library Quantification kits for Illumina Sequencing platforms) and qualified using TapeStation D1000 ScreenTape (Agilent Technologies, Waldbronn, Germany). Indexed libraries were then sequenced using the NovaSeq6000 platform (Illumina, San Diego, CA, USA). The RNA-Seq data were submitted (https://www.ebi.ac.uk/ena, accessed on 30 September 2022) to the European Nucleotide Archive under accession no. PRJEB55778.

2.3. Transcriptome Sequencing, Differential Expression Profiles, and Functional Annotations

After the high-throughput sequencing process, 2 x 150 bp stranded paired-end reads were obtained. Next, the raw reads of the dataset were evaluated according to the quality control standards with FASTQC software version 0.11.7 [22]. The Illumina adaptors and low-quality reads (PHRED cut-off score < 20) were excluded during the quality control (Trimmomatic software v. 0.38) [23] based on the following criteria: all sequences were cropped to 140 bp, and 10 bp frameshifts were checked. After evaluation, the clean paired-end reads were aligned to the pig reference genome with ENSEMBL annotation (Sus_scrofa.Sscrofa11.1.104) with the STAR mapper. The following ENCODE parameters were used in the mapping procedure: -outSAMtype BAM, -SortedByCoordinate, -outFilterType BySJout, -outFilterMultimapNmax 20, -alignSJoverhangMin 8, -alignSJDBoverhangMin 1, -outFilterMismatchNmax 999, -alignIntronMin 20, -alignIntronMax 1000000, and -alignMatesGapMax 1000000. StringTie v. 1.3.3 [24] and the ballgown [25] pipeline were used to annotate and estimate the expression of porcine genes and uncover regulatory TARs. The Binary Alignment Map (BAM) files and the ENSEMBL gtf file were re-evaluated with the StringTie v. 1.3.3 pipeline to annotate the intergenic-expressed regions and uncover their regulatory properties. Ballgown software and prepDE.py script were used to prepare the counts and fragments per kilobase of transcript per million (FPKM) matrix. The DEGs were identified with the negative binomial DESeq2 method. The final results encompassed significant (adjusted p-value < 0.05) DEGs with known protein-coding annotation. The DEGs were transferred to the downstream functional and pathway enrichment module to be analyzed with gProfileR based on Gene Ontology (GO) [26] and the Kyoto Encyclopedia of Genes and Genomes (KEGG) [27] databases. Differentially expressed results were illustrated with the Volcano, circle heatmap, GOplot, and circlize Bioconductor R packages. The pathways illustrations were drawn with the pathview and KEGG.db R packages.

2.4. Real-Time PCR

The mRNA content of selected genes was determined by real-time PCR. Primers for the selected genes were designed using Primer3Plus software [28] (ELIXIR, Hinxton, Cambridgeshire, UK) based on the sequences listed in Supplementary Table S1. Total RNA was isolated using a mirVana kit following the manufacturer’s procedure (Thermo Fischer Scientific, Waltham, MA, USA), and cDNA was obtained using an Applied Biosystems™ High-Capacity cDNA Reverse Transcription Kit (Thermo Fisher Scientific, Vilnius, Lithuania, cat. no. 4374966) according to the manufacturer’s protocol. Real-time PCR was performed using Applied Biosystems™ PowerUp™ SYBR™ Green Master Mix (Thermo Fisher Scientific, Vilnius, Lithuania, Cat. No. A25780) according to the manufacturer’s protocol on a QuantStudio™ 3 Real-Time PCR System (Applied Biosystems™, Thermo Fisher Scientific Inc., Waltham, MA, USA). Briefly, each reaction contained 5 μL of master mix (2X), forward and reverse primers (1000 nM each), 10 ng of cDNA, and an appropriate volume of nuclease-free water to a final volume of 10 μL. Reactions were performed in four technical replicates for each biological sample. The expression of each gene was calculated using the comparative Pfaffl method [29], in which the expression of the gene of interest in treated samples is represented as a fold change compared with that of control samples and normalized to an endogenous reference gene (GAPDH, GenBank AF017079) (relative quantification RQ = 1). Results are expressed as means of biological replicates ± standard deviations. Statistical analysis was performed using Student’s t-test (two-sided test) in Prism 8 software (GraphPad Software Inc., San Diego, CA, USA). p values ≤ 0.05 were considered statistically significant when ≤0.0332 (*), ≤0.0021 (**), ≤0.0002 (***), and ≤0.0001 (****).

3. Results

3.1. Transcript Assembly, Quantification and Transcriptionally Active Region (TAR) Analysis

The summary statistics of 12 cDNA libraries (six from RTX- treated and six from CTR-urinary bladder wall samples) are described in Table 1. After high-throughput sequencing, the 753,795,346 paired-end reads were processed, and 627,549,240 clean reads were obtained. Overall, more than 96% of the reads were mapped to the Sus_Scrofa.11.1.104 genome, and the mapping results displayed over 93% of uniquely aligned sequences. Using the StringTie method, the 38,378 transcriptionally active regions (TARs) were assigned and transferred to expression profiling analyses. Within the annotated TARs, 97,193 transcripts were discovered and classified. Among the annotated transcripts, 45,053 sequences were identified as protein-coding variants, 4589 as long noncoding, and 1374 other noncoding RNA annotations. The rest of the 46,177 assembled sequences had not yet been annotated in the reference genome.

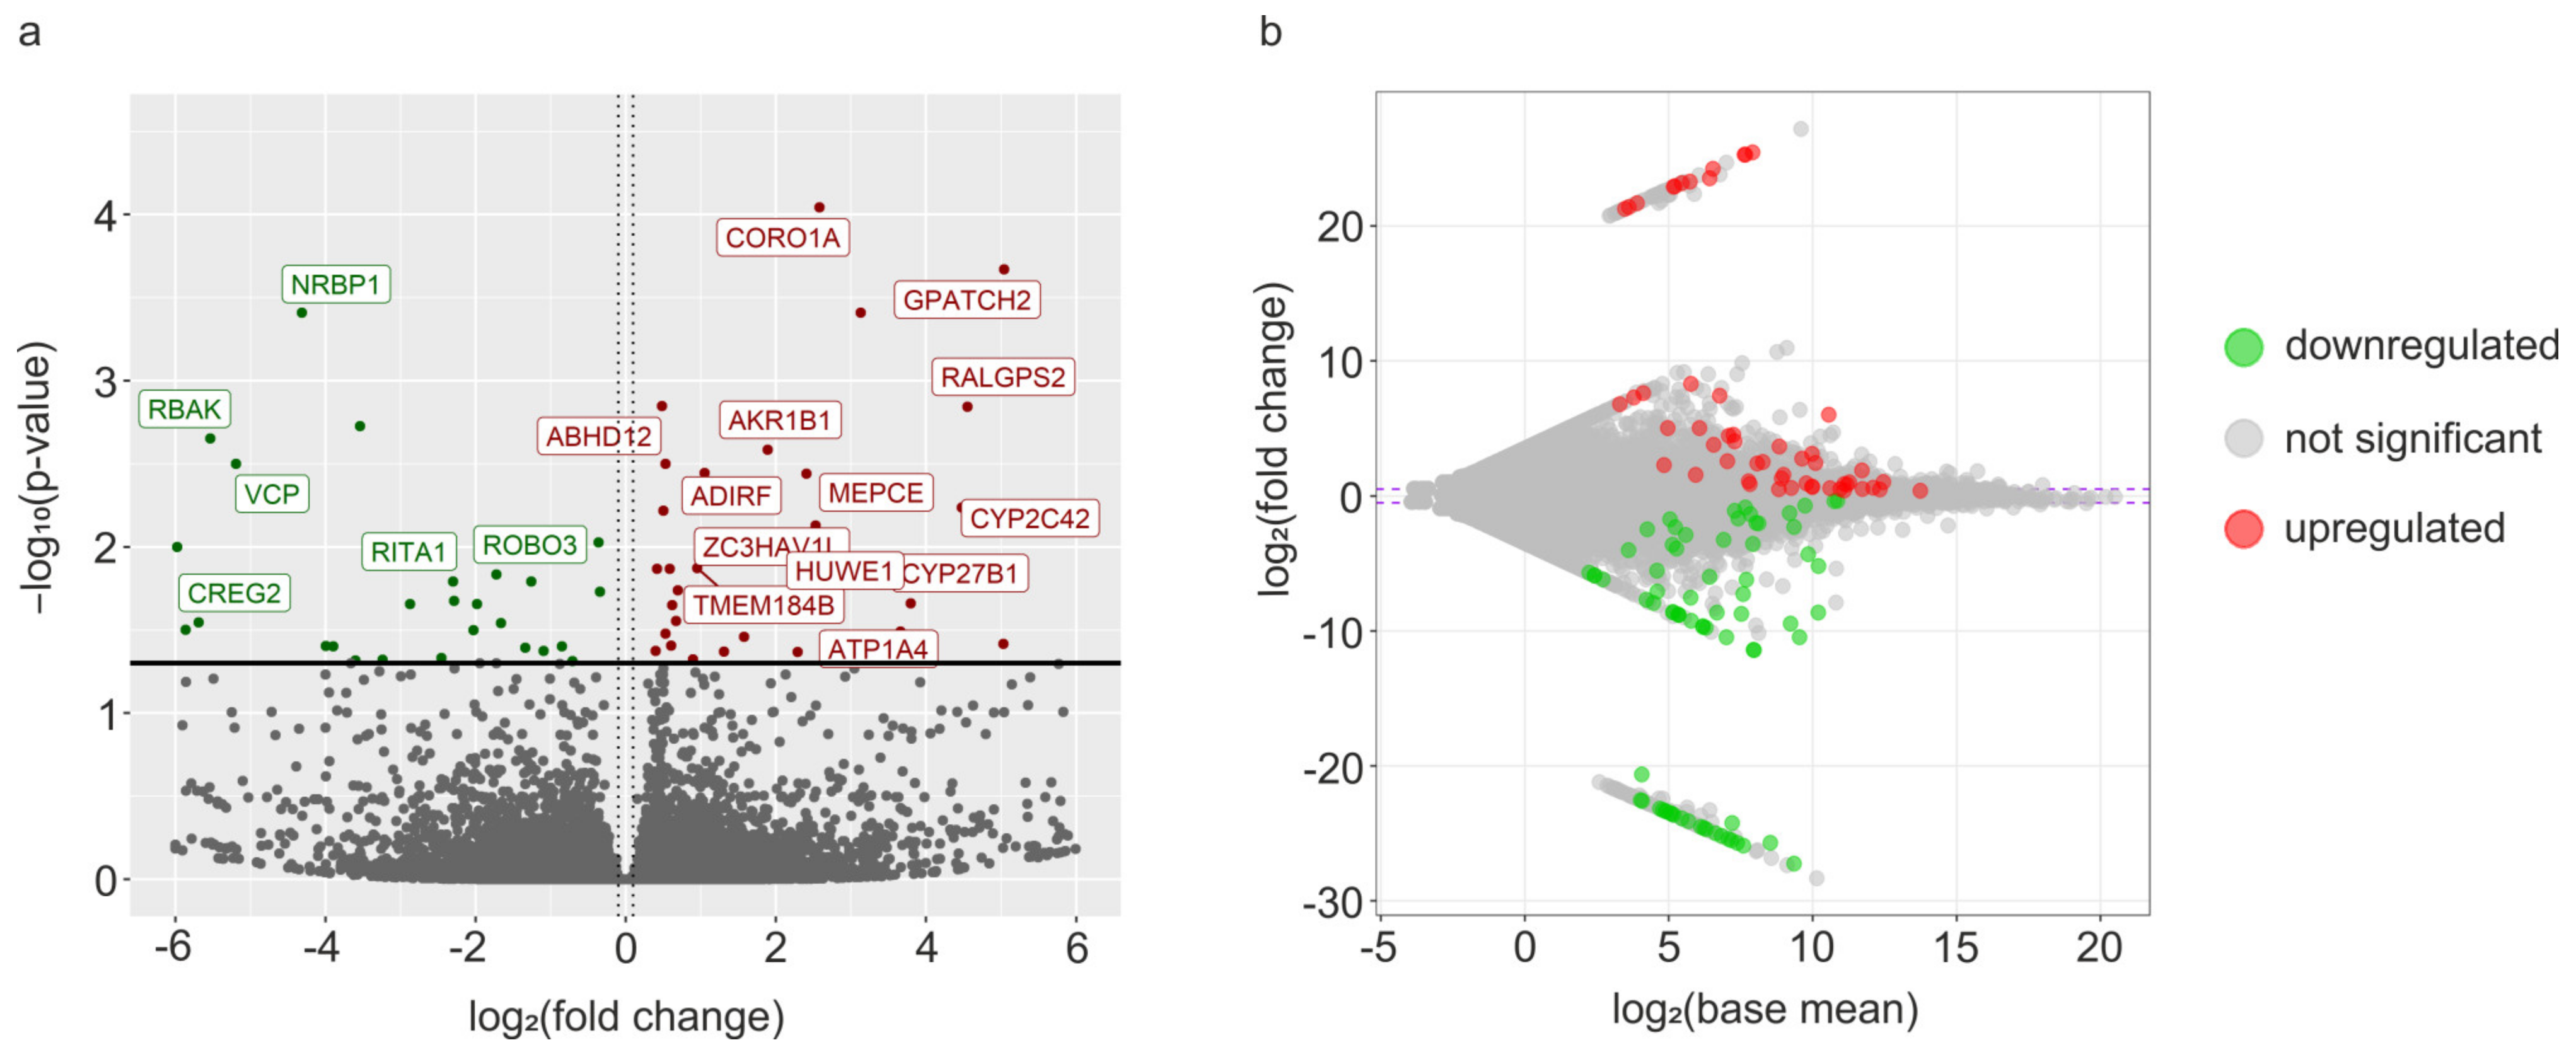
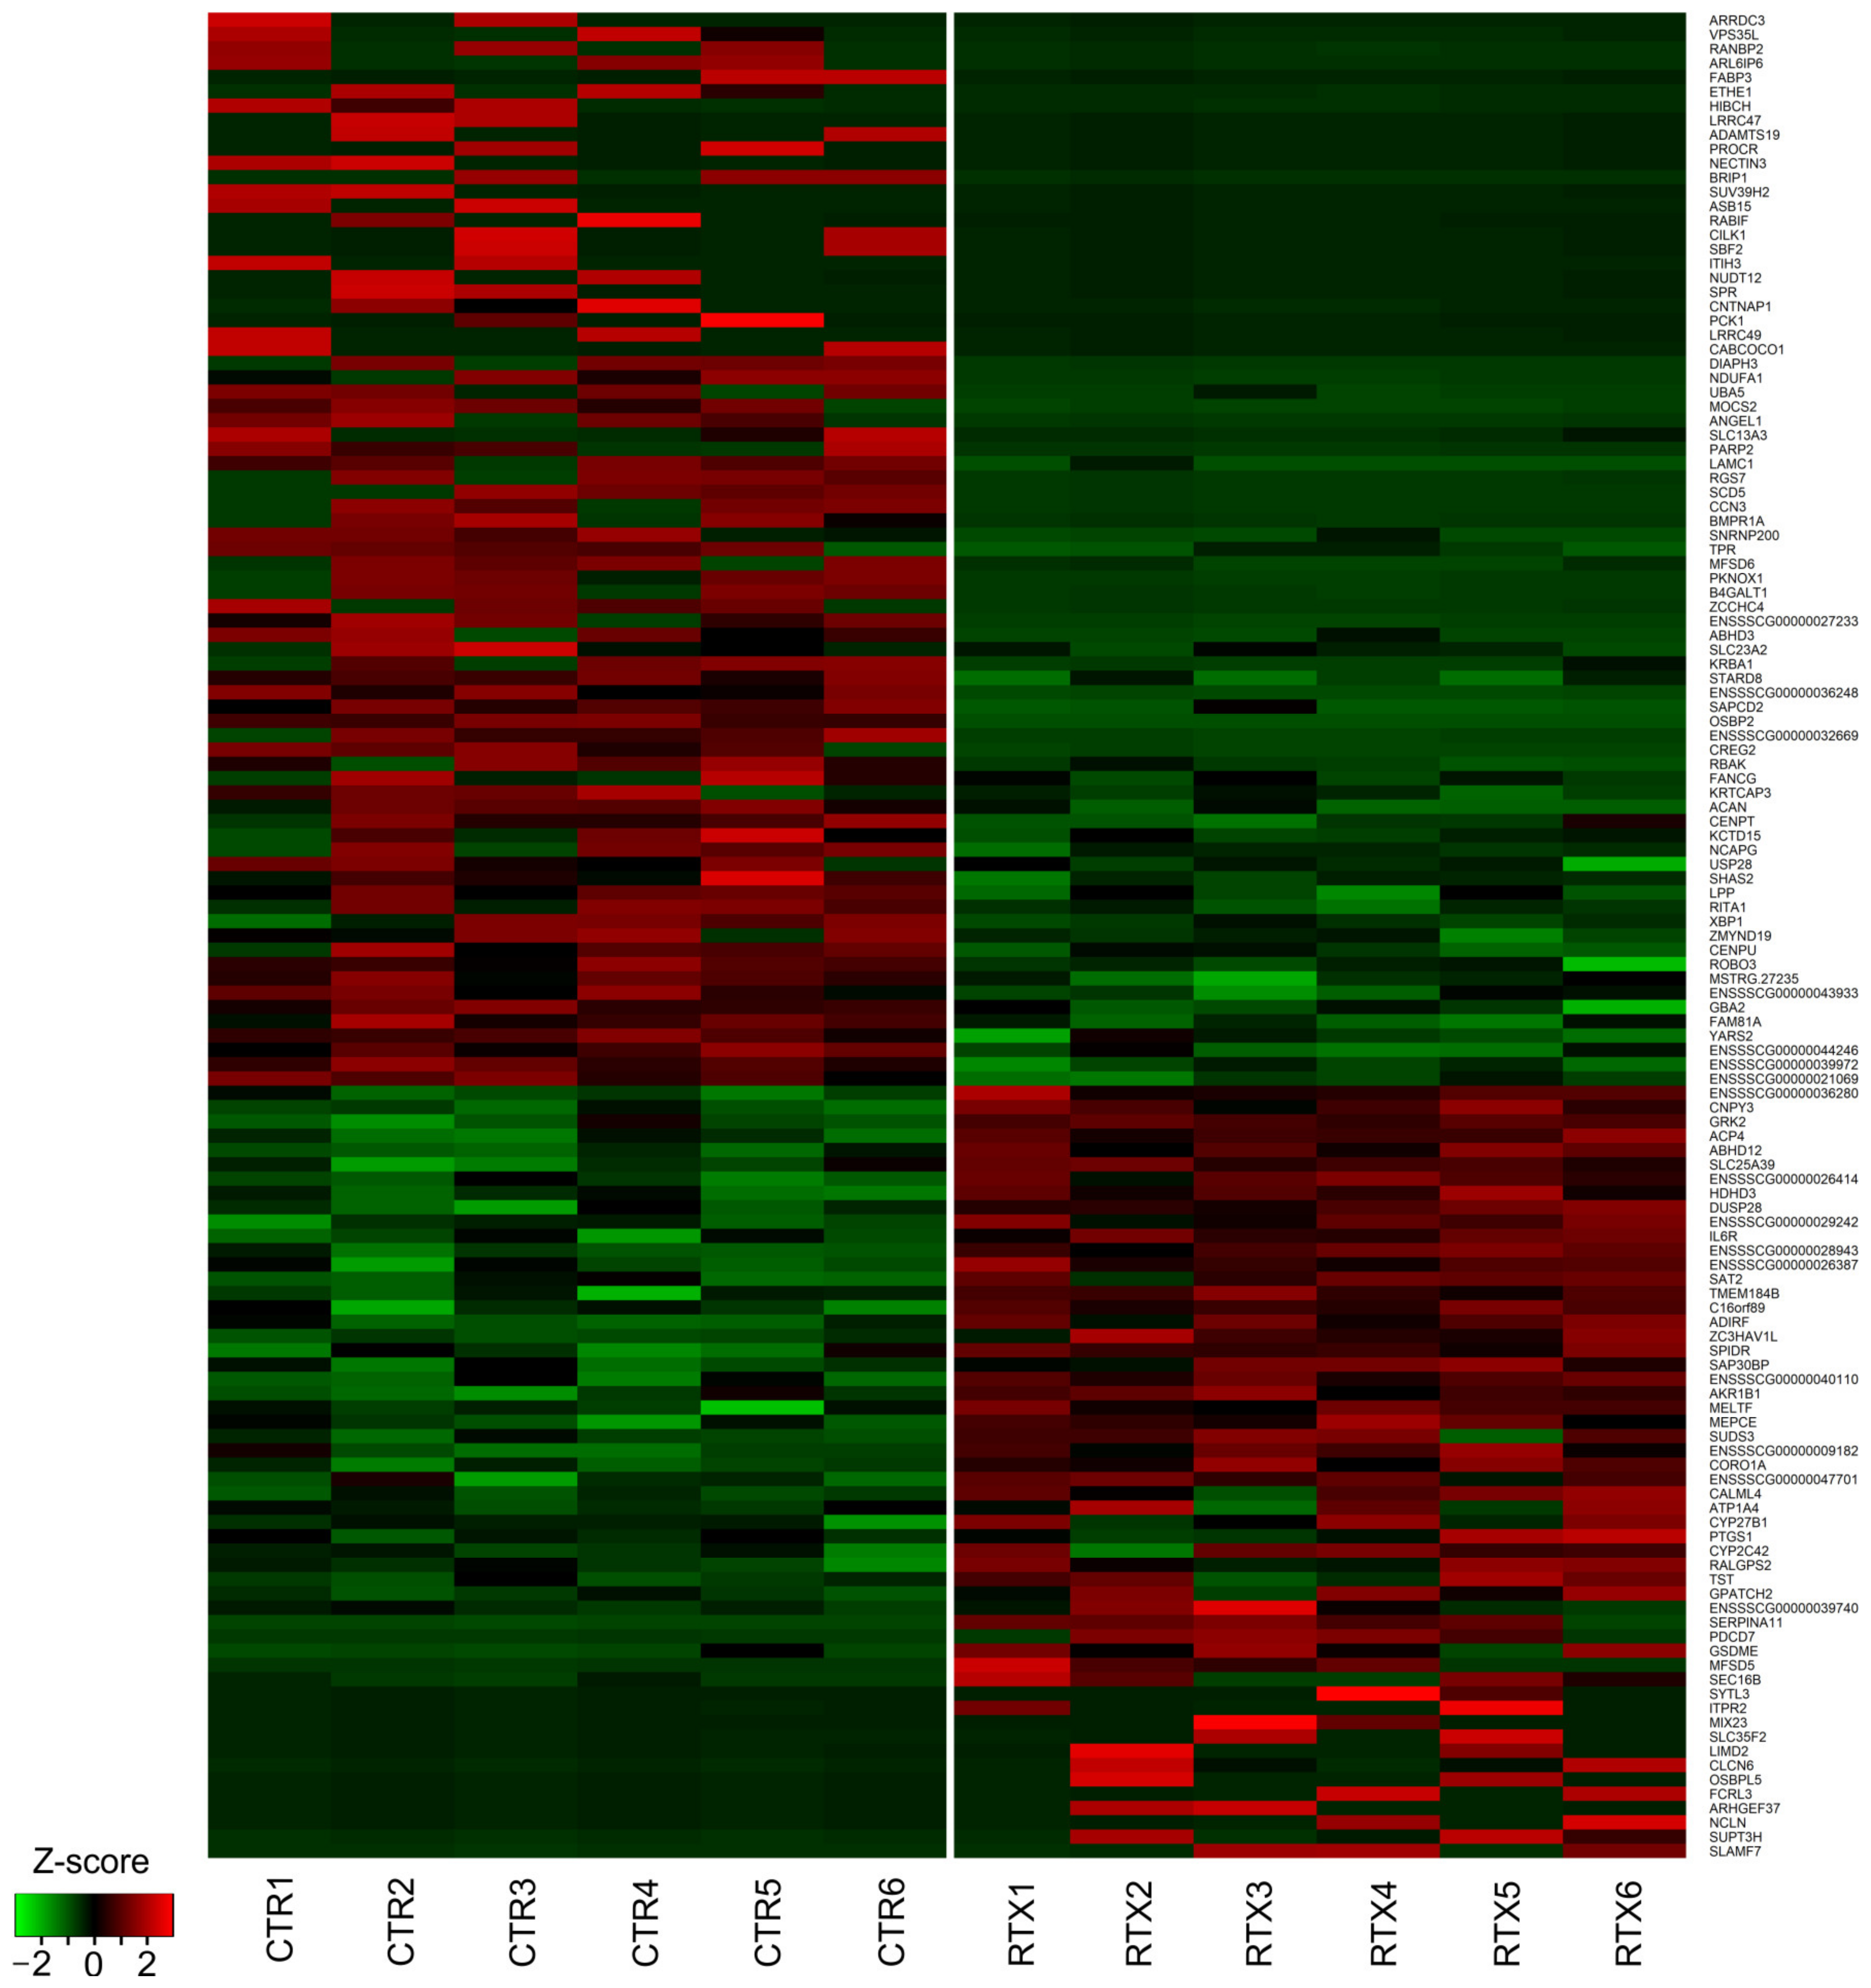
3.2. Transcriptomic Signatures of Differentially Expressed Genes (DEGs) and Functional Annotations

In the present experiment, 129 differentially expressed TARs (DE-TARs) under the threshold of |log2FC| > 1 and adjusted p value < 0.05) were detected in RTX-urinary bladder wall libraries, as confirmed by DESseq2 (Figure 1a,b and Figure 2).
Within the TARs, 125 significant differentially expressed genes (DEGs) were identified; of them, 54 were upregulated and 71 were downregulated (Figure 2; Table 2 and Table 3). Considering the remaining four DE-TARs, three were classified as miRNA, snoRNA, lncRNA, and one was unclassified. Of 47 DEGs with an Entrez gene ID, 20 unigenes were enriched in the KEGG pathway signaling database. The KEGG assignment revealed that the DEGs were significantly categorized into five pathways (Figure 3, Table 4), including ‘Folate biosynthesis’ (Supplementary Figure S1), ‘Metabolic pathways’, ‘Sulfur relay system’, ‘Sulfur metabolism’, and ‘Serotonergic synapse’ (Figure 4). The present study identified three genes enriched in the KEGG ‘Folate biosynthesis’ pathway. One, AKR1B1, was overexpressed, and two genes (SPR and MOCS2) were underexpressed. Six genes assigned to the ‘Metabolic pathways’, i.e., TST, CYP2C42, PTGS1, CYP27B1, ENSSSCG00000009182, AKR1B1, and SAT2, were upregulated, and twelve, namely GBA2, B4GALT1, SCD5, MOCS2, NDUFA1, PCK1, SPR, NUDT12, SUV39H2, HIBCH, and ETHE1, were downregulated. Two altered genes, namely, upregulated TST and downregulated MOCS2, were engaged in the ‘Sulfur relay system’ KEGG pathway. Moreover, two genes were also differentially expressed in the ‘Sulfur metabolism’ pathway: again, upregulated TST and downregulated ETHE1. Furthermore, four genes were enriched in the ‘Serotoninergic synapse’ KEGG pathway: ITPR2, CYP2C42, PTGS1, and ENSSSCG00000040110. Other important DEGs were involved in apoptosis (PDCD7, logFC = 7.3; GSDME, logFC = 7.43), nerve growth and maturation (CNTNAP1, logFC = −23.16; RABIF, logFC = −23.62; ITIH3, logFC = −23.36), nerve regeneration (SYTL3, logFC = 21.28; SLC25A39, logFC = 0.53), and pain transmission (GRK2, logFC = 0.48).

3.3. Validation of the Results

The NGS method was validated using real-time PCR, which revealed the overexpression of eight genes: AKR1B1, CALML4, CORO1A, PDCD7, SEC16B, SERPINA11, SPIDR, and TST, and the underexpression of another three genes: ABHD3, MOCS2 and XBP1 (Figure 5). The genes were selected for validation following the assessment of the function, expression values, and read distribution within samples. For instance, the overexpression of AKR1B1 and downregulation of MOCS2 were assigned to the ‘Folate biosynthesis’ pathway. Moreover, the downregulated MOCS2 and upregulated TST, revealed in RTX-treated samples, were crucial in the ‘Sulfur metabolism’ pathway. The overexpressed PDCD7 was found to be involved in the apoptosis process and the downregulated XBP1 in endoplasmic reticulum (ER) stress mechanisms.

4. Discussion

The gene expression profiling of control and RTX-treated urinary bladder samples revealed that DEGs were mostly characteristic for nervous tissue and were associated with neurodegeneration (or, on the contrary, neuroregeneration processes) and synaptic plasticity (including sensory and nociceptive transmission). The applied multistep bioinformatics identified 129 DEGs: 54 upregulated and 75 downregulated.
The primary and well-known blocking action initiated by RTX on the TRPV1 ion channel is based on its prolonged opening, which results in a massive increase in the intracellular calcium level [30]. Such a huge amount of excess calcium in the cell exerts a cytotoxic effect on the primary sensory neurons. It was found that 1 min after RTX application, mitochondria and ER undergo sudden vesiculation; approximately 5–10 min later, a nuclear membrane disruption was observed in the affected cells. This process inevitably leads to cell death and lysis, which were observed within 1–2 h after RTX treatment [31]. Nerve degeneration of small-diameter unmyelinated sensory fibers expressing TRPV1 was confirmed, for instance, in mice footpad skin after intraperitoneal injections of the toxin [32]. Concerning the urinary bladder wall, RTX intravesical therapy was followed by a marked decline in the density of TRPV1-positive nerve terminals in humans [33]. Moreover, in our previous experiment, a decrease in the number of autonomic (cholinergic and noradrenergic) nerve fibers was observed in the porcine urinary bladder after RTX intravesical instillation [18]. The results of the present study give further proof that RTX treatment induces the process of nerve degeneration. The toxin application was followed, for instance, by the upregulation of programmed cell death 7 (PDCD7) and gasdermin E (GSDME) genes, both involved in the apoptosis process [34,35]. Moreover, in the RTX-treated bladder samples, downregulation of a crucial signal transducer in ER stress, X-box binding protein 1 (XBP1) [36], was observed, and it was found that decreased amounts of this gene’s product (X-box binding protein 1 spliced) enhanced apoptosis [37]. Furthermore, after RTX intravesical instillation, the downregulation of several genes involved in nerve growth and maturation was observed, including contactin associated protein 1 (CNTNAP1), RAB interacting factor (RABIF), interalpha–trypsin inhibitor heavy chain 3 (ITIH3), 3-hydroxyisobutyryl-CoA hydrolase (HIBCH), ubiquitin-like modifier activating enzyme 5 (UBA5), cellular communication network factor 3 (CCN3), solute carrier family 23 member 2 (SLC23A2), SET binding factor 2 (SBF2), and abhydrolase domain containing 3 phospholipase (ABHD3). The first of the abovementioned underexpressed genes, CNTNAP1, encodes contactin-associated protein, which is essential for the development of paranodal junctions as well as proper radial and longitudinal organization of myelinated nerve fibers [38,39]. CNTNAP1-associated disturbances are one of the most serious hypomyelinating disorders of both the central and peripheral nervous systems [40,41]. RABIF encodes a member of small GTP-binding proteins that participate in the control of intracellular vesicular transport. It was found that Rab GTPases are involved in the process of neurite outgrowth and axon specification [42]. Another downregulated gene, ITIH3, encodes the heavy chain of the prealpha–trypsin inhibitor complex, which, through its ability to bind hyaluronic acid, normally stabilizes the extracellular matrix. It was discovered that polymorphism of ITIH3 may alter protein expression and neurodevelopment [43]. The next gene, HIBCH, is thought to be one of the regulators of neuronal stability [44], and its mutations may lead, for instance, to progressive infantile neurodegeneration [45]. Another gene downregulated in the RTX-treated bladder wall, UBA5, encodes a member of the E1-like ubiquitin-activating enzyme family, which promotes the post-translational modification of the proteins. UBA5 is also known to play a crucial role in neurodevelopment [46]. Mutations of this gene may result in hypomyelination and neurodegeneration [47]. CCN3 encodes an immediate–early protein involved in numerous cellular processes such as proliferation, adhesion, migration, differentiation, and survival [48]. It has been also found that CCN3 is engaged in neuroimmune responses, myelin regeneration in nerve cells [49,50] and neurite growth [51]. Moreover, RTX treatment contributed to the downregulation of the SLC23A2 gene, encoding the sodium-dependent vitamin C transporter 2 (SVCT2). This protein is engaged in the regeneration process after peripheral nerve injury. It was found that SVCT2 deficiency reduces the amount of ascorbic acid in the peripheral nerves, leading to hypomyelination and collagen-containing extracellular matrix deficits [52]. A previous study revealed that the SBF2 gene is involved in controlling phosphoinositide signaling, which participates in the myelination process, and its mutations were found in autosomal recessive hereditary motor and sensory neuropathy (also known as Charcot–Marie–Tooth disease) [53]. Furthermore, Cunningham, et al. [54] revealed the impact of SBF2 on the development of taxane-induced peripheral neuropathy. Finally, RTX treatment evoked the downregulation of ABHD3, a gene encoding phospholipase that may play a role in the remodeling of phospholipids [55], which are essential constituent molecules of both neuronal cell bodies and neurites [56]. It is well known that the intricate cooperation between lipids (including phospholipids) and proteins greatly alters presynaptic activity [57].
Interestingly, apart from the DEGs reflecting the ongoing nerve degeneration caused by RTX application, the present study also revealed these indications of the initiation of neuroprotective mechanisms and nerve regeneration process. For instance, the toxin treatment resulted in the upregulation of synaptotagmin-like 3 (SYTL3), solute carrier family 25 member 39 (SLC25A39), cytochrome p450 family 27 subfamily B member 1 (CYP27B1), or Chloride voltage-gated channel 6 (CLCN6). It was found that SYTL3, by regulating the expression of matrix metalloproteinase, plays a crucial role in neuronal migration and development [58]. Moreover, the SYTL3 translation product, synaptotagmin-like protein, regulates vesicle trafficking and docking and thus synaptic neurotransmitter release [59]. SLC25A39 encodes the mitochondrial transporter of the SLC25 family [60]. It was found that the Drosophila homolog of SLC25A39 promotes neuronal survival [61]; thus, the upregulation of SLC25A39 may also be considered a neuroprotective mechanism in mammals. Another gene upregulated in the RTX-treated samples, CYP27B1, is also associated with mitochondria function, and it encodes the 25-hydroxyvitamin D-1α-hydroxylase enzyme, which involved in vitamin D metabolism and is needed for converting inactive 25-OHD to biologically active 1,25-(OH)2D [62]. Vitamin D is a well-known antioxidant that exerts its neuroprotective effect, among others, by decreasing oxidative stress, regulating calcium metabolism, or participating in immunomodulation or glutamatergic transmission [63]. Furthermore, RTX intravesical administration induced the upregulation of chloride voltage-gated channel 6 (CLCN6), which encodes a member of the voltage-dependent chloride channel protein 6 (CLC6), functioning as a Cl/H+-exchanger in the endolysosomal pathway of mammalian neurons [64,65]. The exact role of CLC6 is not known, but this protein is most probably engaged in ion homeostasis and pH regulation of late endosomes. Polovitskaya et al. [66] revealed that mutations in CLCN6 are closely related to some neurological disorders.
As previously mentioned, the main rationale for using RTX to treat LUTSs, such as overactive bladder (OAB), is to diminish the nociceptive bladder input carried to the spinal cord by unmyelinated C fibers [67]. According to the obtained results, RTX treatment led to the identification of DEGs strongly involved in the pain transmission process. It is worth emphasizing that toxin administration was followed by the upregulation of G protein-coupled receptor kinase 2 (GRK2). The GRK2 protein encoded by this gene is well known to promote the desensitization of G protein-coupled receptors engaged in nociceptive transmission [68]. It was found that the downregulation of GRK2 leads to increased pain receptors’ signaling and prolongs the prostaglandin E2-induced hyperalgesia [69]. Moreover, in mice, a low level of GRK2 resulted in the enhancement in both the mechanical and thermal hyperalgesia induced by epinephrine [70]. On the other hand, Wang et al. [71] revealed that the increase in GRK2 inhibited chronic hyperalgesia. Furthermore, it was proven that overexpression of GRK2 strikingly weakens the sensitization of TRPV1 receptors [72]. Thus, the present findings suggest that RTX exerts its blocking action on TRPV1 by upregulation of GRK2.
Remarkably, RTX instillation was also followed by the downregulation of sepiapterin reductase (SPR). Sepiapterin reductase, encoded by SPR, catalyzes the reduction of sepiapterin to tetrahydrobiopterin (BH4), a molecule that, when upregulated, results in a higher sensitivity to pain stimuli [73]. It should be emphasized that the inhibition of SPR in the BH4 pathway was proposed as one of the possible treatment options to alleviate chronic pain in humans. The BH4 pathway is usually activated by proinflammatory factors and leads to the generation of several bioactive molecules with the ability to modify neuropathic pain sensitivity [74]. Therefore, the downregulation of SPR observed in RTX-treated bladder should be considered an advantageous result regarding the treatment of LUTSs characterized by an increase in bladder pain sensation. Furthermore, BH4 acts as a cofactor for the aromatic amino acid hydroxylases involved in the synthesis of several neurotransmitters, such as serotonin, noradrenaline, dopamine, and nitric oxide [75,76]. Thus, the underexpression of SPR may additionally represent the plastic changes induced in the peripheral nerves after RTX intravesical instillation. Importantly, SPR also participates in folate (vitamin B9) formation and metabolism. The present study identified three genes enriched in the KEGG ‘Folate biosynthesis’ pathway. Two of these genes, SPR and molybdenum cofactor synthesis 2 (MOCS2), were underexpressed, and one, aldo-keto reductase family 1 member B (AKR1B1), was overexpressed. Folate is possibly the most well-recognized participant in proper neural tube formation, and its supplementation before and during early pregnancy helps to prevent neural tube defects [77]. Vitamin B9 deficiency has been correlated with several neurodegenerative disorders, including Parkinson’s and Alzheimer’s diseases [78]. The role of folate in the regeneration and repair of injured neural tissues has been widely investigated. Iskandar et al. [79] found that folate stimulates sensory spinal axons regrowth in vivo, and its neurodegenerative properties are not limited to the early embryonic period but are still effective in the adult central nervous system. Moreover, it was proven that folate treatment, by decreasing matrix metalloproteinase-2, reduces neuropathic pain and enhances functional recovery after spinal cord contusion [80]. It is reasonable to assume that the modified gene expression within the KEGG’s ‘Folate biosynthesis’ pathway, in conjunction with the upregulation of GRK2, could enhance the antinociceptive effect exerted by RTX on TRPV1 in LUTSs associated with exaggerated pain transmission, such as interstitial cystitis [81].
Intriguingly, several DEGs revealed in the RTX-treated urinary bladder wall encoded molecules involved in synaptic signaling. Namely, four genes were enriched in the ‘Serotoninergic synapse’ KEGG pathway: cytochrome P450 2C42 (CYP2C42), ENSSSCG00000040110, prostaglandin-endoperoxide synthase 1 (PTGS1, also known as COX1), and inositol 1,4,5-trisphosphate receptor type 2 (ITPR2). Serotonin (5-HT) is a neurotransmitter found in the central and peripheral nervous systems and is well known to participate in pain transmission [82]. Moreover, 5-HT receptors play a crucial role in the control of the micturition reflex. The action of 5-HT on both pain sensation and micturition reflex differs depending on the subtype of the activated receptor. So far, 14 types of structurally different 5-HT receptors, grouped into seven families (5-HT1–7), have been recognized. The genes upregulated in the RTX-treated bladder wall were found to be involved in pathways triggered by the activation of 5-HT1 (a–f), 5-HT2, and 5HT5a receptors. The 5-HT1 and 5-HT2 receptors participate in micturition control [83]; however, their activation seems to exert the opposing effect. In rats, the excitation of 5-HT1A receptors stimulates micturition at the supraspinal level [84]; on the contrary, the excitation of 5-HT2 receptors inhibits the micturition reflex [85]. Regarding 5HT5a receptors, their activation, at least at the spinal level, exerts an antinociceptive impact in several pain models in rodents [86]. Therefore, the results of the present study indicate that RTX may exert its therapeutic effect by influencing 5-HT transmission.
Among the findings of this study, two altered genes annotated to the ‘Sulfur relay system’ KEGG pathway were identified, namely, the previously described downregulated MOCS2 and upregulated thiosulfate sulfurtransferase (TST). Moreover, two genes were also differentially expressed in the ‘Sulfur metabolism’ pathway again: upregulated TST and downregulated ETHE1 persulfide dioxygenase (ETHE1). Both TST and ETHE1 encode mitochondrial enzymes that catalyze the transfer of sulfur in several molecular pathways [87,88]. ETHE1 plays an essential role in hydrogen sulfide catabolism in the mitochondrial matrix by metabolizing hydrogen sulfide and preventing the accumulation of supraphysiological H2S levels, which has toxic effects [88]. Currently, H2S is also considered a physiologically active messenger and in the urinary bladder; this gaseous signaling molecule is a potential chemical entity for the activation of transient receptor potential ankyrin 1 (TRPA1) channels [89]. TRPA1, the same as TRPV1, belongs to the transient receptor potential (TRP) superfamily and is mainly expressed in the primary sensory neurons but is also found in the urothelium, some interstitial cells, and detrusor muscle [90]. A study in rats revealed that H2S induces detrusor overactivity, increased micturition frequency, and most likely bladder inflammation [91]. Therefore, again, increased catabolism of H2S, caused by the downregulation of ETHE1, should be considered an advantageous effect from the perspective of LUTS treatment.
It must be mentioned that RTX treatment was also followed by the upregulation of abhydrolase domain containing 12, lysophospholipase (ABHD12), a gene encoding monoacylglycerol lipase catalyzing the hydrolysis of 2-arachidonoyl glycerol (2-AG), which is the primary endocannabinoid lipid transmitter acting on cannabinoid receptors CB1 and CB2. The binding of 2-AG to these receptors exerts an analgesic effect; thus, endocannabinoids were extensively investigated in studies concerning bladder pain control [92]. The observed upregulation of ABHD12, and thus increased hydrolysis of 2-AG, suggests that RTX’s analgesic effect is not mediated through CB1 and CB2 activation. On the other hand, it was found that genetically modified mice devoid of ABHD12 exhibit abnormal neurobehavior due to a dysregulated lysophospholipase pathway [93], suggesting that ABHD12 may have a neuroprotective role.
The upregulation of spermidine/spermine N(1)-acetyltransferase 2 (SAT2) and the downregulation of regulator of G protein signaling 7 (RGS7) in the bladder wall suggest that the toxin also affects glutamate and GABAergic transmission. SAT2 is a transporter responsible for presynaptic glutamine uptake and, therefore, glutamate resynthesis [94]. It was found that glutaminergic transmission plays a significant facilitatory role in the afferent transduction of the micturition reflex and is involved in bladder nociception [95]. RGS7 modulates synaptic plasticity and GABA signaling in the central nervous system [96,97]. GABA exerts peripherally mediated inhibition of urinary bladder detrusor muscle contractility in human [98]. Thus, alterations in SAT2 and RGS7 expression may modulate the contractility and pain sensation in the bladder. Moreover, in the cultured cell lines, RGS7 reduced muscarinic M3 [99,100] and 5-HT2C receptor activation [101]. In this regard, underexpression of RGS7 may lead to the activation of M3 receptors, which enhance contractions of the urinary bladder wall [102], but it may stimulate 5-HT2 receptors, which are responsible for inhibiting the micturition reflex [85].

5. Conclusions

To the best of our knowledge, this is the first study concerning the targeted gene expression profiling and pathway analysis of control and intravesically RTX-treated porcine urinary bladder walls. The revealed DEGs were assigned to neurodegeneration or neuroprotection processes and nociceptive transmission. Interestingly, several transcripts were found to be engaged in the neuromodulation of synaptic plasticity by affecting 5-HT, H2S, glutamate, or GABA transmission. Evidence from this study implies that RTX exerts its therapeutic, antinociceptive effect not only by acting on TRPV1 receptors. It should be noted that the analyzed urinary bladder wall samples contained all the layers of the bladder wall; thus, the present study did not allow for differentiation of the changes within the subcompartments such as the urothelium, lamina propria, detrusor, adventitia, or serosa. Moreover, it cannot be excluded that the number of cells within each of these subcompartments might have influenced the gene expression profile. Nevertheless, the transcriptomic identification of DEGs sheds light on how RTX affects bladder function and broadens the potential target points for clinical interventions. Therefore, we hope that this research lays the groundwork for studies and clinical trials regarding the possible use of RTX not only in the treatment of urological dysfunctions but also in other diseases associated with exaggerated pain sensation.

Supplementary Materials

The following supporting information can be downloaded at: https://www.mdpi.com/article/10.3390/cells12030462/s1, Figure S1: Enrichment Kyoto Encyclopedia of Genes and Genomes (KEGG) analysis of differentially expressed genes (DEGs) engaged in the ‘Folate biosynthesis’ signaling pathway; Table S1: The list of primers used for real-time PCR.

Author Contributions

Conceptualization: E.L. and M.M.; methodology: E.L. and M.M.; software: Ł.P.; validation: E.Ł.-B.; formal analysis: Ł.P.; surgical procedures: E.L., A.B. and M.K.M.; investigation: E.L., M.W. and M.M.; resources: E.L.; writing—original draft preparation: E.L., Ł.P. and M.M.; writing—review and editing: E.L. and M.M.; visualization: E.L. and Ł.P.; supervision: E.L. and M.M.; project administration: E.L. and M.M.; funding acquisition: E.L. All authors have read and agreed to the published version of the manuscript.

Funding

Ewa Lepiarczyk was the recipient of the Statutory Fund of the School of Medicine, Collegium Medicum (61.610.008-110), University of Warmia and Mazury in Olsztyn.

Institutional Review Board Statement

The study was conducted in accordance with the Declaration of Helsinki and approved by the Ethics Committee for Animal Experimentation in Olsztyn, Poland (affiliated with the National Ethics Committee for Animal Experimentation, Polish Ministry of Science and Higher Education; decision No. 39/2020 from 22 July 2020).

Informed Consent Statement

Not applicable.

Data Availability Statement

The datasets analyzed during the current study are available from the ENA database under accession number: PRJEB55778 (https://www.ebi.ac.uk/ena, accessed on 30 September 2022).

Conflicts of Interest

The authors declare no conflict of interest. The funders had no role in the design of the study; in the collection, analyses, or interpretation of data; in the writing of the manuscript; or in the decision to publish the results.

References

  1. Szallasi, A.; Blumberg, P.M. Resiniferatoxin, a Phorbol-Related Diterpene, Acts as an Ultrapotent Analog of Capsaicin, the Irritant Constituent in Red Pepper. Neuroscience 1989, 30, 515–520. [Google Scholar] [CrossRef] [Green Version]
  2. Cavanaugh, D.J.; Chesler, A.T.; Bráz, J.M.; Shah, N.M.; Julius, D.; Basbaum, A.I. Restriction of Transient Receptor Potential Vanilloid-1 to the Peptidergic Subset of Primary Afferent Neurons Follows Its Developmental Downregulation in Nonpeptidergic Neurons. J. Neurosci. 2011, 31, 10119–10127. [Google Scholar] [CrossRef] [PubMed]
  3. Bates, B.D.; Mitchell, K.; Keller, J.M.; Chan, C.-C.; Swaim, W.D.; Yaskovich, R.; Mannes, A.J.; Iadarola, M.J. Prolonged Analgesic Response of Cornea to Topical Resiniferatoxin, a Potent TRPV1 Agonist. Pain 2010, 149, 522–528. [Google Scholar] [CrossRef] [PubMed] [Green Version]
  4. Abdelhamid, R.E.; Kovács, K.J.; Honda, C.N.; Nunez, M.G.; Larson, A.A. Resiniferatoxin (RTX) Causes a Uniquely Protracted Musculoskeletal Hyperalgesia in Mice by Activation of TRPV1 Receptors. J. Pain 2013, 14, 1629–1641. [Google Scholar] [CrossRef] [PubMed] [Green Version]
  5. Shi, B.; Li, X.; Chen, J.; Su, B.; Li, X.; Yang, S.; Guan, Z.; Wang, R. Resiniferatoxin for Treatment of Lifelong Premature Ejaculation: A Preliminary Study. Int. J. Urol. 2014, 21, 923–926. [Google Scholar] [CrossRef]
  6. Winter, J.; Dray, A.; Wood, J.N.; Yeats, J.C.; Bevan, S. Cellular Mechanism of Action of Resiniferatoxin: A Potent Sensory Neuron Excitotoxin. Brain Res. 1990, 520, 131–140. [Google Scholar] [CrossRef] [PubMed]
  7. Mannes, A.; Hughes, M.; Quezado, Z.; Berger, A.; Fojo, T.; Smith, R.; Butman, J.; Lonser, R.; Iadarola, M. Resiniferatoxin, a Potent TRPV1 Agonist: Intrathecal Administration to Treat Severe Pain Associated with Advanced Cancer—Case Report. J. Pain 2010, 11, S43. [Google Scholar] [CrossRef]
  8. Leiman, D.; Minkowitz, H.; Levitt, R.C.; Solanki, D.; Horn, D.; Janfaza, D.; Sarno, D.; Albores-Ibarra, N.; Bai, X.; Takeshita, K.; et al. Preliminary Results from a Phase 1b Double-Blind Study to Assess the Safety, Tolerability and Efficacy of Intra-Articular Administration of Resiniferatoxin or Placebo for the Treatment of Moderate to Severe Pain Due to Osteoarthritis of the Knee. Osteoarthr. Cartil. 2020, 28, S138. [Google Scholar] [CrossRef]
  9. Nahama, A.; Ramachandran, R.; Cisternas, A.F.; Ji, H. The Role of Afferent Pulmonary Innervation in ARDS Associated with COVID-19 and Potential Use of Resiniferatoxin to Improve Prognosis: A Review. Med. Drug Discov. 2020, 5, 100033. [Google Scholar] [CrossRef]
  10. Kim, D.-Y.; Chancellor, M.B. Intravesical Neuromodulatory Drugs: Capsaicin and Resiniferatoxin to Treat the Overactive Bladder. J. Endourol. 2000, 14, 97–103. [Google Scholar] [CrossRef]
  11. Cruz, F.; Dinis, P. Resiniferatoxin and Botulinum Toxin Type A for Treatment of Lower Urinary Tract Symptoms. Neurourol. Urodyn. 2007, 26, 920–927. [Google Scholar] [CrossRef] [PubMed]
  12. Foster, H.E.; Lake, A.G. Use of Vanilloids in Urologic Disorders. In Capsaicin as a Therapeutic Molecule; Springer: Basel, Switzerland, 2014; Volume 68, pp. 307–317. ISBN 9783034808279. [Google Scholar]
  13. Chancellor, M.B.; de Groat, W.C. Intravesical Capsaicin and Resiniferatoxin Therapy: Spicing up the Ways to Treat the Overactive Bladder. J. Urol. 1999, 162, 3–11. [Google Scholar] [CrossRef]
  14. Cruz, F. Vanilloid Receptor and Detrusor Instability. Urology 2002, 59, 51–60. [Google Scholar] [CrossRef] [PubMed]
  15. Liu, S.; Zhang, C.; Peng, L.; Lu, Y.; Luo, D. Comparative Effectiveness and Safety of Intravesical Instillation Treatment of Interstitial Cystitis/Bladder Pain Syndrome: A Systematic Review and Network Meta-Analysis of Randomized Controlled Trials. Int. Urogynecol. J. 2021, 32, 1061–1071. [Google Scholar] [CrossRef]
  16. Gevaert, T.; Vandepitte, J.; Ost, D.; Nilius, B.; De Ridder, D. Autonomous Contractile Activity in the Isolated Rat Bladder Is Modulated by a TRPV1 Dependent Mechanism. Neurourol. Urodyn. 2007, 26, 424–432. [Google Scholar] [CrossRef] [PubMed]
  17. Lepiarczyk, E.; Majewski, M.; Bossowska, A. The Influence of Intravesical Administration of Resiniferatoxin (RTX) on the Chemical Coding of Sympathetic Chain Ganglia (SChG) Neurons Supplying the Porcine Urinary Bladder. Histochem. Cell Biol. 2015, 144, 479–489. [Google Scholar] [CrossRef] [PubMed]
  18. Lepiarczyk, E.; Bossowska, A.; Kaleczyc, J.; Skowrońska, A.; Majewska, M.; Majewski, M.; Majewski, M. The Influence of Resiniferatoxin (RTX) and Tetrodotoxin (TTX) on the Distribution, Relative Frequency, and Chemical Coding of Noradrenergic and Cholinergic Nerve Fibers Supplying the Porcine Urinary Bladder Wall. Toxins 2017, 9, 310. [Google Scholar] [CrossRef] [PubMed] [Green Version]
  19. Rothschild, M.F.; Ruvinsky, A. The Genetics of the Pig, 2nd ed.; CABI: Wallingford, UK, 2011; ISBN 9781845937560. [Google Scholar]
  20. Swindle, M.M. The Development of Swine Models in Drug Discovery and Development. Future Med. Chem. 2012, 4, 1771–1772. [Google Scholar] [CrossRef]
  21. Schook, L.B.; Collares, T.V.; Darfour-Oduro, K.A.; De, A.K.; Rund, L.A.; Schachtschneider, K.M.; Seixas, F.K. Unraveling the Swine Genome: Implications for Human Health. Annu. Rev. Anim. Biosci. 2015, 3, 219–244. [Google Scholar] [CrossRef] [Green Version]
  22. Andrews, S. FastQC A Quality Control Tool for High Throughput Sequence Data. Available online: https://www.bioinformatics.babraham.ac.uk/projects/fastqc/ (accessed on 14 December 2022).
  23. Bolger, A.M.; Lohse, M.; Usadel, B. Trimmomatic: A Flexible Trimmer for Illumina Sequence Data. Bioinformatics 2014, 30, 2114–2120. [Google Scholar] [CrossRef]
  24. Pertea, M.; Pertea, G.M.; Antonescu, C.M.; Chang, T.-C.; Mendell, J.T.; Salzberg, S.L. StringTie Enables Improved Reconstruction of a Transcriptome from RNA-Seq Reads. Nat. Biotechnol. 2015, 33, 290–295. [Google Scholar] [CrossRef] [PubMed] [Green Version]
  25. Frazee, A.C.; Pertea, G.; Jaffe, A.E.; Langmead, B.; Salzberg, S.L.; Leek, J.T. Ballgown Bridges the Gap between Transcriptome Assembly and Expression Analysis. Nat. Biotechnol. 2015, 33, 243–246. [Google Scholar] [CrossRef] [PubMed] [Green Version]
  26. Ashburner, M.; Ball, C.A.; Blake, J.A.; Botstein, D.; Butler, H.; Cherry, J.M.; Davis, A.P.; Dolinski, K.; Dwight, S.S.; Eppig, J.T.; et al. Gene Ontology: Tool for the Unification of Biology. The Gene Ontology Consortium. Nat. Genet. 2000, 25, 25–29. [Google Scholar] [CrossRef] [PubMed] [Green Version]
  27. Kanehisa, M.; Furumichi, M.; Tanabe, M.; Sato, Y.; Morishima, K. KEGG: New Perspectives on Genomes, Pathways, Diseases and Drugs. Nucleic Acids Res. 2017, 45, D353–D361. [Google Scholar] [CrossRef] [PubMed] [Green Version]
  28. Untergasser, A.; Cutcutache, I.; Koressaar, T.; Ye, J.; Faircloth, B.C.; Remm, M.; Rozen, S.G. Primer3--New Capabilities and Interfaces. Nucleic Acids Res. 2012, 40, e115. [Google Scholar] [CrossRef] [Green Version]
  29. Pfaffl, M.W. A New Mathematical Model for Relative Quantification in Real-Time RT-PCR. Nucleic Acids Res. 2001, 29, e45. [Google Scholar] [CrossRef]
  30. Kárai, L.J.; Russell, J.T.; Iadarola, M.J.; Oláh, Z. Vanilloid Receptor 1 Regulates Multiple Calcium Compartments and Contributes to Ca2+-Induced Ca2+ Release in Sensory Neurons. J. Biol. Chem. 2004, 279, 16377–16387. [Google Scholar] [CrossRef] [PubMed] [Green Version]
  31. Olah, Z.; Szabo, T.; Karai, L.; Hough, C.; Fields, R.D.; Caudle, R.M.; Blumberg, P.M.; Iadarola, M.J. Ligand-Induced Dynamic Membrane Changes and Cell Deletion Conferred by Vanilloid Receptor 1. J. Biol. Chem. 2001, 276, 11021–11030. [Google Scholar] [CrossRef] [PubMed] [Green Version]
  32. Wu, X.-P.; Yang, Y.-P.; She, R.-X.; Xing, Z.-M.; Chen, H.-W.; Zhang, Y.-W. MicroRNA-329 Reduces Bone Cancer Pain through the LPAR1-Dependent LPAR1/ERK Signal Transduction Pathway in Mice. Ther. Adv. Med. Oncol. 2019, 11, 1758835919875319. [Google Scholar] [CrossRef]
  33. BRADY, C. P2X3-Immunoreactive Nerve Fibres in Neurogenic Detrusor Overactivity and the Effect of Intravesical Resiniferatoxin*1. Eur. Urol. 2004, 46, 247–253. [Google Scholar] [CrossRef]
  34. Guan, X.; Lu, J.; Sun, F.; Li, Q.; Pang, Y. The Molecular Evolution and Functional Divergence of Lamprey Programmed Cell Death Genes. Front. Immunol. 2019, 10, 1382. [Google Scholar] [CrossRef] [Green Version]
  35. Li, Y.; Huang, B.; Yang, H.; Kan, S.; Yao, Y.; Liu, X.; Pu, S.; He, G.; Khan, T.-M.; Qi, G.; et al. Latexin Deficiency in Mice Up-Regulates Inflammation and Aggravates Colitis through HECTD1/Rps3/NF-ΚB Pathway. Sci. Rep. 2020, 10, 9868. [Google Scholar] [CrossRef]
  36. Zeng, L.; Zampetaki, A.; Margariti, A.; Pepe, A.E.; Alam, S.; Martin, D.; Xiao, Q.; Wang, W.; Jin, Z.-G.; Cockerill, G.; et al. Sustained Activation of XBP1 Splicing Leads to Endothelial Apoptosis and Atherosclerosis Development in Response to Disturbed Flow. Proc. Natl. Acad. Sci. USA 2009, 106, 8326–8331. [Google Scholar] [CrossRef] [PubMed] [Green Version]
  37. Guo, F.-J.; Liu, Y.; Zhou, J.; Luo, S.; Zhao, W.; Li, X.; Liu, C. XBP1S Protects Cells from ER Stress-Induced Apoptosis through Erk1/2 Signaling Pathway Involving CHOP. Histochem. Cell Biol. 2012, 138, 447–460. [Google Scholar] [CrossRef] [PubMed]
  38. Bhat, M.A.; Rios, J.C.; Lu, Y.; Garcia-Fresco, G.P.; Ching, W.; Martin, M.S.; Li, J.; Einheber, S.; Chesler, M.; Rosenbluth, J.; et al. Axon-Glia Interactions and the Domain Organization of Myelinated Axons Requires Neurexin IV/Caspr/Paranodin. Neuron 2001, 30, 369–383. [Google Scholar] [CrossRef] [Green Version]
  39. Gordon, A.; Adamsky, K.; Vainshtein, A.; Frechter, S.; Dupree, J.L.; Rosenbluth, J.; Peles, E. Caspr and Caspr2 Are Required for Both Radial and Longitudinal Organization of Myelinated Axons. J. Neurosci. 2014, 34, 14820–14826. [Google Scholar] [CrossRef] [PubMed] [Green Version]
  40. Hengel, H.; Magee, A.; Mahanjah, M.; Vallat, J.-M.; Ouvrier, R.; Abu-Rashid, M.; Mahamid, J.; Schüle, R.; Schulze, M.; Krägeloh-Mann, I.; et al. CNTNAP1 Mutations Cause CNS Hypomyelination and Neuropathy with or without Arthrogryposis. Neurol. Genet. 2017, 3, e144. [Google Scholar] [CrossRef] [Green Version]
  41. Mehta, P.; Küspert, M.; Bale, T.; Brownstein, C.A.; Towne, M.C.; De Girolami, U.; Shi, J.; Beggs, A.H.; Darras, B.T.; Wegner, M.; et al. Novel Mutation in CNTNAP1 Results in Congenital Hypomyelinating Neuropathy. Muscle Nerve 2017, 55, 761–765. [Google Scholar] [CrossRef] [PubMed] [Green Version]
  42. Villarroel-Campos, D.; Bronfman, F.C.; Gonzalez-Billault, C. Rab GTPase Signaling in Neurite Outgrowth and Axon Specification. Cytoskeleton 2016, 73, 498–507. [Google Scholar] [CrossRef] [PubMed]
  43. Li, K.; Li, Y.; Wang, J.; Huo, Y.; Huang, D.; Li, S.; Liu, J.; Li, X.; Liu, R.; Chen, X.; et al. A Functional Missense Variant in ITIH3 Affects Protein Expression and Neurodevelopment and Confers Schizophrenia Risk in the Han Chinese Population. J. Genet. Genomics 2020, 47, 233–248. [Google Scholar] [CrossRef] [PubMed]
  44. Llavero Hurtado, M.; Fuller, H.R.; Wong, A.M.S.; Eaton, S.L.; Gillingwater, T.H.; Pennetta, G.; Cooper, J.D.; Wishart, T.M. Proteomic Mapping of Differentially Vulnerable Pre-Synaptic Populations Identifies Regulators of Neuronal Stability in Vivo. Sci. Rep. 2017, 7, 12412. [Google Scholar] [CrossRef] [Green Version]
  45. Loupatty, F.J.; Clayton, P.T.; Ruiter, J.P.N.; Ofman, R.; IJlst, L.; Brown, G.K.; Thorburn, D.R.; Harris, R.A.; Duran, M.; DeSousa, C.; et al. Mutations in the Gene Encoding 3-Hydroxyisobutyryl-CoA Hydrolase Results in Progressive Infantile Neurodegeneration. Am. J. Hum. Genet. 2007, 80, 195–199. [Google Scholar] [CrossRef] [PubMed] [Green Version]
  46. Cabrera-Serrano, M.; Coote, D.J.; Azmanov, D.; Goullee, H.; Andersen, E.; McLean, C.; Davis, M.; Ishimura, R.; Stark, Z.; Vallat, J.-M.; et al. A Homozygous UBA5 Pathogenic Variant Causes a Fatal Congenital Neuropathy. J. Med. Genet. 2020, 57, 835–842. [Google Scholar] [CrossRef]
  47. Al-Saady, M.L.; Kaiser, C.S.; Wakasuqui, F.; Korenke, G.C.; Waisfisz, Q.; Polstra, A.; Pouwels, P.J.W.; Bugiani, M.; van der Knaap, M.S.; Lunsing, R.J.; et al. Homozygous UBA5 Variant Leads to Hypomyelination with Thalamic Involvement and Axonal Neuropathy. Neuropediatrics 2021, 52, 489–494. [Google Scholar] [CrossRef] [PubMed]
  48. Lombet, A.; Planque, N.; Bleau, A.M.; Li, C.L.; Perbal, B. CCN3 and Calcium Signaling. Cell Commun. Signal. 2003, 1, 1. [Google Scholar] [CrossRef] [PubMed] [Green Version]
  49. De la Vega Gallardo, N.; Dittmer, M.; Dombrowski, Y.; Fitzgerald, D.C. Regenerating CNS Myelin: Emerging Roles of Regulatory T Cells and CCN Proteins. Neurochem. Int. 2019, 130, 104349. [Google Scholar] [CrossRef] [Green Version]
  50. Naughton, M.; Moffat, J.; Eleftheriadis, G.; de la Vega Gallardo, N.; Young, A.; Falconer, J.; Hawkins, K.; Pearson, B.; Perbal, B.; Hogan, A.; et al. CCN3 Is Dynamically Regulated by Treatment and Disease State in Multiple Sclerosis. J. Neuroinflammation 2020, 17, 349. [Google Scholar] [CrossRef] [PubMed]
  51. Park, M.; Baek, I.J.; Kim, H.; Woo, D.K.; Park, Y.J.; Shim, S. CCN3 Overexpression Inhibits Growth of Callosal Projections via Upregulation of RAB25. Biochem. Biophys. Res. Commun. 2015, 461, 456–462. [Google Scholar] [CrossRef]
  52. Röhr, D.; Halfter, H.; Schulz, J.B.; Young, P.; Gess, B. Sodium-Dependent Vitamin C Transporter 2 Deficiency Impairs Myelination and Remyelination after Injury: Roles of Collagen and Demethylation. Glia 2017, 65, 1186–1200. [Google Scholar] [CrossRef] [PubMed]
  53. Senderek, J. Mutation of the SBF2 Gene, Encoding a Novel Member of the Myotubularin Family, in Charcot-Marie-Tooth Neuropathy Type 4B2/11p15. Hum. Mol. Genet. 2003, 12, 349–356. [Google Scholar] [CrossRef]
  54. Cunningham, G.M.; Shen, F.; Wu, X.; Cantor, E.L.; Gardner, L.; Philips, S.; Jiang, G.; Bales, C.L.; Tan, Z.; Liu, Y.; et al. The Impact of SBF2 on Taxane-Induced Peripheral Neuropathy. PLoS Genet. 2022, 18, e1009968. [Google Scholar] [CrossRef]
  55. Long, J.Z.; Cisar, J.S.; Milliken, D.; Niessen, S.; Wang, C.; Trauger, S.A.; Siuzdak, G.; Cravatt, B.F. Metabolomics Annotates ABHD3 as a Physiologic Regulator of Medium-Chain Phospholipids. Nat. Chem. Biol. 2011, 7, 763–765. [Google Scholar] [CrossRef] [Green Version]
  56. Calderon, R.O.; Attema, B.; DeVries, G.H. Lipid Composition of Neuronal Cell Bodies and Neurites from Cultured Dorsal Root Ganglia. J. Neurochem. 2002, 64, 424–429. [Google Scholar] [CrossRef] [PubMed]
  57. Lauwers, E.; Goodchild, R.; Verstreken, P. Membrane Lipids in Presynaptic Function and Disease. Neuron 2016, 90, 11–25. [Google Scholar] [CrossRef] [Green Version]
  58. Dong, X.; Yang, L.; Liu, K.; Ji, X.; Tang, C.; Li, W.; Ma, L.; Mei, Y.; Peng, T.; Feng, B.; et al. Transcriptional Networks Identify Synaptotagmin-like 3 as a Regulator of Cortical Neuronal Migration during Early Neurodevelopment. Cell Rep. 2021, 34, 108802. [Google Scholar] [CrossRef]
  59. Johnson, J.L.; Monfregola, J.; Napolitano, G.; Kiosses, W.B.; Catz, S.D. Vesicular Trafficking through Cortical Actin during Exocytosis Is Regulated by the Rab27a Effector JFC1/Slp1 and the RhoA-GTPase–Activating Protein Gem-Interacting Protein. Mol. Biol. Cell 2012, 23, 1902–1916. [Google Scholar] [CrossRef] [PubMed]
  60. Palmieri, F. Mitochondrial Transporters of the SLC25 Family and Associated Diseases: A Review. J. Inherit. Metab. Dis. 2014, 37, 565–575. [Google Scholar] [CrossRef] [PubMed]
  61. Slabbaert, J.R.; Kuenen, S.; Swerts, J.; Maes, I.; Uytterhoeven, V.; Kasprowicz, J.; Fernandes, A.C.; Blust, R.; Verstreken, P. Shawn, the Drosophila Homolog of SLC25A39/40, Is a Mitochondrial Carrier That Promotes Neuronal Survival. J. Neurosci. 2016, 36, 1914–1929. [Google Scholar] [CrossRef] [PubMed] [Green Version]
  62. Holick, M.F. Vitamin D Deficiency. N. Engl. J. Med. 2007, 357, 266–281. [Google Scholar] [CrossRef] [PubMed]
  63. AlJohri, R.; AlOkail, M.; Haq, S.H. Neuroprotective Role of Vitamin D in Primary Neuronal Cortical Culture. eNeurologicalSci 2019, 14, 43–48. [Google Scholar] [CrossRef] [PubMed]
  64. Poët, M.; Kornak, U.; Schweizer, M.; Zdebik, A.A.; Scheel, O.; Hoelter, S.; Wurst, W.; Schmitt, A.; Fuhrmann, J.C.; Planells-Cases, R.; et al. Lysosomal Storage Disease upon Disruption of the Neuronal Chloride Transport Protein ClC-6. Proc. Natl. Acad. Sci. USA 2006, 103, 13854–13859. [Google Scholar] [CrossRef] [PubMed] [Green Version]
  65. Jentsch, T.J.; Pusch, M. CLC Chloride Channels and Transporters: Structure, Function, Physiology, and Disease. Physiol. Rev. 2018, 98, 1493–1590. [Google Scholar] [CrossRef] [PubMed]
  66. Polovitskaya, M.M.; Barbini, C.; Martinelli, D.; Harms, F.L.; Cole, F.S.; Calligari, P.; Bocchinfuso, G.; Stella, L.; Ciolfi, A.; Niceta, M.; et al. A Recurrent Gain-of-Function Mutation in CLCN6, Encoding the ClC-6 Cl−/H+-Exchanger, Causes Early-Onset Neurodegeneration. Am. J. Hum. Genet. 2020, 107, 1062–1077. [Google Scholar] [CrossRef] [PubMed]
  67. Frias, B.; Merighi, A. Capsaicin, Nociception and Pain. Molecules 2016, 21, 797. [Google Scholar] [CrossRef] [PubMed] [Green Version]
  68. Evron, T.; Daigle, T.L.; Caron, M.G. GRK2: Multiple Roles beyond G Protein-Coupled Receptor Desensitization. Trends Pharmacol. Sci. 2012, 33, 154–164. [Google Scholar] [CrossRef] [PubMed] [Green Version]
  69. Kavelaars, A.; Eijkelkamp, N.; Willemen, H.L.D.M.; Wang, H.; Carbajal, A.G.; Heijnen, C.J. Microglial GRK2: A Novel Regulator of Transition from Acute to Chronic Pain. Brain. Behav. Immun. 2011, 25, 1055–1060. [Google Scholar] [CrossRef] [PubMed]
  70. Wang, H.; Heijnen, C.J.; Eijkelkamp, N.; Carbajal, A.G.; Schedlowski, M.; Kelley, K.W.; Dantzer, R.; Kavelaars, A. GRK2 in Sensory Neurons Regulates Epinephrine-Induced Signalling and Duration of Mechanical Hyperalgesia. Pain 2011, 152, 1649–1658. [Google Scholar] [CrossRef]
  71. Wang, H.; Heijnen, C.J.; van Velthoven, C.T.J.; Willemen, H.L.D.M.; Ishikawa, Y.; Zhang, X.; Sood, A.K.; Vroon, A.; Eijkelkamp, N.; Kavelaars, A. Balancing GRK2 and EPAC1 Levels Prevents and Relieves Chronic Pain. J. Clin. Invest. 2013, 123, 5023–5034. [Google Scholar] [CrossRef] [PubMed] [Green Version]
  72. Eijkelkamp, N.; Heijnen, C.J.; Willemen, H.L.D.M.; Deumens, R.; Joosten, E.A.J.; Kleibeuker, W.; den Hartog, I.J.M.; van Velthoven, C.T.J.; Nijboer, C.; Nassar, M.A.; et al. GRK2: A Novel Cell-Specific Regulator of Severity and Duration of Inflammatory Pain. J. Neurosci. 2010, 30, 2138–2149. [Google Scholar] [CrossRef] [PubMed] [Green Version]
  73. Latremoliere, A.; Latini, A.; Andrews, N.; Cronin, S.J.; Fujita, M.; Gorska, K.; Hovius, R.; Romero, C.; Chuaiphichai, S.; Painter, M.; et al. Reduction of Neuropathic and Inflammatory Pain through Inhibition of the Tetrahydrobiopterin Pathway. Neuron 2015, 86, 1393–1406. [Google Scholar] [CrossRef]
  74. Moore, B.J.R.; Islam, B.; Ward, S.; Jackson, O.; Armitage, R.; Blackburn, J.; Haider, S.; McHugh, P.C. Repurposing of Tranilast for Potential Neuropathic Pain Treatment by Inhibition of Sepiapterin Reductase in the BH4 Pathway. ACS Omega 2019, 4, 11960–11972. [Google Scholar] [CrossRef] [PubMed] [Green Version]
  75. McHugh, P.C.; Joyce, P.R.; Deng, X.; Kennedy, M.A. A Polymorphism of the GTP-Cyclohydrolase i Feedback Regulator Gene Alters Transcriptional Activity and May Affect Response to SSRI Antidepressants. Pharmacogenomics J. 2011, 11, 207–213. [Google Scholar] [CrossRef]
  76. Werner, E.R.; Blau, N.; Thöny, B. Tetrahydrobiopterin: Biochemistry and Pathophysiology. Biochem. J. 2011, 438, 397–414. [Google Scholar] [CrossRef] [PubMed] [Green Version]
  77. Wallingford, J.B.; Niswander, L.A.; Shaw, G.M.; Finnell, R.H. The Continuing Challenge of Understanding, Preventing, and Treating Neural Tube Defects. Science 2013, 339, 1222002. [Google Scholar] [CrossRef] [PubMed] [Green Version]
  78. Mattson, M.P.; Shea, T.B. Folate and Homocysteine Metabolism in Neural Plasticity and Neurodegenerative Disorders. Trends Neurosci. 2003, 26, 137–146. [Google Scholar] [CrossRef]
  79. Iskandar, B.J.; Nelson, A.; Resnick, D.; Pate Skene, J.H.; Gao, P.; Johnson, C.; Cook, T.D.; Hariharan, N. Folic Acid Supplementation Enhances Repair of the Adult Central Nervous System. Ann. Neurol. 2004, 56, 221–227. [Google Scholar] [CrossRef] [PubMed]
  80. Miranpuri, G.S.; Schomberg, D.T.; Alrfaei, B.; King, K.C.; Rynearson, B.; Wesley, V.S.; Khan, N.; Obiakor, K.; Wesley, U.V.; Resnick, D.K. Role of Matrix Metalloproteinases 2 in Spinal Cord Injury-Induced Neuropathic Pain. Ann. Neurosci. 2016, 23, 25–32. [Google Scholar] [CrossRef] [Green Version]
  81. Apostolidis, A.; Gonzales, G.E.; Fowler, C.J. Effect of Intravesical Resiniferatoxin (RTX) on Lower Urinary Tract Symptoms, Urodynamic Parameters, and Quality of Life of Patients with Urodynamic Increased Bladder Sensation. Eur. Urol. 2006, 50, 1299–1305. [Google Scholar] [CrossRef]
  82. Giordano, J.; Schultea, T. Serotonin 5-HT(3) Receptor Mediation of Pain and Anti-Nociception: Implications for Clinical Therapeutics. Pain Physician 2004, 7, 141–147. [Google Scholar] [CrossRef] [PubMed]
  83. Ramage, A.G. The Role of Central 5-Hydroxytryptamine (5-HT, Serotonin) Receptors in the Control of Micturition. Br. J. Pharmacol. 2006, 147, S120–S131. [Google Scholar] [CrossRef] [PubMed]
  84. Conley, R.K.; Williams, T.J.; Ford, A.P.D.W.; Ramage, A.G. The Role of α 1 -Adrenoceptors and 5-HT 1A Receptors in the Control of the Micturition Reflex in Male Anaesthetized Rats. Br. J. Pharmacol. 2001, 133, 61–72. [Google Scholar] [CrossRef] [Green Version]
  85. Mbaki, Y.; Ramage, A.G. Investigation of the Role of 5-HT 2 Receptor Subtypes in the Control of the Bladder and the Urethra in the Anaesthetized Female Rat. Br. J. Pharmacol. 2008, 155, 343–356. [Google Scholar] [CrossRef] [Green Version]
  86. Muñoz-Islas, E.; Vidal-Cantú, G.C.; Bravo-Hernández, M.; Cervantes-Durán, C.; Quiñonez-Bastidas, G.N.; Pineda-Farias, J.B.; Barragán-Iglesias, P.; Granados-Soto, V. Spinal 5-HT5A Receptors Mediate 5-HT-Induced Antinociception in Several Pain Models in Rats. Pharmacol. Biochem. Behav. 2014, 120, 25–32. [Google Scholar] [CrossRef] [PubMed]
  87. Kruithof, P.D.; Lunev, S.; Aguilar Lozano, S.P.; de Assis Batista, F.; Al-dahmani, Z.M.; Joles, J.A.; Dolga, A.M.; Groves, M.R.; van Goor, H. Unraveling the Role of Thiosulfate Sulfurtransferase in Metabolic Diseases. Biochim. Biophys. Acta - Mol. Basis Dis. 2020, 1866, 165716. [Google Scholar] [CrossRef] [PubMed]
  88. Tiranti, V.; Viscomi, C.; Hildebrandt, T.; Di Meo, I.; Mineri, R.; Tiveron, C.; Levitt, M.D.; Prelle, A.; Fagiolari, G.; Rimoldi, M.; et al. Loss of ETHE1, a Mitochondrial Dioxygenase, Causes Fatal Sulfide Toxicity in Ethylmalonic Encephalopathy. Nat. Med. 2009, 15, 200–205. [Google Scholar] [CrossRef]
  89. Nicholas, S.; Yuan, S.Y.; Brookes, S.J.H.; Spencer, N.J.; Zagorodnyuk, V.P. Hydrogen Peroxide Preferentially Activates Capsaicin-Sensitive High Threshold Afferents via TRPA1 Channels in the Guinea Pig Bladder. Br. J. Pharmacol. 2017, 174, 126–138. [Google Scholar] [CrossRef] [Green Version]
  90. Andersson, K.-E. TRP Channels as Lower Urinary Tract Sensory Targets. Med. Sci. 2019, 7, 67. [Google Scholar] [CrossRef] [PubMed] [Green Version]
  91. Streng, T.; Axelsson, H.E.; Hedlund, P.; Andersson, D.A.; Jordt, S.-E.; Bevan, S.; Andersson, K.-E.; Högestätt, E.D.; Zygmunt, P.M. Distribution and Function of the Hydrogen Sulfide–Sensitive TRPA1 Ion Channel in Rat Urinary Bladder. Eur. Urol. 2008, 53, 391–400. [Google Scholar] [CrossRef]
  92. Bjorling, D.E.; Wang, Z.Y. Potential of Endocannabinoids to Control Bladder Pain. Front. Syst. Neurosci. 2018, 12, 17. [Google Scholar] [CrossRef] [Green Version]
  93. Blankman, J.L.; Long, J.Z.; Trauger, S.A.; Siuzdak, G.; Cravatt, B.F. ABHD12 Controls Brain Lysophosphatidylserine Pathways That Are Deregulated in a Murine Model of the Neurodegenerative Disease PHARC. Proc. Natl. Acad. Sci. USA 2013, 110, 1500–1505. [Google Scholar] [CrossRef]
  94. Jenstad, M.; Quazi, A.Z.; Zilberter, M.; Haglerød, C.; Berghuis, P.; Saddique, N.; Goiny, M.; Buntup, D.; Davanger, S.; Haug, F.-M.S.; et al. System A Transporter SAT2 Mediates Replenishment of Dendritic Glutamate Pools Controlling Retrograde Signaling by Glutamate. Cereb. Cortex 2009, 19, 1092–1106. [Google Scholar] [CrossRef] [Green Version]
  95. Hu, Y.; Dong, L.; Sun, B.; Guillon, M.A.; Burbach, L.R.; Nunn, P.A.; Liu, X.; Vilenski, O.; Ford, A.P.D.W.; Zhong, Y.; et al. The Role of Metabotropic Glutamate Receptor MGlu5 in Control of Micturition and Bladder Nociception. Neurosci. Lett. 2009, 450, 12–17. [Google Scholar] [CrossRef]
  96. Ostrovskaya, O.; Xie, K.; Masuho, I.; Fajardo-Serrano, A.; Lujan, R.; Wickman, K.; Martemyanov, K.A. RGS7/Gβ5/R7BP Complex Regulates Synaptic Plasticity and Memory by Modulating Hippocampal GABABR-GIRK Signaling. eLife 2014, 3, e02053. [Google Scholar] [CrossRef] [PubMed]
  97. Gerber, K.J.; Squires, K.E.; Hepler, J.R. Roles for Regulator of G Protein Signaling Proteins in Synaptic Signaling and Plasticity. Mol. Pharmacol. 2016, 89, 273–286. [Google Scholar] [CrossRef] [Green Version]
  98. Chen, T.F.; Doyle, P.T.; Ferguson, D.R. Inhibition in the Human Urinary Bladder by Gamma-Amino-Butyric Acid. Br. J. Urol. 1994, 73, 250–255. [Google Scholar] [CrossRef] [PubMed]
  99. Witherow, D.S.; Wang, Q.; Levay, K.; Cabrera, J.L.; Chen, J.; Willars, G.B.; Slepak, V.Z. Complexes of the G Protein Subunit Gβ5 with the Regulators of G Protein Signaling RGS7 and RGS9. J. Biol. Chem. 2000, 275, 24872–24880. [Google Scholar] [CrossRef] [Green Version]
  100. Sandiford, S.L.; Slepak, V.Z. The Gβ 5 −RGS7 Complex Selectively Inhibits Muscarinic M3 Receptor Signaling via the Interaction between the Third Intracellular Loop of the Receptor and the DEP Domain of RGS7. Biochemistry 2009, 48, 2282–2289. [Google Scholar] [CrossRef] [Green Version]
  101. Shuey, D.J.; Betty, M.; Jones, P.G.; Khawaja, X.Z.; Cockett, M.I. RGS7 Attenuates Signal Transduction Through the Gαq Family of Heterotrimeric G Proteins in Mammalian Cells. J. Neurochem. 2002, 70, 1964–1972. [Google Scholar] [CrossRef]
  102. Chess-Williams, R. Muscarinic Receptors of the Urinary Bladder: Detrusor, Urothelial and Prejunctional. Auton. Autacoid Pharmacol. 2002, 22, 133–145. [Google Scholar] [CrossRef] [PubMed]
Figure 1. Transcriptome-wide RNA-Seq analysis and expression profiles of the differentially expressed genes (DEGs) for RTX-treated and control libraries. (a) The volcano plot depicts log2FC plotted against log-normalized p values. The horizontal line indicates a negative logarithmic adjusted p value (0.05) cut-off. Dotted double vertical lines indicate cut-off values of logFC. The square brackets comprise the symbols of the selected genes with high functional significance. (b) MA plot presents the logarithmic scale of the fold changes in the Y axis and the normalized expression count values in the X axis. Two horizontal dotted lines refer to the cut value of log2FC >1 and <−1. The red color illustrates upregulated DEGs; the green color represents downregulated DEGs; grey dots are nonsignificant transcripts according to DESeq2 methods.
Cells 12 00462 g001
Figure 2. Heatmap visualization of the differentially expressed genes (DEGs) after RTX administration. Columns represent individual control (CTR) and RTX-treated (RTX) urinary bladder wall libraries; rows indicate gene symbols of DEGs. The z-score scale is applied for visualization expression values (FPKM) of each biological replicate. The red color illustrates upregulated DEGs; the green color represents downregulated DEGs.
Cells 12 00462 g002
Figure 3. Circos plot representing five significantly enriched Kyoto Encyclopedia of Genes and Genomes (KEGG) pathways associated with differentially expressed genes (DEGs) that altered due to resiniferatoxin (RTX) intravesical administration. Gene symbols with logarithmic values (blue–red scale) of fold change (logFC) are located on the left side of the circos. Five color links merge genes with KEGG annotations (‘Folate biosynthesis’, ‘Metabolic pathways’, ‘Sulfur relay system’, ‘Sulfur metabolism’, and ‘Serotonergic synapse’) on the right side.
Cells 12 00462 g003
Figure 4. Enrichment Kyoto Encyclopedia of Genes and Genomes (KEGG) analysis of differentially expressed genes (DEGs) engaged in ‘Serotonergic synapse’. Red rectangles represent upregulated genes. Logarithmic fold change (logFC; red–green scale) describes gene expression values.
Cells 12 00462 g004
Figure 5. The mRNA expression of selected genes obtained through real-time PCR. The expression of endogenous control is shown as normalized to a value of 1 (REF), and the expression of validated genes indicates the changes relative to the control. The exact values of the expression are marked above the bars. P values ≤ 0.05 were considered statistically significant where ≤0.0332 (*), ≤0.0021 (**), ≤0.0002 (***), and ≤0.0001 (****).
Cells 12 00462 g005
Table 1. Summary of statistical metrics for the RNA-Seq libraries; CTR refers to control samples; RTX refers to the biological replicates of the experimental (RTX-treated) urinary bladder wall samples; “Raw reads“ refers to the number of reads obtained from sequencing protocol; “Trimmed reads” refers to reads that passed the quality control procedure; “Mapped reads” refers to all reads aligned to the reference genome; “Uniquely mapped reads” refers to reads that were mapped to a unique (only one) location of the reference genome; “Multimapped reads” refers to reads aligned to more than one locus on the reference genome; “Reads mapped with too many loci” refers to the reads mapped more than 20 multiple loci on the reference genome.
RNA-Seq LibrariesRaw ReadsTrimmed ReadsMapped ReadsUniquely Mapped ReadsMulti-Mapped ReadsToo Many Loci
CTR163,450,43253,906,52251,882,47650,773,3061,065,27843,892
CTR263,018,14452,441,27050,719,27649,751,418941,06626,792
CTR363,747,77854,451,85251,875,62250,745,1641,099,47430,984
CTR463,650,87253,024,69650,606,39249,420,9021,156,81428,676
CTR564,447,90853,525,86852,020,67251,016,528974,89429,250
CTR661,433,06451,078,74649,682,24448,575,5121,074,52432,208
RTX162,806,45651,157,17849,658,77448,627,582996,79634,396
RTX261,901,72651,796,64248,881,44847,799,7141,050,19831,536
RTX362,638,64252,315,26449,903,75048,713,6441,162,62227,484
RTX462,536,66251,887,61450,170,97848,818,3081,313,04239,628
RTX562,688,46251,465,77050,012,44448,808,9581,171,51031,976
RTX661,475,20050,497,81847,752,17646,484,0261,229,93038,220
Table 2. Significant upregulated differentially expressed genes (DEGs) between RTX-treated (RTX) and control (CTR) libraries.
Gene IDGene Namelog2FoldChangep-Adjusted
MSTRG.18558SLAMF725.477.96 × 10−14
MSTRG.24634SUPT3H25.309.68 × 10−14
MSTRG.14735NCLN25.299.68 × 10−14
MSTRG.15606ARHGEF3724.251.13 × 10−12
MSTRG.18613FCRL323.545.68 × 10−12
MSTRG.13448OSBPL523.309.30 × 10−12
MSTRG.22604CLCN623.189.71 × 10−18
MSTRG.4591LIMD222.962.08 × 10−11
MSTRG.27341SLC35F222.922.22 × 10−11
MSTRG.7236MIX2321.704.42 × 10−10
MSTRG.20205ITPR221.428.65 × 10−10
MSTRG.137SYTL321.281.17 × 10−9
MSTRG.28195SEC16B8.310.0036
MSTRG.19812MFSD57.620.0403
MSTRG.13163GSDME7.430.0105
MSTRG.1415PDCD77.300.0436
ENSSSCG00000002479SERPINA116.810.0006
MSTRG.13644ENSSSCG000000397406.030.0003
MSTRG.2732GPATCH25.040.0002
MSTRG.19650TST5.030.0389
MSTRG.28205RALGPS24.550.0015
MSTRG.9190CYP2C424.480.0059
MSTRG.2418PTGS14.060.0356
MSTRG.19993CYP27B13.790.0221
MSTRG.18574ATP1A43.660.0328
MSTRG.1486CALML43.130.0004
MSTRG.29522ENSSSCG000000477012.780.0214
MSTRG.16166CORO1A2.589.19 × 10−5
MSTRG.26707ENSSSCG000000091822.530.0075
MSTRG.8288SUDS32.460.0018
MSTRG.15899MEPCE2.410.0037
MSTRG.7148MELTF2.290.0434
MSTRG.12780AKR1B11.890.0026
MSTRG.4949ENSSSCG000000401101.580.0015
MSTRG.4430SAP30BP1.580.0352
MSTRG.18428SPIDR1.310.0434
MSTRG.12716ZC3HAV1L1.090.0101
MSTRG.9033ADIRF1.050.0036
MSTRG.16386C16orf891.020.0221
MSTRG.19607TMEM184B0.950.0136
MSTRG.5521SAT20.890.0483
MSTRG.14799ENSSSCG000000263870.890.0224
MSTRG.21677ENSSSCG000000289430.852.31 × 10−15
MSTRG.18711IL6R0.690.0185
MSTRG.22744ENSSSCG000000292420.670.0283
MSTRG.10953DUSP280.620.0227
MSTRG.2338HDHD30.600.0399
MSTRG.11546ENSSSCG000000264140.590.0137
MSTRG.4676SLC25A390.530.0337
MSTRG.11916ABHD120.530.0032
MSTRG.22082ACP40.500.0062
MSTRG.13531GRK20.480.0014
MSTRG.24570CNPY30.420.0137
MSTRG.8629ENSSSCG000000362800.400.0428
Table 3. Significantly downregulated differentially expressed genes (DEGs) between RTX-treated (RTX) and control (CTR) libraries.
Gene IDGene Namelog2FoldChangep−Adjusted
MSTRG.15089ARRDC3−27.241.70 × 10−15
MSTRG.16274VPS35L−25.905.74 × 10−14
MSTRG.16760RANBP2−25.695.74 × 10−14
MSTRG.10097ARL6IP6−25.695.74 × 10−14
MSTRG.22915FABP3−25.517.96 × 10−14
MSTRG.21796ETHE1−25.418.44 × 10−14
MSTRG.10408HIBCH−25.181.23 × 10−13
MSTRG.22503LRRC47−24.991.93 × 10−13
MSTRG.15319ADAMTS19−24.684.27 × 10−13
MSTRG.12082PROCR−24.614.90 × 10−13
MSTRG.7356NECTIN3−24.515.96 × 10−13
MSTRG.5103BRIP1−24.231.13 × 10−12
MSTRG.3245SUV39H2−24.091.57 × 10−12
MSTRG.12889ASB15−23.882.67 × 10−12
MSTRG.2979RABIF−23.625.12 × 10−12
MSTRG.24689CILK1−23.555.68 × 10−12
MSTRG.14163SBF2−23.496.31 × 10−12
MSTRG.6267ITIH3−23.368.48 × 10−12
MSTRG.15168NUDT12−23.348.76 × 10−12
MSTRG.17031SPR−23.269.96 × 10−12
MSTRG.4745CNTNAP1−23.165.74 × 10−14
MSTRG.12395PCK1−22.595.18 × 10−11
MSTRG.1522LRRC49−22.535.88 × 10−11
MSTRG.8812CABCOCO1−20.625.39 × 10−9
MSTRG.3953DIAPH3−11.412.52 × 10−5
MSTRG.29959NDUFA1−11.399.13 × 10−7
MSTRG.6637UBA5−10.477.95 × 10−6
MSTRG.11212MOCS2−10.457.86 × 10−8
MSTRG.25491ANGEL1−9.750.0013
MSTRG.12280SLC13A3−9.710.0151
MSTRG.25217PARP2−9.640.0018
MSTRG.28269LAMC1−9.452.65 × 10−7
MSTRG.2788RGS7−9.230.0018
MSTRG.26818SCD5−8.800.0032
MSTRG.17952CCN3−8.800.0033
MSTRG.9028BMPR1A−8.780.0092
MSTRG.16749SNRNP200−8.727.95 × 10−6
MSTRG.28308TPR−8.649.15 × 10−7
MSTRG.10410MFSD6−8.631.35 × 10−5
MSTRG.7732PKNOX1−8.610.0003
MSTRG.3103B4GALT1−8.590.0037
MSTRG.25925ZCCHC4−7.930.0150
MSTRG.5125ENSSSCG00000027233−7.670.0005
MSTRG.23226ABHD3−7.520.0021
MSTRG.11786SLC23A2−7.270.0007
MSTRG.13311KRBA1−7.080.0293
MSTRG.29606STARD8−6.207.95 × 10−6
MSTRG.4433ENSSSCG00000036248−6.170.0004
MSTRG.28999SAPCD2−5.980.0101
MSTRG.8518OSBP2−5.881.08 × 10−5
ENSSSCG00000032669ENSSSCG00000032669−5.860.0319
ENSSSCG00000008166CREG2−5.690.0289
MSTRG.15782RBAK−5.530.0023
MSTRG.2091FANCG−5.190.0032
MSTRG.17449KRTCAP3−4.320.0004
MSTRG.24821ACAN−4.000.0400
MSTRG.21369CENPT−3.900.0403
MSTRG.21518KCTD15−3.600.0488
MSTRG.25897NCAPG−3.540.0019
MSTRG.27421USP28−3.240.0485
MSTRG.17940SHAS2−2.880.0224
MSTRG.7109LPP−2.460.0473
MSTRG.8347RITA1−2.300.0164
MSTRG.8476XBP1−2.290.0214
MSTRG.28939ZMYND19−2.030.0321
MSTRG.9945CENPU−1.980.0224
MSTRG.27587ROBO3−1.730.0149
MSTRG.27235NA−1.660.0291
MSTRG.11646ENSSSCG00000043933−1.340.0410
MSTRG.2104GBA2−1.260.0164
MSTRG.924FAM81A−1.090.0429
MSTRG.20134YARS2−0.850.0403
MSTRG.3339ENSSSCG00000044246−0.710.0494
MSTRG.2389ENSSSCG00000039972−0.360.0095
MSTRG.24246ENSSSCG00000021069−0.340.0189
Table 4. The results of the Kyoto Encyclopedia of Genes and Genomes (KEGG) pathways for differentially expressed genes (DEGs) detected in resiniferatoxin (RTX)-treated samples.
Term IDKEGG Namep-Adjusted *Gene NumberGene Symbol
KEGG:00790Folate biosynthesis0.02243SPR, MOCS2, AKR1B1
KEGG:01100Metabolic pathways0.062118ETHE1, HIBCH, SUV39H2, NUDT12,
SPR, PCK1, NDUFA1, MOCS2, SCD5, B4GALT1, GBA2, SAT2, AKR1B1, ENSSSCG00000009182, CYP27B1, PTGS1, CYP2C42, TST
KEGG:04122Sulfur relay system0.08452MOCS2,TST
KEGG:00920Sulfur metabolism0.10522ETHE1,TST
KEGG:04726Serotonergic synapse0.22914ENSSSCG00000040110, PTGS1, CYP2C42, ITPR2
* calculated with the g:SCS algorithm.
Disclaimer/Publisher’s Note: The statements, opinions and data contained in all publications are solely those of the individual author(s) and contributor(s) and not of MDPI and/or the editor(s). MDPI and/or the editor(s) disclaim responsibility for any injury to people or property resulting from any ideas, methods, instructions or products referred to in the content.

