
Is Environmental Cadmium Exposure Causally Related to Diabetes and Obesity?

Abstract
:1. Introduction
2. Exposure Sources, Dosimetry and Health Risk Assessment
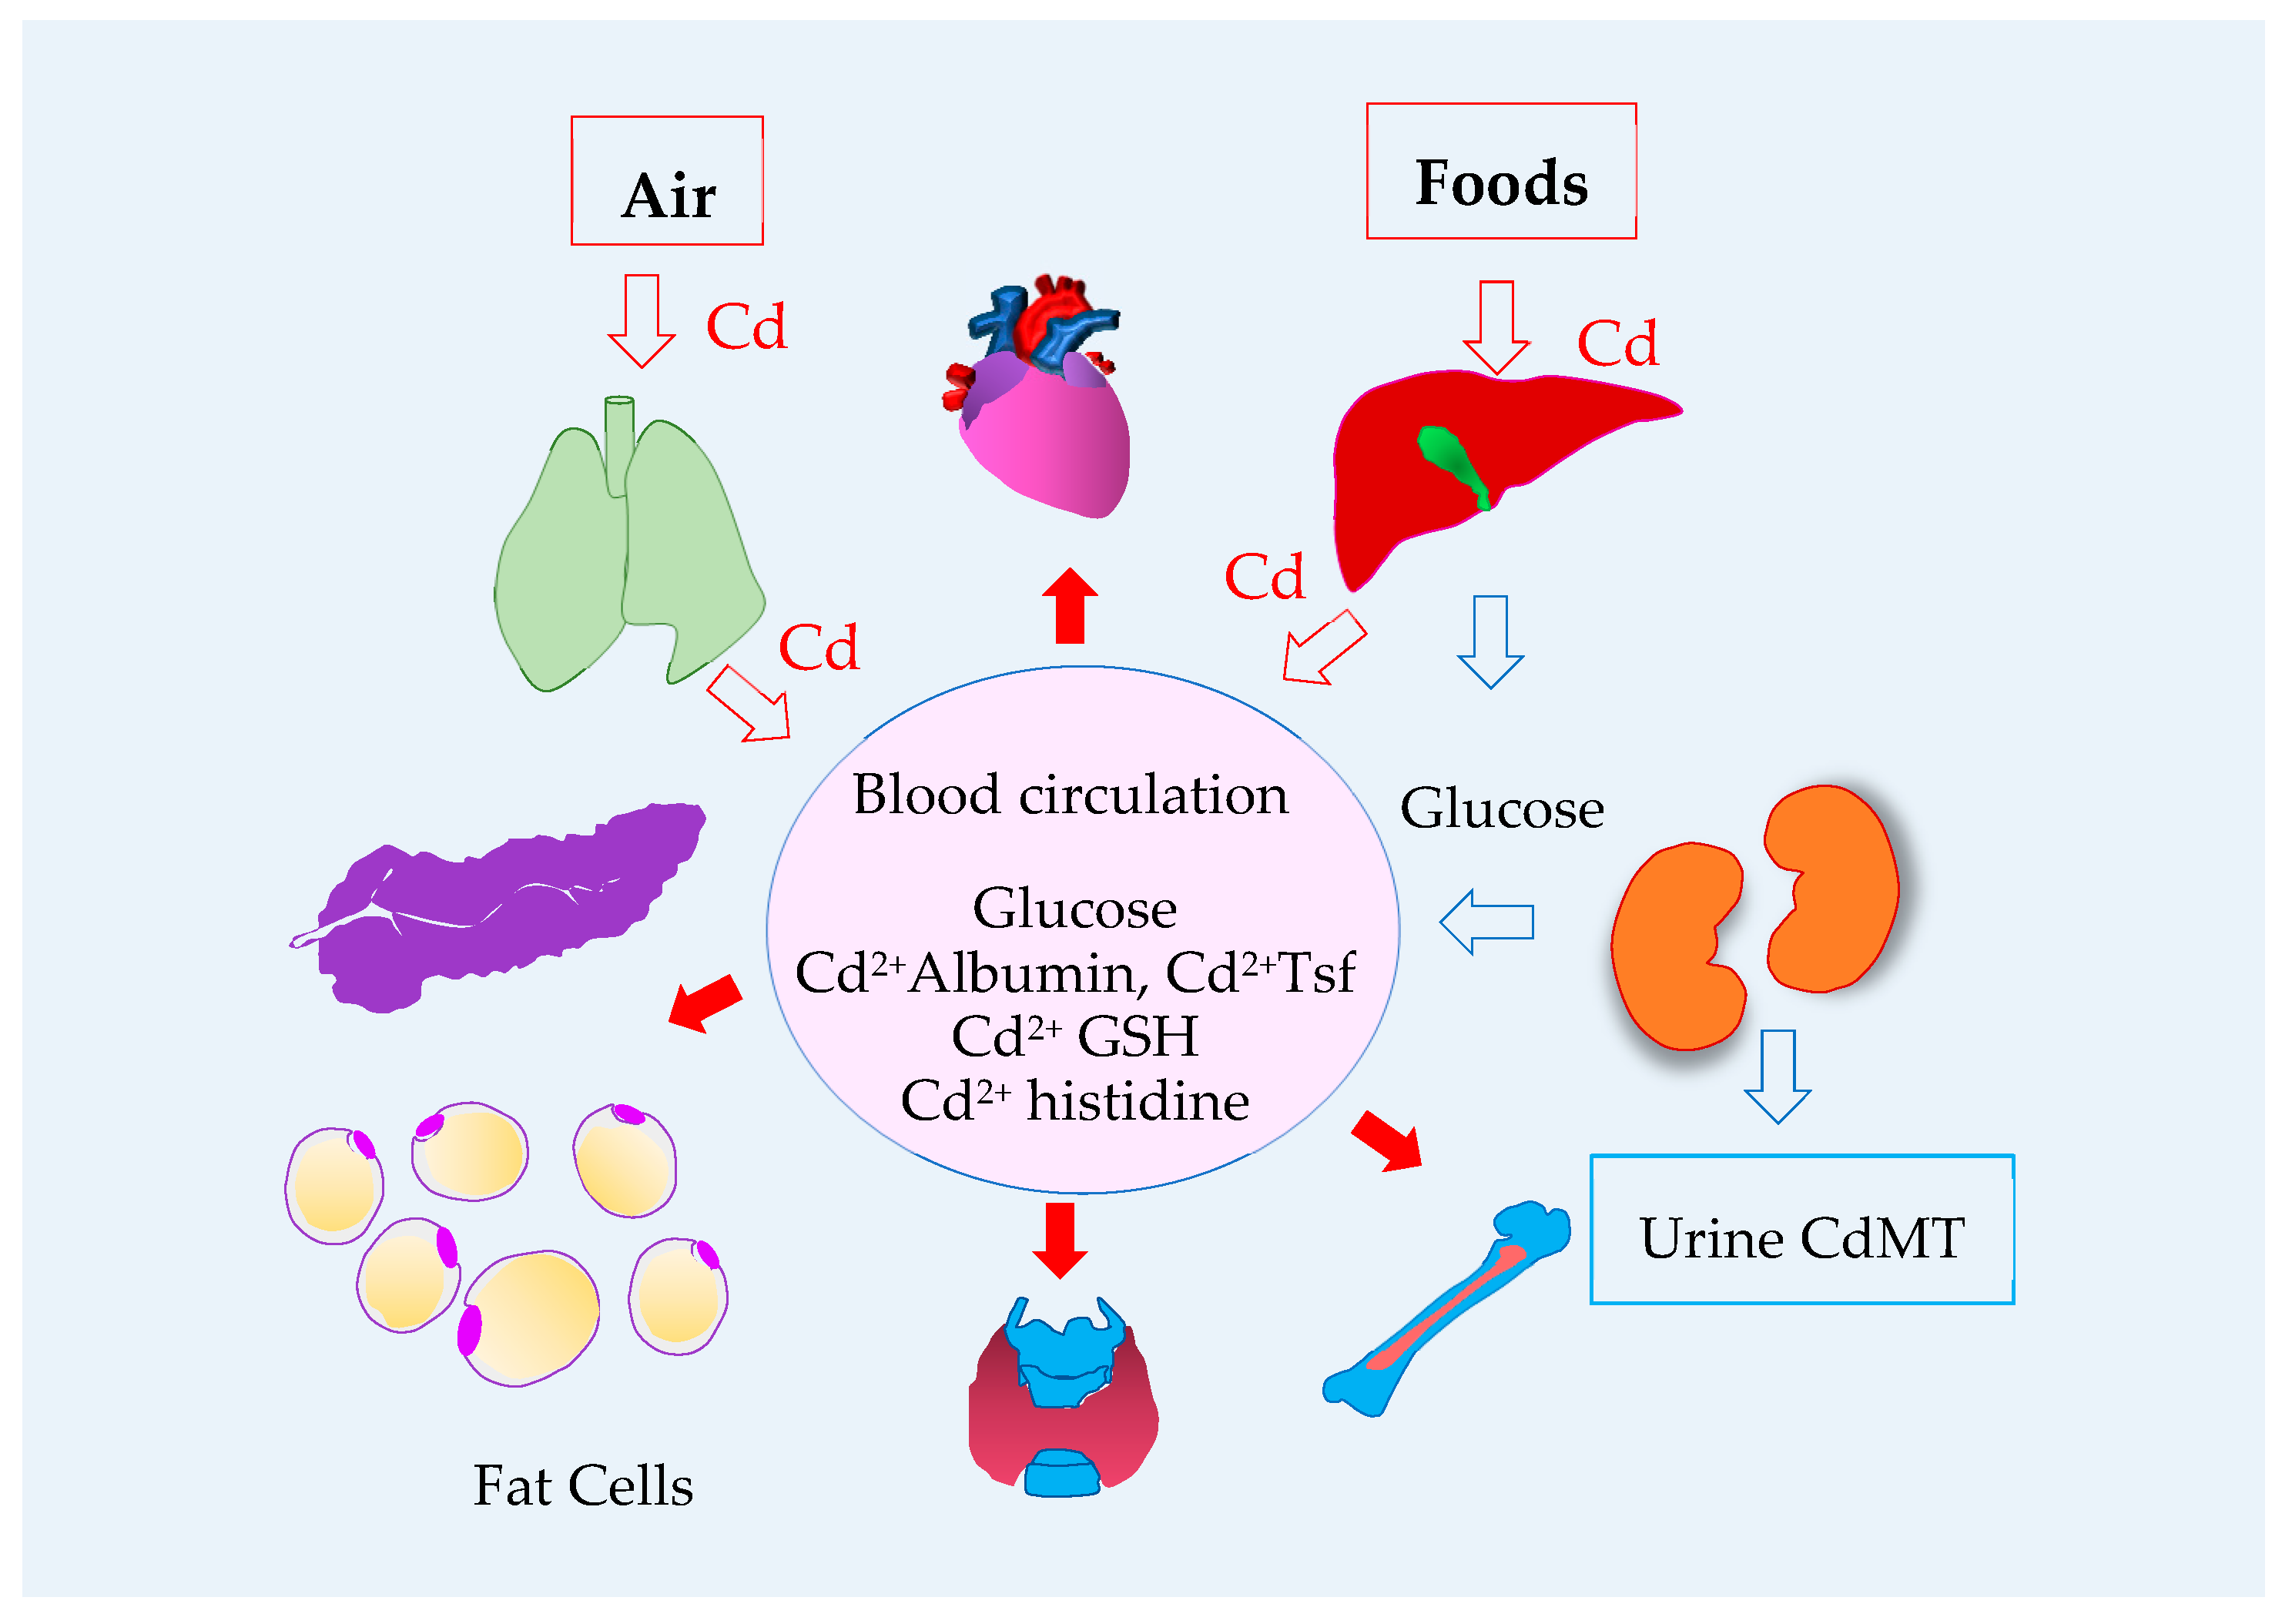
2.1. Dietary Exposure to Cadmium
2.2. The Intestinal Absorption of Cadmium
2.3. Blood Cadmium
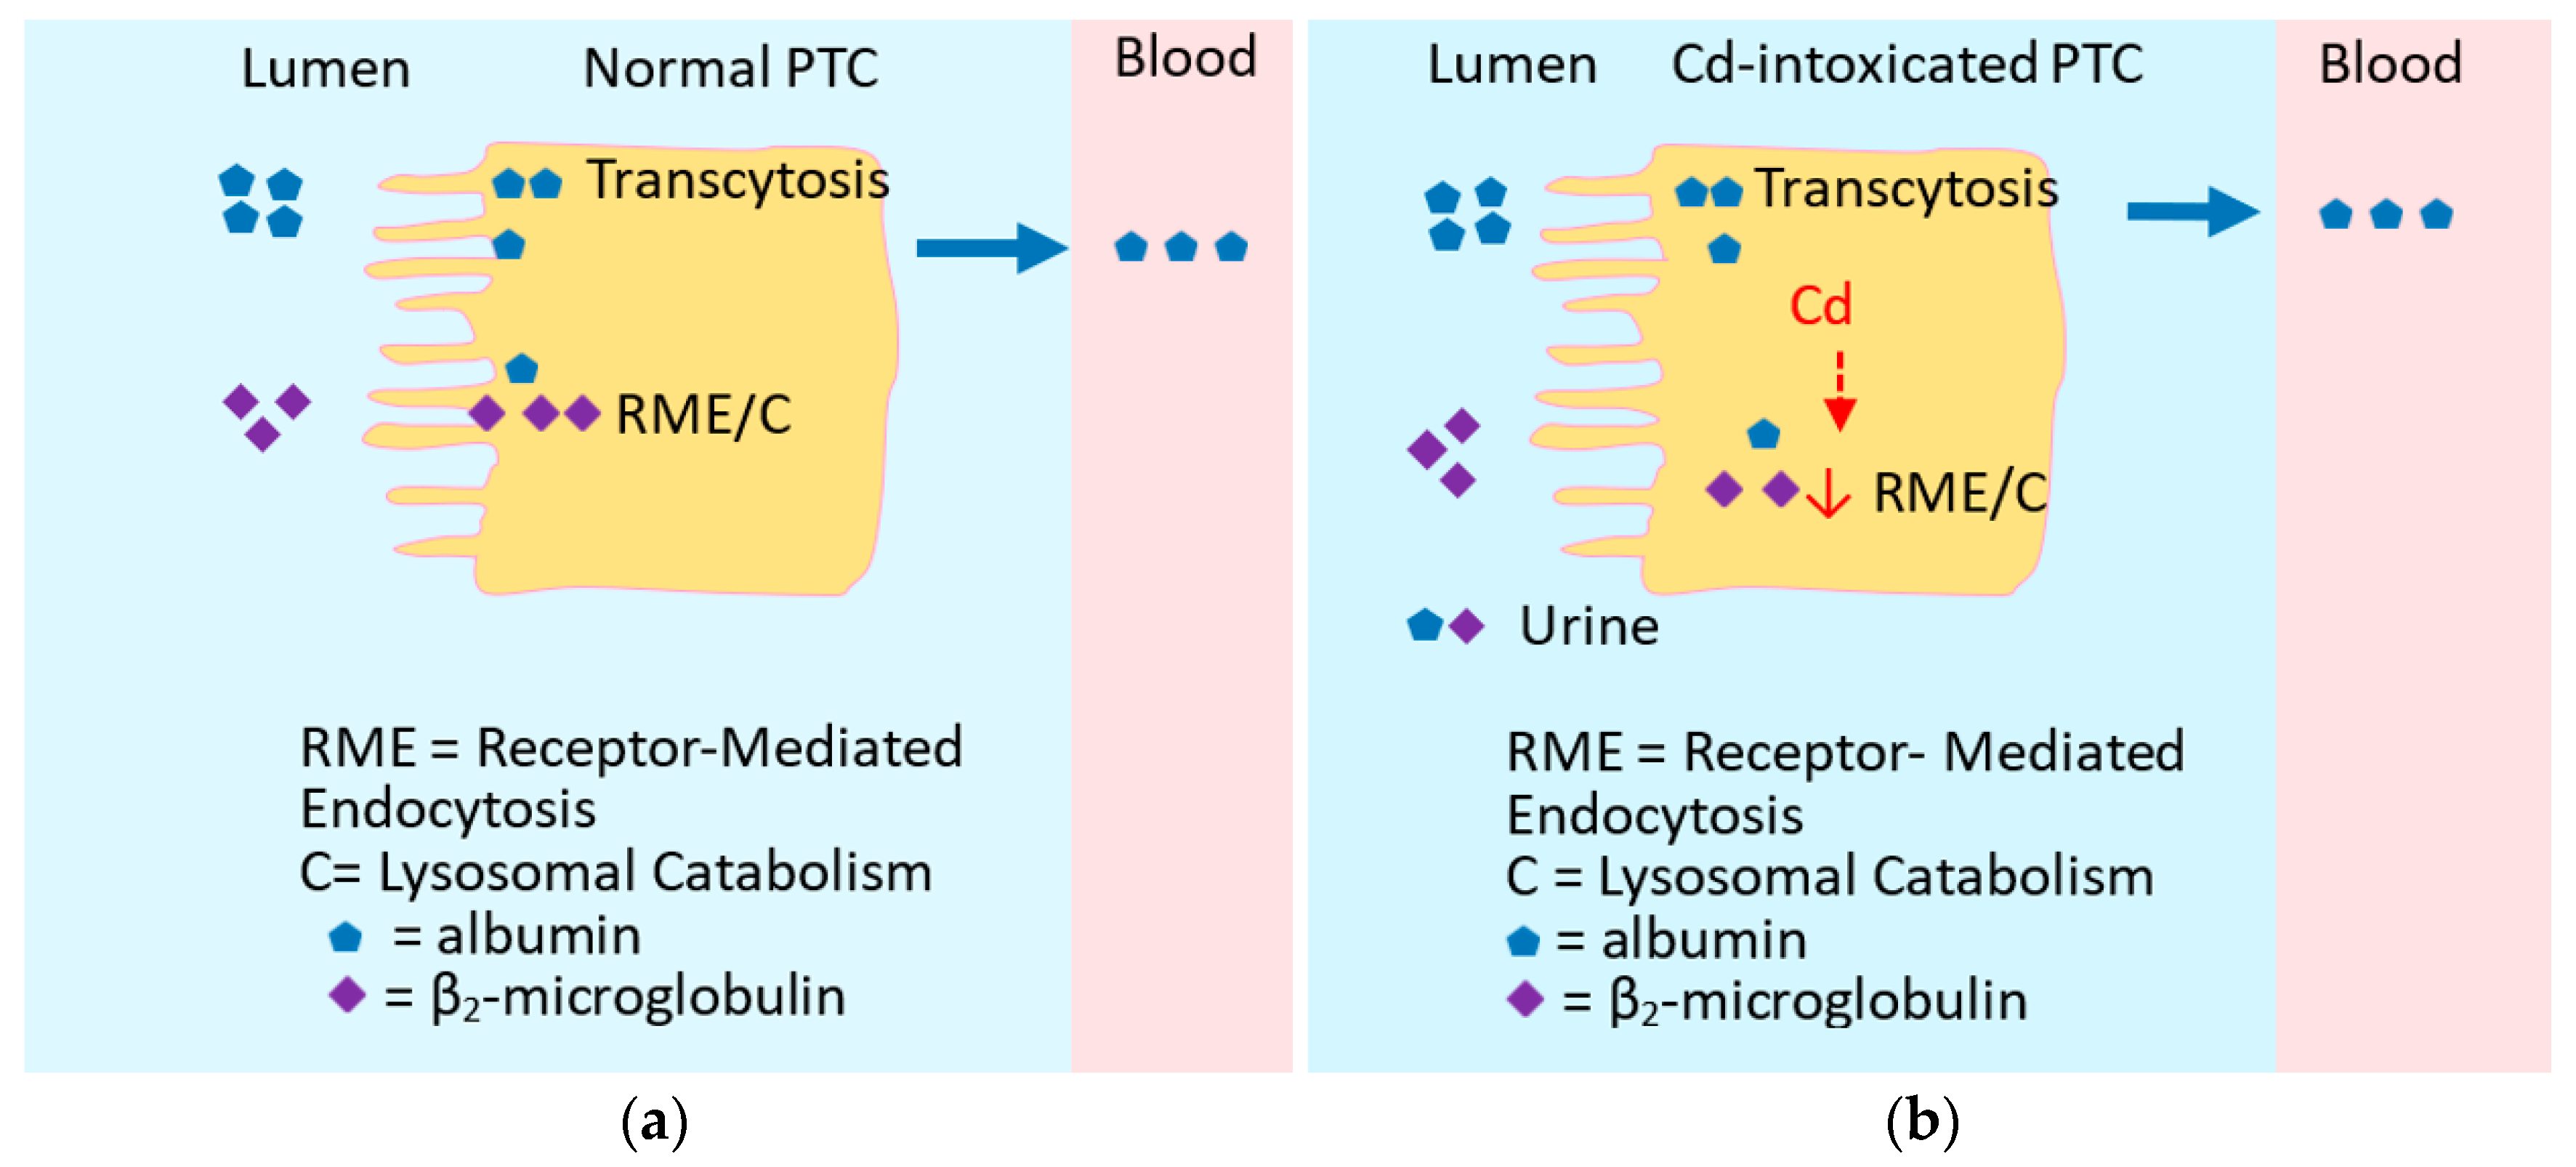
2.4. Excretion of Cadmium Siginfies Kidney Tubular Cell Injury and Death
2.5. Is Urinary β2M Indicative of Tubulopathy?
2.6. Health Risk Assessment of Cadmium Exposure
2.6.1. Exposure Guideline
2.6.2. Population Data
3. Cadmium, Obesity, and Diseases with High Prevalence

| NHANES | Exposure and Risk Estimates | References |
|---|---|---|
| 1988–1994 n 8722, ≥40 years | Urinary Cd levels 1–2 μg/g creatinine were associated with prediabetes (OR 1.48) and diabetes (OR 1.24). Urine Cd levels > 2 µg/g creatinine were associated with 2.5-fold and 1.45-fold increases in risk of prediabetes and diabetes, respectively. | Schwartz et al., 2003 [120] |
| 2005–2010 n 2398, ≥40 years | Urinary Cd > 1.4 µg/g creatinine in non-smokers were associated with pre-diabetes. | Wallia et al., 2014 [121] |
| 2007–2012 n 3552, ≥20 years | Urinary Cd quartile 4 was associated with prediabetes among men (OR 1.95). OR for prediabetes rose 3.4-fold in men with obesity and a high Cd exposure, compared to those with a normal weight and low Cd exposure. | Jiang et al., 2018 [122] |
| 1988–1994 n 12,732, ≥20 years | Urinary Cd levels ≥ 0.83 μg/g creatinine in women were associated with liver inflammation (OR 1.26). Urinary Cd ≥ 0.65 μg/g creatinine in men were associated with liver inflammation (OR 2.21), NAFLD (OR 1.30), and NASH (OR 1.95). | Hyder et al., 2013 [123] |
| 1999–2015 n 11, 838, ≥20 years | A 10-fold increment of urinary Cd was associated with elevated plasma levels of ALT (OR 1.36), and AST (OR 1.31). | Hong et al., 2021 [124] |
| 1999–2016 n 4411 adolescents | Urinary Cd quartile 4 was associated with elevated plasma ALT (OR 1.40) and AST (OR 1.64). The effect was larger in boys than girls. | Xu et al., 2022 [125] |
| 1999–2006 n 5426, aged ≥20 years, | Urinary Cd levels ≥ 1 µg/L were associated with increased risk of albuminuria a (OR 1.41) and low GFR b (OR 1.48). | Ferraro et al., 2010 [126] |
| 2009–2012, n 2926, aged ≥20 years | Urinary Cd levels > 0.220 μg/L were associated with increased albumin excretion, compared with urinary Cd < 0.126 μg/L. Blood Cd levels > 0.349 μg/L associated with increased albumin excretion, compared with blood Cd < 0.243 μg/L. | Zhu et al., 2019 [127] |
| 2011–2012 n 1545, aged ≥20 years | Blood Cd levels > 0.53 μg/L were associated with albuminuria (OR 2.04) and low GFR (OR 2.21). OR for albuminuria was increased to 3.38 in those with similar Cd exposure levels and serum Zn < 74 μg/dL. | Lin et al., 2014 [128] |
| 2007–2012 n 12,577, aged ≥20 years | Blood Cd levels > 0.61 μg/L were associated with low GFR (OR 1.80) and albuminuria (OR 1.60). GFR reduction associated with Cd was more pronounced in those with diabetes, hypertension, or both. | Madrigal et al., 2019 [129] |
| 1999–2016, n 46,748, aged ≥20 years | Of 262 chemicals tested, blood Cd was associated with all three kidney outcomes; low GFR, albuminuria, and low GFR plus albuminuria. | Lee et al., 2020 [130] |
3.1. Dietary Exposure: The U.S. Experience
3.2. Cadmium and Its Inverse Relationship with Obesity
3.2.1. Children and Adolescents
3.2.2. Adults
3.3. The U.S. Population Risk Analysis of Cd-Associated Diabetes
4. Cadmium, the Liver, Kidney, and Diabetes Type 2
5. Cadmium and Diabetes: Experimental Studies
5.1. Cadmium-Induced Hyperglycemia: Landmark Observation
5.2. Female Preponderance Effects of Cadmium
5.3. The Molecular Basis for Deranged Cellular Glucose Metabolism after Cd Exposure
5.4. Cadmium and Pancreatic β Cells
5.5. Cadmium and “Metal Stressed” Fat Cells
6. Heme Oxygenase, Cadmium, Cellular Stress Response and Defense
6.1. Indispensable Role of Heme Oxygenase
6.2. Heme Oxygenase Activity and Blood Glucose Levels
6.3. Similarities versus Differences between HO-1 and HO-2
6.4. Cellular Stress Response and Defense against Cadmium Toxicity
6.5. How Does Cd Activate HO-1 Expression?
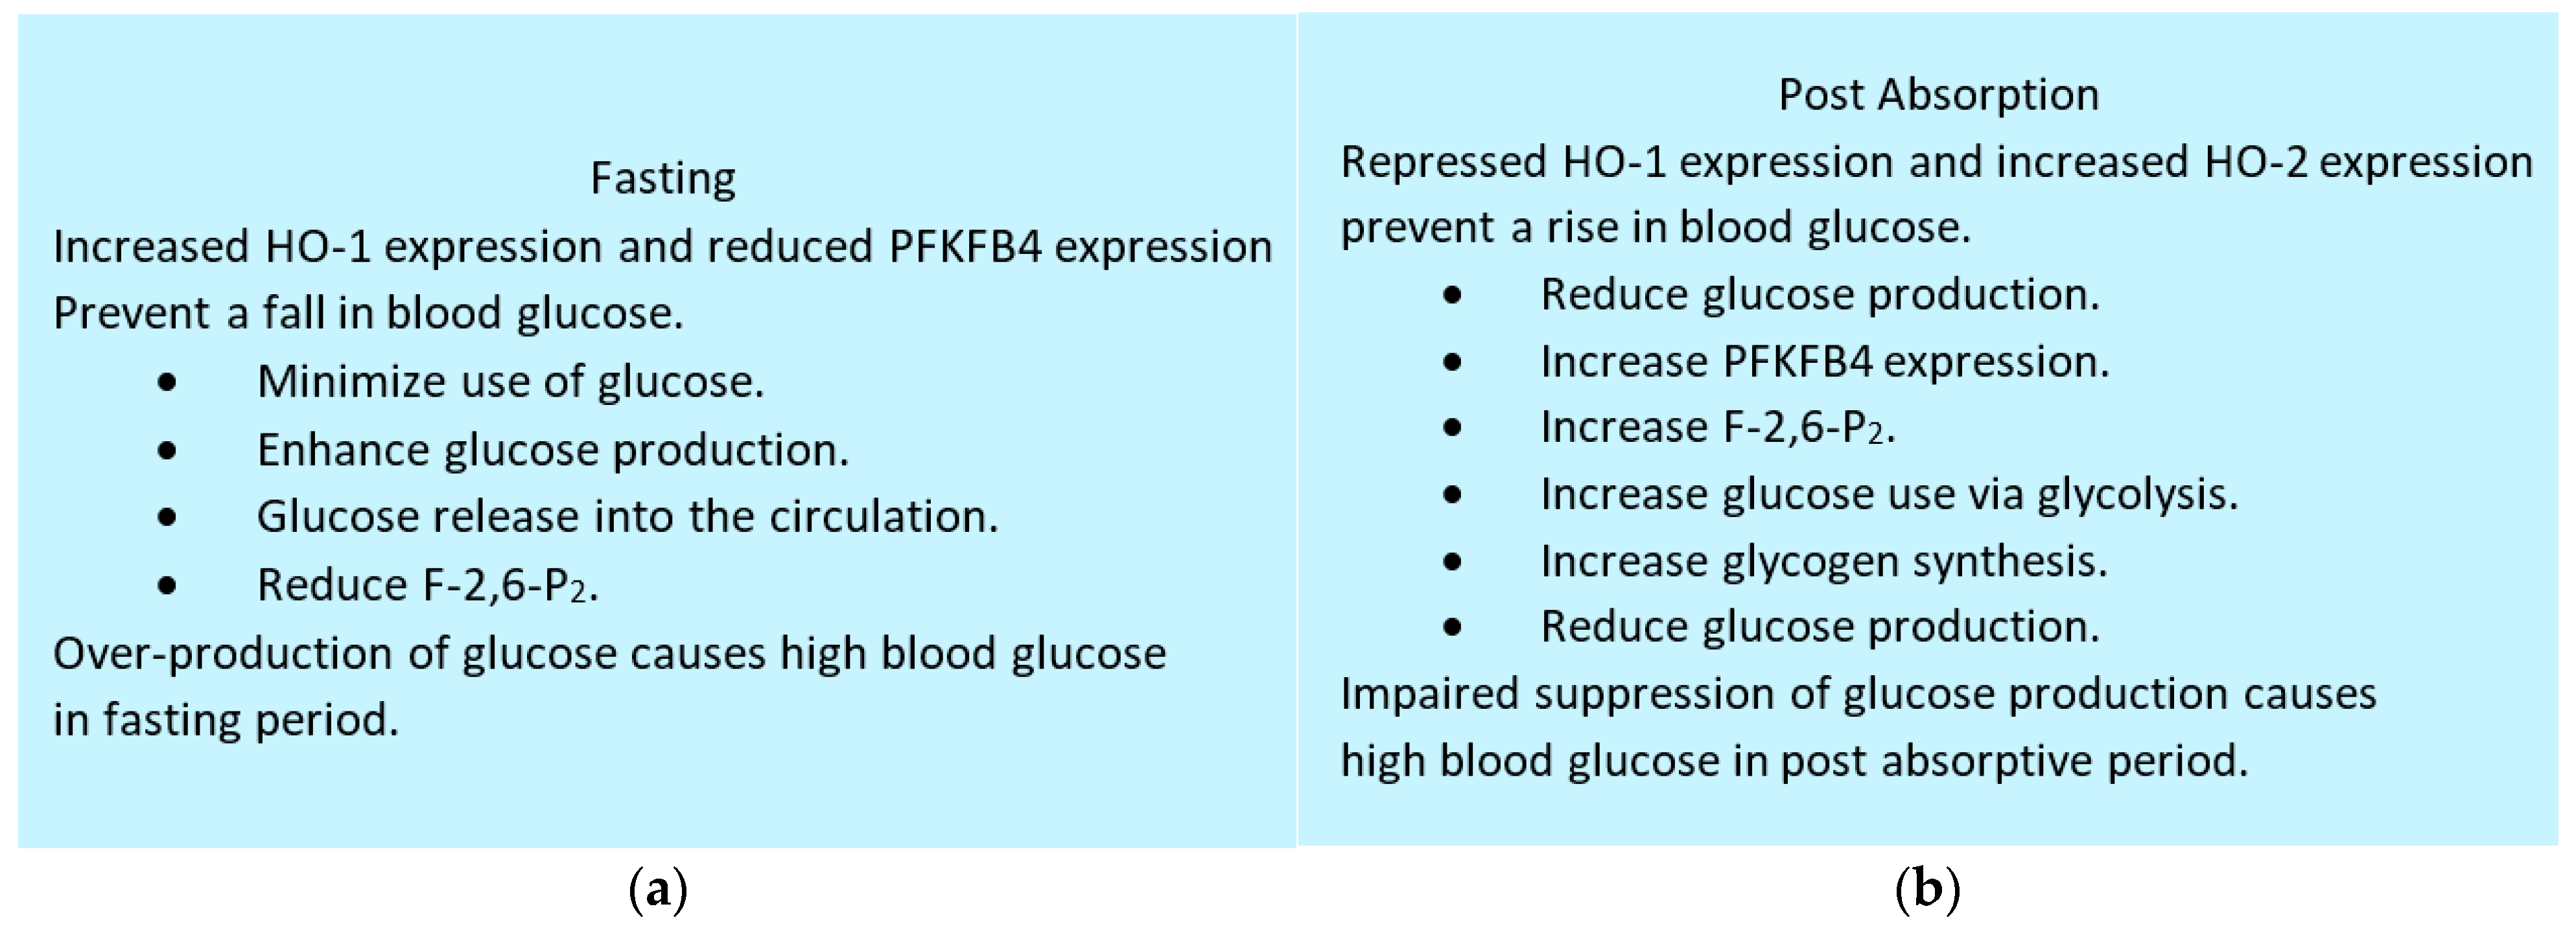
6.6. Maintenance of Blood Glucose: Integrative Role of HO-1, HO-2 and PFKFB4
7. Conclusions
Funding
Acknowledgments
Conflicts of Interest
References
- Järup, L. Hazards of heavy metal contamination. Br. Med. Bull. 2003, 68, 167–182. [Google Scholar] [CrossRef] [PubMed]
- Garrett, R.G. Natural sources of metals to the environment. Hum. Ecol. Risk Assess. 2010, 6, 945–963. [Google Scholar] [CrossRef]
- ATSDR (Agency for Toxic Substances and Disease Registry). Toxicological Profile for Cadmium; Department of Health and Humans Services, Public Health Service, Centers for Disease Control and Prevention: Atlanta, GA, USA, 2012.
- Aoshima, K. Epidemiology of renal tubular dysfunction in the inhabitants of a cadmium-polluted area in the Jinzu River basin in Toyama Prefecture. Tohoku J. Exp. Med. 1987, 152, 151–172. [Google Scholar] [CrossRef] [PubMed]
- Horiguchi, H.; Aoshima, K.; Oguma, E.; Sasaki, S.; Miyamoto, K.; Hosoi, Y.; Katoh, T.; Kayama, F. Latest status of cadmium accumulation and its effects on kidneys, bone, and erythropoiesis in inhabitants of the formerly cadmium-polluted Jinzu River Basin in Toyama, Japan, after restoration of rice paddies. Int. Arch. Occup. Environ. Health 2010, 83, 953–970. [Google Scholar] [CrossRef] [PubMed]
- Horiguchi, H.; Oguma, E.; Sasaki, S.; Miyamoto, K.; Hosoi, Y.; Ono, A.; Kayama, F. Exposure assessment of cadmium in female farmers in cadmium-polluted areas in Northern Japan. Toxics 2020, 8, 44. [Google Scholar] [CrossRef] [PubMed]
- Zarcinas, B.A.; Pongsakul, P.; McLaughlin, M.J.; Cozens, G. Heavy metals in soils and crops in Southeast Asia. 2. Thailand. Environ. Geochem. Health 2004, 26, 359–371. [Google Scholar] [CrossRef] [PubMed]
- Verbeeck, M.; Salaets, P.; Smolders, E. Trace element concentrations in mineral phosphate fertilizers used in Europe: A balanced survey. Sci. Total Environ. 2020, 712, 136419. [Google Scholar] [CrossRef]
- Zou, M.; Zhou, S.; Zhou, Y.; Jia, Z.; Guo, T.; Wang, J. Cadmium pollution of soil-rice ecosystems in rice cultivation dominated regions in China: A review. Environ. Pollut. 2021, 280, 116965. [Google Scholar] [CrossRef]
- McDowell, R.W.; Gray, C.W. Do soil cadmium concentrations decline after phosphate fertiliser application is stopped: A comparison of long-term pasture trials in New Zealand? Sci. Total Environ. 2022, 804, 150047. [Google Scholar] [CrossRef]
- Gao, Y.; Duan, Z.; Zhang, L.; Sun, D.; Li, X. The status and research progress of cadmium pollution in rice- (Oryza sativa L.) and wheat- (Triticum aestivum L.) cropping systems in China: A critical review. Toxics 2022, 10, 794. [Google Scholar] [CrossRef]
- Satarug, S.; Gobe, G.C.; Vesey, D.A.; Phelps, K.R. Cadmium and lead exposure, nephrotoxicity, and mortality. Toxics 2020, 8, 86. [Google Scholar] [CrossRef] [PubMed]
- Satarug, S.; Gobe, G.C.; Vesey, D.A. Multiple targets of toxicity in environmental exposure to low-dose cadmium. Toxics 2022, 10, 472. [Google Scholar] [CrossRef] [PubMed]
- Satarug, S.; Vesey, D.A.; Gobe, G.C.; Phelps, K.R. Estimation of health risks associated with dietary cadmium exposure. Arch. Toxicol. 2023, 97, 329–358. [Google Scholar] [CrossRef] [PubMed]
- Merali, Z.; Singhal, R.L. Diabetogenic effects of chronic oral cadmium administration to neonatal rats. Br. J. Pharmacol. 1980, 69, 151–157. [Google Scholar] [CrossRef] [PubMed]
- Bell, R.R.; Early, J.L.; Nonavinakere, V.K.; Mallory, Z. Effect of cadmium on blood glucose level in the rat. Toxicol. Lett. 1990, 54, 199–205. [Google Scholar] [CrossRef] [PubMed]
- Bell, R.R.; Soliman, M.R.; Early, J.L., 2nd. Acute effects of cadmium and selenium on glucose output from rat liver hepatocytes using various gluconeogenic precursors. Toxicology 1990, 65, 161–168. [Google Scholar] [CrossRef] [PubMed]
- Merali, Z.; Kacew, S.; Singhal, R.L. Response of hepatic carbohydrate and cyclic AMP metabolism to cadmium treatment in rats. Can. J. Physiol. Pharmacol. 1975, 53, 174–184. [Google Scholar] [CrossRef]
- Wang, B.; Luo, Q.; Shao, C.; Li, X.; Li, F.; Liu, Y.; Sun, L.; Li, Y.; Cai, L. The late and persistent pathogenic effects of cadmium at very low levels on the kidney of rats. Dose Response 2013, 11, 60–81. [Google Scholar] [CrossRef]
- Triplitt, C.L. Examining the mechanisms of glucose regulation. Am. J. Manag. Care 2012, 18, S4–S10. [Google Scholar]
- Wilding, J.P. The role of the kidneys in glucose homeostasis in type 2 diabetes: Clinical implications and therapeutic significance through sodium glucose co-transporter 2 inhibitors. Metabolism 2014, 63, 1228–1237. [Google Scholar] [CrossRef]
- Alsahli, M.; Gerich, J.E. Renal glucose metabolism in normal physiological conditions and in diabetes. Diabetes Res. Clin. Pract. 2017, 133, 1–9. [Google Scholar] [CrossRef] [PubMed]
- Dalga, D.; Verissimo, T.; de Seigneux, S. Gluconeogenesis in the kidney: In health and in chronic kidney disease. Clin. Kidney J. 2023, 16, 1249–1257. [Google Scholar] [CrossRef] [PubMed]
- Duo, Y.; Gao, J.; Yuan, T.; Zhao, W. Effect of sodium-glucose cotransporter 2 inhibitors on the rate of decline in kidney function: A systematic review and meta-analysis. J. Diabetes 2023, 15, 58–70. [Google Scholar] [CrossRef] [PubMed]
- Egan, S.K.; Bolger, P.M.; Carrington, C.D. Update of US FDA’s total diet study food list and diets. J. Expo. Sci. Environ. Epidemiol. 2007, 17, 573–582. [Google Scholar] [CrossRef]
- Callan, A.; Hinwood, A.; Devine, A. Metals in commonly eaten groceries in Western Australia: A market basket survey and dietary assessment. Food Addit. Contam. Part A Chem. Anal. Control Expo. Risk Assess. 2014, 31, 1968–1981. [Google Scholar] [CrossRef]
- Sand, S.; Becker, W. Assessment of dietary cadmium exposure in Sweden and population health concern including scenario analysis. Food Chem. Toxicol. 2012, 50, 536–544. [Google Scholar] [CrossRef]
- Schwarz, M.A.; Lindtner, O.; Blume, K.; Heinemeyer, G.; Schneider, K. Cadmium exposure from food: The German LExUKon project. Food Addit. Contam. Part A Chem. Anal. Control Expo. Risk Assess. 2014, 31, 1038–1051. [Google Scholar] [CrossRef]
- Watanabe, T.; Kataoka, Y.; Hayashi, K.; Matsuda, R.; Uneyama, C. Dietary exposure of the Japanese general population to elements: Total diet study 2013–2018. Food Saf. (Tokyo) 2022, 10, 83–101. [Google Scholar] [CrossRef]
- Wei, J.; Gao, J.; Cen, K. Levels of eight heavy metals and health risk assessment considering food consumption by China’s residents based on the 5th China total diet study. Sci. Total Environ. 2019, 689, 1141–1148. [Google Scholar] [CrossRef]
- Xiao, G.; Liu, Y.; Dong, K.F.; Lu, J. Regional characteristics of cadmium intake in adult residents from the 4th and 5th Chinese total diet study. Environ. Sci. Pollut. Res. Int. 2020, 27, 3850–3857. [Google Scholar] [CrossRef]
- Wang, B.; Liu, Y.; Wang, H.; Cui, L.; Zhang, Z.; Guo, J.; Liu, S.; Cui, W. Contamination and health risk assessment of lead, arsenic, cadmium, and aluminum from a total diet study of Jilin Province, China. Food Sci. Nutr. 2020, 8, 5631–5640. [Google Scholar] [CrossRef] [PubMed]
- Lim, J.A.; Kwon, H.J.; Ha, M.; Kim, H.; Oh, S.Y.; Kim, J.S.; Lee, S.A.; Park, J.D.; Hong, Y.S.; Sohn, S.J.; et al. Korean research project on the integrated exposure assessment of hazardous substances for food safety. Environ. Health Toxicol. 2015, 30, e2015004. [Google Scholar] [CrossRef] [PubMed]
- Kim, H.; Lee, J.; Woo, H.D.; Kim, D.W.; Choi, I.J.; Kim, Y.I.; Kim, J. Association between dietary cadmium intake and early gastric cancer risk in a Korean population: A case-control study. Eur. J. Nutr. 2019, 58, 3255–3266. [Google Scholar] [CrossRef] [PubMed]
- Nishito, Y.; Kambe, T. Absorption mechanisms of iron, copper, and zinc: An overview. J. Nutr. Sci. Vitaminol. (Tokyo) 2018, 64, 1–7. [Google Scholar] [CrossRef] [PubMed]
- Guo, S.; Frazer, D.M.; Anderson, G.J. Iron homeostasis: Transport, metabolism, and regulation. Curr. Opin. Clin. Nutr. Metab. Care 2016, 19, 276–281. [Google Scholar] [CrossRef] [PubMed]
- Knez, M.; Graham, R.D.; Welch, R.M.; Stangoulis, J.C. New perspectives on the regulation of iron absorption via cellular zinc concentrations in humans. Crit. Rev. Food Sci. Nutr. 2017, 57, 2128–2143. [Google Scholar] [CrossRef] [PubMed]
- Kondaiah, P.; Yaduvanshi, P.S.; Sharp, P.A.; Pullakhandam, R. Iron and zinc homeostasis and interactions: Does enteric zinc excretion cross-talk with intestinal iron absorption? Nutrients 2019, 11, 1885. [Google Scholar] [CrossRef]
- Kondaiah, P.; Palika, R.; Mashurabad, P.; Singh Yaduvanshi, P.; Sharp, P.; Pullakhandam, R. Effect of zinc depletion/repletion on intestinal iron absorption and iron status in rats. J. Nutr. Biochem. 2021, 97, 108800. [Google Scholar] [CrossRef]
- Schneider, S.N.; Liu, Z.; Wang, B.; Miller, M.L.; Afton, S.E.; Soleimani, M.; Nebert, D.W. Oral cadmium in mice carrying 5 versus 2 copies of the Slc39a8 gene: Comparison of uptake, distribution, metal content, and toxicity. Int. J. Toxicol. 2014, 33, 14–20. [Google Scholar] [CrossRef]
- Fujishiro, H.; Himeno, S. New insights into the roles of ZIP8, a cadmium and manganese transporter, and its relation to human diseases. Biol. Pharm. Bull. 2019, 42, 1076–1082. [Google Scholar] [CrossRef]
- Thévenod, F.; Fels, J.; Lee, W.K.; Zarbock, R. Channels, transporters and receptors for cadmium and cadmium complexes in eukaryotic cells: Myths and facts. Biometals 2019, 32, 469–489. [Google Scholar] [CrossRef] [PubMed]
- Kovacs, G.; Danko, T.; Bergeron, M.J.; Balazs, B.; Suzuki, Y.; Zsembery, A.; Hediger, M.A. Heavy metal cations permeate the TRPV6 epithelial cation channel. Cell Calcium 2011, 49, 43–55. [Google Scholar] [CrossRef] [PubMed]
- Kovacs, G.; Montalbetti, N.; Franz, M.C.; Graeter, S.; Simonin, A.; Hediger, M.A. Human TRPV5 and TRPV6: Key players in cadmium and zinc toxicity. Cell Calcium 2013, 54, 276–286. [Google Scholar] [CrossRef] [PubMed]
- Jorge-Nebert, L.F.; Gálvez-Peralta, M.; Landero Figueroa, J.; Somarathna, M.; Hojyo, S.; Fukada, T.; Nebert, D.W. Comparing gene expression during cadmium uptake and distribution: Untreated versus oral Cd-treated wild-type and ZIP14 knockout mice. Toxicol. Sci. 2015, 143, 26–35. [Google Scholar] [CrossRef] [PubMed]
- Fujishiro, H.; Hamao, S.; Tanaka, R.; Kambe, T.; Himeno, S. Concentration-dependent roles of DMT1 and ZIP14 in cadmium absorption in Caco-2 cells. J. Toxicol. Sci. 2017, 42, 559–567. [Google Scholar] [CrossRef] [PubMed]
- Fujita, Y.; el Belbasi, H.I.; Min, K.S.; Onosaka, S.; Okada, Y.; Matsumoto, Y.; Mutoh, N.; Tanaka, K. Fate of cadmium bound to phytochelatin in rats. Res. Commun. Chem. Pathol. Pharmacol. 1993, 82, 357–365. [Google Scholar] [PubMed]
- Langelueddecke, C.; Roussa, E.; Fenton, R.A.; Thévenod, F. Expression and function of the lipocalin-2 (24p3/NGAL) receptor in rodent and human intestinal epithelia. PLoS ONE 2013, 8, e71586. [Google Scholar] [CrossRef]
- Langelueddecke, C.; Lee, W.K.; Thévenod, F. Differential transcytosis and toxicity of the hNGAL receptor ligands cadmium-metallothionein and cadmium-phytochelatin in colon-like Caco-2 cells: Implications for in vivo cadmium toxicity. Toxicol. Lett. 2014, 226, 228–235. [Google Scholar] [CrossRef]
- DelRaso, N.J.; Foy, B.D.; Gearhart, J.M.; Frazier, J.M. Cadmium uptake kinetics in rat hepatocytes: Correction for albumin binding. Toxicol. Sci. 2003, 72, 19–30. [Google Scholar] [CrossRef]
- Satarug, S.; Baker, J.R.; Reilly, P.E.; Moore, M.R.; Williams, D.J. Cadmium levels in the lung, liver, kidney cortex, and urine samples from Australians without occupational exposure to metals. Arch. Environ. Health 2002, 57, 69–77. [Google Scholar] [CrossRef]
- Uetani, M.; Kobayashi, E.; Suwazono, Y.; Honda, R.; Nishijo, M.; Nakagawa, H.; Kido, T.; Nogawa, K. Tissue cadmium (Cd) concentrations of people living in a Cd polluted area, Japan. Biometals 2006, 19, 521–525. [Google Scholar] [CrossRef] [PubMed]
- Barregard, L.; Fabricius-Lagging, E.; Lundh, T.; Mölne, J.; Wallin, M.; Olausson, M.; Modigh, C.; Sallsten, G. Cadmium, mercury, and lead in kidney cortex of living kidney donors: Impact of different exposure sources. Environ. Res. 2010, 110, 47–54. [Google Scholar] [CrossRef] [PubMed]
- Barregard, L.; Sallsten, G.; Lundh, T.; Mölne, J. Low-level exposure to lead, cadmium and mercury, and histopathological findings in kidney biopsies. Environ. Res. 2022, 211, 113119. [Google Scholar] [CrossRef] [PubMed]
- Ajjimaporn, A.; Botsford, T.; Garrett, S.H.; Sens, M.A.; Zhou, X.D.; Dunlevy, J.R.; Sens, D.A.; Somji, S. ZIP8 expression in human proximal tubule cells, human urothelial cells transformed by Cd+2 and As+3 and in specimens of normal human urothelium and urothelial cancer. Cancer Cell Int. 2012, 12, 16. [Google Scholar] [CrossRef]
- Langelueddecke, C.; Roussa, E.; Fenton, R.A.; Wolff, N.A.; Lee, W.K.; Thévenod, F. Lipocalin-2 (24p3/neutrophil gelatinase-associated lipocalin (NGAL)) receptor is expressed in distal nephron and mediates protein endocytosis. J. Biol. Chem. 2012, 287, 159–169. [Google Scholar] [CrossRef]
- Thévenod, F.; Lee, W.K.; Garrick, M.D. Iron and cadmium entry into renal mitochondria: Physiological and toxicological implications. Front. Cell Dev. Biol. 2020, 8, 848. [Google Scholar] [CrossRef]
- Salcedo-Bellido, I.; Gómez-Peña, C.; Pérez-Carrascosa, F.M.; Vrhovnik, P.; Mustieles, V.; Echeverría, R.; Fiket, Ž.; Pérez-Díaz, C.; Barrios-Rodríguez, R.; Jiménez-Moleón, J.J.; et al. Adipose tissue cadmium concentrations as a potential risk factor for insulin resistance and future type 2 diabetes mellitus in GraMo adult cohort. Sci. Total Environ. 2021, 780, 146359. [Google Scholar] [CrossRef]
- El Muayed, M.; Raja, M.R.; Zhang, X.; MacRenaris, K.W.; Bhatt, S.; Chen, X.; Urbanek, M.; O’Halloran, T.V.; Lowe, W.L., Jr. Accumulation of cadmium in insulin-producing β cells. Islets 2012, 4, 405–416. [Google Scholar] [CrossRef]
- Varga, B.; Zsolnai, B.; Paksy, K.; Náray, M.; Ungváry, G. Age dependent accumulation of cadmium in the human ovary. Reprod. Toxicol. 1993, 7, 225–228. [Google Scholar] [CrossRef]
- Oldereid, N.B.; Thomassen, Y.; Attramadal, A.; Olaisen, B.; Purvis, K. Concentrations of lead, cadmium and zinc in the tissues of reproductive organs of men. J. Reprod. Fertil. 1993, 99, 421–425. [Google Scholar] [CrossRef]
- Lou, M.; Garay, R.; Alda, J.O. Cadmium uptake through the anion exchanger in human red blood cells. J. Physiol. 1991, 443, 123–136. [Google Scholar] [CrossRef] [PubMed]
- Wu, F.; Satchwell, T.J.; Toye, A.M. Anion exchanger 1 in red blood cells and kidney: Band 3’s in a pod. Biochem. Cell Biol. 2011, 89, 106–114. [Google Scholar] [CrossRef] [PubMed]
- Parker, M.D.; Boron, W.F. The divergence, actions, roles, and relatives of sodium-coupled bicarbonate transporters. Physiol. Rev. 2013, 93, 803–959. [Google Scholar] [CrossRef] [PubMed]
- Savigni, D.L.; Morgan, E.H. Transport mechanisms for iron and other transition metals in rat and rabbit erythroid cells. J. Physiol. 1998, 508, 837–850. [Google Scholar] [CrossRef] [PubMed]
- Simons, T.J. The role of anion transport in the passive movement of lead across the human red cell membrane. J. Physiol. 1986, 378, 287–312. [Google Scholar] [CrossRef]
- Simons, T.J. Lead transport and binding by human erythrocytes in vitro. Pflug. Arch. 1993, 423, 307–313. [Google Scholar] [CrossRef]
- Demchenkov, E.L.; Nagdalian, A.A.; Budkevich, R.O.; Oboturova, N.P.; Okolelova, A.I. Usage of atomic force microscopy for detection of the damaging effect of CdCl2 on red blood cells membrane. Ecotoxicol. Environ. Saf. 2021, 208, 111683. [Google Scholar] [CrossRef]
- Horiguchi, H.; Oguma, E.; Kayama, F. Cadmium induces anemia through interdependent progress of hemolysis, body iron accumulation, and insufficient erythropoietin production in rats. Toxicol. Sci. 2011, 122, 198–210. [Google Scholar] [CrossRef]
- Lang, F.; Abed, M.; Lang, E.; Föller, M. Oxidative stress and suicidal erythrocyte death. Antioxid. Redox Signal. 2014, 21, 138–153. [Google Scholar] [CrossRef]
- Lang, E.; Lang, F. Mechanisms and pathophysiological significance of eryptosis, the suicidal erythrocyte death. Semin. Cell Dev. Biol. 2015, 39, 35–42. [Google Scholar] [CrossRef]
- Carlson, L.A.; Friberg, L. The distribution of cadmium in blood after repeated exposure. Scand. J. Clin. Lab. Investig. 1957, 9, 67–70. [Google Scholar] [CrossRef] [PubMed]
- Nordberg, G.F.; Piscator, M.; Nordberg, M. On the distribution of cadmium in blood. Acta Pharmacol. Toxicol. 1971, 30, 289–295. [Google Scholar] [CrossRef] [PubMed]
- Gibson, M.A.; Sarpong-Kumankomah, S.; Nehzati, S.; George, G.N.; Gailer, J. Remarkable differences in the biochemical fate of Cd2+, Hg2+, CH3Hg+ and thimerosal in red blood cell lysate. Metallomics 2017, 9, 1060–1072. [Google Scholar] [CrossRef] [PubMed]
- Nordberg, M.; Nordberg, G.F. Metallothionein and cadmium toxicology-Historical review and commentary. Biomolecules 2022, 12, 360. [Google Scholar] [CrossRef] [PubMed]
- Satarug, S.; Vesey, D.A.; Gobe, G.C.; Phelps, K.R. The pathogenesis of albuminuria in cadmium nephropathy. Curr. Res. Toxicol. 2024, 6, 100140. [Google Scholar] [CrossRef] [PubMed]
- Scott, B.J.; Bradwell, A.R. Identification of the serum binding proteins for iron, zinc, cadmium, nickel, and calcium. Clin. Chem. 1983, 29, 629–633. [Google Scholar] [CrossRef]
- Horn, N.M.; Thomas, A.L. Interactions between the histidine stimulation of cadmium and zinc influx into human erythrocytes. J. Physiol. 1996, 496, 711–718. [Google Scholar] [CrossRef]
- Morris, T.T.; Keir, J.L.; Boshart, S.J.; Lobanov, V.P.; Ruhland, A.M.; Bahl, N.; Gailer, J. Mobilization of Cd from human serum albumin by small molecular weight thiols. J. Chromatogr. B Anal. Technol. Biomed. Life Sci. 2014, 958, 16–21. [Google Scholar] [CrossRef]
- Sagmeister, P.; Gibson, M.A.; McDade, K.H.; Gailer, J. Physiologically relevant plasma d,l-homocysteine concentrations mobilize Cd from human serum albumin. J. Chromatogr. B Anal. Technol. Biomed. Life Sci. 2016, 1027, 181–186. [Google Scholar] [CrossRef]
- Turell, L.; Radi, R.; Alvarez, B. The thiol pool in human plasma: The central contribution of albumin to redox processes. Free Radic. Biol. Med. 2013, 65, 244–253. [Google Scholar] [CrossRef]
- Järup, L.; Rogenfelt, A.; Elinder, C.G.; Nogawa, K.; Kjellström, T. Biological half-time of cadmium in the blood of workers after cessation of exposure. Scand. J. Work Environ. Health 1983, 9, 327–331. [Google Scholar] [CrossRef] [PubMed]
- Adams, S.V.; Newcomb, P.A. Cadmium blood and urine concentrations as measures of exposure: NHANES 1999-2010. J. Expo. Sci. Environ. Epidemiol. 2014, 24, 163–170. [Google Scholar] [CrossRef] [PubMed]
- Nielsen, R.; Christensen, E.I.; Birn, H. Megalin and cubilin in proximal tubule protein reabsorption: From experimental models to human disease. Kidney Int. 2016, 89, 58–67. [Google Scholar] [CrossRef]
- Molitoris, B.A.; Sandoval, R.M.; Yadav, S.P.S.; Wagner, M.C. Albumin uptake and processing by the proximal tubule: Physiological, pathological, and therapeutic implications. Physiol. Rev. 2022, 102, 1625–1667. [Google Scholar] [CrossRef] [PubMed]
- Eshbach, M.L.; Weisz, O.A. Receptor-mediated endocytosis in the proximal tubule. Annu. Rev. Physiol. 2017, 79, 425–448. [Google Scholar] [CrossRef] [PubMed]
- Thévenod, F.; Herbrechter, R.; Schlabs, C.; Pethe, A.; Lee, W.K.; Wolff, N.A.; Roussa, E. Role of the SLC22A17/lipocalin-2 receptor in renal endocytosis of proteins/metalloproteins: A focus on iron- and cadmium-binding proteins. Am. J. Physiol. Renal Physiol. 2023, 325, F564–F577. [Google Scholar] [CrossRef]
- Barbier, O.; Jacquillet, G.; Tauc, M.; Poujeol, P.; Cougnon, M. Acute study of interaction among cadmium, and zinc transport along the rat nephron in vivo. Am. J. Physiol. Ren. Physiol. 2004, 287, F1067–F1075. [Google Scholar] [CrossRef]
- Wang, Y.; Zalups, R.K.; Barfuss, D.W. Potential mechanisms involved in the absorptive transport of cadmium in isolated perfused rabbit renal proximal tubules. Toxicol. Lett. 2010, 193, 61–68. [Google Scholar] [CrossRef]
- Fels, J.; Scharner, B.; Zarbock, R.; Zavala-Guevara, I.P.; Lee, W.K.; Barbier, O.C.; Thévenod, F. Cadmium complexed with β2-microglubulin, albumin and lipocalin-2 rather than metallothionein cause megalin:cubilin dependent toxicity of the renal proximal tubule. Int. J. Mol. Sci. 2019, 20, 2379. [Google Scholar] [CrossRef]
- Zavala-Guevara, I.P.; Ortega-Romero, M.S.; Narváez-Morales, J.; Jacobo-Estrada, T.L.; Lee, W.K.; Arreola-Mendoza, L.; Thévenod, F.; Barbier, O.C. Increased endocytosis of cadmium-metallothionein through the 24p3 receptor in an in vivo model with reduced proximal tubular activity. Int. J. Mol. Sci. 2021, 22, 7262. [Google Scholar] [CrossRef]
- Satarug, S.; Vesey, D.A.; Ruangyuttikarn, W.; Nishijo, M.; Gobe, G.C.; Phelps, K.R. The source and pathophysiologic significance of excreted cadmium. Toxics 2019, 7, 55. [Google Scholar] [CrossRef] [PubMed]
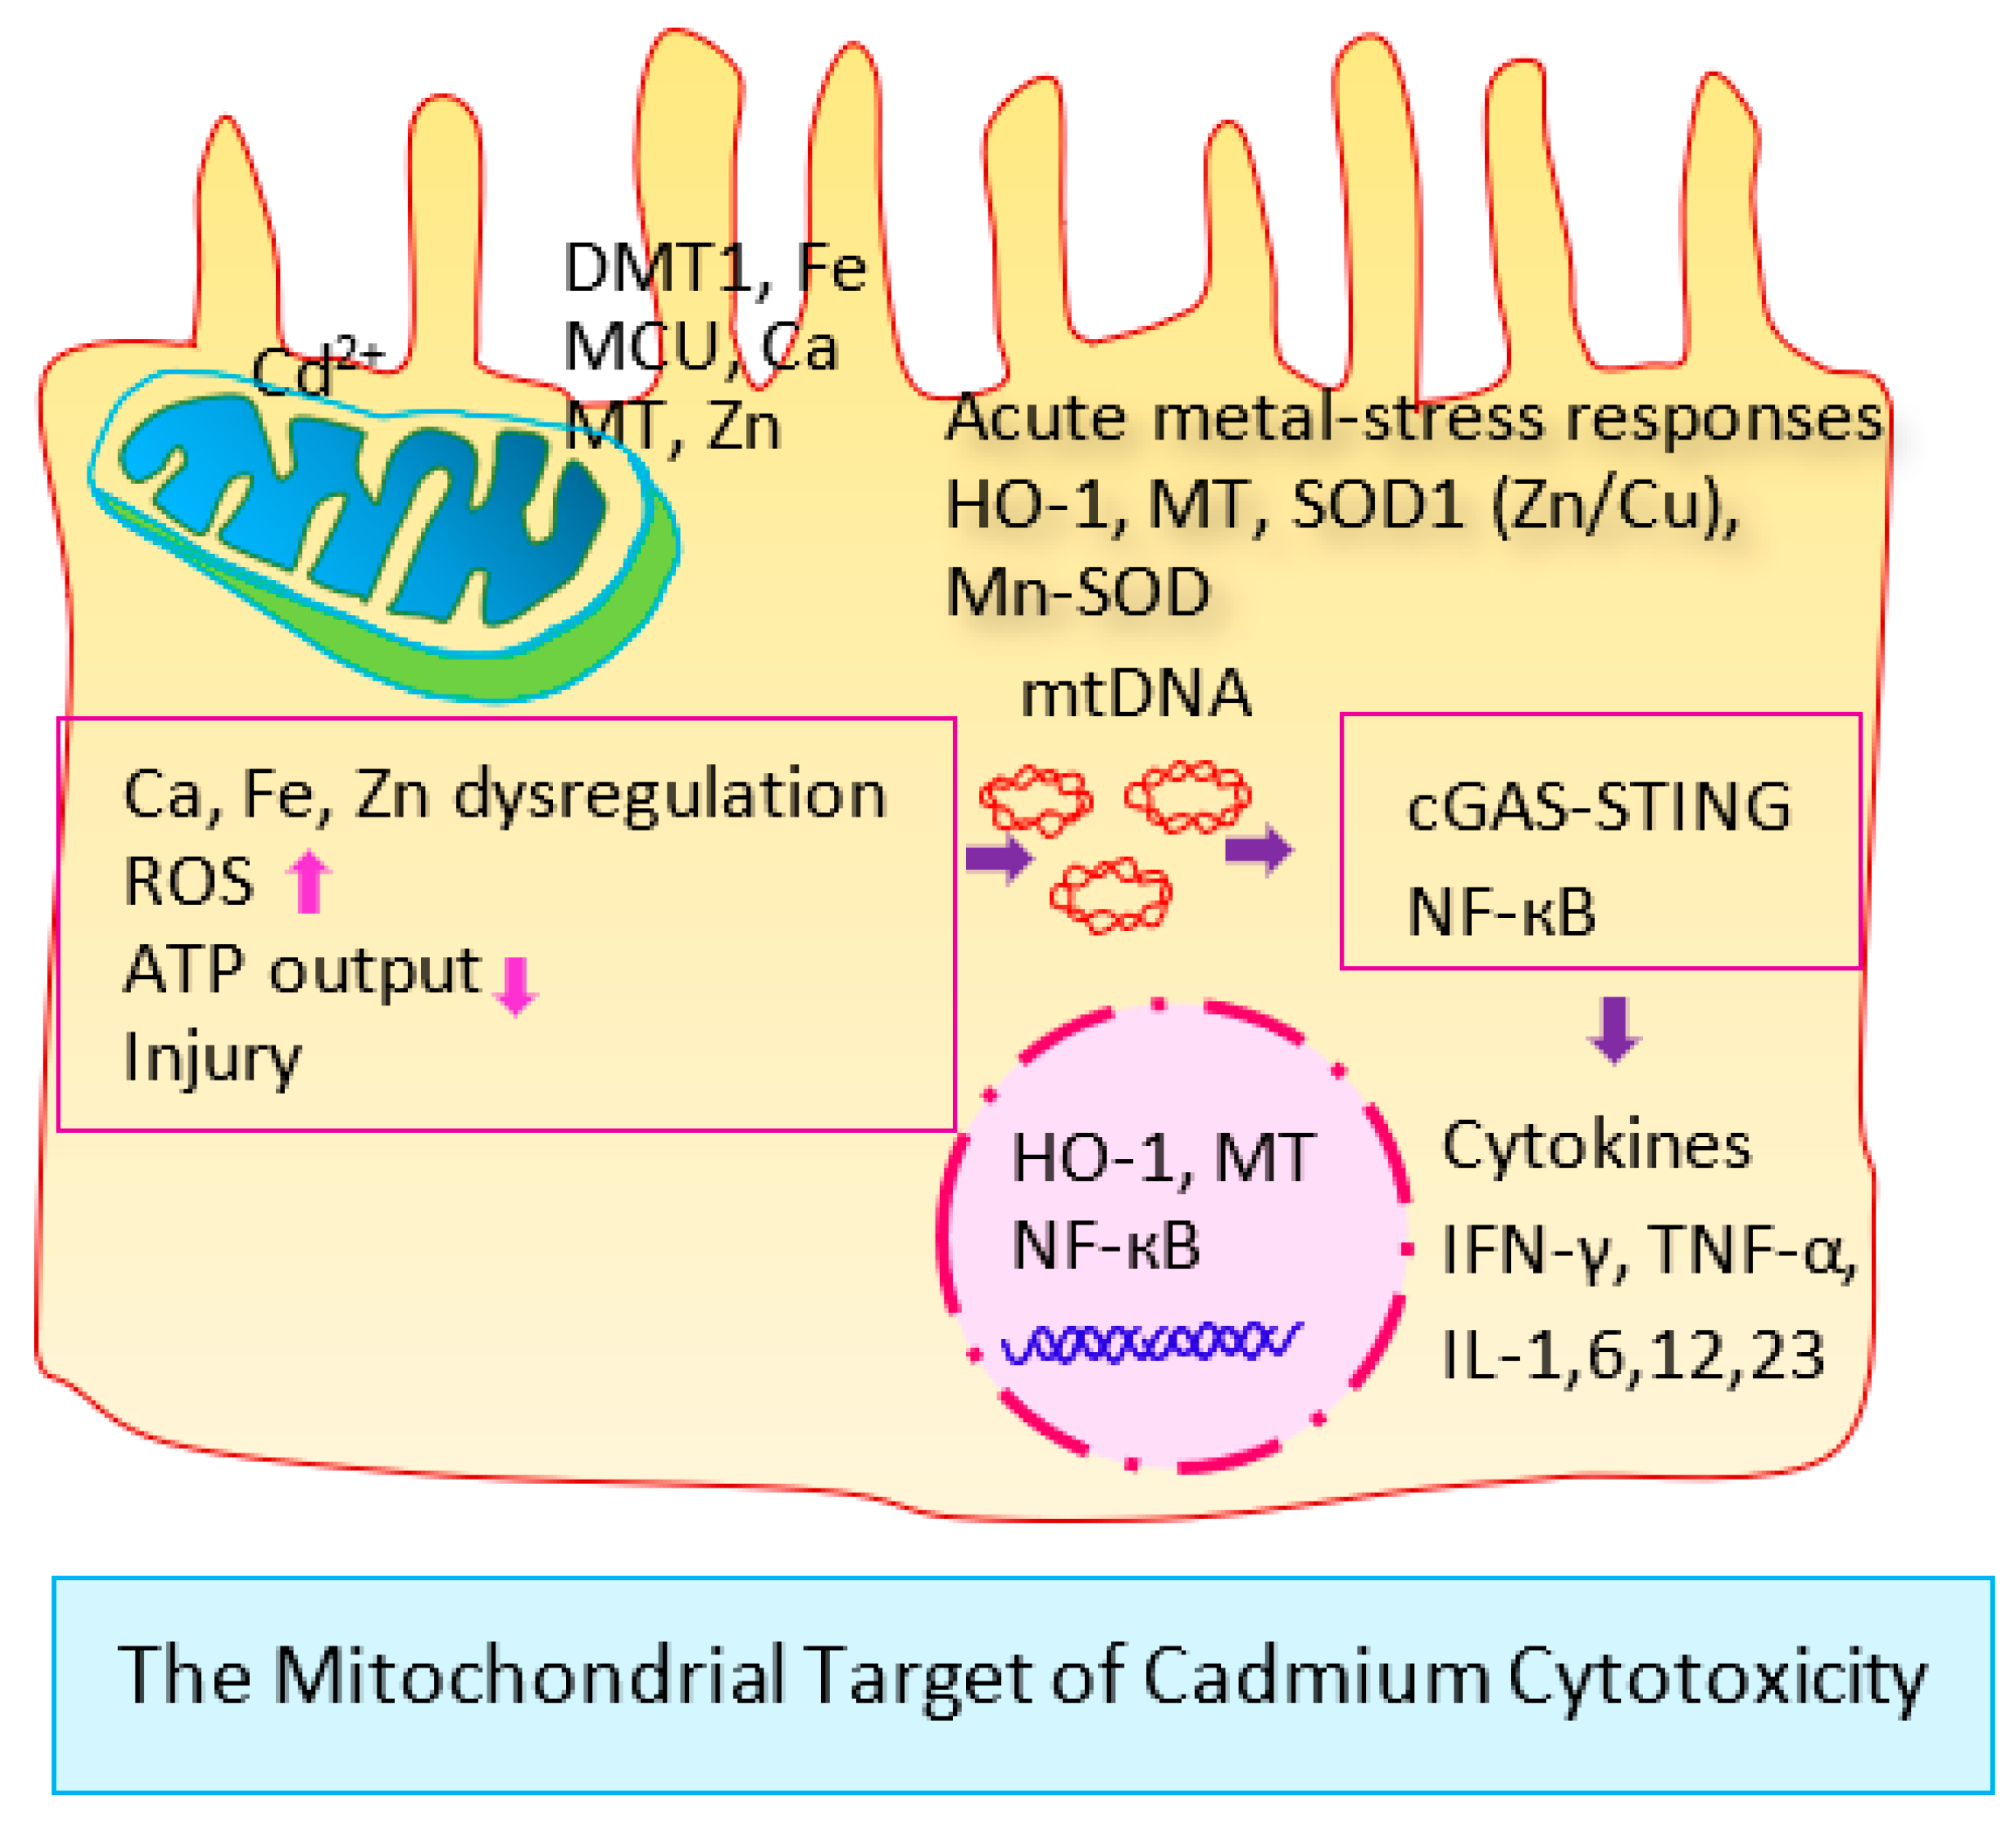
- Gobe, G.; Crane, D. Mitochondria, reactive oxygen species and cadmium toxicity in the kidney. Toxicol. Lett. 2010, 198, 49–55. [Google Scholar] [CrossRef] [PubMed]
- Branca, J.J.V.; Pacini, A.; Gulisano, M.; Taddei, N.; Fiorillo, C.; Becatti, M. Cadmium-induced cytotoxicity: Effects on mitochondrial electron transport chain. Front. Cell Dev. Biol. 2020, 8, 604377. [Google Scholar] [CrossRef] [PubMed]
- Lee, W.K.; Thévenod, F. Cell organelles as targets of mammalian cadmium toxicity. Arch. Toxicol. 2020, 94, 1017–1049. [Google Scholar] [CrossRef] [PubMed]
- Argyropoulos, C.P.; Chen, S.S.; Ng, Y.H.; Roumelioti, M.E.; Shaffi, K.; Singh, P.P.; Tzamaloukas, A.H. Rediscovering beta-2 microglobulin as a biomarker across the spectrum of kidney diseases. Front. Med. 2017, 4, 73. [Google Scholar] [CrossRef] [PubMed]
- Gauthier, C.; Nguyen-Simonnet, H.; Vincent, C.; Revillard, J.-P.; Pellet, M.V. Renal tubular absorption of beta 2 microglobulin. Kidney Int. 1984, 26, 170–175. [Google Scholar] [CrossRef]
- Portman, R.J.; Kissane, J.M.; Robson, A.M. Use of B2-microglobulin to diagnose tubulo-interstitial renal lesions in children. Kidney Int. 1986, 30, 91–98. [Google Scholar] [CrossRef]
- Peterson, P.A.; Evrin, P.-E.; Berggard, I. Differentiation of glomerular, tubular, and normal proteinuria: Determination of urinary excretion of B2-microglobulin, albumin, and total protein. J. Clin. Investig. 1969, 48, 1189–1198. [Google Scholar] [CrossRef]
- Forman, D.T. Beta-2 microglobulin—An immunogenetic marker of inflammatory and malignant origin. Ann. Clin. Lab. Sci. 1982, 12, 447–451. [Google Scholar]
- Satarug, S.; Vesey, D.A.; Nishijo, M.; Ruangyuttikarn, W.; Gobe, G.C. The inverse association of glomerular function and urinary β2-MG excretion and its implications for cadmium health risk assessment. Environ. Res. 2019, 173, 40–47. [Google Scholar] [CrossRef]
- Moffett, D.B.; Mumtaz, M.M.; Sullivan, D.W., Jr.; Whittaker, M.H. Chapter 13, General Considerations of Dose-Effect and Dose-Response Relationships. In Handbook on the Toxicology of Metals, 5th ed.; Volume I: General Considerations; Nordberg, G., Costa, M., Eds.; Academic Press: Cambridge, MA, USA, 2022; pp. 299–317. [Google Scholar]
- Roels, H.A.; Lauwerys, R.R.; Buchet, J.P.; Bernard, A.M.; Vos, A.; Oversteyns, M. Health significance of cadmium induced renal dysfunction: A five year follow up. Br. J. Ind. Med. 1989, 46, 755–764. [Google Scholar] [CrossRef] [PubMed]
- Misra, R.R.; Hochadel, J.F.; Smith, G.T.; Cook, J.C.; Waalkes, M.P.; Wink, D.A. Evidence that nitric oxide enhances cadmium toxicity by displacing the metal from metallothionein. Chem. Res. Toxicol. 1996, 9, 326–332. [Google Scholar] [CrossRef] [PubMed]
- Satarug, S.; Baker, J.R.; Reilly, P.E.; Esumi, H.; Moore, M.R. Evidence for a synergistic interaction between cadmium and endotoxin toxicity and for nitric oxide and cadmium displacement of metals in the kidney. Nitric Oxide 2000, 4, 431–440. [Google Scholar] [CrossRef] [PubMed]
- Satarug, S.; Phelps, K.R. Chapter 14, Cadmium exposure and toxicity. In Metal Toxicology; Bagchi, M., Bagchi, D., Eds.; CRC Press: Boca Raton, FL, USA, 2021. [Google Scholar]
- JECFA. Evaluation of certain Food Additives and Contaminants. In Proceedings of the Seventy-Third Meeting of the Joint FAO/WHO Expert Committee on Food Additives, Geneva, Switzerland, 8–17 June 2010; Food and Agriculture Organization of the United Nations: Rome, Italy; World Health Organization: Geneva, Switzerland, 2010; Available online: https://apps.who.int/iris/handle/10665/44521 (accessed on 9 November 2023).
- EFSA (European Food Safety Agency). Statement on tolerable weekly intake for cadmium. EFSA J. 2011, 9, 1975. [Google Scholar]
- Wong, C.; Roberts, S.M.; Saab, I.N. Review of regulatory reference values and background levels for heavy metals in the human diet. Regul. Toxicol. Pharmacol. 2022, 130, 105122. [Google Scholar] [CrossRef] [PubMed]
- Qing, Y.; Yang, J.; Zhu, Y.; Li, Y.; Zheng, W.; Wu, M.; He, G. Dose-response evaluation of urinary cadmium and kidney injury biomarkers in Chinese residents and dietary limit standards. Environ. Health 2021, 20, 75. [Google Scholar] [CrossRef] [PubMed]
- Satarug, S.; Đorđević, A.B.; Yimthiang, S.; Vesey, D.A.; Gobe, G.C. The NOAEL equivalent of environmental cadmium exposure associated with GFR reduction and chronic kidney disease. Toxics 2022, 10, 614. [Google Scholar] [CrossRef]
- Satarug, S.; Vesey, D.A.; Gobe, G.C.; Yimthiang, S.; Buha Đorđević, A. Health risk in a geographic area of Thailand with endemic cadmium contamination: Focus on albuminuria. Toxics 2023, 11, 68. [Google Scholar] [CrossRef]
- Satarug, S.; Vesey, D.A.; Khamphaya, T.; Pouyfung, P.; Gobe, G.C.; Yimthiang, S. Estimation of the cadmium nephrotoxicity threshold from loss of glomerular filtration rate and albuminuria. Toxics 2023, 11, 755. [Google Scholar] [CrossRef]
- Satarug, S.; Vesey, D.A.; Gobe, G.C.; Đorđević, A.B. The validity of benchmark dose limit analysis for estimating permissible accumulation of cadmium. Int. J. Environ. Res. Public Health 2022, 19, 15697. [Google Scholar] [CrossRef]
- Shi, P.; Yan, H.; Fan, X.; Xi, S. A benchmark dose analysis for urinary cadmium and type 2 diabetes mellitus. Environ. Pollut. 2021, 273, 116519. [Google Scholar] [CrossRef] [PubMed]
- Leconte, S.; Rousselle, C.; Bodin, L.; Clinard, F.; Carne, G. Refinement of health-based guidance values for cadmium in the French population based on modelling. Toxicol. Lett. 2021, 340, 43–51. [Google Scholar] [CrossRef] [PubMed]
- Ougier, E.; Fiore, K.; Rousselle, C.; Assunção, R.; Martins, C.; Buekers, J. Burden of osteoporosis and costs associated with human biomonitored cadmium exposure in three European countries: France, Spain and Belgium. Int. J. Hyg. Environ. Health 2021, 234, 113747. [Google Scholar] [CrossRef]
- Pouillot, R.; Santillana Farakos, S.; Van Doren, J.M. Modeling the risk of low bone mass and osteoporosis as a function of urinary cadmium in U.S adults aged 50–79 years. Environ. Res. 2022, 212 Pt B, 113315. [Google Scholar] [CrossRef]
- Calafat, A.M. The U.S. national health and nutrition examination survey and human exposure to environmental chemicals. Int. J. Hyg. Environ. Health 2012, 215, 99–101. [Google Scholar] [CrossRef] [PubMed]
- Schwartz, G.G.; Il’yasova, D.; Ivanova, A. Urinary cadmium, impaired fasting glucose, and diabetes in the NHANES III. Diabetes Care 2003, 26, 468–470. [Google Scholar] [CrossRef]
- Wallia, A.; Allen, N.B.; Badon, S.; El Muayed, M. Association between urinary cadmium levels and prediabetes in the NHANES 2005–2010 population. Int. J. Hyg. Environ. Health 2014, 217, 854–860. [Google Scholar] [CrossRef]
- Jiang, F.; Zhi, X.; Xu, M.; Li, B.; Zhang, Z. Gender-specific differences of interaction between cadmium exposure and obesity on prediabetes in the NHANES 2007-2012 population. Endocrine 2018, 61, 258–266. [Google Scholar] [CrossRef]
- Hyder, O.; Chung, M.; Cosgrove, D.; Herman, J.M.; Li, Z.; Firoozmand, A.; Gurakar, A.; Koteish, A.; Pawlik, T.M. Cadmium exposure and liver disease among US adults. J. Gastrointest. Surg. 2013, 17, 1265–1273. [Google Scholar] [CrossRef]
- Hong, D.; Min, J.Y.; Min, K.B. Association between cadmium exposure and liver function in adults in the United States: A cross-sectional study. J. Prev. Med. Public Health 2021, 54, 471–480. [Google Scholar] [CrossRef]
- Xu, Z.; Weng, Z.; Liang, J.; Liu, Q.; Zhang, X.; Xu, J.; Xu, C.; Gu, A. Association between urinary cadmium concentrations and liver function in adolescents. Environ. Sci. Pollut. Res. Int. 2022, 29, 39768–39776. [Google Scholar] [CrossRef] [PubMed]
- Ferraro, P.M.; Costanzi, S.; Naticchia, A.; Sturniolo, A.; Gambaro, G. Low level exposure to cadmium increases the risk of chronic kidney disease: Analysis of the NHANES 1999–2006. BMC Public Health 2010, 10, 30. [Google Scholar] [CrossRef] [PubMed]
- Zhu, X.J.; Wang, J.J.; Mao, J.H.; Shu, Q.; Du, L.Z. Relationships of cadmium, lead, and mercury levels with albuminuria in US adults: Results from the National Health and Nutrition Examination Survey Database, 2009–2012. Am. J. Epidemiol. 2019, 188, 1281–1287. [Google Scholar] [CrossRef] [PubMed]
- Lin, Y.S.; Ho, W.C.; Caffrey, J.L.; Sonawane, B. Low serum zinc is associated with elevated risk of cadmium nephrotoxicity. Environ. Res. 2014, 134, 33–38. [Google Scholar] [CrossRef]
- Madrigal, J.M.; Ricardo, A.C.; Persky, V.; Turyk, M. Associations between blood cadmium concentration and kidney function in the U.S. population: Impact of sex, diabetes and hypertension. Environ. Res. 2018, 169, 180–188. [Google Scholar] [CrossRef] [PubMed]
- Lee, J.; Oh, S.; Kang, H.; Kim, S.; Lee, G.; Li, L.; Kim, C.T.; An, J.N.; Oh, Y.K.; Lim, C.S.; et al. Environment-wide association study of CKD. Clin. J. Am. Soc. Nephrol. 2020, 15, 766–775. [Google Scholar] [CrossRef]
- Babazadeh, D.; Shabestari Asl, A.; Sadeghi, A.; Saeed, M.; Moshavery, A. Comparative histopathologic evaluation of the effects of Portulaca oleracea, omega-3, and combination of sodium selenite and vitamin E on hepatic enzymes of experimental diabetic rats. Small Anim. Adv. 2022, 1, 4–9. [Google Scholar] [CrossRef]
- Kim, K.; Melough, M.M.; Vance, T.M.; Noh, H.; Koo, S.I.; Chun, O.K. Dietary cadmium intake and sources in the US. Nutrients 2018, 11, 2. [Google Scholar] [CrossRef]
- Quraishi, S.M.; Adams, S.V.; Shafer, M.; Meliker, J.R.; Li, W.; Luo, J.; Neuhouser, M.L.; Newcomb, P.A. Urinary cadmium and estimated dietary cadmium in the Women’s Health Initiative. J. Expo. Sci. Environ. Epidemiol. 2016, 26, 303–308. [Google Scholar] [CrossRef]
- Kibirige, D.; Sekitoleko, I.; Lumu, W.; Jones, A.G.; Hattersley, A.T.; Smeeth, L.; Nyirenda, M.J. Understanding the pathogenesis of lean non-autoimmune diabetes in an African population with newly diagnosed diabetes. Diabetologia 2022, 65, 675–683. [Google Scholar] [CrossRef]
- Shao, W.; Liu, Q.; He, X.; Liu, H.; Gu, A.; Jiang, Z. Association between level of urinary trace heavy metals and obesity among children aged 6–19 years: NHANES 1999–2011. Environ. Sci. Pollut. Res. Int. 2017, 24, 11573–11581. [Google Scholar] [CrossRef] [PubMed]
- Dhooge, W.; Hond, E.D.; Koppen, G.; Bruckers, L.; Nelen, V.; Van De Mieroop, E.; Bilau, M.; Croes, K.; Baeyens, W.; Schoeters, G.; et al. Internal exposure to pollutants and body size in Flemish adolescents and adults: Associations and dose-response relationships. Environ. Int. 2010, 36, 330–337. [Google Scholar] [CrossRef] [PubMed]
- Padilla, M.A.; Elobeid, M.; Ruden, D.M.; Allison, D.B. An examination of the association of selected toxic metals with total and central obesity indices: NHANES 99-02. Int. J. Environ. Res. Public Health 2010, 7, 3332–3347. [Google Scholar] [CrossRef] [PubMed]
- Jain, R.B. Effect of pregnancy on the levels of blood cadmium, lead, and mercury for females aged 17–39 years old: Data from National Health and Nutrition Examination Survey 2003–2010. J. Toxicol. Environ. Health A 2013, 76, 58–69. [Google Scholar] [CrossRef] [PubMed]
- Noor, N.; Zong, G.; Seely, E.W.; Weisskopf, M.; James-Todd, T. Urinary cadmium concentrations and metabolic syndrome in U.S. adults: The National Health and Nutrition Examination Survey 2001–2014. Environ Int. 2018, 21, 349–356. [Google Scholar] [CrossRef] [PubMed]
- Lu, L.; Li, Y.; Chen, C.; Zhang, Y.; Guo, W.; Zhang, S.; Kahe, K. Associations of cadmium exposure with risk of metabolic syndrome and its individual components: A meta-analysis. J. Expo. Sci. Environ. Epidemiol. 2023, 33, 846–854. [Google Scholar] [CrossRef] [PubMed]
- Garner, R.; Levallois, P. Cadmium levels and sources of exposure among Canadian adults. Health Rep. 2016, 27, 10–18. [Google Scholar]
- Akbar, L.; Zuk, A.M.; Martin, I.D.; Liberda, E.N.; Tsuji, L.J.S. Potential obesogenic effect of a complex contaminant mixture on Cree First Nations adults of Northern Québec, Canada. Environ. Res. 2021, 192, 110478. [Google Scholar] [CrossRef]
- Son, H.S.; Kim, S.G.; Suh, B.S.; Park, D.U.; Kim, D.S.; Yu, S.D.; Hong, Y.S.; Park, J.D.; Lee, B.K.; Moon, J.D.; et al. Association of cadmium with diabetes in middle-aged residents of abandoned metal mines: The first health effect surveillance for residents in abandoned metal mines. Ann. Occup. Environ. Med. 2015, 27, 20. [Google Scholar] [CrossRef]
- Yimthiang, S.; Pouyfung, P.; Khamphaya, T.; Kuraeiad, S.; Wongrith, P.; Vesey, D.A.; Gobe, G.C.; Satarug, S. Effects of environmental exposure to cadmium and lead on the risks of diabetes and kidney dysfunction. Int. J. Environ. Res. Public Health 2022, 19, 2259. [Google Scholar] [CrossRef]
- Nie, X.; Wang, N.; Chen, Y.; Chen, C.; Han, B.; Zhu, C.; Chen, Y.; Xia, F.; Cang, Z.; Lu, M.; et al. Blood cadmium in Chinese adults and its relationships with diabetes and obesity. Environ. Sci. Pollut. Res. Int. 2016, 23, 18714–18723. [Google Scholar] [CrossRef] [PubMed]
- Feng, X.; Zhou, R.; Jiang, Q.; Wang, Y.; Chen, C. Analysis of cadmium accumulation in community adults and its correlation with low-grade albuminuria. Sci. Total Environ. 2022, 834, 155210. [Google Scholar] [CrossRef] [PubMed]
- Crinnion, W.J. The CDC fourth national report on human exposure to environmental chemicals: What it tells us about our toxic burden and how it assists environmental medicine physicians. Altern. Med. Rev. 2010, 15, 101–109. [Google Scholar]
- Mortensen, M.E.; Wong, L.Y.; Osterloh, J.D. Smoking status and urine cadmium above levels associated with subclinical renal effects in U.S. adults without chronic kidney disease. Int. J. Hyg. Environ. Health 2011, 214, 305–310. [Google Scholar] [CrossRef] [PubMed]
- Barregard, L.; Bergström, G.; Fagerberg, B. Cadmium, type 2 diabetes, and kidney damage in a cohort of middle-aged women. Environ. Res. 2014, 135, 311–316. [Google Scholar] [CrossRef]
- Yimthiang, S.; Vesey, D.A.; Pouyfung, P.; Khamphaya, T.; Gobe, G.C.; Satarug, S. Chronic kidney disease induced by cadmium and diabetes: A quantitative case-control study. Int. J. Mol. Sci. 2023, 24, 9050. [Google Scholar] [CrossRef]
- Yimthiang, S.; Pouyfung, P.; Khamphaya, T.; Vesey, D.A.; Gobe, G.C.; Satarug, S. Evidence linking cadmium exposure and β2-microglobulin to increased risk of hypertension in diabetes type 2. Toxics 2023, 11, 516. [Google Scholar] [CrossRef]
- Riaz, M.A.; Nisa, Z.U.; Mehmood, A.; Anjum, M.S.; Shahzad, K. Metal-induced nephrotoxicity to diabetic and non-diabetic Wistar rats. Environ. Sci. Pollut. Res. Int. 2019, 26, 31111–31118. [Google Scholar] [CrossRef]
- Riaz, M.A.; Nisa, Z.U.; Anjum, M.S.; Butt, H.; Mehmood, A.; Riaz, A.; Akhtar, A.B.T. Assessment of metals induced histopathological and gene expression changes in different organs of non-diabetic and diabetic rats. Sci. Rep. 2020, 10, 5897. [Google Scholar] [CrossRef]
- Hagedoorn, I.J.M.; Gant, C.M.; Huizen, S.V.; Maatman, R.G.H.J.; Navis, G.; Bakker, S.J.L.; Laverman, G.D. Lifestyle-related exposure to cadmium and lead is associated with diabetic kidney disease. J. Clin. Med. 2020, 9, 2432. [Google Scholar] [CrossRef]
- Oosterwijk, M.M.; Hagedoorn, I.J.M.; Maatman, R.G.H.J.; Bakker, S.J.L.; Navis, G.; Laverman, G.D. Cadmium, active smoking and renal function deterioration in patients with type 2 diabetes. Nephrol. Dial. Transplant. 2023, 38, 876–883. [Google Scholar] [CrossRef] [PubMed]
- Akerstrom, M.; Barregard, L.; Lundh, T.; Sallsten, G. The relationship between cadmium in kidney and cadmium in urine and blood in an environmentally exposed population. Toxicol. Appl. Pharmacol. 2013, 268, 286–293. [Google Scholar] [CrossRef] [PubMed]
- Wallin, M.; Sallsten, G.; Lundh, T.; Barregard, L. Low-level cadmium exposure and effects on kidney function. Occup. Environ. Med. 2014, 71, 848–854. [Google Scholar] [CrossRef] [PubMed]
- Roth, K.; Petriello, M.C. Exposure to per- and polyfluoroalkyl substances (PFAS) and type 2 diabetes risk. Front. Endocrinol. (Lausanne) 2022, 13, 965384. [Google Scholar] [CrossRef] [PubMed]
- Gui, S.Y.; Qiao, J.C.; Xu, K.X.; Li, Z.L.; Chen, Y.N.; Wu, K.J.; Jiang, Z.X.; Hu, C.Y. Association between per- and polyfluoroalkyl substances exposure and risk of diabetes: A systematic review and meta-analysis. J. Expo. Sci. Environ. Epidemiol. 2023, 33, 40–55. [Google Scholar] [CrossRef] [PubMed]
- Jacquet, A.; Ounnas, F.; Lénon, M.; Arnaud, J.; Demeilliers, C.; Moulis, J.M. Chronic exposure to low-level cadmium in diabetes: Role of oxidative stress and comparison with polychlorinated biphenyls. Curr. Drug Targets 2016, 17, 1385–1413. [Google Scholar] [CrossRef] [PubMed]
- Satarug, S.; Vesey, D.A.; Gobe, G.C. Mitigation of cadmium toxicity through modulation of the frontline cellular stress response. Stresses 2022, 2, 355–372. [Google Scholar] [CrossRef]
- Moulis, J.M. Cellular dynamics of transition metal exchange on proteins: A challenge but a bonanza for coordination chemistry. Biomolecules 2020, 10, 1584. [Google Scholar] [CrossRef]
- Buha, A.; Đukić-Ćosić, D.; Ćurčić, M.; Bulat, Z.; Antonijević, B.; Moulis, J.M.; Goumenou, M.; Wallace, D. Emerging links between cadmium exposure and insulin resistance: Human, animal, and cell study data. Toxics 2020, 8, 63. [Google Scholar] [CrossRef]
- Treviño, S.; Waalkes, M.P.; Flores Hernández, J.A.; León-Chavez, B.A.; Aguilar-Alonso, P.; Brambila, E. Chronic cadmium exposure in rats produces pancreatic impairment and insulin resistance in multiple peripheral tissues. Arch. Biochem. Biophys. 2015, 583, 27–35. [Google Scholar] [CrossRef]
- Sarmiento-Ortega, V.E.; Moroni-González, D.; Díaz, A.; Eduardo, B.; Samuel, T. Oral subacute exposure to cadmium LOAEL dose induces insulin resistance and impairment of the hormonal and metabolic liver-adipose axis in Wistar rats. Biol. Trace Elem. Res. 2022, 200, 4370–4384. [Google Scholar] [CrossRef] [PubMed]
- Sun, H.; Wang, N.; Chen, C.; Nie, X.; Han, B.; Li, Q.; Zhu, C.; Chen, Y.; Xia, F.; Chen, Y.; et al. Cadmium exposure and its association with serum uric acid and hyperuricemia. Sci. Rep. 2017, 7, 550. [Google Scholar] [CrossRef] [PubMed]
- Zeng, A.; Li, S.; Zhou, Y.; Sun, D. Association between low-level blood cadmium exposure and hyperuricemia in the American general population: A cross-sectional study. Biol. Trace Elem. Res. 2022, 200, 560–567. [Google Scholar] [CrossRef] [PubMed]
- Jung, W.; Kim, Y.; Lihm, H.; Kang, J. Associations between blood lead, cadmium, and mercury levels with hyperuricemia in the Korean general population: A retrospective analysis of population-based nationally representative data. Int. J. Rheum. Dis. 2019, 22, 1435–1444. [Google Scholar] [CrossRef] [PubMed]
- Park, J.; Kim, Y. Associations of blood heavy metals with uric acid in the Korean general population: Analysis of data from the 2016–2017 Korean national health and nutrition examination survey. Biol. Trace Elem. Res. 2021, 199, 102–112. [Google Scholar] [CrossRef] [PubMed]
- Lu, J.; He, Y.; Cui, L.; Xing, X.; Liu, Z.; Li, X.; Zhang, H.; Li, H.; Sun, W.; Ji, A.; et al. Hyperuricemia predisposes to the onset of diabetes via promoting pancreatic β-cell death in uricase-deficient male mice. Diabetes 2020, 69, 1149–1163. [Google Scholar] [CrossRef]
- Ghasemi, A. Uric acid-induced pancreatic β-cell dysfunction. BMC Endocr. Disord. 2021, 21, 24. [Google Scholar] [CrossRef]
- Edwards, J.R.; Prozialeck, W.C. Cadmium, diabetes and chronic kidney disease. Toxicol. Appl. Pharmacol. 2009, 238, 289–293. [Google Scholar] [CrossRef]
- Aoyagi, T.; Hayakawa, K.; Miyaji, K.; Ishikawa, H.; Hata, M. Cadmium nephrotoxicity and evacuation from the body in a rat modeled subchronic intoxication. Int. J. Urol. 2003, 10, 332–338. [Google Scholar] [CrossRef]
- Jacquet, A.; Barbeau, D.; Arnaud, J.; Hijazi, S.; Hazane-Puch, F.; Lamarche, F.; Quiclet, C.; Couturier, K.; Fontaine, E.; Moulis, J.M.; et al. Impact of maternal low-level cadmium exposure on glucose and lipid metabolism of the litter at different ages after weaning. Chemosphere 2019, 219, 109–121. [Google Scholar] [CrossRef]
- Saedi, S.; Watson, S.E.; Young, J.L.; Tan, Y.; Wintergerst, K.A.; Cai, L. Does maternal low-dose cadmium exposure increase the risk of offspring to develop metabolic syndrome and/or type 2 diabetes? Life Sci. 2023, 315, 121385. [Google Scholar] [CrossRef] [PubMed]
- Jacquet, A.; Arnaud, J.; Hininger-Favier, I.; Hazane-Puch, F.; Couturier, K.; Lénon, M.; Lamarche, F.; Ounnas, F.; Fontaine, E.; Moulis, J.M.; et al. Impact of chronic and low cadmium exposure of rats: Sex specific disruption of glucose metabolism. Chemosphere 2018, 207, 764–773. [Google Scholar] [CrossRef] [PubMed]
- Shiraishi, N.; Barter, R.A.; Uno, H.; Waalkes, M.P. Effect of progesterone pretreatment on cadmium toxicity in the male Fischer (F344/NCr) rat. Toxicol. Appl. Pharmacol. 1993, 118, 113–118. [Google Scholar] [CrossRef] [PubMed]
- Shimada, H.; Hochadel, J.F.; Waalkes, M.P. Progesterone pretreatment enhances cellular sensitivity to cadmium despite a marked activation of the metallothionein gene. Toxicol. Appl. Pharmacol. 1997, 142, 178–185. [Google Scholar] [CrossRef] [PubMed]
- Shimada, H.; Hashiguchi, T.; Yasutake, A.; Waalkes, M.P.; Imamura, Y. Sexual dimorphism of cadmium-induced toxicity in rats: Involvement of sex hormones. Arch. Toxicol. 2012, 86, 1475–1480. [Google Scholar] [CrossRef]
- Takiguchi, M.; Cherrington, N.J.; Hartley, D.P.; Klaassen, C.D.; Waalkes, M.P. Cyproterone acetate induces a cellular tolerance to cadmium in rat liver epithelial cells involving reduced cadmium accumulation. Toxicology 2001, 165, 13–25. [Google Scholar] [CrossRef]
- Ohana, E.; Sekler, I.; Kaisman, T.; Kahn, N.; Cove, J.; Silverman, W.F.; Amsterdam, A.; Hershfinkel, M. Silencing of ZnT-1 expression enhances heavy metal influx and toxicity. J. Mol. Med. 2006, 84, 753–763. [Google Scholar] [CrossRef]
- Wasner, H.K. Metformin’s mechanism of action is stimulation of the biosynthesis of the natural cyclic AMP antagonist prostaglandylinositol cyclic phosphate (cyclic PIP). Int. J. Mol. Sci. 2022, 23, 2200. [Google Scholar] [CrossRef]
- Wasner, H.K. Insulin resistance develops due to an imbalance in the synthesis of cyclic AMP and the natural cyclic AMP antagonist prostaglandylinositol cyclic phosphate (cyclic PIP). Stresses 2023, 3, 762–767. [Google Scholar] [CrossRef]
- Sarmiento-Ortega, V.E.; Brambila, E.; Flores-Hernández, J.Á.; Díaz, A.; Peña-Rosas, U.; Moroni-González, D.; Aburto-Luna, V.; Treviño, S. The NOAEL Metformin dose is ineffective against metabolic disruption induced by chronic cadmium exposure in Wistar rats. Toxics 2018, 6, 55. [Google Scholar] [CrossRef]
- Moulis, J.M.; Nahoui-Zarouri, I.; Lénon, M.; Cottet-Rousselle, C. Low-level cadmium doses do not jeopardize the insulin secretion pathway of β-cell models until the onset of cell death. J. Trace Elem. Med. Biol. 2021, 68, 126834. [Google Scholar] [CrossRef] [PubMed]
- Jacquet, A.; Cottet-Rousselle, C.; Arnaud, J.; Julien Saint Amand, K.; Ben Messaoud, R.; Lénon, M.; Demeilliers, C.; Moulis, J.M. Mitochondrial morphology and function of the pancreatic β-cells INS-1 model upon chronic exposure to sub-lethal cadmium doses. Toxics 2018, 6, 20. [Google Scholar] [CrossRef] [PubMed]
- Rocca, A.; Fanchon, E.; Moulis, J.-M. Theoretical modeling of oral glucose tolerance tests guides the interpretation of the impact of perinatal cadmium exposure on the offspring’s glucose homeostasis. Toxics 2020, 8, 30. [Google Scholar] [CrossRef]
- Fitzgerald, R.; Olsen, A.; Nguyen, J.; Wong, W.; El Muayed, M.; Edwards, J. Pancreatic islets accumulate cadmium in a rodent model of cadmium-induced hyperglycemia. Int. J. Mol. Sci. 2020, 22, 360. [Google Scholar] [CrossRef] [PubMed]
- Gasser, M.; Lenglet, S.; Bararpour, N.; Sajic, T.; Wiskott, K.; Augsburger, M.; Fracasso, T.; Gilardi, F.; Thomas, A. Cadmium acute exposure induces metabolic and transcriptomic perturbations in human mature adipocytes. Toxicology 2022, 470, 153153. [Google Scholar] [CrossRef]
- Echeverría, R.; Vrhovnik, P.; Salcedo-Bellido, I.; Iribarne-Durán, L.M.; Fiket, Ž.; Dolenec, M.; Martin-Olmedo, P.; Olea, N.; Arrebola, J.P. Levels and determinants of adipose tissue cadmium concentrations in an adult cohort from Southern Spain. Sci. Total Environ. 2019, 670, 1028–1036. [Google Scholar] [CrossRef]
- Kawakami, T.; Sugimoto, H.; Furuichi, R.; Kadota, Y.; Inoue, M.; Setsu, K.; Suzuki, S.; Sato, M. Cadmium reduces adipocyte size and expression levels of adiponectin and Peg1/Mest in adipose tissue. Toxicology 2010, 267, 20–26. [Google Scholar] [CrossRef]
- Kawakami, T.; Nishiyama, K.; Kadota, Y.; Sato, M.; Inoue, M.; Suzuki, S. Cadmium modulates adipocyte functions in metallothionein-null mice. Toxicol. Appl. Pharmacol. 2013, 272, 625–636. [Google Scholar] [CrossRef]
- Attia, S.M.; Das, S.C.; Varadharajan, K.; Al-Naemi, H.A. White adipose tissue as a target for cadmium toxicity. Front. Pharmacol. 2022, 13, 1010817. [Google Scholar] [CrossRef]
- Shibahara, S.; Yoshizawa, M.; Suzuki, H.; Takeda, K.; Meguro, K.; Endo, K. Functional analysis of cDNAs for two types of human heme oxygenase and evidence for their separate regulation. J. Biochem. (Tokyo) 1993, 113, 214–218. [Google Scholar] [CrossRef]
- Shibahara, S. The heme oxygenase dilemma in cellular homeostasis: New insights for the feedback regulation of heme catabolism. Tohoku J. Exp. Med. 2003, 200, 167–186. [Google Scholar] [CrossRef] [PubMed]
- Shibahara, S.; Han, F.; Li, B.; Takeda, K. Hypoxia and heme oxygenases: Oxygen sensing and regulation of expression. Antiox. Redox Signal. 2007, 9, 2209–2225. [Google Scholar] [CrossRef] [PubMed]
- Muñoz-Sánchez, J.; Chánez-Cárdenas, M.E. A review on heme oxygenase-2: Focus on cellular protection and oxygen response. Oxid. Med. Cell Longev. 2014, 2014, 604981. [Google Scholar] [CrossRef] [PubMed]
- Schultz, I.J.; Chen, C.; Paw, B.H.; Hamza, I. Iron, porphyrin trafficking in heme biogenesis. J. Biol. Chem. 2010, 285, 26753–26759. [Google Scholar] [CrossRef] [PubMed]
- Nath, K.A.; Singh, R.D.; Croatt, A.J.; Adams, C.M. Heme proteins and kidney injury: Beyond rhabdomyolysis. Kidney360 2022, 3, 1969–1979. [Google Scholar] [CrossRef] [PubMed]
- Jansen, T.; Hortmann, M.; Oelze, M.; Opitz, B.; Steven, S.; Schell, R.; Knorr, M.; Karbach, S.; Schuhmacher, S.; Wenzel, P.; et al. Conversion of biliverdin to bilirubin by biliverdin reductase contributes to endothelial cell protection by heme oxygenase-1-evidence for direct and indirect antioxidant actions of bilirubin. J. Mol. Cell Cardiol. 2010, 49, 186–195. [Google Scholar] [CrossRef] [PubMed]
- Durante, W. Targeting heme oxygenase-1 in the arterial response to injury and disease. Antioxidants 2020, 9, 829. [Google Scholar] [CrossRef]
- Vitek, L.; Hinds, T.D., Jr.; Stec, D.E.; Tiribelli, C. The physiology of bilirubin: Health and disease equilibrium. Trends Mol. Med. 2023, 29, 315–328. [Google Scholar] [CrossRef]
- Zhang, F.; Guan, W.; Fu, Z.; Zhou, L.; Guo, W.; Ma, Y.; Gong, Y.; Jiang, W.; Liang, H.; Zhou, H. Relationship between serum indirect bilirubin level and insulin sensitivity: Results from two independent cohorts of obese patients with impaired glucose regulation and type 2 diabetes mellitus in China. Int. J. Endocrinol. 2020, 2020, 5681296. [Google Scholar] [CrossRef]
- Lin, J.P.; Vitek, L.; Schwertner, H.A. Serum bilirubin and genes controlling bilirubin concentrations as biomarkers for cardiovascular disease. Clin. Chem. 2010, 56, 1535–1543. [Google Scholar] [CrossRef]
- Paredi, P.; Biernacki, W.; Invernizzi, G.; Kharitonov, S.A.; Barnes, P.J. Exhaled carbon monoxide levels elevated in diabetes and correlated with glucose concentration in blood: A new test for monitoring the disease? Chest 1999, 116, 1007–1011. [Google Scholar] [CrossRef] [PubMed]
- Goto, Y.; Kakizaki, M.; Masaki, N. Production of spontaneous diabetic rats by repetition of selective breeding. Tohoku J. Exp. Med. 1976, 119, 85–90. [Google Scholar] [CrossRef] [PubMed]
- Ndisang, J.F.; Lane, N.; Jadhav, A. Upregulation of the heme oxygenase system ameliorates postprandial and fasting hyperglycemia in type 2 diabetes. Am. J. Physiol. Endocrinol. Metab. 2009, 296, E1029–E1041. [Google Scholar] [CrossRef] [PubMed]
- Li, M.; Kim, D.H.; Tsenovoy, P.L.; Peterson, S.J.; Rezzani, R.; Rodella, L.F.; Aronow, W.S.; Ikehara, S.; Abraham, N.G. Treatment of obese diabetic mice with a heme oxygenase inducer reduces visceral and subcutaneous adiposity, increases adiponectin levels, and improves insulin sensitivity and glucose tolerance. Diabetes 2008, 57, 1526–1535. [Google Scholar] [CrossRef] [PubMed]
- Hanna, D.A.; Moore, C.M.; Liu, L.; Yuan, X.; Dominic, I.M.; Fleischhacker, A.S.; Hamza, I.; Ragsdale, S.W.; Reddi, A.R. Heme oxygenase-2 (HO-2) binds and buffers labile ferric heme in human embryonic kidney cells. J. Biol. Chem. 2022, 298, 101549. [Google Scholar] [CrossRef] [PubMed]
- Fleischhacker, A.S.; Carter, E.L.; Ragsdale, S.W. Redox regulation of heme oxygenase-2 and the transcription factor, Rev-Erb, through heme regulatory motifs. Antioxid. Redox Signal. 2018, 29, 1841–1857. [Google Scholar] [CrossRef] [PubMed]
- Fleischhacker, A.S.; Gunawan, A.L.; Kochert, B.A.; Liu, L.; Wales, T.E.; Borowy, M.C.; Engen, J.R.; Ragsdale, S.W. The heme-regulatory motifs of heme oxygenase-2 contribute to the transfer of heme to the catalytic site for degradation. J. Biol. Chem. 2020, 295, 5177–5191. [Google Scholar] [CrossRef]
- Nath, K.A.; Garovic, V.D.; Grande, J.P.; Croatt, A.J.; Ackerman, A.W.; Farrugia, G.; Katusic, Z.S.; Belcher, J.D.; Vercellotti, G.M. Heme oxygenase-2 protects against ischemic acute kidney injury: Influence of age and sex. Am. J. Physiol. Renal Physiol. 2019, 317, F695–F704. [Google Scholar] [CrossRef]
- Bao, W.; Song, F.; Li, X.; Rong, S.; Yang, W.; Wang, D.; Xu, J.; Fu, J.; Zhao, Y.; Liu, L. Association between heme oxy-genase-1 gene promoter polymorphisms and type 2 diabetes mellitus: A HuGE review and meta-analysis. Am. J. Epidemiol. 2010, 172, 631–636. [Google Scholar] [CrossRef]
- Ma, L.L.; Sun, L.; Wang, Y.X.; Sun, B.H.; Li, Y.F.; Jin, Y.L. Association between HO-1 gene promoter polymorphisms and diseases (Review). Mol. Med. Rep. 2022, 25, 29. [Google Scholar] [CrossRef]
- Zhang, Y.; Fang, B.; Emmett, M.J.; Damle, M.; Sun, Z.; Feng, D.; Armour, S.M.; Remsberg, J.R.; Jager, J.; Soccio, R.E.; et al. Gene regulation. Discrete functions of nuclear receptor Rev-erbα couple metabolism to the clock. Science 2015, 348, 1488–1492. [Google Scholar] [CrossRef] [PubMed]
- Everett, L.J.; Lazar, M.A. Nuclear receptor Rev-erbα: Up, down, and all around. Trends Endocrinol. Metab. 2014, 25, 586–592. [Google Scholar] [CrossRef] [PubMed]
- Bass, J.; Takahashi, J.S. Circadian integration of metabolism and energetics. Science 2010, 330, 1349–1354. [Google Scholar] [CrossRef] [PubMed]
- Medina, M.V.; Sapochnik, D.; Garcia Solá, M.; Coso, O. Regulation of the expression of heme oxygenase-1: Signal transduction, gene promoter activation, and beyond. Antioxid. Redox Signal. 2020, 32, 1033–1044. [Google Scholar] [CrossRef] [PubMed]
- Sahar, S.; Sassone-Corsi, P. Metabolism and cancer: The circadian clock connection. Nat. Rev. Cancer 2009, 9, 886–896. [Google Scholar] [CrossRef] [PubMed]
- Wu, N.; Yin, L.; Hanniman, E.A.; Joshi, S.; Lazar, M.A. Negative feedback maintenance of heme homeostasis by its re-ceptor, Rev-erb alpha. Genes Dev. 2009, 23, 2201–2209. [Google Scholar] [CrossRef] [PubMed]
- Igarashi, K.; Watanabe-Matsui, M. Wearing red for signaling: The Heme-Bach axis in heme metabolism, oxidative stress response and iron immunology. Tohoku J. Exp. Med. 2014, 232, 229–253. [Google Scholar] [CrossRef]
- Goodman, A.I.; Chander, P.N.; Rezzani, R.; Schwartzman, M.L.; Regan, R.F.; Rodella, L.; Turkseven, S.; Lianos, E.A.; Dennery, P.A.; Abraham, N.G. Heme oxygenase-2 deficiency contributes to diabetes-mediated increase in superoxide anion and renal dysfunction. J. Am. Soc. Nephrol. 2006, 17, 1073–1081. [Google Scholar] [CrossRef]
- Sodhi, K.; Inoue, K.; Gotlinger, K.H.; Canestraro, M.; Vanella, L.; Kim, D.H.; Manthati, V.L.; Koduru, S.R.; Falck, J.R.; Schwartzman, M.L.; et al. Epoxyeicosatrienoic acid agonist rescues the metabolic syndrome phenotype of HO-2-null mice. J. Pharmacol. Exp. Ther. 2009, 331, 906–916. [Google Scholar] [CrossRef]
- Li, B.; Takeda, K.; Ishikawa, K.; Yoshizawa, M.; Sato, M.; Shibahara, S.; Furuyama, K. Coordinated expression of 6-phosphofructo-2-kinase/fructose-2, 6-bisphosphatase 4 and heme oxygenase 2: Evidence for a regulatory link between glycolysis and heme catabolism. Tohoku J. Exp. Med. 2012, 228, 27–41. [Google Scholar] [CrossRef]
- Takeda, T.A.; Mu, A.; Tai, T.T.; Kitajima, S.; Taketani, S. Continuous de novo biosynthesis of haem and its rapid turnover to bilirubin are necessary for cytoprotection against cell damage. Sci. Rep. 2015, 5, 10488. [Google Scholar] [CrossRef] [PubMed]
- Kumagai, A.; Ando, R.; Miyatake, H.; Greimel, P.; Kobayashi, T.; Hirabayashi, Y.; Shimogori, T.; Miyawaki, A. A bilirubin-inducible fluorescent protein from eel muscle. Cell 2013, 153, 1602–1611. [Google Scholar] [CrossRef] [PubMed]
- Satarug, S.; Wisedpanichkij, R.; Takeda, K.; Li, B.; Na-Bangchang, K.; Moore, M.R.; Shibahara, S. Prostaglandin D2 induces heme oxygenase-1 mRNA expression through the DP2 receptor. Biochem. Biophys. Res. Commun. 2008, 377, 878–883. [Google Scholar] [CrossRef] [PubMed]
- Boonprasert, K.; Satarug, S.; Morais, C.; Gobe, G.C.; Johnson, D.W.; Na-Bangchang, K.; Vesey, D.A. The stress response of human proximal tubule cells to cadmium involves up-regulation of haemoxygenase 1 and metallothionein but not cyto-chrome P450 enzymes. Toxicol. Lett. 2016, 249, 5–14. [Google Scholar] [CrossRef] [PubMed]
- Spik, I.; Brénuchon, C.; Angéli, V.; Staumont, D.; Fleury, S.; Capron, M.; Trottein, F.; Dombrowicz, D. Activation of the prostaglandin D2 receptor DP2/CRTH2 increases allergic inflammation in mouse. J. Immunol. 2005, 174, 3703–3708. [Google Scholar] [CrossRef] [PubMed]
- Takeda, K.; Ishizawa, S.; Sato, M.; Yoshida, T.; Shibahara, S. Identification of a cis-acting element that is responsible for cadmium-mediated induction of the human heme oxygenase gene. J. Biol. Chem. 1994, 269, 22858–22867. [Google Scholar] [CrossRef] [PubMed]
- Stewart, D.; Killeen, E.; Naquin, R.; Alam, S.; Alam, J. Degradation of transcription factor Nrf2 via the ubiquitin-proteasome pathway and stabilization by cadmium. J. Biol. Chem. 2003, 278, 2396–2402. [Google Scholar] [CrossRef] [PubMed]
- Suzuki, H.; Tashiro, S.; Sun, J.; Doi, H.; Satomi, S.; Igarashi, K. Cadmium induces nuclear export of Bach1, a transcriptional repressor of heme oxygenase-1 gene. J. Biol. Chem. 2003, 278, 49246–49253. [Google Scholar] [CrossRef]
- Okar, D.A.; Manzano, A.; Navarro-Sabatè, A.; Riera, L.; Bartrons, R.; Lange, A.J. PFK-2/FBPase-2: Maker and breaker of the essential biofactor fructose-2, 6-bisphosphate. Trends Biochem. Sci. 2001, 26, 30–35. [Google Scholar] [CrossRef]
- Rider, M.H.; Bertrand, L.; Vertommen, D.; Michels, P.A.; Rousseau, G.G.; Hue, L. 6-Phosphofructo-2-kinase/fructose-2,6-bisphosphatase: Head-to-head with a bifunctional enzyme that controls glycolysis. Biochem. J. 2004, 381, 561–579. [Google Scholar] [CrossRef]
- Lannoy, V.J.; Decaux, J.F.; Pierreux, C.E.; Lemaigre, F.P.; Rousseau, G.G. Liver glucokinase gene expression is controlled by the onecut transcription factor hepatocyte nuclear factor-6. Diabetologia 2002, 45, 1136–1141. [Google Scholar] [PubMed]
- Han, F.; Takeda, K.; Ishikawa, K.; Ono, M.; Date, F.; Yokoyama, S.; Furuyama, K.; Shinozawa, Y.; Urade, Y.; Shibahara, S. Induction of lipocalin-type prostaglandin D synthase in mouse heart under hypoxemia. Biochem. Biophys. Res. Commun. 2009, 385, 449–453. [Google Scholar] [CrossRef] [PubMed]
| Tissues/Organs | Cd Content in µg/g Wet Tissue Weight | Country of Origin/Reference | |
|---|---|---|---|
| Males | Females | ||
| Lung | 0.11 ± 0.19 | 0.17 ± 0.35 | Australia, Satarug et al. [51] a |
| Liver | 0.78 ± 0.71 | 1.36 ± 0.96 | |
| Kidney cortex | 14.6 ± 12.4 | 18.1 ± 18.0 | |
| Liver | 7.9 (1.3−33.3) | 13.1 (3.1−106.4) | Japan, Uetani et al. [52] b |
| Kidney cortex | 72.1 (19.4−200) | 83.9 (3.9−252.9) | |
| Kidney medulla | 18.3 (3.5−76.4) | 24.5 (4−105) | |
| Pancreas | 7.4 (3.0−25.9) | 10.5 (2.5−29.8) | |
| Thyroid | 10.6 (3.8−35) | 11.9 (3.9−56.4) | |
| Heart | 0.3 (0.1−0.5) | 0.4 (0.1−1.3) | |
| Muscle | 1.2 (0.3−3.2) | 2.2 (0.8−12.4) | |
| Aorta | 1.0 (0.4−2.5) | 1.1 (0.3−3) | |
| Bone | 0.4 (0.2−0.6) | 0.6 (0.2−1.6) | |
Disclaimer/Publisher’s Note: The statements, opinions and data contained in all publications are solely those of the individual author(s) and contributor(s) and not of MDPI and/or the editor(s). MDPI and/or the editor(s) disclaim responsibility for any injury to people or property resulting from any ideas, methods, instructions or products referred to in the content. |
© 2023 by the author. Licensee MDPI, Basel, Switzerland. This article is an open access article distributed under the terms and conditions of the Creative Commons Attribution (CC BY) license (https://creativecommons.org/licenses/by/4.0/).
Share and Cite
Satarug, S. Is Environmental Cadmium Exposure Causally Related to Diabetes and Obesity? Cells 2024, 13, 83. https://doi.org/10.3390/cells13010083
Satarug S. Is Environmental Cadmium Exposure Causally Related to Diabetes and Obesity? Cells. 2024; 13(1):83. https://doi.org/10.3390/cells13010083
Chicago/Turabian StyleSatarug, Soisungwan. 2024. "Is Environmental Cadmium Exposure Causally Related to Diabetes and Obesity?" Cells 13, no. 1: 83. https://doi.org/10.3390/cells13010083
APA StyleSatarug, S. (2024). Is Environmental Cadmium Exposure Causally Related to Diabetes and Obesity? Cells, 13(1), 83. https://doi.org/10.3390/cells13010083