Abstract
The differential effects of cellular and ultrastructural characteristics on the optical properties of adaxial and abaxial leaf surfaces in the genus Tradescantia highlight the intricate relationships between cellular arrangement and pigment distribution in the plant cells. We examined hyperspectral and chlorophyll a fluorescence (ChlF) kinetics using spectroradiometers and optical and electron microscopy techniques. The leaves were analysed for their spectral properties and cellular makeup. The biochemical compounds were measured and correlated with the biophysical and ultrastructural features. The main findings showed that the top and bottom leaf surfaces had different amounts and patterns of pigments, especially anthocyanins, flavonoids, total phenolics, chlorophyll-carotenoids, and cell and organelle structures, as revealed by the hyperspectral vegetation index (HVI). These differences were further elucidated by the correlation coefficients, which influence the optical signatures of the leaves. Additionally, ChlF kinetics varied between leaf surfaces, correlating with VIS-NIR-SWIR bands through distinct cellular structures and pigment concentrations in the hypodermis cells. We confirmed that the unique optical properties of each leaf surface arise not only from pigmentation but also from complex cellular arrangements and structural adaptations. Some of the factors that affect how leaves reflect light are the arrangement of chloroplasts, thylakoid membranes, vacuoles, and the relative size of the cells themselves. These findings improve our knowledge of the biophysical and biochemical reasons for leaf optical diversity, and indicate possible implications for photosynthetic efficiency and stress adaptation under different environmental conditions in the mesophyll cells of Tradescantia plants.
1. Introduction
Leaves, the primary photosynthetic organs of higher plants, exhibit complex interactions between their structural composition and optical properties which are essential for photosynthesis [1,2,3]. Notably, pigments, such as anthocyanins and phenolic compounds, play critical roles in determining foliar optical properties, modifying light absorption, enhancing reflectance, and adjusting transmittance of energy in leaves [4,5,6]. These pigments not only contribute to the unique optical signatures analysed via spectral data, but also enhance photoprotection and light management, which are crucial for photosynthesis [2,7]. In Tradescantia species, pronounced pigmentation, particularly that of anthocyanins, aids in light attenuation and stress mitigation under intense light conditions [8,9].
Tradescantia spathacea, commonly known as Boat Lily, is an evergreen herbaceous perennial belonging to the Commelinaceae family, indigenous to southern Mexico and Guatemala. This plant is characterised by its clumping growth habit and broad, linear leaves that display a remarkable chromatic shift from green on the upper (adaxial) surface to purple on the lower (abaxial) surface. In contrast, Tradescantia pallida, commonly referred to as a purple heart, is notable for its deep, uniform purple pigmentation that saturates the entirety of its foliage, although it typically shows a gradient from a darker tone on the adaxial side to a slightly lighter purple on the abaxial side [8,9,10,11].
Plant leaves have contrasting functions related to how they are organised at the cellular level, affecting their interactions with light and fluorescence properties. This is especially noticeable in species such as Ophiopogon planiscapus, Euphorbia pulcherrima, Codiaeum variegatum, Passiflora edulis, Tradescantia spathacea, Tradescantia pallida and others, where the location and chemical nature of cellular pigments, along with the structural configuration of leaf tissues, are the principal factors. The epidermis is the outermost protective layer, which protects plants from environmental stressors, controls light entry, optimises photosynthetic efficiency, and prevents photodamage to underlying tissues [12,13]. Under the epidermis, the hypodermis provides additional structural support and helps scatter light, thus improving the optical properties of the leaf, which influence light absorption and reflection. The chlorenchyma, composed of chlorophyll-bearing cells, is vital for photosynthesis [12]. Its structural arrangement strongly affects how well light is captured and converted into chemical energy, and influences chlorophyll a fluorescence (ChlF) dynamics [11,14]. Moreover, chloroplasts within the chlorenchyma cells, which have light-harvesting complexes and a photosynthetic electron transport chain, are essential for photosynthesis in deeper layers [2,15,16]. The location and density of these chloroplasts are key factors in the light absorption efficiency and functional performance of photosystem II, as shown by ChlF kinetics [17,18]. Studying these cellular structures helps understand the complex relationship between cellular architecture and plant physiological responses, enhancing our knowledge of how plants manage light and perform photosynthesis under different shade or sunlight environmental conditions [2,19,20].
The morphology, structure, and ultrastructure of leaf cells, including the number and arrangement of chloroplasts, significantly impact their ability to capture and use light, as indicated by the VIS-NIR-SWIR spectral curves [21,22,23,24]. These spectral techniques are essential for investigating how visible (VIS), near-infrared (NIR), and shortwave infrared (SWIR) light interacts with cellular structures, revealing intricate details about plant physiological responses to electromagnetic radiation [22,23,25]. Variations in chloroplast structures, such as the number of granum stacks and thylakoid arrangements, are important for maximising the light absorption and efficiency of the electron transport chain. Advanced microscopic techniques, such as electron microscopy, are key to visualising these subtle structural changes and provide a deeper understanding of how these structures function at the microscopic level [26,27]. These microscopic structures are overly sensitive to biophysical and biochemical stimuli, which reflects the plasticity of plants in adjusting to environmental changes through genetic variation and phenotypic flexibility. For example, VIS-NIR-SWIR spectroscopy and detailed microscopic analysis revealed complex interactions between plant structural adaptations and their environmental interactions, improving our knowledge of adaptability efficiency in plants [2,24,25,26].
Overall, the integration of correlation by hyperspectral, chlorophyll a fluorescence and microscopic techniques demonstrated that pigment distribution and leaf architecture synergistically affected the light management strategies of Tradescantia species [8,10,11]. By examining spectral indices and cellular details, different mechanisms by which structural modifications at the cellular level enhance light-energy management in plants can be identified, for example, deconvolution or hyperspectral vegetation index [24,28]. Specifically, chlorophyll fluorescence kinetics provide insights into the dynamic changes in the light-absorbing and energy-dissipating functions of chlorophyll a under variable light conditions.
In this study, VIS-NIR-SWIR hyperspectral and chlorophyll a fluorescence techniques were employed to acquire precise spectral profiles that correlate cellular and ultrastructural data with the physiological status of plants. This method facilitates an in-depth analysis of the influence of cellular composition and arrangement on the optical properties of leaves, and improves understanding of the modulation of light across both standard and nonstandard leaves, as well as analysing the spectral and fluorescence curves on both adaxial and abaxial surfaces [9,11,14,29]. By integrating detailed microscopic analyses of cellular structures with advanced spectral techniques, we aim to enhance our understanding of the complex interplay between plant cell morphology and function [11,28,30].
Based on the observed differences in photosynthetic function and structure between leaf tissues, we hypothesised that variations in chlorophyll fluorescence (ChlF) and optical properties between the adaxial and abaxial sides of bifacial leaves are primarily due to structural differences. We anticipate that these structural variations will also influence the shape of the hyperspectral vegetation index (HVI) data used to align the optical properties of leaves [2,31]. To evaluate this hypothesis, we analysed the structure, spectroscopy, and ChlF curves of the adaxial and abaxial sides of leaves in vivo. Our goal was to elucidate the differences in the HVI curves and assess the potential effects of leaf structure and ultrastructure on Tradescantia species, using both optical and electron microscopy (Figure 1).

Figure 1.
Flowchart illustrating the analysis of leaf optical properties, changes in pigment composition, leaf structure, and ultrastructure, along with chlorophyll a fluorescence and statistical analyses in Tradescantia spathacea (L.) Olof Swartz and Tradescantia pallida (Rose) D.R. Hunt., with variegated leaves. Plants were cultivated in a greenhouse, and their leaves were assessed using a novel method with two hyperspectral sensors to acquire reflectance, transmittance, and absorbance spectra. Leaves were analysed to evaluate changes in their optical properties [2,19]. The biochemical components of the leaves were measured in polar and apolar phases [7]. In addition, modifications in leaf structure and ultrastructure were examined using light microscopy as well as scanning and transmission electron microscopy techniques. Leaves were adapted to both light and dark conditions, and chlorophyll a fluorescence factors were measured using the JIP test dataset, focusing on observing changes in the electron transport chain. Finally, the data were subjected to univariate and multivariate analyses. The flow of analysis was considered starting from the growth of the plants and transitioning from non-destructive analyses to destructive analyses. Created with BioRender.com.
2. Materials and Methods
2.1. Plant Materials and Experimental Design
Tradescantia spathacea (L.) Olof Swartz and Tradescantia pallida (Rose) D.R. Hunt, a horticultural plant with green and purple leaves, was grown in 2-L pots with MecPlant® commercial substrate (MecPrec Ind., Telêmaco Borba, Paraná, Brazil) and NPK fertiliser (10-10-10; 1 g per pot). The plants were kept in a greenhouse under natural light conditions at a temperature of 21–26 °C and a humidity level of 50–70% [26]. A 14-h light cycle was maintained, with the light intensity changing throughout the day. The plants were watered twice daily at 8 a.m. and 6 p.m. to standardise the water conditions. Young, fully opened leaves were chosen for various analyses, with 200 leaf samples collected to evaluate their hyperspectral reflectance, transmittance, absorbance, and chlorophyll a fluorescence for leaf optical properties, biochemical profiles, leaf cell structure, and ultrastructure [32]. The samples were collected immediately before the analyses to ensure consistency in data collection. All measurements were conducted between 11 a.m. and 1 p.m., unless otherwise stated in the experimental modifications. Other procedures, such as material fixation, were carried out after the collection of hyperspectral data. Fluorescence and pigments were extracted and quantified sequentially, as described below (Figure 1).
2.2. Spectral Characterisation of Leaf Optical Properties through Hyperspectral Analysis
The interaction of cells in leaves with reflectance (R) and transmittance (T) properties in vivo was measured quantitatively using a novel method developed by Falcioni et al. (2023) [2] with a FieldSpec® 3 spectroradiometer from Analytical Spectral Devices (ASD), Inc., Longmont, CO, USA [31,32,33]. This instrument, coupled with an ASD Contact PlantProbe® (ASD Inc., Longmont, CO, USA) with 10 mm diameter, features a sophisticated detector array consisting of 512 InGaAs photodiodes, enabling highly accurate spectral data collection from 350 to 2500 nm. To reduce atmospheric effects during data collection, an ASD PlantProbe® leaf clip calibrated with standard White Spectralon® reference plates (Labsphere Inc., Longmont, CO, USA) was used. The upper surface of the leaf was exposed to a powerful light source integrated into the plant probe, whereas the lower surface was assessed using another probe, with its light source turned off. Simultaneous reflectance (R) and transmittance (T) measurements were performed at different wavelengths, with each leaf sample undergoing an average of 50 repeated measurements to obtain a consistent spectral profile. Absorbance (A) was calculated using the formula A = 1 − (R + T). The sensor settings were adjusted to 1000 and 1800 nm using the ViewSpec Pro software version 6.2 (ASD Inc., Boulder, CO, USA). In addition, this study also included data on spectral curves and leaf pigments assessed under in vitro conditions, covering the wavelength range of 350–750 nm [31,32,33].
2.3. Assessment of Leaf Tissue Composition
2.3.1. Measurement of Chlorophyll and Carotenoids
We used a modified version of the method by Gitelson and Solovchenko (2018) [34] to measure the concentrations of chlorophyll a, chlorophyll b, total chlorophyll (a + b), and carotenoids, including carotenes and xanthophylls. We measured the absorbance of the methanol extract from the apolar phase of the chloroform/methanol (2:1) extraction at wavelengths of 470, 652, and 665 nm [35]. The concentrations of these pigments were calculated using the formulas and final concentrations were expressed in mg cm−2 and mg g−1 [35].
2.3.2. Measurement of Anthocyanins and Flavonoids
To measure anthocyanins, we acidified the water-methanol phase with hydrochloric acid and measured its absorbance at λ530 nm using the molar absorption coefficient of Gitelson & Solovchenko (2018) [34]. To measure flavonoids, we examined the polar fraction of the methanol extract at a wavelength of 358 nm. The molar absorption coefficients were applied according to the method described by Gitelson and Solovchenko (2018) [34].
2.3.3. Evaluation of Antioxidant Capacity
To evaluate the total antioxidant capacity of the samples, a DPPH assay adapted from the method of Llorach, Martínez-Sánchez, Tomás-Barberán, Gil, and Ferreres (2008) [36] was used. For this assay, we mixed the methanolic extract with a 1 mM solution of DPPH and measured the absorbance of the mixture after incubation in a microplate reader.
2.3.4. Measurement of Phenolic Compounds in Leaves
The soluble phenolic compounds were measured using a revised version of the method that Ragaee (2006) [37] reported. The assay involved mixing the methanolic extract with Folin-Ciocalteu reagent, sodium carbonate (Na2CO3), and deionised water. We then incubated the mixture in the dark before centrifuging to separate the phases. The absorbance of the supernatant that was obtained was determined at 725 nm wavelength.
2.4. OJIP Chlorophyll a Fluorescence Transient
Leaf measurements were performed using an infrared gas exchange analyser (IRGA; LI-6800, LI-COR Inc., Lincoln, NE, USA) equipped with a multiphase flash fluorometer (LI-6800-01; LI-COR Inc.) [2,19]. The IRGA was configured for fluorescence measurements. The following specific conditions for analysis were used in setup: CO2 concentration of 400 µmol mol−1, 60% relative humidity in the sample chamber, a flow rate of 700 µmol s−1, a fan speed of 10,000 rpm, and sample heat exchanger temperature of 25 °C within a 6 cm2 chamber. The sensor was operated above 720 nm, specifically to detect chlorophyll fluorescence to photosystem II (PSII).
Each leaf was subjected to a 12-h dark acclimation period prior to the measurements. During the experiments, leaves were secured in a clipping chamber where a saturating light pulse of 15,000 µmol m−2 s−1 was applied for 1 s in the induction mode, ensuring the closure of all reaction centres. The methods and formulas for calculating the JIP test parameters were taken from the literature. The JIP test parameters related to the electron transport chain in plants were measured using the Biolyzer software (version 4.0; Laboratory of Bioenergetics, University of Geneva, Geneva, Switzerland) [38,39,40].
2.5. Preparation and Microscopic Analyses
2.5.1. Sample Preparation for Microscopy
The leaves were meticulously prepared for examination by optical microscopy (OM), scanning electron microscopy (SEM), and transmission electron microscopy (TEM) [27]. The samples were cut into cubic millimetres using a scalpel blade on a paraffin-coated Petri dish and immediately immersed in a droplet of fixative solution to prevent damage and ensure rapid preservation. The fixative solution used was a modified Karnovsky solution, which was originally described by Karnovsky (1965) [41], comprising 2.5% glutaraldehyde and 2% paraformaldehyde in 0.05 M cacodylate buffer at pH 7.2. After six hours in this solution, the samples were fixed with a mixture of 1% osmium tetroxide and 1.6% potassium ferrocyanide in the same buffer for better cell and organelle contrasts [27].
After fixation, the samples were contrasted for 12 h with 0.5% uranyl acetate, followed by a graded dehydration series using acetone at concentrations ranging from 30 to 100%, with three cycles at the highest concentration. Portions of the samples were reserved for SEM-specific processing. The remaining samples were infiltrated and embedded in Spurr low-viscosity epoxy resin. The resin blocks were sectioned into semi-thin (1 μm) and ultrathin (70 nm) sections using an MTX Powertome X ultramicrotome (Boeckeler Instruments, RCM Products, Egham, UK). Sectioning was performed using both glass and diamond knives to meet the different thickness specifications. All reagents were of electron microscopy grade and obtained from Sigma-Aldrich (Sigma-Aldrich Inc., St. Louis, MO, USA) or Electron Microscopy Sciences (EMS, Hatfield, PA, USA).
2.5.2. Optical Microscopy
For optical microscopy (OM), leaf sections with a thickness of 1 μm were stained with 1% toluidine blue solution in borax buffer [42]. To improve the staining process, the samples were briefly heated on a hot plate at 70 °C for 5 s. Observations were performed using a Leica ICC50 optical microscope (Leica Microsystems, Wetzlar, Germany). Various anatomical features, including the characteristics of the adaxial and abaxial surfaces, stomatal distributions, thicknesses of the adaxial and abaxial epidermal layers, and mesophyll structures, were quantitatively assessed. Dimensional analysis was performed using ImageJ version 1.54g software (National Institutes of Health, New York, NY, USA), while contrast enhancement in false colours and further quantitative assessments were conducted using the Image-Pro-Plus® version 4.5 software (Media Cybernetics Inc., Rockville, MD, USA).
2.5.3. Scanning Electron Microscopy
Leaf samples were prepared using the critical point drying (CPD) method with a CPD-030 device (Bal-Tec AG, Balzers, Liechtenstein). After drying, the samples were mounted on aluminium stubs using double-sided carbon adhesive tape and sputter-coated with gold, and a current of 50 mA was applied for 150 s using an MED010 Balzer evaporator (Bal-Tec AG Balzers, Liechtenstein, DEU). Observations were conducted using a Quanta 250 scanning electron microscope (Thermo Fisher Scientific, Hillsboro, OR, USA) operated at either 15 kV or 20 kV. Scanning and imaging were performed using the microscope’s integrated FEI version 5.2.6 software (Thermo Fisher Scientific, Hillsboro, OR, USA). This approach enabled detailed assessments of stomatal density on both the adaxial and abaxial surfaces of the leaves, as well as comprehensive characterisation of leaf trichomes. Image-Pro-Plus® version 4.5 software (Media Cybernetics Inc., Rockville, MD, USA) was used to perform both quantitative and qualitative analyses of the images obtained.
2.5.4. Transmission Electron Microscopy
Ultrathin sections, either 60 nm or 70 nm thick, were prepared and placed onto copper mesh grids rated at 300 mesh. The sections underwent contrast enhancement using 3% uranyl acetate for 30 min, followed by a 15-min treatment with lead citrate, following the method developed by Reynolds (1963) [43]. Observations were made using a JEOL JEM-1400 (JEOL Inc., Peabody, MA, USA) transmission electron microscope operating at 80 kV, which was equipped with a digital imaging system (Leica Microsystems, Inc., Deerfield, IL, USA). This configuration allowed for a detailed examination of cellular ultrastructures, including chloroplasts, thylakoid membranes, mitochondria, vacuoles, cytoplasmic components [20]. Both quantitative and qualitative analyses were performed using the Image-Pro Plus® version 4.5 software (Media Cybernetics Inc., Rockville, MD, USA).
2.6. Hyperspectral Vegetation Indices Using Optimal Wavelengths for Biophysical Cell Parameters
To refine the accuracy of assessments based on chlorophyll a fluorescence and absorbance data, essential hyperspectral bands were identified through the application of the normalised difference vegetation index formula, as delineated in Equation (1) by Crusiol et al. (2023) [24]. This methodology facilitated the derivation of distinct hyperspectral vegetation indices (HVIs) relative to the biophysical indices of plant cells. Subsequent analyses involved correlating each HVI with cross-sectional data pertinent to the anatomical, structural, and ultrastructural features of plant cells. The Pearson correlation coefficient and the coefficient of determination (R2) were used to establish quantitative correlations. These were analysed using custom-made IDL programming and spectral data acquisition, covering a range of 350 to 2500 nm. Analytical results were visualised using Surfer® version 16.6software (Golden Software, LLC., Golden, CO, USA) to generate a detailed contour map of the data.
2.7. Univariate and Multivariate Analyses
Variability of variances across all variables was assessed using Bartlett’s test, which showed that there was no need for data transformation. Quantitative outcomes were analysed using paired t tests, and the results are presented as the mean ± standard error (SE). The significance threshold was set at p < 0.01 to determine statistical significance. Pearson’s correlation coefficient was used to examine the relationships among variables when appropriate. Statistica® 10.0 (StatSoft, Inc., Tulsa, OK, USA), SigmaPlot® 10.0 (Systat Software, Inc., San Jose, CA, USA), and the R statistical package (R Core Team, 2020) were used for all univariate and multivariate statistical analyses.
The dataset related to growth parameters was subjected to principal component analysis (PCA) using Unscrambler X software, version 10.4 (CAMO Software, Oslo, Norway). To ensure analytical validity, a significance level of p < 0.01 was applied. The best number of principal components was chosen based on the first maximum of the cumulative explained variance following Zar’s (2010) [44]. PCA also enabled the grouping of two species, T. spathacea and T. pallida, along with the identification of vectors for each group corresponding to each species component (Jolliffe and Cadima, 2016) [45]. This analytical method provides detailed information on the interdependencies of the hyperspectral and fluorescence kinetic curves within the studied species.
3. Results
3.1. Morphological Characteristics
Figure 2 shows representative specimens of Tradescantia spathacea (L.) Olof Swartz and Tradescantia pallida (Rose) D.R. Hunt. These species exhibit distinctive green and purple hues, with morphological differences between their adaxial and abaxial leaves (Figure 2).

Figure 2.
Images of Tradescantia spathacea (L.) Olof Swartz and Tradescantia pallida (Rose) D.R. Hunt plants. The variegated leaves evaluated in this study displayed significant variations in the bioaccumulation of pigments (i.e., the accumulation of pigments based on secondary metabolism). Upper panel: Details of the lateral profile of plants. Lower panel: details of the plant leaves, including leaf surface and paved epidermal cells.
T. spathacea displays a unique colour transition from green on the adaxial leaf surface to purple on the abaxial leaf surface. Conversely, T. pallida maintained a consistent purple hue on both leaf surfaces, with a more intense shade on the adaxial surface (Figure 2, top and bottom panels).
Stereoscopic microscopic analysis revealed variations in epidermal cell patterns between species. In T. spathacea, epidermal cells are irregular in shape and size, and pigments are unevenly distributed. In contrast, T. pallida exhibits epidermal cells that are more uniform in shape and arrangement with a more distinct and consistent pigment distribution. These observations highlight significant differences in cell morphology and pigment processing, which contribute to the distinct visual appearance of each species (Figure 2).
3.2. Microscopic Epidermal Architecture of Tradescantia Species
Scanning electron microscopy (SEM) images of the epidermal structures of T. spathacea and T. pallida are shown in Figure 3. High-resolution SEM images revealed differences in the morphology of both adaxial and abaxial leaf surfaces (Figure 3A–P). The T. spathacea adaxial epidermis exhibited a cellular area density of approximately 86.85 cells mm−2 (Figure 3A,E,I,M,Q), while the abaxial surface showed a slightly reduced density of 83.96 cells mm−2 (Figure 3B,F,J,N,R). In contrast, T. pallida possessed a lower density of 21.99 cells mm−2 adaxially (Figure 3C,G,K,O,Q) and 24.63 cells mm−2 (Figure 3D,H,L,P,R). SEM revealed a more compact epidermal structure in T. spathacea than in T. pallida (Figure 3). For example, both species exhibited hexagonal-shaped cells with concavity facing the inner side of the mesophyll, forming convex lenses towards the external environment and concave towards the interior of the leaf mesophyll (Figure 3).
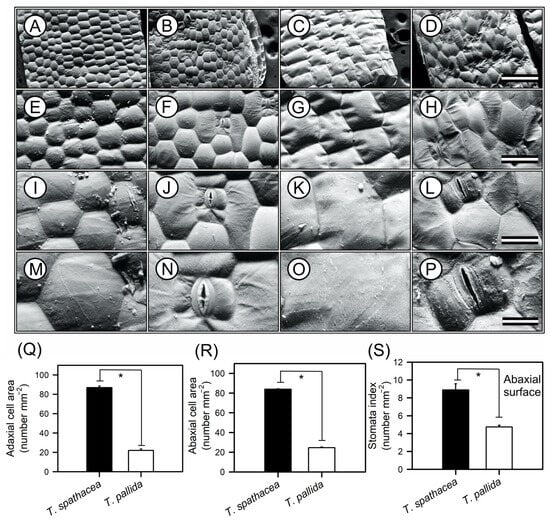
Figure 3.
Representative scanning electron microscopy (SEM) images of the adaxial and abaxial surfaces of Tradescantia spathacea (L.) Olof Swartz and Tradescantia pallida (Rose) D.R. Hunt plants. (A,E,I,M) Adaxial surface of T. spathacea. (B,F,J,N) Abaxial surfaces of T. spathacea. (C,G,K,O) Adaxial surfaces of T. pallida species. (D,H,L,P) Abaxial surface of T. pallida. (Q) Adaxial cell surface area. (R) Abaxial cell surface area. (S) Stomatal indices of the abaxial surfaces of both the species. Scale bars = 500 μm, 200 μm, 100 μm, and 50 μm, from top to bottom. Bars with asterisks show significant differences by Student’s t test (p < 0.01). Mean ± SE. (n = 100).
Stomatal indices on the lower surfaces could also distinguish between species (see Figure 3N,P). For example, T. spathacea had a greater index (8.89) than T. pallida (4.75), according to statistical analyses (Figure 3S). Both species lack stomata on their upper surfaces, which indicate that they are hypostomatic. Statistical analyses, performed with a confidence interval of 99% (p < 0.01), confirmed the significance of differences between species (Figure 3).
From a structural perspective, the cells on the upper and lower surfaces of T. spathacea had a hexagonal shape, whereas those on T. pallida exhibit a rectangular shape. These cells are tightly packed and arranged at almost 90° angles on the upper surface but are more loosely packed and still have clear outlines on the lower surface of both species (Figure 3A–P).
However, the features of the lower surfaces include paracytic stomata, which have guard cells that are usually longer than the adjacent cells and parallel to the abaxial surface (Figure 3J,L). The subsidiary cells, as shown, are also parallel to the guard cells and assist with the functioning and maintenance of the stomata but do not directly participate in the opening and closing of the stomata (Figure 3J,N,L,P).
3.3. Leaf Anatomy Structures
The tissues and cells of the leaves presented the anatomical features of T. spathacea and T. pallida, as visualised by optical microscopy (Figure 4A–L). Cross-sectional imaging revealed structural differences and cellular reorganisation patterns between the species (Figure 4A–F). The adaxial epidermis of T. spathacea (Figure 4A,G), measuring 80.25 µm2, was significantly thinner (p < 0.01) than that of T. pallida, measuring 125.08 µm2 (Figure 4B,G). Conversely, the adaxial hypodermis of T. spathacea (240.87 µm2) was less extensive than the 405.85 µm2 observed in T. pallida plants (Figure 4A,B,H).
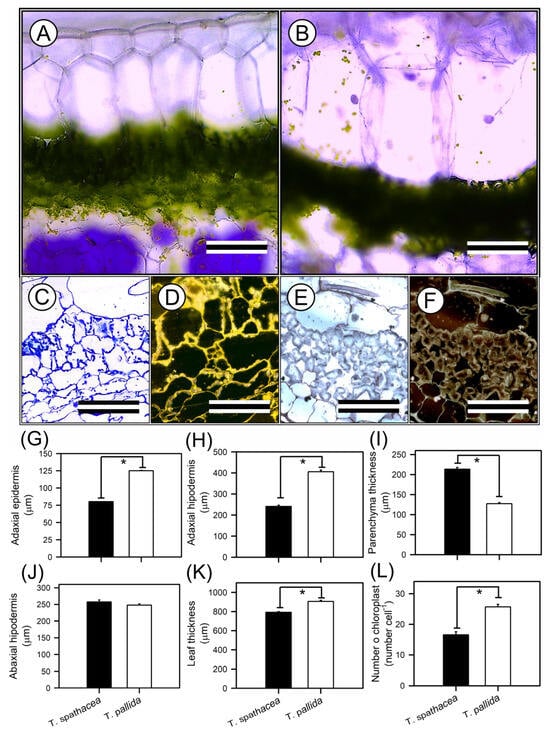
Figure 4.
Representative optical microscopy (OM) images of the top–bottom and anatomical analyses of Tradescantia spathacea (L.) Olof Swartz and Tradescantia pallida (Rose) D.R. Hunt plants. (A,C,D) Cross sections of T. spathacea plants. (B,E,F) Cross-sections of T. pallida plants. (G) Adaxial epidermis. (H) Adaxial hypodermis. (I) Parenchyma thickness. (J) Abaxial hypodermis. (K) Leaf thickness. (L) Number of chloroplasts. Bars with asterisks show significant differences by Student’s t test (p < 0.01). Scale bars = 200 μm and 60 μm, from top to bottom. Mean ± SE. (n = 100).
The parenchyma thickness in T. spathacea (257.38 µm2) increased compared with that in T. pallida (247.78 µm2), revealing a denser mesophyll layer that may enhance photosynthetic efficiency (Figure 4C–F,I). The compact cells of the mesophyll parenchyma in T. spathacea indicated limited cellular expansion and a high concentration of chloroplasts, which may restrict light passage in deep layers (Figure 4C–F, and see purple points in hypodermal cells).
The abaxial hypodermis of T. spathacea was 213.50 µm2 thinner than that of T. pallida (127.48 µm2) (Figure 4J). Higher concentrations of extrachloroplastic pigments, such as anthocyanins, were observed in these cell layers (Figure 4D,F,J).
The total leaf thickness of T. spathacea (792 µm2) contrasts with the greater thickness of T. pallida (906.18 µm2) (Figure 4K), showing differential cell structures to support the accumulation of water and pigments in large vacuoles in plant cells (Figure 4A–F).
Chloroplast density was greater in T. pallida (25.69 chloroplasts cells−1) than in T. spathacea (16.59 chloroplasts cell−1) (Figure 4C–F,L), which could be correlated with the species’ photosynthetic activity and adaptation to light conditions, indicating a balance between the number of chloroplasts and the thickness and area of the chloroplastic and nonchloroplastic cellular regions (Figure 4).
3.4. Leaf Anatomy Ultrastructures by Transmission Electron Microscopy
Transmission electron microscopy (TEM) images revealed ultrastructures within the palisade parenchyma and hypodermal cells. High-resolution TEM enables in-depth analysis of cellular components, providing insight into the ultrastructural adaptations of plant cells (Figure 5A–R).
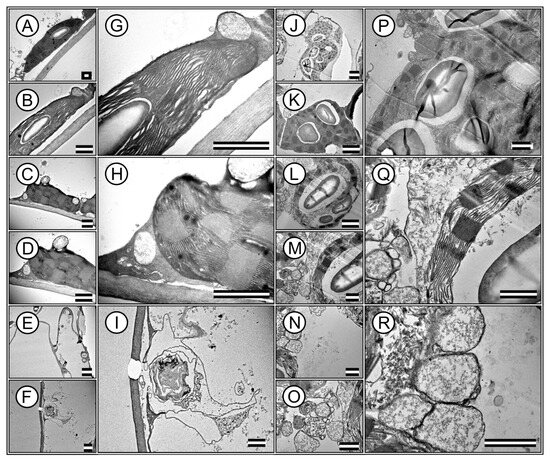
Figure 5.
Representative transmission electron microscopy (TEM) image of ultrastructures in mesophilic cells of Tradescantia spathacea (L.) Olof Swartz and Tradescantia pallida (Rose) D.R. Hunt plants. (A–I) T. spathacea species. (J–R) T. pallida species. Stromal and granal thylakoids are evidenced. Accumulation of cell wall, starch and chloroplasts and vesicles accumulate different substances based on electrodensity. Scale bars = 1 μm.
The TEM images highlight the integrity and distribution of chloroplasts, which are densely packed within the cells. This organization in T. spathacea (Figure 5A,B,G) compared with that in T. pallida (Figure 5J,K,P) showed a possible efficient photosynthetic apparatus with many thylakoid membranes that are crucial for modifying leaf spectral absorption (Figure 5).
Remarkably, the chloroplasts exhibited a high degree of structural organisation, with clearly defined granum stacks, indicating a substantial capacity for energy capture and transfer and electron-dense membranes (Figure 5G,H,Q). The presence of large and abundant starch grains within the chloroplasts indicated active and higher photosynthesis and carbohydrate synthesis (Figure 5G,P). Various organelles essential for cell function were visible in the cytoplasmic matrix (Figure 5D,H,M,Q). Mitochondria, the sites of cellular respiration and energy production, were identifiable, revealing an integral link between energy-producing and energy-utilising processes within the cell, and no plastoglobules were identified (Figure 5C,D,H,L,M,Q).
Additionally, the images revealed that the cell wall was thick and robust, contributing to cellular rigidity and structural integrity, particularly in T. spathacea (Figure 5H). However, the cell wall is robust in T. pallida, with major cytoplasmic and minor vacuoles in the cytoplasm.
Nevertheless, other images from the apical meristematic region of T. spathacea showed chloroplasts at various stages of degradation, with vestiges of the membranes (Figure 5E,F,I). In contrast, in T. pallida, no denatured membranes were observed; instead, a series of vesicles and vacuoles contained electron-dense substances (Figure 5N,O,R).
The hypodermis of T. spathacea (Figure 5E,F,I) and T. pallida (Figure 5N,O,R) exhibited clustered vacuoles containing deposited material in addition to disorganised membranes. This indicates that any chloroplasts present have become nonfunctional, given the characteristics of the accumulation of solutes and water and the deposition of secondary metabolic materials (Figure 5).
Base TEM was used to determine the relative frequency distributions of the biophysical parameters defined in T. spathacea and T. pallida species based on the chloroplast distribution and thylakoid layers (Figure 6A–F). Histograms juxtaposed with a normal distribution curve provided a statistical view of the granum height, thylakoid layers, and stacking repeat distance (Figure 6).

Figure 6.
The relative distribution of frequencies according to biophysical parameters aligns the ultrastructures of the chloroplasts and thylakoids of Tradescantia spathacea (L.) Olof Swartz and Tradescantia pallida (Rose) D.R. Hunt plants. (A) Relative distribution of the frequency of T. spathacea granum height (nm). (B) Relative distribution of the frequency of thylakoid layers in T. spathacea. (C) Relative distribution of the frequency of stacking repeats in T. spathacea species. (D) Relative distribution of the frequency of granum height (nm) in T. pallida species. (E) Relative distribution of the frequency of thylakoid layers in T. pallida. (F) Relative distribution of the frequency of stacking repeat distances in T. pallida species. The green line shows the normalised distribution. (n = 100).
For T. spathacea, the average granum height was 451.4 ± 16.1 nm (Figure 6A), indicating the vertical extent of stacked thylakoid membranes within the chloroplasts. The frequency of thylakoid layers averaged 22.5 ± 0.73 per granum (Figure 6B), which reflects the number of thylakoid membranes per stack, and the stacking repeat distance—the space between successive thylakoids—was 20.1 ± 0.47 nm (Figure 6C).
Comparatively, T. pallida has a different structural composition, with a granum height of 593.6 ± 20.1 nm (Figure 6D), demonstrating taller granum stacks than those observed in T. spathacea species. The average number of thylakoid layers was 27.9 ± 0.88 per granum (Figure 6E), indicating a greater number of membranes per stack, and the average stacking repeat distance was 21.3 ± 0.43 nm (Figure 6F).
Histograms revealed that compared with T. spathacea, T. pallida typically has taller granum stacks with more thylakoid layers and a slightly greater stacking repeat distance (Figure 6C,F). These characteristics of thylakoids in chloroplasts have profound implications for the photosynthetic and antioxidant adaptability of plants, influencing their capture, scattering, and use of light energy in leaf cells.
3.5. Pigment Components in Cell Structure and Ultrastructure
A comparative analysis of the pigment content in T. spathacea and T. pallida was conducted by extracting pigments from both chloroplastidic and extrachloroplastidic cells (Figure 7A–P). Analysis revealed that the concentrations of chlorophyll a (Chla) and chlorophyll b (Chlb) in T. spathacea were greater than those in T. pallida, with values of 709.91 mg m−2 and 430.92 mg m−2, respectively (Figure 7A,B). This was also reflected in the total chlorophyll (Chla+b) content, which was 1140.82 mg m−2 in T. spathacea (Figure 7C). The carotenoid content in T. spathacea was 247.88 mg m−2, which was significantly lower than that in T. pallida (279.20 mg m−2) (Figure 7D) (p < 0.01).

Figure 7.
Concentrations of compounds in Tradescantia spathacea (L.) Olof Swartz and Tradescantia pallida (Rose) D.R. Hunt plants. (A) Chlorophyll a (mg m−2). (B) Chlorophyll b (mg m−2). (C) Total chlorophyll (a+b) (mg m−2). (D) Carotenoids (mg m−2). (E) Chl a/b ratio. (F) Car/Chl a+b ratio. (G) Anthocyanins (nmol cm−2). (H) Flavonoids (nmol cm−2). (I) Chlorophyll a (mg g−1). (J) Chlorophyll b (mg g−1). (K) Total chlorophyll (a+b) (mg g−1). (L) Carotenoids (mg g−1). (M) Anthocyanins (μmol g−1). (N) Flavonoids (μmol g−1). (O) Radical scavenging (g gallic acid−1). (P) Phenolic compounds (mL cm−2). Bars with asterisks show significant differences by Student’s t test (p < 0.01). Mean ± SE. (n = 100).
The Chla/Chlb ratio in T. spathacea was greater than the Chlb, which is consistent with the high photosynthetic capacity of the chloroplasts and extrachloroplastidic plant cells (Figure 7E). Conversely, T. pallida displayed a lower carotenoid-to-chlorophyll ratio (Car/Chla+b), indicating a different balance of these pigments, which may reflect the varied light-harvesting strategies (Figure 7F).
Anthocyanin levels showed significant interspecies variation, with T. spathacea exhibiting high concentrations both per base area and per mass of leaf, at 25.17 nmol cm−2 and 4.36 µmol g−1, respectively (Figure 7G,M). Similarly, the flavonoid content was greater in T. spathacea, at 39.36 nmol cm−2 and 6.84 µmol g−1 (Figure 7H,N). On the other hand, T. pallida exhibited lower values for these same pigments with Chla, Chlb, Chla+b, Car, AnC and Flv per mass, even though its colouration is “visually” more purple leaves (Figure 7A–N).
Photochemical efficiency, assessed by radical scavenging activity, revealed that T. spathacea has a significantly greater capacity for radical scavenging, indicating the potential for greater antioxidant activity within this species (Figure 7O). The data showed an increase of approximately 70% in the radical scavenging activity compared to that of T. pallida species. The phenolic compound concentration measured per base area further supported this finding, with T. spathacea exhibiting a concentration approximately 50% higher than that of T. pallida (Figure 7P), demonstrating significant differences (p < 0.01).
3.6. Leaf Optical Profile and Absorbance Spectrum of Pigments
The leaf optical profile differed between the adaxial and abaxial surfaces, as did the spectral characteristics of reflectance, transmittance, and absorbance (Figure 8A–D and Figure S1).

Figure 8.
Spectral analysis of leaves (in vivo) and pigments (in vitro) in Tradescantia spathacea (L.) Olof Swartz and Tradescantia pallida (Rose) D.R. Hunt plants. (A) Reflectance factor (Ref) from 350 to 2500 nm. (B) Transmittance factor (trans) from 350 to 2500 nm. (C) Absorbance factor (Abs) from 350 to 2500 nm. (D) Spectra of chloroplast (chlorophylls and carotenoids) and extrachloroplastidic (anthocyanins and flavonoids) pigments from 350 to 750 nm. The solid and dashed black lines represent the measurements from the adaxial and abaxial surfaces of the leaves of Tradescantia species, respectively. (n = 100).
In the ultraviolet (UV) spectrum (350–400 nm), we observed low reflectance, which is indicative of effective UV light absorption (Figure 8A and Figure S1A). Specifically, the lowest reflectance values at 380 nm were 5.6% for Tradescantia spathacea and 6.3% for Tradescantia pallida on the adaxial surfaces. A distinct reduction in the reflectance of T. spathacea on the adaxial surface was observed at violet/blue wavelengths (400–450 nm), which was 12% lower than that of its abaxial counterpart. In addition, the interaction of light with biochemical and biophysical compounds results in distinct reflectance patterns associated with cell surface characteristics as well as interactions with the upper cellular layers of the epidermis and hypodermis (Figure 8A, see details in reflectance spectra). The red range (620–700 nm) exhibited a pronounced decrease in reflectance, notably at 680 nm, where T. spathacea and T. pallida exhibited adaxial reflectance values of 11% and 13%, respectively (Figure 8A and Figure S1A).
The low transmittance in the UV region suggests a unique adaptation within the Tradescantia species-based concentration of pigments in the cells (Figure 8A and Figure S1B). As the spectrum transitions to violet/blue, the decrease in transmittance, particularly for T. spathacea on the adaxial surface by 10% at 450 nm, aligns with the increased absorption of the photoprotective and antioxidant compounds (Figure 8B, range for spectral bands). The transmittance continues to decrease toward the red end, paralleling the trend in which the reflectance aligns with that of interactions such as denatured chloroplasts and membranes, cell walls, and vacuoles containing compounds of different densities (Figure 8B, see details on the NIR structures in this range). In the NIR region (700–1000 nm), the transmittance increased for both species, suggesting that the structural aspects of the leaves facilitated light passage. In parallel, T. pallida showed a significant increase in transmittance of 15% in the SWIR2 band (1800–2500 nm) compared to that of T. spathacea, suggesting that differences in leaf water content or density are associated with the presence of many vacuoles in cells (Figure 4B).
The absorbance spectra revealed increased absorption across the UV spectrum for both Tradescantia species, with T. spathacea on the adaxial surface absorbing up to 90% of UV light (Figure 8A and Figure S1C). This strong UV absorbance is likely a protective adaptation against harmful radiation. In the violet/blue region, the absorbance at 430 nm and decrease in the intensity of the green band (530–560 nm) were particularly high for T. spathacea, reflecting the presence of anthocyanins and other blue–green light-absorbing pigments. The absorbance peaks were within the visible region, particularly at a red wavelength of 680 nm (T. spathacea adaxial: 92%). The absorbance in the NIR region notably decreased to 15% for T. spathacea and 18% for T. pallida at 750 nm, which is indicative of decreased pigment interaction and translucency of plant tissues at these wavelengths (Figure 8C), but dispersion of light in the interiors of chloroplasts, cells, and leaves (Figure 8C).
In the SWIR1 (1300–1800 nm) and SWIR2 (1800–2500 nm) regions, the absorbance trends varied less markedly between the two leaf sides, suggesting interactions with leaf components beyond the pigments predominantly responsible for adaptations to drought environment, such as water, which has distinct absorbance characteristics in the SWIR range and can indicate water status and cell structure integrity for cellular homeostasis (Figure 8A–C).
The absorption spectra of the pigments within plant leaves are shown in Figure 8D. The spectral data correspond to the absorbance characteristics of different pigments, such as chlorophyll, anthocyanins, and flavonoids, across the visible-NIR proximal light spectrum (Figure 8D). The chlorophyll curve shows peaks in the blue (approximately ≈ 430–450 nm) and red (approximately ≈ 660–680 nm) regions, which are typical absorption wavelengths for chlorophyll and reflect the role of pigments in capturing light energy for photosynthesis. The intensity of the peak at approximately 530 nm indicates the absorption properties of anthocyanins, which contribute to leaf colouration and photoprotection. The flavonoid absorption curve spanned a broader range, suggesting that absorption in the UV-cyan band extends into the visible region, which is consistent with the roles of flavonoids in UV protection and oxidative stress mitigation (Figure 8D), and the reflectance, transmittance, and absorbance of flavonoids are correlated with the leaf spectrum (Figure 8A–D). The spectral patterns provided insights into the plant’s light harvesting and protective mechanisms, for example, with specific absorption maxima and minima revealing detailed information about the types and concentrations of pigments and their metabolic pathways such as the possible increase of the pathways of flavonoids, anthocyanins, and phenolic compounds (Figure 8A–D).
3.7. Chlorophyll a Fluorescence Kinetics-Based Pigments and the Structure and Ultrastructure of Cells
Analysis of chlorophyll a fluorescence kinetics for T. spathacea and T. pallida based on the JIP test parameters revealed distinct differences between the adaxial and abaxial faces and cells (Figure 9A–D). The fluorescence induction kinetics, observed through the normalised OJIP transient, flash-pulse induction, modulated the double emission of the adaxial and abaxial faces of the species (Figure 9A–D).
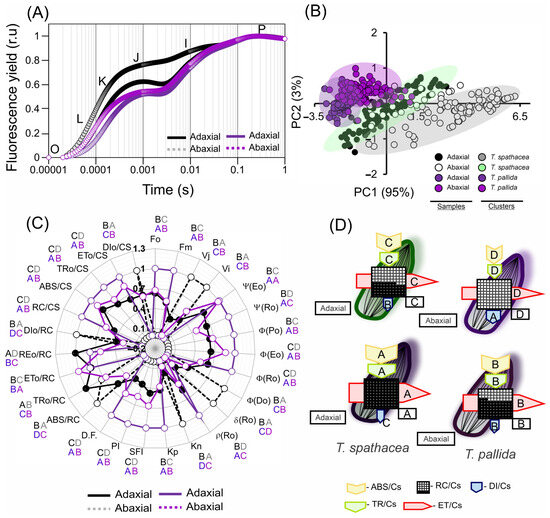
Figure 9.
Chlorophyll a fluorescence kinetic parameters derived from the JIP test of Tradescantia spathacea (L.) Olof Swartz and Tradescantia pallida (Rose) D.R. Hunt plants. (A) Kinetics of chlorophyll a fluorescence induction with normalisation. (B) Principal component analysis of the adaxial and abaxial leaf surfaces. (C) Radar plot displaying parameters derived from the transient chlorophyll a fluorescence kinetics (JIP test). (D) Pipeline variegatum leaves displaying phenomenological energy flow through excited leaf cross sections (CSs). Yellow arrow: ABS/CS, absorption flow by approximate CS; green arrow: TR/CS, energy flow trapped by CS; red arrow: ET/CS, electron transport flow by CS; blue arrow: DI/CS, energy flow dissipated by CS; circles inscribed in squares: RC/CS indicate the percentage of active/inactive reaction centres. The white circles inscribed in squares represent reduced (active) QA reaction centres, the black circles represent non-reducing (inactive) QA reaction centres, and 100% of the active reaction centres responded with the highest average numbers observed in relation to the control. The arrow size indicates the change in energy flow compared with that of the green surface leaves in T. spathacea. Different letters and colours indicate significant differences between plants, as determined using Duncan’s test (p < 0.01). The standard error was omitted for clarity. (n = 100).
The fluorescence curves indicate a greater proportion and differences in the K-J-I bands, stabilising and reaching a plateau in the P-bands (Figure 9A). In addition, the principal component data (PC: 95% and PC2: 3%) explained 98% of the total variability of the data when analysing the adaxial and abaxial faces of the species (Figure 9B).
In the analysis of the JIP test by photosynthetic parameters of the T. spathacea and T. pallida species, both the adaxial and abaxial surfaces were examined in comparison with the standard T. spathacea adaxial (Figure 9C,D; green surfaces). Ψ(Eo) in the T. pallida adaxial increased by 16.99%, with the abaxial surface showing an increase of 15.66%, whereas T. spathacea abaxial decreased by 40.88%. Ψ(Ro) values increased in T. pallida adaxial by 9.33% and decreased in T. spathacea abaxial by 16.57%. ϕ(Po), a measure of maximum quantum yield, increased in the T. pallida adaxial by 9.79% and marginally in its abaxial by 1.19%, indicating more efficient primary photochemistry than that of T. spathacea (Figure 9C).
In terms of the ϕ(Eo) parameter, which pertains to the quantum yield of electron transport, adaxial T. pallida demonstrated an increase of 27.79% with abaxial T. pallida at 16.91%. This suggests the existence of a more robust electron transport chain. However, for ϕ(Ro), the quantum yield of electron transport to reduce the end electron acceptors at the PSI acceptor side, the T. pallida adaxial only showed a slight increase of 17.24%, whereas T. spathacea abaxial showed a reduction of 5.37% (Figure 9C).
For ϕ(Do), which indicates the quantum yield of non-photochemical energy dissipation in PSII, there was a significant decrease in T. pallida adaxial by 22.62%. δRo, which expresses the efficiency with which an electron from the intersystem electron carrier is transferred to reduce the end electron acceptors at the PSI acceptor side, was reduced in the T. pallida adaxial by 4.57%, whereas the T. spathacea abaxial decreased by 13.84% (Figure 9C).
The ρRo values, reflecting the probability that an electron from the intersystem electron carrier moves further than PSI, were elevated by 31.30% in T. pallida adaxial and decreased by 7.57% in T. spathacea abaxial. Both Kn and Kp, denoting the de-epoxidation state of xanthophyll cycle pigments, were slightly reduced in T. pallida adaxial by 6.14% and 20.69%, respectively (Figure 9C).
The Structure Function Index (SFI) increased by 59.48% in T. pallida adaxial, indicating the enhanced structural integrity of the thylakoid membranes. The Performance Index (PI), encompassing overall photosynthetic performance, was notably higher in the adaxial face of T. pallida than in the abaxial face by 117.52% and 36.40%, respectively. Finally, the Dissipation Factor (D.F.) in the T. pallida adaxial increased by 68.02% with a more moderate increase of 27.51% in the abaxial face, signifying a higher energy dissipation as heat, potentially indicating stress or a higher capacity for non-photochemical quenching (Figure 9C).
Based on radar plots (Figure 9C) and phenological flux models (Figure 9D), in T. spathacea, the proportion of active reaction centres (RC/CS), reflecting the number of active photosystem II (PSII) units per cross-sectional area, was significantly greater, with an average of 47.22%, as opposed to the absence of active reaction centres on the abaxial surface of the same species. This percentage reached 100% on the adaxial surface and 60.41% on the abaxial surface of T. pallida, suggesting a greater density of PSII on the abaxial surface of T. pallida (Figure 9C).
The absorption per cross-section (ABS/CS) of T. spathacea was 9.29% on the adaxial surface and 5.99% on the abaxial surface, whereas that of T. pallida was 11.97% and 10.56%, respectively. This parameter measures the light-harvesting efficiency of chlorophyll a in photosystems (Figure 9C,D).
The percentage of energy trapped per cross section (TRo/CS) was 7.03% in T. spathacea on the adaxial surface and 5.23% on the abaxial surface, with T. pallida displaying percentages of 10.45% and 7.91%, respectively (Figure 9C,D).
In addition, the percentages of electron transport per cross-section (ETo/CS) for the adaxial and abaxial surfaces of T. spathacea were 4.50% and 3.59%, respectively, whereas those of T. pallida were 7.18% and 6.06%, respectively, which reflects the rate at which electrons are transported beyond QA− (Figure 9C,D).
The dissipation energy flow per cross-section (DIo/CS) was lower in T. spathacea (3.38% on the adaxial surface and 5.41% on the abaxial surface), indicating lower NPQ; however, this aligns with the presence of hypodermal cells and the concentrations of anthocyanins, phenolic compounds, and flavonoids (Figure 9D). For T. pallida, the values were 2.71% and 3.25% for the adaxial and abaxial surfaces, respectively.
Aligning these data, the radar plot with phenomenological models (Figure 9C,D) provides a visual representation of the JIP test parameters, and these patterns of energy conversion efficiency and NPQ elucidate the different photochemical reaction strategies employed by these species, as evidenced by the fluorescence induction kinetics (Figure 9A–D).
3.8. Correlation Coefficients between the Hyperspectral Vegetation Indices and Biophysical Parameters of the Leaves
Figure 10 and Figure 11 present heatmaps of correlation coefficients from linear regression analyses of hyperspectral vegetation indices (HVIs) spanning a wavelength spectrum from 350 to 2500 nm, including chlorophyll a kinetics for Tradescantia spathacea and Tradescantia pallida, as shown in Figure 10 and Figure 11 (see panels 10 and 11 from A, C, E, G, I, K, M, O, Q, and S for T. spathacea and B, D, F, H, J, L, N, P, R, and T for T. pallida). The depicted colour gradients illustrate a range of R2 values, where the intensity reflects the correlation strength. In addition, the results indicate strong associations between the differential absorption patterns upon illumination and structural correlations within the UV, VIS, NIR, and SWIR bands (Figure 10).
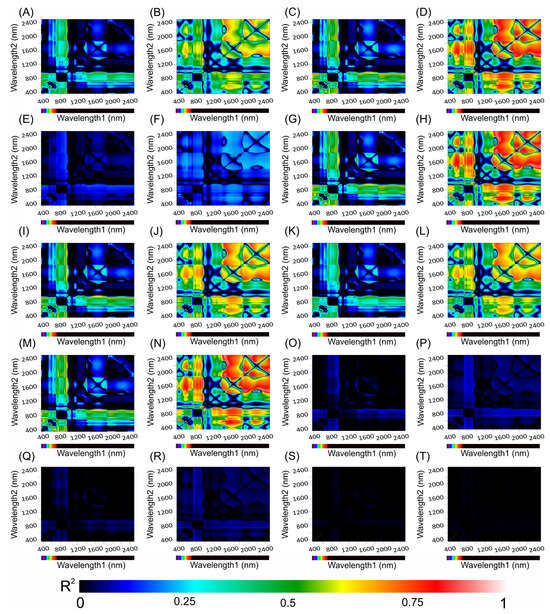
Figure 10.
Counter map for correlation coefficients (R2) from HVI algorithms applied to adaxial and abaxial absorbance hyperspectroscopy data across the range of 350 to 2500 nm for Tradescantia spathacea (L.) Olof Swartz and Tradescantia pallida (Rose) D.R. Hunt plants. The heatmap shows the coefficient of correlation (R2) obtained from linear regression analyses between various biophysical parameters and the interactions between wavelengths1 and wavelengths2. (A,B) adaxial epidermis, (C,D) adaxial hypodermis, (E,F) parenchyma thickness, (G,H) abaxial hypodermis, (I,J) leaf thickness, (K,L) number of chloroplasts, (M,N) adaxial cell area surface, (O,P) granum height, (Q,R) thylakoid layers, and (S,T) stacking repeat distance (SRD). The colour gradient, which transitions from dark blue to light red, signifies increasing correlation strength. (n = 200).

Figure 11.
Counter map for correlation coefficients (R2) from HVI algorithms applied to adaxial and abaxial chlorophyll a fluorescence kinetics data across the range of 350 to 2500 nm for Tradescantia spathacea (L.) Olof Swartz and Tradescantia pallida (Rose) D.R. Hunt plants. The heatmap shows the coefficient of correlation (R2) obtained from linear regression analyses between various biophysical parameters and interactions between wavelengths 1 and 2. (A,B) adaxial epidermis, (C,D) adaxial hypodermis, (E,F) parenchyma thickness, (G,H) abaxial hypodermis, (I,J) leaf thickness, (K,L) number of chloroplasts, (M,N) adaxial cell area surface, (O,P) granum height, (Q,R) thylakoid layers, and (S,T) stacking repeat distance (SRD). The colour gradient, which transitions from dark blue to light red, signifies increasing correlation strength. (n = 200).
The strongest correlations occurred within the SWIR1 and SWIR2 bands with notable interactions between the VIS and SWIR bands (Figure 10 and Figure 11). However, correlations approaching zero were particularly noticeable for biophysical parameters related to organelle structures or thylakoid membranes, such as granum height (Figure 10O,P), thylakoid layers (Figure 10Q,R), and stacking repeat distance (SRD) (Figure 10S,T), for both species under investigation (Figure 10).
The chlorophyll kinetic correlation maps indicated that regions corresponding to curves K, J, and I were most significantly affected by interactions with cells containing extrachloroplastidic pigments (e.g., anthocyanins and phenolics) rather than those related to the chlorophyll concentration within the chlorophyll parenchyma. Furthermore, the JIP test curves did not show a correlation with the HVIs for thylakoid stacking, granum thickening, or stacking repeat distance among the thylakoid membranes within cellular chloroplasts (Figure 11).
3.9. Multivariate Analyses
A cluster heatmap (Figure 12A) revealed distinct biophysical and biochemical characteristics comparing the T. spathacea and T. pallida species (Figure 12A). In the heatmap, the colour intensity indicates the level of parameter expression, blue represents lower values, and red indicates higher values. The heatmap uses a Z-score spectrum to demonstrate relative changes in values, organising the data by grouping parameters in rows and sample groups in columns, which accentuates species-specific differences. The variables related to anthocyanins, flavonoid compounds, surface cells, and the abaxial epidermis were strongly correlated with T. spathacea and weakly correlated with T. pallida (Figure 12A, see red details).
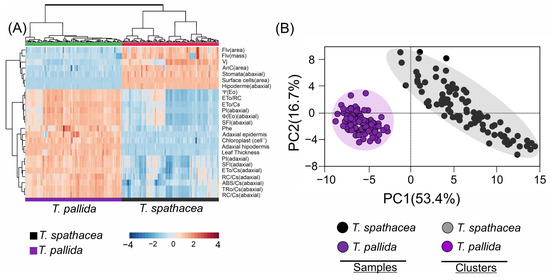
Figure 12.
Cluster heatmap and principal component analysis of Tradescantia spathacea (L.) Olof Swartz and Tradescantia pallida (Rose) D.R. Hunt plants. (A) Cluster heatmap summarising pigments by area and mass, chlorophyll a fluorescence parameter, and adaxial, abaxial, and anatomical parameters. Numerical differences within the data matrix are shown by the Z scores, where blue and red indicate decreased and increased values, respectively. The parameters were clustered in the rows, and sample groups were clustered in the columns by differences between species at independent factors. (B) Principal component analysis and clustering based cluster heatmap factors. (n = 100).
In contrast, the PCA scatter plot summarised the data into two principal components, separating 70.1% of the total explication for the two species (Figure 12B). The closer clustering of T. spathacea suggested less variability in the measured parameters, or alternatively, for T. pallida, depending on cluster identification. The principal components PC1 and PC2 explained 53.4% and 16.7% of the variance, respectively, reducing complex data into principal factors that describe species-specific traits. PCA distinguished the species and validated their unique biological and structural features (Figure 12B).
4. Discussion
4.1. Comparative Analysis of Morphological and Biochemical Characteristics
The phenotypic traits of plants are altered through the modulation of gene expression [46,47]. Phenotypic variation in epidermal cells, particularly concerning their interaction with observational patterns of leaf structures and the leaf optical profile, has received little attention [48,49]. Further research is imperative to understand the association between these variations and the cellular spectral signatures at the ultrastructural level [32,50].
In this study, we investigated the morphological and biochemical characteristics of Tradescantia spathacea and Tradescantia pallida (Figure 1, Figure 2, Figure 3, Figure 4, Figure 5, Figure 6, Figure 7, Figure 8, Figure 9, Figure 10, Figure 11 and Figure 12). We focused on purple and green leaves to demonstrate how the accumulation of pigments (Figure 2), notably anthocyanins and flavonoids, can modify the spectral signatures and chlorophyll patterns on both adaxial and abaxial leaf surfaces [51,52]. Significant differences were observed in the optical properties and fluorescence kinetic parameters of the two species, suggesting that their distinct photosynthetic behaviours were influenced by their morphological traits [53,54]. Notably, the interplay between epidermal cells and leaf pigments revealed unique traits in similar leaves that were discernible upon integrating the spectra at wavelengths of 350–2500 nm [55,56,57,58]. The ultrastructural and cellular components of these species shown above determine their cellular reprograming and subsequent functional pathways by metabolic profile [59,60,61].
Some researchers have shown that spectral and hyperspectral signatures, along with chlorophyll fluorescence, align with morphological alterations [52,62,63,64,65]. This concordance extends to the spectral data and ChlF disparities for various species, albeit through a novel approach. The spectral signatures principally mirror pigment composition (VIS-NIR) and structural adjustments at both the cellular and ultrastructural levels. Chlorophyll fluorescence primarily indicates the photosynthetic efficiency of leaf surface cells, thereby emphasising the functional implications of morphological variation [2,28,30,66,67]. By measuring the fluorescence emitted by a flash or detection between two sensors that penetrated the mesophyll tissue profile, we ascertained that the internal leaf signals diminished upon the sensor return [1,11,14,68]. For example, this determines how light dispersion varies among different cellular layers and the impact of adaxial and abaxial hypodermal cells, which contain purple pigments, on the epidermis. The correlation with the HVI models indicated a pronounced distinction in the signal between the superficial and deeper cellular layers. The fluorescence yield phases K, L, J, and lower in O, I, and P, measured on both leaf sides, revealed that the superficial tissues, despite their greater cross-sectional volume, exhibited markedly reduced photosynthetic electron transport activity compared to deeper tissues such as chlorophyll-rich parenchyma. This discrepancy in the reflected and scattered signals can be attributed to the significant structural differences between the adaxial and abaxial aspects of the Tradescantia leaves [8,11].
4.2. Adaptations to Cell and Tissue Structures from Spectral Data
The adaxial and abaxial tissue indicate that the hexagonal and rectangular formats, combined with varying cellular densities in the epidermal layers of both Tradescantia species, signify an architectural evolution [8,11]. This development is designed to optimise light absorption and curtail water loss, both of which are essential for survival under diverse lighting conditions [1,29,69,70]. The denser cellular matrix of T. spathacea might be an evolutionary response to high-light environments, promoting more efficient light capture and utility because of its compact cellular structure. This dense array could be particularly beneficial for obstructing excessive light penetration, which can be deleterious under strong irradiance [6,51,71].
The thickness of the hypodermis in these species underscores the divergent approaches for retaining water and structural integrity [11]. The thinner hypodermis of Tradescantia spathacea suggests a reduced structural investment, potentially to increase adaptability to environmental shifts, while the thicker hypodermis of Tradescantia pallida might offer greater mechanical support and moisture retention, indicative of an adaptation to more arid conditions [72,73,74]. Investigations into chloroplast density and spatial orientation have revealed the distinct photosynthetic strategies employed by each species. The increased chloroplast density of T. pallida could counterbalance its low chlorophyll content, suggesting a delicate equilibrium (homeostasis) to maximise the light absorption per cellular unit [75,76]. This assumption is bolstered by granum and thylakoid structures, which have evolved in tune with the specific lighting milieu of each species, boosting the energy conversion efficiency.
Chloroplast placement within the palisade parenchyma cells and organelle count per cell correlate with the photosynthetic capacity of each species at the subcellular level [20]. T. pallida may exhibit superior photosynthetic performance per cell owing to its elevated chloroplast density, potentially offsetting its reduced overall chlorophyll volume relative to that of T. spathacea species. Chloroplast positioning, along with granum stacks and a thylakoid architecture, manifests specific adaptations that augment light capture and energy transduction in energetic compounds (NADPH and ATP, see Figure 9C to JIP test parameters for details) [56,77,78].
Furthermore, the merger of anthocyanins, flavonoids, and additional phenolic substances in the epidermal and subepidermal layers suggests sophisticated photoprotection and antioxidant defence modalities [79,80,81]. These compounds can function as both ultraviolet radiation barriers and reactive oxygen species neutralisers under stress [79,82,83]. The integration of structural data with fluorescence kinetics clarified how Tradescantia species customise their energy conversion pathways by aligning them with their structural adaptations.
The differences in fluorescence induction kinetics and JIP test parameters across leaf surfaces highlight the influence of cellular and subcellular frameworks on the quantum yield of electron transport and potentially indicating stress or a higher capacity for non-photochemical quenching [2,68,84,85]. Such insights are vital for elucidating how structural attributes steer physiological processes, including photosynthesis and stress responses. The pronounced J and I phases of the ChlF curves on the adaxial side, with heightened anthocyanin, antioxidant, and phenolic contents, contrasted with the lower levels and diminished vacuole presence in the leaves, particularly under subdued pulsed light [86]. This result is consistent with HVI data and heatmap observations (Figure 10, Figure 11 and Figure 12), suggesting that structural changes in the epidermal and hypodermal cells of leaves could have a dual function: to act as light-focusing lenses, and to regulate light scattering out of the cell if not absorbed by regions with higher cellular chlorophyll levels detected by ChlF and spectroscopic curves (Figure 10 and Figure 11). For example, the light is drawn to a central point within this layer of leaves before it diverges and hits a layer of mesophyll beneath. As a result, the chloroplasts are not exposed to the intensified light at the focal point and the arrangements must be modulated in the granal and stromal thylakoids. The most striking instances of epidermal focusing can be seen in the leaves of tropical understory species. The leaves of plants like Anthurium and Begonia genus have a velvety look, an optical effect caused by the conical form of the epidermal cells. This conical shape also endows these cells with lens-like properties. While recent focus has been on these and other tropical species, epidermal focusing is also observed in temperate species. These measurements were irrespective of the adaxial or abaxial side and were reciprocally detected by sensors on both leaf surfaces (Figure 1).
The JIP-test, which measures the function of PSII, can provide various parameters, such as Ψ(EO), Ψ(RO), ϕ(PO), ϕ(EO), ϕ(RO), ϕ(DO), δRo, ρRo, Kn, Kp, SFI(abs), PI(abs), and D.F., that reflect different aspects of plant photosynthesis and health in T. spathacea and T. pallida, both adaxial and abaxial surfaces [19,52,62,63,64,65]. These parameters provide valuable information about photosynthetic performance (Figure 9C). For example, Ψ(EO) and ϕ(PO) indicate changes in photosynthetic efficiency, while δRo and SFI(abs) show how energy is dissipated within the photosystem and photoprotective in leaves [56,77,78].
Such contributions may reveal discrete adaptations in the response to biochemical and biophysical compositional changes. For instance, Tradescantia spathacea and Tradescantia pallida display significant differences in pigment concentration, spanning chlorophylls, carotenoids, anthocyanins, and flavonoids (Figure 1, Figure 2, Figure 3, Figure 4, Figure 5, Figure 6, Figure 7, Figure 8, Figure 9, Figure 10, Figure 11 and Figure 12). Although pigment concentrations disparities between these species are not as pronounced as those in other genera, such as Euphorbia, Croton, Phyllanthus, Acalypha, where pigment concentrations in green or purple leaves differ twentyfold, our results still confirm considerable variation [28,87]. Both species manifested similar scattering traits in the mid-infrared region but exhibited greater variations in the SWIR domain, concordant with other plants where leaf structural features influence light scattering, notwithstanding structural and ultrastructural alterations in plant cells.
4.3. Photosynthetic Strategies and Cellular Adaptations
The distribution and concentration of important biochemical constituents, such as chlorophylls, carotenoids, lignin, ferulic acid, and proteins, varies within the leaf architecture of Tradescantia spathacea and Tradescantia pallida (Figure 1, Figure 2, Figure 3, Figure 4, Figure 5, Figure 6, Figure 7, Figure 8, Figure 9, Figure 10, Figure 11 and Figure 12). Differential pigment accumulation not only augments the visual appearance of these species but also significantly contributes to primary and secondary metabolic processes within the leaves [12,88]. The kinetic fluorescence emission properties of chlorophyll a in Tradescantia leaves were similar to those of typical plant cells in high absorption areas [2,8,9,10,11,14]. However, regions with intensified pigment concentrations, such as those in purple leaves, exhibited altered absorbance and fluorescence emission owing to self-absorption across all measurement configurations [8,9,14].
The morphology of the adaxial and abaxial epidermal cells, as well as the respective hypodermal layers, profoundly influenced the light absorption and scattering qualities of the leaves [8,9,10]. Because of their distinct optical attributes, these cells function as pivotal barriers and regulators of light ingress. Such an architectural design is crucial in dictating light distribution across the leaf surface, consequently affecting photosynthetic efficiency and photoprotection mechanisms [89,90]. In both Tradescantia species, parenchymal cells encompassed within specific cellular frameworks were instrumental in defining plant photosynthetic capacities and xanthophyll cycle pigments and capacity for non-photochemical quenching changes.
Chloroplasts, as organelles housing essential pigments such as chlorophylls and carotenoids, are integral to light absorption for photosynthesis, whereas vacuoles contain anthocyanins and flavonoids for directional light scattering and photoprotection [17,34,68,91]. Varied chlorophyll a/b ratios and carotenoid quantities across species indicate differing approaches to light energy utilisation, possibly as an adaptive response to their distinct lighting environments [2,92,93]. Furthermore, the elevated anthocyanin and flavonoid levels in Tradescantia spathacea suggest a robust ability to mitigate UV damage and oxidative stress. These compounds, which are present in epidermal and hypodermal cells, filter out detrimental radiation while safeguarding the photosynthetic apparatus in the deeper tissue layers [68]. The pronounced presence of phenolic compounds in Tradescantia spathacea also signifies a formidable defence mechanism, affording antioxidant advantages that bolster the plant’s resistance to biotic and abiotic stressors [79,93,94,95]. This adaptive trait may enhance the resilience and ornamental value of T. spathacea, thereby increasing its versatility for cultivation in diverse environmental settings. Photochemical efficiency, gauged by radical scavenging activity, demonstrated the heightened radical scavenging capacity of T. spathacea, implying the potential for superior antioxidant activity within this species (Figure 5O). This was corroborated by the higher phenolic compound concentration and radical scavenging per base area in T. spathacea, which significantly surpassed that in T. pallida (Figure 5P), indicating distinct interspecies differences (p < 0.01). Overall, Tradescantia pallida harboured lower concentrations of these bioactive compounds despite its darker hue [8,9,10,11]. This finding suggests that assessing visual intensity does not necessarily reflect the actual levels of bioactive compounds and their antioxidant activities [2,92,93]. It is possible that other factors, not evaluated in this study, might significantly alter the spectral signatures. This highlights the need for further research, not only to determine the pigment composition visible but also to explore the contribution and arrangement of these pigments in the leaf optical profile [2,55,56,57,58]. Such research should consider their relationship with structures, locations, and arrangements, thereby emphasizing the importance of the SWIR (Short-Wave Infrared) bands in determining the spectral fingerprints of leaves.
4.4. Interaction Implications of Adaxial and Abaxial Cell Surfaces in Leaves
The understanding of pigment-based adaptations in ornamental plants sets the stage for further research on how these adaptation pathways respond to ultrastructural challenges [8,9,10,11,14]. For example, analysis of pigment distribution on the upper and lower leaf surfaces, along with the role of cellular components in pigment localisation, provides crucial insights into the intricate interplay between plant structure and biochemical pathways for mesophyll cells for adaptation [96].
In summary, the unique pigment profiles and associated biochemical and biophysical properties observed in Tradescantia spathacea and Tradescantia pallida contribute significantly to our knowledge of plant adaptation mechanisms [79,93,94,95]. This refined understanding has important ramifications for horticulture, particularly for the cultivation and breeding of ornamental plants, and opens new avenues for exploring plant stress physiology and ecological resilience in other genera and families of plants.
Environmental stressors such as high light intensity, salinity, and drought are known to reduce the activity of PSII electron transport in vivo [29,97,98]. Our findings suggest that leaf structural changes under environmental stress, such as cellular miniaturisation and less prominent columnar cells, might enhance the refraction of incident light, thereby affecting the J and I phases of the chlorophyll fluorescence induction (ChlF) curves and potentially reducing photosynthetic electron transport activity, as suggested by the JIP test parameters. Alterations in PSII activity can be gauged more accurately by accounting for the potential influence of leaf structure on light refraction. Thus, earlier research may not have fully captured the extent of PSII electron transport activity changes under various stress conditions, based on the presence of vacuoles in cells.
Differences or variations in leaf structure could influence the configuration of ChlF curves in Tradescantia leaves, which in turn might affect the assessment of PSII electron transport activity. This hypothesis is supported by the absorption spectra and HVI correlation patterns shown in Figure 8, which revealed significant differences in the reflectance, transmittance, and absorbance between the adaxial and abaxial leaf surfaces. Moreover, spectral absorption profiles (Figure 10) and chlorophyll fluorescence mapping (Figure 11) corroborated this finding, illustrating that the physiological and structural nuances of leaves are strongly related to functional photosynthetic parameters. These findings were further reflected in the heatmap data correlations (Figure 12), providing a comprehensive understanding that transcends chlorophyll activity [19,79,93,94,95].
Further work is required to understand the interaction process between cells and the leaf profile and fluorescence based on variations, such as in albino leaves or those that accumulate anthocyanins solely in plant cells, and how this interaction affects cellular biology and, therefore, the stress responses of developing organs when fingerprints are evidenced in spectral and fluorescence curves. The data presented here suggest that the answer lies, at least in part, in changes in the metabolism of phenolic compounds, such as anthocyanins, flavonoids, antioxidant capacity, and phenolic compounds, but also in structural modifications of the leaf, such as the cellular wall and organelles that are accelerated by processing leading to genetic, molecular and metabolic reprogramming aligned with changes in the leaf’s optical profile.
5. Conclusions
This study explored the integration of hyperspectral and chlorophyll a fluorescence kinetics sensors to analyse biophysical and biochemical patterns, focusing on the structural and ultrastructural differences in the optical leaf patterns of the two Tradescantia species. The data demonstrated a clear correlation between the hyperspectral readings and chlorophyll fluorescence (ChlF) parameters using hyperspectral vegetation indices (HVIs) that aligned the biophysical parameters, revealing a hypoderm with modified fingerprints in the spectral curves. The developed models were highly precise and underscore the efficacy of the multivariate statistical methods employed. Specifically, spectral regions ranging from ultraviolet and blue in the VIS bands to shortwave infrared and SWIR bands proved essential for non-invasive assessments of plant physiology, particularly those associated with significant modifications in the hypodermal cells influencing the hyperspectral fluorescence curves of these plants.
The use of HVIs is crucial for selecting appropriate wavelengths, which leads to enhanced predictive outcomes in estimating cellular changes, including cell surface changes in adaxial and abaxial leaves. The accuracy achieved by these measure underscores the promising role of hyperspectral sensors in advancing our understanding of plant photosynthesis and the distribution of purple pigments in the leaves.
For future research, it would be beneficial to expand the study to include a wider variety of plant species and to incorporate additional analytical methods. This approach enhanced the accuracy and applicability of hyperspectral sensors in plant biology. Moreover, evaluating this approach in diverse field settings may provide further insight into its consistency and versatility, particularly for other plants that accumulate secondary metabolic compounds and possess variegated leaves.
Supplementary Materials
The following supporting information can be downloaded at: https://www.mdpi.com/article/10.3390/cells13110952/s1, Figure S1. Spectral analysis of leaves (in vivo) in Tradescantia spathacea (L.) Olof Swartz and Tradescantia pallida (Rose) D.R. Hunt plants. (A) Reflectance factor (Ref) from 350 to 800 nm. (B) Transmittance factor (trans) from 350 to 800 nm. (C) Absorbance factor (Abs) from 350 to 800 nm. The solid and dashed black lines represent the measurements from the adaxial and abaxial surfaces of the leaves of Tradescantia species, respectively. (n = 100).
Author Contributions
Conceptualization, R.F.; Data curation, R.F. and M.R.N.; Formal analysis, R.F., W.C.A., J.A.M.D. and M.R.N.; Funding acquisition, R.F. and M.R.N.; Investigation, R.F.; Methodology, R.F., W.C.A., R.B.d.O., M.L.C., J.A.M.D. and M.R.N.; Project administration, R.F. and M.R.N.; Resources, R.F. and R.B.d.O.; Software, R.F., R.B.d.O., M.L.C., J.A.M.D. and M.R.N.; Supervision, R.F. and M.R.N.; Validation, R.F., R.B.d.O., M.L.C., J.A.M.D. and M.R.N.; Visualization, R.F., W.C.A. and M.R.N.; Writing—original draft, R.F., W.C.A., R.B.d.O., M.L.C., J.A.M.D. and M.R.N.; Writing—review & editing, R.F., W.C.A., R.B.d.O., M.L.C., J.A.M.D. and M.R.N. All authors have read and agreed to the published version of the manuscript.
Funding
This research received external funding from the National Council for Scientific and Technological Development: Programa de Apoio à Fixação de Jovens Doutores no Brasil 168180/2022-7; Fundação Araucária: CP 19/2022—Jovens Doutores; Fundação Araucária: N° 244/2023—PDI; Coordenação de Aperfeiçoamento de Pessoal de Nível Superior: 001; Fundação de Amparo à Pesquisa do Estado de São Paulo, FAPESP pn 2021/05129-8 for sensor financial support. CEAGRE—Centro de Excelência em Agricultura Exponencial for financial support.
Data Availability Statement
Data are contained within the article and Supplementary Materials.
Acknowledgments
We also express our gratitude to the Programa de Pós–Graduação em Agronomia (PGA–UEM) and COMCAP of the State University of Maringá.
Conflicts of Interest
The authors declare no conflicts of interest. The funders had no role in the study design, collection, analyses, interpretation of the data, writing of the manuscript, or decision to publish the results.
References
- Henry, R.J.; Furtado, A.; Rangan, P. Pathways of Photosynthesis in Non-Leaf Tissues. Biology 2020, 9, 438. [Google Scholar] [CrossRef]
- Falcioni, R.; Antunes, W.C.; Demattê, J.A.M.; Nanni, M.R. Biophysical, Biochemical, and Photochemical Analyses Using Reflectance Hyperspectroscopy and Chlorophyll a Fluorescence Kinetics in Variegated Leaves. Biology 2023, 12, 704. [Google Scholar] [CrossRef]
- Mélida, H.; Largo-Gosens, A.; Novo-Uzal, E.; Santiago, R.; Pomar, F.; García, P.; García-Angulo, P.; Acebes, J.L.; Álvarez, J.; Encina, A. Ectopic Lignification in Primary Cellulose-Deficient Cell Walls of Maize Cell Suspension Cultures. J. Integr. Plant Biol. 2015, 57, 357–372. [Google Scholar] [CrossRef] [PubMed]
- Glińska, S.; Gabara, B. The Effects of the Anthocyanin-Rich Extract from Red Cabbage Leaves on Allium cepa L. Root Tip Cell Ultrastructure. Ecotoxicol. Environ. Saf. 2011, 74, 93–98. [Google Scholar] [CrossRef] [PubMed]
- Huang, J.; Wei, C.; Zhang, Y.; Blackburn, G.A.; Wang, X.; Wei, C.; Wang, J. Meta-Analysis of the Detection of Plant Pigment Concentrations Using Hyperspectral Remotely Sensed Data. PLoS ONE 2015, 10, e0137029. [Google Scholar] [CrossRef]
- Blackburn, G.A. Hyperspectral Remote Sensing of Plant Pigments. J. Exp. Bot. 2007, 58, 855–867. [Google Scholar] [CrossRef]
- Gitelson, A.; Solovchenko, A.; Viña, A. Foliar Absorption Coefficient Derived from Reflectance Spectra: A Gauge of the Efficiency of in Situ Light-Capture by Different Pigment Groups. J. Plant Physiol. 2020, 254, 153277. [Google Scholar] [CrossRef]
- Antonio, É.; Paiva, S.; Mary, R.; Henrique, F.; Vale, A. The Influence of Light Intensity on Anatomical Structure and Pigment Contents of Tradescantia pallida (Rose) Hunt. Cv. Purpurea Boom (Commelinaceae) Leaves. Braz. Arch. Biol. Technol. 2003, 46, 617–624. [Google Scholar]
- Bercu, R. Histoanatomical Study on the Vegetative Organs of Tradescantia spathacea (Commelinaceae). Bot. Serbica 2013, 37, 121–126. [Google Scholar]
- Chimpan, C.; Sipos, M. Anatomy of the Vegetative Organs of Tradescantia Pallida Purpurea. Biharean Biol. 2009, 3, 1–4. [Google Scholar]
- Cuba, N.I.; Torres, R.; San Román, E.; Lagorio, M.G. Influence of Surface Structure, Pigmentation and Particulate Matter on Plant Reflectance and Fluorescence. Photochem. Photobiol. 2021, 97, 110–121. [Google Scholar] [CrossRef] [PubMed]
- Pierce, S.; Maffi, D.; Faoro, F.; Cerabolini, B.E.L.; Spada, A. The Leaf Anatomical Trade-Offs Associated with Plant Ecological Strategy Variation. Plant Ecol. 2022, 223, 1233–1246. [Google Scholar] [CrossRef]
- Shabala, S.N.; Lew, R.R. Turgor Regulation in Osmotically Stressed Arabidopsis Epidermal Root Cells. Direct Support for the Role of Cell Turgor Measurement. Plant Physiol. 2002, 129, 290–299. [Google Scholar] [CrossRef] [PubMed]
- Ptushenko, V.V.; Ptushenko, O.S.; Samoilova, O.P.; Solovchenko, A.E. Analysis of Photoprotection and Apparent Non-Photochemical Quenching of Chlorophyll Fluorescence in Tradescantia Leaves Based on the Rate of Irradiance-Induced Changes in Optical Transparence. Biochemistry 2017, 82, 67–74. [Google Scholar] [CrossRef] [PubMed]
- Gill, S.S.; Tuteja, N. Reactive Oxygen Species and Antioxidant Machinery in Abiotic Stress Tolerance in Crop Plants. Plant Physiol. Biochem. 2010, 48, 909–930. [Google Scholar] [CrossRef] [PubMed]
- Zhang, D.W.; Yuan, S.; Xu, F.; Zhu, F.; Yuan, M.; Ye, H.X.; Guo, H.Q.; Lv, X.; Yin, Y.; Lin, H.H. Light Intensity Affects Chlorophyll Synthesis during Greening Process by Metabolite Signal from Mitochondrial Alternative Oxidase in Arabidopsis. Plant Cell Environ. 2016, 39, 12–25. [Google Scholar] [CrossRef] [PubMed]
- Merzlyak, M.N.; Chivkunova, O.B.; Melø, T.B.; Naqvi, K.R. Does a Leaf Absorb Radiation in the near Infrared (780-900 Nm) Region? A New Approach to Quantifying Optical Reflection, Absorption and Transmission of Leaves. Photosynth. Res. 2002, 72, 263–270. [Google Scholar] [CrossRef]
- Gould, K.S.; Jay-Allemand, C.; Logan, B.A.; Baissac, Y.; Bidel, L.P.R. When Are Foliar Anthocyanins Useful to Plants? Re-Evaluation of the Photoprotection Hypothesis Using Arabidopsis Thaliana Mutants That Differ in Anthocyanin Accumulation. Environ. Exp. Bot. 2018, 154, 11–22. [Google Scholar] [CrossRef]
- Falcioni, R.; Antunes, W.C.; de Oliveira, R.B.; Chicati, M.L.; Demattê, J.A.M.; Nanni, M.R. Assessment of Combined Reflectance, Transmittance, and Absorbance Hyperspectral Sensors for Prediction of Chlorophyll a Fluorescence Parameters. Remote Sens. 2023, 15, 5067. [Google Scholar] [CrossRef]
- Colpo, A.; Molinari, A.; Boldrini, P.; Živčak, M.; Brestič, M.; Demaria, S.; Baldisserotto, C.; Pancaldi, S.; Ferroni, L. Thylakoid Membrane Appression in the Giant Chloroplast of Selaginella martensii Spring: A Lycophyte Challenges Grana Paradigms in Shade-Adapted Species. Plant Sci. 2023, 336, 111833. [Google Scholar] [CrossRef]
- Rodrigues, M.; Berti de Oliveira, R.; dos Santos, G.L.A.A.; Mayara de Oliveira, K.; Silveira Reis, A.; Herrig Furlanetto, R.; Antônio Yanes Bernardo Júnior, L.; Silva Coelho, F.; Rafael Nanni, M. Rapid Quantification of Alkaloids, Sugar and Yield of Tobacco (Nicotiana tabacum L.) Varieties by Using Vis–NIR–SWIR Spectroradiometry. Spectrochim. Acta Part A Mol. Biomol. Spectrosc. 2022, 274, 121082. [Google Scholar] [CrossRef] [PubMed]
- Féret, J.-B.; le Maire, G.; Jay, S.; Berveiller, D.; Bendoula, R.; Hmimina, G.; Cheraiet, A.; Oliveira, J.C.; Ponzoni, F.J.; Solanki, T.; et al. Estimating Leaf Mass per Area and Equivalent Water Thickness Based on Leaf Optical Properties: Potential and Limitations of Physical Modeling and Machine Learning. Remote Sens. Environ. 2019, 231, 110959. [Google Scholar] [CrossRef]
- Hassanzadeh, A.; Murphy, S.P.; Pethybridge, S.J.; van Aardt, J. Growth Stage Classification and Harvest Scheduling of Snap Bean Using Hyperspectral Sensing: A Greenhouse Study. Remote Sens. 2020, 12, 3809. [Google Scholar] [CrossRef]
- Crusiol, L.G.T.; Sun, L.; Sun, Z.; Chen, R.; Wu, Y.; Ma, J.; Song, C. In-Season Monitoring of Maize Leaf Water Content Using Ground-Based and UAV-Based Hyperspectral Data. Sustainability 2022, 14, 9039. [Google Scholar] [CrossRef]
- Braga, P.; Crusiol, L.G.T.; Nanni, M.R.; Caranhato, A.L.H.; Fuhrmann, M.B.; Nepomuceno, A.L.; Neumaier, N.; Farias, J.R.B.; Koltun, A.; Gonçalves, L.S.A.; et al. Vegetation Indices and NIR-SWIR Spectral Bands as a Phenotyping Tool for Water Status Determination in Soybean. Precis. Agric. 2021, 22, 249–266. [Google Scholar] [CrossRef]
- Falcioni, R.; Moriwaki, T.; Perez-Llorca, M.; Munné-Bosch, S.; Gibin, M.S.; Sato, F.; Pelozo, A.; Pattaro, M.C.; Giacomelli, M.E.; Rüggeberg, M.; et al. Cell Wall Structure and Composition Is Affected by Light Quality in Tomato Seedlings. J. Photochem. Photobiol. B Biol. 2020, 203, 111745. [Google Scholar] [CrossRef] [PubMed]
- Falcioni, R.; Moriwaki, T.; Furlanetto, R.H.; Nanni, M.R.; Antunes, W.C. Simple, Fast and Efficient Methods for Analysing the Structural, Ultrastructural and Cellular Components of the Cell Wall. Plants 2022, 11, 995. [Google Scholar] [CrossRef] [PubMed]
- Radotić, K.; Melø, T.B.; Lindgren, M. A Fluorescence Spectroscopic Study of Light Transmission and Adaxial-Abaxial Distribution of Emitting Compounds in Leaves of Christmas Star (Euphorbia pulcherrima). Spectrochim. Acta Part A Mol. Biomol. Spectrosc. 2023, 303, 123269. [Google Scholar] [CrossRef] [PubMed]
- Chaudhry, S.; Sidhu, G.P.S. Climate Change Regulated Abiotic Stress Mechanisms in Plants: A Comprehensive Review. Plant Cell Rep. 2022, 41, 1–31. [Google Scholar] [CrossRef]
- Cordón, G.B.; Lagorio, M.G. Optical Properties of the Adaxial and Abaxial Faces of Leaves. Chlorophyll Fluorescence, Absorption and Scattering Coefficients. Photochem. Photobiol. Sci. 2007, 6, 873–882. [Google Scholar] [CrossRef]
- Falcioni, R.; Antunes, W.C.; Demattê, J.A.M.; Nanni, M.R. Reflectance Spectroscopy for the Classification and Prediction of Pigments in Agronomic Crops. Plants 2023, 12, 2347. [Google Scholar] [CrossRef] [PubMed]
- Falcioni, R.; Moriwaki, T.; Pattaro, M.; Herrig Furlanetto, R.; Nanni, M.R.; Camargos Antunes, W. High Resolution Leaf Spectral Signature as a Tool for Foliar Pigment Estimation Displaying Potential for Species Differentiation. J. Plant Physiol. 2020, 249, 153161. [Google Scholar] [CrossRef] [PubMed]
- Falcioni, R.; Antunes, W.C.; Demattê, J.A.M.; Nanni, M.R. A Novel Method for Estimating Chlorophyll and Carotenoid Concentrations in Leaves: A Two Hyperspectral Sensor Approach. Sensors 2023, 23, 3843. [Google Scholar] [CrossRef] [PubMed]
- Gitelson, A.; Solovchenko, A. Non-Invasive Quantification of Foliar Pigments: Possibilities and Limitations of Reflectance- and Absorbance-Based Approaches. J. Photochem. Photobiol. B Biol. 2018, 178, 537–544. [Google Scholar] [CrossRef] [PubMed]
- Lichtenthaler, H.K.; Wellburn, A.R. Determinations of Total Carotenoids and Chlorophylls a and b of Leaf Extracts in Different Solvents. Biochem. Soc. Trans. 1983, 11, 591–592. [Google Scholar] [CrossRef]
- Llorach, R.; Martínez-Sánchez, A.; Tomás-Barberán, F.A.; Gil, M.I.; Ferreres, F. Characterisation of Polyphenols and Antioxidant Properties of Five Lettuce Varieties and Escarole. Food Chem. 2008, 108, 1028–1038. [Google Scholar] [CrossRef] [PubMed]
- Ragaee, S. Antioxidant Activity and Nutrient Composition of Selected Cereals for Food Use. Food Chem. 2006, 98, 32–38. [Google Scholar] [CrossRef]
- Kalaji, H.M.; Bosa, K.; Kościelniak, J.; Hossain, Z. Chlorophyll a Fluorescence—A Useful Tool for the Early Detection of Temperature Stress in Spring Barley (Hordeum vulgare L.). Omi. A J. Integr. Biol. 2011, 15, 925–934. [Google Scholar] [CrossRef] [PubMed]
- Stirbet, A.; Lazár, D.; Kromdijk, J. Govindjee Chlorophyll a Fluorescence Induction: Can Just a One-Second Measurement Be Used to Quantify Abiotic Stress Responses? Photosynthetica 2018, 56, 86–104. [Google Scholar] [CrossRef]
- Sitko, K.; Rusinowski, S.; Kalaji, H.M.; Szopiński, M.; Małkowski, E. Photosynthetic Efficiency as Bioindicator of Environmental Pressure in A. Halleri. Plant Physiol. 2017, 175, 290–302. [Google Scholar] [CrossRef]
- Karnovsky, M.J. A formaldehyde-glutaraldehyde fixative of high osmolality for use in electron-microscopy. J. Cell Biol. 1965, 27, 1A–149A. [Google Scholar]
- Kraus, J.E.; de Sousa, H.C.; Rezende, M.H.; Castro, N.M.; Vecchi, C.; Luque, R. Astra Blue and Basic Fuchsin Double Staining of Plant Materials. Biotech. Histochem. 1998, 73, 235–243. [Google Scholar] [CrossRef] [PubMed]
- Reynolds, E.S. The Use of Lead Citrate at High PH as an Electron-Opaque Stain in Electron Microscopy. J. Cell Biol. 1963, 17, 208–212. [Google Scholar] [CrossRef] [PubMed]
- Zar, J.H. Biostatistical Analysis, 5th ed.; Pearson Education: Upper Saddle River, NJ, USA, 2010; ISBN 0-13-100846-3. [Google Scholar]
- Jolliffe, I.; Cadima, J. Principal Component Analysis: A Review and Recent Developments. Philos. Trans. R. Soc. A Math. Phys. Eng. Sci. 2016, 374, 20150202. [Google Scholar] [CrossRef] [PubMed]
- Hichri, I.; Barrieu, F.; Bogs, J.; Kappel, C.; Delrot, S.; Lauvergeat, V. Recent Advances in the Transcriptional Regulation of the Flavonoid Biosynthetic Pathway. J. Exp. Bot. 2011, 62, 2465–2483. [Google Scholar] [CrossRef] [PubMed]
- Zhang, N.; Sun, Q.; Li, H.; Li, X.; Cao, Y.; Zhang, H.; Li, S.; Zhang, L.; Qi, Y.; Ren, S.; et al. Melatonin Improved Anthocyanin Accumulation by Regulating Gene Expressions and Resulted in High Reactive Oxygen Species Scavenging Capacity in Cabbage. Front. Plant Sci. 2016, 7, 197. [Google Scholar] [CrossRef] [PubMed]
- Stecha, S.; Ueda, T.; Bohorquez-Restrepo, A.; Chanoca, A.; Eliceiri, K.W.; Burkel, B.; Kovinich, N.; Otegui, M.S.; Grotewold, E. Anthocyanin Vacuolar Inclusions Form by a Microautophagy Mechanism. Plant Cell 2015, 27, 2545–2559. [Google Scholar]
- Heredia-Guerrero, J.A.; Benítez, J.J.; Domínguez, E.; Bayer, I.S.; Cingolani, R.; Athanassiou, A.; Heredia, A. Infrared and Raman Spectroscopic Features of Plant Cuticles: A Review. Front. Plant Sci. 2014, 5, 305. [Google Scholar] [CrossRef] [PubMed]
- Kycko, M.; Zagajewski, B.; Lavender, S.; Dabija, A. In Situ Hyperspectral Remote Sensing for Monitoring of Alpine Trampled and Recultivated Species. Remote Sens. 2019, 11, 1296. [Google Scholar] [CrossRef]
- Merzlyak, M.N.; Solovchenko, A.E.; Smagin, A.I.; Gitelson, A.A. Apple Flavonols during Fruit Adaptation to Solar Radiation: Spectral Features and Technique for Non-Destructive Assessment. J. Plant Physiol. 2005, 162, 151–160. [Google Scholar] [CrossRef]
- Nogales-Bueno, J.; Baca-Bocanegra, B.; Rooney, A.; Miguel Hernández-Hierro, J.; José Heredia, F.; Byrne, H.J. Linking ATR-FTIR and Raman Features to Phenolic Extractability and Other Attributes in Grape Skin. Talanta 2017, 167, 44–50. [Google Scholar] [CrossRef]
- Osman, S.O.M.; Saad, A.S.I.; Tadano, S.; Takeda, Y.; Konaka, T.; Yamasaki, Y.; Tahir, I.S.A.; Tsujimoto, H.; Akashi, K. Chemical Fingerprinting of Heat Stress Responses in the Leaves of Common Wheat by Fourier Transform Infrared Spectroscopy. Int. J. Mol. Sci. 2022, 23, 2842. [Google Scholar] [CrossRef] [PubMed]
- Fernandes, A.M.; Fortini, E.A.; Müller, L.A.d.C.; Batista, D.S.; Vieira, L.M.; Silva, P.O.; Amaral, C.H.; Poethig, R.S.; Otoni, W.C. Leaf Development Stages and Ontogenetic Changes in Passionfruit (Passiflora edulis Sims.) Are Detected by Narrowband Spectral Signal. J. Photochem. Photobiol. B Biol. 2020, 209, 111931. [Google Scholar] [CrossRef]
- Cotrozzi, L.; Lorenzini, G.; Nali, C.; Pellegrini, E.; Saponaro, V.; Hoshika, Y.; Arab, L.; Rennenberg, H.; Paoletti, E. Hyperspectral Reflectance of Light-Adapted Leaves Can Predict Both Dark- and Light-Adapted Chl Fluorescence Parameters, and the Effects of Chronic Ozone Exposure on Date Palm (Phoenix dactylifera). Int. J. Mol. Sci. 2020, 21, 6441. [Google Scholar] [CrossRef]
- Xiao, Y.; Tholen, D.; Zhu, X.G. The Influence of Leaf Anatomy on the Internal Light Environment and Photosynthetic Electron Transport Rate: Exploration with a New Leaf Ray Tracing Model. J. Exp. Bot. 2016, 67, 6021–6035. [Google Scholar] [CrossRef]
- Fu, P.; Meacham-Hensold, K.; Guan, K.; Bernacchi, C.J. Hyperspectral Leaf Reflectance as Proxy for Photosynthetic Capacities: An Ensemble Approach Based on Multiple Machine Learning Algorithms. Front. Plant Sci. 2019, 10, 730. [Google Scholar] [CrossRef]
- El-Hendawy, S.; Al-Suhaibani, N.; Mubushar, M.; Tahir, M.U.; Marey, S.; Refay, Y.; Tola, E. Combining Hyperspectral Reflectance and Multivariate Regression Models to Estimate Plant Biomass of Advanced Spring Wheat Lines in Diverse Phenological Stages under Salinity Conditions. Appl. Sci. 2022, 12, 1983. [Google Scholar] [CrossRef]
- Wang, L.; Ran, L.; Hou, Y.; Tian, Q.; Li, C.; Liu, R.; Fan, D.; Luo, K. The Transcription Factor MYB115 Contributes to the Regulation of Proanthocyanidin Biosynthesis and Enhances Fungal Resistance in Poplar. New Phytol. 2017, 215, 351–367. [Google Scholar] [CrossRef] [PubMed]
- Aluru, M.R.; Zola, J.; Foudree, A.; Rodermel, S.R. Chloroplast Photooxidation-Induced Transcriptome Reprogramming in Arabidopsis Immutans White Leaf Sectors. Plant Physiol. 2009, 150, 904–923. [Google Scholar] [CrossRef] [PubMed]
- Ďúranová, H.; Šimora, V.; Ďurišová, Ľ.; Olexiková, L.; Kovár, M.; Požgajová, M. Modifications in Ultrastructural Characteristics and Redox Status of Plants under Environmental Stress: A Review. Plants 2023, 12, 1666. [Google Scholar] [CrossRef]
- Iqbal, I.M.; Balzter, H.; Firdaus-e-Bareen; Shabbir, A. Identifying the Spectral Signatures of Invasive and Native Plant Species in Two Protected Areas of Pakistan through Field Spectroscopy. Remote Sens. 2021, 13, 4009. [Google Scholar] [CrossRef]
- Olmos, V.; Marro, M.; Loza-Alvarez, P.; Raldúa, D.; Prats, E.; Padrós, F.; Piña, B.; Tauler, R.; de Juan, A. Combining Hyperspectral Imaging and Chemometrics to Assess and Interpret the Effects of Environmental Stressors on Zebrafish Eye Images at Tissue Level. J. Biophotonics 2018, 11, e201700089. [Google Scholar] [CrossRef] [PubMed]
- Ruban, A.V.; Wilson, S. The Mechanism of Non-Photochemical Quenching in Plants: Localization and Driving Forces. Plant Cell Physiol. 2021, 62, 1063–1072. [Google Scholar] [CrossRef] [PubMed]
- Gupta, R. Tissue Specific Disruption of Photosynthetic Electron Transport Rate in Pigeonpea (Cajanus cajan L.) under Elevated Temperature. Plant Signal. Behav. 2019, 14, 1601952. [Google Scholar] [CrossRef] [PubMed]
- Ouzounis, T.; Rosenqvist, E.; Ottosen, C.O. Spectral Effects of Artificial Light on Plant Physiology and Secondary Metabolism: A Review. HortScience 2015, 50, 1128–1135. [Google Scholar] [CrossRef]
- Almeida Rodrigues, A.; Carvalho Vasconcelos Filho, S.; Müller, C.; Almeida Rodrigues, D.; de Fátima Sales, J.; Zuchi, J.; Carlos Costa, A.; Lino Rodrigues, C.; Alves da Silva, A.; Pereira Barbosa, D. Tolerance of Eugenia dysenterica to Aluminum: Germination and Plant Growth. Plants 2019, 8, 317. [Google Scholar] [CrossRef] [PubMed]
- Zou, Q.-Q.; Liu, D.-H.; Sang, M.; Jiang, C.-D. Sunflower Leaf Structure Affects Chlorophyll a Fluorescence Induction Kinetics In Vivo. Int. J. Mol. Sci. 2022, 23, 14996. [Google Scholar] [CrossRef] [PubMed]
- Valladares, F.; Niinemets, Ü. Shade Tolerance, a Key Plant Feature of Complex Nature and Consequences. Annu. Rev. Ecol. Evol. Syst. 2008, 39, 237–257. [Google Scholar] [CrossRef]
- Gould, K.S. Nature’s Swiss Army Knife: The Diverse Protective Roles of Anthocyanins in Leaves. J. Biomed. Biotechnol. 2004, 2004, 314–320. [Google Scholar] [CrossRef]
- Fukuda, N.; Ajima, C.; Yukawa, T.; Olsen, J.E. Antagonistic Action of Blue and Red Light on Shoot Elongation in Petunia Depends on Gibberellin, but the Effects on Flowering Are Not Generally Linked to Gibberellin. Environ. Exp. Bot. 2016, 121, 102–111. [Google Scholar] [CrossRef]
- Weng, J.-K.; Chapple, C. The Origin and Evolution of Lignin Biosynthesis. New Phytol. 2010, 187, 273–285. [Google Scholar] [CrossRef]
- Kimura, H.; Hashimoto-Sugimoto, M.; Iba, K.; Terashima, I.; Yamori, W. Improved Stomatal Opening Enhances Photosynthetic Rate and Biomass Production in Fluctuating Light. J. Exp. Bot. 2020, 71, 2339–2350. [Google Scholar] [CrossRef] [PubMed]
- Lawlor, D. Limitation to Photosynthesis in Water-Stressed Leaves: Stomata vs. Metabolism and the Role of ATP. Ann. Bot. 2002, 89, 871–885. [Google Scholar] [CrossRef]
- Enriquez, S.; Sand-Jensen, K. Variation in Light Absorption Properties of Mentha aquatica L. as a Function of Leaf Form: Implications for Plant Growth. Int. J. Plant Sci. 2003, 164, 125–136. [Google Scholar] [CrossRef]
- Vialet-Chabrand, S.R.; Matthews, J.S.; Simkin, A.; Raines, C.A.; Lawson, T. Importance of Fluctuations in Light on Plant Photosynthetic Acclimation. Plant Physiol. 2017, 173, 2163–2179. [Google Scholar] [CrossRef]
- Kume, A. Importance of the Green Color, Absorption Gradient, and Spectral Absorption of Chloroplasts for the Radiative Energy Balance of Leaves. J. Plant Res. 2018, 131, 501–514. [Google Scholar] [CrossRef] [PubMed]
- Bykowski, M.; Mazur, R.; Wójtowicz, J.; Suski, S.; Garstka, M.; Mostowska, A.; Kowalewska, Ł. Too Rigid to Fold: Carotenoid-Dependent Decrease in Thylakoid Fluidity Hampers the Formation of Chloroplast Grana. Plant Physiol. 2021, 185, 210–227. [Google Scholar] [CrossRef]
- Landi, M.; Tattini, M.; Gould, K.S. Multiple Functional Roles of Anthocyanins in Plant-Environment Interactions. Environ. Exp. Bot. 2015, 119, 4–17. [Google Scholar] [CrossRef]
- Quina, F.H.; Moreira, P.F.; Vautier-Giongo, C.; Rettori, D.; Rodrigues, R.F.; Freitas, A.A.; Silva, P.F.; Maçanita, A.L. Photochemistry of Anthocyanins and Their Biological Role in Plant Tissues. Pure Appl. Chem. 2009, 81, 1687–1694. [Google Scholar] [CrossRef]
- Neil, S.O.; Gould, K.S. Anthocyanins in Leaves: Light Attenuators or Antioxidants? Funct. Plant Biol. 2003, 30, 865–873. [Google Scholar] [CrossRef]
- Varghese, N.; Alyammahi, O.; Nasreddine, S.; Alhassani, A.; Gururani, M.A. Melatonin Positively Influences the Photosynthetic Machinery and Antioxidant System of Avena Sativa during Salinity Stress. Plants 2019, 8, 610. [Google Scholar] [CrossRef] [PubMed]
- Gu, J.; Zhou, Z.; Li, Z.; Chen, Y.; Wang, Z.; Zhang, H. Photosynthetic Properties and Potentials for Improvement of Photosynthesis in Pale Green Leaf Rice under High Light Conditions. Front. Plant Sci. 2017, 8, 1082. [Google Scholar] [CrossRef] [PubMed]
- Gamon, J.A.; Surfus, J.S. Assessing Leaf Pigment Content and Activity with a Reflectometer. New Phytol. 1999, 143, 105–117. [Google Scholar] [CrossRef]
- Subhash, N.; Mohanan, C.N. Curve-Fit Analysis of Chlorophyll Fluorescence Spectra: Application to Nutrient Stress Detection in Sunflower. Remote Sens. Environ. 1997, 60, 347–356. [Google Scholar] [CrossRef]
- Lang, M.; Stober, F.; Lichtenthaler, H.K. Fluorescence Emission Spectra of Plant Leaves and Plant Constituents. Radiat. Environ. Biophys. 1991, 30, 333–347. [Google Scholar] [CrossRef] [PubMed]
- Manjunatha, B.; Mohiddin, G.; Ortiz, J.; Selvanayagam, M. International Journal of Pharmacology and Pharmaceutical Sciences. Int. J. Pharmacol. 2014, 2, 7–15. [Google Scholar]
- Ndlovu, E.; van Staden, J.; Maphosa, M. Morpho-Physiological Effects of Moisture, Heat and Combined Stresses on Sorghum bicolor [Moench (L.)] and Its Acclimation Mechanisms. Plant Stress 2021, 2, 100018. [Google Scholar] [CrossRef]
- Terashima, I.; Hiroki, O.; Takashi, F.; Riichi, O. Light Environment within a Leaf. II. Progress in the Past One-Third Century. J. Plant Res. 2016, 129, 353–363. [Google Scholar]
- Hatier, J.H.B.; Gould, K.S. Black Coloration in Leaves of Ophiopogon planiscapus “Nigrescens”. Leaf Optics, Chromaticity, and Internal Light Gradients. Funct. Plant Biol. 2007, 34, 130–138. [Google Scholar] [CrossRef]
- Gitelson, A.; Chivkunova, O.; Zhigalova, T.; Solovchenko, A. In Situ Optical Properties of Foliar Flavonoids: Implication for Non-Destructive Estimation of Flavonoid Content. J. Plant Physiol. 2017, 218, 258–264. [Google Scholar] [CrossRef]
- Merzlyak, M.N.; Gitelson, A.A.; Chivkunova, O.B.; Rakitin, V.Y.U. Non-Destructive Optical Detection of Pigment Changes during Leaf Senescence and Fruit Ripening. Physiol. Plant. 1999, 106, 135–141. [Google Scholar] [CrossRef]
- Guidi, L.; Lo Piccolo, E.; Landi, M. Chlorophyll Fluorescence, Photoinhibition and Abiotic Stress: Does It Make Any Difference the Fact to Be a C3 or C4 Species? Front. Plant Sci. 2019, 10, 174. [Google Scholar] [CrossRef] [PubMed]
- Lichtenthaler, H.K. Vegetation Stress: An Introduction to the Stress Concept in Plants. J. Plant Physiol. 1996, 148, 4–14. [Google Scholar] [CrossRef]
- Roeber, V.M.; Bajaj, I.; Rohde, M.; Schmülling, T.; Cortleven, A. Light Acts as a Stressor and Influences Abiotic and Biotic Stress Responses in Plants. Plant. Cell Environ. 2021, 44, 645–664. [Google Scholar] [CrossRef] [PubMed]
- Ivanova, L.A.; P’yankov, V.I. Structural Adaptation of the Leaf Mesophyll to Shading. Russ. J. Plant Physiol. 2002, 49, 419–431. [Google Scholar] [CrossRef]
- Romero, J.M.; Cordon, G.B.; Lagorio, M.G. Re-Absorption and Scattering of Chlorophyll Fluorescence in Canopies: A Revised Approach. Remote Sens. Environ. 2020, 246, 111860. [Google Scholar] [CrossRef]
- Boshkovski, B.; Doupis, G.; Zapolska, A.; Kalaitzidis, C.; Koubouris, G. Hyperspectral Imagery Detects Water Deficit and Salinity Effects on Photosynthesis and Antioxidant Enzyme Activity of Three Greek Olive Varieties. Sustainability 2022, 14, 1432. [Google Scholar] [CrossRef]
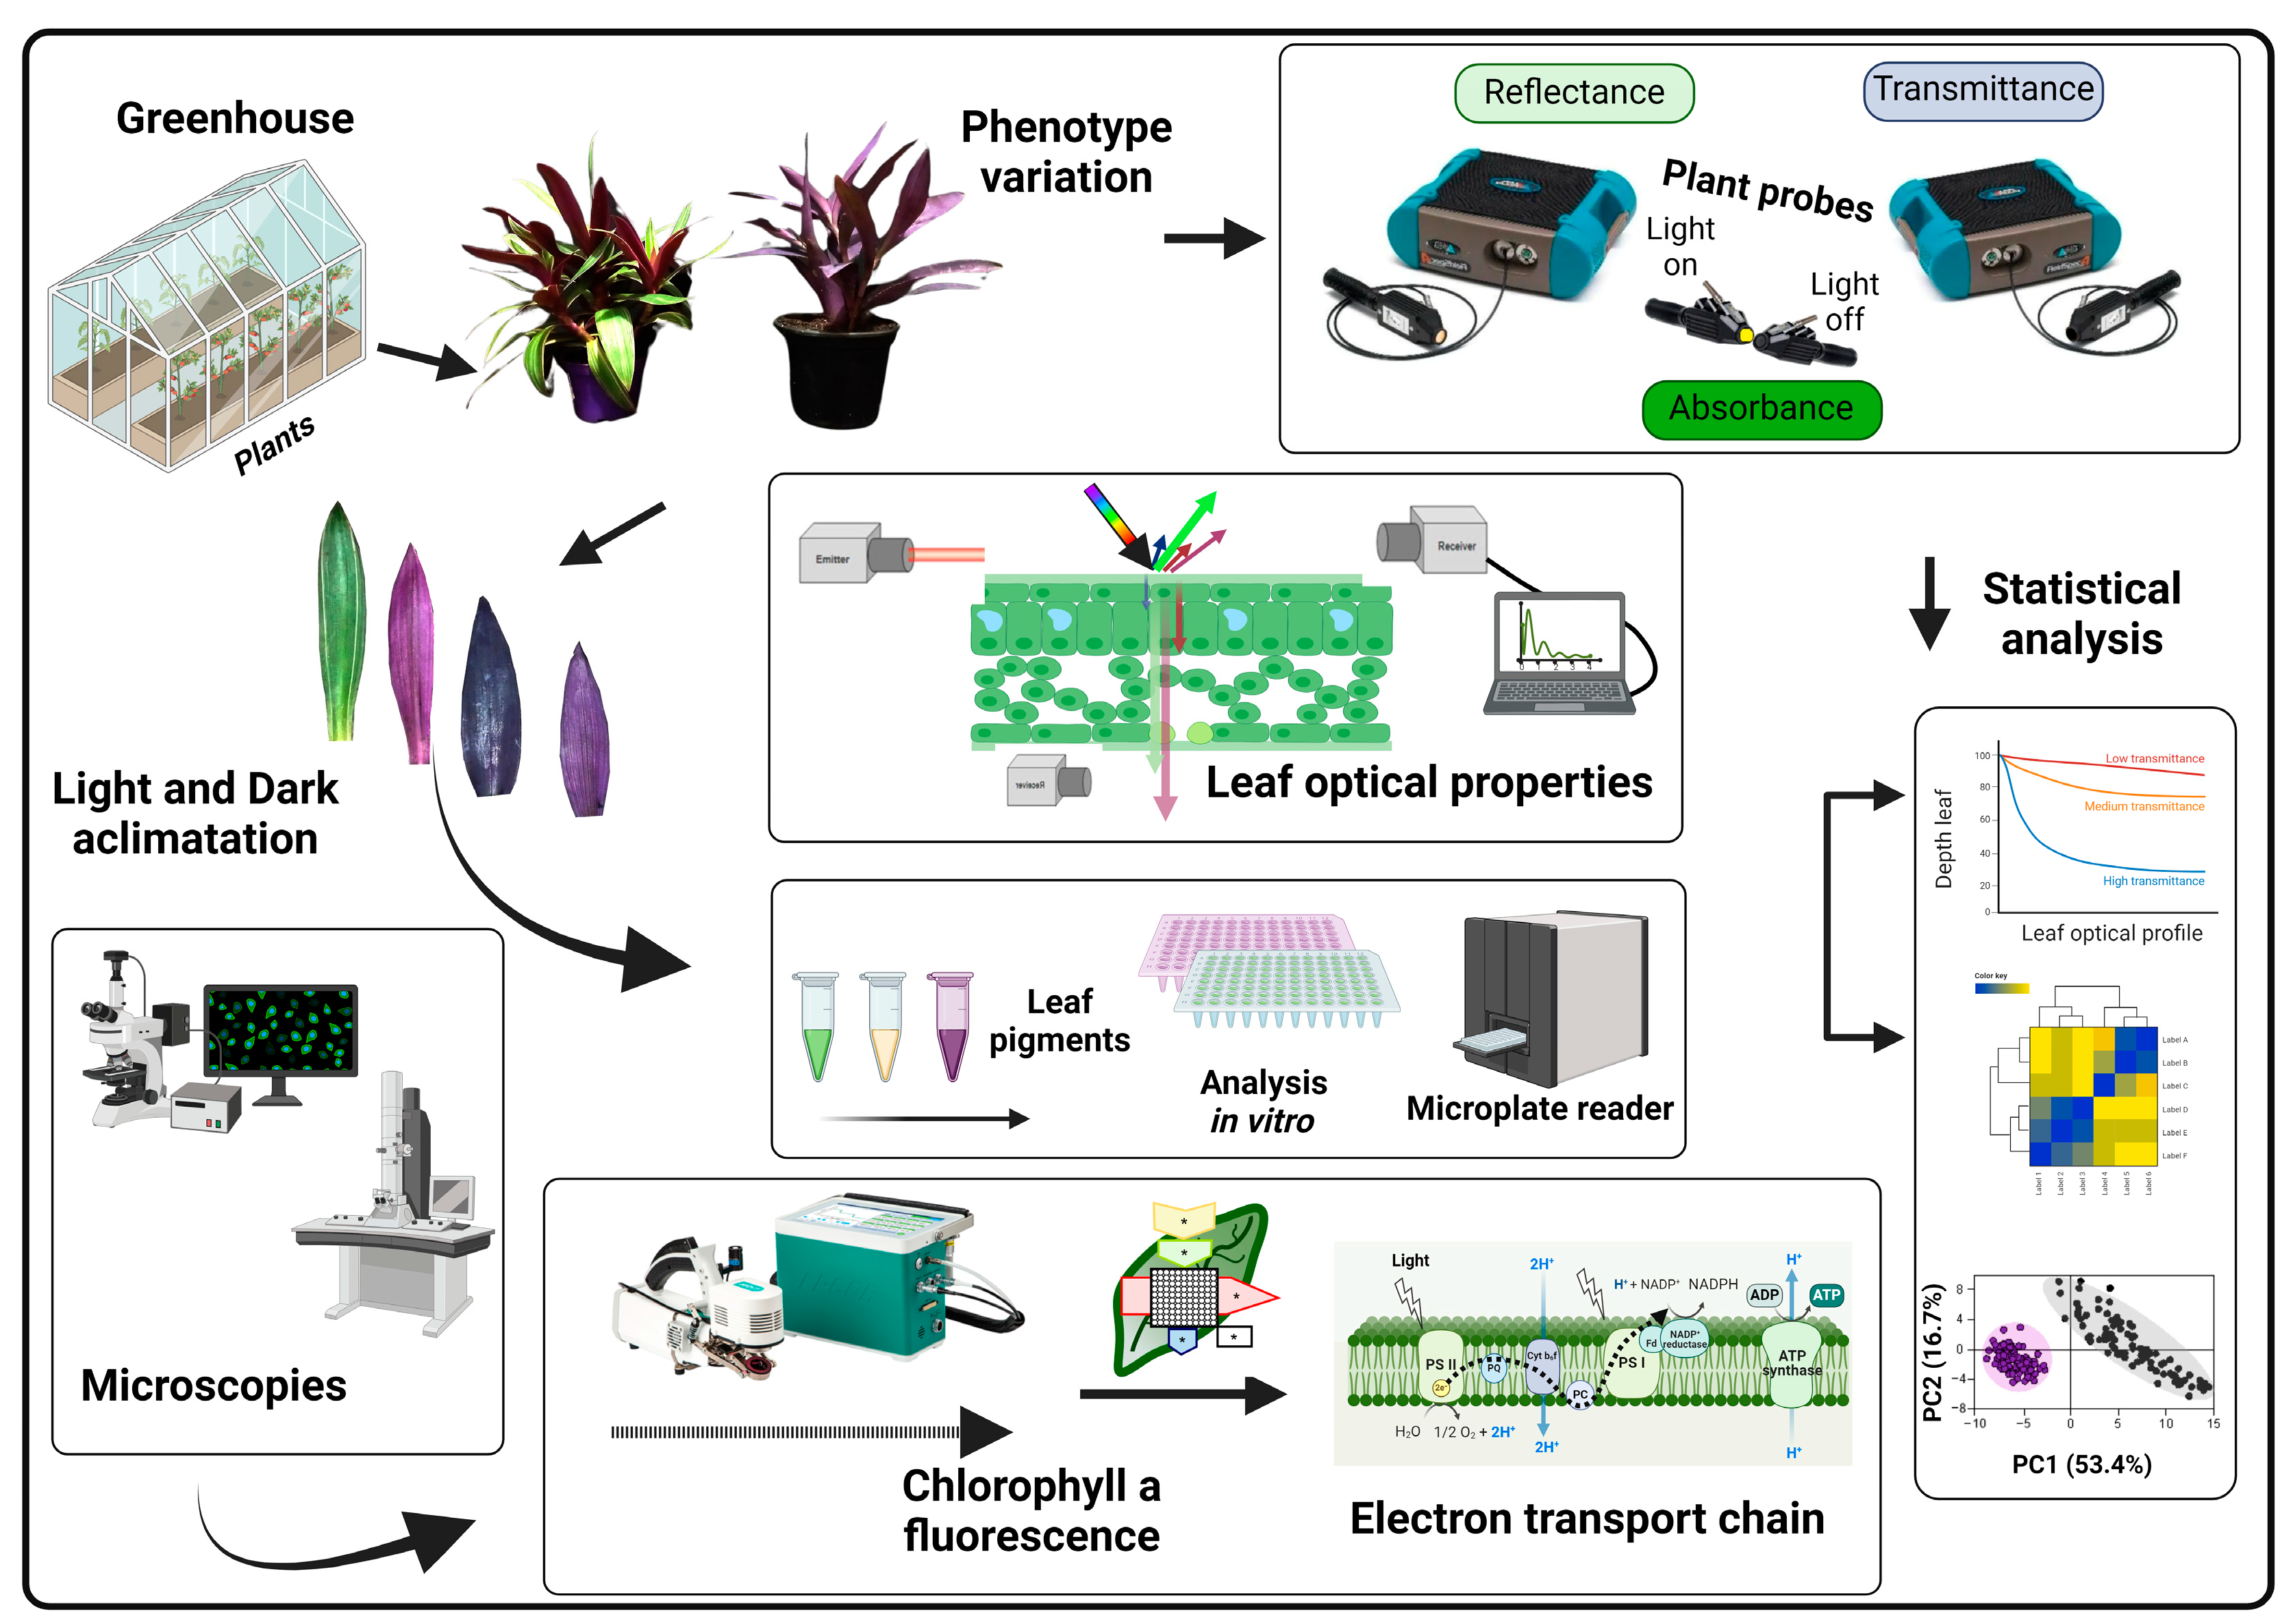
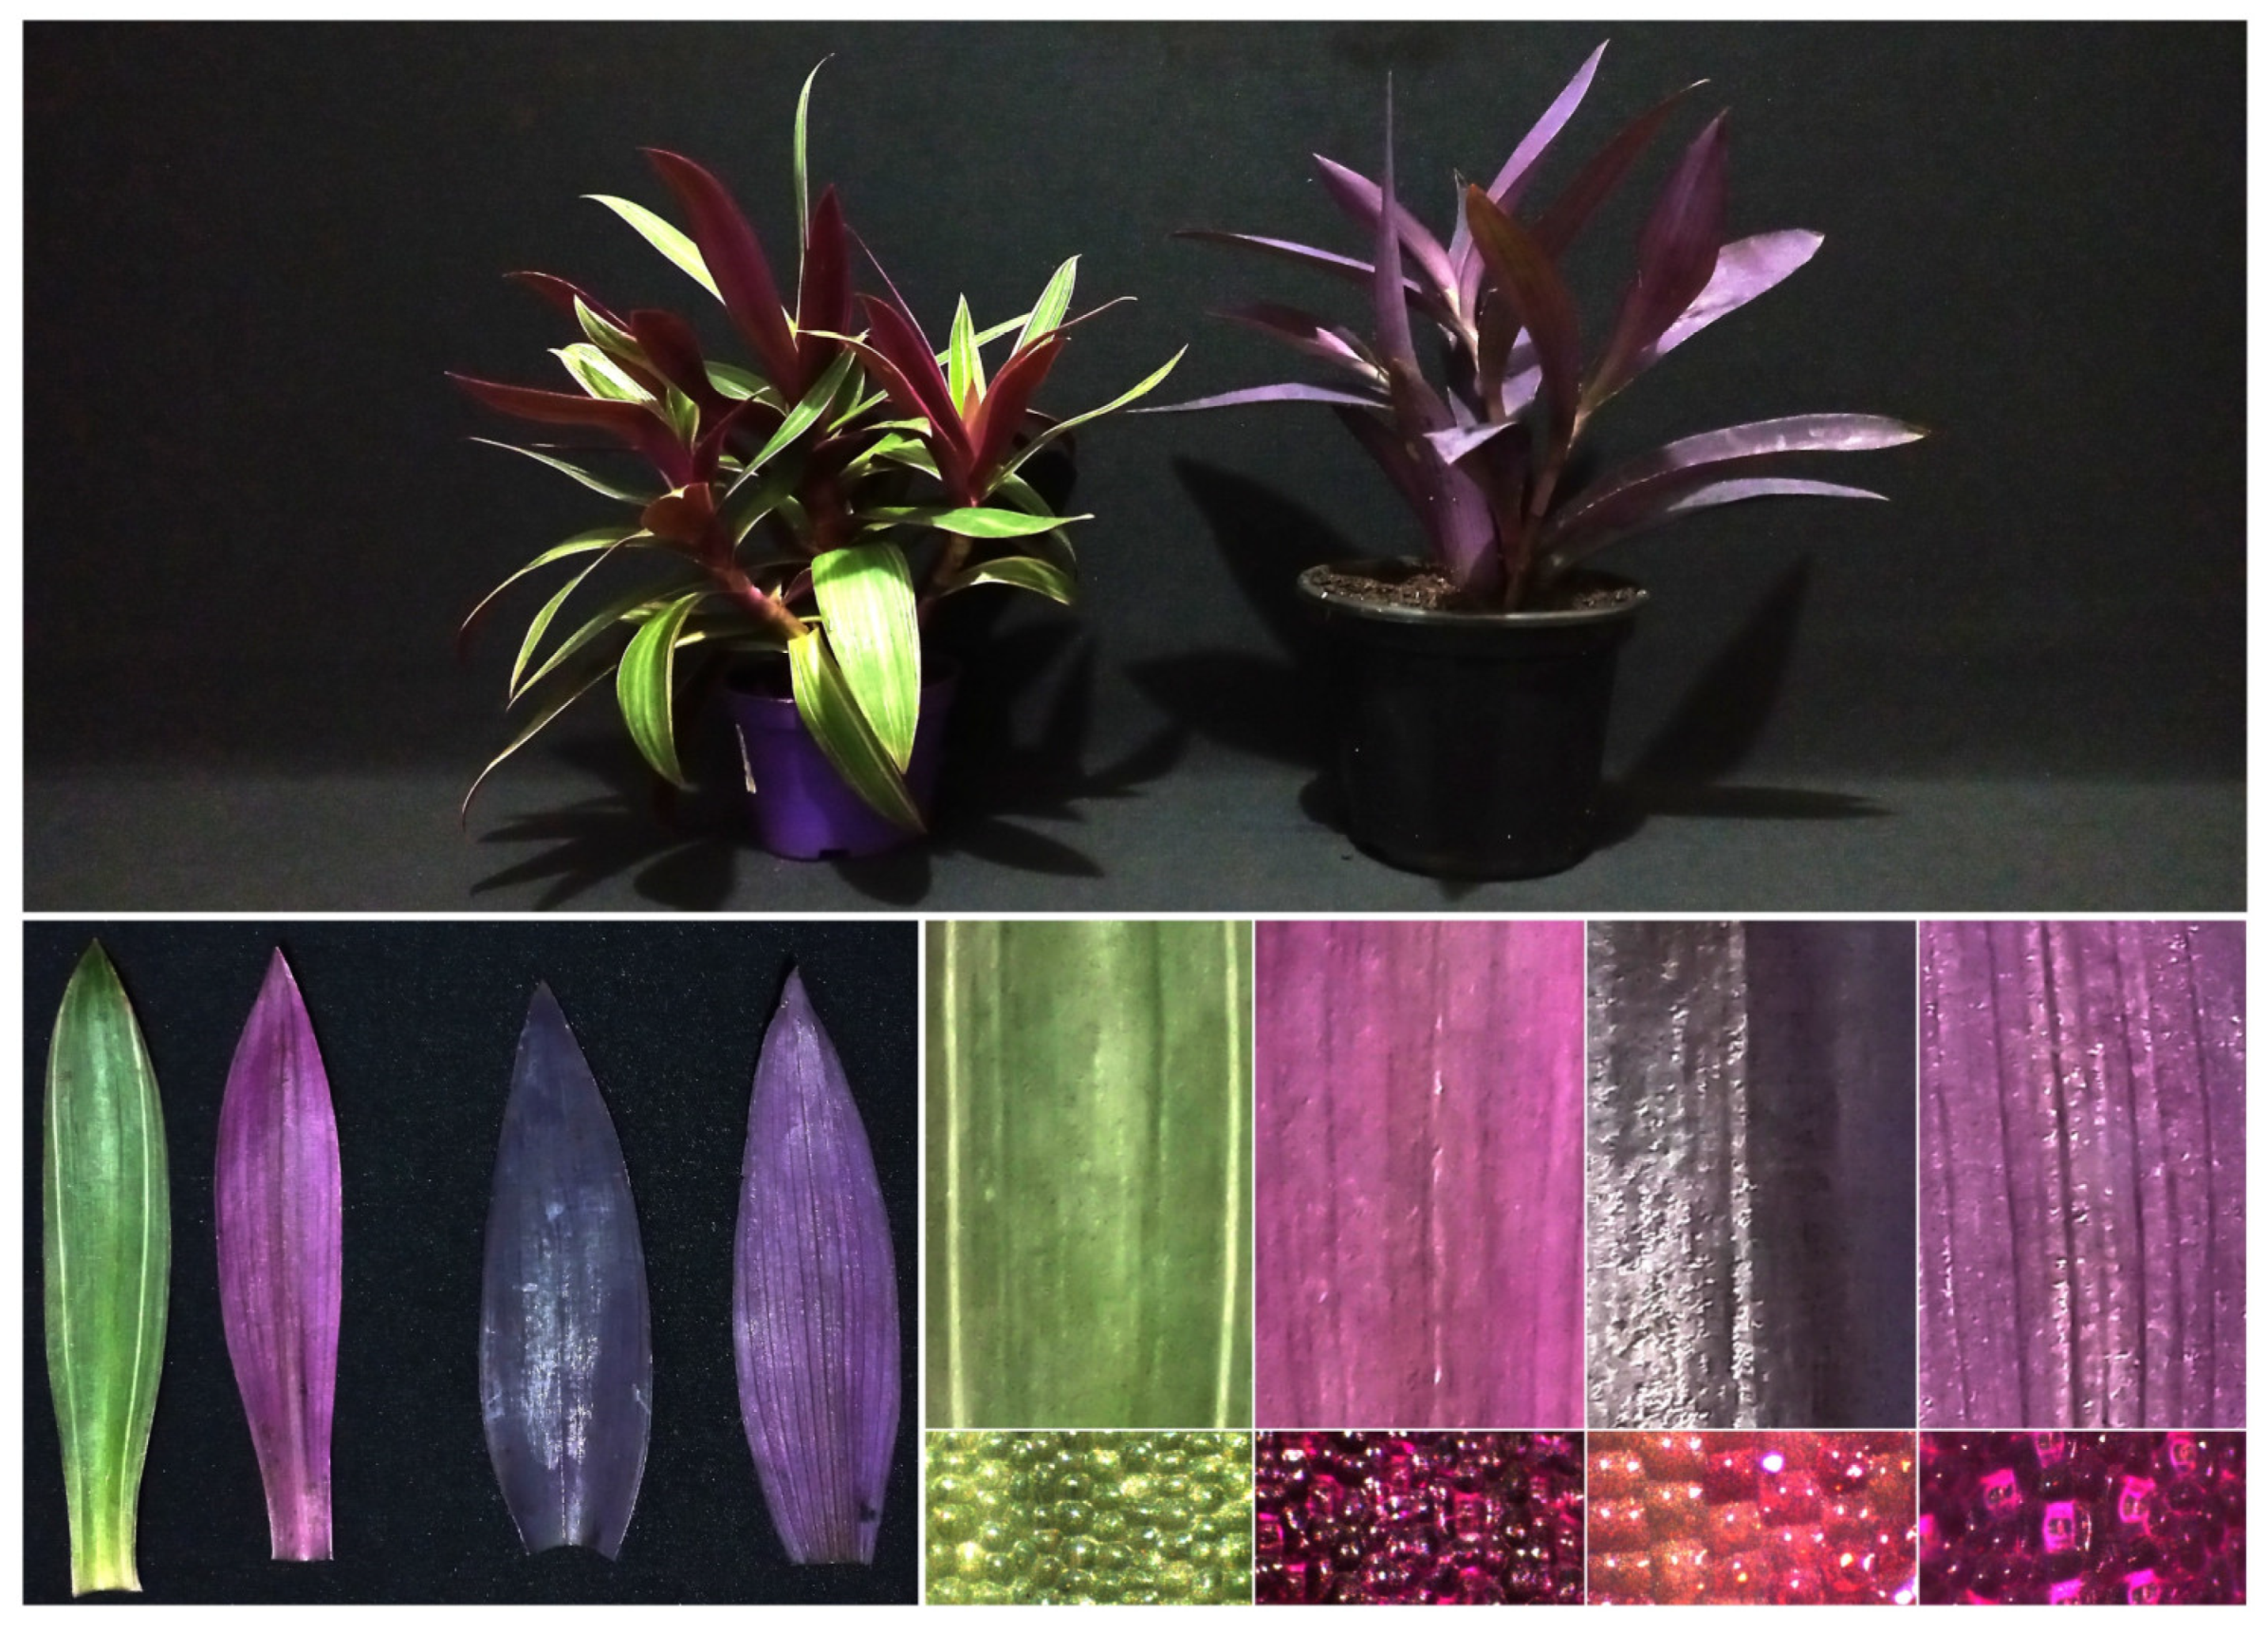
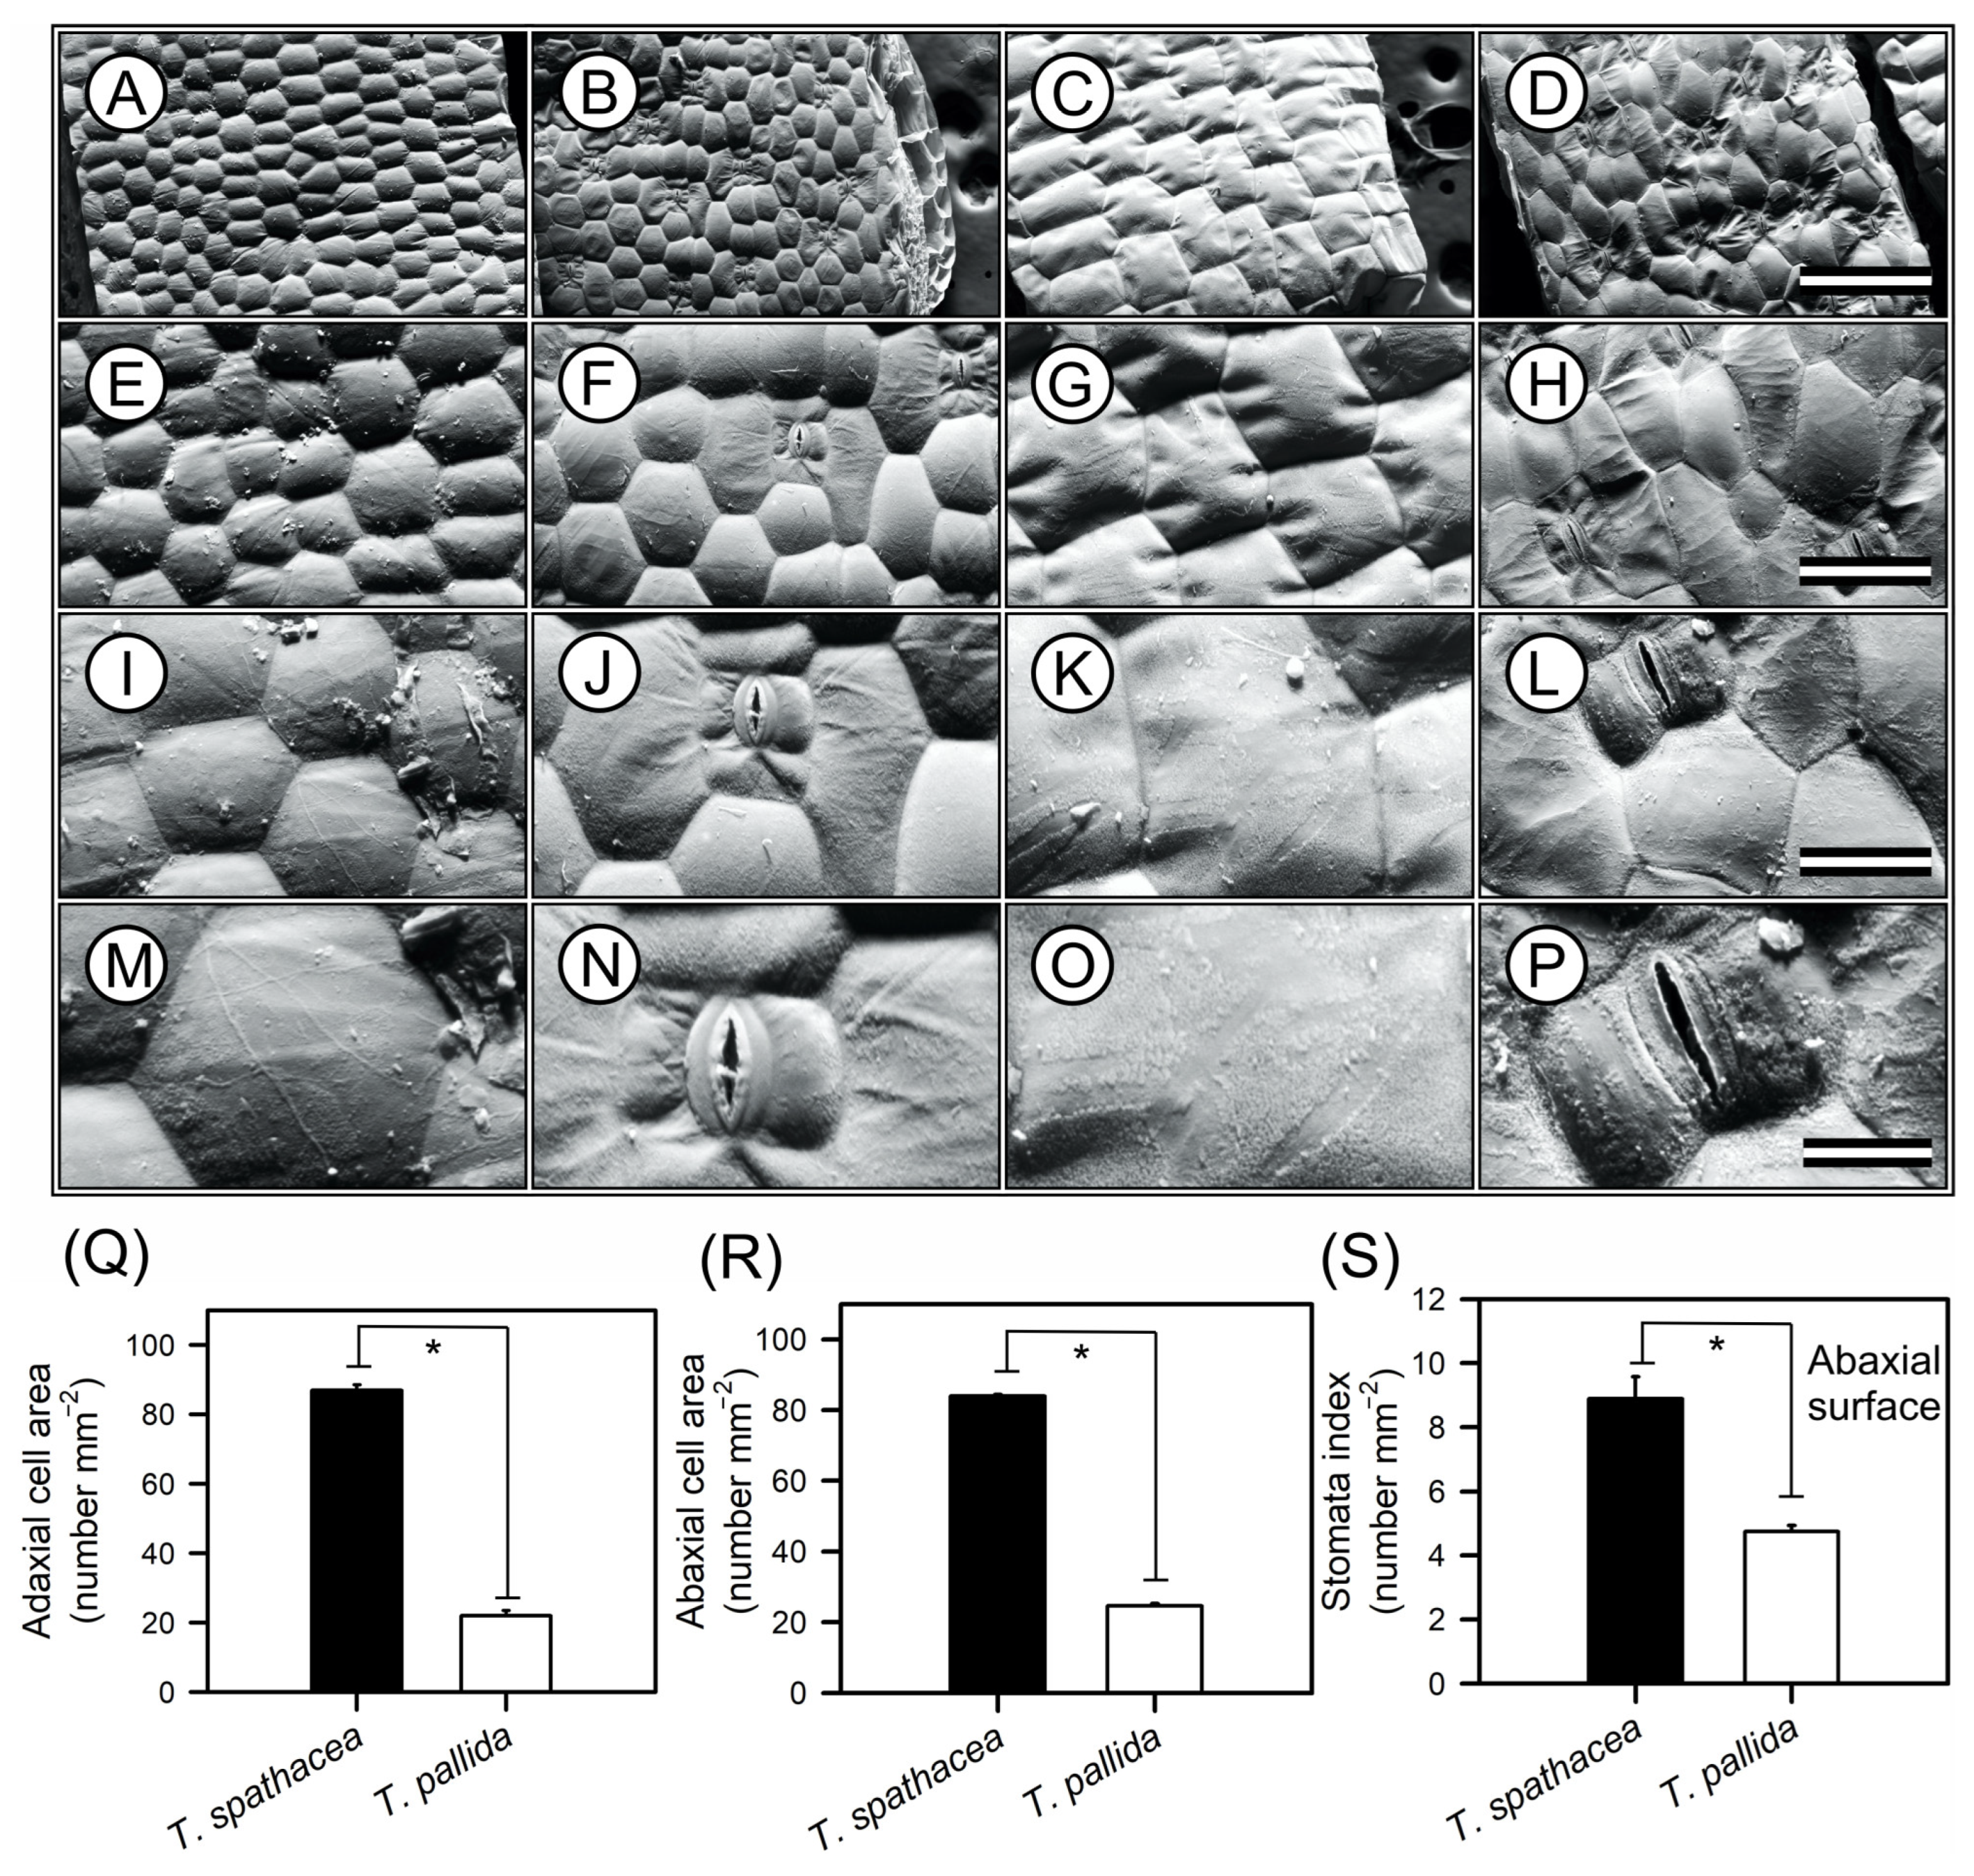


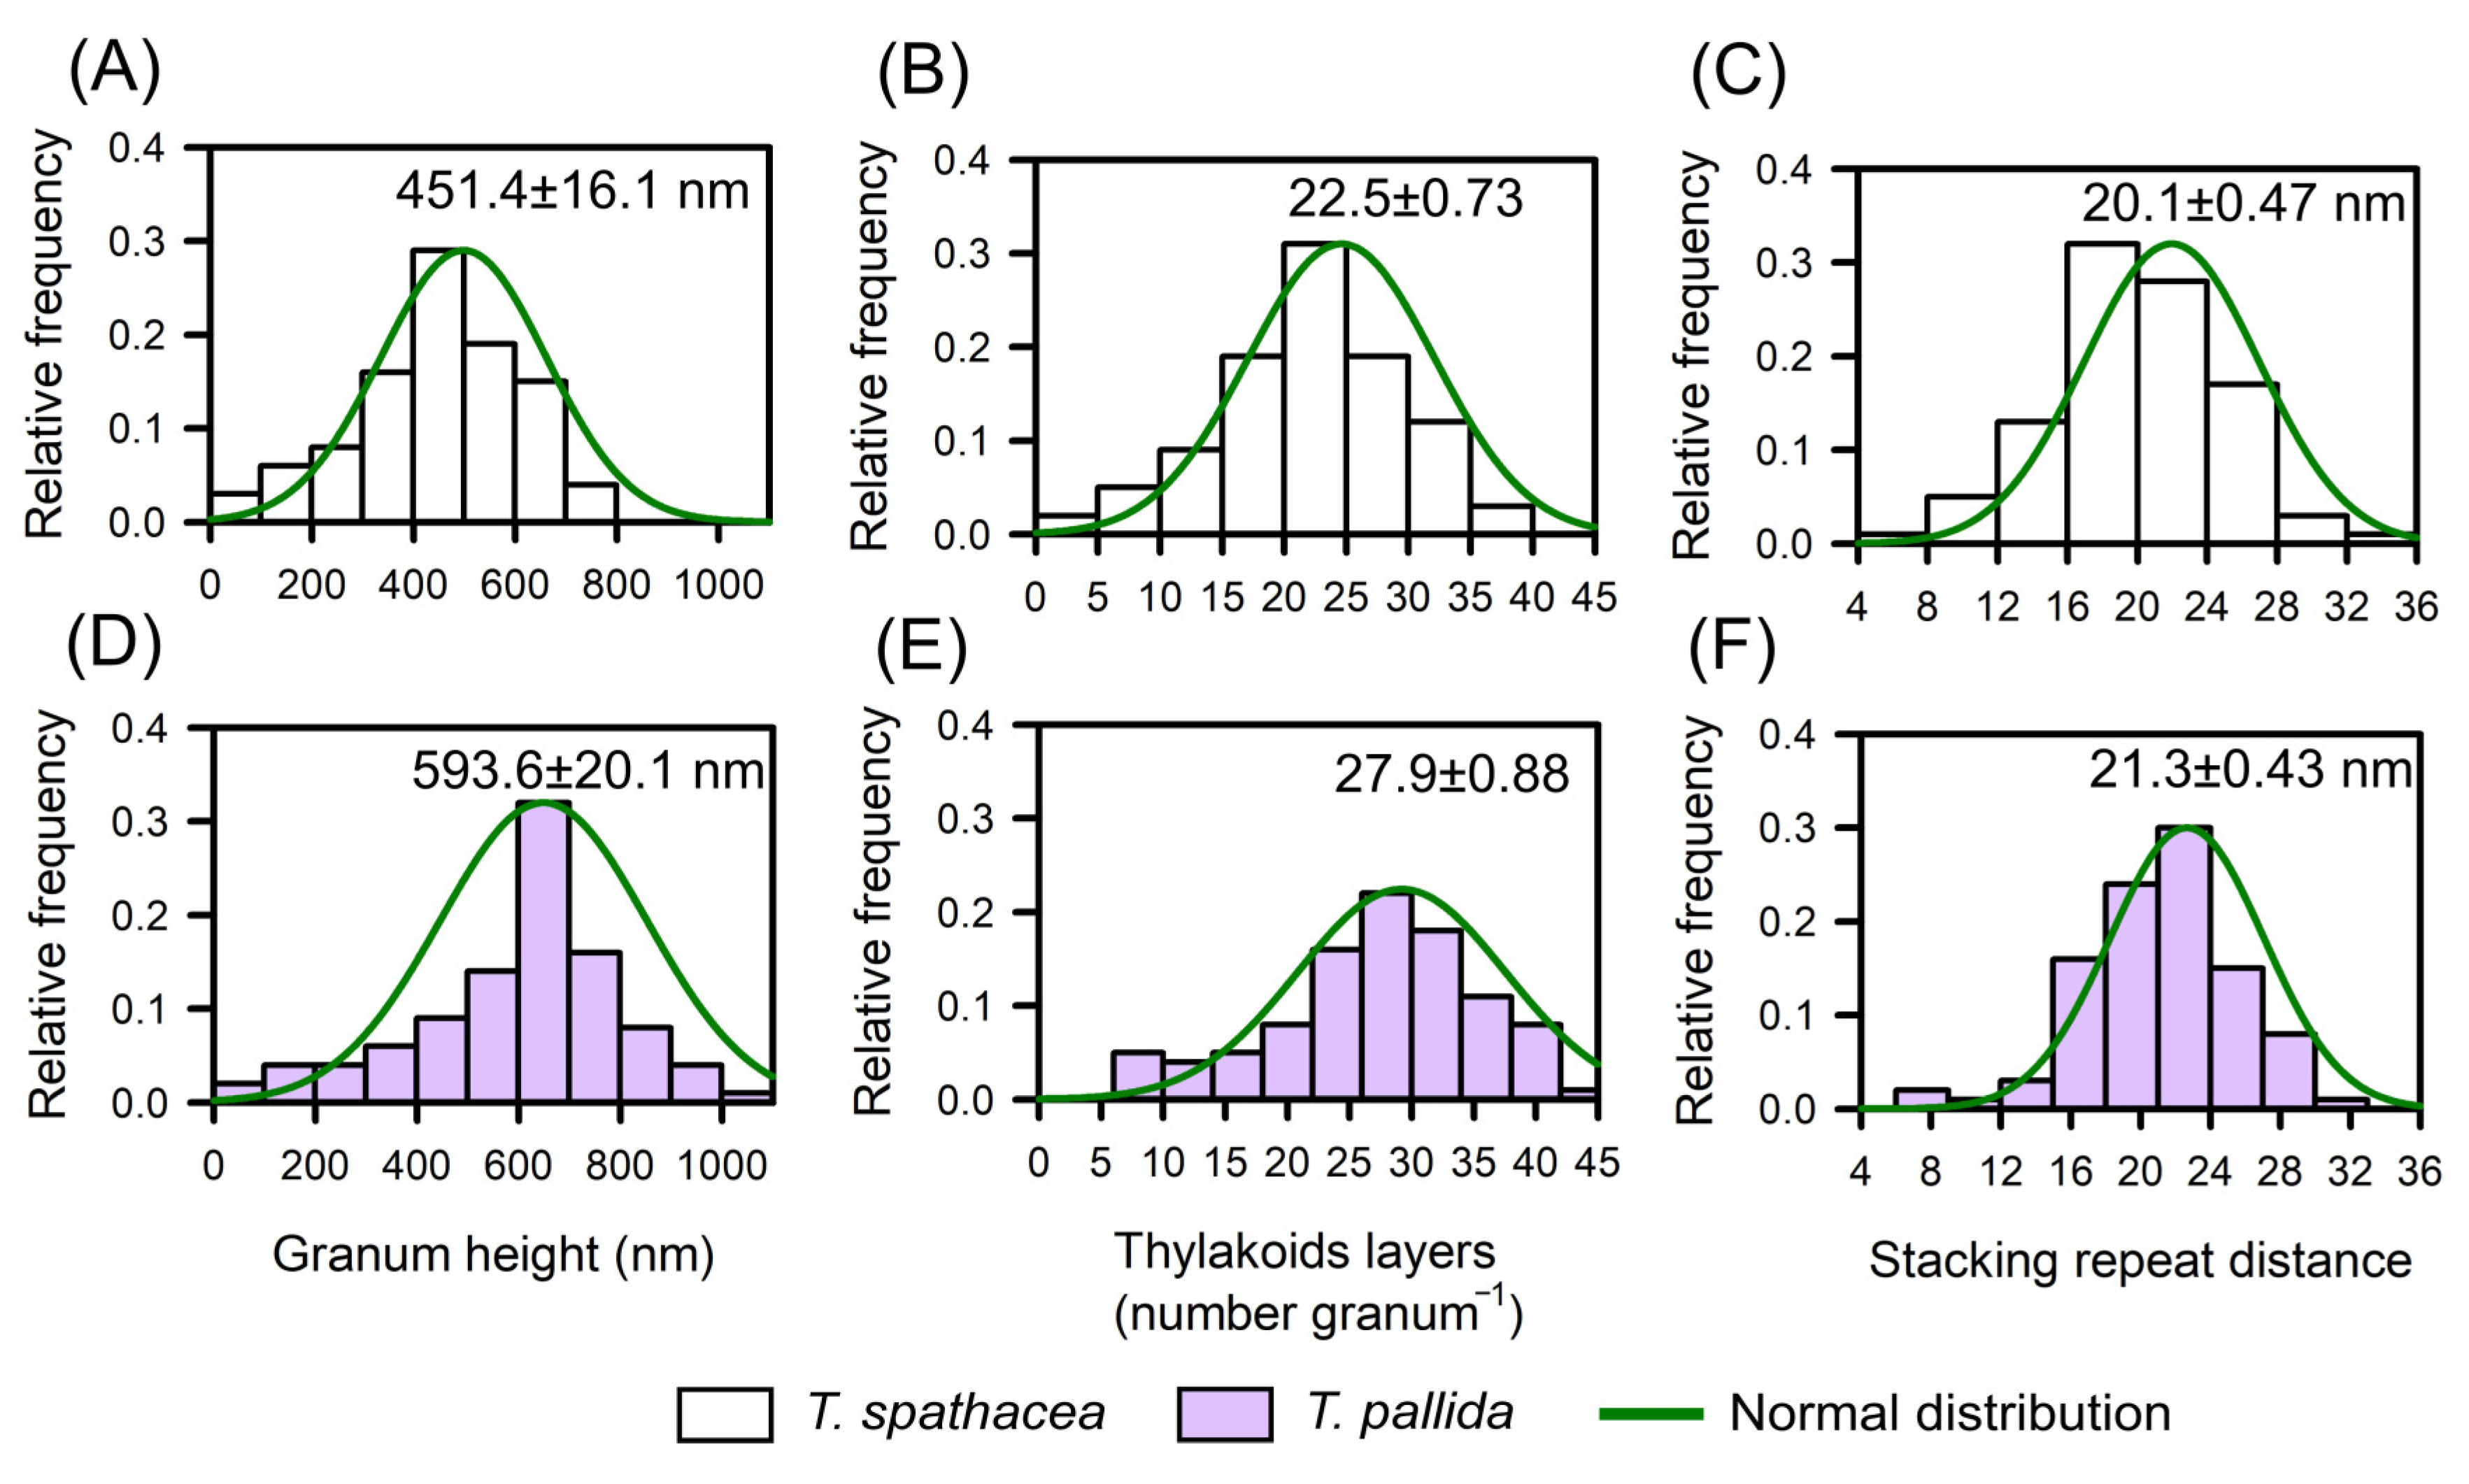
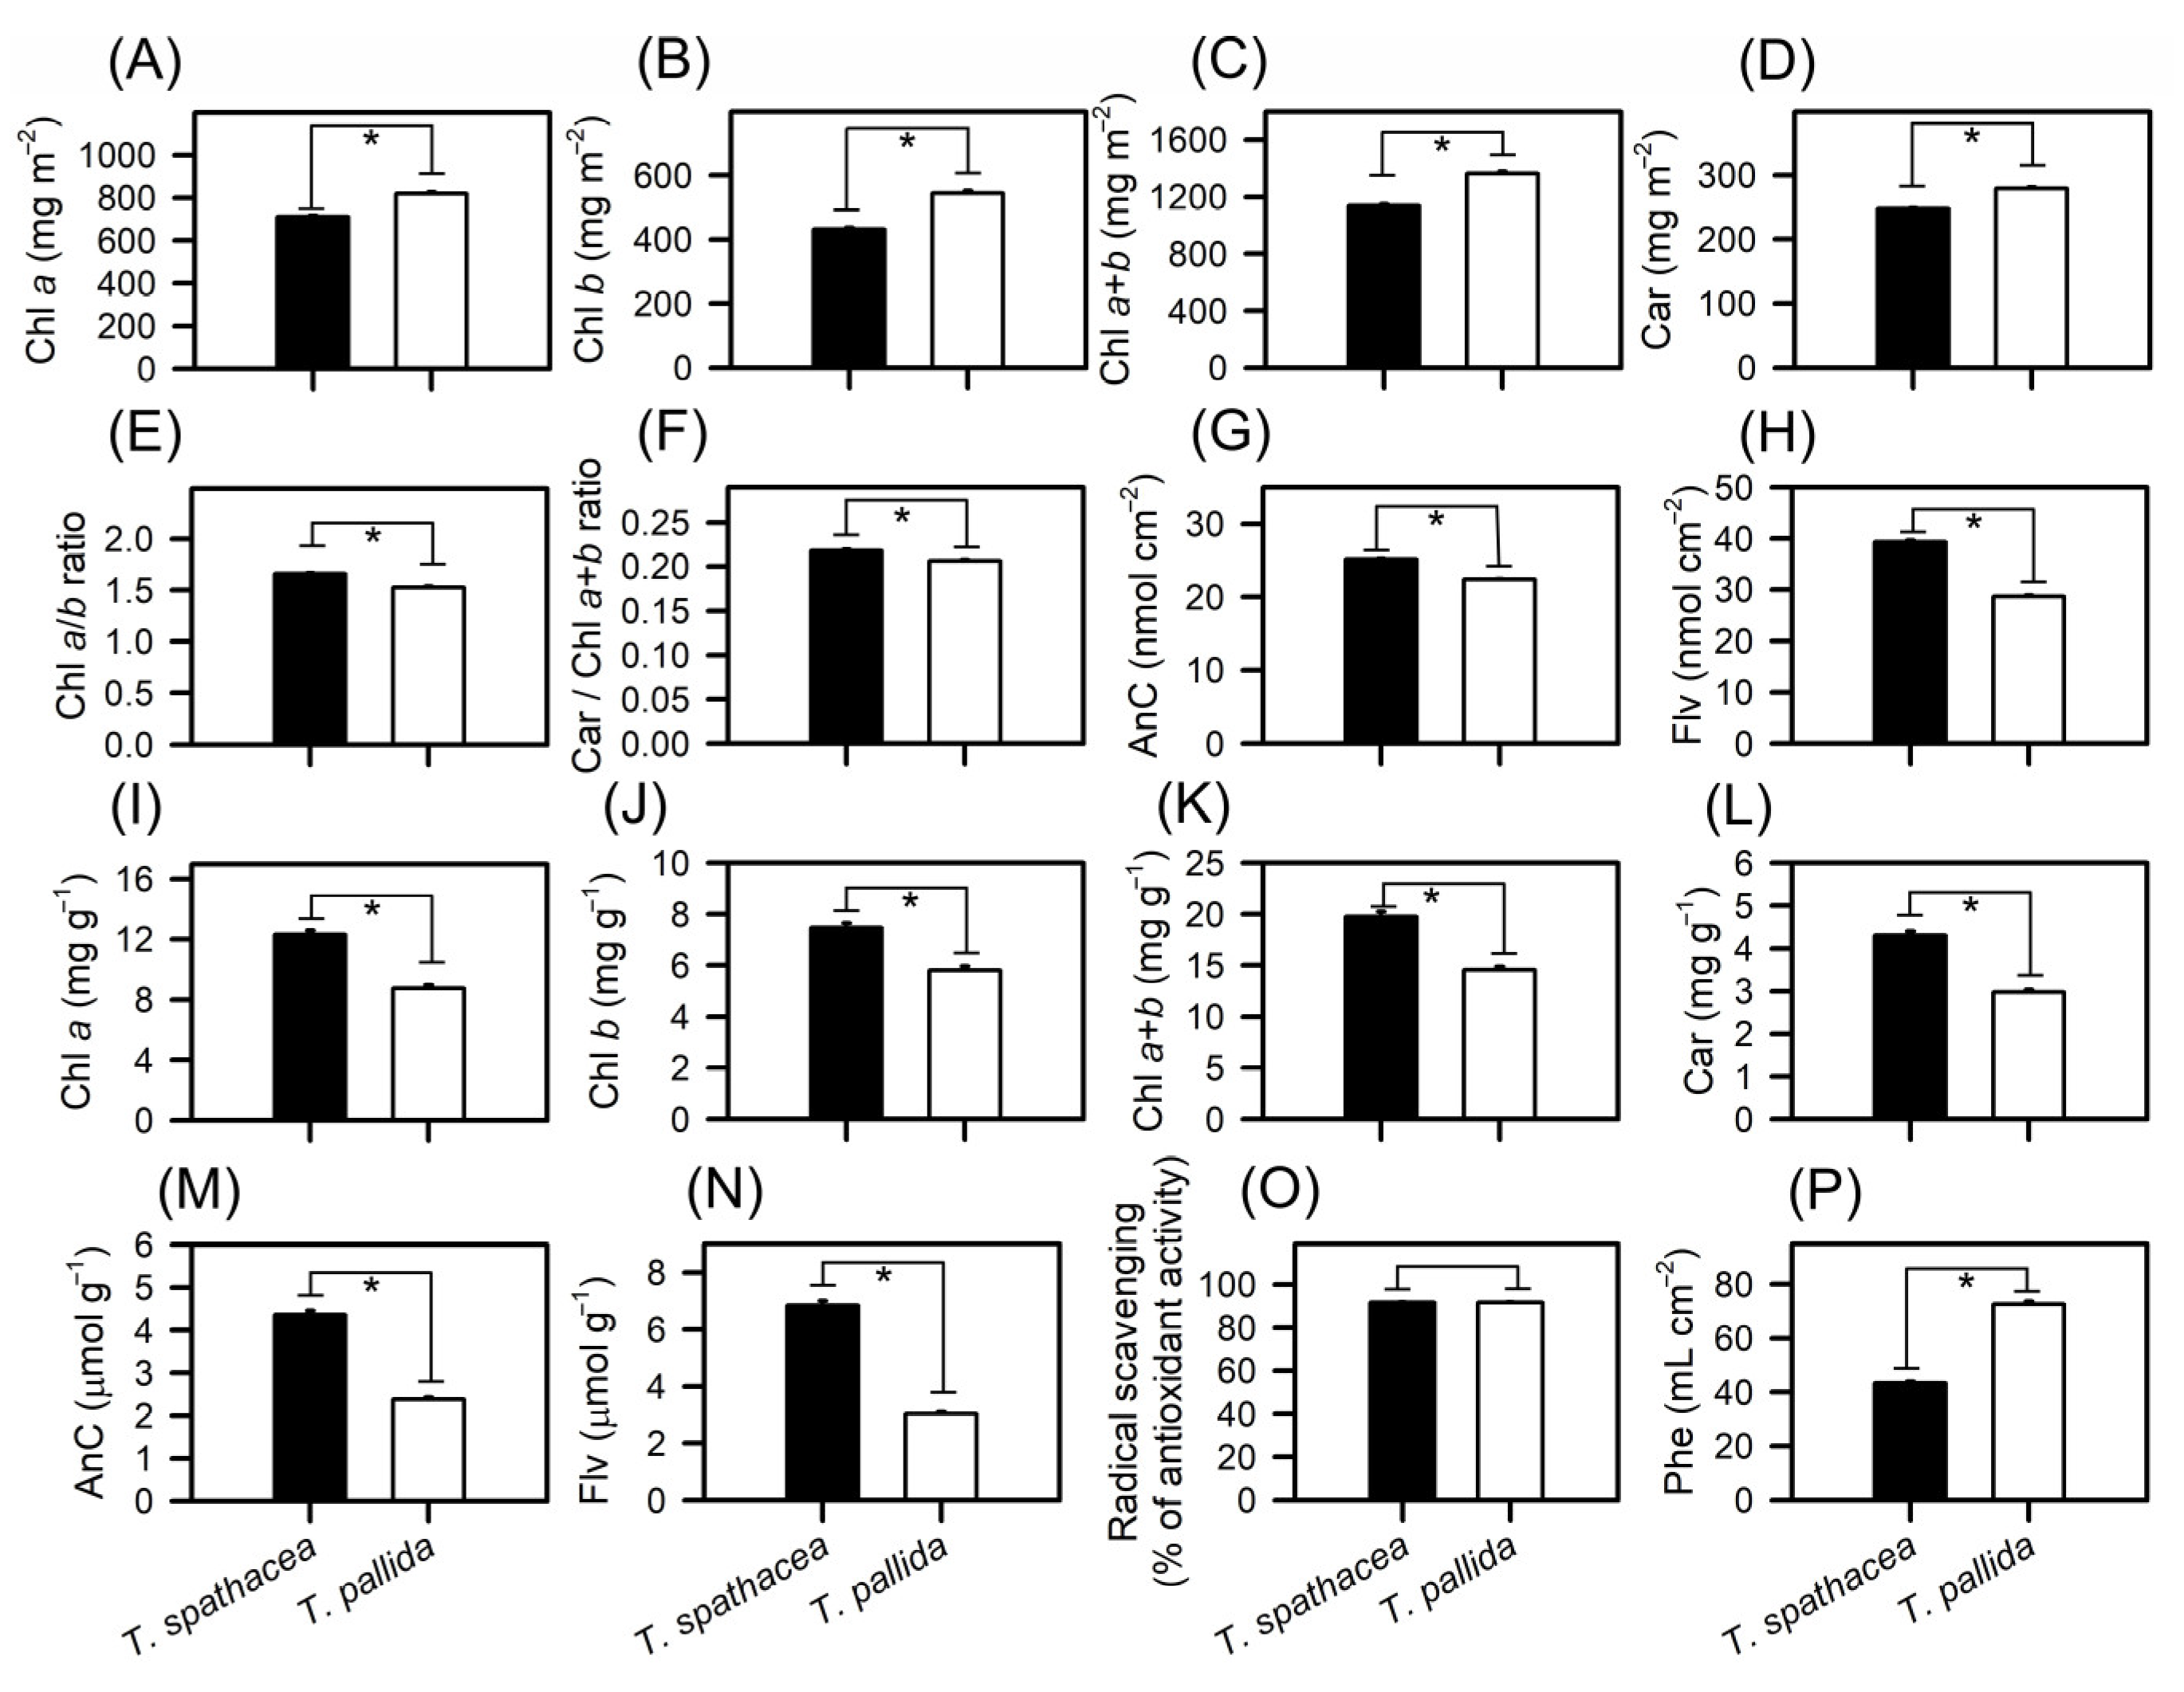
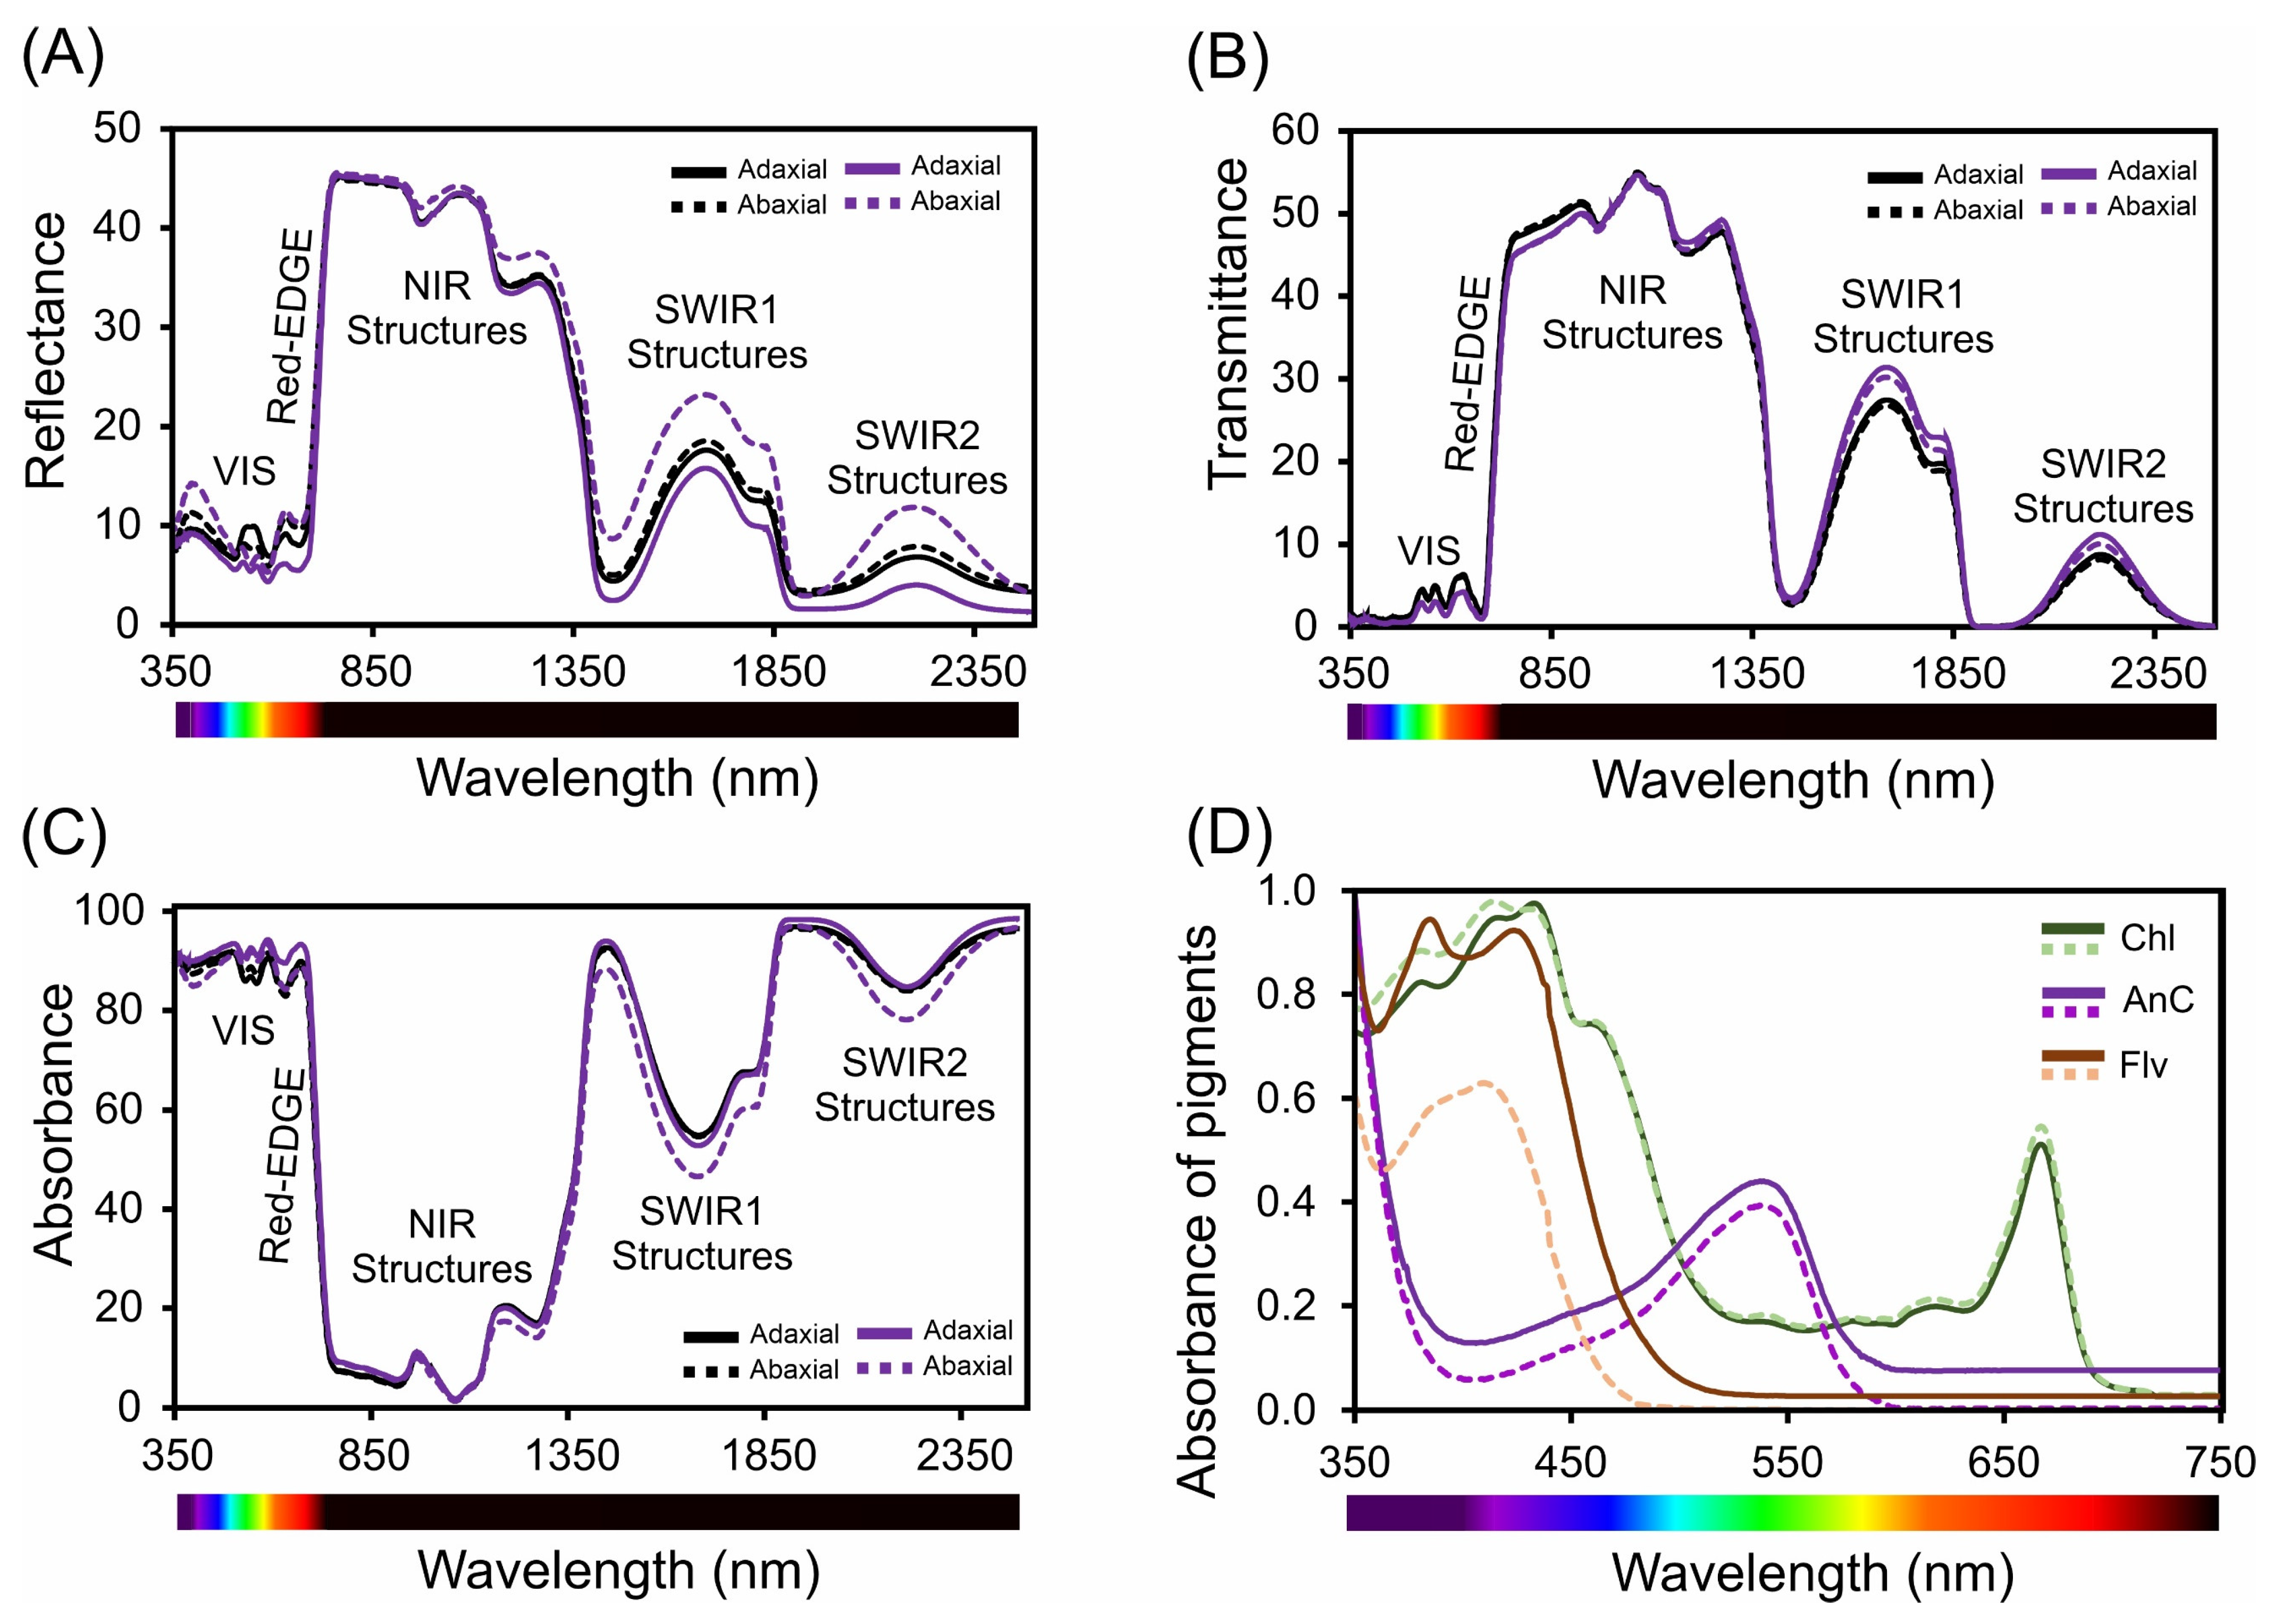
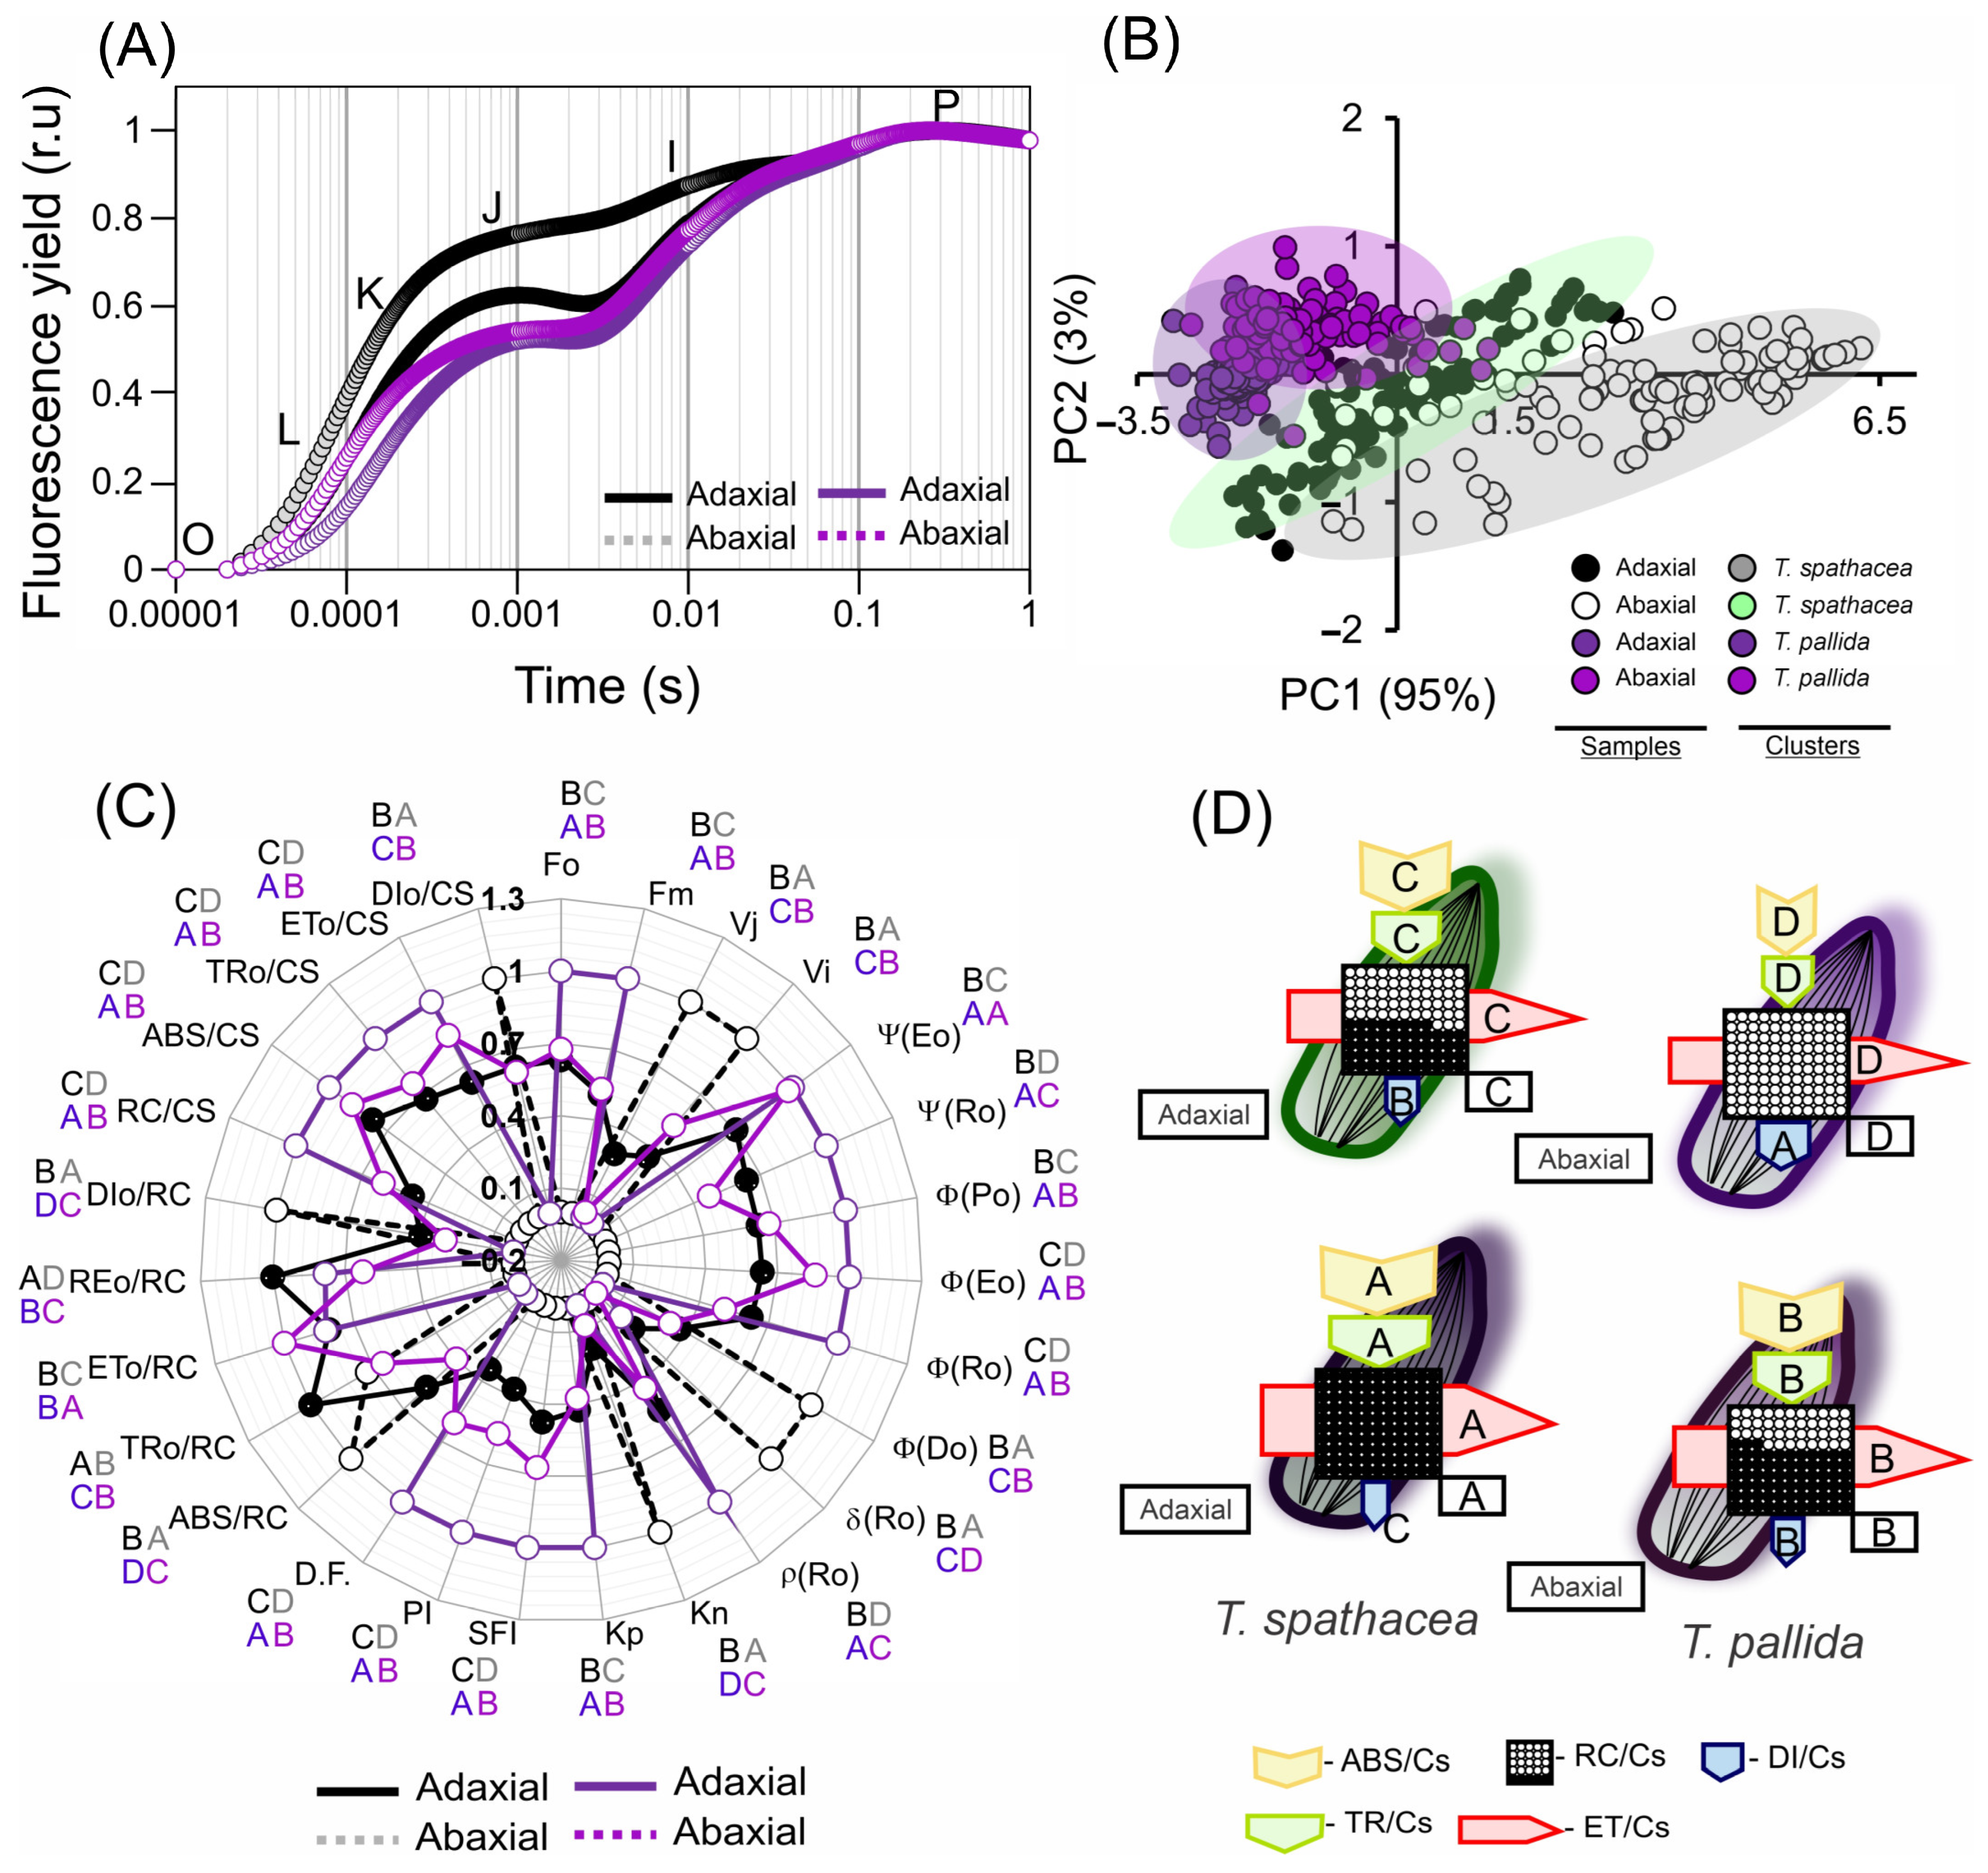
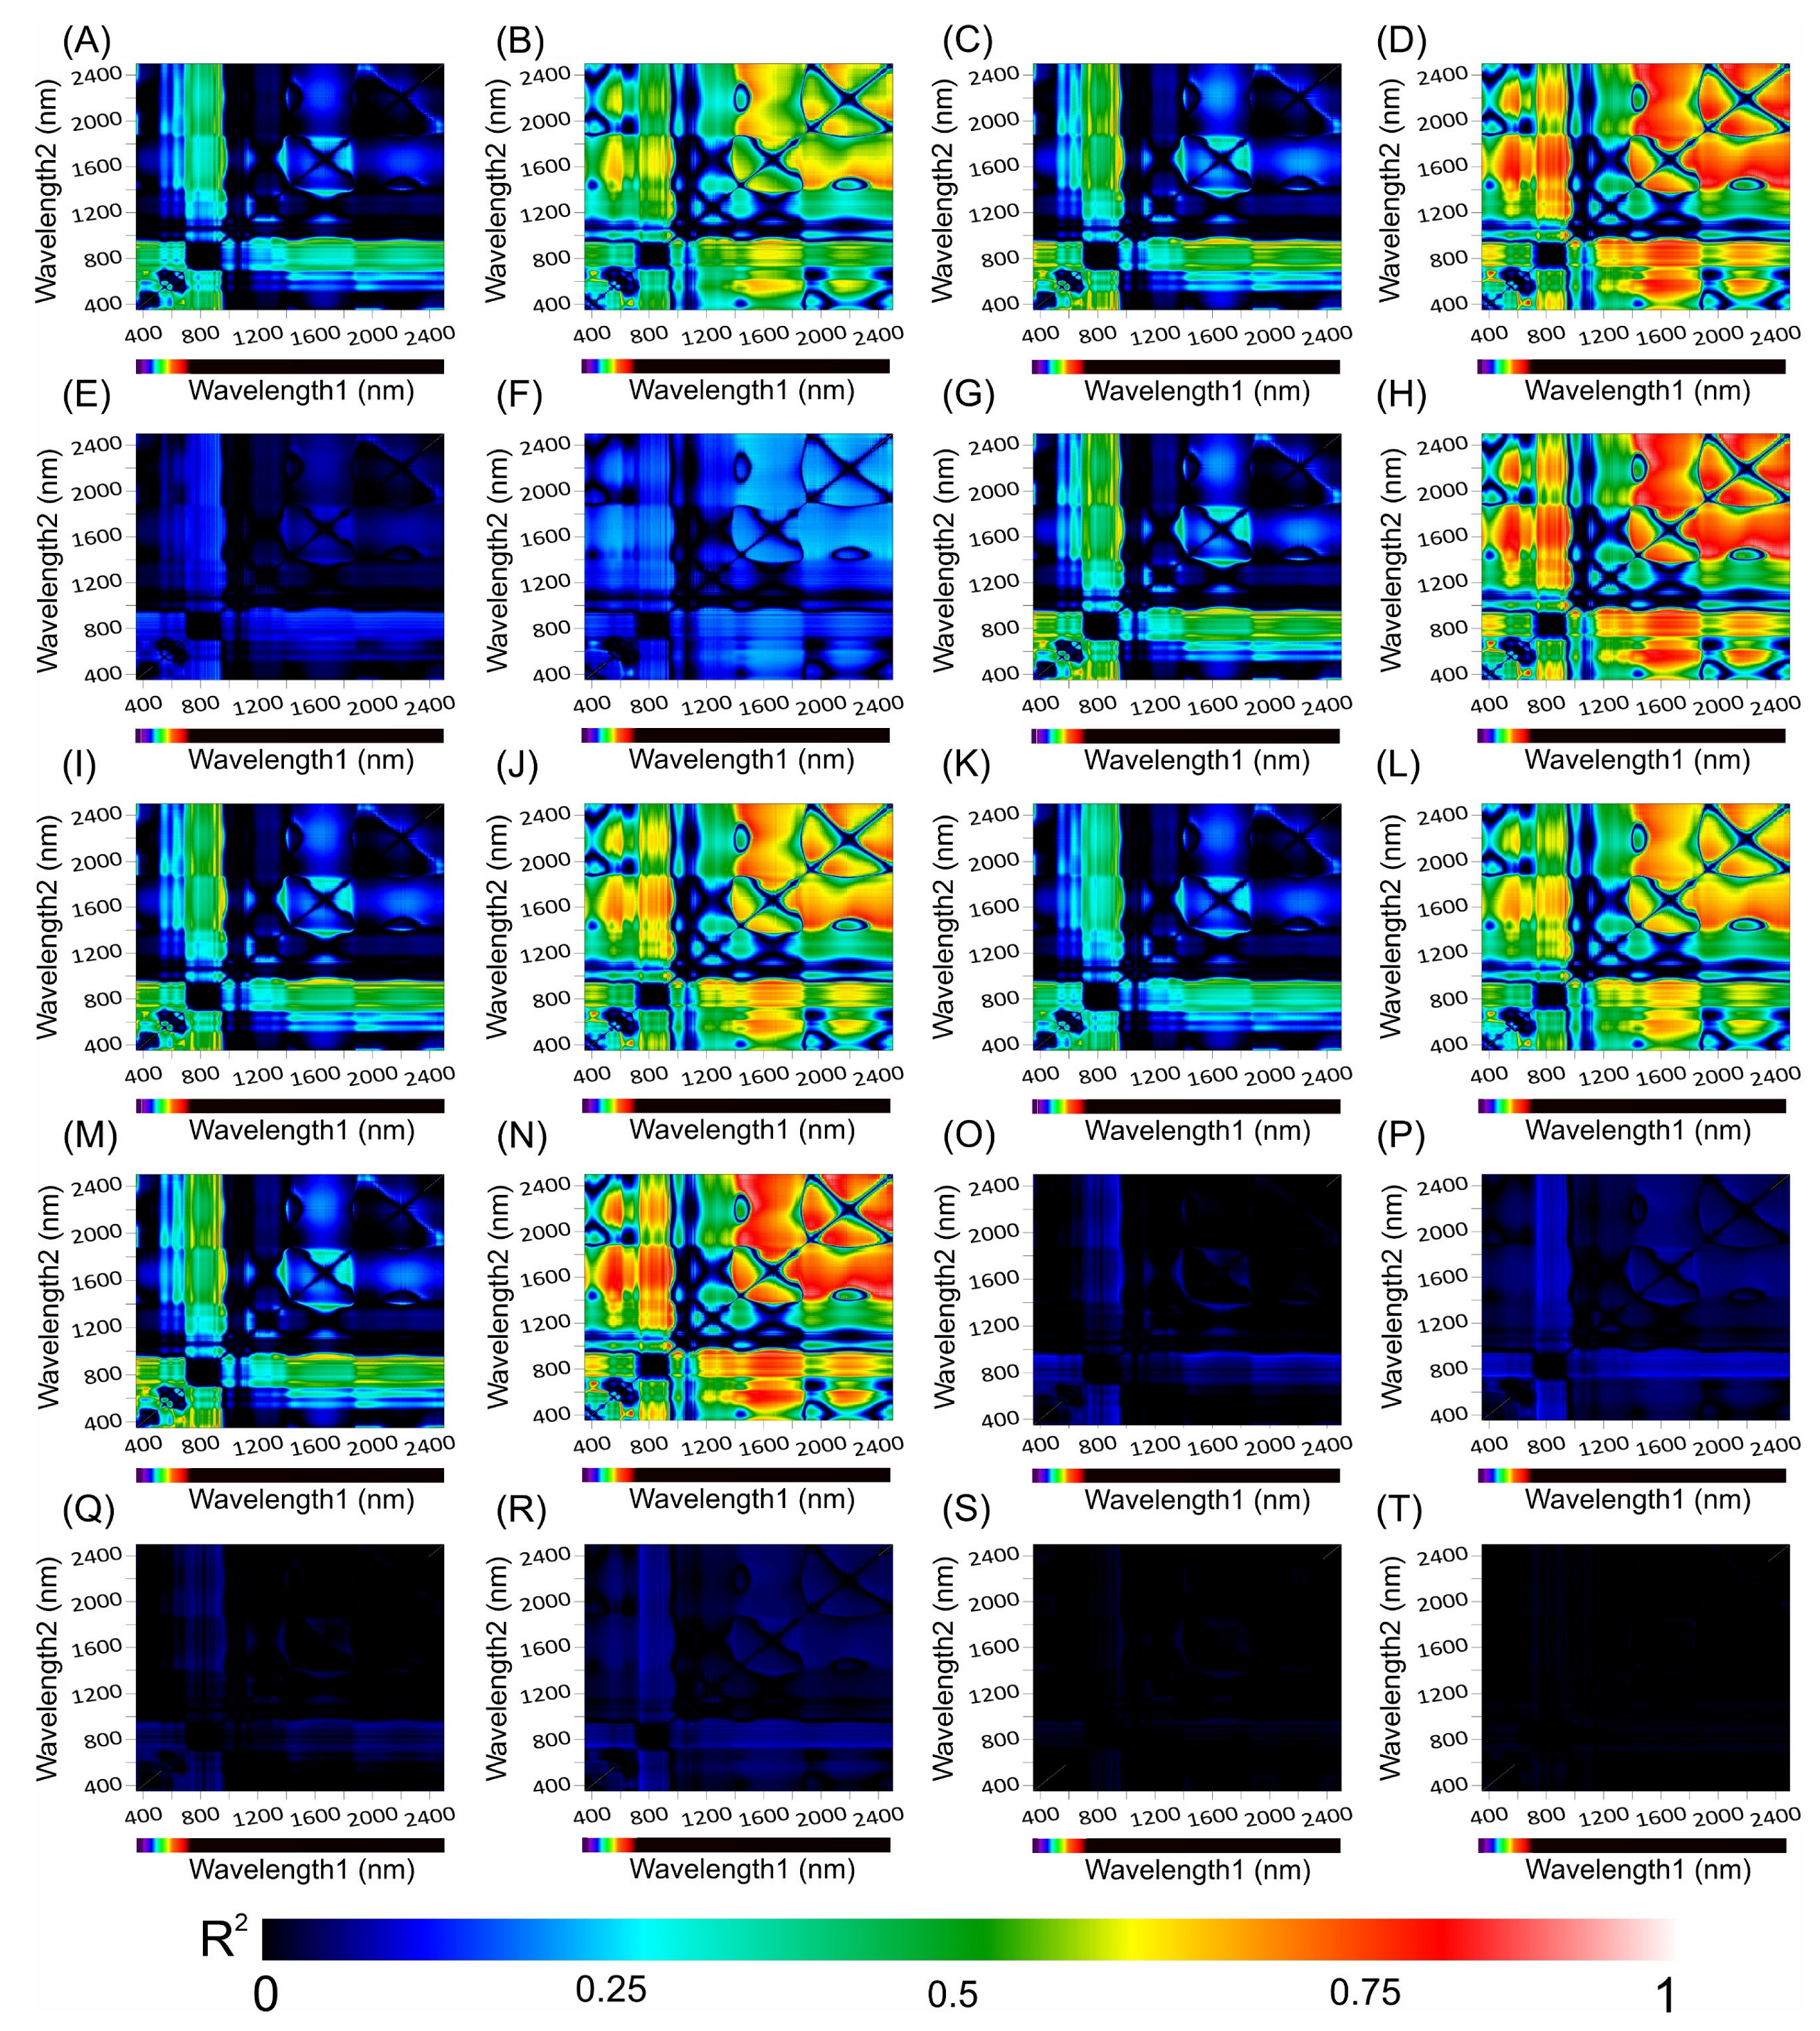
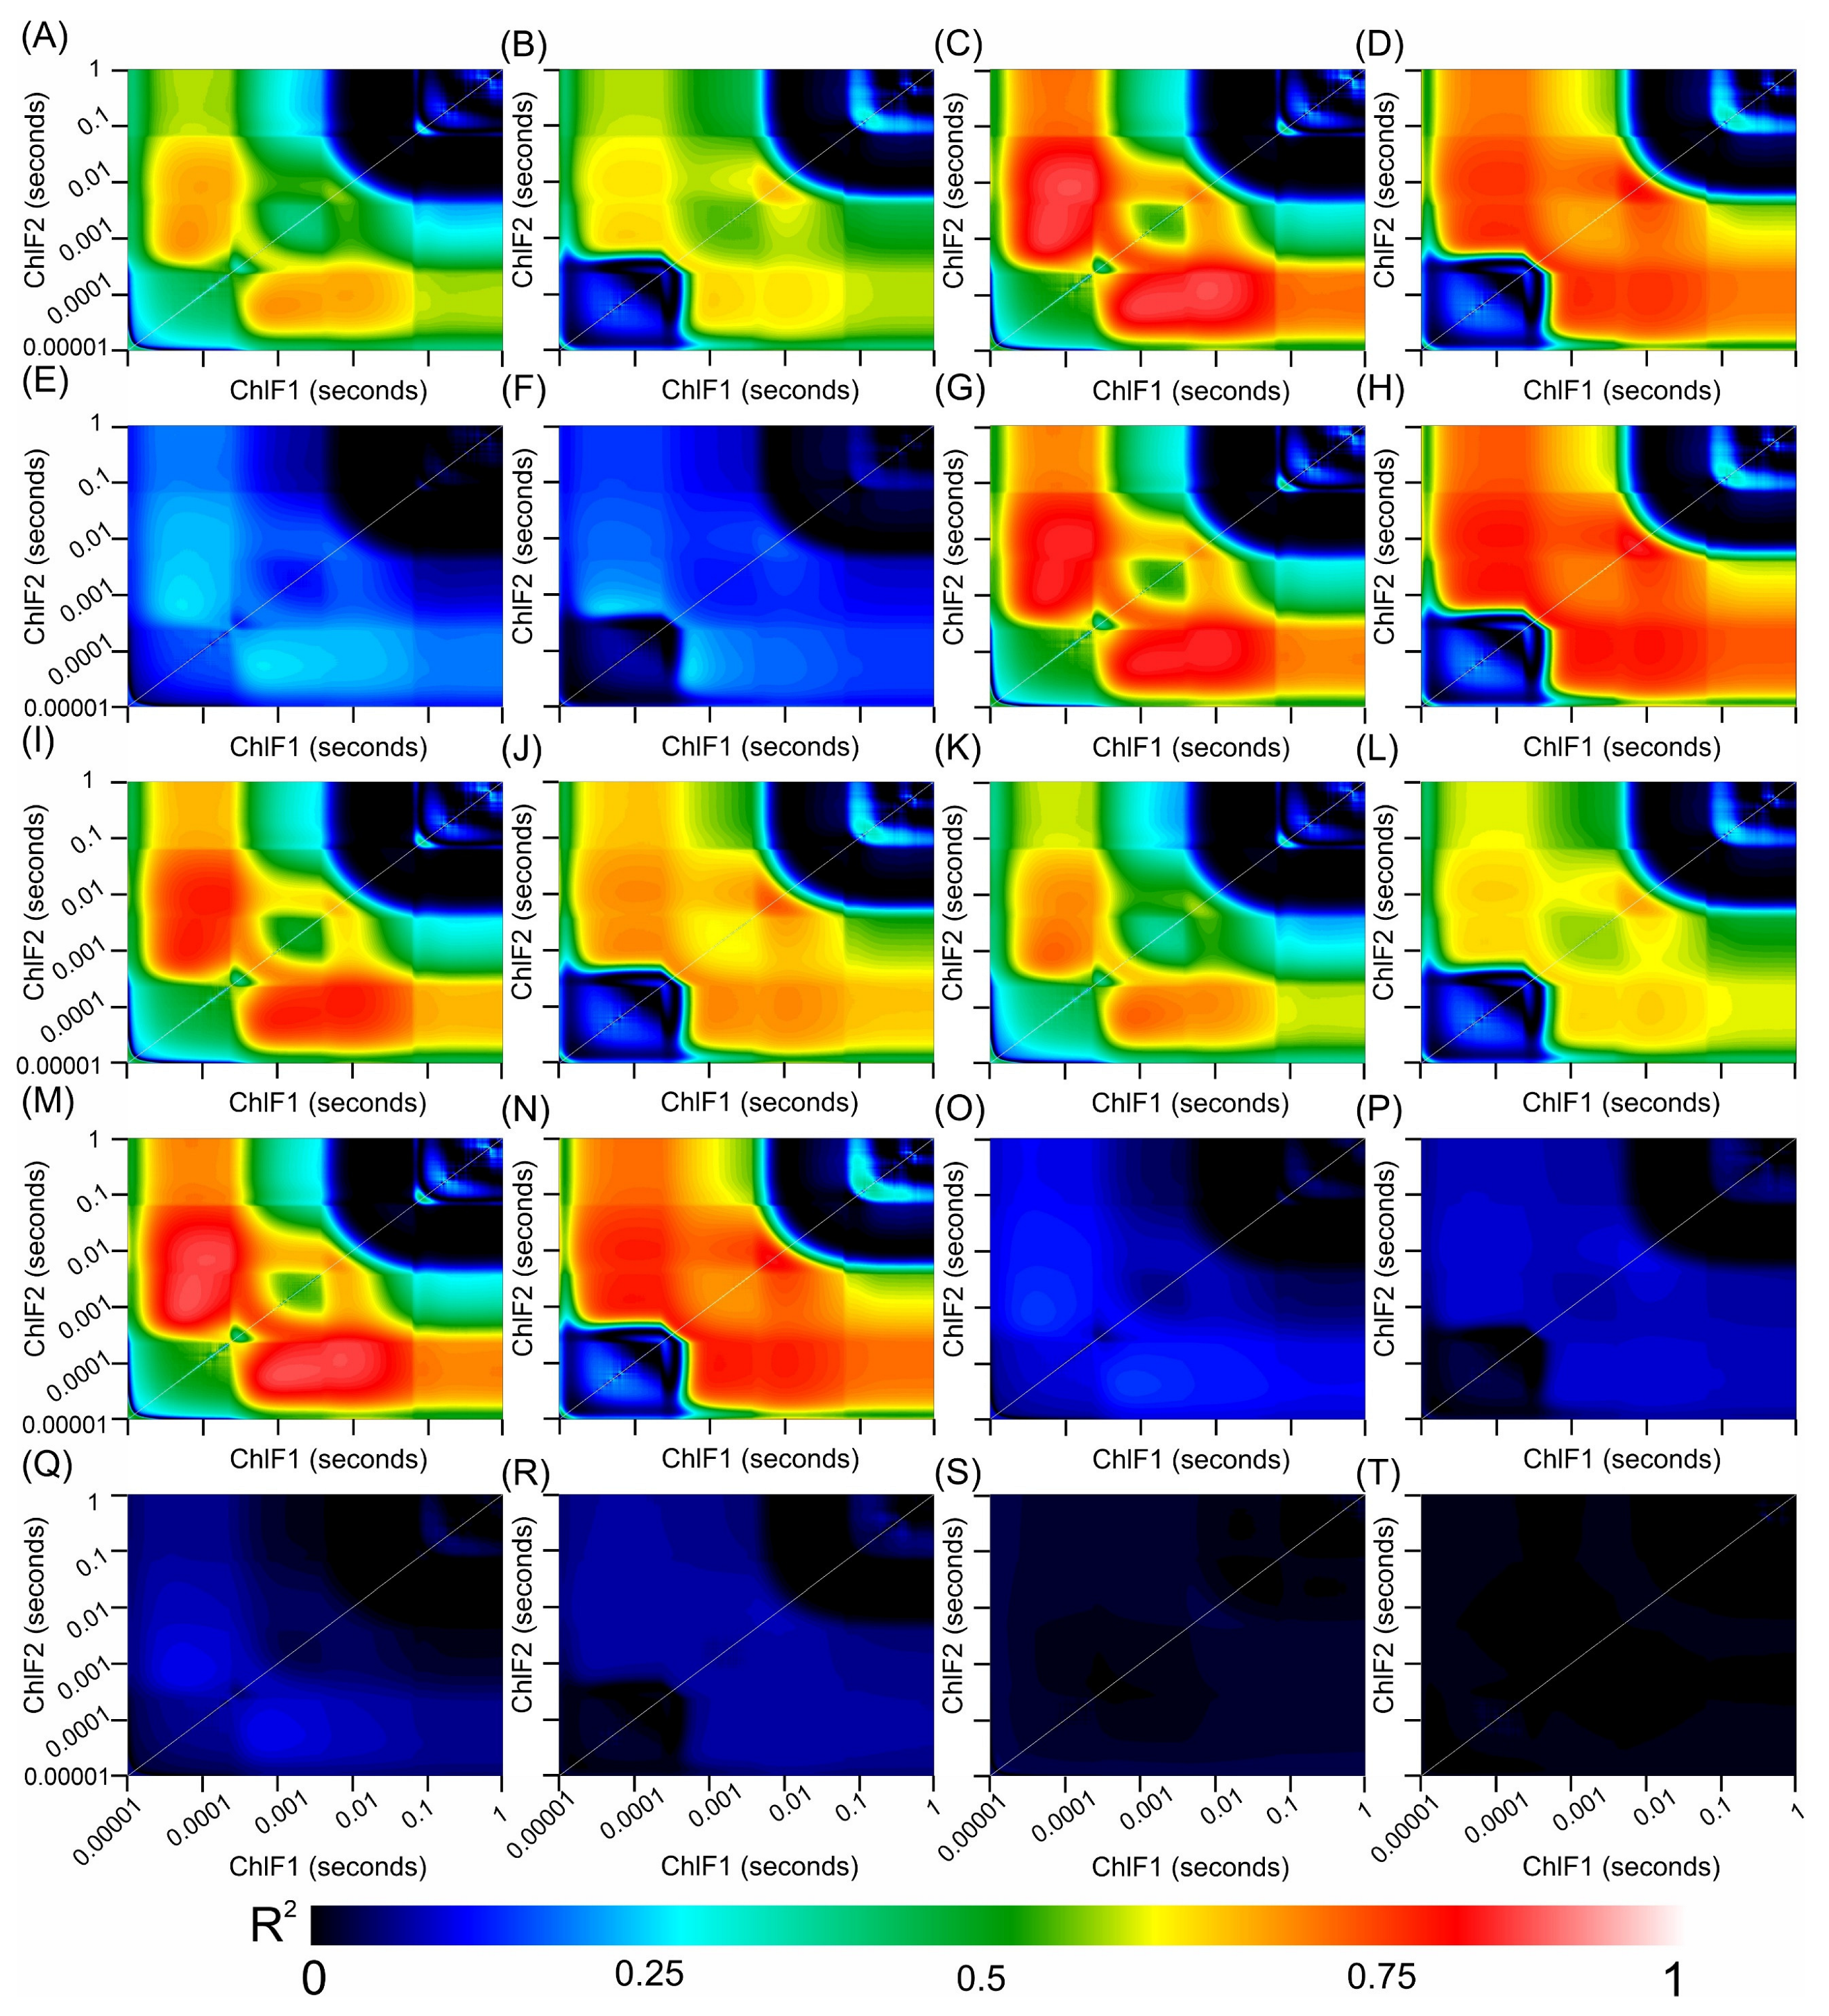
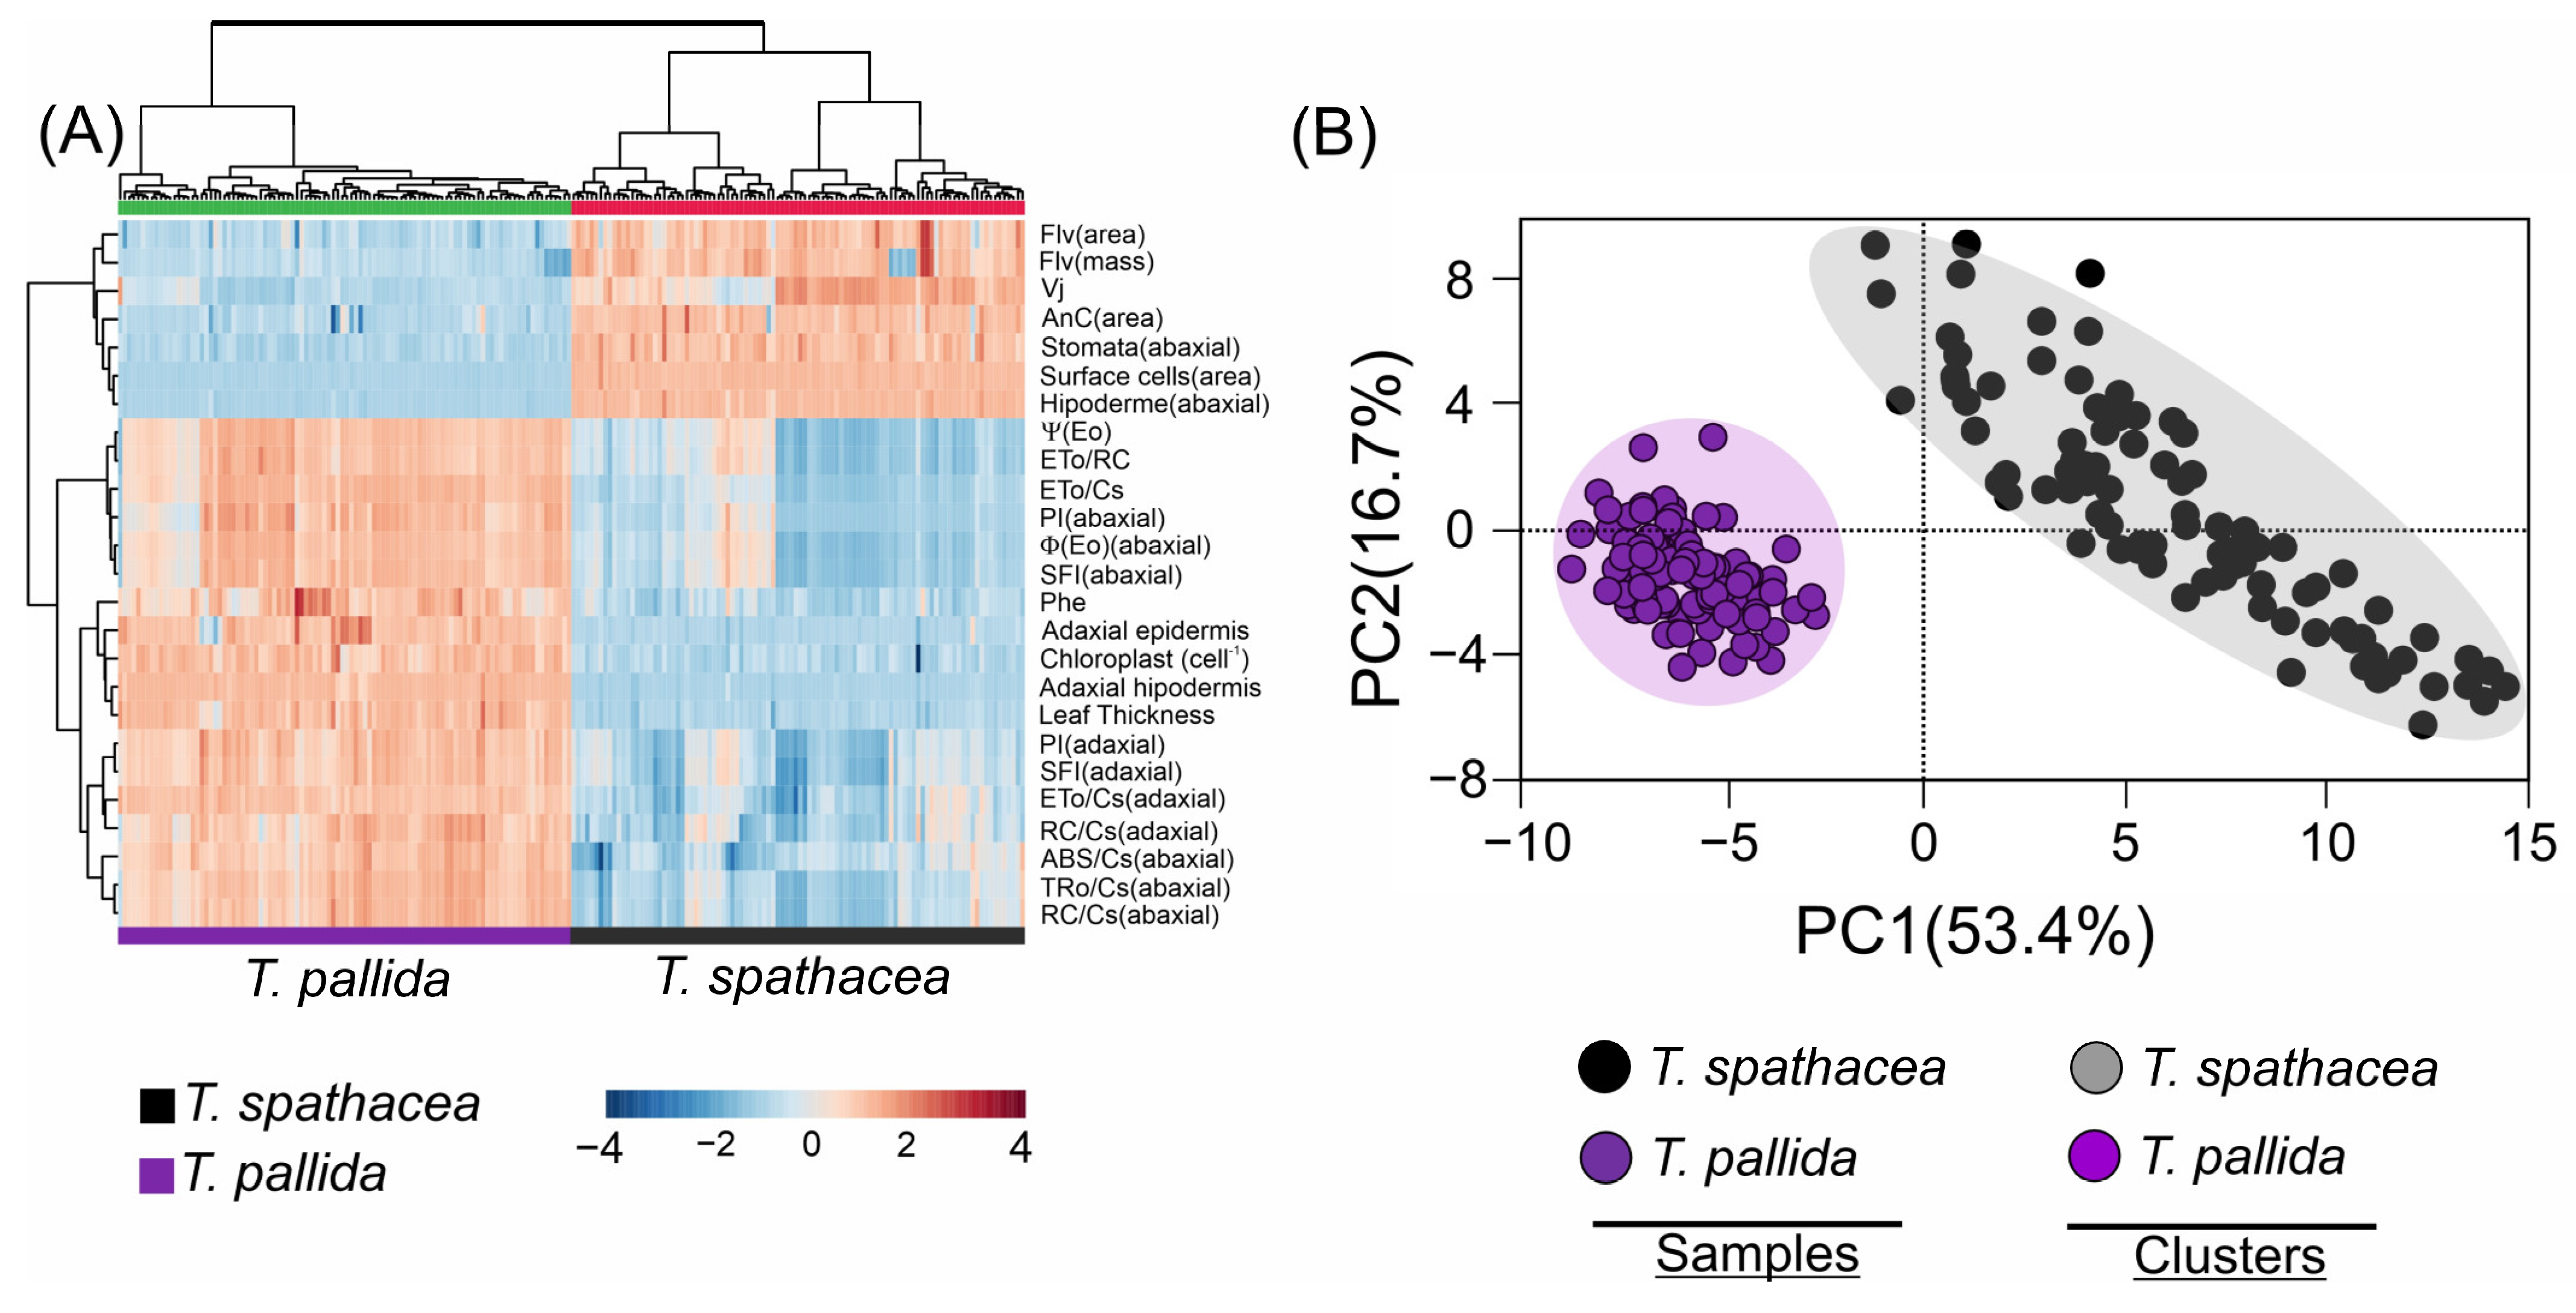
Disclaimer/Publisher’s Note: The statements, opinions and data contained in all publications are solely those of the individual author(s) and contributor(s) and not of MDPI and/or the editor(s). MDPI and/or the editor(s) disclaim responsibility for any injury to people or property resulting from any ideas, methods, instructions or products referred to in the content. |
© 2024 by the authors. Licensee MDPI, Basel, Switzerland. This article is an open access article distributed under the terms and conditions of the Creative Commons Attribution (CC BY) license (https://creativecommons.org/licenses/by/4.0/).