
1H and 31P Magnetic Resonance Spectroscopic Metabolomic Imaging: Assessing Mitogen-Activated Protein Kinase Inhibition in Melanoma
 , and
, and
Abstract
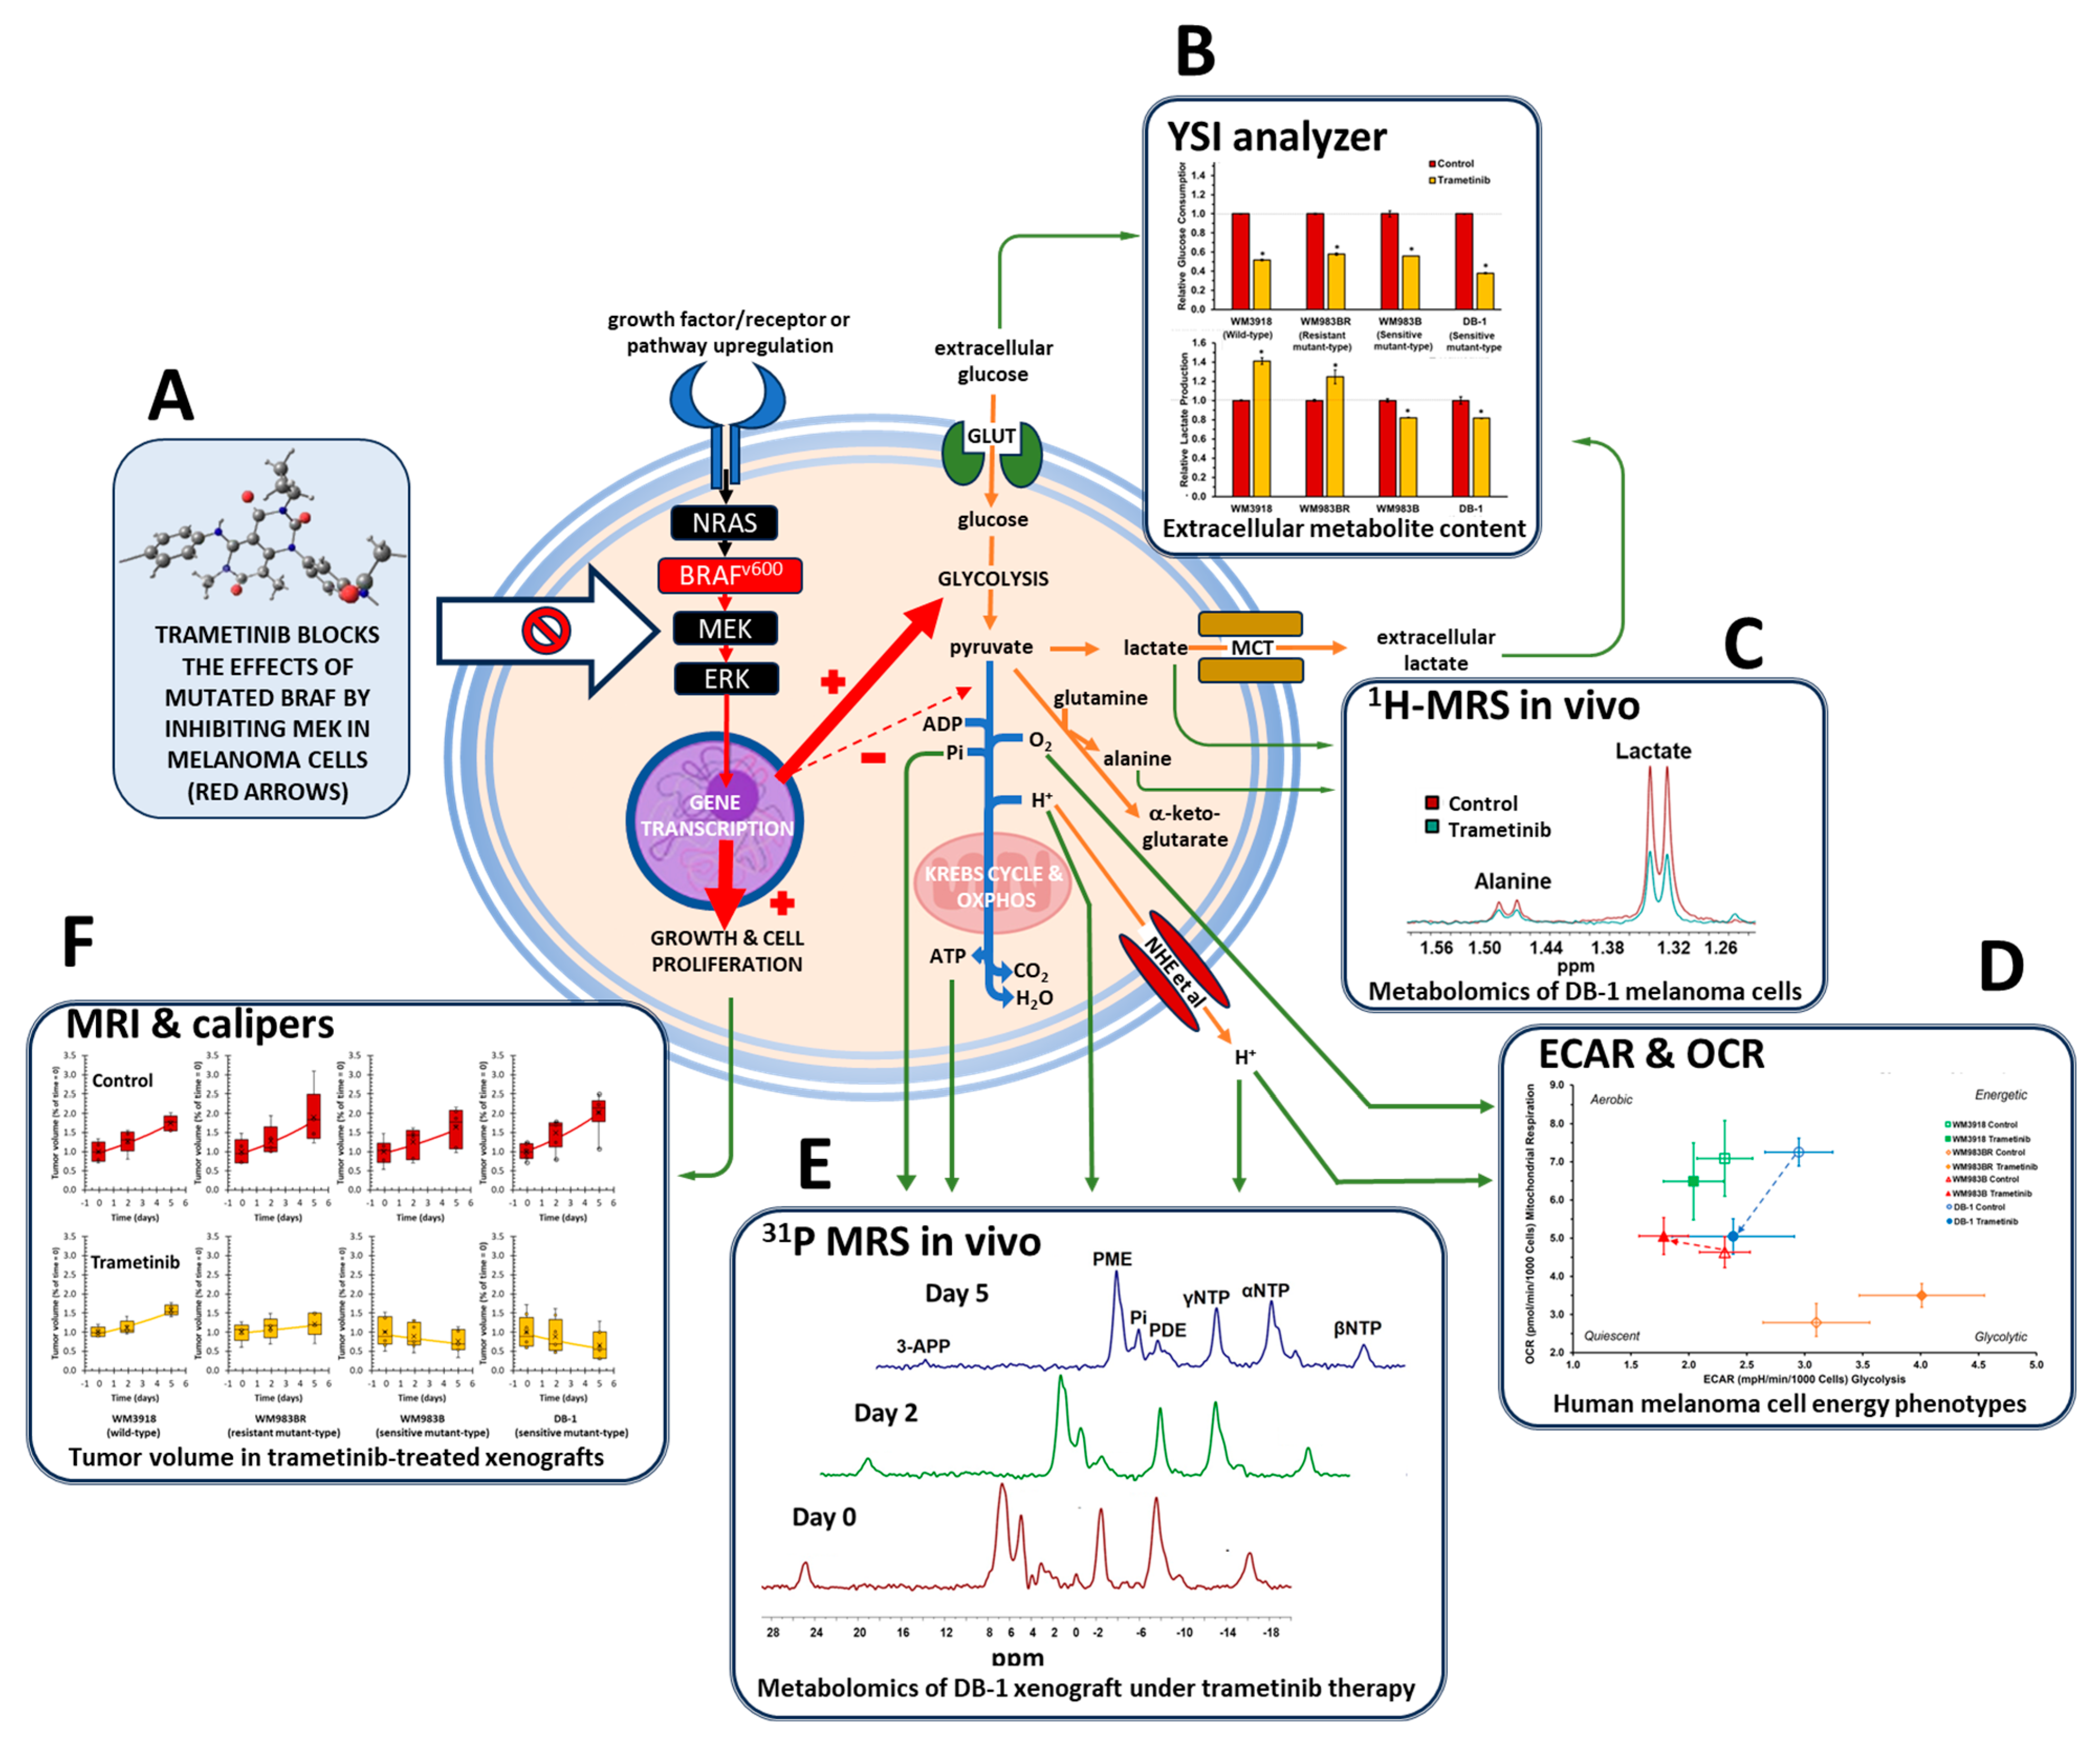
:1. Introduction
2. Materials and Methods
2.1. Reagents and MEK Inhibitor
2.2. Cell Lines and Cell Culture Conditions
2.3. Extracellular Glucose and Lactate Measurements
2.4. Mitochondrial Stress and Cell Energy Phenotype Assays
2.5. In Vitro Measurement of Intracellular Metabolites by High-Resolution 1H-MRS
2.6. Mouse Preparation for Proton (1H) and Phosphorus (31P) MRS Studies
2.7. Experiments Involving In Vivo 1H and 31P MRS
2.8. Measurement of Tumor Volume
2.9. Statistical Analysis
3. Results
3.1. Trametinib’s Impact on Glucose Consumption and Lactate Production in Melanoma In Vitro

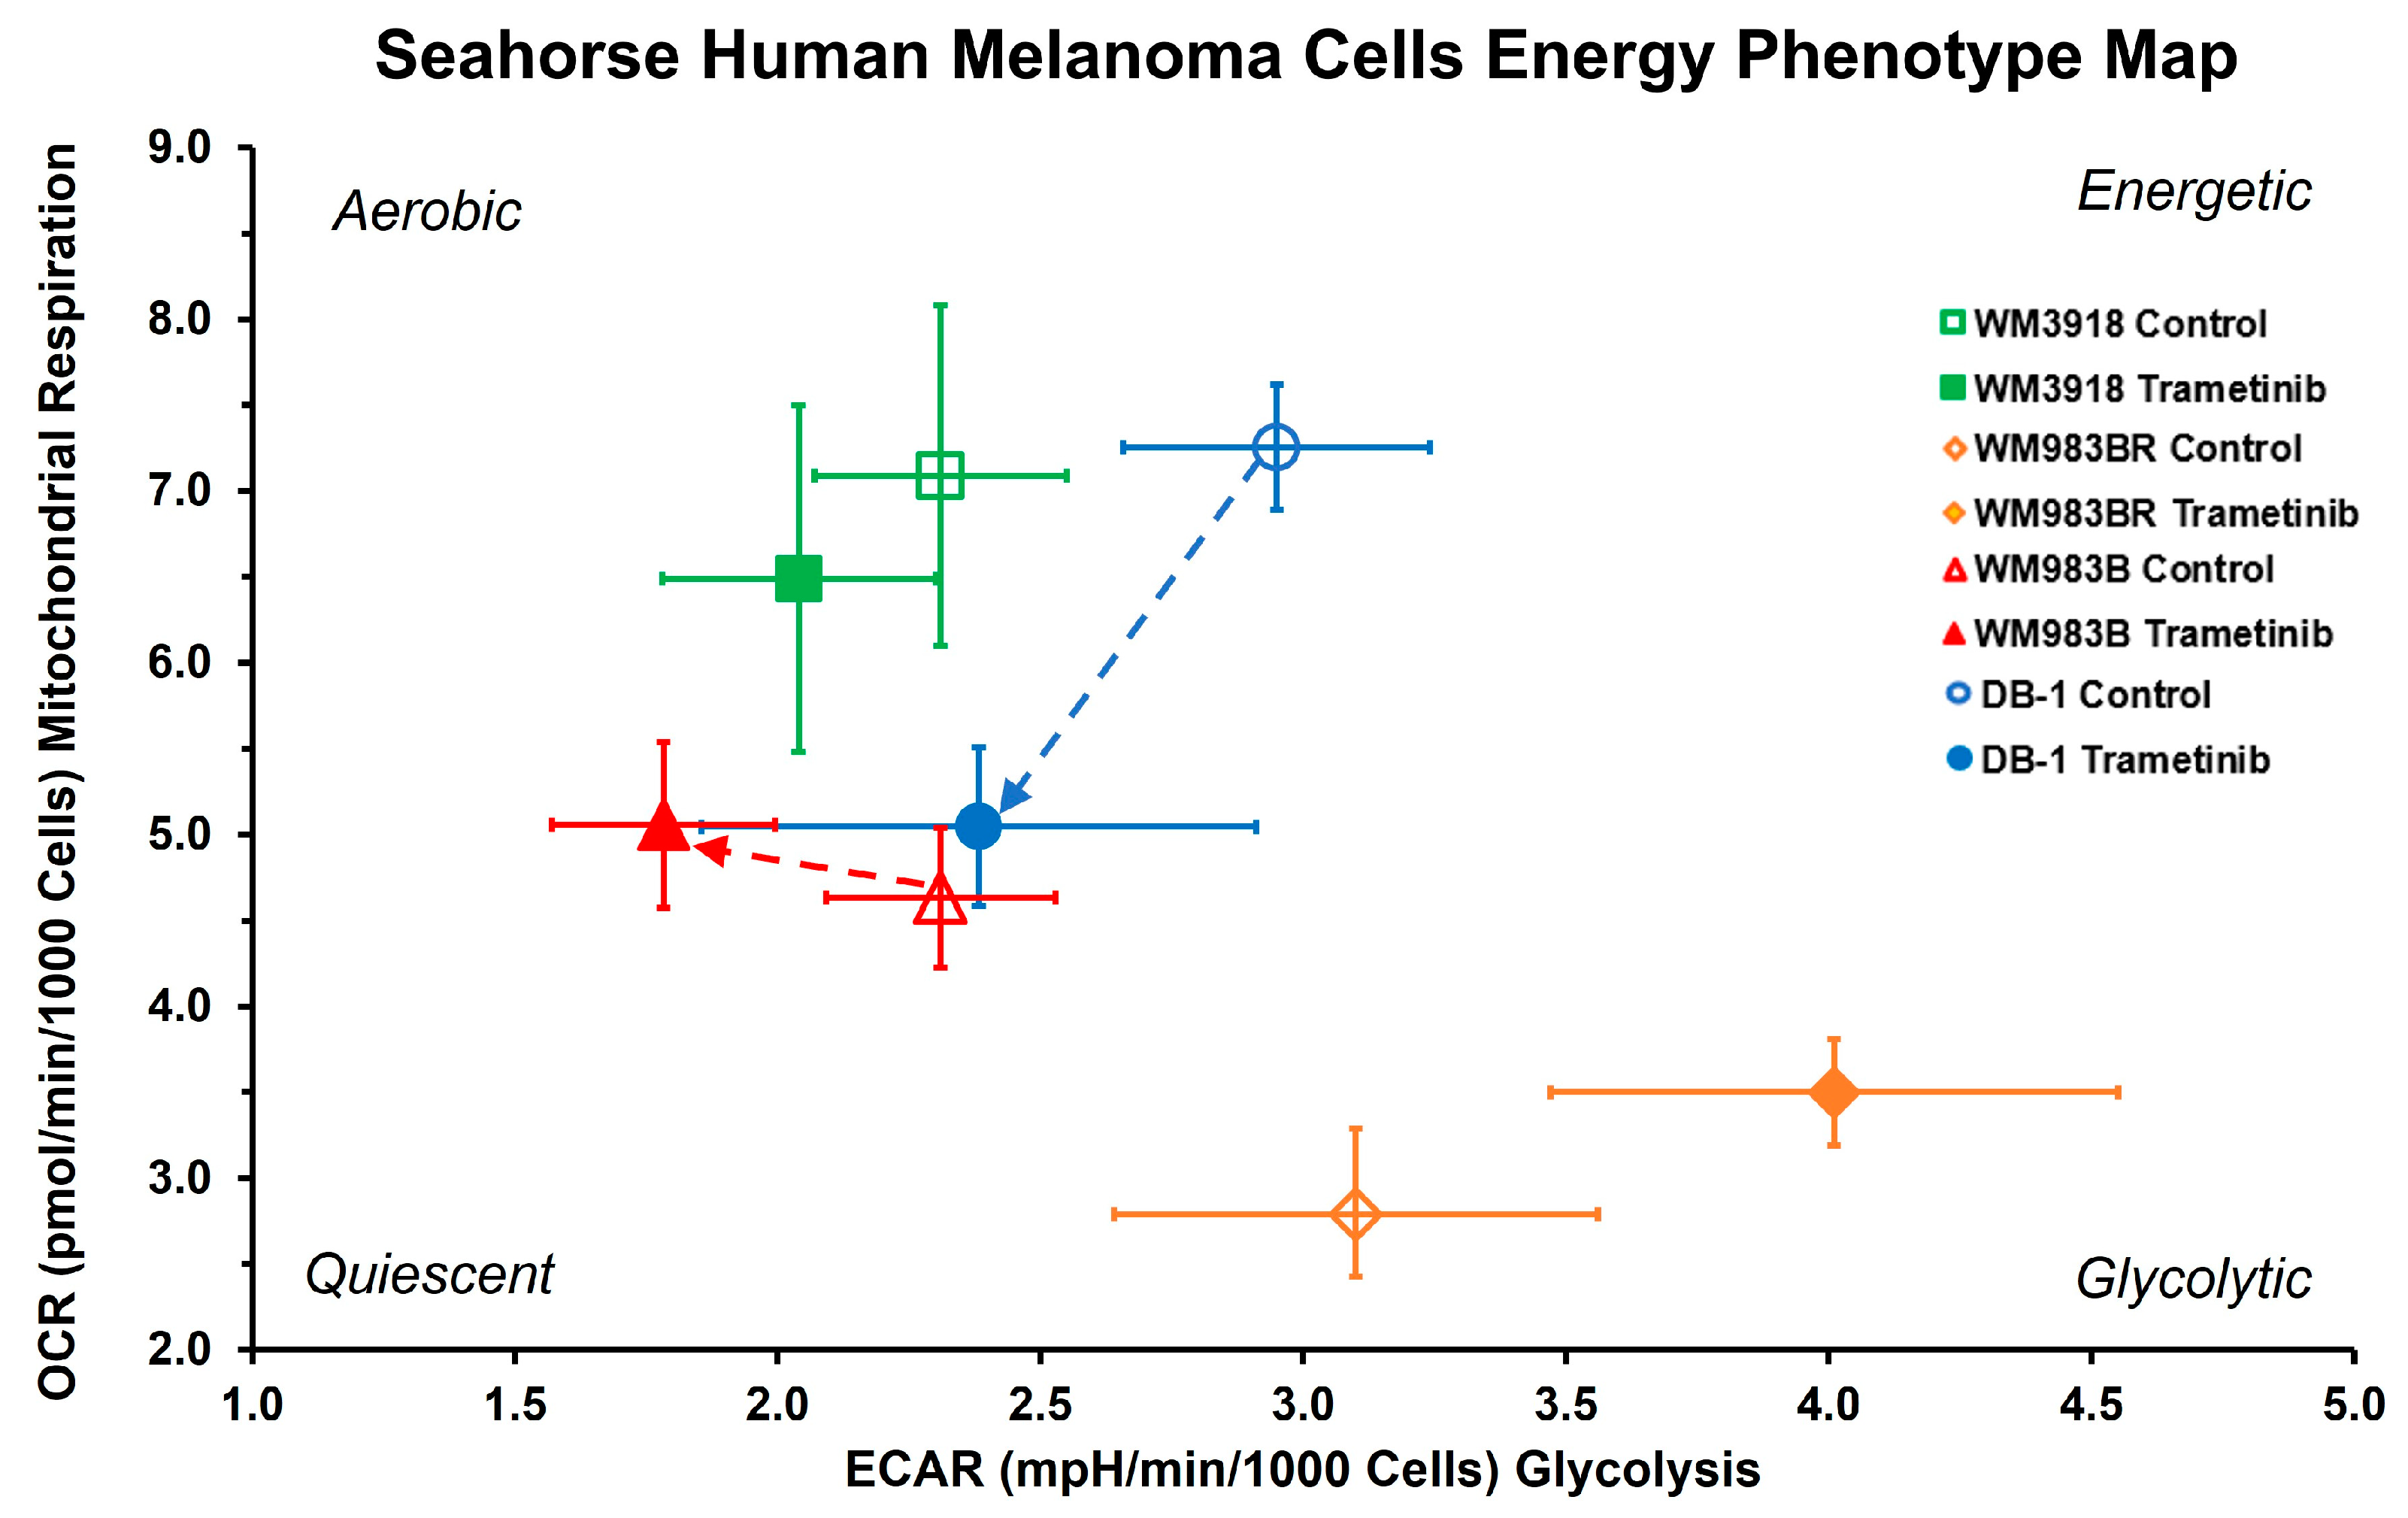
3.2. Oxygen Consumption and Extracellular Acidification Rates In Vitro

| Group | Mean ± SD (n = 8) | p-Value | |
|---|---|---|---|
| Control | Trametinib | ||
| Oxygen consumption rate (pmol/min/1000 cells) | |||
| WM3918 | 7.09 ± 0.99 | 6.49 ± 1.01 | 0.13 |
| WM983BR | 2.79 ± 0.50 | 3.50 ± 0.31 | 0.007 |
| WM983B | 4.63 ± 0.41 | 5.06 ± 0.48 | 0.014 |
| DB-1 | 7.25 ± 0.36 | 5.05 ± 0.46 | <0.001 |
| Extracellular acidification rate (pmol/min/1000 cells) | |||
| WM3918 | 2.31 ± 0.24 | 2.04 ± 0.26 | 0.011 |
| WM983BR | 3.10 ± 0.46 | 4.01 ± 0.54 | 0.015 |
| WM983B | 2.31 ± 0.22 | 1.78 ± 0.21 | 0.001 |
| DB-1 | 2.95 ± 0.29 | 2.38 ± 0.53 | 0.001 |
| OCR/ECAR ratio—cell energy phenotype | |||
| WM3918 | 3.08 ± 0.37 | 3.18 ± 0.29 | 0.46 |
| WM983BR | 0.90 ± 0.12 | 0.88 ± 0.08 | 0.71 |
| WM983B | 2.02 ± 0.22 | 2.89 ± 0.55 | <0.001 |
| DB-1 | 2.48 ± 0.28 | 2.17 ± 0.33 | 0.01 |
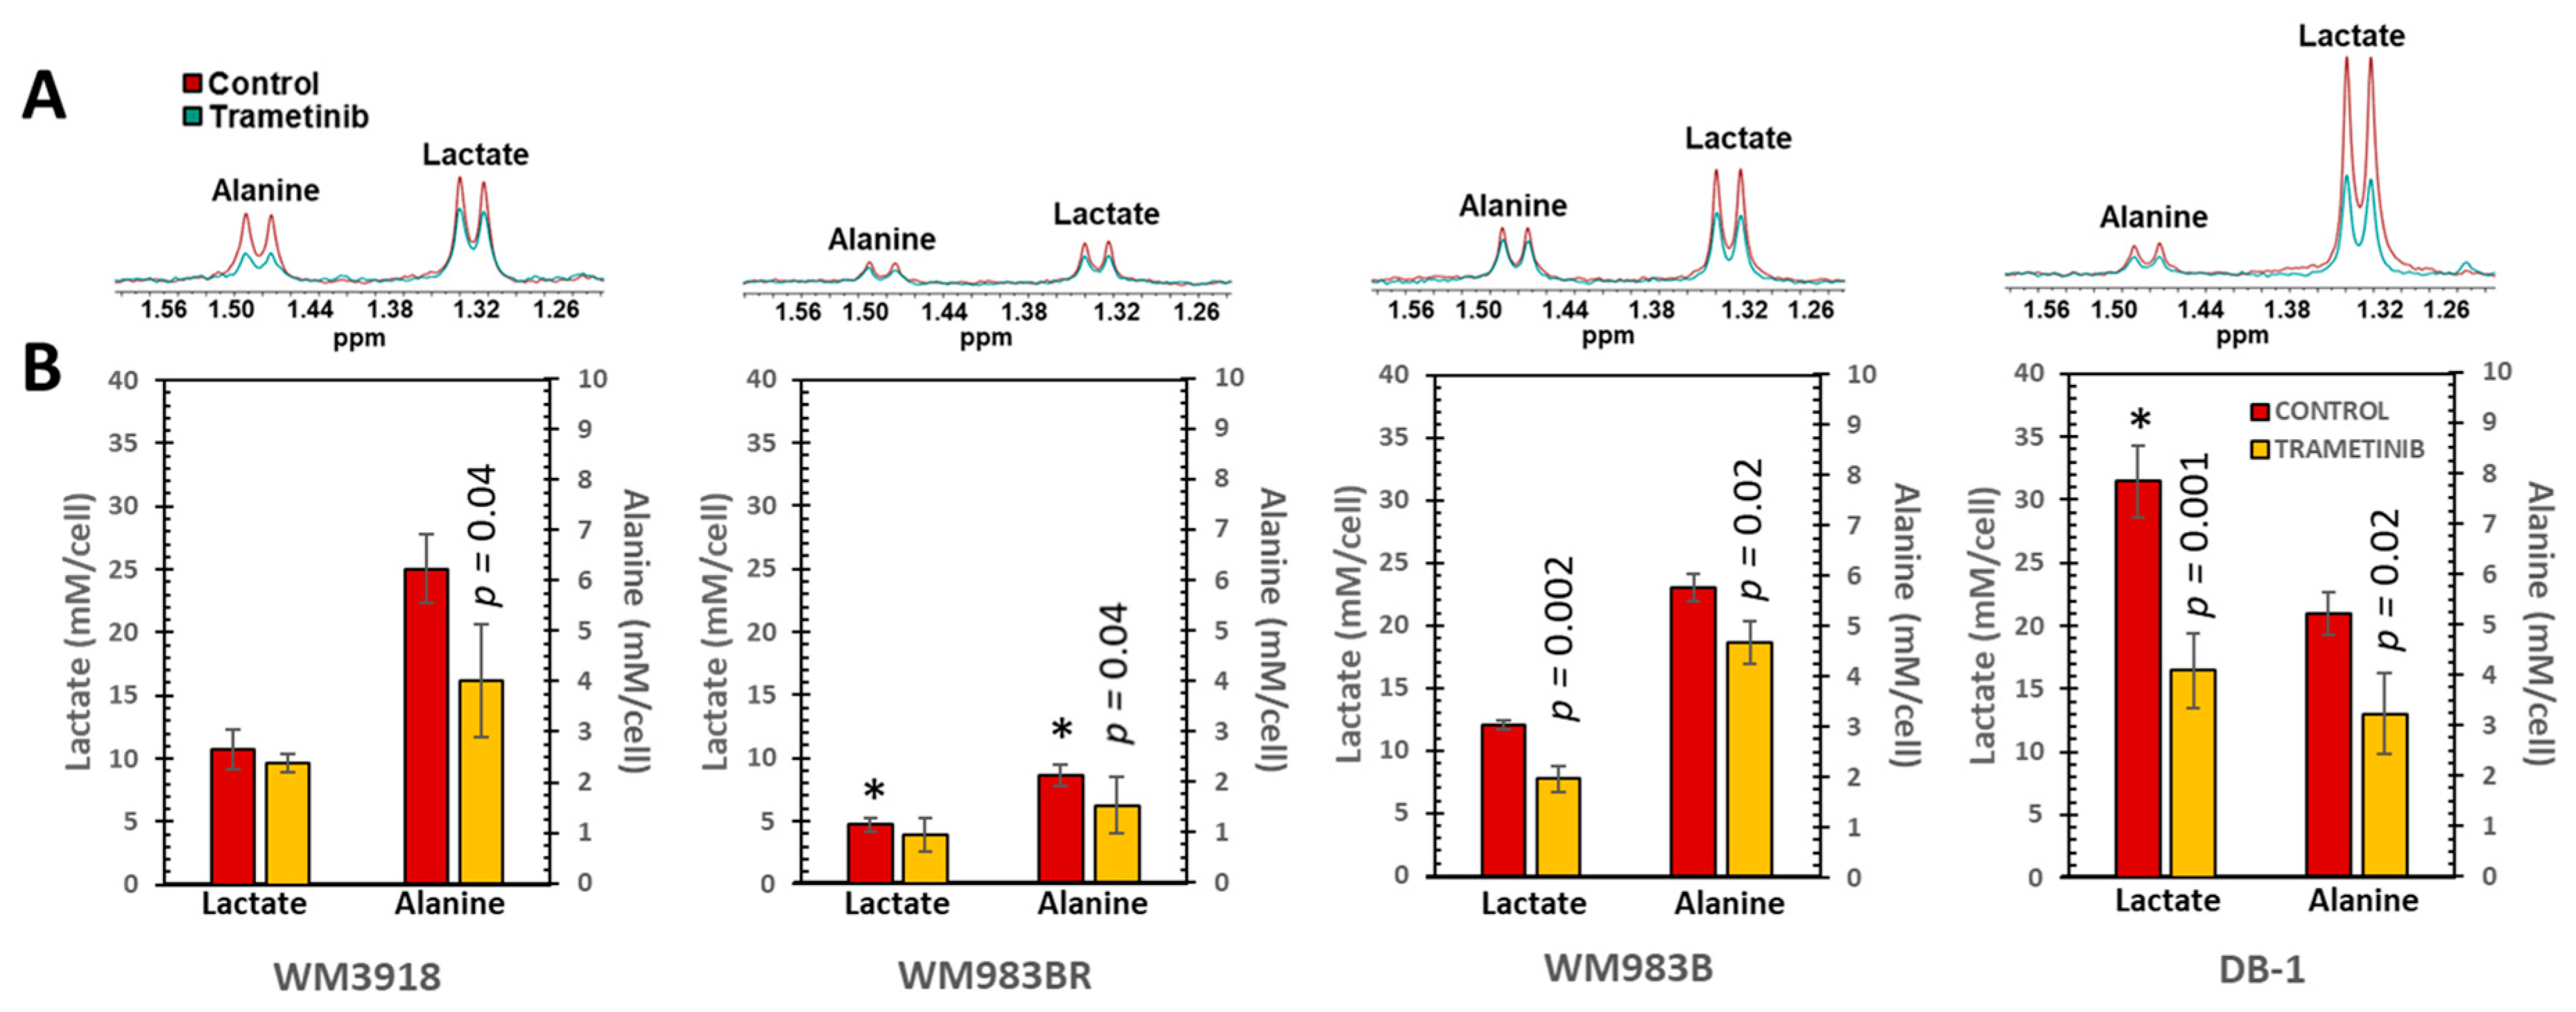
3.3. In Vitro 1H MRS to Test the Metabolic Response to Trametinib in Isolated Melanoma Cells
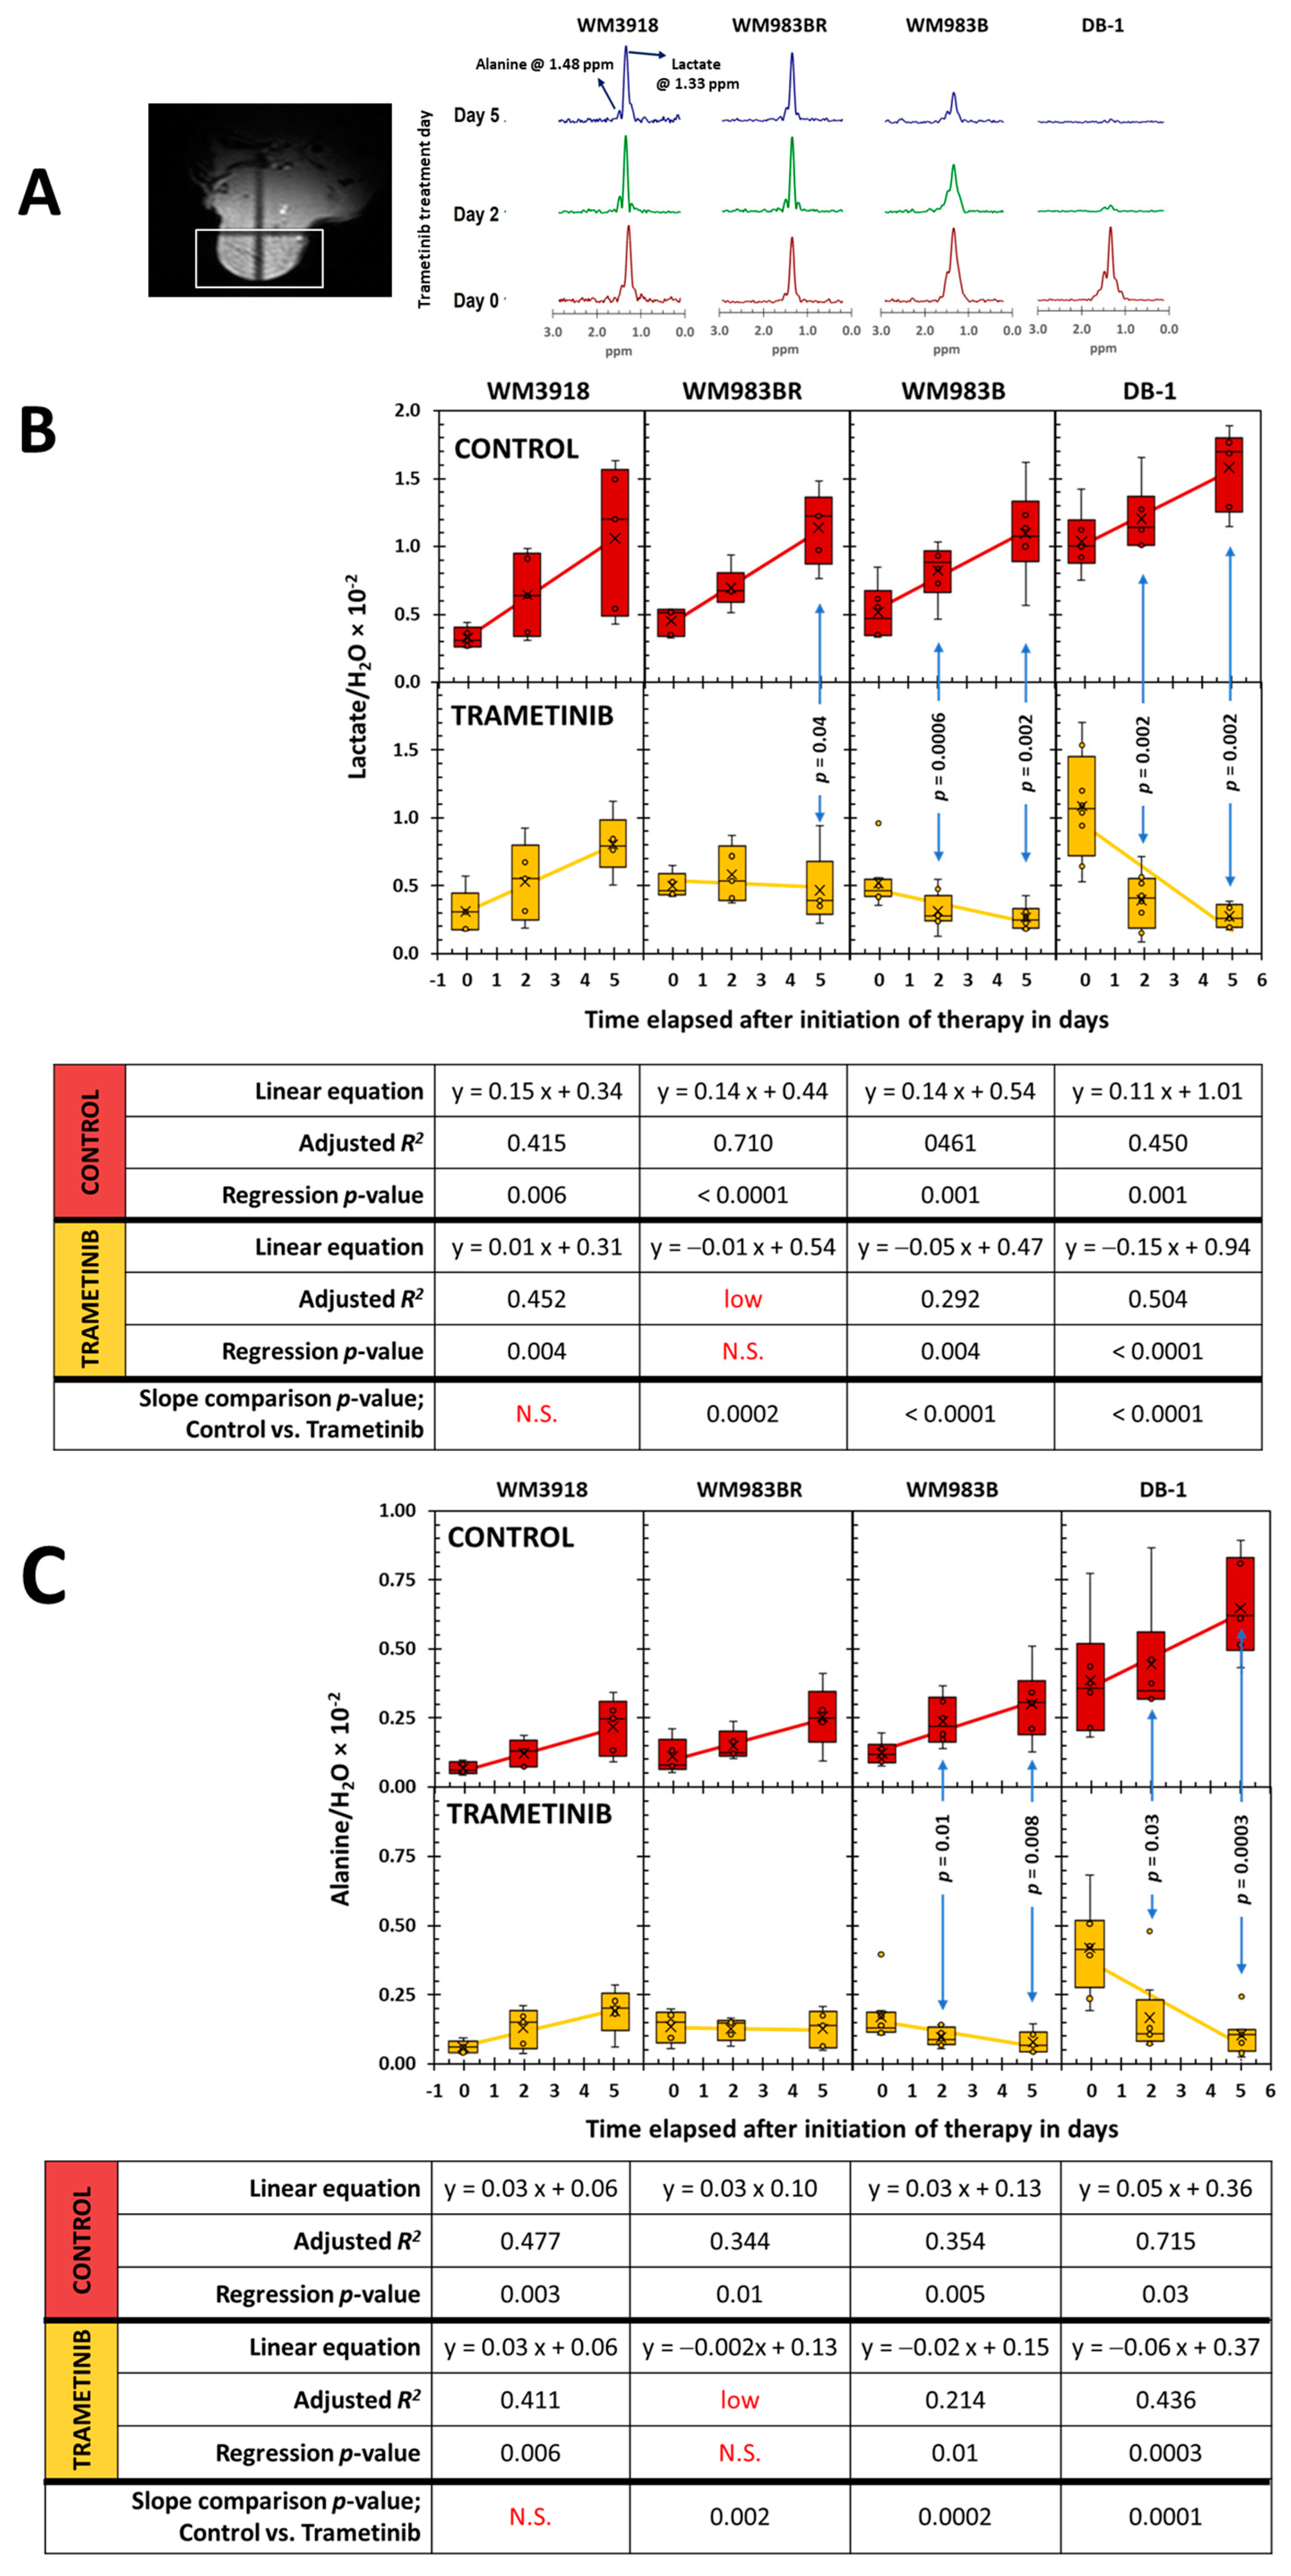
3.4. In Vivo 1H- and 31P- MRS of Melanoma Xenografts in Mice

3.5. Assessment of Tumor Growth Following Trametinib Treatment

4. Discussion
5. Conclusions
Author Contributions
Funding
Institutional Review Board Statement
Informed Consent Statement
Data Availability Statement
Acknowledgments
Conflicts of Interest
References
- Roesch, A.; Berking, C. Melanoma. In Braun-Falco’s Dermatology; Plewig, G., French, L., Ruzicka, T., Kaufmann, R., Hertl, M., Eds.; Springer: Berlin/Heidelberg, Germany, 2022; pp. 1855–1871. [Google Scholar]
- Saginala, K.; Barsouk, A.; Aluru, J.S.; Rawla, P.; Barsouk, A. Epidemiology of Melanoma. Med. Sci. 2021, 9, 63. [Google Scholar] [CrossRef]
- Davis, L.E.; Shalin, S.C.; Tackett, A.J. Current state of melanoma diagnosis and treatment. Cancer Biol. Ther. 2019, 20, 1366–1379. [Google Scholar] [CrossRef]
- Sandru, A.; Voinea, S.; Panaitescu, E.; Blidaru, A. Survival rates of patients with metastatic malignant melanoma. J. Med. Life 2014, 7, 572–576. [Google Scholar] [PubMed]
- Quaglino, P.; Fava, P.; Tonella, L.; Rubatto, M.; Ribero, S.; Fierro, M.T. Treatment of Advanced Metastatic Melanoma. Dermatol. Pract. Concept. 2021, 11, e2021164S. [Google Scholar] [CrossRef]
- Polkowska, M.; Ekk-Cierniakowski, P.; Czepielewska, E.; Kozłowska-Wojciechowska, M. Efficacy and safety of BRAF inhibitors and anti-CTLA4 antibody in melanoma patients-real-world data. Eur. J. Clin. Pharmacol. 2019, 75, 329–334. [Google Scholar] [CrossRef] [PubMed]
- Wang, X.; Luo, Z.; Chen, J.; Chen, Y.; Ji, D.; Fan, L.; Chen, L.; Zhao, Q.; Hu, P.; Sun, P.; et al. First-in-human phase I dose-escalation and dose-expansion trial of the selective MEK inhibitor HL-085 in patients with advanced melanoma harboring NRAS mutations. BMC Med. 2023, 21, 2. [Google Scholar] [CrossRef]
- Pavri, S.N.; Clune, J.; Ariyan, S.; Narayan, D. Malignant Melanoma: Beyond the Basics. Plast. Reconstr. Surg. 2016, 138, 330e–340e. [Google Scholar] [CrossRef]
- Lopes, J.; Rodrigues, C.M.P.; Gaspar, M.M.; Reis, C.P. Melanoma Management: From Epidemiology to Treatment and Latest Advances. Cancers 2022, 14, 4652. [Google Scholar] [CrossRef] [PubMed]
- Gupta, P.K.; Orlovskiy, S.; Arias-Mendoza, F.; Nelson, D.S.; Osborne, A.; Pickup, S.; Glickson, J.D.; Nath, K. Metabolic Imaging Biomarkers of Response to Signaling Inhibition Therapy in Melanoma. Cancers 2024, 16, 365. [Google Scholar] [CrossRef]
- Sithanandam, G.; Kolch, W.; Duh, F.M.; Rapp, U.R. Complete coding sequence of a human B-raf cDNA and detection of B-raf protein kinase with isozyme specific antibodies. Oncogene 1990, 5, 1775–1780. [Google Scholar]
- Sithanandam, G.; Druck, T.; Cannizzaro, L.A.; Leuzzi, G.; Huebner, K.; Rapp, U.R. B-raf and a B-raf pseudogene are located on 7q in man. Oncogene 1992, 7, 795–799. [Google Scholar] [PubMed]
- Dérijard, B.; Raingeaud, J.; Barrett, T.; Wu, I.H.; Han, J.; Ulevitch, R.J.; Davis, R.J. Independent human MAP-kinase signal transduction pathways defined by MEK and MKK isoforms. Science 1995, 267, 682–685. [Google Scholar] [CrossRef] [PubMed]
- Falck Miniotis, M.; Arunan, V.; Eykyn, T.R.; Marais, R.; Workman, P.; Leach, M.O.; Beloueche-Babari, M. MEK1/2 inhibition decreases lactate in BRAF-driven human cancer cells. Cancer Res. 2013, 73, 4039–4049. [Google Scholar] [CrossRef] [PubMed]
- Strashilov, S.; Yordanov, A. Aetiology and Pathogenesis of Cutaneous Melanoma: Current Concepts and Advances. Int. J. Mol. Sci. 2021, 22, 6395. [Google Scholar] [CrossRef] [PubMed]
- Scheffzek, K.; Shivalingaiah, G. Ras-Specific GTPase-Activating Proteins-Structures, Mechanisms, and Interactions. Cold Spring Harb. Perspect. Med. 2019, 9, a031500. [Google Scholar] [CrossRef] [PubMed]
- Hall, A.; Meyle, K.D.; Lange, M.K.; Klima, M.; Sanderhoff, M.; Dahl, C.; Abildgaard, C.; Thorup, K.; Moghimi, S.M.; Jensen, P.B.; et al. Dysfunctional oxidative phosphorylation makes malignant melanoma cells addicted to glycolysis driven by the (V600E)BRAF oncogene. Oncotarget 2013, 4, 584–599. [Google Scholar] [CrossRef] [PubMed]
- Hosseini, M.; Kasraian, Z.; Rezvani, H.R. Energy metabolism in skin cancers: A therapeutic perspective. Biochim. Biophys. Acta Bioenerg. 2017, 1858, 712–722. [Google Scholar] [CrossRef] [PubMed]
- Paluncic, J.; Kovacevic, Z.; Jansson, P.J.; Kalinowski, D.; Merlot, A.M.; Huang, M.L.; Lok, H.C.; Sahni, S.; Lane, D.J.; Richardson, D.R. Roads to melanoma: Key pathways and emerging players in melanoma progression and oncogenic signaling. Biochim. Biophys. Acta 2016, 1863, 770–784. [Google Scholar] [CrossRef]
- Huang, C.; Radi, R.H.; Arbiser, J.L. Mitochondrial Metabolism in Melanoma. Cells 2021, 10, 3197. [Google Scholar] [CrossRef]
- Baenke, F.; Chaneton, B.; Smith, M.; Van Den Broek, N.; Hogan, K.; Tang, H.; Viros, A.; Martin, M.; Galbraith, L.; Girotti, M.R.; et al. Resistance to BRAF inhibitors induces glutamine dependency in melanoma cells. Mol. Oncol. 2016, 10, 73–84. [Google Scholar] [CrossRef]
- Pickup, S.; Lee, S.C.; Mancuso, A.; Glickson, J.D. Lactate imaging with Hadamard-encoded slice-selective multiple quantum coherence chemical-shift imaging. Magn. Reson. Med. 2008, 60, 299–305. [Google Scholar] [CrossRef] [PubMed]
- Nath, K.; Nelson, D.S.; Ho, A.M.; Lee, S.C.; Darpolor, M.M.; Pickup, S.; Zhou, R.; Heitjan, D.F.; Leeper, D.B.; Glickson, J.D. (31) P and (1) H MRS of DB-1 melanoma xenografts: Lonidamine selectively decreases tumor intracellular pH and energy status and sensitizes tumors to melphalan. NMR Biomed. 2013, 26, 98–105. [Google Scholar] [CrossRef] [PubMed]
- Rata, M.; Giles, S.L.; deSouza, N.M.; Leach, M.O.; Payne, G.S. Comparison of three reference methods for the measurement of intracellular pH using 31P MRS in healthy volunteers and patients with lymphoma. NMR Biomed. 2014, 27, 158–162. [Google Scholar] [CrossRef] [PubMed]
- Goodwin, M.L.; Gladden, L.B.; Nijsten, M.W.; Jones, K.B. Lactate and cancer: Revisiting the warburg effect in an era of lactate shuttling. Front. Nutr. 2014, 1, 27. [Google Scholar] [CrossRef]
- Koppenol, W.H.; Bounds, P.L.; Dang, C.V. Otto Warburg’s contributions to current concepts of cancer metabolism. Nat. Rev. Cancer 2011, 11, 325–337. [Google Scholar] [CrossRef]
- Liberti, M.V.; Locasale, J.W. The Warburg Effect: How Does it Benefit Cancer Cells? Trends Biochem. Sci. 2016, 41, 211–218. [Google Scholar] [CrossRef]
- Vander Heiden, M.G.; Cantley, L.C.; Thompson, C.B. Understanding the Warburg effect: The metabolic requirements of cell proliferation. Science 2009, 324, 1029–1033. [Google Scholar] [CrossRef]
- Orlovskiy, S.; Gupta, P.K.; Roman, J.; Arias-Mendoza, F.; Nelson, D.S.; Koch, C.J.; Narayan, V.; Putt, M.E.; Nath, K. Lonidamine Induced Selective Acidification and De-Energization of Prostate Cancer Xenografts: Enhanced Tumor Response to Radiation Therapy. Cancers 2024, 16, 1384. [Google Scholar] [CrossRef] [PubMed]
- Ascierto, P.A.; Dummer, R.; Gogas, H.J.; Arance, A.; Mandala, M.; Liszkay, G.; Garbe, C.; Schadendorf, D.; Krajsova, I.; Gutzmer, R.; et al. Contribution of MEK Inhibition to BRAF/MEK Inhibitor Combination Treatment of BRAF-Mutant Melanoma: Part 2 of the Randomized, Open-Label, Phase III COLUMBUS Trial. J. Clin. Oncol. 2023, 41, 4621–4631. [Google Scholar] [CrossRef]
- Salama, A.K.S.; Li, S.; Macrae, E.R.; Park, J.I.; Mitchell, E.P.; Zwiebel, J.A.; Chen, H.X.; Gray, R.J.; McShane, L.M.; Rubinstein, L.V.; et al. Dabrafenib and Trametinib in Patients With Tumors with BRAF(V600E) Mutations: Results of the NCI-MATCH Trial Subprotocol H. J. Clin. Oncol. 2020, 38, 3895–3904. [Google Scholar] [CrossRef]
- Dillon, M.; Lopez, A.; Lin, E.; Sales, D.; Perets, R.; Jain, P. Progress on Ras/MAPK Signaling Research and Targeting in Blood and Solid Cancers. Cancers 2021, 13, 5059. [Google Scholar] [CrossRef] [PubMed]
- Zhang, P.; Guan, H.; Yuan, S.; Cheng, H.; Zheng, J.; Zhang, Z.; Liu, Y.; Yu, Y.; Meng, Z.; Zheng, X.; et al. Targeting myeloid derived suppressor cells reverts immune suppression and sensitizes BRAF-mutant papillary thyroid cancer to MAPK inhibitors. Nat. Commun. 2022, 13, 1588. [Google Scholar] [CrossRef] [PubMed]
- Flaherty, K.T.; Robert, C.; Hersey, P.; Nathan, P.; Garbe, C.; Milhem, M.; Demidov, L.V.; Hassel, J.C.; Rutkowski, P.; Mohr, P.; et al. Improved survival with MEK inhibition in BRAF-mutated melanoma. N. Engl. J. Med. 2012, 367, 107–114. [Google Scholar] [CrossRef] [PubMed]
- Bahar, M.E.; Kim, H.J.; Kim, D.R. Targeting the RAS/RAF/MAPK pathway for cancer therapy: From mechanism to clinical studies. Signal Transduct. Target. Ther. 2023, 8, 455. [Google Scholar] [CrossRef] [PubMed]
- Li, L.; Zhao, G.D.; Shi, Z.; Qi, L.L.; Zhou, L.Y.; Fu, Z.X. The Ras/Raf/MEK/ERK signaling pathway and its role in the occurrence and development of HCC. Oncol. Lett. 2016, 12, 3045–3050. [Google Scholar] [CrossRef] [PubMed]
- Yue, J.; López, J.M. Understanding MAPK Signaling Pathways in Apoptosis. Int. J. Mol. Sci. 2020, 21, 2346. [Google Scholar] [CrossRef] [PubMed]
- Lin, X.; Xiao, Z.; Chen, T.; Liang, S.H.; Guo, H. Glucose Metabolism on Tumor Plasticity, Diagnosis, and Treatment. Front. Oncol. 2020, 10, 317. [Google Scholar] [CrossRef] [PubMed]
- Beasley, G.M.; Parsons, C.; Broadwater, G.; Selim, M.A.; Marzban, S.; Abernethy, A.P.; Salama, A.K.; Eikman, E.A.; Wong, T.; Zager, J.S.; et al. A multicenter prospective evaluation of the clinical utility of F-18 FDG-PET/CT in patients with AJCC stage IIIB or IIIC extremity melanoma. Ann. Surg. 2012, 256, 350–356. [Google Scholar] [CrossRef] [PubMed]
- Strobel, K.; Skalsky, J.; Steinert, H.C.; Dummer, R.; Hany, T.F.; Bhure, U.; Seifert, B.; Perez Lago, M.; Joller-Jemelka, H.; Kalff, V. S-100B and FDG-PET/CT in therapy response assessment of melanoma patients. Dermatology 2007, 215, 192–201. [Google Scholar] [CrossRef] [PubMed]
- Van de Wiele, C.; Juanito, G.; Vander, B.K.; Lawal, I.; Sathekge, M.; Maes, A.; De Spiegeleer, B. Practical Considerations When Interpreting FDG PET/CT Imaging for Staging and Treatment Response Assessment in Melanoma Patients. Semin. Nucl. Med. 2021, 51, 544–553. [Google Scholar] [CrossRef]
- Perng, P.; Marcus, C.; Subramaniam, R.M. (18)F-FDG PET/CT and Melanoma: Staging, Immune Modulation and Mutation-Targeted Therapy Assessment, and Prognosis. AJR Am. J. Roentgenol. 2015, 205, 259–270. [Google Scholar] [CrossRef] [PubMed]
- Weber, P.; Arnold, A.; Hohmann, J. Comparison of 18F-FDG PET/CT and ultrasound in staging of patients with malignant melanoma. Medicine 2022, 101, e31092. [Google Scholar] [CrossRef] [PubMed]
- Capparelli, C.; Purwin, T.J.; Heilman, S.A.; Chervoneva, I.; McCue, P.A.; Berger, A.C.; Davies, M.A.; Gershenwald, J.E.; Krepler, C.; Aplin, A.E. ErbB3 Targeting Enhances the Effects of MEK Inhibitor in Wild-Type BRAF/NRAS Melanoma. Cancer Res. 2018, 78, 5680–5693. [Google Scholar] [CrossRef]
- Chen, W.; Park, J.I. Tumor Cell Resistance to the Inhibition of BRAF and MEK1/2. Int. J. Mol. Sci. 2023, 24, 4837. [Google Scholar] [CrossRef] [PubMed]
- Schwartz, L.H.; Seymour, L.; Litiere, S.; Ford, R.; Gwyther, S.; Mandrekar, S.; Shankar, L.; Bogaerts, J.; Chen, A.; Dancey, J.; et al. RECIST 1.1—Standardisation and disease-specific adaptations: Perspectives from the RECIST Working Group. Eur. J. Cancer 2016, 62, 138–145. [Google Scholar] [CrossRef]
- Litiere, S.; Isaac, G.; De Vries, E.G.E.; Bogaerts, J.; Chen, A.; Dancey, J.; Ford, R.; Gwyther, S.; Hoekstra, O.; Huang, E.; et al. RECIST 1.1 for Response Evaluation Apply Not Only to Chemotherapy-Treated Patients But Also to Targeted Cancer Agents: A Pooled Database Analysis. J. Clin. Oncol. 2019, 37, 1102–1110. [Google Scholar] [CrossRef]
Disclaimer/Publisher’s Note: The statements, opinions and data contained in all publications are solely those of the individual author(s) and contributor(s) and not of MDPI and/or the editor(s). MDPI and/or the editor(s) disclaim responsibility for any injury to people or property resulting from any ideas, methods, instructions or products referred to in the content. |
© 2024 by the authors. Licensee MDPI, Basel, Switzerland. This article is an open access article distributed under the terms and conditions of the Creative Commons Attribution (CC BY) license (https://creativecommons.org/licenses/by/4.0/).
Share and Cite
Gupta, P.K.; Orlovskiy, S.; Arias-Mendoza, F.; Nelson, D.S.; Nath, K. 1H and 31P Magnetic Resonance Spectroscopic Metabolomic Imaging: Assessing Mitogen-Activated Protein Kinase Inhibition in Melanoma. Cells 2024, 13, 1220. https://doi.org/10.3390/cells13141220
Gupta PK, Orlovskiy S, Arias-Mendoza F, Nelson DS, Nath K. 1H and 31P Magnetic Resonance Spectroscopic Metabolomic Imaging: Assessing Mitogen-Activated Protein Kinase Inhibition in Melanoma. Cells. 2024; 13(14):1220. https://doi.org/10.3390/cells13141220
Chicago/Turabian StyleGupta, Pradeep Kumar, Stepan Orlovskiy, Fernando Arias-Mendoza, David S. Nelson, and Kavindra Nath. 2024. "1H and 31P Magnetic Resonance Spectroscopic Metabolomic Imaging: Assessing Mitogen-Activated Protein Kinase Inhibition in Melanoma" Cells 13, no. 14: 1220. https://doi.org/10.3390/cells13141220