Article

Focal Cerebral Ischemia Induces Expression of Glutaminyl Cyclase along with Downstream Molecular and Cellular Inflammatory Responses

1
Paul Flechsig Institute for Brain Research, University of Leipzig, 04103 Leipzig, Germany
2
Department of Neurology, University of Leipzig, 04103 Leipzig, Germany
3
Fraunhofer Institute for Cell Therapy and Immunology, Department of Molecular Drug Design and Target Validation, 06120 Halle, Germany
4
Faculty of Applied Biosciences and Process Engineering, Anhalt University of Applied Sciences, 06366 Köthen, Germany
*
Author to whom correspondence should be addressed.
Cells 2024, 13(17), 1412; https://doi.org/10.3390/cells13171412 (registering DOI)
Submission received: 19 July 2024 / Revised: 16 August 2024 / Accepted: 21 August 2024 / Published: 23 August 2024
(This article belongs to the Section Cells of the Nervous System)

Abstract

:
Glutaminyl cyclase (QC) and its isoenzyme (isoQC) catalyze the formation of N-terminal pyroglutamate (pGlu) from glutamine on a number of neuropeptides, peptide hormones and chemokines. Chemokines of the C-C ligand (CCL) motif family are known to contribute to inflammation in neurodegenerative conditions. Here, we used a model of transient focal cerebral ischemia to explore functional, cellular and molecular responses to ischemia in mice lacking genes for QC, isoQC and their substrate CCL2. Mice of the different genotypes were evaluated for functional consequences of stroke, infarct volume, activation of glia cells, and for QC, isoQC and CCL2 expression. The number of QC-immunoreactive, but not of isoQC-immunoreactive, neurons increased robustly in the infarct area at 24 and 72 h after ischemia. In parallel, immunohistochemical signals for the QC substrate CCL2 increased from 24 to 72 h after ischemia induction without differences between genotypes analyzed. The increase in CCL2 was accompanied by morphological activation of Iba1-immunoreactive microglia and recruitment of MHC-II-positive cells at 72 h after ischemia. Among other chemokines quantified in the brain tissue, CCL17 showed higher concentrations at 72 h compared to 24 h after ischemia. Collectively, these data suggest a critical role for QC in inflammatory processes in the stroke-affected brain.

Graphical Abstract

1. Introduction

The enzyme glutaminyl cyclase (QC; E.C. 2.3.2.5) catalyzes the conversion of N-terminal glutamine into pyroglutamate (pGlu) [1,2]. In mammals, QC was found to be abundant in the hypothalamus, pituitary and adrenal medulla, but also in lymphocytes [1,3,4]. Physiological QC substrates are proteins that reside in these brain structures and include, amongst others, thyrotropin releasing hormone (TRH), orexin A and neurotensin [5]. In addition, in the human and mouse brain, QC is expressed in distinct regions such as the Edinger–Westphal nucleus, locus coeruleus, nucleus basalis [6], hippocampus [7] and substantia nigra [8]. Intriguingly, these brain regions are affected in Alzheimer’s disease (AD) and in Parkinson’s disease, and QC was demonstrated to be implicated in the pGlu modification of pathogenic amyloid-β (Aβ) and α-synuclein (aSyn) proteins [6,7,8,9]. QC was also found to be a regulator of huntingtin neurotoxicity by a mechanism that involves αB-crystallin [10]. Pharmacologic inhibition and genetic ablation of QC activity in AD transgenic animal models reduced pGlu-Aβ generation and total Aβ load and ameliorated learning and memory deficits [9,11,12,13]. In addition, completed and ongoing AD clinical trials indicated safety, tolerability and efficacy of the QC inhibitor PQ912 in human subjects [14,15,16].
The expression of the isoenzyme of QC (isoQC; E.C. 2.3.2.5) in the brain is more widespread than that of QC [5,17,18]. IsoQC localization to the Golgi apparatus [19] determines its substrate specificity. For example, hormones such as TRH, which mature in secretory granules by the enzymatic activity of prohormone convertases, cannot be pGlu-modified by Golgi-resident isoQC. In contrast, proteins with N-terminal glutamine already generated in the endoplasmic reticulum, such as gonadotropin-releasing hormone and the chemokine CCL2, represent isoQC substrates [5]. Indeed, isoQC was demonstrated to account for pGlu modification of CCL2 and subsequent monocyte infiltration in the model of thioglycolate-induced peritonitis and for atherosclerotic pathology in ApoE3*Leiden mice [20]. In contrast, QC, but not isoQC, was found to be co-regulated with CCL2 and CX3CL1 in human endothelial and smooth muscle cells [21]. Moreover, application of dual QC/isoQC inhibitors alleviated inflammation in mouse models of non-alcoholic fatty liver disease [22] and septic arthritis [23] by destabilizing CCL2.
Thus, the QC/isoQC-CCL2 axis seems to have a pivotal role in several inflammatory processes. Based on observations in traumatic brain injury [24], epilepsy [25], tumors [26,27], AD [18,28,29] and stroke [30,31], CCL2 is also implicated in neuroinflammation. However, a potential regulation of CCL2 stabilization and bioactivity under neuroinflammatory conditions by QC/isoQC was not yet investigated. Therefore, we here used a model of transient focal cerebral ischemia, which is known to be associated with inflammatory processes, in genetically altered mice to explore the impact of QC, isoQC and CCL2 expression in experimental stroke, as well as the consequences of the genetic ablation on the functional outcome, infarct volumes, the reactions of diverse cell types and biochemical consequences.

2. Materials and Methods

2.1. Characterization of KO Mice

QC KO mice were generated by homologue recombination leading to deletion of exons 4 and 5 of the QC gene [32]. To establish isoQC KO mice, a targeted point mutation (T>A; L144X) was introduced into the isoQC gene, which leads to a stop of mRNA translation [5]. The CCL2 KO mouse line was generated by deletion in exon 2 and insertion of a stop codon in exon 1 [33]. Mice of all KO genotypes were found to be viable and fertile with the same body weight as wild-type mice and did not show deficits in motor function, cognitive performance and activity. The only KO effect observed was a slight hypothyroidism in the absence of hypogonadism in the QC KO strain [32]. CCL2 KO mice were purchased from Jackson Lab, Bar Harbor, ME, USA. QC and isoQC KO mice were generated by and bred with permission of Vivoryon Therapeutics (Probiodrug AG), Halle, Germany. All mouse lines were maintained on a C57Bl/6J background at the Fraunhofer Institute for Cell Therapy and Immunology, Halle, Germany, at 12 h day/12 h night cycles with food and water ad libitum in individually ventilated cages that contained nest building material.

2.2. Genotyping

Genotyping was performed according to a standard DNA isolation and PCR protocol essentially as described elsewhere [34]. Briefly, DNA was isolated from ear punches using the 1-Step kit (Nexttec, Leverkusen, Germany). DNA was analyzed for the presence of respective KOs by PCR using specific primers shown in Table 1. Whereas mixes of 3 different primers directly reveal QC KO and CCL2 KO, the PCR product of isoQC-specific primers was further digested using AvrII leading to 2 distinct bands in case of the presence of at least one isoQC KO allele. Samples were analyzed on a 1.6% agarose gel in TAE buffer.

2.3. Experimental Stroke

The experiments have been performed following the 3R principles and ARRIVE guidelines. Induction of transient focal cerebral ischemia was approved by the Ethical Committee for Animal Research of Landesdirektion Sachsen, Germany, license number TVV 13/18. Seven days before experimental stroke, mice were transferred to the Animal Care Facility of the Medical Faculty, Leipzig University, and trained to be fed with a “high calorie dietary supplement for laboratory rodents” (DietGel® Boost, Clear H2O, Portland, ME, USA) from a syringe. Transient focal cerebral ischemia in 4 months old male mice of different genotypes with an initial body weight of 28.3 g was performed by the filament-based model as originally described in [35], with some minor adaptions. Briefly, under anesthesia (Fentanyl, 0.05 mg/kg; Midazolam, 5 mg/kg; Medetomidin 0.5 mg/kg) a standardized silicon-coated monofilament of 0.23 mm diameter (Doccol, Sharon, MA, USA) was introduced into the right carotid artery and moved forward to the origin of the middle cerebral artery, and kept in place for 30 min. This procedure resulted in focal ischemia typically involving subcortical regions of the middle cerebral artery territory and, at least in part, an involvement of neocortical areas. Pain management included local anesthesia at the medial site of the neck and the use of lidocaine (Licain, DeltaSelect, Dreieich, Germany). We decided to use male mice only in our study. We are aware of this weakness in the experimental design but including females would not only double the animal number but also introduce the estrous cycle as an additional variable. Therefore, and considering 3R guidelines, females were not included in this study.
After observation periods of 24 or 72 h, mice were sacrificed by CO2 inhalation and the brain tissue was prepared for immunohistochemical or biochemical analyses. Overall, 58 wild-type, 41 QC KO, 48 isoQC KO, and 50 CCL2 KO mice were subjected to ischemia, finally leading to a group size of n = 6 each for biochemical and for histological analyses at 24 and 72 h after induction of ischemia. The post-ischemia intervals of 24 and 72 h were chosen to monitor neuronal cell death, the expression of chemokines and the activation/recruitment of microglial cells and astrocytes in the acute ischemia phase. Additionally, 12 mice of each genotype without ischemia served as controls for biochemical (n = 6) and histological analyses (n = 6). The group size was calculated based on the estimated effect size of QC/isoQC KO on CCL2 concentrations and glia activation of 1.67 [36] and an error of 0.05 to reach a power of 0.8.

2.4. Evaluation of Functional Outcome

The investigators were blind to the group allocation during the experiment and when scoring the functional outcome. The Menzies score [37] is a clinical score to evaluate neurobehavioral deficits without relevant manipulation. Thereby, the degree of motoric deficits is recorded as follows: 0 = “no apparent deficits”, 1 = “contralateral forelimb flexion”, 2 = “decreased grip of the contralateral forelimb while tail pulled”, 3 = “spontaneous movement in all directions, contralateral circling only if pulled by tail”, 4 = “spontaneous contralateral circling”. Animals were scored every 24 h after re-perfusion. At the same time points, animal weight was taken. In case of loss of more than 20% of initial body weight, the animals had to be excluded from further study procedures and were sacrificed. As an additional outcome, the “overall physical condition” was calculated. This is based on body weight, behavior and mobility, appearance and Menzies score, and thus, gives an estimate of the animals’ wellbeing.

Overall Physical Condition

As an additional outcome parameter, the overall physical condition was recorded while considering body weight, behavior and mobility, general appearance, and Menzies score. Each parameter was scored from 0 to 3, with 3 being the worst. Score 0 included active behavior, smooth, shiny coat, a weight loss of less than 5%, and a Menzies score of 0–2. Score 1 resulted from decreased reaction, dull coat, and soiled eye corners, a weight loss of less than 13%, and a Menzies score of 3. Score 3 included chewing posture and arched back, stuck body openings, and shaggy coat, a weight loss of less than 20%, and a Menzies score of 4. Score 3 in any of the parameters examined was also the termination criterion and included no response, apathy, and no locomotion in behavior and mobility. In appearance, score 3 was achieved when the animal had closed eyes and was cool.

2.5. Mouse Plasma and Brain Tissue Preparation

After the sacrifice, a small volume (about 0.5 mL) of blood was collected by cardiac puncture, which was transferred to heparin-coated vials and centrifuged immediately at 7000× g for 10 min at 4 °C. Plasma was carefully removed from the cell pellet and stored at −80 °C.
For histochemical analyses, mice were transcardially perfused with 0.9% saline followed by perfusion with 4% paraformaldehyde in phosphate buffer (0.1 M, pH 7.4). The brains were removed from the skull and post-fixed by immersion in the same fixative overnight at 4 °C. After cryoprotection in 30% sucrose in 0.1 M phosphate buffer for three days, 30 µm thick coronal sections were cut on a sliding microtome and collected in phosphate buffer supplemented with 0.025% sodium azide for storage.
For biochemical analyses, mice were transcardially perfused with 0.9% saline, the brains were removed from the skull, the cerebellum was cut off and the cerebrum was dissected into the right (ischemic) and left (control) hemispheres, frozen on dry ice and stored at −80 °C.

2.6. Calculation of Infarct Volumes

The infarct volume was determined by using every 9th coronal brain section for immunohistochemical NeuN + HuC/D labeling of neurons and subsequent calculation of the infarct area, which was integrated over the rostro-caudal infarct area extension. Details on the respective image analyses are given below.

2.7. Immunohistochemistry

In the present study, the following primary antibodies against neuronal, glial and inflammatory marker proteins were used (Table 2). The specificity of the antisera against QC, isoQC and CCL2 was verified in the brain tissue of the respective KO mice by the absence of the typical immunoreactivity present in the wild-type mouse brain (Supplementary Figure S1).

2.7.1. Single Labeling of NeuN and HuC/D, QC, isoQC and CCL2 in Mouse Brain Sections

In order to detect significant neuronal populations in the brains of wild-type, QC KO, isoQC KO and CCL2 KO mice, single labeling immunohistochemistry with mouse antibodies against NeuN and HuC/D was performed on free-floating coronal brain sections. In addition, the expression of CCL2 and its modifying enzymes, QC and isoQC, was revealed by immunohistochemical single labeling using primary goat or rabbit antibodies (Table 2). Brain sections were washed in 0.1 M phosphate buffer (pH 7.4) for 5 min and endogenous peroxidases were inactivated by treating brain slices with 60% methanol containing 1% H2O2 for 60 min followed by three washing steps with Tris-buffered saline (TBS, 0.1 M, pH 7.4) for 5 min each. After masking unspecific binding sites with blocking solution (3% donkey anti-mouse IgG Fab fragment, 2% normal donkey serum in TBS containing 0.3% Triton X-100) for 60 min, sections were incubated in 5% normal donkey serum in TBS containing 0.1% Triton-X-100 with the primary antibodies as indicated in Table 2 for 24 h at 4 °C. Brain sections were then washed three times in TBS for 5 min each before being incubated with biotinylated secondary donkey anti-mouse or donkey anti-goat or donkey anti-rabbit antibodies (Dianova, Hamburg, Germany; 1:1000) in TBS containing 2% bovine serum albumin (BSA) for 60 min. After three washing steps in TBS for 5 min each, slices were incubated with ExtrAvidin peroxidase (Sigma, Neustadt, Germany; 1:2000) in TBS/2% BSA followed by washing steps and pre-incubation in Tris buffer (0.05 M, pH 7.6) for 5 min. Finally, visualization of peroxidase binding was performed by incubation with 4 mg 3,3’-diaminobenzidine (DAB) and 2.5 µL 30% H2O2 per 5 mL Tris buffer. After washing, sections were mounted onto glass slides and cover slipped.

2.7.2. Double and Triple Immunofluorescent Labeling in the Mouse Brain

In order to reveal the activation of microglia cells and astrocytes in the infarct area and the cell type-specific expression of CCL2 in ischemic mouse brain tissue, cocktails of primary antibodies from different species were used as specified in Table 2. Brain sections were incubated with cocktails of primary antibodies for 24 h at 4 °C. Sections were then washed three times with TBS followed by incubation with cocktails of Cy2-, Cy3- or Cy5-conjugated donkey anti-mouse, -rabbit, -guinea pig or -goat antisera, respectively, (1:200 each; Dianova, Hamburg, Germany) in TBS containing 2% BSA for 60 min at room temperature. After washing, sections were mounted onto glass slides and cover slipped. Switching the fluorescent labels of the secondary antibodies generated similar results as when following the procedure outlined above. For all single, double and triple immunohistochemical labelinglabeling in the brain sections described above, control experiments in the absence of primary antibodies were carried out. In each case, this resulted in unstained brain sections. In addition, the specificity of the primary antibodies against QC, isoQC and CCL2 was validated in non-ischemic and ischemic brain tissue of wild-type and the respective KO genotype (Supplementary Figure S1).

2.8. Microscopy

2.8.1. Light Microscopy

Mouse brain tissue sections immunohistochemically stained with DAB or DAB-Ni for NeuN + HuC/D, QC, isoQC and for MHC-II expression were examined with an Axio-Scan.Z1 slide scanner connected with a Colibri.7 light source and a Hitachi HV-F202SCL camera (Zeiss, Göttingen, Germany). High resolution images of brain sections were taken using a 20× objective lens with 0.8 numerical aperture (Zeiss). Images were digitized by means of ZEN blue 2.6 software and analyzed using the ZEN imaging tool.

2.8.2. Fluorescence Microscopy

Brain tissue sections of wild-type and KO mice immunochemically stained with Cyanine labeled secondary antibodies were examined with an AxioScan.Z1 microscope (Zeiss, Göttingen, Germany) equipped with a Colibri 7 light source including 6 LED to cover the light spectrum from 385 to 735 nm to generate seven fluorescence excitation lines for the samples to be analyzed. All LEDs besides the green/yellow line (combined 555/590 nm filter changer) come with individual excitation filters. Emission filters select for Cy2 at 524 nm, for Cy3 at 595 nm and Cy5 at 676 nm and Hoechst 33,342 at 425 nm. Pictures were taken by means of Axiocam 506 and a Plan-Apochromat objective (20×/0.8) and exposure time of 15 ms for Cy2, 20 ms for Cy3, 30 ms for Cy5 and 2 ms for Hoechst 33,342. Images were digitized by means of ZEN blue 2.6 software.

2.8.3. Image Analysis

Images were analyzed by means of trainable segmentation with Apeer Machine Learning toolkit and ZEN blue 3.5 Intellesis software (Zeiss, Göttingen, Germany). By using machine learning, errors and influences of user bias were avoided. For single neuronal staining, the area missing NeuN and HuC/D immunoreactivity was determined manually and calculated by ZEN software. For QC-, isoQC- and MHC-II-positive cells the number of these cells (QC, MHC-II) or the staining intensity (isoQC) was determined in defined regions of interest. For quantification of fluorescence signals, trainable segmentation was applied to recognize specific fluorescence signals from CCL2, NFL, GFAP, CD68, TMEM119 and Iba1 separately. The final readout for NFL, GFAP, CD68 and TMEM119 was the area covered by positive signals. For CCL2, the number of positive signals was determined independent of signal size. For Iba1 staining, the training was aimed to recognize the number of morphological reactive microglia (enlarged cell body, less branches), but not surveying microglia (small cell body, long branches). During analysis, the number of these cells per brain slice was determined. The choice of the quantification method was based on the applicability of the respective procedure. For example, isoQC is a Golgi-resident, non-secreted enzyme where the immunohistochemical signal arises from neuronal labeling and signal intensity is related to neuronal numbers. In contrast, QC is a secreted enzyme and measuring signal intensity would not give an accurate quantification of QC-positive neurons. Therefore, QC-positive neurons were counted.

2.9. Quantification of Chemokines in Brain Tissue and Plasma

2.9.1. Cerebrum Preparation

In order to prepare the mouse cerebrum for Bio-Plex analysis, the left and right cerebrum of the ischemic group and right cerebrum of control mice were homogenized in T-Per buffer (Tissue Protein Extraction Reagent, Thermo Fisher Scientific, Darmstadt, Germany) at a concentration of 333 mg/mL with Protease Inhibitor Cocktail Tablets (Merck, Darmstadt, Germany) by using a Precellys homogenizer (VWR, Dresden, Germany). The homogenate was centrifuged for 15 min at 10,000× g at 4 °C, kept on ice for transferring to 1.5 mL reaction tubes and centrifuged again for 30 min at 25,000× g at 4 °C. The soluble supernatant was collected, aliquoted and stored at −80 °C until use.

2.9.2. BCA Protein Assay

The BCA assay (Pierce, Thermo Fisher Scientific; Darmstadt, Germany) was performed according to the manufacturer’s protocol. Cerebrum samples were 1:50 diluted in T-PER buffer. The albumin (BSA) standard working range corresponded to 20–2000 µg/mL (n = 2). Absorption was measured at 562 nm (Tecan Sunrise, Männedorf, Switzerland).

2.9.3. Bio Plex Analysis

For multiplex analysis of the plasma and cerebrum, an individually prepared 8-Plex (Bio-Rad, Feldkirchen, Germany) was used. The following cytokines were included: fractalkine/CX3CL1, IL-1β, IL-6, MCP-1/CCL2, MCP-5/CCL12, RANTES/CCL5, TARC/CCL17 and TNF-α. At the beginning, all desired cytokine beads were combined and 50 µL of the suspension was added per well to a 96-well plate. After washing twice, the samples (1:4 plasma diluted in Sample Diluent; 1:10 cerebrum diluted Sample Diluent containing 0.5% BSA), standards and blanks were transferred to the appropriate wells. Further steps of the implementation were made following the manufacturer’s instructions.

2.10. Statistical Analysis

To compare the ischemic with the control hemisphere, we used the Wilcoxon Signed Rank test. To compare differences between wild-type and the respective KO mice, the Mann–Whitney Rank Sum test was used. Statistical comparisons between all groups were evaluated using one-way ANOVA, with the Bonferroni post-hoc analysis. For calculations, Sigma Plot 14.0 (Systat Software Inc., Frankfurt/M., Germany) was used. Differences between groups were considered statistically significant for p values < 0.05.

3. Results

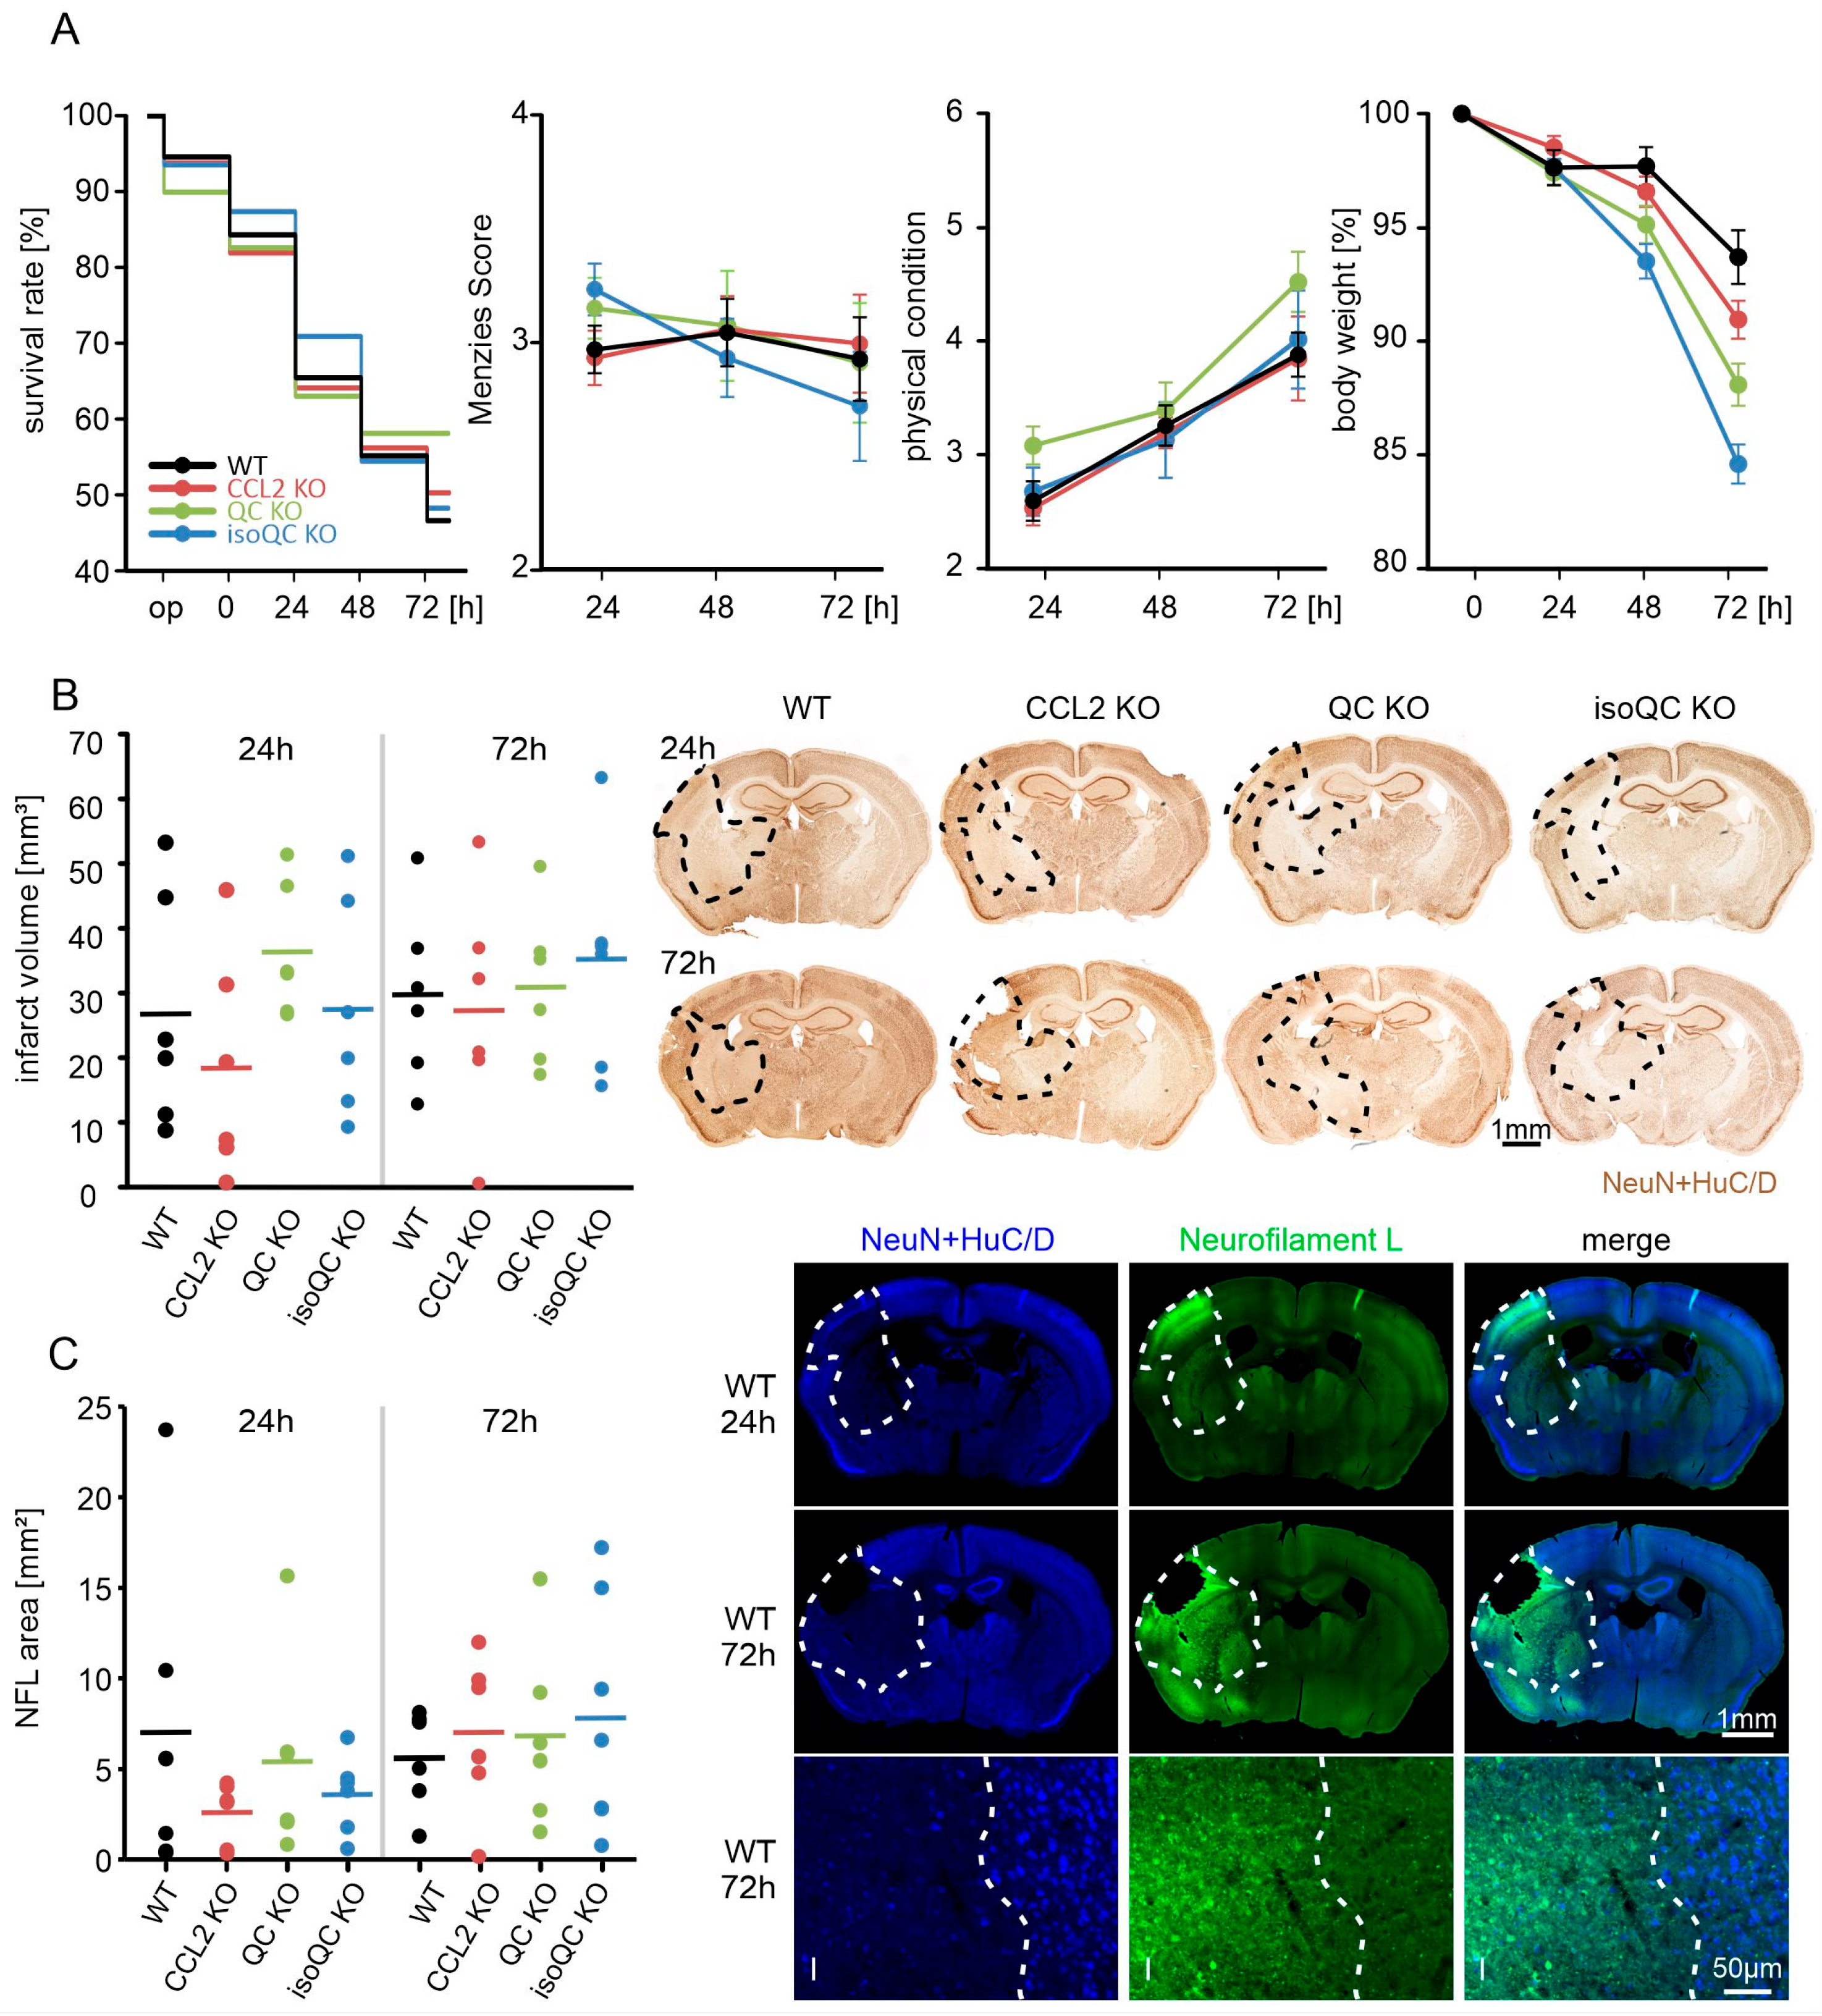
3.1. Consequences of Focal Cerebral Ischemia in Mice with Lacking Genes for QC, isoQC, and CCL2

Since the functional and cellular consequences of ischemia were not yet investigated in the QC KO and isoQC KO mouse brain, we first determined the survival rate, Menzies score, overall physical condition, body weight and infarct volume in all KO genotypes and wild-type mice (Figure 1). There were no statistically significant differences between the genotypes, but QC KO mice tended to provide the best survival rate and isoQC KO mice the largest body weight loss after ischemia (Figure 1A). The infarct volume was calculated from diminished NeuN + HuC/D labeling in brain sections demonstrating neuronal loss along the rostro-caudal extension of the ischemic area. There was a tendency of larger infarct volume by 72 h after ischemia onset compared to the 24 h time point, but there was also large inter-individual infarct size variation (Figure 1B). These data were corroborated by NFL labeling, which displayed increased immunoreactivity in brain regions affected by ischemia (Figure 1C).
Next, we analyzed the expression of the enzymes QC and isoQC in ischemic brain tissue. In order to relate the expression of both proteins to ischemia, they were detected in consecutive brain sections to those labelled for NeuN + HuC/D (Figure 2A). Interestingly, the expression of QC was increased in ischemic brain regions identified by absence of NeuN + HuC/D labeling, whereas the expression of isoQC was reduced (Figure 2B,C). Increased QC immunoreactivity was restricted to neurons and not observed in glial cells. There were no differences in the abundance of QC-positive neurons between wild-type and isoQC KO mice. Likewise, isoQC-immunoreactivity was not affected by QC KO. Notably, there was no QC immunoreactivity in the control and ischemic QC KO mouse brain and no isoQC immunoreactivity in the control and ischemic isoQC KO mouse brain (Supplementary Figure S1).
We then quantified CCL2 immunohistochemical signals in ischemic brain tissue. CCL2 expression was absent in brain sections of control animals that did not experience ischemia (Supplementary Figure S1). In contrast, there was significant CCL2 immunoreactivity at the ischemic hemisphere at 24 h, and even more pronounced at 72 h after ischemia as shown by single DAB labeling (Figure 3A). This labeling was restricted to ischemic tissue at 24 h of ischemia, but also extended into neighboring non-ischemic brain areas at 72 h of ischemia as shown in double labeling with NeuN + HuC/D (Figure 3A). This is consistent with a CCL2 gradient from ischemic to non-ischemic brain tissue to recruit microglial cells and with a pro-inflammatory role of CCL2 in the clinical situation of stroke that might contribute to secondary neuronal cell death. Quantification of the CCL2 immunohistochemical signals validated this post lesion time-dependent increase in CCL2 and the absence in CCL2 in ischemic CCL2 KO mouse brain tissue (Figure 3B). In ischemic brain tissue of QC KO mice and of isoQC KO mice, the mean values of the CCL2 immunosignals were about half of those in in wild-type mice at both time points, although this reduction was not statistically significant (Figure 3B). Consistent with CCL2 being a secreted protein, its immunohistochemical appearance was mostly diffuse, but also present as extracellular spots, in vessel-associated and in glia-like shapes (Figure 3C). Double labeling with cell type-specific markers revealed a partial co-localization with the microglial markers Iba1, CD68 and TMEM119, with the neuronal markers NeuN + HuC/D and with the astrocyte marker GFAP, but not with the oligodendrocyte marker Olig2 (Figure 3D).

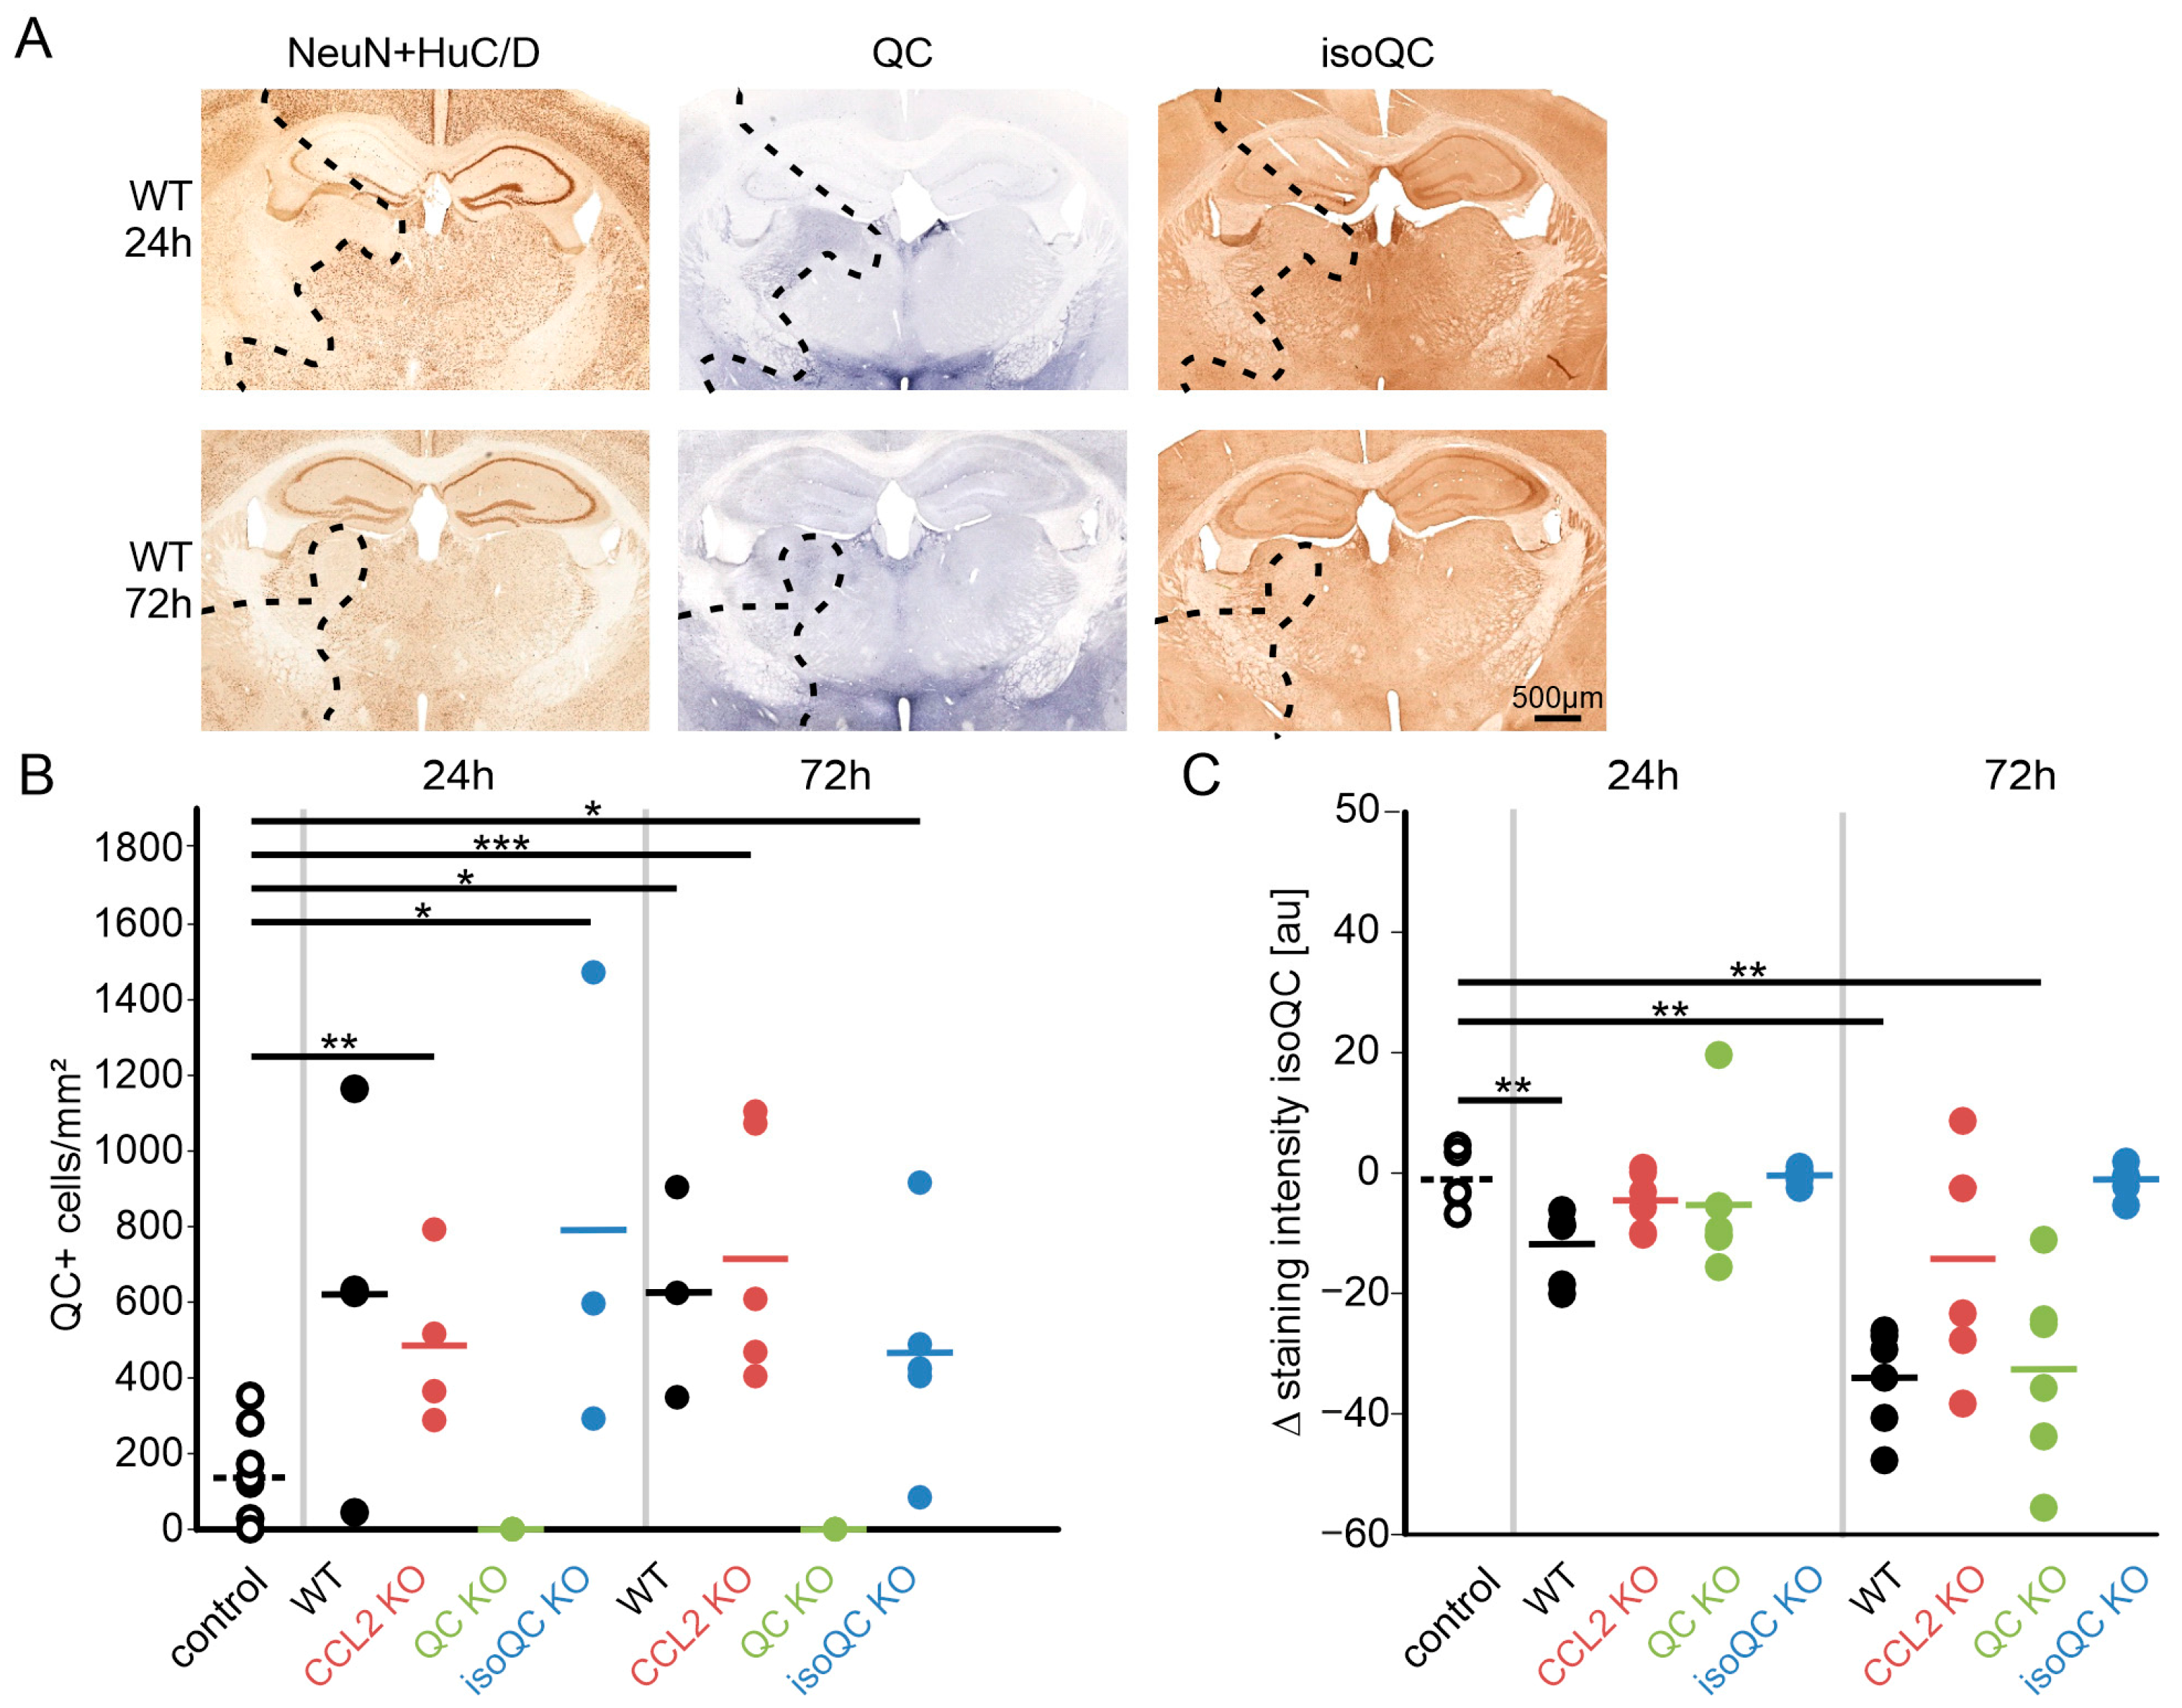
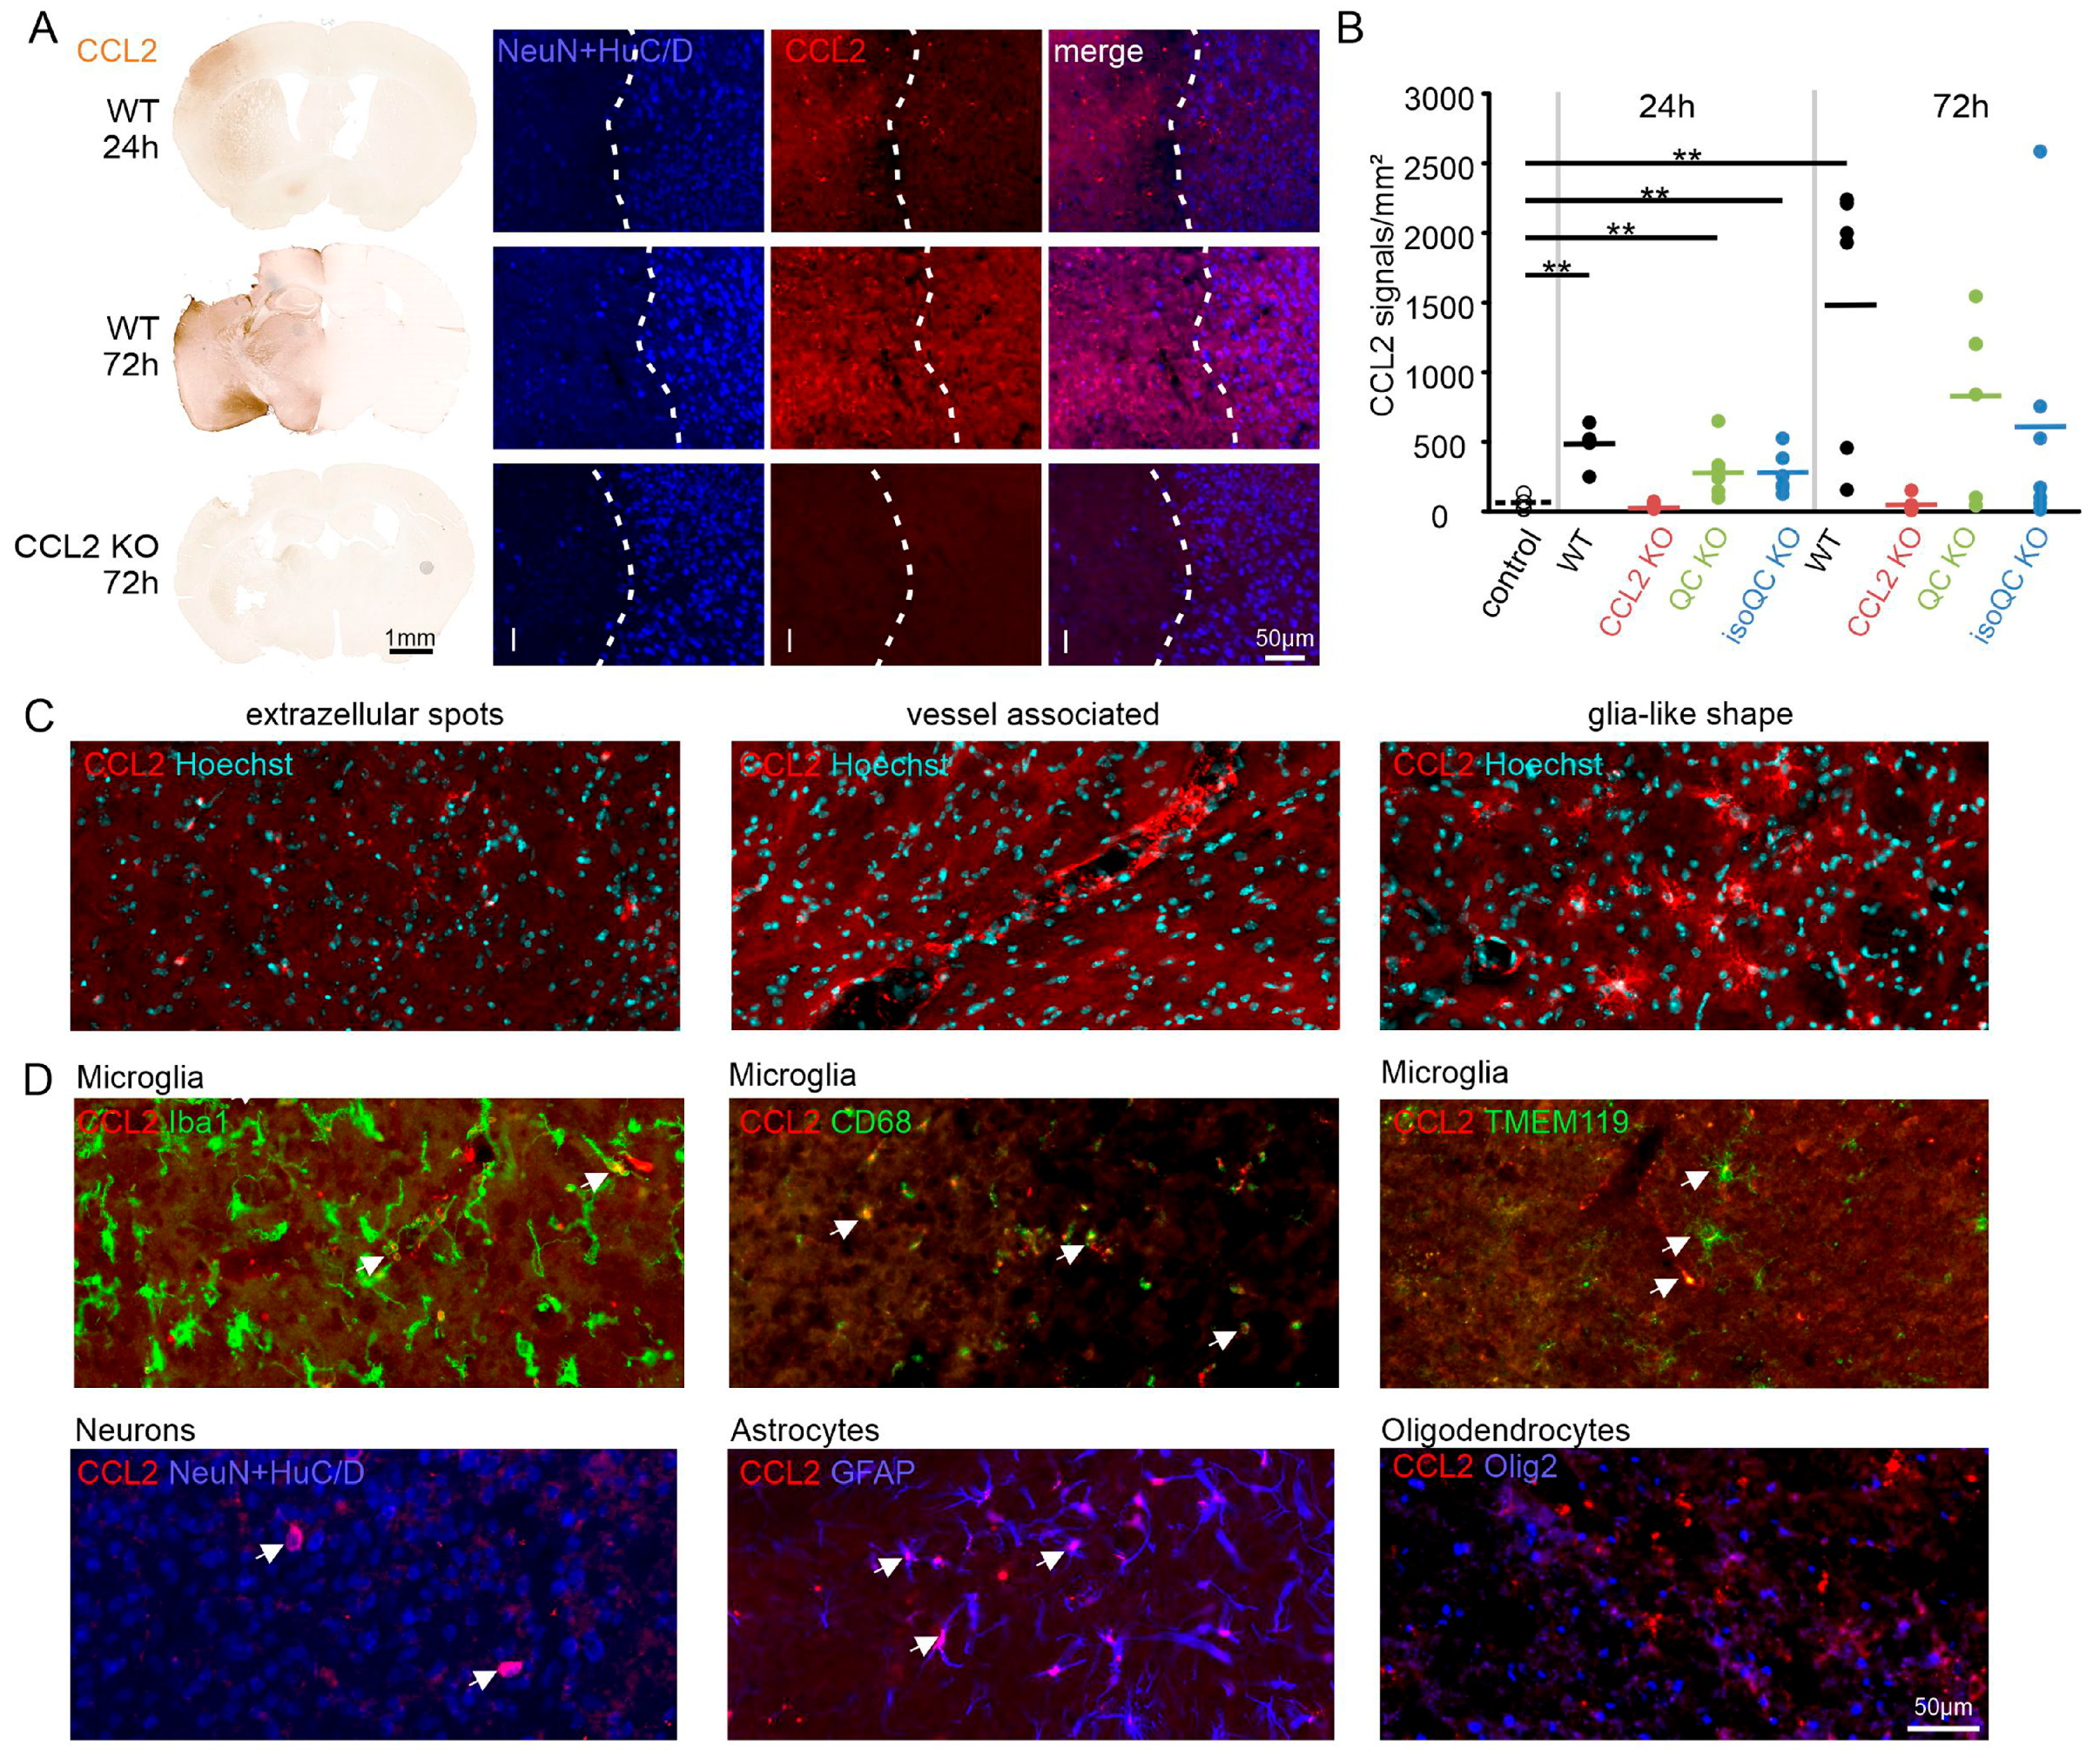
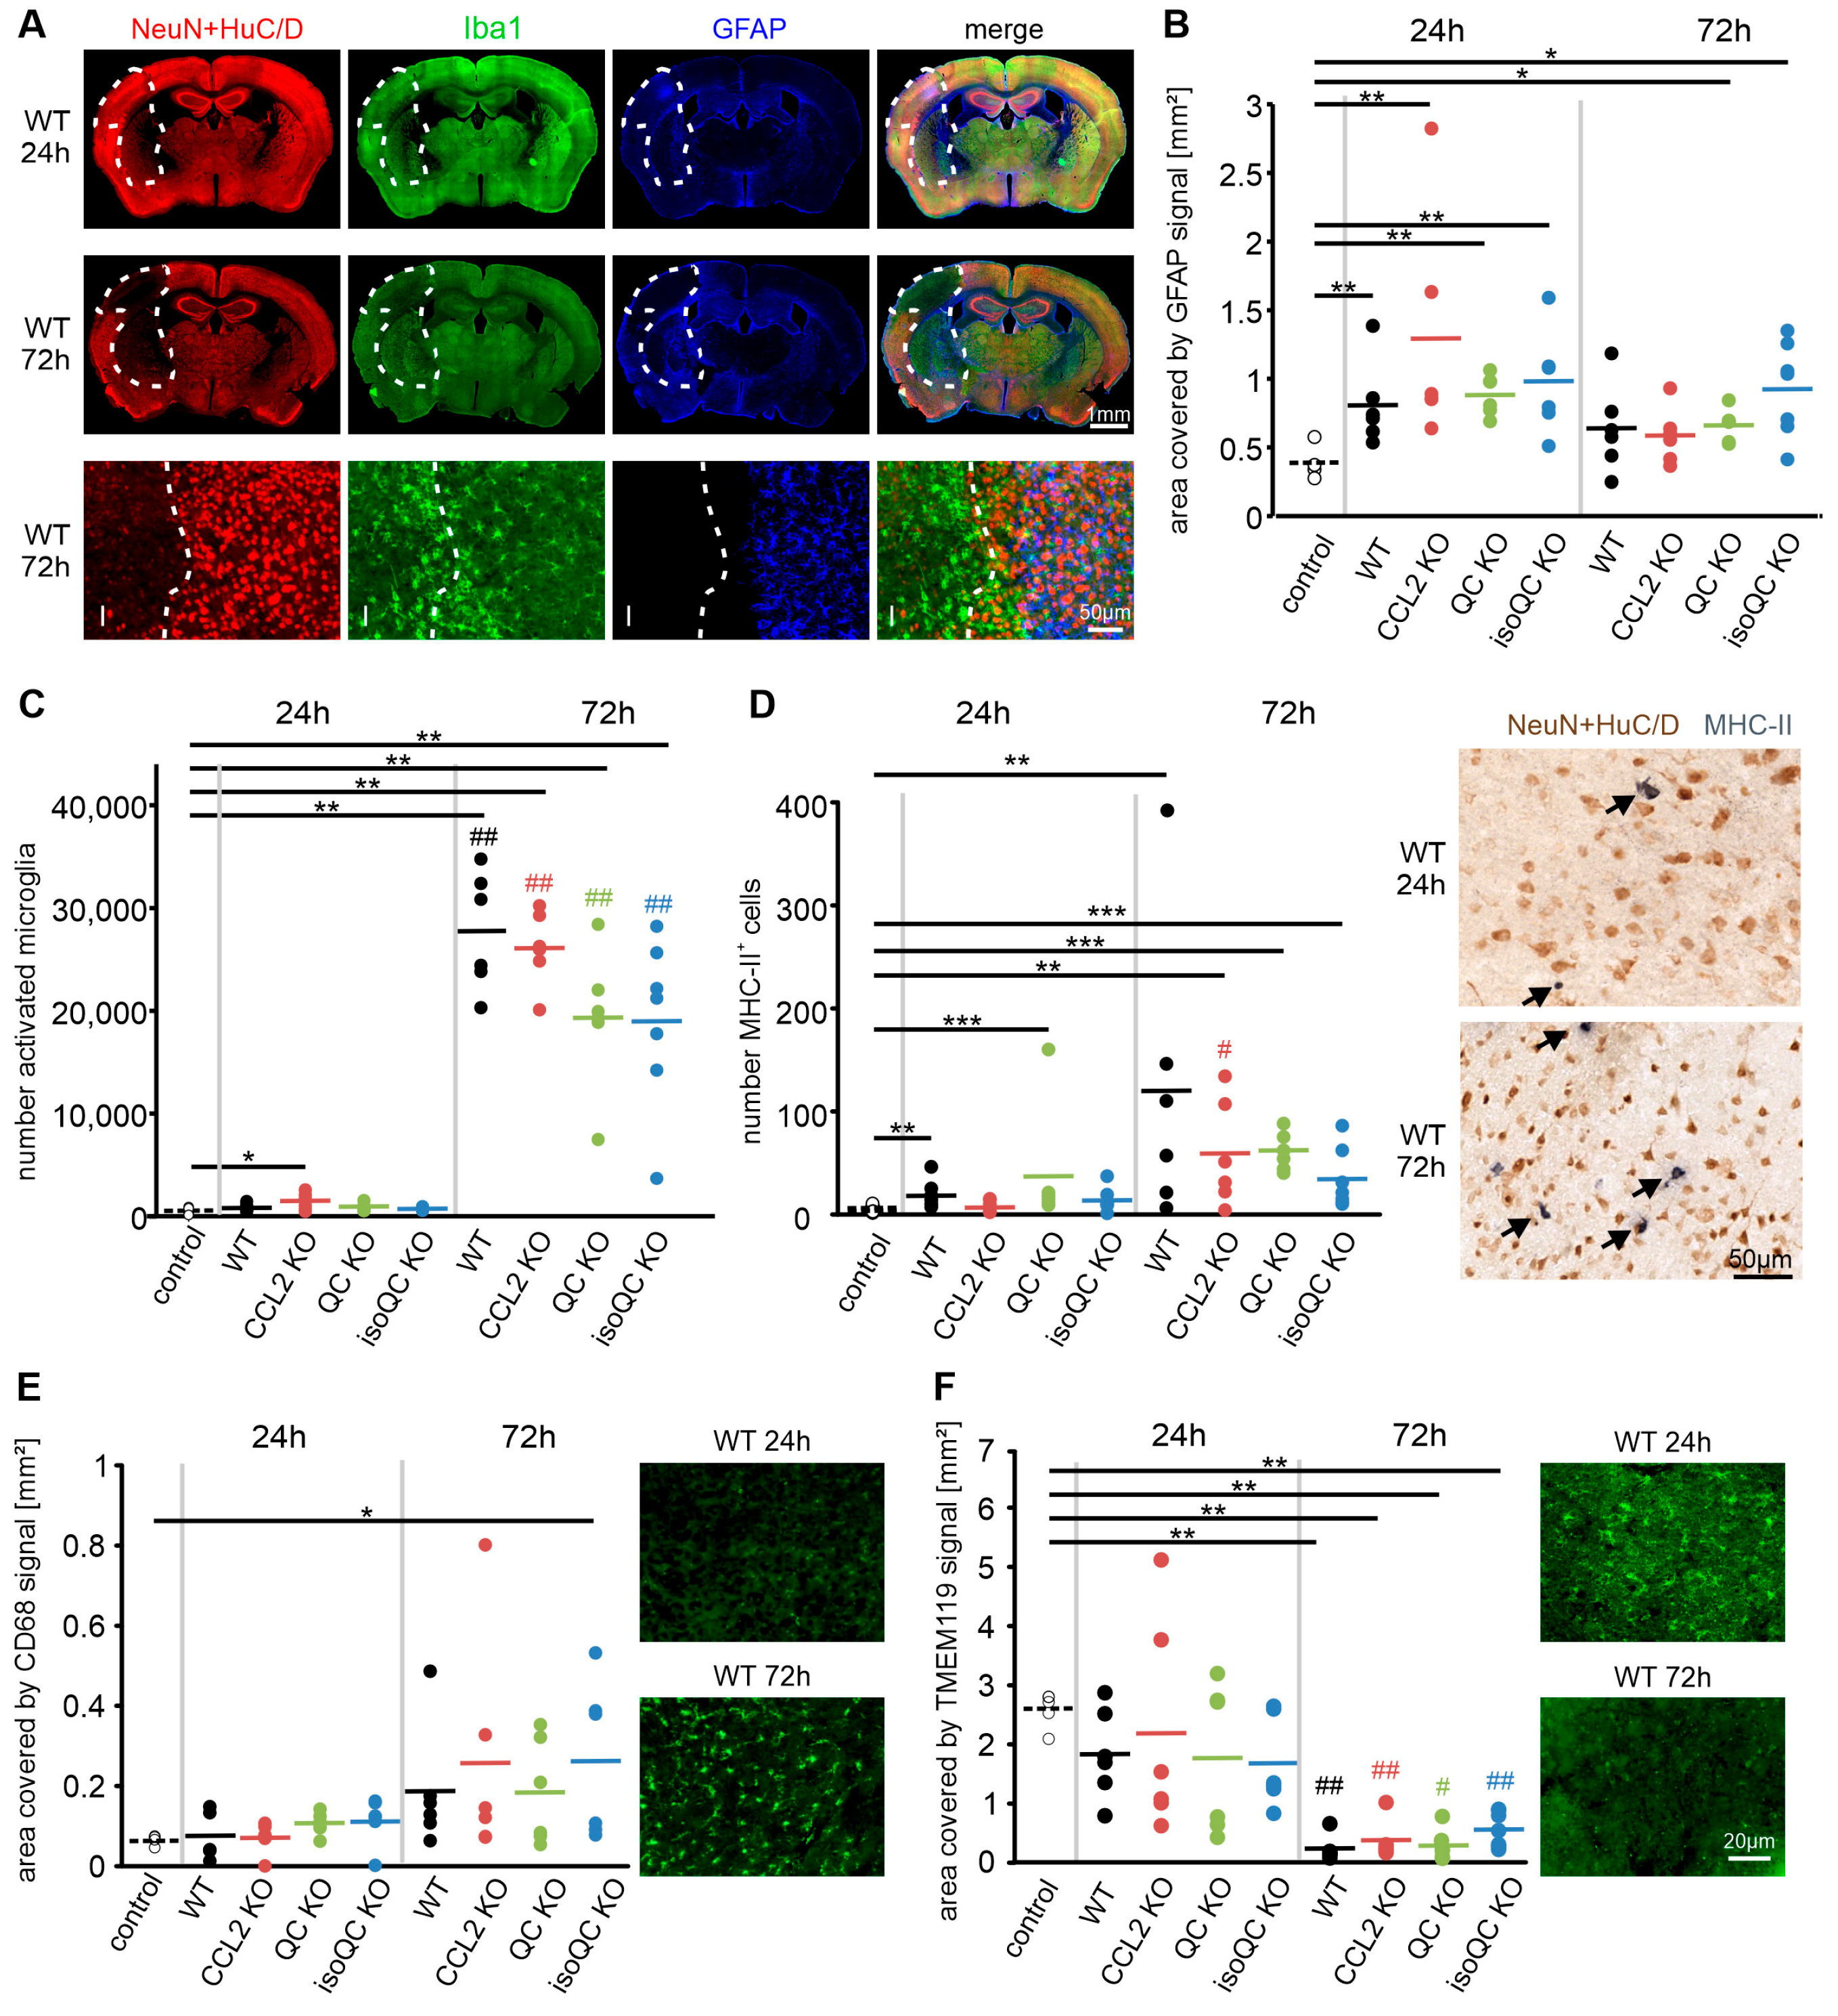
3.2. Consequences of Increased QC and CCL2 Expression in Ischemic Brain Tissue

In order to reveal the cellular responses to increased QC and CCL2 expression after ischemia, we performed triple labeling for NeuN + HuC/D, to identify the ischemic area, with the microglial marker Iba1 and the astrocyte marker GFAP (Figure 4A). While GFAP immunosignals were increased already by 24 h after ischemia and did not further increase by 72 h of ischemia (Figure 4B), the number of Iba1-positive morphologically activated microglia only increased by 72 h of ischemia (Figure 4C). Likewise, the number of infiltrating MHC-II-positive cells increased markedly by 72 h of ischemia (Figure 4D). Remarkably, and in analogy to the CCL2 immunosignals, the mean numbers of Iba1- and MHC-II-positive cells in the ischemic tissue of the QC KO and of isoQC KO mouse brain was only half of that in the wild-type mouse brain (Figure 4C,D). In addition, we observed a time-dependent increase in CD68 immunosignals (Figure 4E) and a converse decrease in TMEM119 immunosignals (Figure 4F). There were no statistically significant differences in the abundance of glial (sub)-types between wild-type mice and the KO mice under investigation in this study.
To obtain insights into inflammatory responses to ischemia, the concentrations of chemokines pre-selected from a broader panel based on their presence in ischemic brain tissue and in plasma were quantified by multiplex analyses in the brain tissue and plasma of experimental animals of all genotypes at both survival time points (Figure 5). At the primary site of pathology, the ischemic brain tissue, a time-dependent increase in CCL2 was detected, which was mirrored by increases of CCL2 in plasma in WT, QC KO and isoQC KO mice. In the brain tissue, there was a non-significant reduction in CCL2 in isoQC KO mice compared WT and QC KO mice, underlining the importance of isoQC for CCL2 maturation in the infarct area. Plasma levels of CCL2 did not further increase by 72 h post ischemia onset. Reduced CCL2 in isoQC mice was accompanied by trends of reduced levels of CX3CL1 and interleukin-1β in brain tissue 24 h post ischemia compared to the control tissue suggesting an impact on overall reduced inflammatory environment of isoQC KO at this time point. This effect was attenuated by 72 h post ischemia and was not consistently observed for the corresponding plasma chemokine concentrations. Interestingly, CCL17 levels increased between 24 h and 72 h of ischemia (Figure 5). In addition, at the early time point of 24 h, isoQC KO had a similar reducing effect on CCL17 as on CCL2 although CCL17 is not a known isoQC substrate.

4. Discussion

In the present study, we wanted to address the questions whether the expression of the CCL2-stabilizing enzymes QC and isoQC are influenced by ischemia in mouse brain and whether their absence in KO mice affects CCL2 concentrations and the downstream cellular and functional outcome after experimental stroke.
CCL2 is known to be induced in the brain by multiple events with an inflammatory component [24,26,28], including stroke [30,31]. In the CCL2 KO mouse brain, the infarct size, levels of pro-inflammatory markers and blood–brain barrier breakdown were found to be reduced, and the functional outcome was improved after focal cerebral ischemia compared to wild-type animals [36,38,39]. This would suggest that a pharmacological reduction of biologically active CCL2 has therapeutic potential in ischemic conditions and presumably also in other brain disorders with a neuroinflammatory component. This assumption is challenged by other studies demonstrating that deletion of the CCL2 receptor CCR2 contributes to an increased cerebral injury after ischemia [40,41,42]. However, in CCR2 KO tissue, CCL2 might still bind to CCR4 and mediate its effects via this receptor [43,44]. Therefore, we here investigated the contributions of the CCL2-stabilizing enzymes QC and isoQC on the functional outcome as well as cellular and molecular responses to ischemia.
Our most interesting observation was an increased QC immunoreactivity and decreased isoQC immunoreactivity in brain regions affected by ischemia in wild-type mice. The increased expression of a protein by neurons affected by ischemia is surprising and may point to a very important cellular response to the ischemic insult. Like QC, the QC/isoQC substrate CCL2 was also induced in a time-dependent manner after ischemia in the wild-type mouse brain. In both the QC KO and isoQC KO mouse brain, the amount of CCL2 immunoreactivity was reduced by half. We detected CCL2 immunoreactivity frequently within glial cells, but also within neurons. Abolished neuronal QC/isoQC expression in KO mouse brains reduces CCL2 stabilization and thus its secretion into the extracellular space. Subsequently, glial CCL2 uptake via CCR2 or CCR4 is diminished as well.
Analyzing CCL2 protein by multiplex analysis showed a trend of reduced CCL2 in isoQC KO mice only. This indicated that isoQC is a major factor for stabilizing CCL2 as suggested by previous studies [20]. However, it also suggested that QC might be also a contributing factor for CCL2 stabilization. This point should be addressed in future studies in QC/isoQC double KO mice. CCL2 was found to be co-localized with a small proportion of Iba1-positive, MHC-II-positive and GFAP-positive glia cells and with neurons in the infarct area. However, from these immunohistochemical labeling it is not possible to discriminate between CCL2 expressed by or taken up into these cells. The appearance of CCL2 immunosignals as diffuse and spot-like extracellular labeling, and its association with blood vessels and glia cells, is in good agreement with CCL2 building up a chemotactic gradient starting by the adherence of CCL2 to the inner vessel wall as first point of contact with immature phagocytes.
A surprising observation was the time- and genotype-dependent effect of isoQC KO on CCL17, which was reduced in isoQC KO brain tissue, but not in QC KO brain tissue, compared to wild-type animals. CCL17 was originally described as murine thymus and activation-regulated chemokine (mTARC) that possesses chemotactic activity towards CD4+ T-cells [45]. CCL17 is not a QC/isoQC substrate since signal peptidase cleavage liberates an N-terminal alanine residue (Ala24) [45]. Therefore, it lacks an N-terminal glutamine residue, which is a prerequisite for a QC/isoQC-catalyzed N-terminal blockage by a pyroglutamate (pGlu) residue. Consequently, the observed reduction of CCL17 protein could be in relation to observed trends of reduced CX3CL1 and IL-1β in isoQC KO mice. In this case, immature CCL2 might prevent the full activation of the pro-inflammatory cytokine cascade following the ischemic insult. Since reports on CCL17 are scarce in the present literature, it is tempting to speculate that signal peptidase could also release mature CCL17 starting with glutamine at position 19 (Gln19). In this case, CCL17 could be an isoQC substrate and the observed reduction could be a direct effect of isoQC depletion. In particular, the presence of brain-specific CCL17 sharing the N-terminus with CX3CL1 as a result of alternative splicing [46] could point to a more complex biology of CCL17 than anticipated.
The cellular responses to ischemia include an instant activation of astrocytes and a delayed activation of Iba1-positive microglial cells and infiltration of MHC-II-positive cells, which coincides with increased QC and CCL2 expression levels. This is consistent with the activation and recruitment of Iba1- and MHC-II-positive cells via the QC/isoQC-CCL2 axis. We observed an up-regulation of the CD68-positive microglia sub-population and a down-regulation of the TMEM119-positive microglia sub-population after ischemia which is in line with numerous other studies investigating microglial cell activation after brain lesions [47,48].
Although we observed a regulation of QC, isoQC and their substrate CCL2 after ischemia and altered CCL2 protein levels in the QC KO and isoQC KO mouse brain, there were no strong differences regarding the survival rates, infarct volumes, and glial activation between the wild-type mice and the KO genotypes analyzed. There may be several explanations for this. First, the functions of QC and isoQC might be partly redundant so that the absence of one enzyme is compensated by the presence of the other. Second, both QCs have numerous substrates that might be affected by the lack of one enzyme or the other. Therefore, the functional outcome of experimental stroke is probably based on the pGlu stabilization of numerous proteins with a different impact in this process. Finally, although efforts have been made to consider a relatively long observation period in the study, the chosen period of 72 hours might have been too short to clearly delineate inflammatory consequences of ischemia, which are assumed to occur in the post-acute stage of ischemia [49].
Such a regulated expression of QC, but not isoQC, was already reported for thyroid carcinomas [50] and for Human Umbilical Vein Endothelial Cells (HUVECs) after stimulation with TNF-α/IL-1β [21]. However, it appears that this effect is cell type-specific since in human coronary artery smooth muscle cells (HCASMCs), a co-regulation of QC and isoQC after stimulation using TNF-α/IL-1β was observed [21].

5. Conclusions

We conclude that neuronal QC expression is induced in neurons of ischemic brain regions, leading to increased levels of its substrate CCL2. CCL2, in turn, was identified in subsets of neurons and glial cells and thus might contribute to microglia activation and MHC-II cell infiltration. This does not, however, affect the functional outcome of stroke in the experimental setting during the post-ischemic observation period of 72 h. Therefore, future studies should focus on long-term consequences of modulated CCL2 expression in ischemic stroke.

Supplementary Materials

The following supporting information can be downloaded at: https://www.mdpi.com/article/10.3390/cells13171412/s1, Figure S1: Specificity of antibodies against QC, isoQC and CCL2.

Author Contributions

C.H. designed and supervised the study, performed histological processing, microscopic examination and quantification in mouse brain tissue and was a major contributor in writing the manuscript. L.U., S.B., P.D. and M.O. validated antibody specificity and performed immunohistochemical labeling, histological examination and quantitative analyses of mouse brain tissue. S.G. performed biochemical analyses in mouse brain tissue. S.S. and H.C. designed and supervised the study, analyzed data and participated in writing the manuscript. D.M. designed and supervised the study, performed animal surgery, i.e., experimental stroke, and contributed to writing the manuscript. S.R. initiated, designed and supervised the study and was a major contributor in writing the manuscript. All authors have read and agreed to the published version of the manuscript.

Funding

This work was supported by the German Research Foundation (DFG grants #RO 2226/15-1 to SR and #SCHI 1437/2-1 to SS).

Institutional Review Board Statement

The animal experiments were carried out in agreement with European regulations on the protection of animals used for scientific purposes (Directive 2010/63/EU for animal experiments), followed the 3R principles and ARRIVE guidelines and were carried out in accordance with the U.K. Animals (Scientific Procedures) Act, 1986 and associated guidelines. The study was approved by the Ethical Committee for Animal Research of Landesdirektion Sachsen, license number TVV13/18 on 25 September 2018.

Informed Consent Statement

Not applicable.

Data Availability Statement

Original data, electronic image files and immunohistochemically labelled mouse brain tissue sections will be made available upon reasonable request.

Acknowledgments

We thank Eva Jung (Medizinisch-Experimentelles Zentrum, Medical Faculty, Leipzig University) for dedicated pre- and post-surgery animal care and Benjamin Hietel (Fraunhofer IZI-MWT) for excellent technical assistance.

Conflicts of Interest

The authors declare no conflicts of interest. The funders had no role in the design of the study; in the collection, analyses, or interpretation of data; in the writing of the manuscript; or in the decision to publish the results.

References

  1. Busby, W.H.; Quackenbush, G.E.; Humm, J.; Youngblood, W.W.; Kizer, J.S. An enzyme(s) that converts glutaminyl-peptides into pyroglutamyl-peptides. J. Biol. Chem. 1987, 262, 8532–8536. [Google Scholar] [CrossRef] [PubMed]
  2. Fischer, W.H.; Spiess, J. Identification of a mammalian glutaminyl cyclase converting glutaminyl into pyroglutamyl peptides. Proc. Natl. Acad. Sci. USA 1987, 84, 3628–3632. [Google Scholar] [CrossRef] [PubMed]
  3. Böckers, T.M.; Kreutz, M.R.; Pohl, T. Glutaminyl-cyclase expression in the bovine/porcine hypothalamus and pituitary. J. Neuroendocrinol. 1995, 7, 445–453. [Google Scholar] [CrossRef] [PubMed]
  4. Hartlage-Rübsamen, M.; Staffa, K.; Waniek, A.; Wermann, M.; Hoffmann, T.; Cynis, H.; Schilling, S.; Demuth, H.U.; Roßner, S. Developmental expression and subcellular localization of glutaminyl cyclase in mouse brain. Int. J. Dev. Neurosci. 2009, 27, 825–835. [Google Scholar] [CrossRef]
  5. Becker, A.; Eichentopf, R.; Sedlmeier, R.; Waniek, A.; Cynis, H.; Koch, B.; Stephan, A.; Bäuscher, C.; Kohlmann, S.; Hoffmann, T.; et al. IsoQC (QPCTL) knock-out mice suggest differential substrate conversion by glutaminyl cyclase isoenzymes. Biol. Chem. 2016, 397, 45–55. [Google Scholar] [CrossRef]
  6. Morawski, M.; Hartlage-Rübsamen, M.; Jäger, C.; Waniek, A.; Schilling, S.; Schwab, C.; McGeer, P.L.; Arendt, T.; Demuth, H.U.; Roßner, S. Distinct glutaminyl cyclase expression in Edinger-Westphal nucleus, locus coeruleus and nucleus basalis Meynert contributes to pGlu-Abeta pathology in Alzheimer’s disease. Acta Neuropathol. 2010, 120, 195–207. [Google Scholar] [CrossRef]
  7. Hartlage-Rübsamen, M.; Morawski, M.; Waniek, A.; Jäger, C.; Zeitschel, U.; Koch, B.; Cynis, H.; Schilling, S.; Schliebs, R.; Demuth, H.U.; et al. Glutaminyl cyclase contributes to the formation of focal and diffuse pyroglutamate (pGlu)-Aβ deposits in hippocampus via distinct cellular mechanisms. Acta Neuropathol. 2011, 121, 705–719. [Google Scholar] [CrossRef]
  8. Hartlage-Rübsamen, M.; Bluhm, A.; Moceri, S.; Machner, L.; Köppen, J.; Schenk, M.; Hilbrich, I.; Holzer, M.; Weidenfeller, M.; Richter, F.; et al. A glutaminyl cyclase-catalyzed α-synuclein modification identified in human synucleinopathies. Acta Neuropathol. 2021, 142, 399–421. [Google Scholar] [CrossRef]
  9. Schilling, S.; Zeitschel, U.; Hoffmann, T.; Heiser, U.; Francke, M.; Kehlen, A.; Holzer, M.; Hutter-Paier, B.; Prokesch, M.; Windisch, M.; et al. Glutaminyl cyclase inhibition attenuates pyroglutamate Abeta and Alzheimer’s disease-like pathology. Nat. Med. 2008, 14, 1106–1111. [Google Scholar] [CrossRef]
  10. Jimenez-Sanchez, M.; Lam, W.; Hannus, M.; Sönnichsen, B.; Imarisio, S.; Fleming, A.; Tarditi, A.; Menzies, F.; Dami, T.E.; Xu, C.; et al. siRNA screen identifies QPCT as a druggable target for Huntington’s disease. Nat. Chem. Biol. 2015, 11, 347–354. [Google Scholar] [CrossRef]
  11. Alexandru, A.; Jagla, W.; Graubner, S.; Becker, A.; Bäuscher, C.; Kohlmann, S.; Sedlmeier, R.; Raber, K.A.; Cynis, H.; Rönicke, R.; et al. Selective hippocampal neurodegeneration in transgenic mice expressing small amounts of truncated Aβ is induced by pyroglutamate-Aβ formation. J. Neurosci. 2011, 31, 12790–12801. [Google Scholar] [CrossRef] [PubMed]
  12. Hoffmann, T.; Meyer, A.; Heiser, U.; Kurat, S.; Böhme, L.; Kleinschmidt, M.; Bühring, K.U.; Hutter-Paier, B.; Farcher, M.; Demuth, H.U.; et al. Glutaminyl cyclase inhibitor PQ912 improves cognition in mouse models of Alzheimer’s disease-studies on relation to effective target occupancy. J. Pharmacol. Exp. Ther. 2017, 362, 119–130. [Google Scholar] [CrossRef] [PubMed]
  13. Jawhar, S.; Wirths, O.; Schilling, S.; Graubner, S.; Demuth, H.U.; Bayer, T.A. Overexpression of glutaminyl cyclase, the enzyme responsible for pyroglutamate A{beta} formation, induces behavioral deficits, and glutaminyl cyclase knock-out rescues the behavioral phenotype in 5XFAD mice. J. Biol. Chem. 2011, 286, 4454–4460. [Google Scholar] [CrossRef] [PubMed]
  14. Lues, I.; Weber, F.; Meyer, A.; Bühring, U.; Hoffmann, T.; Kühn-Wache, K.; Manhart, S.; Heiser, U.; Pokorny, R.; Chiesa, J.; et al. A phase 1 study to evaluate the safety and pharmacokinetics of PQ912, a glutaminyl cyclase inhibitor, in healthy subjects. Alzheimers Dement. 2015, 1, 182–195. [Google Scholar] [CrossRef]
  15. Scheltens, P.; Hallikainen, M.; Grimmer, T.; Duning, T.; Gouw, A.A.; Teunissen, C.E.; Wink, A.M.; Maruff, P.; Harrison, J.; van Baal, C.M.; et al. Safety, tolerability and efficacy of the glutaminyl cyclase inhibitor PQ912 in Alzheimer’s disease: Results of a randomized, double-blind, placebo-controlled phase 2a study. Alzheimers Res. Ther. 2018, 10, 107. [Google Scholar] [CrossRef]
  16. Vijverberg, E.G.B.; Axelsen, T.M.; Bihlet, A.R.; Henriksen, K.; Weber, F.; Fuchs, K.; Harrison, J.E.; Kühn-Wache, K.; Alexandersen, P.; Prins, N.D.; et al. Rationale and study design of a randomized, placebo-controlled, double-blind phase 2b trial to evaluate efficacy, safety, and tolerability of an oral glutaminyl cyclase inhibitor varoglutamstat (PQ912) in study participants with MCI and mild AD-VIVIAD. Alzheimers Res. Ther. 2021, 13, 142. [Google Scholar] [CrossRef]
  17. Höfling, C.; Indrischek, H.; Höpcke, T.; Waniek, A.; Cynis, H.; Koch, B.; Schilling, S.; Morawski, M.; Demuth, H.U.; Roßner, S.; et al. Mouse strain and brain region-specific expression of the glutaminyl cyclases QC and isoQC. Int. J. Dev. Neurosci. 2014, 36, 64–73. [Google Scholar] [CrossRef]
  18. Hartlage-Rübsamen, M.; Waniek, A.; Meissner, J.; Morawski, M.; Schilling, S.; Jäger, C.; Kleinschmidt, M.; Cynis, H.; Kehlen, A.; Arendt, T.; et al. Isoglutaminyl cyclase contributes to CCL2-driven neuroinflammation in Alzheimer’s disease. Acta Neuropathol. 2015, 129, 565–583. [Google Scholar] [CrossRef]
  19. Cynis, H.; Rahfeld, J.U.; Stephan, A.; Kehlen, A.; Koch, B.; Wermann, M.; Demuth, H.U.; Schilling, S. Isolation of an isoenzyme of human glutaminyl cyclase: Retention in the Golgi complex suggests involvement in the protein maturation machinery. J. Mol. Biol. 2008, 379, 966–980. [Google Scholar] [CrossRef]
  20. Cynis, H.; Hoffmann, T.; Friedrich, D.; Kehlen, A.; Gans, K.; Kleinschmidt, M.; Rahfeld, J.U.; Wolf, R.; Wermann, M.; Stephan, A.; et al. The isoenzyme of glutaminyl cyclase is an important regulator of monocyte infiltration under inflammatory conditions. EMBO Mol. Med. 2011, 3, 545–558. [Google Scholar] [CrossRef]
  21. Kehlen, A.; Haegele, M.; Böhme, L.; Cynis, H.; Hoffmann, T.; Demuth, H.U. N-terminal pyroglutamate formation in CX3CL1 is essential for its full biologic activity. Biosci. Rep. 2017, 37, BSR20170712. [Google Scholar] [CrossRef]
  22. Cynis, H.; Kehlen, A.; Haegele, M.; Hoffmann, T.; Heiser, U.; Fujii, M.; Shibazaki, Y.; Yoneyama, H.; Schilling, S.; Demuth, H.U. Inhibition of glutaminyl cyclases alleviates CCL2-mediated inflammation of non-alcoholic fatty liver disease in mice. Int. J. Exp. Pathol. 2013, 94, 217–225. [Google Scholar] [CrossRef] [PubMed]
  23. Hellvard, A.; Maresz, K.; Schilling, S.; Graubner, S.; Heiser, U.; Jonsson, R.; Cynis, H.; Demuth, H.U.; Potempa, J.; Mydel, P. Glutaminyl cyclases as novel targets for the treatment of septic arthritis. J. Infect. Dis. 2013, 207, 768–777. [Google Scholar] [CrossRef] [PubMed]
  24. Gyoneva, S.; Ransohoff, R.M. Inflammatory reaction after traumatic brain injury: Therapeutic potential of targeting cell-cell communication by chemokines. Trends Pharmacol. Sci. 2015, 36, 471–480. [Google Scholar] [CrossRef] [PubMed]
  25. Arisi, G.M.; Foresti, M.L.; Katki, K.; Shapiro, L.A. Increased CCL2, CCL3, CCL5, and IL-1β cytokine concentration in piriform cortex, hippocampus, and neocortex after pilocarpine-induced seizures. J. Neuroinflammation 2015, 12, 129. [Google Scholar] [CrossRef] [PubMed]
  26. Leung, S.Y.; Wong, M.P.; Chung, L.P.; Chan, A.S.; Yuen, S.T. Monocyte chemoattractant protein-1 expression and macrophage infiltration in gliomas. Acta Neuropathol. 1997, 93, 518–527. [Google Scholar] [CrossRef]
  27. Lindemann, C.; Marschall, V.; Weigert, A.; Klingebiel, T.; Fulda, S. Smac mimetic-induced upregulation of CCL2/MCP-1 triggers migration and invasion of glioblastoma cells and influences the tumor microenvironment in a paracrine manner. Neoplasia 2015, 17, 481–489. [Google Scholar] [CrossRef]
  28. Sokolova, A.; Hill, M.D.; Rahimi, F.; Warden, L.A.; Halliday, G.M.; Shepherd, C.E. Monocyte chemoattractant protein-1 plays a dominant role in the chronic inflammation observed in Alzheimer’s disease. Brain Pathol. 2009, 19, 392–398. [Google Scholar] [CrossRef]
  29. Westin, K.; Buchhave, P.; Nielsen, H.; Minthon, L.; Janciauskiene, S.; Hansson, O. CCL2 is associated with a faster rate of cognitive decline during early stages of Alzheimer’s disease. PLoS ONE 2012, 7, e30525. [Google Scholar] [CrossRef]
  30. Worthmann, H.; Tryc, A.B.; Goldbecker, A.; Ma, Y.T.; Tountopoulou, A.; Hahn, A.; Dengler, R.; Lichtinghagen, R.; Weissenborn, K. The temporal profile of inflammatory markers and mediators in blood after acute ischemic stroke differs depending on stroke outcome. Cerebrovasc. Dis. 2010, 30, 85–92. [Google Scholar] [CrossRef]
  31. Kuriyama, N.; Mizuno, T.; Kita, M.; Nagakane, Y.; Hosomi, A.; Harada, S.; Takeda, K.; Ozasa, K.; Yamada, K.; Tokuda, T.; et al. Predictive markers of blood cytokine and chemokine in recurrent brain infarction. J. Interferon Cytokine Res. 2009, 29, 729–734. [Google Scholar] [CrossRef] [PubMed]
  32. Schilling, S.; Kohlmann, S.; Bäuscher, C.; Sedlmeier, R.; Koch, B.; Eichentopf, R.; Becker, A.; Cynis, H.; Hoffmann, T.; Berg, S.; et al. Glutaminyl cyclase knock-out mice exhibit slight hypothyroidism but no hypogonadism: Implications for enzyme function and drug development. J. Biol. Chem. 2011, 286, 14199–14208. [Google Scholar] [CrossRef] [PubMed]
  33. Lu, B.; Rutledge, B.J.; Gu, L.; Fiorillo, J.; Lukacs, N.W.; Kunkel, S.L.; North, R.; Gerard, C.; Rollins, B.J. Abnormalities in monocyte recruitment and cytokine expression in monocyte chemoattractant protein 1-deficient mice. J. Exp. Med. 1998, 187, 601–608. [Google Scholar] [CrossRef]
  34. Barendrecht, S.; Schreurs, A.; Geissler, S.; Sabanov, V.; Ilse, V.; Rieckmann, V.; Eichentopf, R.; Künemund, A.; Hietel, B.; Wussow, S.; et al. A novel human tau knock-in mouse model reveals interaction of Abeta and human tau under progressing cerebral amyloidosis in 5xFAD mice. Alzheimers Res. Ther. 2023, 15, 16. [Google Scholar] [CrossRef]
  35. Longa, E.Z.; Weinstein, P.R.; Carlson, S.; Cummins, R. Reversible middle cerebral artery occlusion without craniectomy in rats. Stroke 1989, 20, 84–91. [Google Scholar] [CrossRef]
  36. Strecker, J.K.; Minnerup, J.; Gess, B.; Ringelstein, E.B.; Schäbitz, W.R.; Schilling, M. Monocyte chemoattractant protein-1-deficiency impairs the expression of IL-6, IL-1β and G-CSF after transient focal ischemia in mice. PLoS ONE 2011, 6, e25863. [Google Scholar] [CrossRef]
  37. Menzies, S.A.; Hoff, J.T.; Betz, A.L. Middle cerebral artery occlusion in rats: A neurological and pathological evaluation of a reproducible model. Neurosurgery 1992, 31, 100–106. [Google Scholar] [CrossRef] [PubMed]
  38. Strecker, J.K.; Minnerup, J.; Schütte-Nütgen, K.; Gess, B.; Schäbitz, W.R.; Schilling, M. Monocyte chemoattractant protein-1-deficiency results in altered blood-brain barrier breakdown after experimental stroke. Stroke 2013, 44, 2536–2544. [Google Scholar] [CrossRef]
  39. Schuette-Nuetgen, K.; Strecker, J.K.; Minnerup, J.; Ringelstein, E.B.; Schilling, M. MCP-1/CCR-2-double-deficiency severely impairs the migration of hematogenous inflammatory cells following transient cerebral ischemia in mice. Exp. Neurol. 2012, 233, 849–858. [Google Scholar] [CrossRef]
  40. Gliem, M.; Krammes, K.; Liaw, L.; van Rooijen, N.; Hartung, H.P.; Jander, S. Macrophage-derived osteopontin induces reactive astrocyte polarization and promotes re-establishment of the blood brain barrier after ischemic stroke. Glia 2015, 63, 2198–2207. [Google Scholar] [CrossRef]
  41. Gliem, M.; Schwaninger, M.; Jander, S. Protective features of peripheral monocytes/macrophages in stroke. Biochim. Biophys. Acta 2016, 1862, 329–338. [Google Scholar] [CrossRef] [PubMed]
  42. Wattananit, S.; Tornero, D.; Graubardt, N.; Memanishvili, T.; Monni, E.; Tatarishvili, J.; Miskinyte, G.; Ge, R.; Ahlenius, H.; Lindvall, O.; et al. Monocyte-derived macrophages contribute to spontaneous long-term functional recovery after stroke in mice. J. Neurosci. 2016, 36, 4182–4195. [Google Scholar] [CrossRef] [PubMed]
  43. Ling, Z.; Li, W.; Hu, J.; Li, Y.; Deng, M.; Zhang, S.; Ren, X.; Wu, T.; Xia, J.; Cheng, B.; et al. Targeting CCL2-CCR4 axis suppress cell migration of head and neck squamous cell carcinoma. Cell Death Dis. 2022, 13, 158. [Google Scholar] [CrossRef] [PubMed]
  44. Zhang, T.; Somasundaram, R.; Berencsi, K.; Caputo, L.; Gimotty, P.; Rani, P.; Guerry, D.; Swoboda, R.; Herlyn, D. Migration of cytotoxic T lymphocytes toward melanoma cells in three-dimensional organotypic culture is dependent on CCL2 and CCR4. Eur. J. Immunol. 2006, 36, 457–467. [Google Scholar] [CrossRef] [PubMed]
  45. Lieberam, I.; Förster, I. The murine beta-chemokine TARC is expressed by subsets of dendritic cells and attracts primed CD4+ T cells. Eur. J. Immunol. 1999, 29, 2684–2694. [Google Scholar] [CrossRef]
  46. Hiroyama, T.; Iwama, A.; Nakamura, Y.; Nakauchi, H. Fractalkine shares signal sequence with TARC: Gene structures and expression profiles of two chemokine genes. Genomics 2001, 75, 3–5. [Google Scholar] [CrossRef]
  47. Lier, J.; Streit, W.J.; Bechmann, I. Beyond activation: Characterizing microglial functional phenotypes. Cells 2021, 10, 2236. [Google Scholar] [CrossRef]
  48. Spiteri, A.G.; Wishart, C.L.; King, N.J.C. Immovable object meets unstoppable force? Dialogue between resident and peripheral myeloid cells in the inflamed brain. Front. Immunol. 2020, 11, 600822. [Google Scholar] [CrossRef]
  49. Dirnagl, U.; Iadecola, C.; Moskowitz, M.A. Pathobiology of ischaemic stroke: An integrated view. Trends Neurosci. 1999, 22, 391–397. [Google Scholar] [CrossRef]
  50. Kehlen, A.; Haegele, M.; Menge, K.; Gans, K.; Immel, U.D.; Hoang-Vu, C.; Klonisch, T.; Demuth, H.U. Role of glutaminyl cyclases in thyroid carcinomas. Endocr. Relat. Cancer 2013, 20, 79–90. [Google Scholar] [CrossRef]
Figure 1. Characterization of focal cerebral ischemia in knock-out mouse models. Mice of different genotypes (wild-type, CCL2 KO, QC KO and isoQC KO) were subjected to transient focal cerebral ischemia for 30 min, followed by 24 h and 72 h observation periods. (A) Survival rate (p = 0.858), Menzies score (p = 0.91), overall physical condition (p = 0.82) and body weight (p = 0.78) did not differ significantly between genotypes. Only 45% (wild type) to 58% (QC KO) of the animals subjected to the operation procedure survived for 72 h. For all genotypes, a constant Menzies score of 3 was determined at all time points. In contrast, the overall physical condition steadily declined (higher scores indicating worse condition) during the 72 h post-surgery period, which was also characterized by a weight loss ranging between 7% in wild-type mice and 16% in isoQC KO mice. (B) Immunohistochemical NeuN + HuC/D images from experimental animals of all genotypes at 24 h and 72 h after onset of ischemia. The dashed lines indicate the infarct area identified by diminished NeuN + HuC/D labeling. The infarct volume was calculated from serial brain slices for all animals of all genotypes and was found to be between 18 mm3 (CCL2 KO, 24 h) and 35 mm3 (QC KO, 24 h). (C) As a complementary measure of infarct size, increased immunosignals for Neurofilament L (NFL) in the ischemic area was quantified in serial sections. Here, the smallest ischemic areas were detected for CCL2 KO mice at 24 h and largest for QC KO at 72 h after ischemia. Note the complementary loss of NeuN + HuC/D and induction of NFL immunoreactivity in the ischemic area (I).
Cells 13 01412 g001
Figure 2. Expression of QC and isoQC in ischemic brain areas. (A) Immunohistochemical labeling for QC and isoQC in the wild-type mouse brain at 24 h and 72 h after ischemia. (B) There were significant increases in the numbers of QC-immunoreactive neurons in infarct areas identified by NeuN + HuC/D labeling in consecutive brain sections for all genotypes (except QC KO) at both survival time points. (C) In contrast, there was significantly reduced isoQC immunoreactivity in infarct areas compared to the non-ischemic hemisphere. * p < 0.05; ** p < 0.01; *** p < 0.001; differences statistically significant versus control.
Cells 13 01412 g002
Figure 3. Quantification of CCL2 expression and co-localization to neuronal and glial markers. (A) Left: single immunohistochemical labeling of CCL2 in the wild-type (WT) mouse brain 24 h and 72 h after ischemia. Note the absence of CCL2 immunoreactivity in a CCL2 KO mouse brain 72 h after ischemia. Right: note the post-ischemia time-dependent increase in signal intensity and spreading of the CCL2 immunosignal beyond the infarct (I) region demarked by the dashed line related to reduced NeuN + HuC/D labeling at 72 h. (B) Quantification of CCL2 immunosignals demonstrating increased CCL2 in the wild-type (WT) mouse brain at 24 and 72 h. Note that the mean values for CCL2 signals in QC KO and in isoQC KO are only half of the of the WT mice at both time points. (C) Appearance of CCL2 immunoreactivity in the ischemic cortex as extracellular spots, in association with vessels and in a glia-like shape. (D) Examples of double labeling of CCL2 with microglia markers Iba1, CD68 and TMEM119, with neurons (NeuN + HuC/D), astrocytes (GFAP) and oligodendrocytes (Olig2) in the ischemic cortex. Note the presence of CCL2 immunosignals in subsets of these neuronal and glial populations (arrows) except in oligodendrocytes. ** p < 0.01; differences statistically significant versus control.
Cells 13 01412 g003
Figure 4. Glia cell activation/recruitment in ischemic brain regions. (A) Triple immunofluorescent labeling of the microglial marker Iba1 and the astrocyte marker GFAP in combination with NeuN + HuC/D to identify the cortical infarct area (I). In the high magnification images (bottom), the activation of Iba1-positive microglia in the ischemic region and the presence of GFAP-immunoreactive reactive astrocytes in the border zone is evident. (B) Quantification of GFAP immunosignals in brain sections of mice of different genotypes. Note the instant increase in GFAP expression at 24 h for all genotypes, which is not increase further at 72 h. (C,D) In contrast, both numbers of activated microglia (C) and of MHC-II cells (D) only increase at 72 h after ischemia for all genotypes. Note that the mean values for both cell types in QC KO mice and in isoQC KO mice are only half of that in wild-type (WT) mice. Arrows in (D) point towards MHC-II-positive neurons (black). (E,F) The immunoreactivity for CD68 is increased after ischemia in all genotypes (E), whereas TMEM119 immunosignals are reduced (F). * p < 0.05; ** p < 0.01; *** p < 0.001; differences statistically significant versus control. # p < 0.05; ## p < 0.01; differences statistically significant at 72 h versus 24 h.
Cells 13 01412 g004
Figure 5. Quantification of chemokines in brain tissue and plasma of mice after ischemia. The concentrations of CCL2, CX3CL1, IL-1β, TNF-α and CCL17 were quantified by multiplex analyses in brain tissue of the ischemic hemisphere (left) and in plasma (right) at 24 h and 72 h after ischemia as indicated. Upregulation in the brain tissue is only selectively mirrored in the plasma, e.g., in case of CCL2. Please note the lack of CCL2 in CCL2 KO mice. * p < 0.05; ** p < 0.01; differences statistically significant versus control. ## p < 0.01; differences statistically significant at 72 h versus 24 h.
Cells 13 01412 g005
Table 1. Primers used for genotyping.
StrainPrimer Sequence 5‘ → 3‘Product [bp]
QC KOPbd2-1CommonGTC CGG TAA GGT GAG GAG AA
Pbd2-2KOTGA TGT GTG CGT TTC AGA GA525 (KO)
Pbd2-WT1WTCCA GAG ACA TCC TGG TAA AAC A733 (WT)
   
isoQC KO7bCommonTGT CCA CCC TCC TAC CTC TC212 + 106 (KO)
(AvrII Digestion)
8bCommonTCA CCT GCT GCT TGA TTC TG318 (WT)
(AvrII Digestion)
   
CCL2 KOoIMR7415KOGCC AGA GGC CAC TTG TGT AG179 (KO)
oIMR9219_optWTTGA CAG TCC CCA GAG TCA CAT AG287 (WT)
oIMR9220_optCommonTCA TTG GGA TCA TCT TGC TGG TGA
Table 2. Cocktails of primary antibodies used for double and triple labeling immunohistochemistry.
Primary AntibodyDilutionHostCompanyCat. No.Detection
single labeling
MHC-II1:500ratInvitrogenM5/114.15.2Ni-DAB
NeuN1:1000mouseMilliporeMAB 377DAB
HuC/D1:1000mouseInvitrogenA-21271DAB
QC1:500goatIZI77101DAB/Ni-DAB
isoQC1:200rabbitIZI3285DAB
double labeling
NeuN1:1000mouseMilliporeMAB 377donkey anti-mouse Cy5
HuC/D +1:1000mouseInvitrogenA-21271donkey anti-mouse Cy5
NFL1:200rabbitSynaptic Systems171002donkey anti-rabbit Cy2
CCL2+1:200goatAF479R&Ddonkey anti-goat Cy3
NeuN1:1000mouseMilliporeMAB 377donkey anti-mouse Cy5
HuC/D1:1000mouseInvitrogenA-21271donkey anti-mouse Cy5
Hoechst1:10,000-InvitrogenH3570-
Iba11:500rabbitWako019-19741donkey anti-rabbit Cy2
CD681:100ratBioradMCA1957donkey anti-rat Cy2
TMEM1191:100rabbitabcamab209064donkey anti-rabbit Cy2
GFAP1:200guinea pigSynaptic Systems173001donkey anti-guinea pig Cy5
Olig21:100rabbitabcamab81093donkey anti-rabbit Cy5
triple labeling
NeuN 1:1000mouseMilliporeMAB 377donkey anti-mouse Cy3
HuC/D +1:1000mouseInvitrogenA-21271donkey anti-mouse Cy3
Iba1 +1:500rabbitWako019-19741donkey anti-rabbit Cy2
GFAP1:200guinea pigSynaptic Systems173001donkey anti-guinea pig Cy5
Secondary antibodies were all from Dianova and used at a dilution of 1:200.
Disclaimer/Publisher’s Note: The statements, opinions and data contained in all publications are solely those of the individual author(s) and contributor(s) and not of MDPI and/or the editor(s). MDPI and/or the editor(s) disclaim responsibility for any injury to people or property resulting from any ideas, methods, instructions or products referred to in the content.

