Article

Expression of LOXL3, NES, and SNAI1 in Melanoma Genesis and Progression

1
Department of Dermatovenerology, University Hospital of Split, 21000 Split, Croatia
2
Department of Anatomy, Histology and Embryology, University of Split School of Medicine, 21000 Split, Croatia
3
Laboratory of Morphology, Department of Histology and Embryology, School of Medicine, University of Mostar, 88 000 Mostar, Bosnia and Herzegovina
4
Department of Pathology, Forensic Medicine and Cytology, University Hospital of Split, 21000 Split, Croatia
5
Center for Translational Research in Biomedicine, University of Split School of Medicine, 21000 Split, Croatia
*
Author to whom correspondence should be addressed.
Cells 2024, 13(17), 1450; https://doi.org/10.3390/cells13171450
Submission received: 31 July 2024 / Revised: 27 August 2024 / Accepted: 28 August 2024 / Published: 29 August 2024

Abstract

:
Melanoma is the most severe type of skin cancer and among the most malignant neoplasms in humans. With the growing incidence of melanoma, increased numbers of therapeutic options, and the potential to target specific proteins, understanding the basic mechanisms underlying the disease’s progression and resistance to treatment has never been more important. LOXL3, SNAI1, and NES are key factors in melanoma genesis, regulating tumor growth, metastasis, and cellular differentiation. In our study, we explored the potential role of LOXL3, SNAI1, and NES in melanoma progression and metastasis among patients with dysplastic nevi, melanoma in situ, and BRAF+ and BRAF− metastatic melanoma, using immunofluorescence and qPCR analysis. Our results reveal a significant increase in LOXL3 expression and the highest NES expression in BRAF+ melanoma compared to BRAF−, dysplastic nevi, and melanoma in situ. As for SNAI1, the highest expression was observed in the metastatic melanoma group, without significant differences among groups. We found co-expression of LOXL3 and SNAI1 in the perinuclear area of all investigated subgroups and NES and SNAI1 co-expression in melanoma cells. These findings suggest a codependence or collaboration between these markers in melanoma EMT, suggesting new potential therapeutic interventions to block the EMT cascade that could significantly affect survival in many melanoma patients.

1. Introduction

A malignant tumor derived from melanocytes, melanoma mostly occurs in the skin but can also originate from mucosal surfaces, the ciliary body, the uvea, and conjunctiva of the eye, as well as the leptomeninges. It is the fifth most common malignancy in men and sixth most common in women. Over the past 40 years, melanoma incidence has increased globally at a rate of about 3–7% annually. Melanoma is the most serious type of skin cancer, accounting for almost 90% of deaths related to cutaneous malignancies because of its potential for metastasis. Survival rates depend on the stage of the disease at the time of diagnosis, so early recognition and treatment are crucial to improve the outcome and survival. The 5-year survival rate for localized primary melanomas is 99%. Patients with regional disease have a 5-year survival rate of around 68%, while those with distant metastatic disease around 30% [1,2,3]. Thus, melanoma is a life-threatening disease when diagnosed at an advanced stage or when metastasis occurs after surgical treatment of the primary tumor [4]. The initial oncogenic events in melanoma formation impact genes involved in the mitogen-activated protein kinase (MAPK) and phosphoinositide 3-kinase (PI3K) signaling pathways. These genes include BRAF, NRAS, and KIT. The MAPK signaling pathway is essential in the pathogenesis of various types of cancer as it regulates key cellular functions, including proliferation, growth, apoptosis, transformation, and migration [5,6,7,8]. The protein RAS binds to the RAS-binding domain of RAF, leading to dimerization and activation of RAF, which subsequently phosphorylates MEK and leads to its activation and the activation of MAPK [9]. The presence of an oncogenic BRAF mutation results in continuous BRAF activity and the activation of the MEK and MAPK pathways, independent of the inclusion of RAS/RAF [10]. The V600E mutations of BRAF, namely the substitution of valine with glutamic acid at codon 600, were detected in over 90% of acquired melanocytic nevi and over 50% of cutaneous melanomas [11,12,13,14]. BRAF or NRAS activity leads to cellular proliferation and nevus formation with limited growth. However, benign nevi can progress to melanoma, and studies have shown a linear progression pattern from precursor lesions like benign and dysplastic nevi to melanoma in situ and invasive melanoma [5,15]. Specific molecular events characterize this transition. Among the various factors implicated in melanoma genesis, the roles of lysyl oxidase-like 3 (LOXL3), Snai1 family transcriptional repressor 1 (SNAI1), and nestin (NES) have garnered significant attention due to their involvement in key pathways that regulate tumor growth, metastasis, and cellular differentiation [16,17]. The LOXL3 enzyme belongs to the lysyl oxidase family, which consists of five associated members: the prototype LOX and four LOX-like enzymes, LOXL1–4. These enzymes control the balance of the extracellular matrix and play a role in the development of tumors through intracellular and extracellular actions [18]. They function as extracellular enzymes, facilitating cross-linking and stabilizing collagen and elastin fibers. Nevertheless, research has also demonstrated their participation in gene transcription, epithelial–mesenchymal transition (EMT), development, differentiation, and angiogenesis in cancer [17,19]. Prior research has demonstrated that LOXL3 is crucial for the survival of human melanoma cells and the preservation of genomic stability. Animal models with LOXL3 deletion exhibited prolonged onset of melanoma, reduced tumor development, and decreased spread of metastases. It was proposed that LOXL3 modulates phenotypic switching through SNAI1 [20]. NES is a type VI intermediate filament protein first identified as a marker for neural stem cells. The expression of this gene was detected in embryonic cells, and its association with malignancies has been documented in melanoma as well as other tumors, including ovarian cancer, breast cancer, prostate cancer, pancreatic cancer, and osteosarcoma [21,22,23,24]. NES expression in melanoma has been associated with cell migration, invasion, disease progression, and metastasis. It is expressed more strongly in melanomas compared to benign nevi, and even more in advanced melanoma stages [25,26]. SNAI1 is a member of the Snai1 superfamily of zinc finger transcription factors that govern the EMT of various cancers. An increase in SNAI1 expression was observed to correlate with tumor progression and recurrence. SNAI1 is overexpressed in melanoma, hepatocellular carcinoma, head and neck squamous cell carcinoma, and endometrial cancers [27,28,29,30]. In animal models, it has been shown that Snai1 depletion blocks melanoma growth by interrupting cell proliferation and enhancing apoptosis [31].
Considering that the co-expression of LOXL3, SNAI1, and NES in melanoma has not been described in the existing literature, our study aimed to determine whether LOXL3, SNAI1, and NES are potential risk factors and whether their expression can be used to predict melanoma progression and metastasis in patients with dysplastic nevi, melanoma in situ, and BRAF+ and BRAF− metastatic melanoma. Our results can potentially improve comprehension of the association between the investigated factors and melanoma progression, which could lead to the development of potential new therapeutic targets for melanoma treatment.

2. Materials and Methods

2.1. Tissue Procurement and Processing

A total of 45 paraffin blocks of skin biopsy samples with a pathological diagnosis of dysplastic nevus, melanoma in situ, and BRAF+ and BRAF− melanoma were collected from the Department of Pathology, Forensic Medicine and Cytology at the University Hospital Center Split from 2017 to 2020 (Table 1). Ethical approval was given by the Ethics Committee of University Hospital Center Split (class: 520-03/24-01/95, approval number: 2181-147/01-06/LJ.Z.24-02), following the Helsinki Declaration [32]. The pathology report was used to derive clinical data from the time of the biopsy. Inclusion criteria demanded sufficient paraffin block material for immunohistochemistry (IHC) and complete clinical data. Incomplete laboratory results or an insufficient amount of tissue for IHC constituted the exclusion criteria.
The skin biopsy samples were collected and fixed with 4% paraformaldehyde (PFA) in 0.1 M phosphate buffer saline (PBS) overnight to enable standard histological examinations, including hematoxylin–eosin and immunofluorescence labeling. After dehydration of the tissue in graded ethanol solutions and clearing in xylol, it was embedded in paraffin blocks, serially cut to a thickness of 5 µm using a microtome, and mounted on glass slides. Every tenth section was stained by hematoxylin–eosin (H&E). Proper tissue preservation and pathological findings in the skin biopsies were examined by light microscopy.

2.2. Immunofluorescence

Following deparaffinization using xylol and the gradual rehydration in water–ethanol solutions, the histological slides were subjected to antigen retrieval. This involved heating the slides in a water steamer at 95 °C for 30 min in a 0.01 M citrate buffer (pH 6.0), followed by cooling to room temperature. After washing the slides in a 0.1 M PBS solution, a protein-blocking solution (ab64226, Abcam, Cambridge, UK) was applied for 30 min at room temperature to prevent non-specific staining. Table 2 provides comprehensive information involving the application and overnight incubation of primary antibodies in a humidity chamber. This was followed by rinsing in PBS and a subsequent one-hour incubation of secondary antibodies (Table 2). The nuclei were detected with 4′,6-diamidino-2-phenylindole (DAPI) after the slides were washed with PBS. Following the last rinse with distilled water, the mounting media (Immumount, Shandon, Pittsburgh, PA, USA) was applied, and the histological slides were covered with a cover slip.
Prior to the preadsorption experiment, each primary antibody was diluted to the predetermined concentration using a blocking solution. Tissue slices were treated with a solution containing a suitable peptide antigen. No antibody staining was seen. When the primary antibodies were excluded from the experimental technique, there were no signs of non-specific binding of the secondary antibody or any false-positive results.

2.3. Data Acquisition

H&E slides were analyzed using a light microscope (BX40, Olympus, Tokyo, Japan). Images of the skin biopsy samples were recorded by an epifluorescence microscope (BX51, Olympus, Tokyo, Japan) equipped with a Nikon DS-Ri2 camera (Nikon Corporation, Tokyo, Japan) with NIS-Elements F software (version 5.22.00). LOXL3, SNAI1, and NES were analyzed in ten non-overlapping representative fields at ×1000 total magnification with the use of immersion oil (Carl Roth, Karlsruhe, Germany) with a constant exposure duration. Green staining was interpreted as positive LOXL3 and NES immunoexpression, and red staining as positive SNAI1 immunoexpression.

2.4. Semi-Quantification

The intensity of staining of LOXL3, SNAI1, and NES markers in dysplastic nevus, melanoma in situ, BRAF+ and BRAF− melanomas were semi-quantitatively evaluated into four groups according to the staining reactivity: no reactivity = −, mild reactivity = +, moderate reactivity = ++, and strong reactivity = +++.

2.5. Image Analysis of Area Percentage

The microphotographs were processed and analyzed using ImageJ software Version 1.54 (National Institutes of Health, Bethesda, MD, USA) for quantitative cell assessment of immunoreactivity as described previously [33,34,35]. The fluorescence leak was decreased by subtracting the red countersignal from the green fluorescence and applying a median filter with a 2.0-pixel radius. Each image was then altered using the threshold method (triangle thresholding algorithm), and the “analyze particles” option was used to measure the fluorescence percentage area.

2.6. Statistical Analysis of Area Percentage

GraphPad Prism 9.0.0 software was used for statistical analyses (GraphPad Software, San Diego, CA, USA). The Shapiro–Wilk test was used to check whether the data distribution was normal. Each dataset regarding area percentage analysis was described with p at the probability level of p < 0.05, regarded as statistically significant. Datasets were analyzed using an ordinary one-way ANOVA followed by Tukey’s multiple comparisons test. The percentage of positive cells was expressed as the mean ± standard deviation (SD).
All graphs were generated using GraphPad Prism 9.0.0. Plates were created using Adobe Photoshop version 21.0.2 (Adobe, San Francisco, CA, USA). Background subtraction and contrast were applied to microphotographs for presentation purposes.

2.7. RNA Isolation and Reverse Transcription

Total RNA was extracted from 24 human formalin-fixed, paraffin-embedded melanoma samples, including dysplastic nevus (n = 6), melanoma in situ (n = 6), BRAF+ (n = 6), and BRAF− (n = 6). Multiple 6 µm thick tissue slices were placed in RNAse-free tubes and processed with High Pure RNA Paraffin (Cat. No. 03270289001; Roche, Basel, Switzerland) following the manufacturer’s instructions. The protocol began with deparaffinizing the paraffin-embedded tissue, washing it in absolute ethanol, and centrifuging at maximum speed for 2 min. Proteinase K and Tissue Lysis Buffer were then added to the dried pellet for digestion and overnight incubation. The following day, the binding buffer and ethanol were applied to the lysate, and the solution was applied to a spin column. The bound RNA was washed from the column, and DNase working solution and incubation buffer were added to the eluate and mixed. The total RNA in each sample was quantified using the Qubit™ 4 Fluorometer (Thermo Fisher Scientific Inc., Waltham, MA, USA). The samples were diluted to match the lowest measured concentration (1.34 ng/µL). Then, 1.34 nanograms of total RNA was reverse transcribed into complementary DNA (cDNA) using a High Capacity Reverse Transcriptase Kit (Applied Biosystems, Foster City, CA, USA) with random primers, as per the manufacturer’s instructions. The cDNA, with a final volume of 20 µL, was stored at −80 °C for subsequent quantification of genes of interest.

2.8. qPCR

qPCR analysis was conducted on a Real-Time PCR instrument (Applied BiosystemsFast 7500, Waltham, MA, USA) using Taqman® Fast Advanced Universal Master Mix II (Applied Biosystems, Waltham, MA, USA) comprising AmpEraseuracil-N-glycosylase and the passive reference dye ROX. ProbesTaqman® gene expression assays for human LOXL3, SNAI1, and NES were provided by Applied Biosystems (Hs01046945_m1, Hs00195591_m1, Hs01895061_u1, and Hs00707120_s). Glyceraldehyde-3-phosphate dehydrogenase (GAPDH) was used as the housekeeping gene (assay ID Hs99999905_m1). Taqman real-time PCR was performed with a 2 µL cDNA template, 1 µL Taqman® (Applied Biosystems, Waltham, MA, USA) gene expression assay, and 10 µL Taqman® (Applied Biosystems, Waltham, MA, USA) universal master mix, bringing the total volume to 20 µL. The PCR protocol involved an initial 2 min incubation at 50 °C for uracil-N-glycosylase activation, followed by 2 min at 95 °C for polymerase activation, and then 40 cycles of amplification (3 s at 95 °C and 30 s at 60 °C). Duplicate PCRs were conducted for each gene per cDNA sample. A negative control with nuclease-free water instead of a cDNA template was included in each experiment. The 2−∆∆CT method was employed for relative quantification. The plate was subsequently analyzed using the Applied Biosystems™ 7500 RT-PCR system (Thermo Fisher Scientific, Waltham, MA, USA).

2.9. Statistical Analysis of RT-qPCR

Statistical analysis was conducted using ordinary one-way ANOVA followed by Tukey’s multiple comparisons test, utilizing Prism 9.0.0 for Windows (GraphPad Software, San Diego, CA, USA). Data were expressed as mean ± SD, with p < 0.05 considered statistically significant. To implement the 2−ΔΔCt method, the average ΔCt values from dysplastic nevus samples served as a calibrator for calculating the relative fold gene expression of all samples relative to dysplastic nevus.

2.10. Transcriptomics

Differential expression of the LOXL3, NES, and SNAI1 genes between melanoma and normal skin samples, as well as survival analysis based on their expression status, was performed using the standard processing pipeline of the publically available database Gene Expression Profiling Interactive Analysis 2 (GEPIA2, http://gepia2.cancer-pku.cn/, accessed on 15 June 2024) [36]. The data sources for the analyses performed in GEPIA2 were the TCGA Skin Cutaneous Melanoma (SKCM) and GTEx Skin datasets. The Subtype Filter function was used to separately analyze TCGA SKCM samples with (N = 147) and without (N = 165) confirmed BRAF mutations. Differential expression analysis was performed using one-way ANOVA with cutoff values |log2FC| ≥ 1 and p < 0.01. Overall survival analysis based on the expression of the analyzed genes was performed between the lowest and highest 50% for each gene using the Log-rank test with significance set at p < 0.05. The box-plots for differential expression and Kaplan–Meier curves of overall survival were constructed in GEPIA2.

3. Results

Morphological differences between dysplastic nevi, melanoma in situ, and BRAF− and BRAF+ melanoma were observed in H&E slides. Using immunofluorescence, LOXL3, NES, and SNAI1 expression was evaluated with different expression patterns and intensity. Quantitative cell evaluation of LOXL3, NES, and SNAI1 immunoreactivity in dysplastic nevi, melanoma in situ, and BRAF− and BRAF+ melanoma was performed by determining the section percentage area of the epidermal region. The results were presented as the percentage of the area showing a positive signal.vRT-qPCR analysis of FFPE skin biopsies was performed on the same specimens to determine the fold gene expression score of observed mRNAs between dysplastic nevi, melanoma in situ, and BRAF− and BRAF+ melanoma. The LOXL3, NES, and SNAI1 in high and low expressions in the TCGA SKCM study were analyzed for the survival rate and the average survival time.

3.1. H&E Staining of Dysplastic Nevus, Melanoma In Situ, and BRAF− and BRAF+ Melanoma

Histological examination of dysplastic nevi revealed architectural disorder and cytologic atypia. Architectural disorder included the presence of junctional shoulders adjacent to a dermal component, bridging of nests between adjacent elongated rete ridges, suprabasal scatter of melanocytes confined to the lower epidermal levels, concentric and lamellar fibroplasia around elongated rete ridges, and a patchy lymphocytic infiltrate. Cytologic atypia was characterized by enlargement of nuclei with varying degrees of irregularity, chromatin clumping and hyperchromatism, and variably prominent nucleoli.
Similar atypical characteristics were also seen in melanoma in situ and invasive melanomas. However, these were accompanied by either high-level and/or extensive pagetoid scatter or extensive continuous basal proliferation of atypical melanocytes, more severe and more uniform cytologic atypia, mitotic activity, and in cases of invasive melanoma, failure of maturation of the dermal component (Figure 1).

3.2. LOXL3 Expression

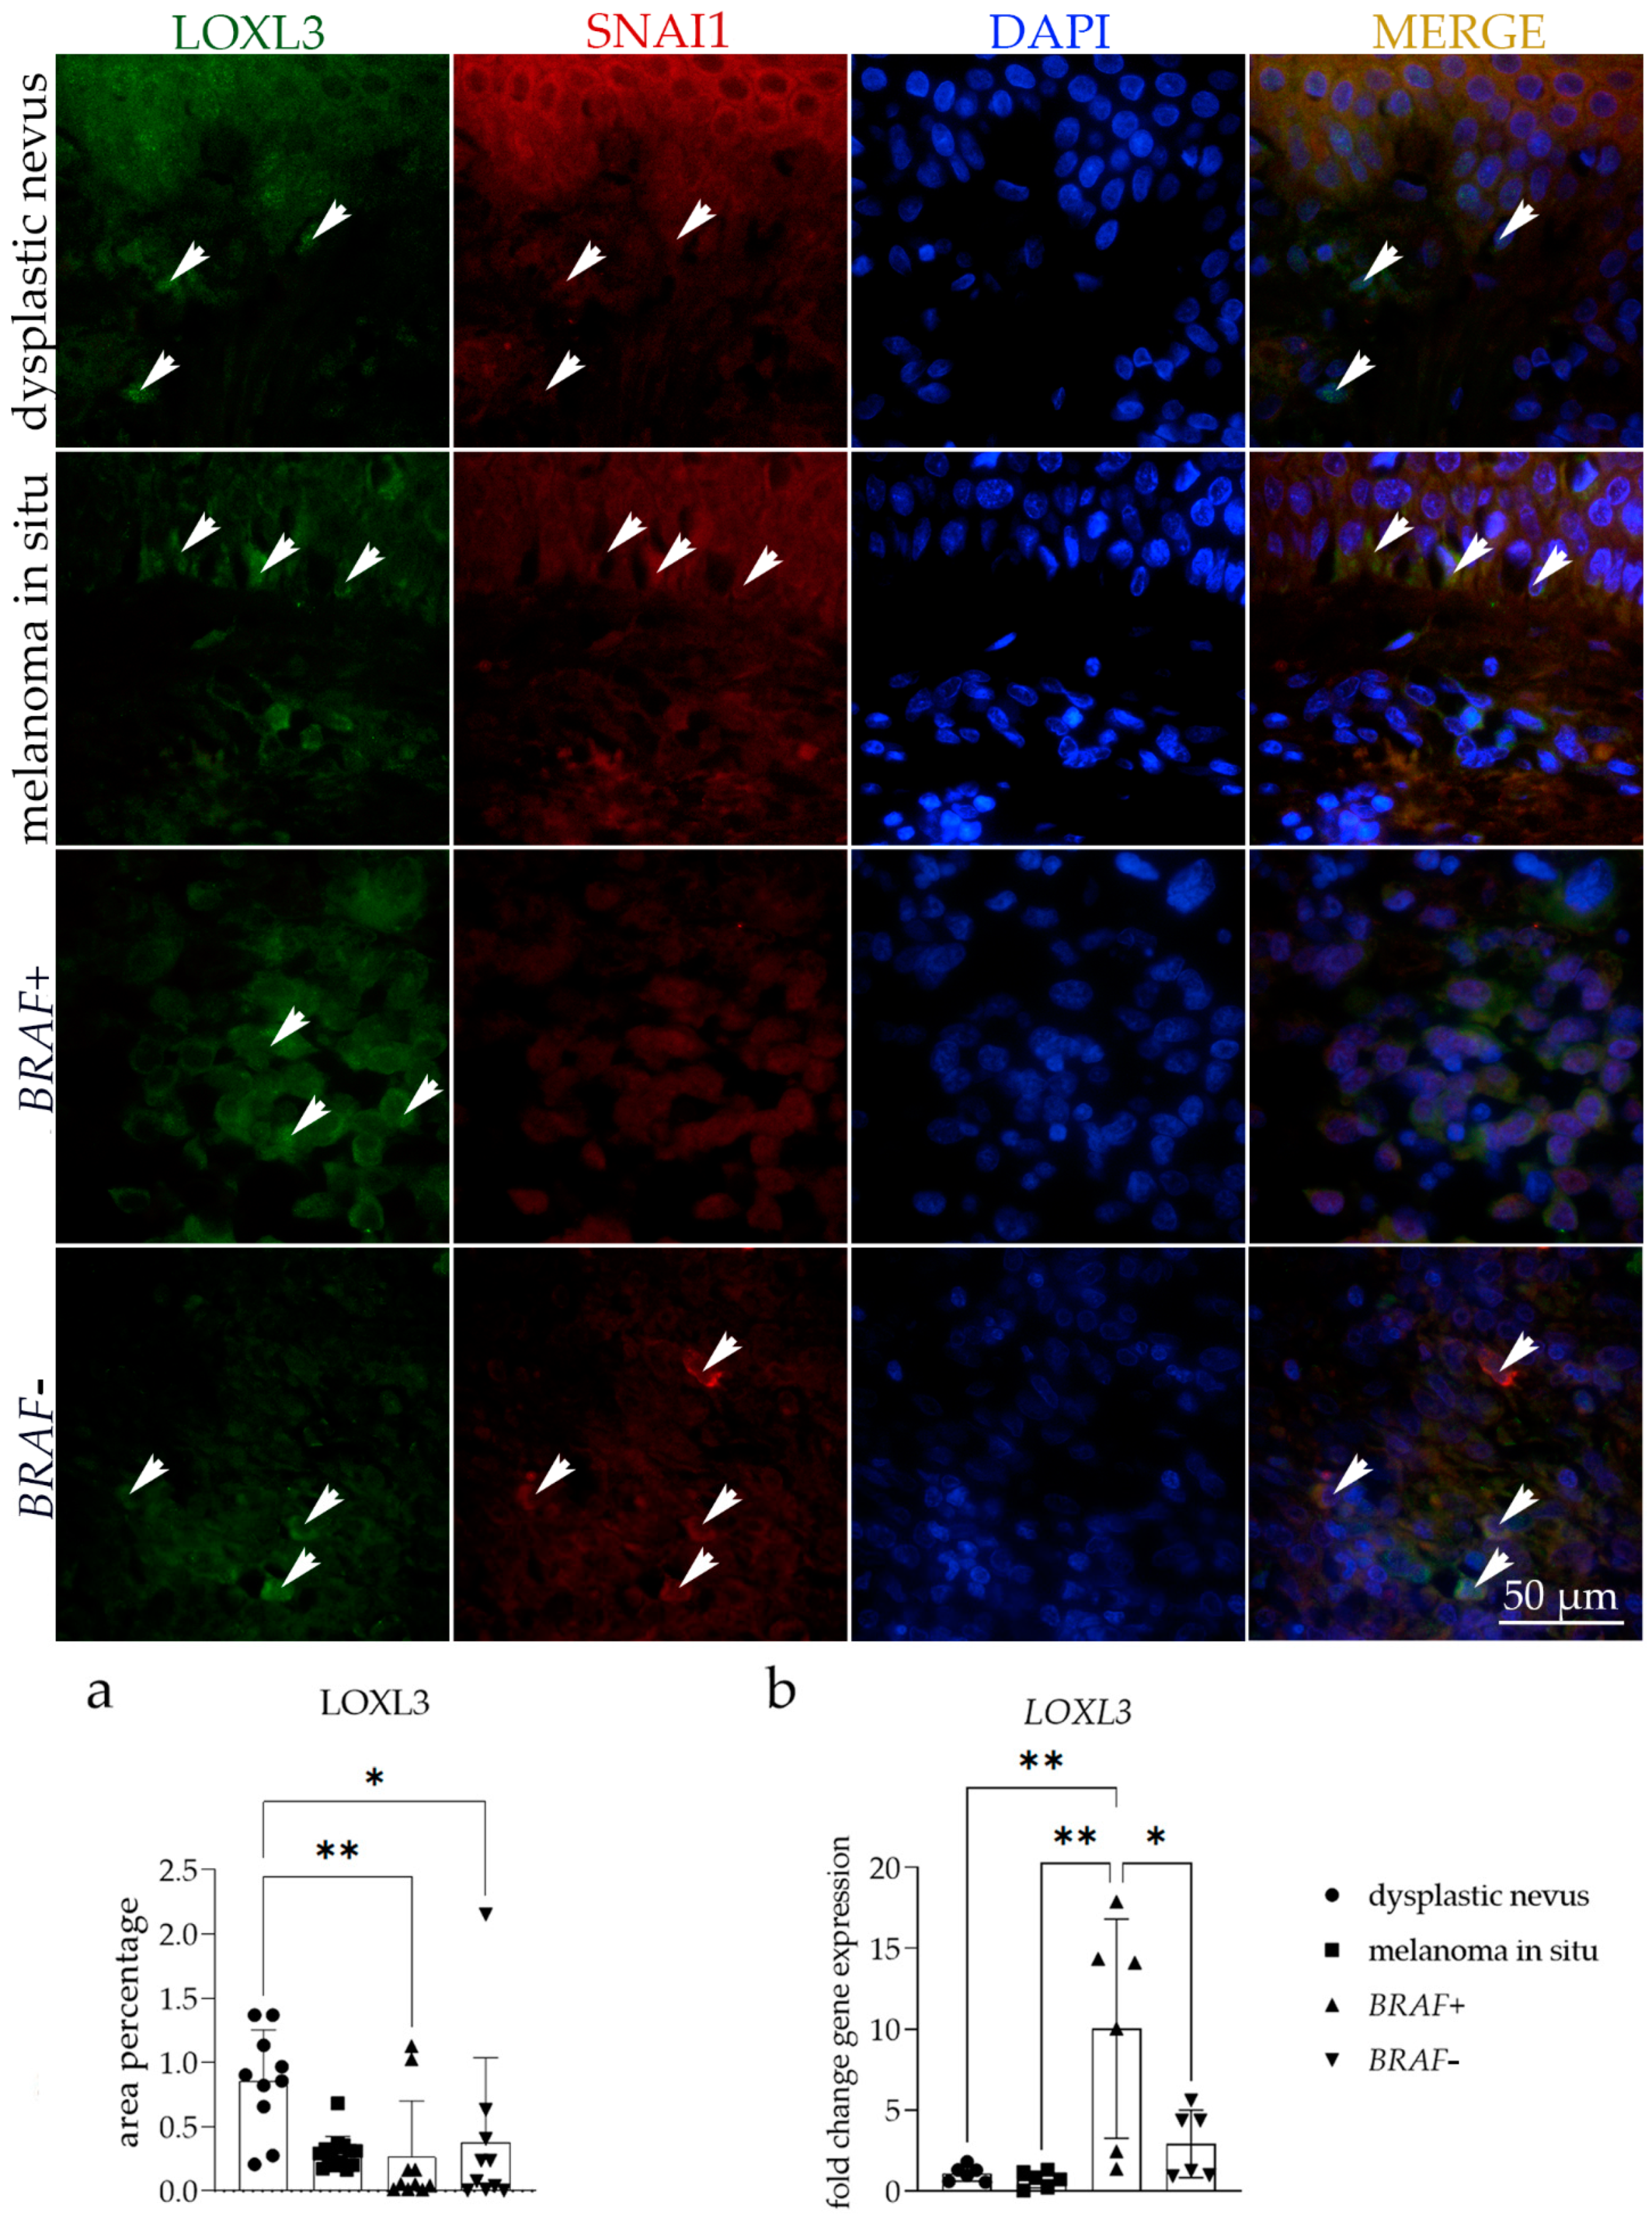
The immunohistochemical staining pattern of LOXL3 ranged from negative to punctate nuclear and cytoplasmic staining in all tissue samples examined (Table 3). The LOXL3 staining signal was widely distributed in all layers of the epidermis, in the cells of the dysplastic nevus nests, and in the tumor cells in the basal layer of the epidermis of melanoma in situ samples (Figure 2). Compared to other observed groups, the strongest immunoreactivity was noticed in the epithelium of BRAF+ and BRAF− melanoma samples (Table 3).
Co-expression of LOXL3 and SNAI1 was noticed sporadically in the perinuclear area of all observed phenotypes.
The area percentage of LOXL3 was significantly higher in dysplastic nevus compared to BRAF+ (p = 0.0061) and BRAF− melanoma (p = 0.0270) (Figure 2a). The RT-qPCR analysis demonstrated a significantly higher LOXL3 fold change gene expression in the BRAF+ melanoma than in the BRAF− melanoma (p = 0.0214), dysplastic nevus (p = 0.0035), and melanoma in situ (p = 0.0024) (Figure 2b).

3.3. NES Expression

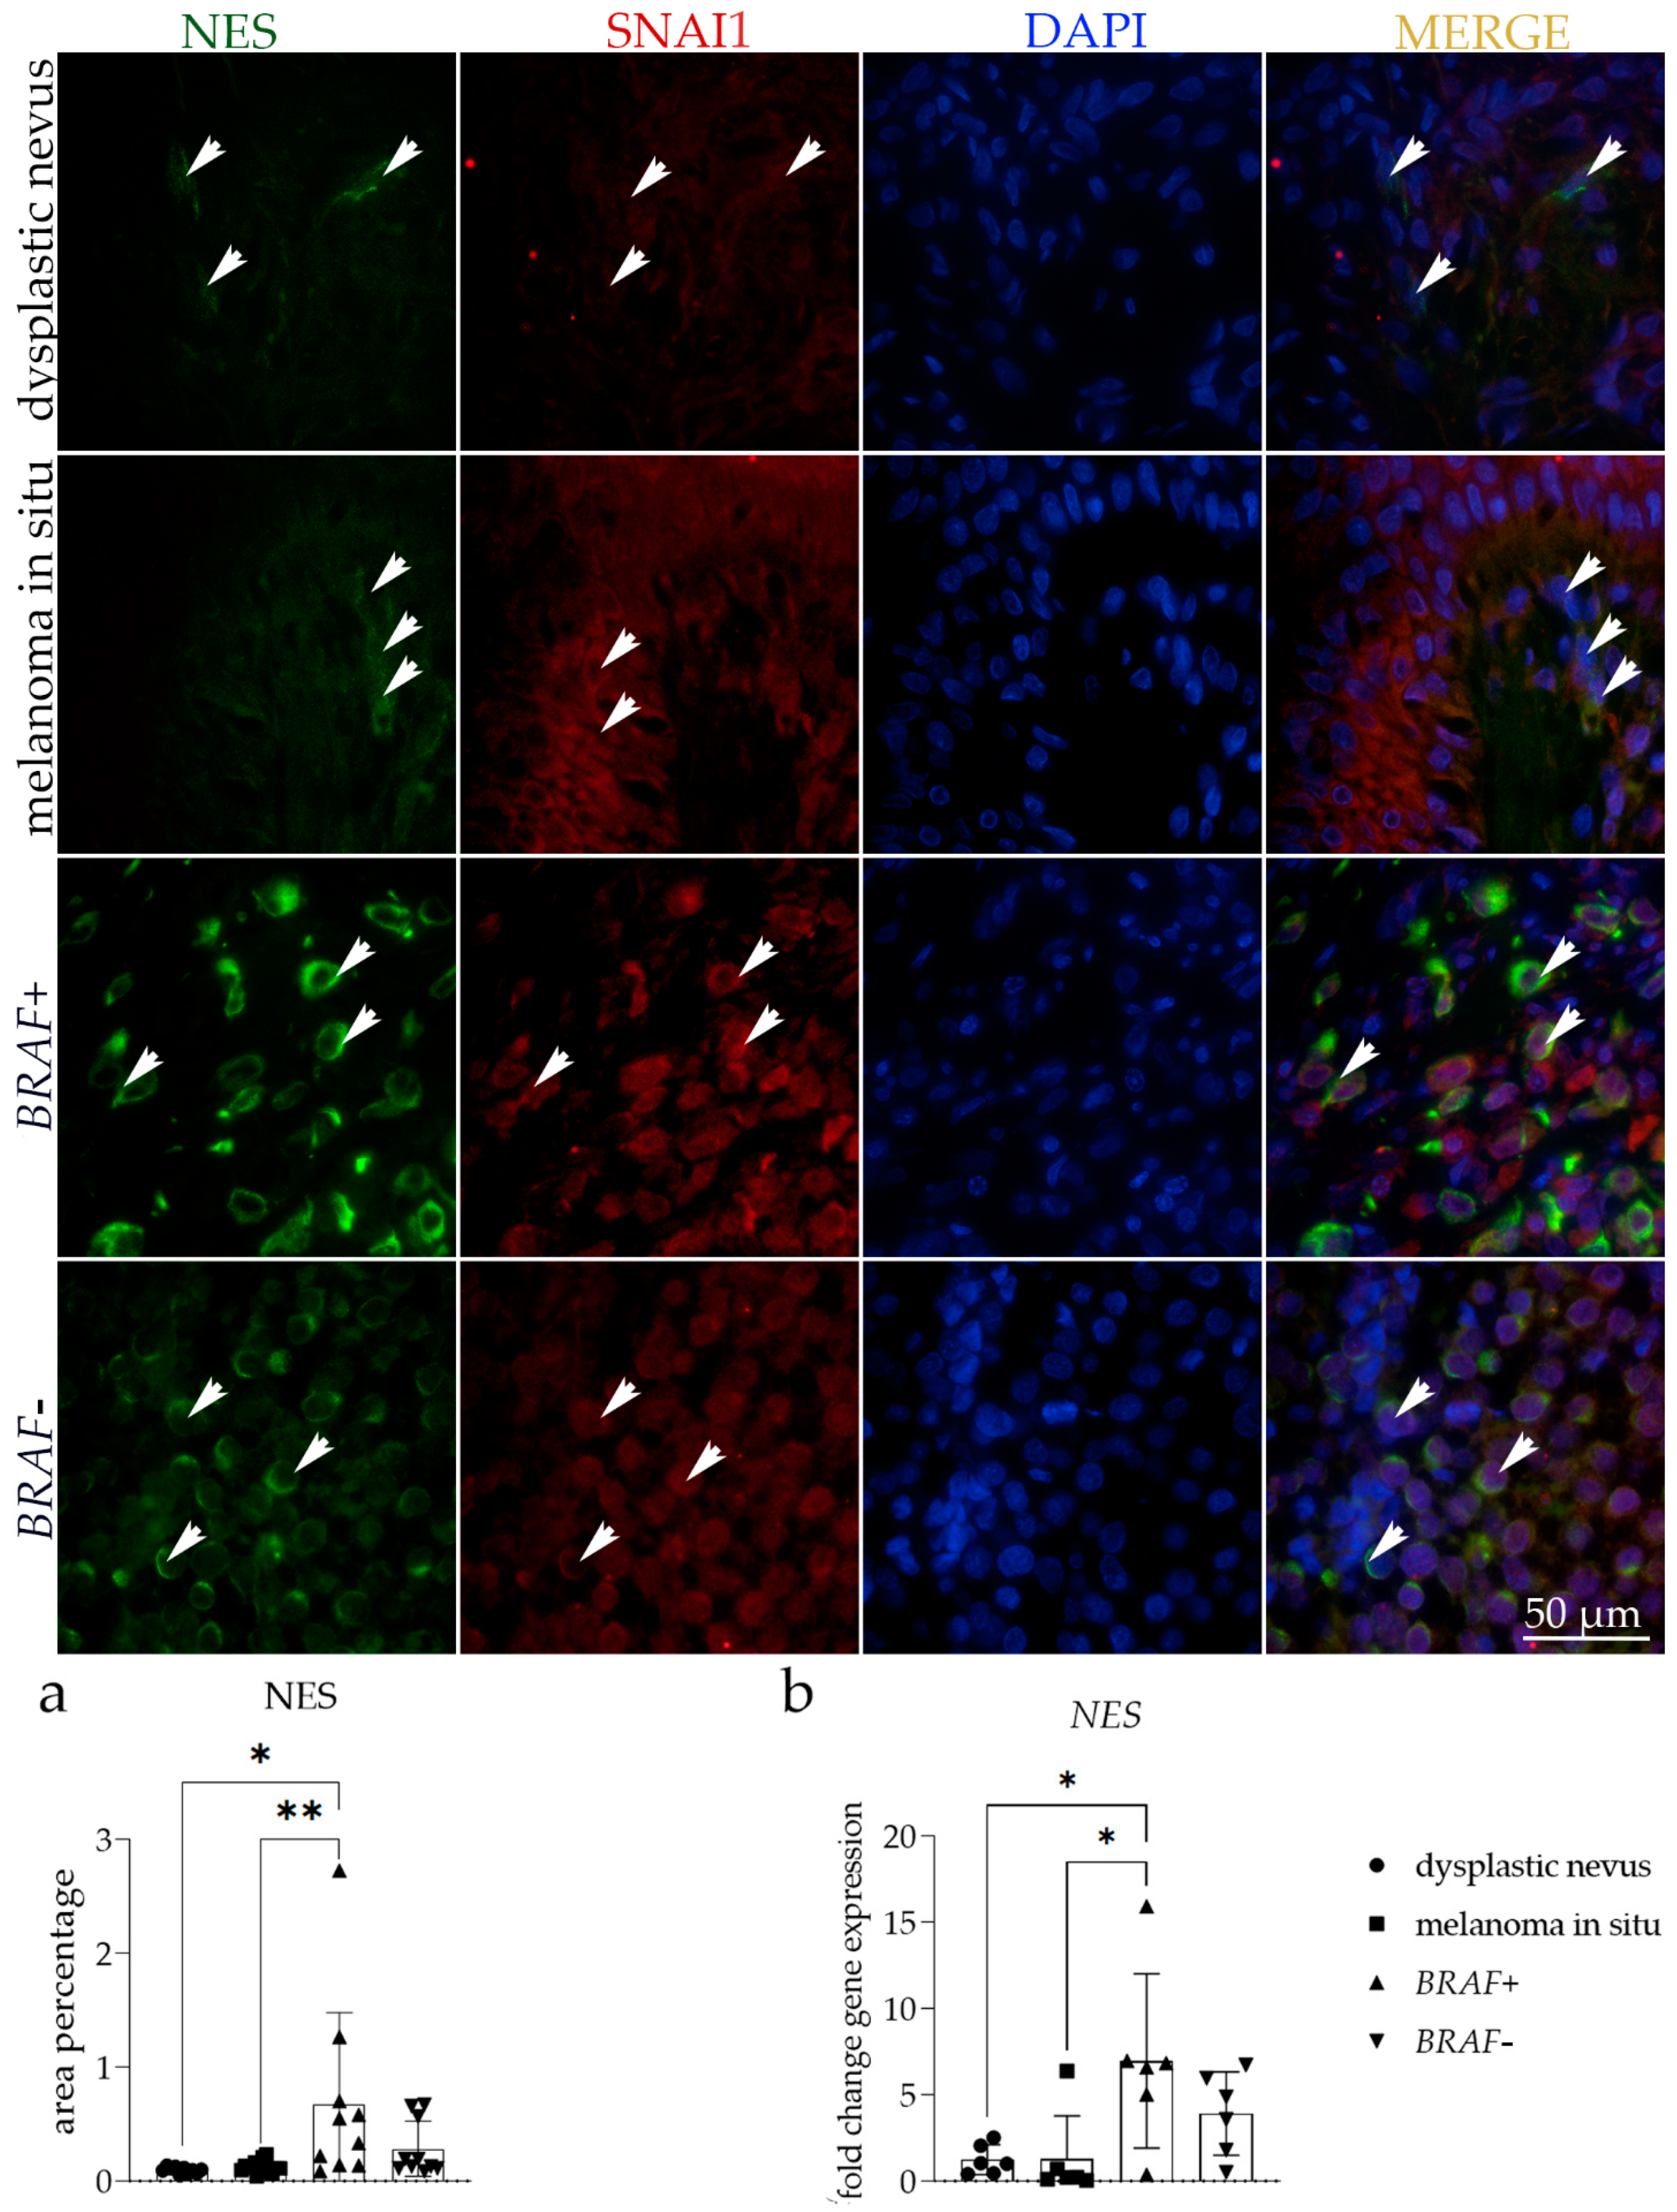
Nestin staining was noticed as mild diffuse staining appearing sporadically in tumor cells of irregular nests of dysplastic nevus and melanoma in situ. In BRAF+ melanoma, however, strong diffuse cytoplasmic staining was noticed (Figure 3). Compared to other observed groups, the strongest immunoreactivity was seen in the epithelium of BRAF+ melanoma and moderate in the BRAF− melanoma samples (Table 3).
Nestin and SNAI1 were co-expressed in the melanoma cells (Figure 3).
The area percentage and the RT-qPCR analysis demonstrated similar results for all observed groups. The BRAF+ melanoma showed a substantially higher NES area percentage compared to dysplastic nevus (p = 0.0201) and melanoma in situ (p = 0.0160) (Figure 3a).
When we compared the NES mRNA fold change gene expression in all tissues examined, we detected a significantly higher expression score in BRAF+ melanoma than in dysplastic nevus (p = 0.0357) and melanoma in situ (p = 0.0367) (Figure 3b).

3.4. SNAI1 Expression

SNAI1 staining patterns demonstrated punctate nuclear and cytoplasmic staining in all tissue samples examined (Figure 2 and Figure 3). Semi-quantitative analysis demonstrated the moderate immunoreactivity in the epithelium of BRAF+ and BRAF− melanoma samples, compared to other observed sample groups (Table 3).
The area percentage of SNAI1-positive cells showed a significantly higher area percentage score in BRAF+ and BRAF− melanoma samples than in dysplastic nevus (p < 0.01) and melanoma in situ samples (p < 0.0001) (Figure 4a).
The RT-qPCR analysis demonstrated the expression of SNAI1 mRNA in all tissues tested, with no significant difference in the fold change gene expression comparing the tissues examined. The highest SNAI1 mRNA expression was observed in BRAF+ and BRAF− melanoma (Figure 4b).

3.5. Differential Expression

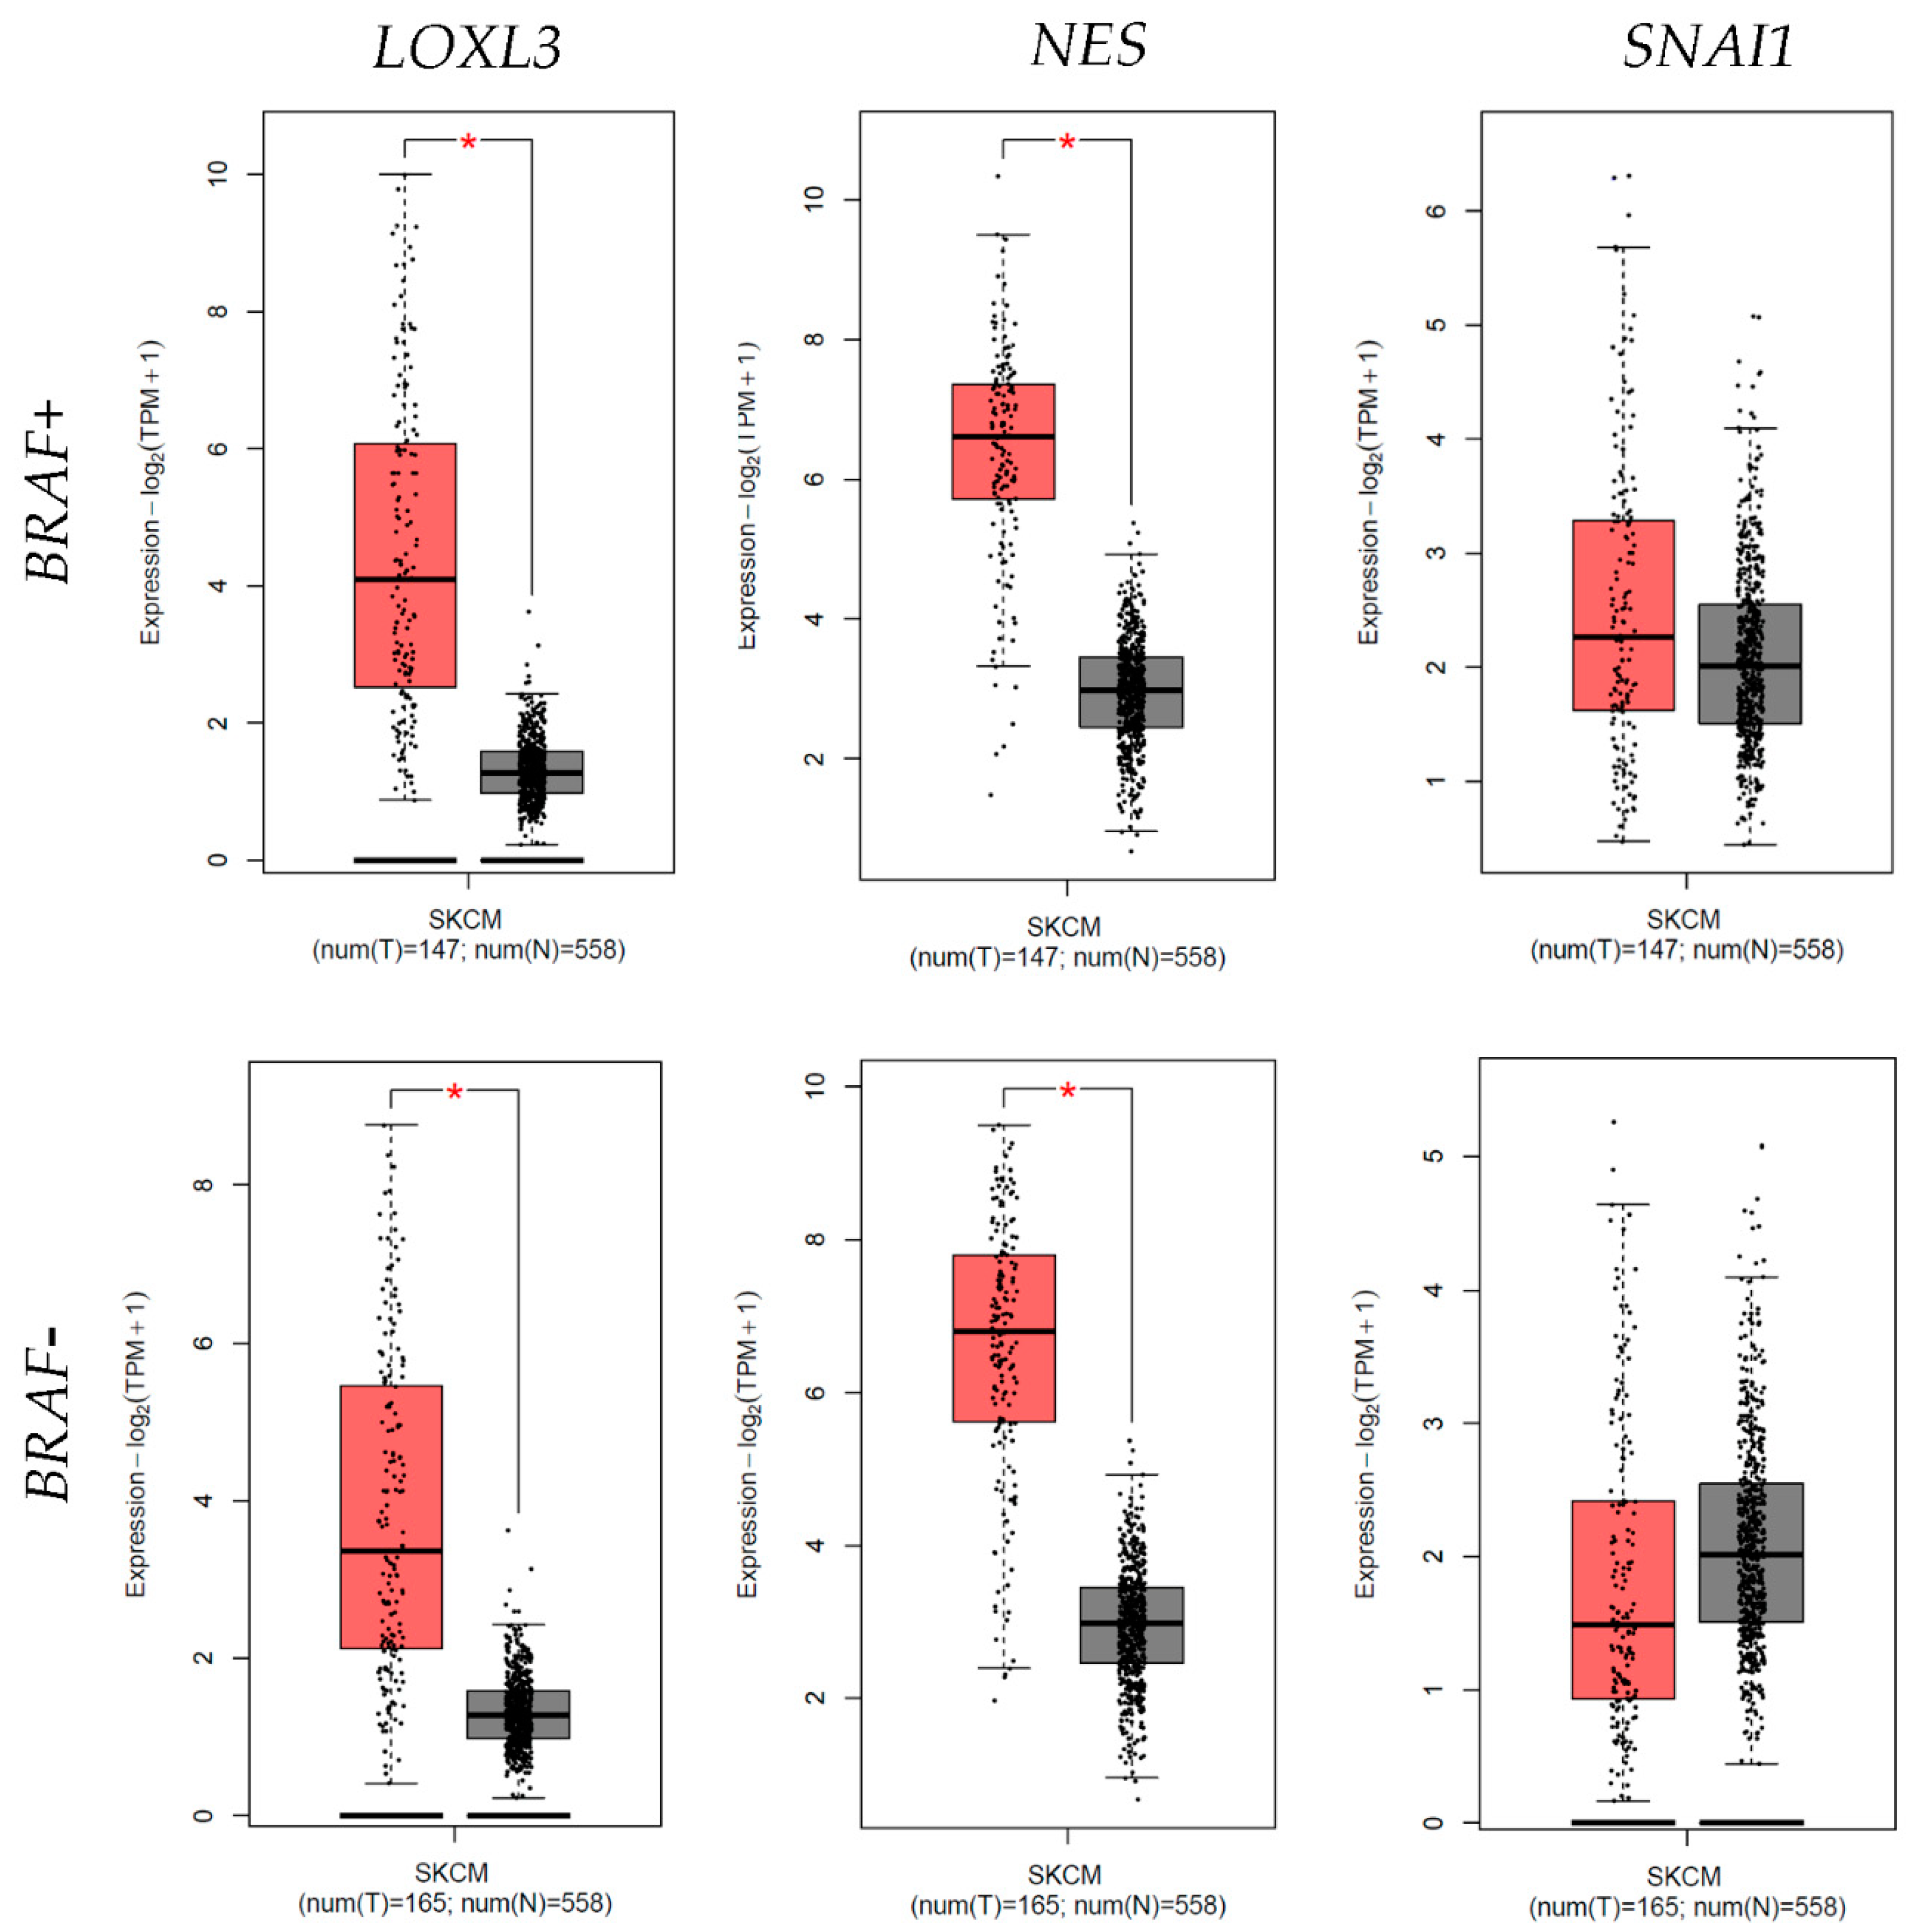
The differential expression analyses perfomed using GEPIA2 revealed a significantly higher mRNA expression level for LOXL3 and NES in cutaneous melanomas, both with and without confirmed BRAF mutations, compared to normal skin samples. There were no significant differences in SNAI1 mRNA expression between melanoma samples and normal skin, regardless of the BRAF status (Figure 5).

3.6. Survival Analysis

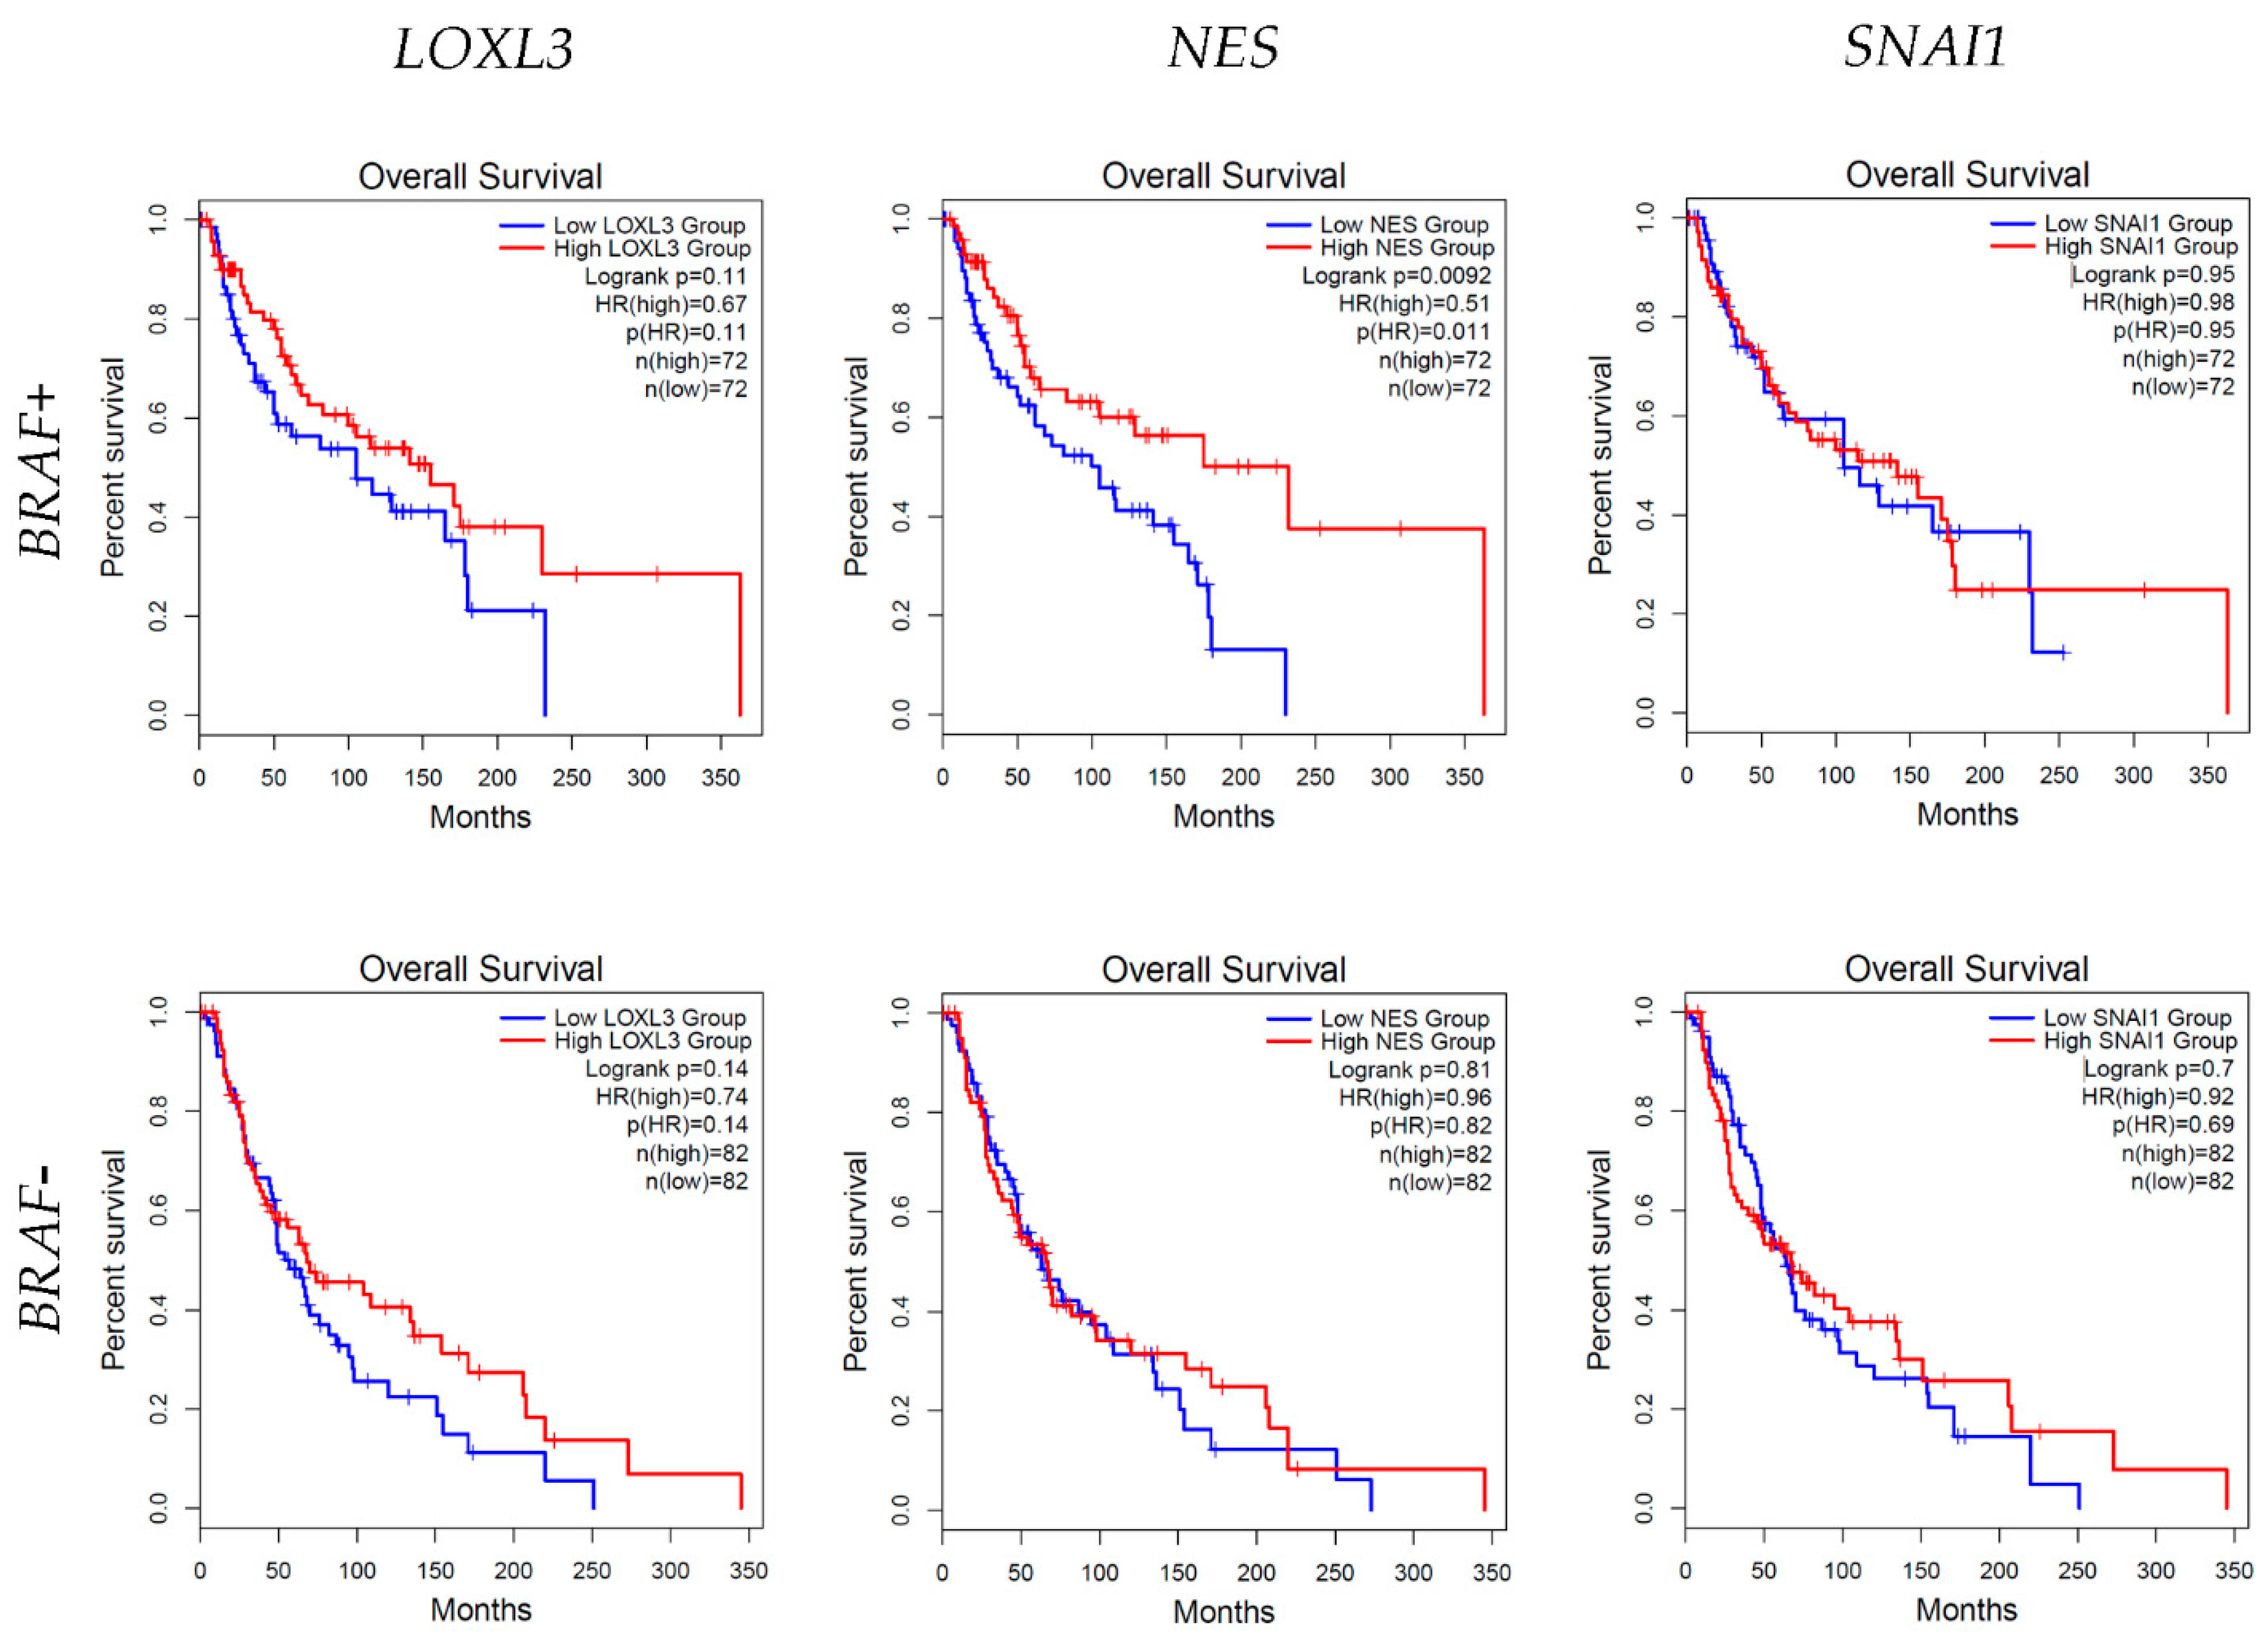
The survival rates in relation to the high and low mRNA expressions of LOXL3, NES, and SNAI1 in both BRAF-positive (BRAF+) and BRAF-negative (BRAF−) melanoma were analyzed (Figure 6).
In BRAF+ melanoma, there was no significant difference in the survival times between the high- and low-expression groups of LOXL3 and SNAI1. However, a statistically significant difference (p = 0.0092) in survival times was found between the high- and low-NES-expression groups (Figure 6).
In contrast, for BRAF− melanoma, no statistically significant differences were observed in survival times between the high- and low-expression groups of LOXL3, NES, and SNAI1 (p = 0.14, p = 0.81, and p = 0.07, respectively) (Figure 6).

4. Discussion

With the growing incidence of melanoma, an increased number of therapeutic options, and the potential to target specific proteins, understanding tumorigenesis has never been more important. Upon reviewing the literature, it becomes apparent that certain markers, such as LOXL3, SNAI1, and NES, are associated with melanoma development. However, their specific roles, as well as the expression and co-expression of these markers in different melanoma groups and dysplastic nevi as melanoma precursors, have not been thoroughly examined.
Our study, using two experimental methods, immunofluorescence and qPCR analysis, reports on the aberrant LOXL3, SNAI1, and NES expression and their co-expression in dysplastic nevi, melanoma in situ, and BRAF+ and BRAF– melanoma. The same techniques in analyzing Loxl3 influence on melanoma progression and dissemination were used in a recent study by Vázquez-Naharro on animal models, and it showed that Loxl3 knockout and activation of Braf with concomitant inactivation of Pten reduced melanoma growth, while increasing latency and overall mice survival. Furthermore, in a melanoma cell lines study, Loxl3-silenced cells showed a marked decrease in Snai1 compared to the control. This finding was also confirmed on the protein level, indicating that Loxl3 might regulate Snai1 expression and activity [20], which is consistent with earlier studies showing that overexpression of Lox2 induces EMT via Snai1, implicating a similar role for LOXL3 [37]. NES was depicted as a reliable factor in prognosis melanoma metastasis, and a study demonstrated that reducing nestin expression decreases cell growth, migration, and invasion in human melanoma cells [21,38].
Our study demonstrated a substantial increase in the expression of the LOXL3 in BRAF−positive melanoma compared to BRAF−negative melanoma, dysplastic nevi, and melanoma in situ. This finding suggests that LOXL3 has a significant role in melanoma genesis from precursor lesions and in situ tumors to metastatic melanoma and corroborates findings from previous studies [20,39]. The association between the overexpression of LOXL3 and the transformation of immortalized human melanocytes carrying the BRAF V600E mutation into malignant cells was originally described in an in vitro experiment on melanoma cell lines [39]. Reports from a study on animal models also refer to the interaction of Loxl3 and oncogene Braf, one of the most common mutations found in human melanoma, to facilitate tumor development and progression [20]. The study of Zhang et al. discovered a significant association between the expression of LOXL3 and the growth and depth of invasion of primary melanoma. Furthermore, they observed that patients with higher LOXL3 expression had a poorer prognosis [40]. This finding does not align with our hypothesis, since we found higher LOXL3 expression in dysplastic nevi compared to all investigated melanoma subtypes. One of the possible explanations is that this could be due to the fact that our study used dysplastic nevi, which are considered to be precursors of melanoma, instead of healthy skin as the reference point [5,15].
The highest NES expression in our study was noticed in BRAF+ melanoma, compared to dysplastic nevi and melanoma in situ, while there were no significant differences between the BRAF− group and others. Concerning the mRNA expression, NES was expressed significantly higher in BRAF+ melanoma than in dysplastic nevus and melanoma in situ. These results align with previous studies’ findings and suggest that this marker plays a significant role in advancing malignancies, with NES expression increasing during each step of proposed tumor development [21,25,26].
Furthermore, metastases tend to have higher levels of NES than primary tumors [21,26]. To the best of our knowledge, our study is the first to investigate the expression of these markers in dysplastic nevi. In the future, it would be interesting to see if there is a difference in nestin expression among benign nevi and dysplastic ones.
We also investigated SNAI1 expression among dysplastic nevi and melanoma subgroups and revealed higher SNAI1 expression in BRAF+ and BRAF– melanoma samples than in dysplastic nevi and melanoma in situ. This finding is in line with previous research investigating the influence of SNAI1 overexpression on human melanoma cell lines in hypoxic conditions, which revealed that elevated SNAI1 expression leads to the acquisition of cancer stem cell-like characteristics and an enhanced ability to metastasize [41]. Additionally, we have demonstrated the expression of SNAI1 mRNA in all tissues tested. The expression trend was similar and followed the immunohistochemistry results: the highest SNAI1 mRNA expression was observed in BRAF+ and BRAF– melanomas, supporting the role of SNAI1 as a potent epithelial repressor that cancer cells activate to detach from neighboring cells [20,42]. However, we found no significant difference when comparing investigated groups. It is plausible that the mRNA detected by PCR is not efficiently translated into protein or that the resulting protein undergoes post-translational modifications, degradation, or changes in localization that render it less detectable by IHC. Conversely, proteins identified through IHC may exhibit longer half-lives, resulting in sustained detectability even when corresponding mRNA levels are reduced [43]. Additionally, the limited sample size may contribute to variability in the results, potentially amplifying discrepancies between the two methods.
Furthermore, we compared the RT-qPCR results of the observed genes from our samples with the mRNA expression data found in the TCGA melanoma database. When analyzing differential expression using GEPIA2, we have found a significantly higher expression for LOXL3 and NES in cutaneous metastatic melanoma, both in BRAF+ and BRAF– tumors, compared to normal skin samples. Although statistical validation of our findings would require analyses of larger sample cohorts, the data from our samples suggest significantly higher LOXL3 fold change gene expression in BRAF+ melanoma than in BRAF– melanoma, dysplastic nevi, and melanoma in situ. As for NES, we found higher expression in BRAF+ melanoma than in BRAF− melanoma and significantly higher expression than in dysplastic nevus and melanoma in situ, emphasizing the significance of NES in melanoma progression. However, our analysis of differential expression on the data from the TCGA melanoma study showed no differences in SNAI1 expression between melanoma samples and normal skin, regardless of BRAF status. We have also not observed any significant differences in SNAI1 expression between the investigated groups of our samples. Results showed the highest SNAI1 mRNA expression in metastatic melanoma, regardless of BRAF status. The fact that the mRNA expression analyses of all three genes from our limited number of samples correspond to those from the much larger TCGA melanoma database indicates that our samples are relatively representative.
The major point of our interest was to explore the co-expression of LOXL3, SNAI1, and NES in melanoma development and their supposed role in EMT. During our search of available literature, no previous studies reported on or investigated the co-expression of these markers, although they were all implicated in the same process of EMT, which is an important milestone of tumor progression. We have found co-expression of LOXL3 and SNAI1 in the perinuclear area of all investigated subgroups, and we have also found NES and SNAI1 co-expression in melanoma cells. These findings, combined with previous knowledge that LOXL3 and SNAI1 facilitate detachment and migration of cells from primary melanoma [20,42], while NES enhances cell motility and structural reorganization [44,45], suggest some level of codependence or collaboration between these markers in melanoma EMT. These results should be investigated further as potential future therapeutic interventions, as we can hypothesize that blocking the cascade that leads to EMT could significantly affect survival in many melanoma patients.
Analysis of the influence of LOXL3, NES, and SNAI1 expression data from the TCGA melanoma database on the survival rates in patients discovered that in the group of BRAF+ melanoma patients, there was no significant difference in survival times between the high- and low-expression groups of LOXL3 and SNAI1. However, there was a statistically significant difference in survival rates between high- and low-NES-expression groups, favoring high NES expression and longer survival. This finding is opposite to the previous studies where NES was significantly increased in melanomas than in melanocytic nevi [46], and it correlated with more advanced stages of the disease, metastatic potential, and poor survival rates [47,48]. However, these studies analyzed the protein expression, not the mRNA expression. As for survival analysis among BRAF− melanoma patients, no statistically significant differences were observed in survival times between the high- and low-expression groups of LOXL3, NES, and SNAI1.

5. Conclusions

Our study, although limited because of the small size of our cohort, provides evidence that the expressions of the investigated markers LOXL3, NES, and SNAI1 change with the progression of melanoma. These markers are also co-expressed in melanoma cells. Blocking these specific markers may have an impact on the progression of melanoma and potentially affect the prognosis of many melanoma patients in the future. However, additional studies are needed to further our understanding of these markers’ exact roles and interactions in melanoma.

Author Contributions

Conceptualization, N.K., M.S.-B. and K.V.; Data curation, Z.Š.Č., M.V. and T.Č.; Formal analysis, M.O. and M.S.-B.; Funding acquisition, M.S.-B. and K.V.; Investigation, Z.Š.Č., N.K., M.V. and N.F.; Methodology, Z.Š.Č., A.R., M.V., T.Č. and N.F.; Project administration, Z.Š.Č., A.R., M.V. and T.Č.; Resources, A.R. and N.F.; Software, M.O. and A.R.; Supervision, N.K., M.O., M.V., T.Č., N.F., M.S.-B. and K.V.; Validation, N.K., T.Č., M.S.-B. and K.V.; Visualization, N.K.; Writing—original draft, Z.Š.Č. and N.K.; Writing—review and editing, M.O., A.R., M.V., T.Č., N.F., M.S.-B. and K.V. All authors have read and agreed to the published version of the manuscript.

Funding

This work was supported by the Croatian Science Foundation (grant no. IP-2022-10-8720).

Institutional Review Board Statement

This study was conducted according to the guidelines of the Declaration of Helsinki. Ethical approval was given by the Ethics Committee of University Hospital Center Split (class: 520-03/24-01/95, approval number: 2181-147/01-06/LJ.Z.24-02, date: 29 April 2024).

Informed Consent Statement

Written informed consent has been obtained from the patients to publish this paper.

Data Availability Statement

All data and materials are available upon request. Data regarding the expression of LOXL3, NES, and SNAI1 in TCGA Melanoma (SKCM) study can be found at the publicly available websites https://www.genome.gov/Funded-Programs-Projects/Cancer-Genome-Atlas (accessed on 4 June 2024) and https://gtexportal.org/home/ (accessed on 4 June 2024), which contain databases for gene expression in cancers.

Conflicts of Interest

The authors declare no conflicts of interest. The funders had no role in the study’s design; in the collection, analyses, or interpretation of data; in the writing of the manuscript, or in the decision to publish the results.

References

  1. Heistein, J.B.; Acharya, U.; Mukkamalla, S.K.R. Malignant Melanoma. In StatPearls [Internet]; StatPearls Publishing: Treasure Island, FL, USA, 2024. [Google Scholar]
  2. Geller, A.C.; Clapp, R.W.; Sober, A.J.; Gonsalves, L.; Mueller, L.; Christiansen, C.L.; Shaikh, W.; Miller, D.R. Melanoma Epidemic: An Analysis of Six Decades of Data From the Connecticut Tumor Registry. J. Clin. Oncol. 2013, 31, 4172–4178. [Google Scholar] [CrossRef]
  3. Garbe, C.; Amaral, T.; Peris, K.; Hauschild, A.; Arenberger, P.; Basset-Seguin, N.; Bastholt, L.; Bataille, V.; del Marmol, V.; Dréno, B.; et al. European consensus-based interdisciplinary guideline for melanoma. Part 1: Diagnostics: Update 2022. Eur. J. Cancer 2022, 170, 236–255. [Google Scholar] [CrossRef]
  4. Rastrelli, M.; Tropea, S.; Rossi, C.R.; Alaibac, M. Melanoma: Epidemiology, risk factors, pathogenesis, diagnosis and classification. In Vivo 2014, 28, 1005–1011. [Google Scholar] [PubMed]
  5. Shain, A.H.; Yeh, I.; Kovalyshyn, I.; Sriharan, A.; Talevich, E.; Gagnon, A.; Dummer, R.; North, J.P.; Pincus, L.B.; Ruben, B.S.; et al. The Genetic Evolution of Melanoma from Precursor Lesions. N. Engl. J. Med. 2015, 373, 1926–1936. [Google Scholar] [CrossRef] [PubMed]
  6. Paluncic, J.; Kovacevic, Z.; Jansson, P.J.; Kalinowski, D.; Merlot, A.M.; Huang, M.L.-H.; Lok, H.C.; Sahni, S.; Lane, D.J.; Richardson, D.R. Roads to melanoma: Key pathways and emerging players in melanoma progression and oncogenic signaling. Biochim. Biophys. Acta (BBA) Mol. Cell Res. 2016, 1863, 770–784. [Google Scholar] [CrossRef] [PubMed]
  7. Elder, D.E.; Bastian, B.C.; Cree, I.A.; Massi, D.; Scolyer, R.A. The 2018 World Health Organization Classification of Cutaneous, Mucosal, and Uveal Melanoma: Detailed Analysis of 9 Distinct Subtypes Defined by Their Evolutionary Pathway. Arch. Pathol. Lab. Med. 2020, 144, 500–522. [Google Scholar] [CrossRef]
  8. Bastian, B.C. The Molecular Pathology of Melanoma: An Integrated Taxonomy of Melanocytic Neoplasia. Annu. Rev. Pathol. Mech. Dis. 2014, 9, 239–271. [Google Scholar] [CrossRef]
  9. Ostrowski, S.M.; Fisher, D.E. Biology of Melanoma. Hematol. Oncol. Clin. N. Am. 2021, 35, 29–56. [Google Scholar] [CrossRef]
  10. Satyamoorthy, K.; Li, G.; Gerrero, M.R.; Brose, M.S.; Volpe, P.; Weber, B.L.; Van Belle, P.; E Elder, D.; Herlyn, M. Constitutive mitogen-activated protein kinase activation in melanoma is mediated by both BRAF mutations and autocrine growth factor stimulation. Cancer Res. 2003, 63, 756–759. [Google Scholar]
  11. Jansen, P.; Cosgarea, I.; Murali, R.; Möller, I.; Sucker, A.; Franklin, C.; Paschen, A.; Zaremba, A.; Brinker, T.J.; Stoffels, I.; et al. Frequent Occurrence of NRAS and BRAF Mutations in Human Acral Naevi. Cancers 2019, 11, 546. [Google Scholar] [CrossRef]
  12. Davies, H.; Bignell, G.R.; Cox, C.; Stephens, P.; Edkins, S.; Clegg, S.; Teague, J.; Woffendin, H.; Garnett, M.J.; Bottomley, W.; et al. Mutations of the BRAF gene in human cancer. Nature 2002, 417, 949–954. [Google Scholar] [CrossRef] [PubMed]
  13. Cherepakhin, O.S.; Argenyi, Z.B.; Moshiri, A.S. Genomic and Transcriptomic Underpinnings of Melanoma Genesis, Progression, and Metastasis. Cancers 2021, 14, 123. [Google Scholar] [CrossRef]
  14. Genomic Classification of Cutaneous Melanoma. Cell 2015, 161, 1681–1696. [CrossRef] [PubMed]
  15. Tsao, H.; Bevona, C.; Goggins, W.; Quinn, T. The transformation rate of moles (melanocytic nevi) into cutaneous melanoma: A population-based estimate. Arch. Dermatol. 2003, 139, 282–288. [Google Scholar] [CrossRef]
  16. Wu, Y.; Zhou, B.P. Snail: More than EMT. Cell Adhes. Migr. 2010, 4, 199–203. [Google Scholar] [CrossRef] [PubMed]
  17. Barker, H.E.; Cox, T.R.; Erler, J.T. The rationale for targeting the LOX family in cancer. Nat. Rev. Cancer 2012, 12, 540–552. [Google Scholar] [CrossRef] [PubMed]
  18. Molnar, J.; Fong, K.; He, Q.; Hayashi, K.; Kim, Y.; Fong, S.; Fogelgren, B.; Szauter, K.M.; Mink, M.; Csiszar, K. Structural and functional diversity of lysyl oxidase and the LOX-like proteins. Biochim. Biophys. Acta (BBA) Proteins Proteom. 2003, 1647, 220–224. [Google Scholar] [CrossRef]
  19. Trackman, P.C. Lysyl Oxidase Isoforms and Potential Therapeutic Opportunities for Fibrosis and Cancer. Expert Opin. Ther. Targets 2016, 20, 935–945. [Google Scholar] [CrossRef]
  20. Vázquez-Naharro, A.; Bustos-Tauler, J.; Floristán, A.; Yuste, L.; Oltra, S.S.; Vinyals, A.; Moreno-Bueno, G.; Fabra, À.; Portillo, F.; Cano, A.; et al. Loxl3 Promotes Melanoma Progression and Dissemination Influencing Cell Plasticity and Survival. Cancers 2022, 14, 1200. [Google Scholar] [CrossRef]
  21. Akiyama, M.; Matsuda, Y.; Ishiwata, T.; Naito, Z.; Kawana, S. Inhibition of the Stem Cell Marker Nestin Reduces Tumor Growth and Invasion of Malignant Melanoma. J. Investig. Dermatol. 2013, 133, 1384–1387. [Google Scholar] [CrossRef]
  22. Gomes, C.B.; Zechin, K.G.; Xu, S.; Stelini, R.F.; Nishimoto, I.N.; Zhan, Q.; Xu, T.; Qin, G.; Treister, N.S.; Murphy, G.F.; et al. TET2 Negatively Regulates Nestin Expression in Human Melanoma. Am. J. Pathol. 2016, 186, 1427–1434. [Google Scholar] [CrossRef] [PubMed]
  23. Kuk, S.K.; Won, C.H.; Lee, W.J.; Shin, W.J.; Yoon, H.J.; Hong, S.D.; Hong, S.P.; Lee, J. Prognostic significance of nestin in primary malignant melanoma of the oral cavity. Melanoma Res. 2016, 26, 457–463. [Google Scholar] [CrossRef]
  24. Zhang, X.; Xing, C.; Guan, W.; Chen, L.; Guo, K.; Yu, A.; Xie, K. Clinicopathological and prognostic significance of nestin expression in patients with breast cancer: A systematic review and meta-analysis. Cancer Cell Int. 2020, 20, 169. [Google Scholar] [CrossRef] [PubMed]
  25. A Flørenes, V.; Holm, R.; Myklebost, O.; Lendahl, U.; Fodstad, O. Expression of the neuroectodermal intermediate filament nestin in human melanomas. Cancer Res. 1994, 54, 354–356. [Google Scholar] [PubMed]
  26. Klein, W.M.; Wu, B.P.; Zhao, S.; Wu, H.; Klein-Szanto, A.J.P.; Tahan, S.R. Increased expression of stem cell markers in malignant melanoma. Mod. Pathol. 2007, 20, 102–107. [Google Scholar] [CrossRef]
  27. Dissanayake, S.K.; Wade, M.; Johnson, C.E.; O’Connell, M.P.; Leotlela, P.D.; French, A.D.; Shah, K.V.; Hewitt, K.J.; Rosenthal, D.T.; Indig, F.E.; et al. The Wnt5A/Protein Kinase C Pathway Mediates Motility in Melanoma Cells via the Inhibition of Metastasis Suppressors and Initiation of an Epithelial to Mesenchymal Transition. J. Biol. Chem. 2007, 282, 17259–17271. [Google Scholar] [CrossRef]
  28. Moody, S.E.; Perez, D.; Pan, T.-C.; Sarkisian, C.J.; Portocarrero, C.P.; Notorfrancesco, K.L.; Cardiff, R.D.; Chodosh, L.A. The transcriptional repressor Snail promotes mammary tumor recurrence. Cancer Cell 2005, 8, 197–209. [Google Scholar] [CrossRef]
  29. Sugimachi, K.; Tanaka, S.; Kameyama, T.; Taguchi, K.-I.; Aishima, S.-I.; Shimada, M.; Sugimachi, K.; Tsuneyoshi, M. Transcriptional repressor snail and progression of human hepatocellular carcinoma. Clin. Cancer Res. 2003, 9, 2657–2664. [Google Scholar]
  30. Yang, Z.; Zhang, X.; Gang, H.; Li, X.; Li, Z.; Wang, T.; Han, J.; Luo, T.; Wen, F.; Wu, X. Up-regulation of gastric cancer cell invasion by Twist is accompanied by N-cadherin and fibronectin expression. Biochem. Biophys. Res. Commun. 2007, 358, 925–930. [Google Scholar] [CrossRef]
  31. Arumi-Planas, M.; Rodriguez-Baena, F.J.; Cabello-Torres, F.; Gracia, F.; Lopez-Blau, C.; Nieto, M.A.; Sanchez-Laorden, B. Microenvironmental Snail1-induced immunosuppression promotes melanoma growth. Oncogene 2023, 42, 2659–2672. [Google Scholar] [CrossRef]
  32. Williams, J. The Declaration of Helsinki and public health. Bull. World Health Organ. 2008, 86, 650–651. [Google Scholar] [CrossRef] [PubMed]
  33. Kelam, N.; Racetin, A.; Polović, M.; Benzon, B.; Ogorevc, M.; Vukojević, K.; Durdov, M.G.; Huljev, A.D.; Prusac, I.K.; Čarić, D.; et al. Aberrations in FGFR1, FGFR2, and RIP5 Expression in Human Congenital Anomalies of the Kidney and Urinary Tract (CAKUT). Int. J. Mol. Sci. 2022, 23, 15537. [Google Scholar] [CrossRef] [PubMed]
  34. Lozić, M.; Filipović, N.; Jurić, M.; Kosović, I.; Benzon, B.; Šolić, I.; Kelam, N.; Racetin, A.; Watanabe, K.; Katsuyama, Y.; et al. Alteration of Cx37, Cx40, Cx43, Cx45, Panx1, and Renin Expression Patterns in Postnatal Kidneys of Dab1-/- (yotari) Mice. Int. J. Mol. Sci. 2021, 22, 1284. [Google Scholar] [CrossRef]
  35. Paštar, V.; Lozić, M.; Kelam, N.; Filipović, N.; Bernard, B.; Katsuyama, Y.; Vukojević, K. Connexin Expression Is Altered in Liver Development of Yotari (dab1 -/-) Mice. Int. J. Mol. Sci. 2021, 22, 10712. [Google Scholar] [CrossRef] [PubMed]
  36. Tang, Z.; Kang, B.; Li, C.; Chen, T.; Zhang, Z. GEPIA2: An enhanced web server for large-scale expression profiling and interactive analysis. Nucleic Acids Res. 2019, 47, W556–W560. [Google Scholar] [CrossRef]
  37. Peinado, H.; Cruz, M.D.C.I.-D.L.; Olmeda, D.; Csiszar, K.; Fong, K.S.K.; Vega, S.; Nieto, M.A.; Cano, A.; Portillo, F. A molecular role for lysyl oxidase-like 2 enzyme in Snail regulation and tumor progression. EMBO J. 2005, 24, 3446–3458. [Google Scholar] [CrossRef] [PubMed]
  38. Yamamoto, Y.; Hayashi, Y.; Sakaki, H.; Murakami, I. Evaluation of Clinical and Immunohistochemical Factors Relating to Melanoma Metastasis: Potential Roles of Nestin and Fascin in Melanoma. Diagnostics 2022, 12, 219. [Google Scholar] [CrossRef]
  39. Santamaría, P.G.; Floristán, A.; Fontanals-Cirera, B.; Vázquez-Naharro, A.; Santos, V.; Morales, S.; Yuste, L.; Peinado, H.; García-Gómez, A.; Portillo, F.; et al. Lysyl oxidase-like 3 is required for melanoma cell survival by maintaining genomic stability. Cell Death Differ. 2017, 25, 935–950. [Google Scholar] [CrossRef]
  40. Zhang, X.; Su, M.-W.; Cheng, Y.; Martinka, M.; Wang, G.; Huang, Y.; Li, L.; Zhou, Y. Immunohistochemistry analysis reveals lysyl oxidase-like 3 as a novel prognostic marker for primary melanoma. Melanoma Res. 2021, 31, 173–177. [Google Scholar] [CrossRef]
  41. Liu, S.; Kumar, S.M.; Martin, J.S.; Yang, R.; Xu, X. Snail1 Mediates Hypoxia-Induced Melanoma Progression. Am. J. Pathol. 2011, 179, 3020–3031. [Google Scholar] [CrossRef]
  42. Cano, A.; Pérez-Moreno, M.A.; Rodrigo, I.; Locascio, A.; Blanco, M.J.; Del Barrio, M.G.; Portillo, F.; Nieto, M.A. The transcription factor Snail controls epithelial–mesenchymal transitions by repressing E-cadherin expression. Nat. Cell Biol. 2000, 2, 76–83. [Google Scholar] [CrossRef] [PubMed]
  43. Vogel, C.; Marcotte, E.M. Insights into the regulation of protein abundance from proteomic and transcriptomic analyses. Nat. Rev. Genet. 2012, 13, 227–232. [Google Scholar] [CrossRef] [PubMed]
  44. Kaufhold, S.; Bonavida, B. Central role of Snail1 in the regulation of EMT and resistance in cancer: A target for therapeutic intervention. J. Exp. Clin. Cancer Res. 2014, 33, 014–0062. [Google Scholar] [CrossRef] [PubMed]
  45. Tang, Y.; Durand, S.; Dalle, S.; Caramel, J. EMT-Inducing Transcription Factors, Drivers of Melanoma Phenotype Switching, and Resistance to Treatment. Cancers 2020, 12, 2154. [Google Scholar] [CrossRef]
  46. Brychtova, S.; Fiuraskova, M.; Hlobilková, A.; Brychta, T.; Hirnak, J. Nestin expression in cutaneous melanomas and melanocytic nevi. J. Cutan. Pathol. 2006, 34, 370–375. [Google Scholar] [CrossRef]
  47. Akiyama, M.; Matsuda, Y.; Ishiwata, T.; Naito, Z.; Kawana, S. Nestin is highly expressed in advanced-stage melanomas and neurotized nevi. Oncol. Rep. 2013, 29, 1595–1599. [Google Scholar] [CrossRef]
  48. Piras, F.; Perra, M.T.; Murtas, D.; Minerba, L.; Floris, C.; Maxia, C.; Demurtas, P.; Ugalde, J.; Ribatti, D.; Sirigu, P. The stem cell marker nestin predicts poor prognosis in human melanoma. Oncol. Rep. 2009, 23, 17–24. [Google Scholar] [CrossRef]
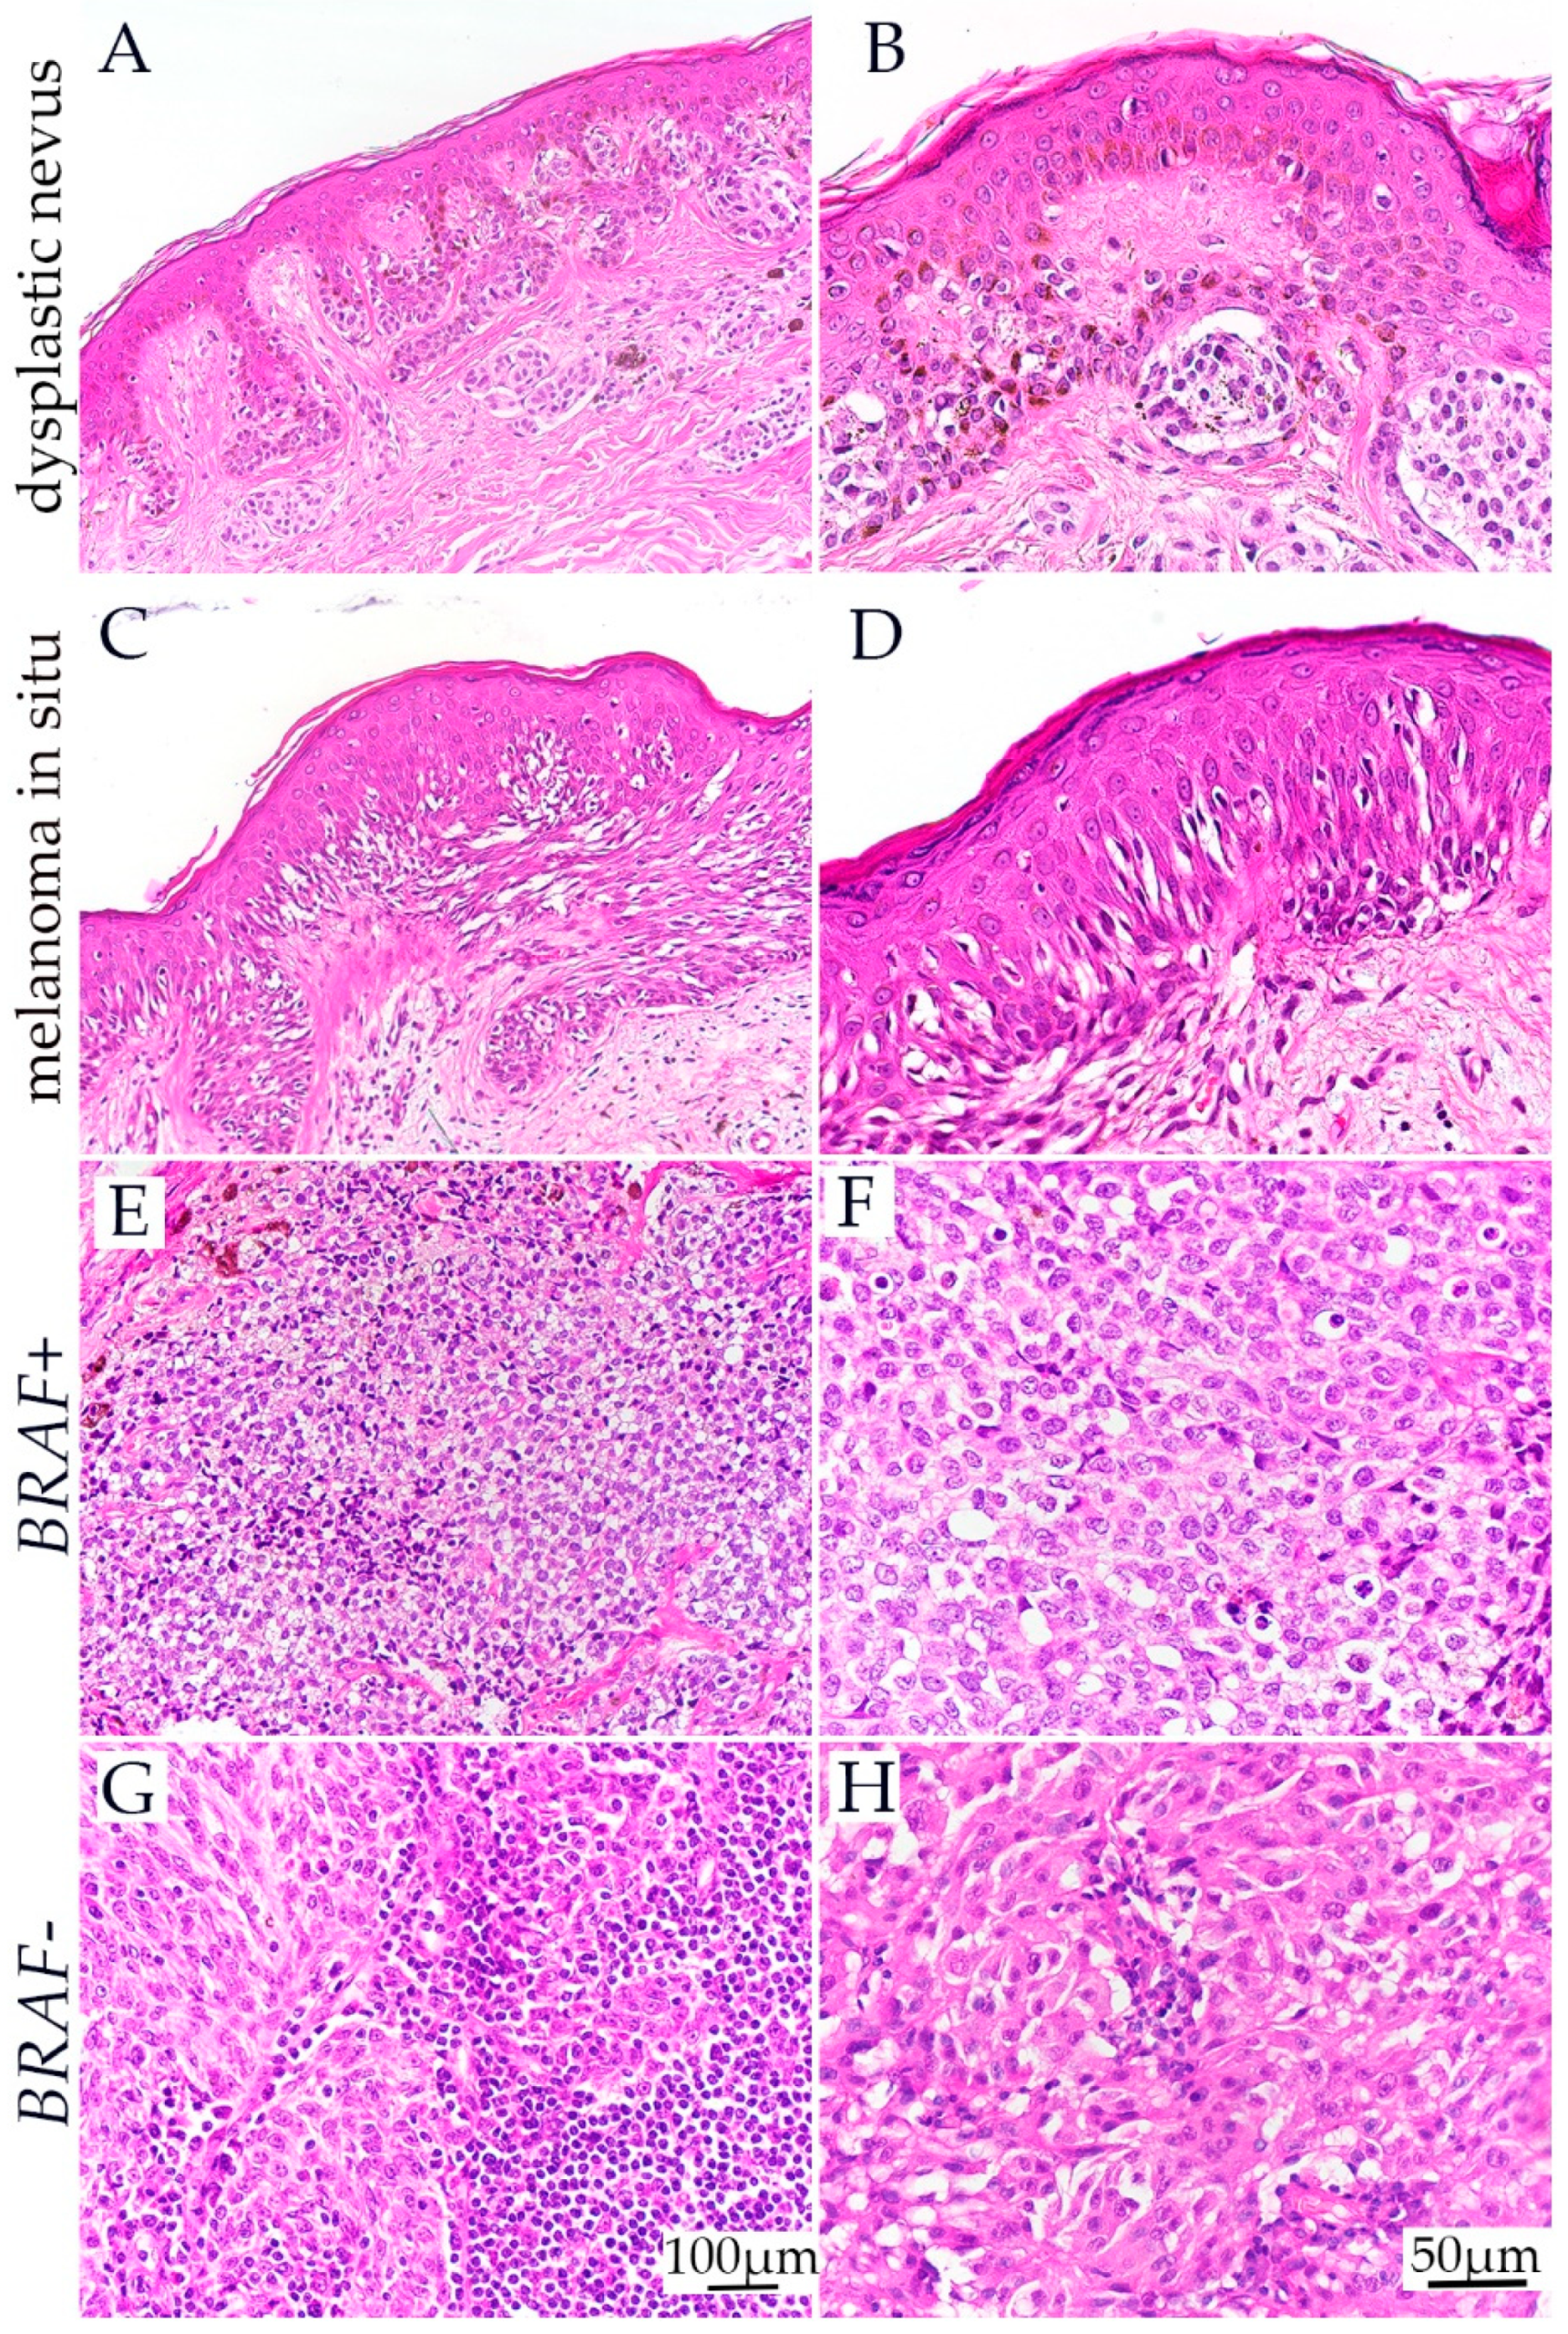
Figure 1. Hematoxylin and eosin staining of different melanocytic lesions included in the study. Dysplastic nevus characterised by an architectural disorder (nest bridging) and moderate cytological atypia (A,B). The confluent proliferation of melanocytes with severe atypia along the base of the epidermis with intraepidermal proliferation (pagetoid scatter), but with no apparent invasive component in melanoma in situ (C,D); Invasive components of BRAF+ and BRAF− invasive melanomas consisting of cohesive aggregates of neoplastic melanocytes (EH).
Cells 13 01450 g001
Figure 2. Immunoexpression of lysyl oxidase homolog 3 (LOXL3), zinc finger protein SNAI1 (SNAI1), 4′,6-diamidino-2-phenylindole (DAPI) nuclear staining image, and merged LOXL3, SNAI1, and DAPI staining in dysplastic nevus, melanoma in situ, and BRAF− and BRAF+ melanoma. The arrows show the expression pattern of LOXL3 and SNAI1 in the skin tissue. The arrows on the merged microphotographs indicate the area where co-expression was observed. Images were captured at a magnification of ×1000, with a scale bar of 50 µm applicable to all images. The LOXL3 area percentages in the tissue of dysplastic nevus, melanoma in situ, and BRAF− and BRAF+ melanoma (a). Data are presented as the mean ± SD (vertical line) and analyzed by an ordinary one-way ANOVA followed by Tukey’s multiple comparisons test. At each time point, ten representative pictures were assessed. The LOXL3 mRNA fold change gene expression comparison between dysplastic nevus, melanoma in situ, and BRAF− and BRAF+ melanoma (b). Ordinary one-way ANOVA was followed by Tukey’s multiple comparison test. Data are shown as mean ± SD (vertical line); significant differences are marked by * p < 0.05, ** p < 0.01.
Cells 13 01450 g002
Figure 3. Immunoexpression of nestin (NES), zinc finger protein SNAI1 (SNAI1), 4′,6-diamidino-2-phenylindole (DAPI) nuclear staining image, and merged NES, SNAI1, and DAPI staining in dysplastic nevus, melanoma in situ, and BRAF− and BRAF+ melanoma. The arrows show the NES and SNAI1 expression patterns in the skin tissue. The arrows on the merged microphotographs indicate the area where co-expression was observed. Images were captured at a magnification of ×1000, with a scale bar of 50 µm applicable to all images. The NES area percentages in the tissue of dysplastic nevus, melanoma in situ, and BRAF− and BRAF+ melanoma (a). Data are presented as the mean ± SD (vertical line) and analyzed by an ordinary one-way ANOVA followed by Tukey’s multiple comparisons test. At each time point, ten representative pictures were assessed. The NES mRNA fold change gene expression comparison between dysplastic nevus, melanoma in situ, and BRAF− and BRAF+ melanoma (b). Ordinary one-way ANOVA was followed by Tukey’s multiple comparison test. Data are shown as mean ± SD (vertical line); significant differences are marked by * p < 0.05, ** p < 0.01.
Cells 13 01450 g003
Figure 4. The zinc finger protein SNAI1 (SNAI1) area percentages in the tissue of dysplastic nevus, melanoma in situ, and BRAF− and BRAF+ melanoma (a). Data are presented as the mean ± SD (vertical line) and analyzed by an ordinary one-way ANOVA followed by Tukey’s multiple comparison test. At each time point, ten representative pictures were assessed. The SNAI1 mRNA fold change gene expression comparison between dysplastic nevus, melanoma in situ, and BRAF− and BRAF+ melanoma (b). Ordinary one-way ANOVA was followed by Tukey’s multiple comparison test. Data are shown as mean ± SD (vertical line); significant differences are marked by ** p < 0.01, **** p < 0.0001.
Cells 13 01450 g004
Figure 5. Graphic representation of the differential expression of lysyl oxidase homolog 3 (LOXL3), nestin (NES), and zinc finger protein SNAI1 (SNAI1) mRNA in BRAF+ and BRAF− melanoma (red colored bars) compared to normal skin samples (grey colored bars). Statistically significant differences were found in LOXL3 and NES mRNA differential expression in both BRAF+ and BRAF− melanoma. Data are used from the TCGA Melanoma (SKCM) study. Significant differences are marked by * p < 0.05.
Cells 13 01450 g005
Figure 6. Graphical representation of survival analysis of lysyl oxidase homolog 3 (LOXL3), nestin (NES) and zinc finger protein (SNAI1) in high (red line) and low (blue line) mRNA expression in BRAF+ and BRAF− melanoma was expressed as the average survival time in months. A statistically significant difference (p = 0.0092) in survival times was found between the high- and low-NES-expression groups. The Kaplan–Meier method and Log-rank test for survival length were used. Data are utilized from the TCGA Melanoma (SKCM) study.
Cells 13 01450 g006
Table 1. Socio-demographic characteristics of patients.
Histology No PatientsAgeSex (Male/Female)
Dysplastic nevus1036.9 ± 12.26/4
Melanoma in situ1555.9 ± 10.95/5
BRAF+ melanoma1060.8 ± 13.19/6
BRAF− melanoma1065.3 ± 15.97/3
Table 2. Primary and secondary antibodies used for immunofluorescence.
AntibodiesCatalog NumberHostDilutionSource
PrimaryAnti-LOXL3 SAB4301652Rabbit1:100Merck KGaA, Darmstadt, Germany
Anti-SNAI1 antibody ab53519Goat1:500Abcam, Cambridge, UK
Anti-nestin antibody (SP103) ab105389Rabbit1:100Abcam, Cambridge, UK
SecondaryRhodamine Red™-X (RRX)
AffiniPure Anti-Goat IgG (H + L)
705-295-003Donkey1:300Jackson Immuno Research
Laboratories, Inc., (Baltimore, PA, USA)
Alexa Fluor®488
AffiniPure Anti-
Rabbit lgG (H + L)
711-545-152Donkey1:300Jackson Immuno Research
Laboratories, Inc., (Baltimore, PA, USA)
Table 3. Immunoreactivity to LOXL3, SNAI1, and NES markers in dysplastic nevus, melanoma in situ, BRAF+ and BRAF− melanoma.
StructureAntibodies
LOXL3NESSNAI1
Dysplastic NevusMelanoma In SituBRAF+BRAF−Dysplastic NevusMelanoma In SituBRAF+BRAF−Dysplastic NevusMelanoma In SituBRAF+BRAF−
epithelium+++++++++++++++++++
lamina propria+/−+/−+++/−+/−+++/−+/−++
+++ strong reactivity; ++ moderate reactivity; + mild reactivity; − no reactivity.
Disclaimer/Publisher’s Note: The statements, opinions and data contained in all publications are solely those of the individual author(s) and contributor(s) and not of MDPI and/or the editor(s). MDPI and/or the editor(s) disclaim responsibility for any injury to people or property resulting from any ideas, methods, instructions or products referred to in the content.