
An Optimized Liquid Chromatography–Mass Spectrometry Method for Ganglioside Analysis in Cell Lines

 , , , ,
Abstract
:1. Introduction
2. Materials and Methods
2.1. Chemicals and Reagents
2.2. Stock Solutions of Ganglioside Standards
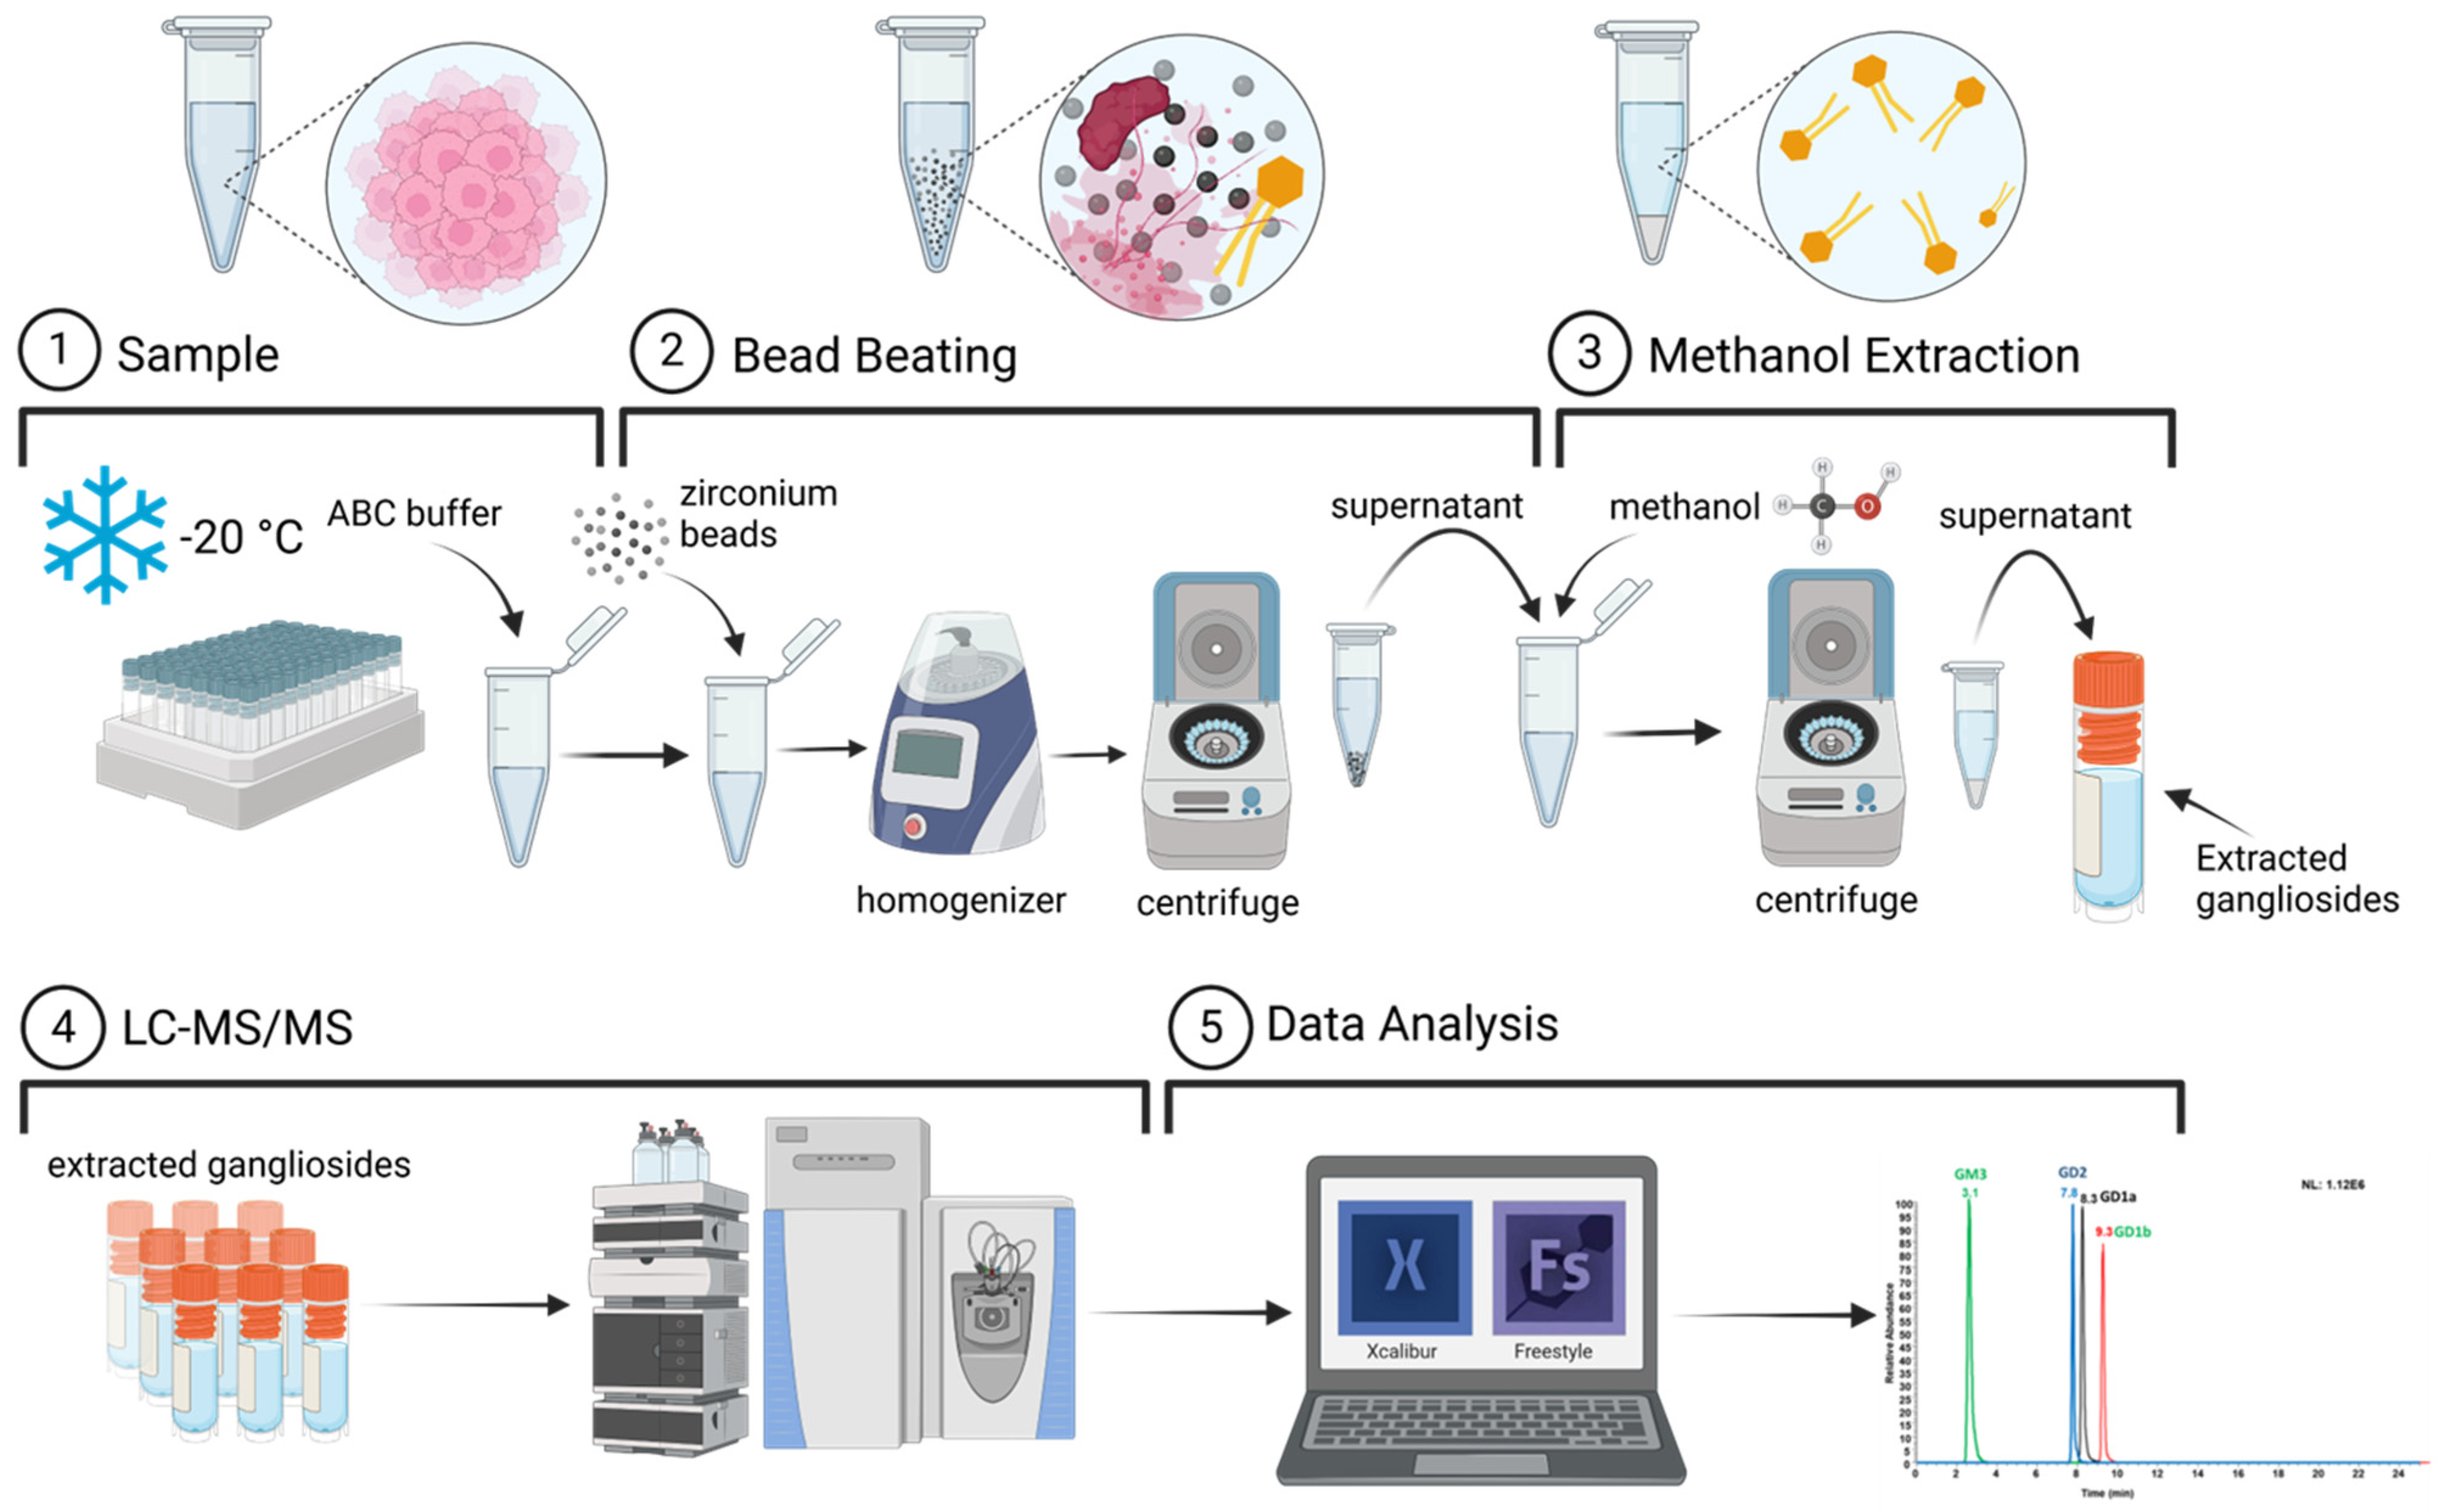
2.3. Cell Lysis for Sphingolipid Extraction
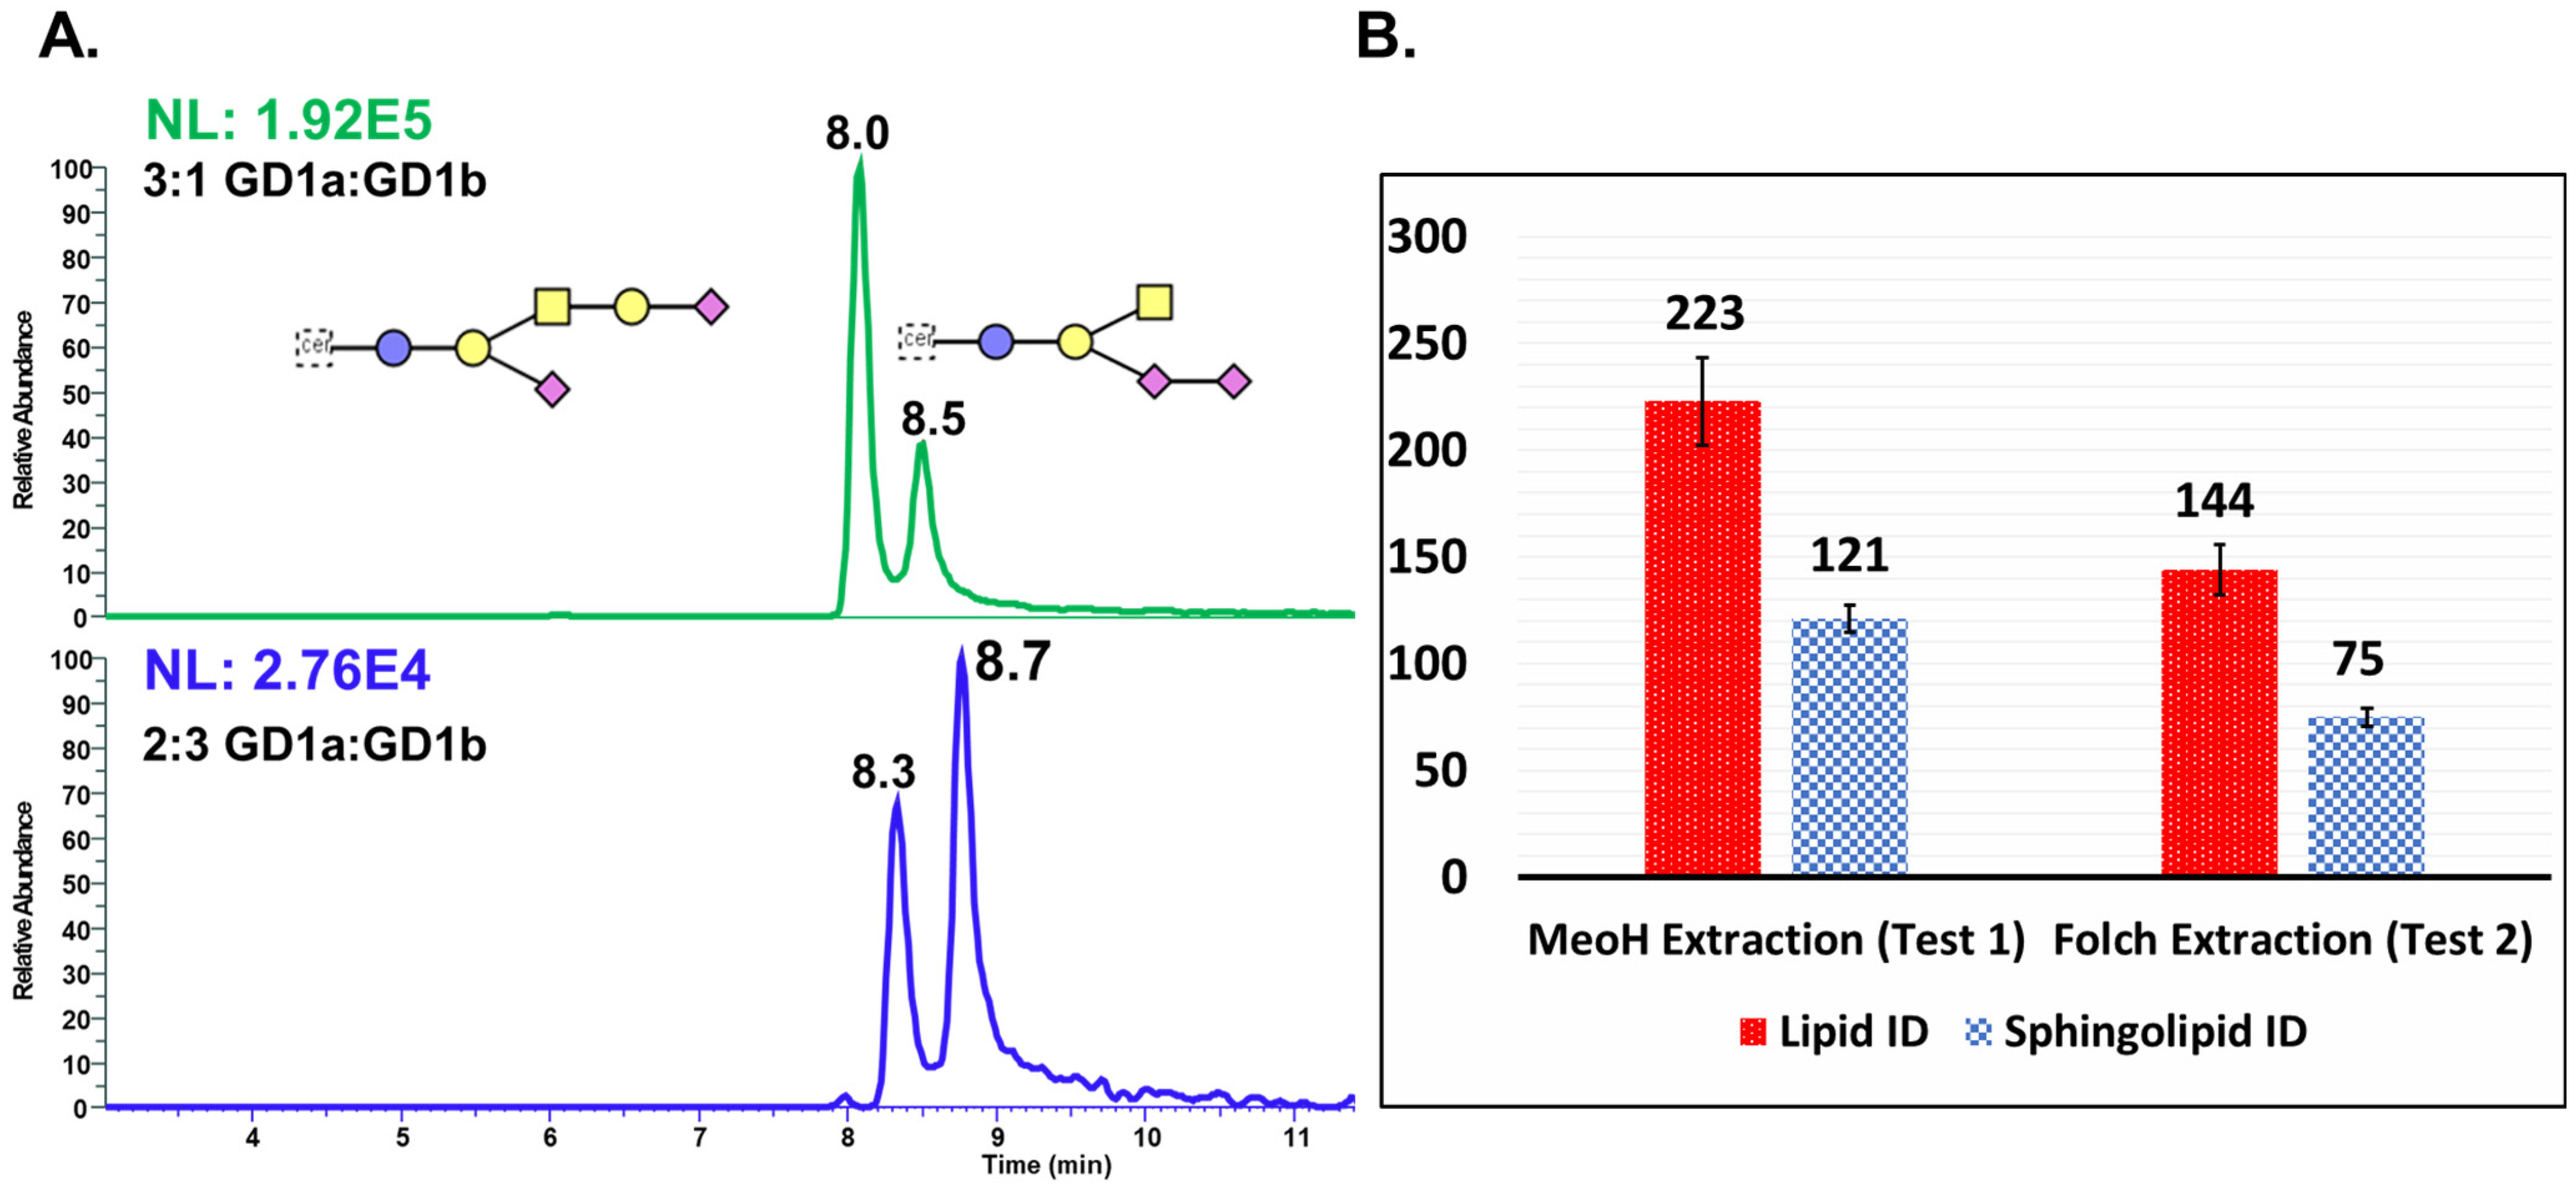
2.4. Optimization of Sphingolipids Extraction
2.5. Optimization of LC Separation Techniques for Analysis of Intact Gangliosides
2.6. Negative Mode LC-MS Setup
2.7. Sphingolipid Profiling in Cog-N-683, MDA-MB-231BR, CRL-1620, and PSN1 Cancer Cell Lines
3. Results
3.1. Optimization of LC Separation
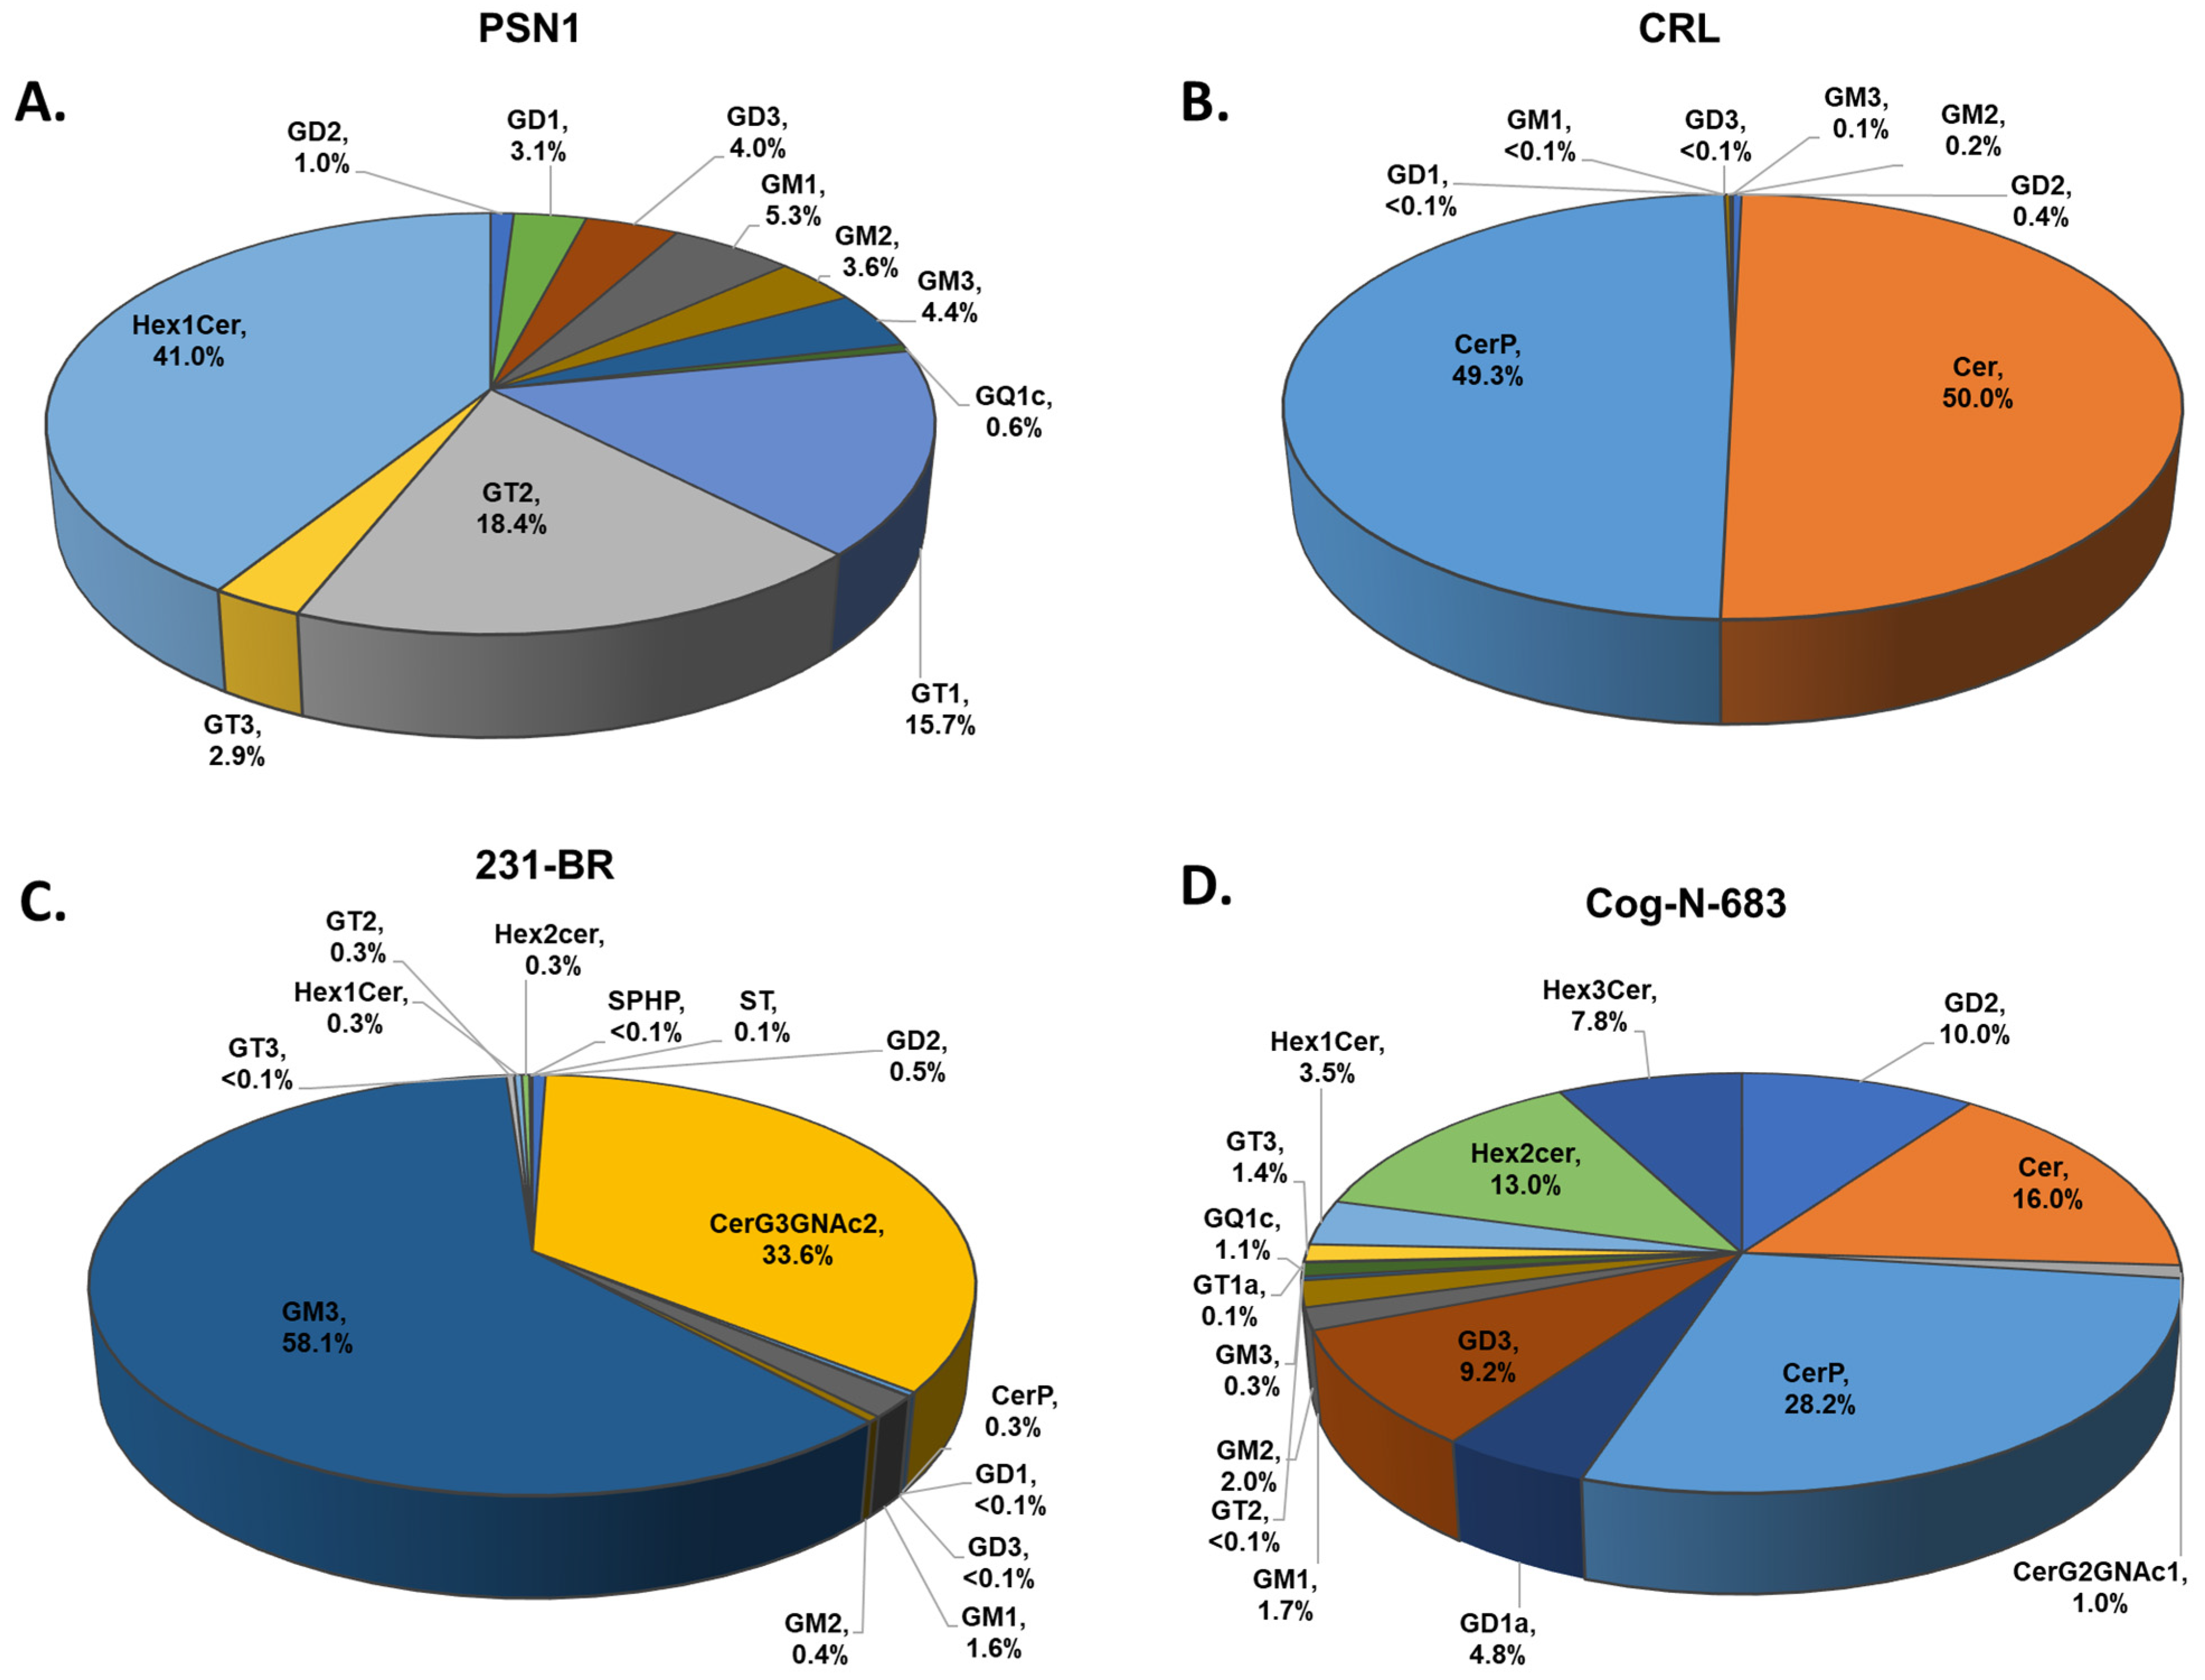
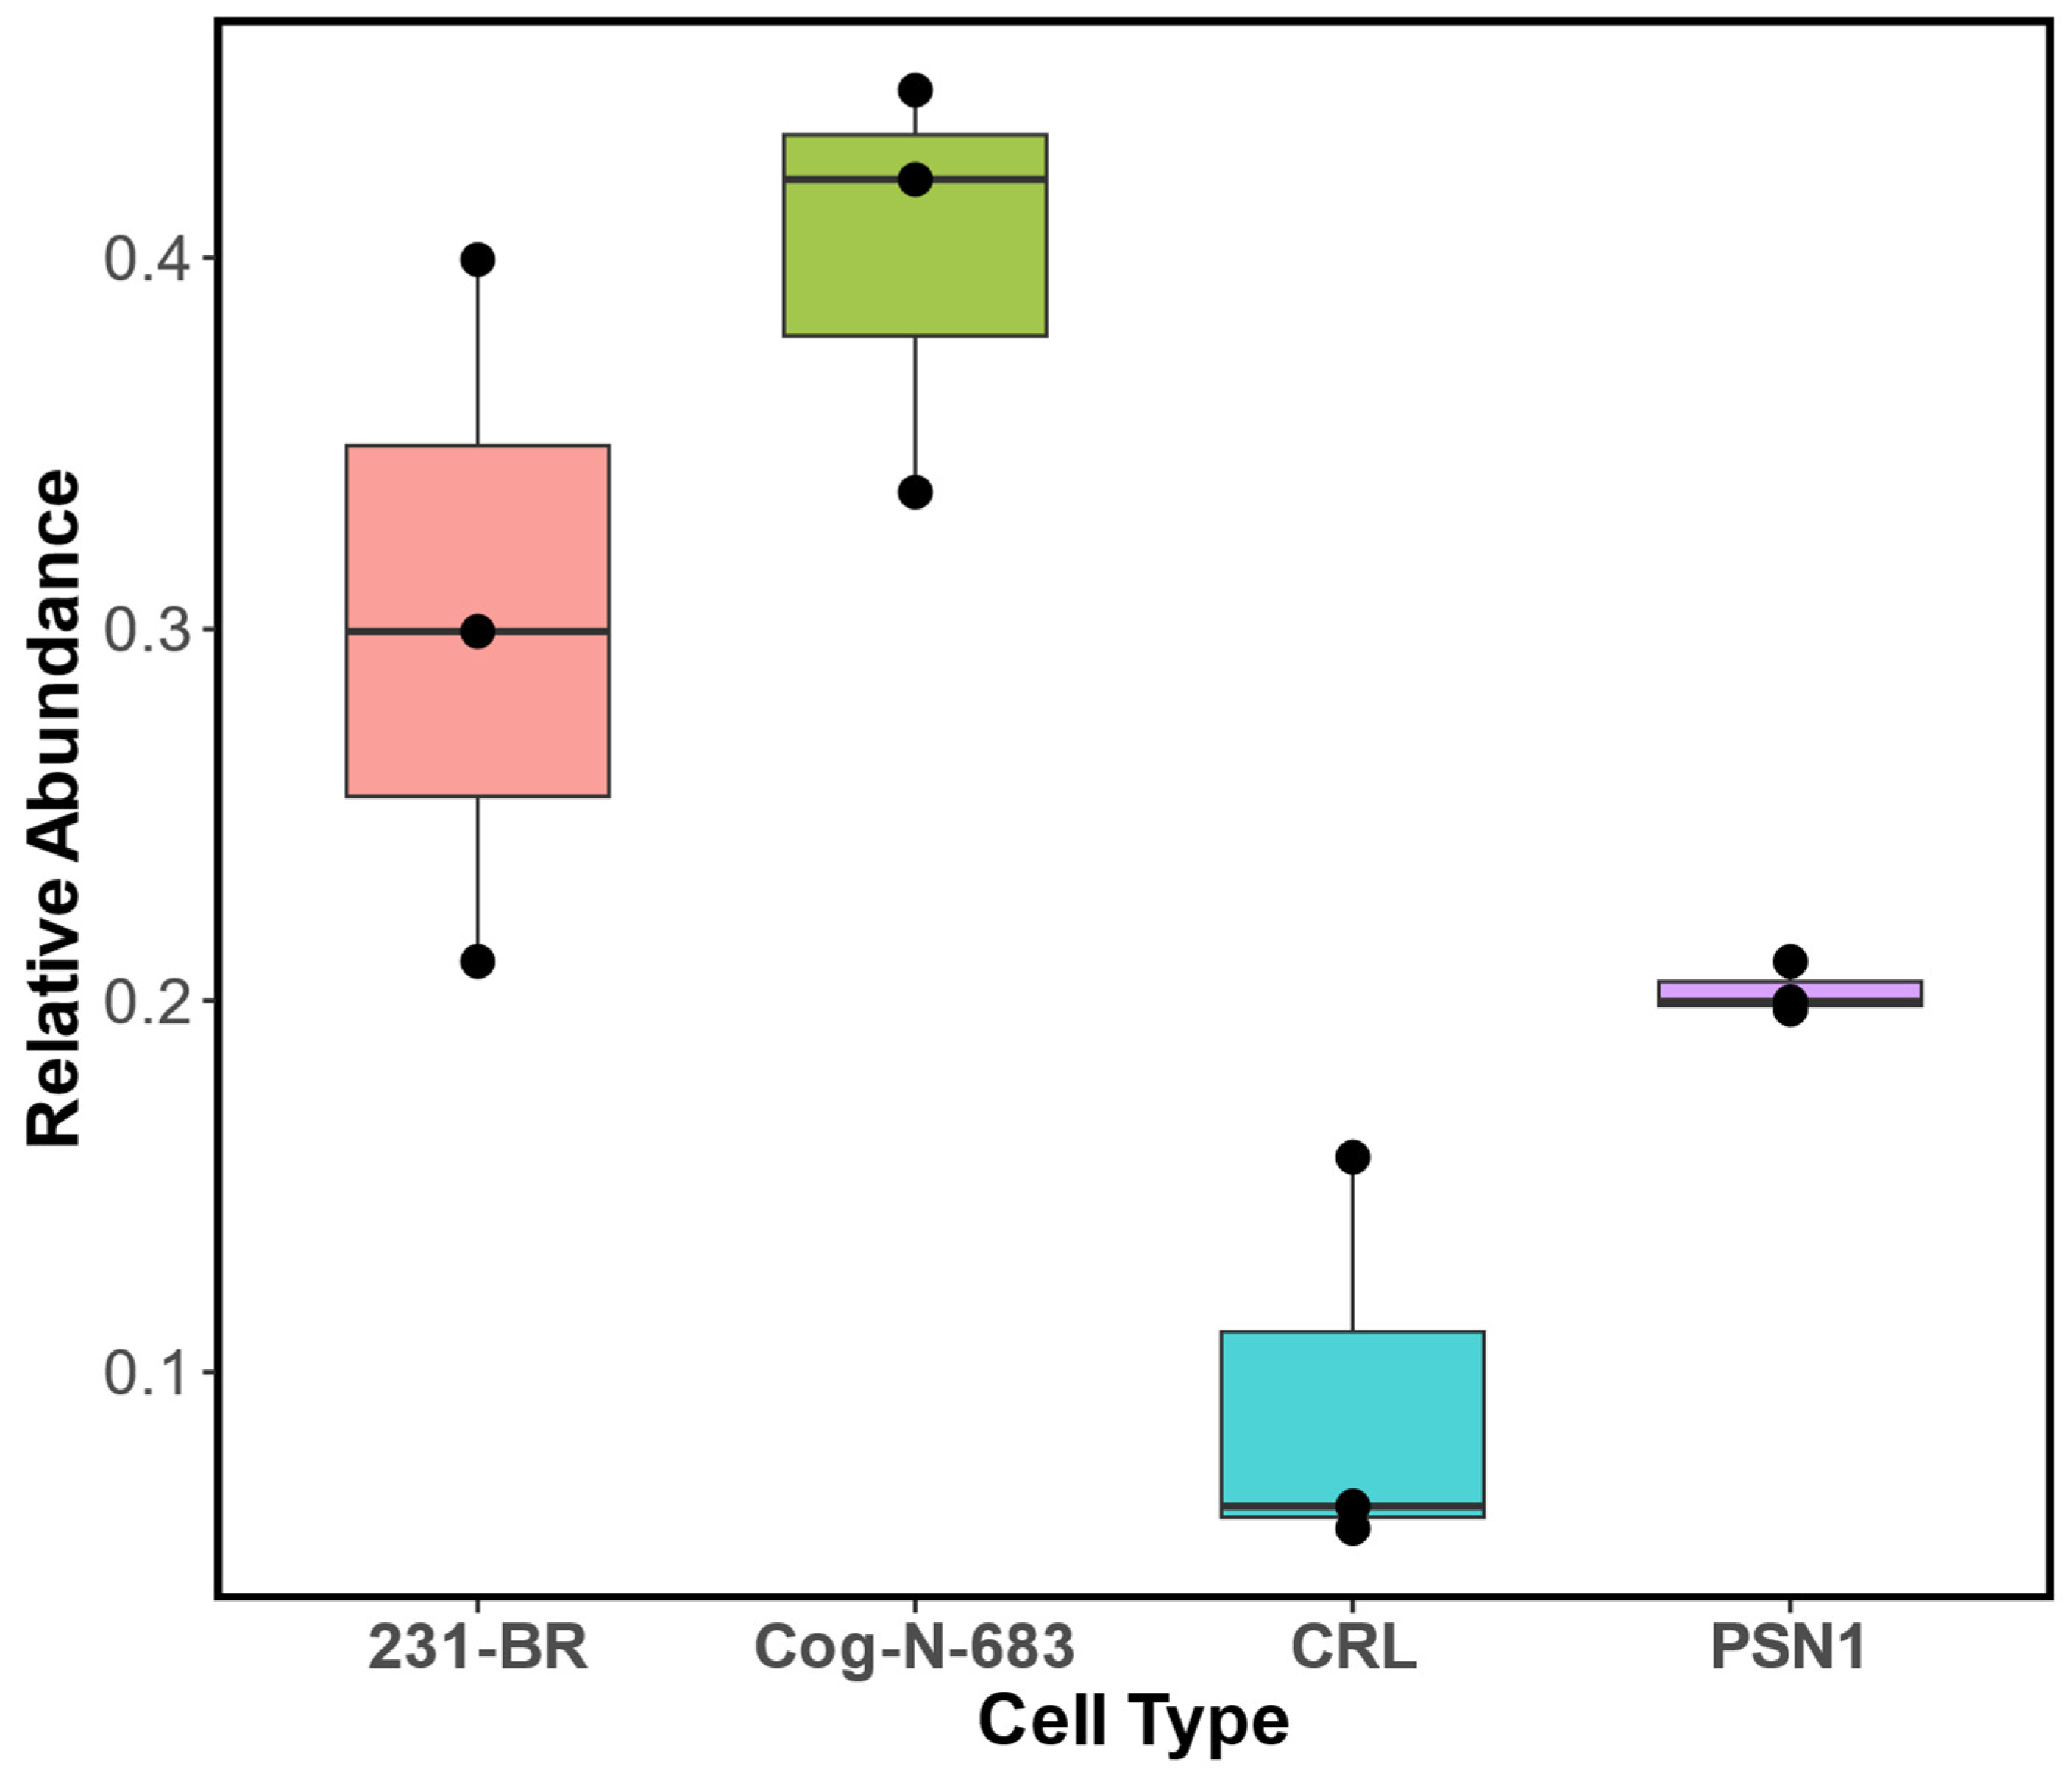
3.2. Ganglioside Profiles of Cog-N-683, MDA-MB-231BR, CRL-1620, and PSN1
4. Discussion
5. Conclusions
Supplementary Materials
Author Contributions
Funding
Data Availability Statement
Acknowledgments
Conflicts of Interest
References
- Schnaar, R.L.; Kinoshita, T. Glycosphingolipids. In Essentials of Glycobiology; Varki, A., Cummings, R.D., Esko, J.D., Stanley, P., Hart, G.W., Aebi, M., Darvill, A.G., Kinoshita, T., Packer, N.H., Prestegard, J.H., et al., Eds.; Cold Spring Harbor Laboratory Press: Cold Spring Harbor, NY, USA, 2015; pp. 125–135. [Google Scholar]
- Galleguillos, D.; Wang, Q.; Steinberg, N.; Zaidi, A.; Shrivastava, G.; Dhami, K.; Daskhan, G.C.; Schmidt, E.N.; Dworsky-Fried, Z.; Giuliani, F.; et al. Anti-inflammatory role of GM1 and other gangliosides on microglia. J. Neuroinflammation 2022, 19, 9. [Google Scholar] [CrossRef] [PubMed]
- Schnaar, R.L. 95Brain glycolipids: Insights from genetic modifications of biosynthetic enzymes. In Neuroglycobiology: (Molecular and Cellular Neurobiology); Fukuda, M., Rutishauser, U., Schnaar, R.L., Eds.; Oxford University Press: Oxford, UK, 2005. [Google Scholar]
- Posse de Chaves, E.; Sipione, S. Sphingolipids and gangliosides of the nervous system in membrane function and dysfunction. FEBS Lett. 2010, 584, 1748–1759. [Google Scholar] [CrossRef] [PubMed]
- Porter, M.J.; Zhang, G.L.; Schnaar, R.L. Ganglioside Extraction, Purification and Profiling. J. Vis. Exp. 2021, e62385. [Google Scholar] [CrossRef]
- Kracun, I.; Rosner, H.; Drnovsek, V.; Vukelic, Z.; Cosovic, C.; Trbojevic-Cepe, M.; Kubat, M. Gangliosides in the human brain development and aging. Neurochem. Int. 1992, 20, 421–431. [Google Scholar] [CrossRef] [PubMed]
- Mo, L.; Ren, Q.; Duchemin, A.M.; Neff, N.H.; Hadjiconstantinou, M. GM1 and ERK signaling in the aged brain. Brain Res. 2005, 1054, 125–134. [Google Scholar] [CrossRef]
- Magistretti, P.J.; Geisler, F.H.; Schneider, J.S.; Li, P.A.; Fiumelli, H.; Sipione, S. Gangliosides: Treatment Avenues in Neurodegenerative Disease. Front. Neurol. 2019, 10, 859. [Google Scholar] [CrossRef]
- Wu, G.; Lu, Z.H.; Kulkarni, N.; Ledeen, R.W. Deficiency of ganglioside GM1 correlates with Parkinson’s disease in mice and humans. J. Neurosci. Res. 2012, 90, 1997–2008. [Google Scholar] [CrossRef]
- Schneider, J.S. Altered expression of genes involved in ganglioside biosynthesis in substantia nigra neurons in Parkinson’s disease. PLoS ONE 2018, 13, e0199189. [Google Scholar] [CrossRef]
- Blennow, K.; Davidsson, P.; Wallin, A.; Fredman, P.; Gottfries, C.G.; Karlsson, I.; Månsson, J.E.; Svennerholm, L. Gangliosides in cerebrospinal fluid in ‘probable Alzheimer’s disease’. Arch. Neurol. 1991, 48, 1032–1035. [Google Scholar] [CrossRef]
- Blennow, K.; Davidsson, P.; Wallin, A.; Fredman, P.; Gottfries, C.G.; Månsson, J.E.; Svennerholm, L. Differences in cerebrospinal fluid gangliosides between “probable Alzheimer’s disease” and normal aging. Aging 1992, 4, 301–306. [Google Scholar] [CrossRef]
- Li, H.; Liu, Y.; Wang, Z.; Xie, Y.; Yang, L.; Zhao, Y.; Tian, R. Mass spectrometry-based ganglioside profiling provides potential insights into Alzheimer’s disease development. J. Chromatogr. A 2022, 1676, 463196. [Google Scholar] [CrossRef]
- Desplats, P.A.; Denny, C.A.; Kass, K.E.; Gilmartin, T.; Head, S.R.; Sutcliffe, J.G.; Seyfried, T.N.; Thomas, E.A. Glycolipid and ganglioside metabolism imbalances in Huntington’s disease. Neurobiol. Dis. 2007, 27, 265–277. [Google Scholar] [CrossRef] [PubMed]
- Maglione, V.; Marchi, P.; Di Pardo, A.; Lingrell, S.; Horkey, M.; Tidmarsh, E.; Sipione, S. Impaired ganglioside metabolism in Huntington’s disease and neuroprotective role of GM1. J. Neurosci. 2010, 30, 4072–4080. [Google Scholar] [CrossRef] [PubMed]
- Alpaugh, M.; Galleguillos, D.; Forero, J.; Morales, L.C.; Lackey, S.W.; Kar, P.; Di Pardo, A.; Holt, A.; Kerr, B.J.; Todd, K.G.; et al. Disease-modifying effects of ganglioside GM1 in Huntington’s disease models. EMBO Mol. Med. 2017, 9, 1537–1557. [Google Scholar] [CrossRef] [PubMed]
- Kraĉun, I.; Rösner, H.; Cosović, C.; Stavljenić, A. Topographical atlas of the gangliosides of the adult human brain. J. Neurochem. 1984, 43, 979–989. [Google Scholar] [CrossRef]
- Müthing, J. High-resolution thin-layer chromatography of gangliosides. J. Chromatogr. A 1996, 720, 3–25. [Google Scholar] [CrossRef] [PubMed]
- Rischke, S.; Hahnefeld, L.; Burla, B.; Behrens, F.; Gurke, R.; Garrett, T.J. Small molecule biomarker discovery: Proposed workflow for LC-MS-based clinical research projects. J. Mass. Spectrom. Adv. Clin. Lab. 2023, 28, 47–55. [Google Scholar] [CrossRef] [PubMed]
- Liu, Y.; Qiao, W.; Liu, Y.; Zhao, J.; Liu, Q.; Yang, K.; Zhang, M.; Wang, Y.; Liu, Y.; Chen, L. Quantification of phospholipids and glycerides in human milk using ultra-performance liquid chromatography with quadrupole-time-of-flight mass spectrometry. Front. Chem. 2022, 10, 1101557. [Google Scholar] [CrossRef]
- Hájek, R.; Lísa, M.; Khalikova, M.; Jirásko, R.; Cífková, E.; Študent, V., Jr.; Vrána, D.; Opálka, L.; Vávrová, K.; Matzenauer, M.; et al. HILIC/ESI-MS determination of gangliosides and other polar lipid classes in renal cell carcinoma and surrounding normal tissues. Anal. Bioanal. Chem. 2018, 410, 6585–6594. [Google Scholar] [CrossRef]
- Kolbeinsson, H.M.; Chandana, S.; Wright, G.P.; Chung, M. Pancreatic Cancer: A Review of Current Treatment and Novel Therapies. J. Investig. Surg. 2023, 36, 2129884. [Google Scholar] [CrossRef]
- Sasaki, N.; Hirabayashi, K.; Michishita, M.; Takahashi, K.; Hasegawa, F.; Gomi, F.; Itakura, Y.; Nakamura, N.; Toyoda, M.; Ishiwata, T. Ganglioside GM2, highly expressed in the MIA PaCa-2 pancreatic ductal adenocarcinoma cell line, is correlated with growth, invasion, and advanced stage. Sci. Rep. 2019, 9, 19369. [Google Scholar] [CrossRef] [PubMed]
- Schengrund, C.L. Gangliosides and Neuroblastomas. Int. J. Mol. Sci. 2020, 21, 5313. [Google Scholar] [CrossRef] [PubMed]
- Voeller, J.; Sondel, P.M. Advances in Anti-GD2 Immunotherapy for Treatment of High-risk Neuroblastoma. J. Pediatr. Hematol. Oncol. 2019, 41, 163–169. [Google Scholar] [CrossRef] [PubMed]
- Folch, J.; Lees, M.; Sloane Stanley, G.H. A simple method for the isolation and purification of total lipides from animal tissues. J. Biol. Chem. 1957, 226, 497–509. [Google Scholar] [CrossRef] [PubMed]
- Cavdarli, S.; Yamakawa, N.; Clarisse, C.; Aoki, K.; Brysbaert, G.; Le Doussal, J.M.; Delannoy, P.; Guérardel, Y.; Groux-Degroote, S. Profiling of O-acetylated Gangliosides Expressed in Neuroectoderm Derived Cells. Int. J. Mol. Sci. 2020, 21, 370. [Google Scholar] [CrossRef]
- Rodrigues-Junior, D.M.; Raminelli, C.; Hassanie, H.; Trossini, G.H.G.; Perecim, G.P.; Caja, L.; Moustakas, A.; Vettore, A.L. Aporphine and isoquinoline derivatives block glioblastoma cell stemness and enhance temozolomide cytotoxicity. Sci. Rep. 2022, 12, 21113. [Google Scholar] [CrossRef]
- Yamada, H.; Yoshida, T.; Sakamoto, H.; Terada, M.; Sugimura, T. Establishment of a human pancreatic adenocarcinoma cell line (PSN-1) with amplifications of both c-myc and activated c-Ki-ras by a point mutation. Biochem. Biophys. Res. Commun. 1986, 140, 167–173. [Google Scholar] [CrossRef]
- Chan, C.Y.; Chen, Z.; Destro, G.; Veal, M.; Lau, D.; O’Neill, E.; Dias, G.; Mosley, M.; Kersemans, V.; Guibbal, F.; et al. Imaging PARP with [(18)F]rucaparib in pancreatic cancer models. Eur. J. Nucl. Med. Mol. Imaging 2022, 49, 3668–3678. [Google Scholar] [CrossRef]
- Dun, M.D.; Chalkley, R.J.; Faulkner, S.; Keene, S.; Avery-Kiejda, K.A.; Scott, R.J.; Falkenby, L.G.; Cairns, M.J.; Larsen, M.R.; Bradshaw, R.A.; et al. Proteotranscriptomic Profiling of 231-BR Breast Cancer Cells: Identification of Potential Biomarkers and Therapeutic Targets for Brain Metastasis. Mol. Cell. Proteom. 2015, 14, 2316–2330. [Google Scholar] [CrossRef]
- Harenza, J.L.; Diamond, M.A.; Adams, R.N.; Song, M.M.; Davidson, H.L.; Hart, L.S.; Dent, M.H.; Fortina, P.; Reynolds, C.P.; Maris, J.M. Transcriptomic profiling of 39 commonly-used neuroblastoma cell lines. Sci. Data 2017, 4, 170033. [Google Scholar] [CrossRef]
- Kendsersky, N.M.; Lindsay, J.; Kolb, E.A.; Smith, M.A.; Teicher, B.A.; Erickson, S.W.; Earley, E.J.; Mosse, Y.P.; Martinez, D.; Pogoriler, J.; et al. The B7-H3-Targeting Antibody-Drug Conjugate m276-SL-PBD Is Potently Effective Against Pediatric Cancer Preclinical Solid Tumor Models. Clin. Cancer Res. 2021, 27, 2938–2946. [Google Scholar] [CrossRef] [PubMed]
- Daniotti, J.L.; Vilcaes, A.A.; Torres Demichelis, V.; Ruggiero, F.M.; Rodriguez-Walker, M. Glycosylation of glycolipids in cancer: Basis for development of novel therapeutic approaches. Front. Oncol. 2013, 3, 306. [Google Scholar] [CrossRef] [PubMed]
- Nakajima, K.; Akiyama, H.; Tanaka, K.; Kohyama-Koganeya, A.; Greimel, P.; Hirabayashi, Y. Separation and analysis of mono-glucosylated lipids in brain and skin by hydrophilic interaction chromatography based on carbohydrate and lipid moiety. J. Chromatogr. B Anal. Technol. Biomed. Life Sci. 2016, 1031, 146–153. [Google Scholar] [CrossRef] [PubMed]
- Li, Z.; Zhang, Q. Ganglioside isomer analysis using ion polarity switching liquid chromatography-tandem mass spectrometry. Anal. Bioanal. Chem. 2021, 413, 3269–3279. [Google Scholar] [CrossRef] [PubMed]
- Lee, J.; Hwang, H.; Kim, S.; Hwang, J.; Yoon, J.; Yin, D.; Choi, S.I.; Kim, Y.-H.; Kim, Y.-S.; An, H.J. Comprehensive Profiling of Surface Gangliosides Extracted from Various Cell Lines by LC-MS/MS. Cells 2019, 8, 1323. [Google Scholar] [CrossRef]
- Zhang, G.-L.; Porter, M.J.; Awol, A.K.; Orsburn, B.C.; Canner, S.W.; Gray, J.J.; O’Meally, R.N.; Cole, R.N.; Schnaar, R.L. The Human Ganglioside Interactome in Live Cells Revealed Using Clickable Photoaffinity Ganglioside Probes. J. Am. Chem. Soc. 2024, 146, 17801–17816. [Google Scholar] [CrossRef]
- Svennerholm, L.; Fredman, P. A procedure for the quantitative isolation of brain gangliosides. Biochim. Biophys. Acta 1980, 617, 97–109. [Google Scholar] [CrossRef]
- Kozłowska, M.; Gruczyńska, E.; Ścibisz, I.; Rudzińska, M. Fatty acids and sterols composition, and antioxidant activity of oils extracted from plant seeds. Food Chem. 2016, 213, 450–456. [Google Scholar] [CrossRef]
- Huang, Q.; Zhou, X.; Liu, D.; Xin, B.; Cechner, K.; Wang, H.; Zhou, A. A new liquid chromatography/tandem mass spectrometry method for quantification of gangliosides in human plasma. Anal. Biochem. 2014, 455, 26–34. [Google Scholar] [CrossRef]
- Saini, R.K.; Prasad, P.; Shang, X.; Keum, Y.S. Advances in Lipid Extraction Methods-A Review. Int. J. Mol. Sci. 2021, 22, 13643. [Google Scholar] [CrossRef]
- Eggers, L.F.; Schwudke, D. Liquid Extraction: Folch. In Encyclopedia of Lipidomics; Wenk, M.R., Ed.; Springer: Dordrecht, The Netherlands, 2016; pp. 1–6. [Google Scholar]
- Schindler, R.L.; Oloumi, A.; Tena, J.; Alvarez, M.R.S.; Liu, Y.; Grijaldo, S.; Barboza, M.; Jin, L.-W.; Zivkovic, A.M.; Lebrilla, C.B. Profiling Intact Glycosphingolipids with Automated Structural Annotation and Quantitation from Human Samples with Nanoflow Liquid Chromatography Mass Spectrometry. Anal. Chem. 2024, 96, 5951–5959. [Google Scholar] [CrossRef] [PubMed]
- Di Palma, S.; Boersema, P.J.; Heck, A.J.; Mohammed, S. Zwitterionic hydrophilic interaction liquid chromatography (ZIC-HILIC and ZIC-cHILIC) provide high resolution separation and increase sensitivity in proteome analysis. Anal. Chem. 2011, 83, 3440–3447. [Google Scholar] [CrossRef] [PubMed]
- Boersema, P.J.; Divecha, N.; Heck, A.J.; Mohammed, S. Evaluation and optimization of ZIC-HILIC-RP as an alternative MudPIT strategy. J. Proteome Res. 2007, 6, 937–946. [Google Scholar] [CrossRef] [PubMed]
- Pohlentz, G.; Marx, K.; Mormann, M. Characterization of Protein N-Glycosylation by Analysis of ZIC-HILIC-Enriched Intact Proteolytic Glycopeptides. Methods Mol. Biol. 2016, 1394, 163–179. [Google Scholar] [CrossRef] [PubMed]
- Dedvisitsakul, P.; Jacobsen, S.; Svensson, B.; Bunkenborg, J.; Finnie, C.; Hägglund, P. Glycopeptide enrichment using a combination of ZIC-HILIC and cotton wool for exploring the glycoproteome of wheat flour albumins. J. Proteome Res. 2014, 13, 2696–2703. [Google Scholar] [CrossRef]
- Seo, N.; Ko, J.; Lee, D.; Jeong, H.; Oh, M.J.; Kim, U.; Lee, D.H.; Kim, J.; Choi, Y.J.; An, H.J. In-depth characterization of non-human sialic acid (Neu5Gc) in human serum using label-free ZIC-HILIC/MRM-MS. Anal. Bioanal. Chem. 2021, 413, 5227–5237. [Google Scholar] [CrossRef]
- Kirsch, S.; Souady, J.; Mormann, M.; Bindila, L.; Peter-Katalinić, J. Ceramide profiles of human serum gangliosides GM2 and GD1a exhibit cancer-associated alterations. J. Glycom. Lipidom. 2012, 1, 2153-0637. [Google Scholar] [CrossRef]
- Marian, O.C.; Teo, J.D.; Lee, J.Y.; Song, H.; Kwok, J.B.; Landin-Romero, R.; Halliday, G.; Don, A.S. Disrupted myelin lipid metabolism differentiates frontotemporal dementia caused by GRN and C9orf72 gene mutations. Acta Neuropathol. Commun. 2023, 11, 52. [Google Scholar] [CrossRef]
- Pascual-Pasto, G.; McIntyre, B.; Hines, M.G.; Giudice, A.M.; Garcia-Gerique, L.; Hoffmann, J.; Mishra, P.; Matlaga, S.; Lombardi, S.; Shraim, R.; et al. CAR T-cell-mediated delivery of bispecific innate immune cell engagers for neuroblastoma. Nat. Commun. 2024, 15, 7141. [Google Scholar] [CrossRef]
- Higashi, C.; Saito, K.; Kozuka, Y.; Yuasa, H.; Nakamura, K.; Ishitobi, M.; Ishihara, M.; Mizuno, T.; Tawara, I.; Fujiwara, H.; et al. Ganglioside GD2 Expression Is Associated With Unfavorable Prognosis in Early Triple-negative Breast Cancer. Anticancer. Res. 2023, 43, 4045–4053. [Google Scholar] [CrossRef]
- Battula, V.L.; Shi, Y.; Evans, K.W.; Wang, R.Y.; Spaeth, E.L.; Jacamo, R.O.; Guerra, R.; Sahin, A.A.; Marini, F.C.; Hortobagyi, G.; et al. Ganglioside GD2 identifies breast cancer stem cells and promotes tumorigenesis. J. Clin. Investig. 2012, 122, 2066–2078. [Google Scholar] [CrossRef] [PubMed]
- Orsi, G.; Barbolini, M.; Ficarra, G.; Tazzioli, G.; Manni, P.; Petrachi, T.; Mastrolia, I.; Orvieto, E.; Spano, C.; Prapa, M.; et al. GD2 expression in breast cancer. Oncotarget 2017, 8, 31592–31600. [Google Scholar] [CrossRef] [PubMed]
- Takahashi, T.; Suzuki, T. Role of sulfatide in normal and pathological cells and tissues. J. Lipid Res. 2012, 53, 1437–1450. [Google Scholar] [CrossRef] [PubMed]
- Nagahashi, M.; Abe, M.; Sakimura, K.; Takabe, K.; Wakai, T. The role of sphingosine-1-phosphate in inflammation and cancer progression. Cancer Sci. 2018, 109, 3671–3678. [Google Scholar] [CrossRef]
- Watanabe, Y.; Aoki-Kinoshita, K.F.; Ishihama, Y.; Okuda, S. GlycoPOST realizes FAIR principles for glycomics mass spectrometry data. Nucleic Acids Res. 2020, 49, D1523–D1528. [Google Scholar] [CrossRef]


| Extraction Methods | 1st Replicate (%) | 2nd Replicate (%) | 3rd Replicate (%) | Average |
|---|---|---|---|---|
| Folch extraction | 98.2 | 94.3 | 81.5 | 91.4 ± 8 |
| MeOH extraction | 103.4 | 96.4 | 89.2 | 96.3 ± 7 |
| Ganglioside Types | Adduct | Theoretical m/z | Observed m/z | Mass Accuracy (ppm) |
|---|---|---|---|---|
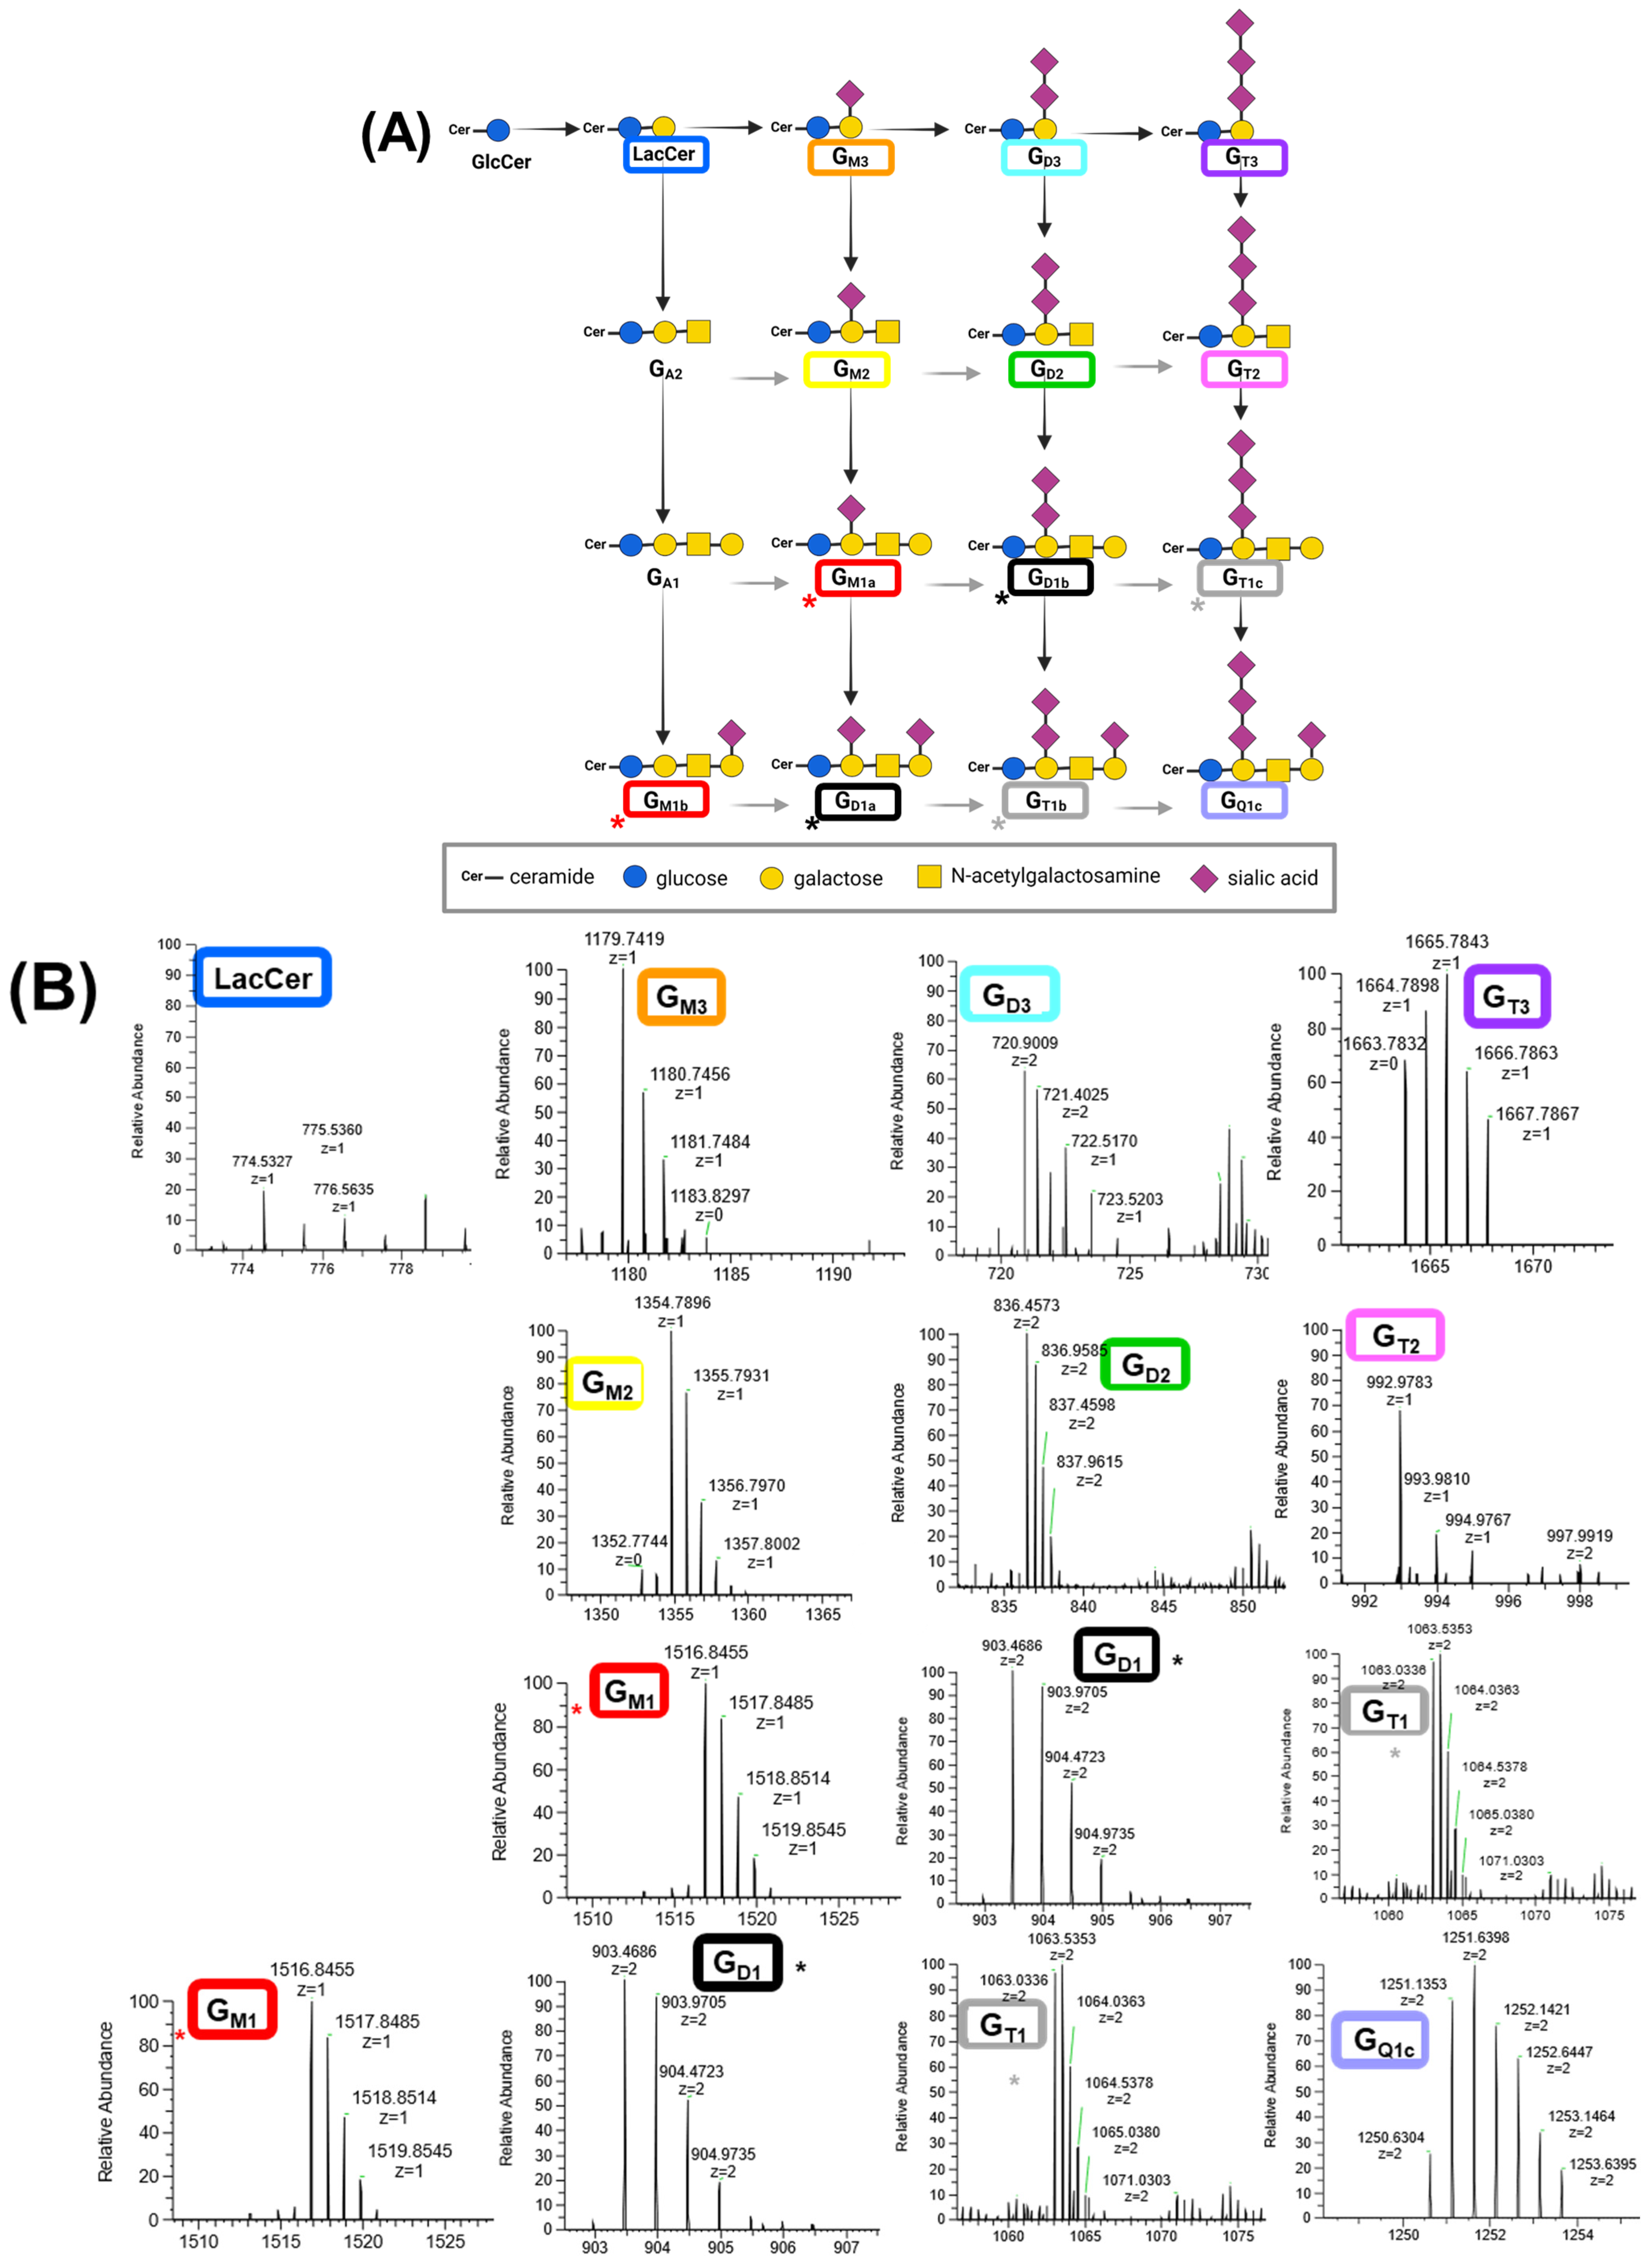
| GlcCer | Hex1Cer(d17:0_18:2+2O)-H | 742.5475 | 742.5424 | 6.8 |
| LacCer | Hex2Cer(m17:1_12:0)-H | 774.5373 | 774.5327 | 6.1 |
| GM3 | GM3(d18:1_18:0)-H | 1179.7365 | 1179.7419 | 4.5 |
| GD3 | GD3(d18:1_16:0)-H | 720.8967 | 720.9009 | 4.5 |
| GT3 | GT3(t16:1_12:0)-H | 1664.7982 | 1664.7898 | 5.0 |
| GD2 | GD2 (d18:1_18:0)-2H | 836.4520 | 836.4574 | 6.4 |
| GT2 | GT2(d18:1_21:5)-2H | 992.9761 | 992.9785 | 2.4 |
| GM1 | GM1(d18:1_16:0)-H | 1516.8375 | 1516.8451 | 5.0 |
| GT1 | GT1(d18:1_18:0)-2H | 1063.0261 | 1063.0338 | 7.3 |
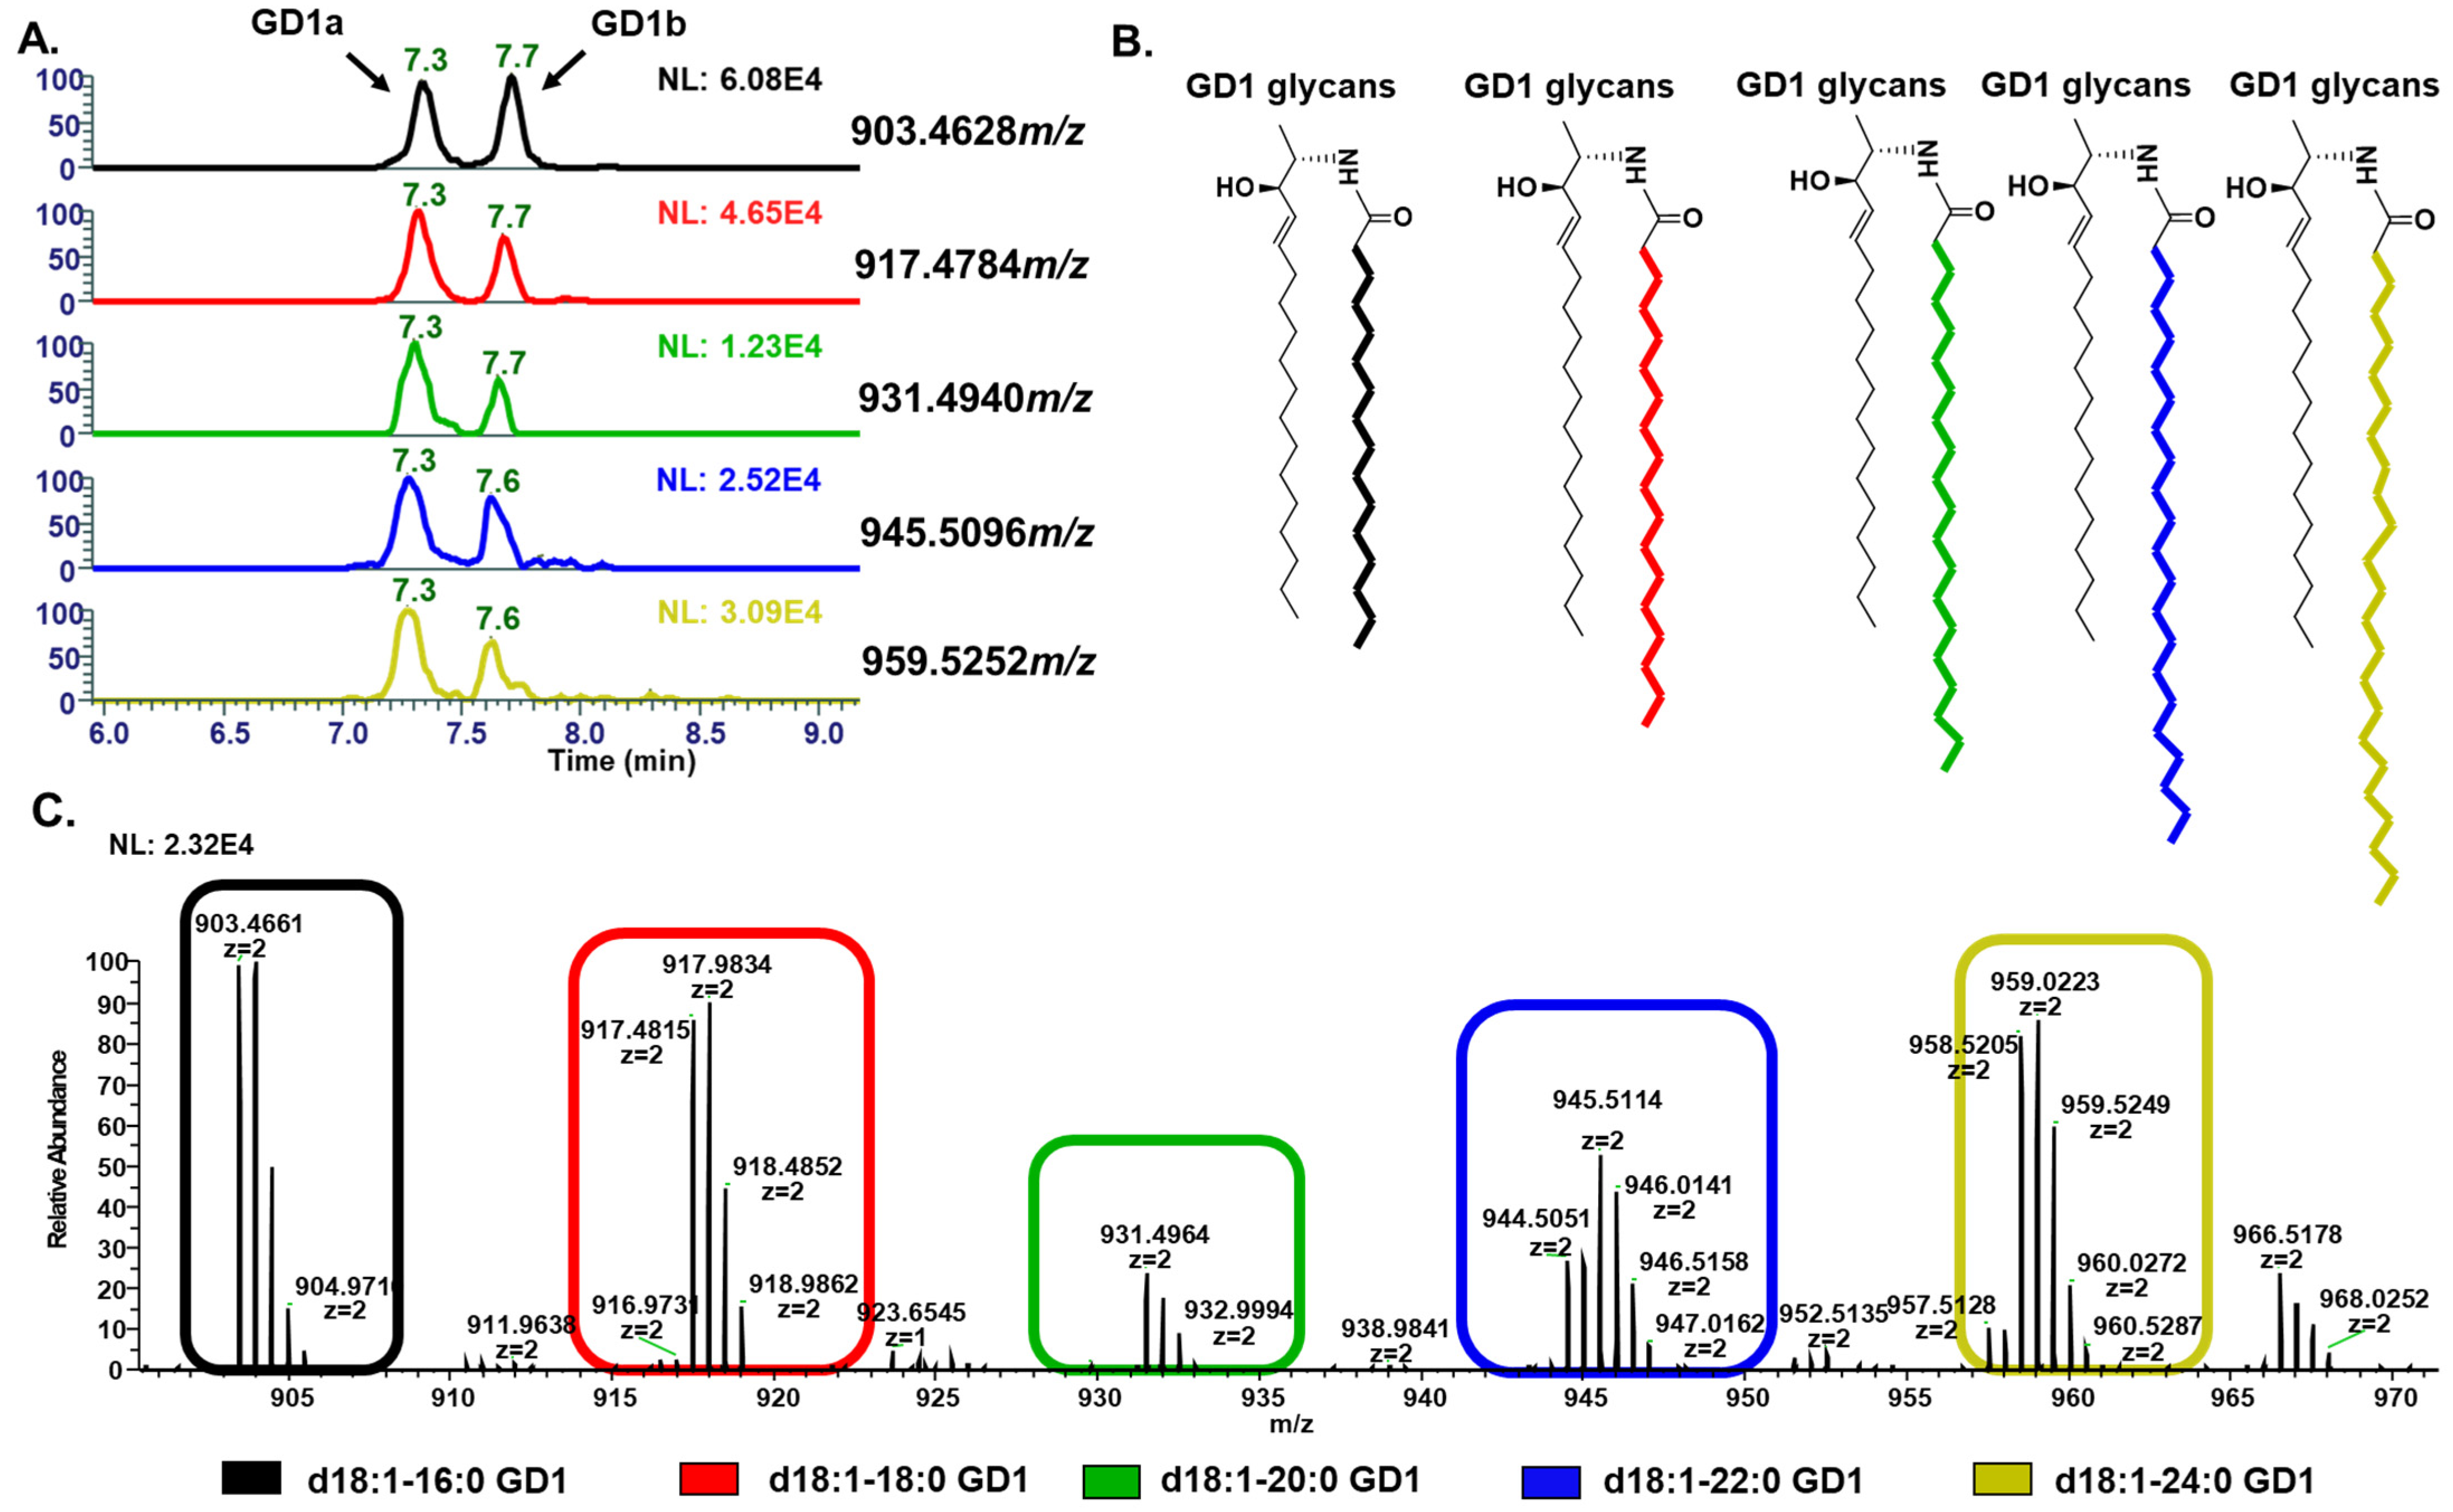
| GD1 | GD1 (d18:1_18:0)-2H | 903.4628 | 903.4687 | 6.5 |
| GQ1 | GQ1(d18:1_18:0)-2H | 1250.6206 | 1250.6333 | 10.0 |
| GM2 | GM 2 (d18:1_16:0)-H | 1354.7847 | 1354.7892 | 3.6 |
| Cell Line | Description | Sphingolipids | Abbreviation | %Relative Abundance |
|---|---|---|---|---|
| CRL-1620 | Established from tumor tissue of a glioblastoma patient [28]. | Ceramide | Cer | 50.0 ± 0.5 |
| Ceramides phosphate | CerP | 49.3 ± 0.8 | ||
| Disialoganglioside-GD2 | GD2 | 0.37 ± 0.08 | ||
| Monosialoganglioside-GM2 | GM2 | 0.20 ± 0.05 | ||
| Monosialoganglioside-GM3 | GM3 | 0.1 ± 0.2 | ||
| Monosialoganglioside-GM1 | GM1 | <0.10 ± 0.01 | ||
| Disialoganglioside-GD3 | GD3 | <0.10 ± 0.01 | ||
| Disialoganglioside-GD1 | GD1 | <0.10 ± 0.01 | ||
| PSN1 | Established from a pancreatic adenocarcinoma [29,30]. | Hexosylceramide | Hex1Cer | 41.00 ± 0.08 |
| Trisialoganglioside-GT2 | GT2 | 18.40 ± 0.05 | ||
| Trisialoganglioside-GT1 | GT1 | 15.70 ± 0.01 | ||
| Monosialoganglioside-GM1 | GM1 | 5.30 ± 0.01 | ||
| Monosialoganglioside-GM3 | GM3 | 4.400 ± 0.001 | ||
| Disialoganglioside-GD3 | GD3 | 4.00 ± 0.01 | ||
| Monosialoganglioside-GM2 | GM2 | 3.60 ± 0.01 | ||
| Disialoganglioside-GD1 | GD1 | 3.100 ± 0.001 | ||
| Trisialoganglioside-GT3 | GT3 | 2.90 ± 0.01 | ||
| Disialoganglioside-GD2 | GD2 | 1.00 ± 0.01 | ||
| Tetrasialoganglioside-GQ1c | GQ1c | 0.60 ± 0.01 | ||
| 231-BR | MDA-MD-231BR established from breast cancer [31]. | Monosialoganglioside-GM3 | GM3 | 58.1 ± 0.9 |
| Simple Glc series | CerG3GNAc2 | 33.6 ± 0.8 | ||
| Disialoganglioside-GD2 | GD2 | 4.90 ± 0.01 | ||
| Monosialoganglioside-GM1 | GM1 | 1.60 ± 0.09 | ||
| Monosialoganglioside-GM2 | GM2 | 0.40 ± 0.07 | ||
| Trisialoganglioside-GT2 | GT2 | 0.30 ± 0.01 | ||
| Hexosylceramide | Hex2Cer | 0.30 ± 0.02 | ||
| Hexosylceramide | Hex3Cer | 0.30 ± 0.01 | ||
| Ceramides phosphate | CerP | 0.30 ± 0.05 | ||
| Sulfatide | ST | 0.10 ± 0.01 | ||
| Disialoganglioside-GD1 | GD1 | <0.10 ± 0.01 | ||
| Trisialoganglioside-GT3 | GT3 | <0.10 ± 0.05 | ||
| Sphingosine-1-phosphate | SPHP | <0.10 ± 0.07 | ||
| Disialoganglioside-GD3 | GD3 | <0.10 ± 0.08 | ||
| COG-N-683 | Established at time of diagnosis from a neuroblastoma bone marrow metastasis [32,33]. | Ceramides phosphate | CerP | 28.2 ± 0.5 |
| Ceramide | Cer | 16.0 ± 0.9 | ||
| Hexosylceramide | Hex2Cer | 13.0 ± 0.6 | ||
| Disialoganglioside-GD2 | GD2 | 10.0 ± 0.2 | ||
| Disialoganglioside-GD3 | GD3 | 9.2 ± 0.2 | ||
| Hexosylceramide | Hex3Cer | 7.80 ± 0.05 | ||
| Disialoganglioside-GD1 | GD1 | 4.8 ± 0.8 | ||
| Hexosylceramide | Hex1Cer | 3.5 ± 0.8 | ||
| Monosialoganglioside-GM2 | GM2 | 2.00 ± 0.09 | ||
| Monosialoganglioside-GM1 | GM1 | 1.70 ± 0.08 | ||
| Trisialoganglioside-GT3 | GT3 | 1.40 ± 0.07 | ||
| Tetrasialoganglioside-GQ1c | GQ1c | 1.10 ± 0.03 | ||
| Simple Glc series | CerG2GNAc1 | 1.00 ± 0.09 | ||
| Monosialoganglioside-GM3 | GM3 | 0.30 ± 0.09 |
Disclaimer/Publisher’s Note: The statements, opinions and data contained in all publications are solely those of the individual author(s) and contributor(s) and not of MDPI and/or the editor(s). MDPI and/or the editor(s) disclaim responsibility for any injury to people or property resulting from any ideas, methods, instructions or products referred to in the content. |
© 2024 by the authors. Licensee MDPI, Basel, Switzerland. This article is an open access article distributed under the terms and conditions of the Creative Commons Attribution (CC BY) license (https://creativecommons.org/licenses/by/4.0/).
Share and Cite
Sanni, A.; Bennett, A.I.; Huang, Y.; Gidi, I.; Adeniyi, M.; Nwaiwu, J.; Kang, M.H.; Keyel, M.E.; Gao, C.; Reynolds, C.P.; et al. An Optimized Liquid Chromatography–Mass Spectrometry Method for Ganglioside Analysis in Cell Lines. Cells 2024, 13, 1640. https://doi.org/10.3390/cells13191640
Sanni A, Bennett AI, Huang Y, Gidi I, Adeniyi M, Nwaiwu J, Kang MH, Keyel ME, Gao C, Reynolds CP, et al. An Optimized Liquid Chromatography–Mass Spectrometry Method for Ganglioside Analysis in Cell Lines. Cells. 2024; 13(19):1640. https://doi.org/10.3390/cells13191640
Chicago/Turabian StyleSanni, Akeem, Andrew I. Bennett, Yifan Huang, Isabella Gidi, Moyinoluwa Adeniyi, Judith Nwaiwu, Min H. Kang, Michelle E. Keyel, ChongFeng Gao, C. Patrick Reynolds, and et al. 2024. "An Optimized Liquid Chromatography–Mass Spectrometry Method for Ganglioside Analysis in Cell Lines" Cells 13, no. 19: 1640. https://doi.org/10.3390/cells13191640