Article

Agonist-Induced Ca2+ Signaling in HEK-293-Derived Cells Expressing a Single IP3 Receptor Isoform

by
Ekaterina N. Kochkina
,
Elizaveta E. Kopylova
,
Olga A. Rogachevskaja
,
Nina P. Kovalenko
,
Natalia V. Kabanova
,
Polina D. Kotova
,
Marina F. Bystrova
and
Stanislav S. Kolesnikov
*
Institute of Cell Biophysics, Pushchino Scientific Center for Biological Research of the Russian Academy of Sciences, 3 Institutskaya Street, 142290 Pushchino, Russia
*
Author to whom correspondence should be addressed.
Cells 2024, 13(7), 562; https://doi.org/10.3390/cells13070562
Submission received: 7 September 2023 / Revised: 13 March 2024 / Accepted: 18 March 2024 / Published: 22 March 2024

Abstract

:
In mammals, three genes encode IP3 receptors (IP3Rs), which are involved in agonist-induced Ca2+ signaling in cells of apparently all types. Using the CRISPR/Cas9 approach for disruption of two out of three IP3R genes in HEK-293 cells, we generated three monoclonal cell lines, IP3R1-HEK, IP3R2-HEK, and IP3R3-HEK, with the single functional isoform, IP3R1, IP3R2, and IP3R3, respectively. All engineered cells responded to ACh with Ca2+ transients in an “all-or-nothing” manner, suggesting that each IP3R isotype was capable of mediating CICR. The sensitivity of cells to ACh strongly correlated with the affinity of IP3 binding to an IP3R isoform they expressed. Based on a mathematical model of intracellular Ca2+ signals induced by thapsigargin, a SERCA inhibitor, we developed an approach for estimating relative Ca2+ permeability of Ca2+ store and showed that all three IP3R isoforms contributed to Ca2+ leakage from ER. The relative Ca2+ permeabilities of Ca2+ stores in IP3R1-HEK, IP3R2-HEK, and IP3R3-HEK cells were evaluated as 1:1.75:0.45. Using the genetically encoded sensor R-CEPIA1er for monitoring Ca2+ signals in ER, engineered cells were ranged by resting levels of stored Ca2+ as IP3R3-HEK ≥ IP3R1-HEK > IP3R2-HEK. The developed cell lines could be helpful for further assaying activity, regulation, and pharmacology of individual IP3R isoforms.

1. Introduction

Extracellular cues regulate diverse cellular functions by involving a variety of surface receptors and intracellular signaling pathways. The mobilization of intracellular Ca2+ is central to transduction of many first messengers that act through G-protein-coupled receptors (GPCRs) and receptor tyrosine kinases (RTKs) coupled to the phosphoinositide cascade [1,2,3]. GPCRs stimulate the phosphoinositide cascade by involving the β1–4 isoforms of phospholipase C (PLC) in a αGq- and/or βγGi-dependent manner, while RTKs employ PLCγ [2,3,4,5,6]. Once stimulated, PLC produces two second messengers, IP3 and diacylglycerol, by hydrolyzing the precursor lipid phosphatidylinositol 4,5-bisphosphate. The primary mode of action of IP3 is to release Ca2+ from Ca2+ store through IP3 receptors (IP3Rs) [1,3]. Three genes encode IP3R subunits IP3R1, IP3R2, and IP3R3, which form primarily homotetrameric IP3-gated Ca2+ channels in the endoplasmic reticulum (ER). Moreover, evidence exists that different IP3R subunits also can form heterotetrameric complexes with specific functional and regulatory properties [3,7,8,9,10]. This and alternative splicing of the IP3R genes increase the functional heterogeneity of IP3-gated channels, posing an additional complexity to studying physiological functions and regulations of IP3Rs in cells [11,12].
Most cell types express two or even all three IP3R genes [12], implying that any particular IP3R subtype cannot cover the reported diversity of intracellular IP3/Ca2+ signaling [1]. The expression pattern of IP3Rs is not uniform among different tissues and cell types, suggesting a specific role for individual IP3R isoforms or their combinations in cell physiology [12]. For instance, IP3R1 predominates in Purkinje neurons, cardiac myocytes rely largely on IP3R2, and insulin-secreting β-cells, taste cells, and vomeronasal sensory neurons express primarily IP3R3 [13,14,15,16,17].
Since agonist-induced IP3/Ca2+ signaling is pivotal to the physiology of apparently all cell types, IP3Rs were subjected to intensive studies at molecular, biophysical, and functional levels [1,3,9,10,18]. Reportedly, all IP3R isoforms are regulated by cytosolic Ca2+ in a bimodal manner, suggesting that IP3Rs hold two allosteric Ca2+-binding sites, both activatory and inhibitory [1,3,19,20]. Although the activatory site has been identified, the structure and location of the inhibitory site is still debatable [3]. Characteristic of IP3R regulation is that IP3 binding increases affinity of the activatory site, and its occupation by Ca2+ increases the open probability of the IP3-gated channel [19]. Owing to this interdependent regulation of IP3R gating by the primary co-agonists, Ca2+ ions released from the ER through IP3Rs can facilitate their activity. This positive feedback underlies Ca2+-induced Ca2+ release (CICR), the regenerative process that is ubiquitously involved in the generation of diverse Ca2+ signals [1,6]. Serving as a co-agonist at a relatively low level, cytosolic Ca2+ suppresses the activity of IP3Rs by occupying the inhibitory site at higher concentrations [1,3,19]. This multimodal control of IP3Rs by IP3 and Ca2+ is central to diverse modes of intracellular Ca2+ signaling [1,20].
Although IP3R1, IP3R2, and IP3R3 share 60–80% homology at the amino acid level, they are dissimilar in sensitivity towards the primary agonists IP3 and Ca2+ and differ in their regulatory mechanisms [9,10,11,12,18]. Multiple intracellular regulators, from small molecules to proteins, have been reported to control IP3R activity in an isoform-specific manner and depending on intracellular context. The list of regulators includes ATP [21], cAMP [22], NADH [23], H+ [24], calmodulin, and several other Ca2+-binding proteins [18,25], as well as the IP3R binding proteins IRBIT and IRAG [26,27]. A variety of protein kinases and phosphatases is also involved in the regulation of IP3Rs [10,18,28].
Previously, we studied Ca2+ signaling induced by GPCR agonists, including ATP, UTP, adenosine, ACh, 5-HT, and glutamate, in cells of diverse types [29,30,31,32]. The assayed cells universally responded to Ca2+-mobilizing agonists in an “all-or-nothing” manner: They either were irresponsive to a particular agonist at subthreshold concentrations or generated quite similar Ca2+ signals at different agonist doses above the threshold (see Figure 1 below). The body of evidence suggests that being a trigger-like self-driven process, CICR finalized agonist transduction by forming cellular responses of a virtually universal shape, regardless of agonist doses [31]. Given that assayed cells express multiple IP3R isoforms, it remains unclear whether the “all-or-nothing” responsiveness is mediated by a specific IP3R subtype or whether each IP3R isoform can endow agonist-induced Ca2+ signaling in cells with this feature.
As demonstrated in previous studies, a cell line expressing a particular IP3R isotype represents a promising cellular model for the systematic assay of gating, regulation, pharmacology, and physiology of IP3R isoforms [33,34,35,36,37,38,39]. Here, we generated several such cell lines by inactivating two out of three IP3R genes in HEK-293 cells using the CRISPR/Cas9 approach. Different aspects of intracellular Ca2+ signaling in these cells were analyzed with Ca2+ imaging. It was particularly shown that the engineered cells responded to ACh in the “all-or-nothing” manner and that the ACh sensitivity of a given cellular subclone strongly correlated with EC50 for IP3 characteristic of an IP3R isoform it expressed. A mathematical model of intracellular Ca2+ signals induced by thapsigargin, a SERCA inhibitor, was proposed, based on which we developed an approach for estimating relative Ca2+ permeability of Ca2+ store. Altogether, our results suggest that the engineered cell lines could provide a relatively simple and effective assay of activity, regulation, and pharmacology of individual IP3R isoforms.

2. Materials and Methods

2.1. Cell Culture and Transfection

WT-HEK cells and their derivatives were routinely cultured in Dulbecco’s modified Eagle’s medium (DMEM) (Corning, NY, USA) containing 10% (v/v) fetal bovine serum (Cytiva, Marlborough, MA, USA) and the antibiotic gentamicin (100 μg/mL) (Corning, NY, USA) on 12-well culture plates. Cells were grown in a humidified atmosphere containing 5% CO2 at 37 °C.
To induce transient expression of genetically encoded Ca2+ sensor R-CEPIA1er with reticular location, cells were transfected with the plasmid vector pCMV R-CEPIA1er kindly provided by Masamitsu Iino (Addgene plasmid # 58216; http://n2t.net/addgene:58216, accessed on 1 October 2019; RRID:Addgene_58216) [40]. Before the day of transfection, 3–5 × 10⁵ cells were placed in the well of 12-well culture plates. For the transfection of cultured cells, the growth medium was replaced with the transfection mixture, containing 800 μL of the growth medium as well as 200 μL OptiMEM media, 2 μL P3000 Reagent, 2 μL Lipofectamine 3000 (all from Invitrogen, Waltham, MA, USA), and 2 μg pCMV R-CEPIA1er. After 24 h of incubation, the transfection mixture was replaced with the normal culture medium. The transfection was considered effective if at least 30% of the transfected cells exhibited sufficient fluorescence in the red spectral range. Next, the transfected cells were subjected to selection in the presence of antibiotic G418 (700 μg/mL) (Corning) for two weeks. The survivor cells yielded a population, which was maintained in the presence of 300 μg/mL G-418, wherein a nearly 70% cell fraction stably expressed R-CEPIA1er.

2.2. Ca2+ Imaging and IP3 Uncaging

Isolated cells were plated on a photometric chamber (~150 μL), which contained a disposable coverslip (Menzel-Glaser, Braunschweig, Germany) with an attached ellipsoidal resin wall. The chamber bottom was coated with Cell-Tak (Corning, NY, USA), enabling strong cell adhesion. Attached cells were loaded with Fluo-8 at room temperature (23–25 °C) by adding Fluo-8 AM (3 μM) and Pluronic® F-127 (0.02%) (both from AAT Bioquest, Pleasanton, CA, USA) to the following bath solution (mM): 140 NaCl, 5 KCl, 2 CaCl2, 1 MgCl2, 10 HEPES-NaOH (pH 7.4), 10 glucose. After 30 min of incubation, the cells were rinsed several times with the bath solution and stored for 40 min to complete dye de-esterification. For IP3 uncaging, the cells were treated with 3 μM Fluo-8 AM + 4 μM caged-Ins(145)P3/PM (SiChem, Bremen, Germany) + 0.02% Pluronic as described above. When necessary, 2 mM CaCl2 in the bath were replaced with 0.5 mM EGTA + 0.4 mM CaCl2, thus reducing free Ca2+ to nearly 260 nM at 23 °C, as calculated with the Maxchelator program (http://maxchelator.stanford.edu, accessed on 1 October 2019). All used chemicals were applied with a gravity-driven perfusion system, which enabled the complete replacement of the bath solution in the photometric chamber for nearly 2 s. The used salts and buffers were from Sigma-Aldrich (St. Louis, MO, USA); the ACh and inhibitors were from Tocris Bioscience (Bristol, UK).
Experiments were carried out using an inverted fluorescent microscope Axiovert 135 equipped with an objective Plan NeoFluar 20×/0.75 (Zeiss, Oberkochen, Germany) and a digital ECCD camera LucaR (Andor Technology, Belfast, Northern Ireland). Apart from a transparent light illuminator, the microscope was equipped with a handmade system for epi-illumination via an objective. The epi-illumination was performed using a bifurcational glass fiber. One channel transmitted irradiation of computer-controlled LEDs, which provided sequential excitation of Fluo-8 or R-SEPIA1er at 480 ± 5 and 572 ± 17 nm, respectively. Their emission was collected at 535 ± 20 and 630 ± 30 nm, respectively. Serial fluorescent images were captured every second and analyzed using NIS-Elements software (version AR 5.30.01) (Nikon, Tokyo, Japan). Deviations of cytosolic and reticular Ca2+ in individual cells were quantified by a relative change in intensity of Fluo-8 and R-SEPIA1er fluorescence (ΔF/F0), respectively. Another channel was connected to a TECH-351 Advanced pulsed solid laser (680 mW) (Laser-Export, Moscow, Russia). This unit operated in a two-harmonic mode and generated not only 351 nm UV light used for Ca2+ uncaging but also visible light at 527 nm. The last could penetrate an emission channel through non-ideal optical filters and elicited optical artifacts during uncaging.

2.3. Generation of Cell Lines with Inactivated IP3R Genes

Two out of three IP3R genes in HEK-293 cells were inactivated sequentially using CRISPR/Cas9 technology. Firstly, three monoclonal cell lines were generated, HEK-∆IP3R1, HEK-∆IP3R2, and HEK-∆IP3R3, wherein IP3R1-, IP3R2-, and IP3R3 were disrupted, respectively. Next, by inactivating either of two remaining IP3R genes in these lines, IP3R1-HEK, IP3R2-HEK, and IP3R3-HEK cells were obtained with solely IP3R1, IP3R2, or IP3R3, respectively, to be functional. The used methods, protocols, and controls are sufficiently detailed in the Supplementary Materials.

2.3.1. Inactivation of IP3R1 Gene

The construct used for IP3R1 inactivation was engineered on the basis of the AIO-GFP vector that provided expression of Cas9-D10A nickase fused with the enhanced green fluorescent protein (EGFP) [41]. This vector was kindly provided by Steve Jackson (Addgene plasmid # 74119; http://n2t.net/addgene:74119, accessed on 30 March, 2017; RRID: Addgene_74119). The appropriate protospacer locus was identified using IP3R1 mRNA sequences (GenBank NM_001099952.4; NM_001168272.2; NM_001378452.1; NM_002222.7). Target-specific sgRNAs were designed and cloned into the AIO-GFP vector as described in the Supplementary Materials. The final cAIO-GFP-sgRNA construct was verified by sequencing. WT-HEK cells were transfected with cAIO-GFP-sgRNA using Lipofectamin 3000 (Invitrogen, Waltham, MA, USA). Seventy-two hours after transfection, EGFP-expressing cells were sorted using a FACSAria SORP sorter (BD Biosciences, NJ, USA) and grown as single cells. Once a particular cell monoclone achieved a monolayer, the cells were collected, their genomic DNA was isolated, and a gene fragment containing the target site was amplified using PCR with specific primers. Each amplicon was subjected to in vitro hydrolysis using commercial nuclease Cas9 and synthesized sgRNA to reveal induced mutations in the IP3R1 gene in a source clone. Finally, 4 cell clones (HEK-∆IP3R1) were found to contain necessary biallelic mutations inactivating the IP3R1 gene, which also were verified by sequencing. Due to exhibiting the highest fraction (~90%) of cells responsive to ACh with Ca2+ transients, one clone was chosen for future experimentations.

2.3.2. Inactivation of IP3R2 and IP3R3 Genes

The IP3R2 and IP3R3 genes were inactivated using the pGuide-it-tdTomato vector (Takara Bio, San Jose, CA, USA) that encoded nuclease Cas9 fused with the red fluorescent protein tdTomato. The appropriate protospacer locus was identified using the IP3R2/IP3R3 mRNA sequence (GenBank NM_002223.4/NM_002224.4). Target-specific sgRNA-IP3R2/IP3R3 was designed and cloned into the pGuide-it-tdTomato vector as described in the Supplementary Materials. After verification by sequencing, the final pGuide-it-tdTomato-sgRNA-IP3R2/IP3R3 construct was transfected into WT-HEK cells. In seventy-two hours, tdTomato-positive cells were collected using a FACSAria SORP sorter and then grown as single cells. Genomic DNA was isolated from a particular monoclone, and a gene fragment containing a target site was amplified using PCR with specific primers. Each amplicon was subjected to in vitro hydrolysis using commercial nuclease Cas9 and synthesized sgRNA to reveal mutations in the IP3R2/IP3R3 gene in cells of source clones. Overall, 3 HEK-∆IP3R2 and 4 HEK-∆IP3R3 clones were identified to contain inactivating indels in both alleles of the IP3R2 and IP3R3 genes, which were verified by sequencing. All these HEK-∆IP3R2/HEK-∆IP3R3 clones were assayed with Ca2+ imaging, and one exhibiting the highest fraction (~90%) of ACh-responsive cells was taken for future experimentations.

2.3.3. Generation of IP3R1-HEK, IP3R2-HEK, and IP3R3-HEK Lines

Cells expressing the only IP3R1 gene were generated by disrupting the IP3R2 gene in HEK-∆IP3R3 cells using the strategy described above. In a variety of HEK-∆IP3R3-derived subclones, solely one cell clone, IP3R1-HEK, was eventually identified to contain proper biallelic inactivating mutations in both IP3R2 and IP3R3 genes.
Cells, wherein solely IP3R2 or IP3R3 was functional, were generated by inactivating the IP3R3 or IP3R2 gene in HEK-∆IP3R1 cells, respectively. Single-cell clones of each type, IP3R2-HEK and IP3R3-HEK, were eventually obtained (see Supplementary Materials).

2.4. RT-PCR and RT-qPCR

For the expression analysis, total RNA was routinely isolated from a particular cell colony (~106 cells), using the Gen Elute Mammalian Total RNA Miniprep Kit (Sigma, St. Louis, MO, USA) according to the manufacturer’s protocol. Reverse transcription was performed using SuperScript IV VILO Master Mix (Thermo Fisher Scientific, Waltham, MA, USA). PCR amplification of the target sequences was performed using Phusion Hot Start II High-Fidelity DNA Polymerase (Thermo Fisher Scientific, Waltham, MA, USA) and gene-specific primers (Table S2). The primers were intron-spanning and designed to recognize transcript sequences of all known splice variants, should they be characteristic of an assayed gene. Different RNA transcription levels were quantified with the RT-qPCR approach using a real-time PCR instrument DTlight (DNA Technology, Protvino, Russia) and Maxima SYBR Green/ROX qPCR Master Mix (Thermo Fisher Scientific, Waltham, MA, USA). Amplifications were performed starting with a 3 min template denaturation step at 94 °C, followed by 45 cycles of denaturation at 94 °C for 20 s and combined primer annealing/extension at the gene specific primer temperature for 30 s (Table S2). All samples were amplified in triplicate and the mean was obtained for further calculations. Relative quantification of gene expression was calculated using the 2–ΔCt method and β-Actin gene as an endogenous reference.

2.5. Western Blot

Expression of a particular IP3R isoform in the WT-, IP3R1-, IP3R2-, and IP3R3-HEK cells was verified with the Western blot approach (Figure S11). In each case, cells (~107) were pelleted and directly transferred to 300 µL of 1x Laemmli buffer. Samples were incubated for 10 min at 95 °C, and each probe (20 µL) was applied on 4–15% BIS-TRIS gradient gel. Protein transfer was performed on 0.45 µM nitrocellulose membranes (BioRad Laboratories, Hercules, CA, USA) using the PowerBlotter semi-dry transfer system (BioRad Laboratories, Hercules, CA, USA). Membranes were probed with primary antibodies to IP3R1 (rabbit polyclonal antibodies against rat IP3R1 2732–2750 aa, Alomone Labs, Jerusalem Israel, Cat# ACC-019), type 2 (rabbit polyclonal antibodies against rat IP3R2 (2683–2696 aa, Alomone Labs, Jerusalem, Israel, Cat# ACC-116), or human IP3R3 (mouse monoclonal antibodies against 22–230 aa, BD Transduction Laboratories, NJ, USA, Cat# 610312). Next, probes were incubated with horseradish peroxidase-conjugated secondary antibodies Anti-Rabbit gG Peroxidase Conjugate (Sigma-Aldrich, St. Louis, MO, USA, Cat# A-9169) and Anti-Mouse IgG, IgA, and IgM Peroxidase Conjugate (IMTEC, Moscow, Russia, Cat# P-GAM Iss). Anti-actin was from United States Biological (Cat# A0760-40). Blots were imaged using iBright™ CL750 Imaging System (Thermo Fisher Scientific, Waltham, MA, USA) and enhanced chemiluminescent substrate SuperSignal™ West Pico PLUS Chemiluminescent Substrate (Thermo Fisher Scientific, Waltham, MA, Cat#34580).

3. Results

Reportedly, cells of the HEK-293 line endogenously express GPCRs of multiple types, including muscarinic, purinergic, chemokine, lysophospholipid, and protease receptors, many of which are coupled to the phosphoinositide cascade [42]. We therefore assayed the responsiveness of basic HEK-293 cells (WT-HEK) and their genetically modified offspring to a variety of GPCR agonists with Ca2+ imaging. Among agonists capable of mobilizing intracellular Ca2+, acetylcholine (ACh) was most effective in that it mobilized cytosolic Ca2+ in most (80–90%) of the assayed cells. So, cell responsiveness to ACh was predominantly analyzed in the experiments described below. WT-HEK cells that expressed all three IP3R isotypes (Figure S6) were subjected to gene editing using the CRISPR/Cas9 technology, and three monoclonal cell lines, each expressing a particular IP3R isoform, were generated (see Supplementary Materials). Here, we performed the comparative physiological analysis of Ca2+ signaling in WT-HEK cells as well as in cells of three lines, called IP3R1-HEK, IP3R2-HEK, and IP3R3-HEK, which functionally express solely IP3R1, IP3R2, and IP3R3, respectively.

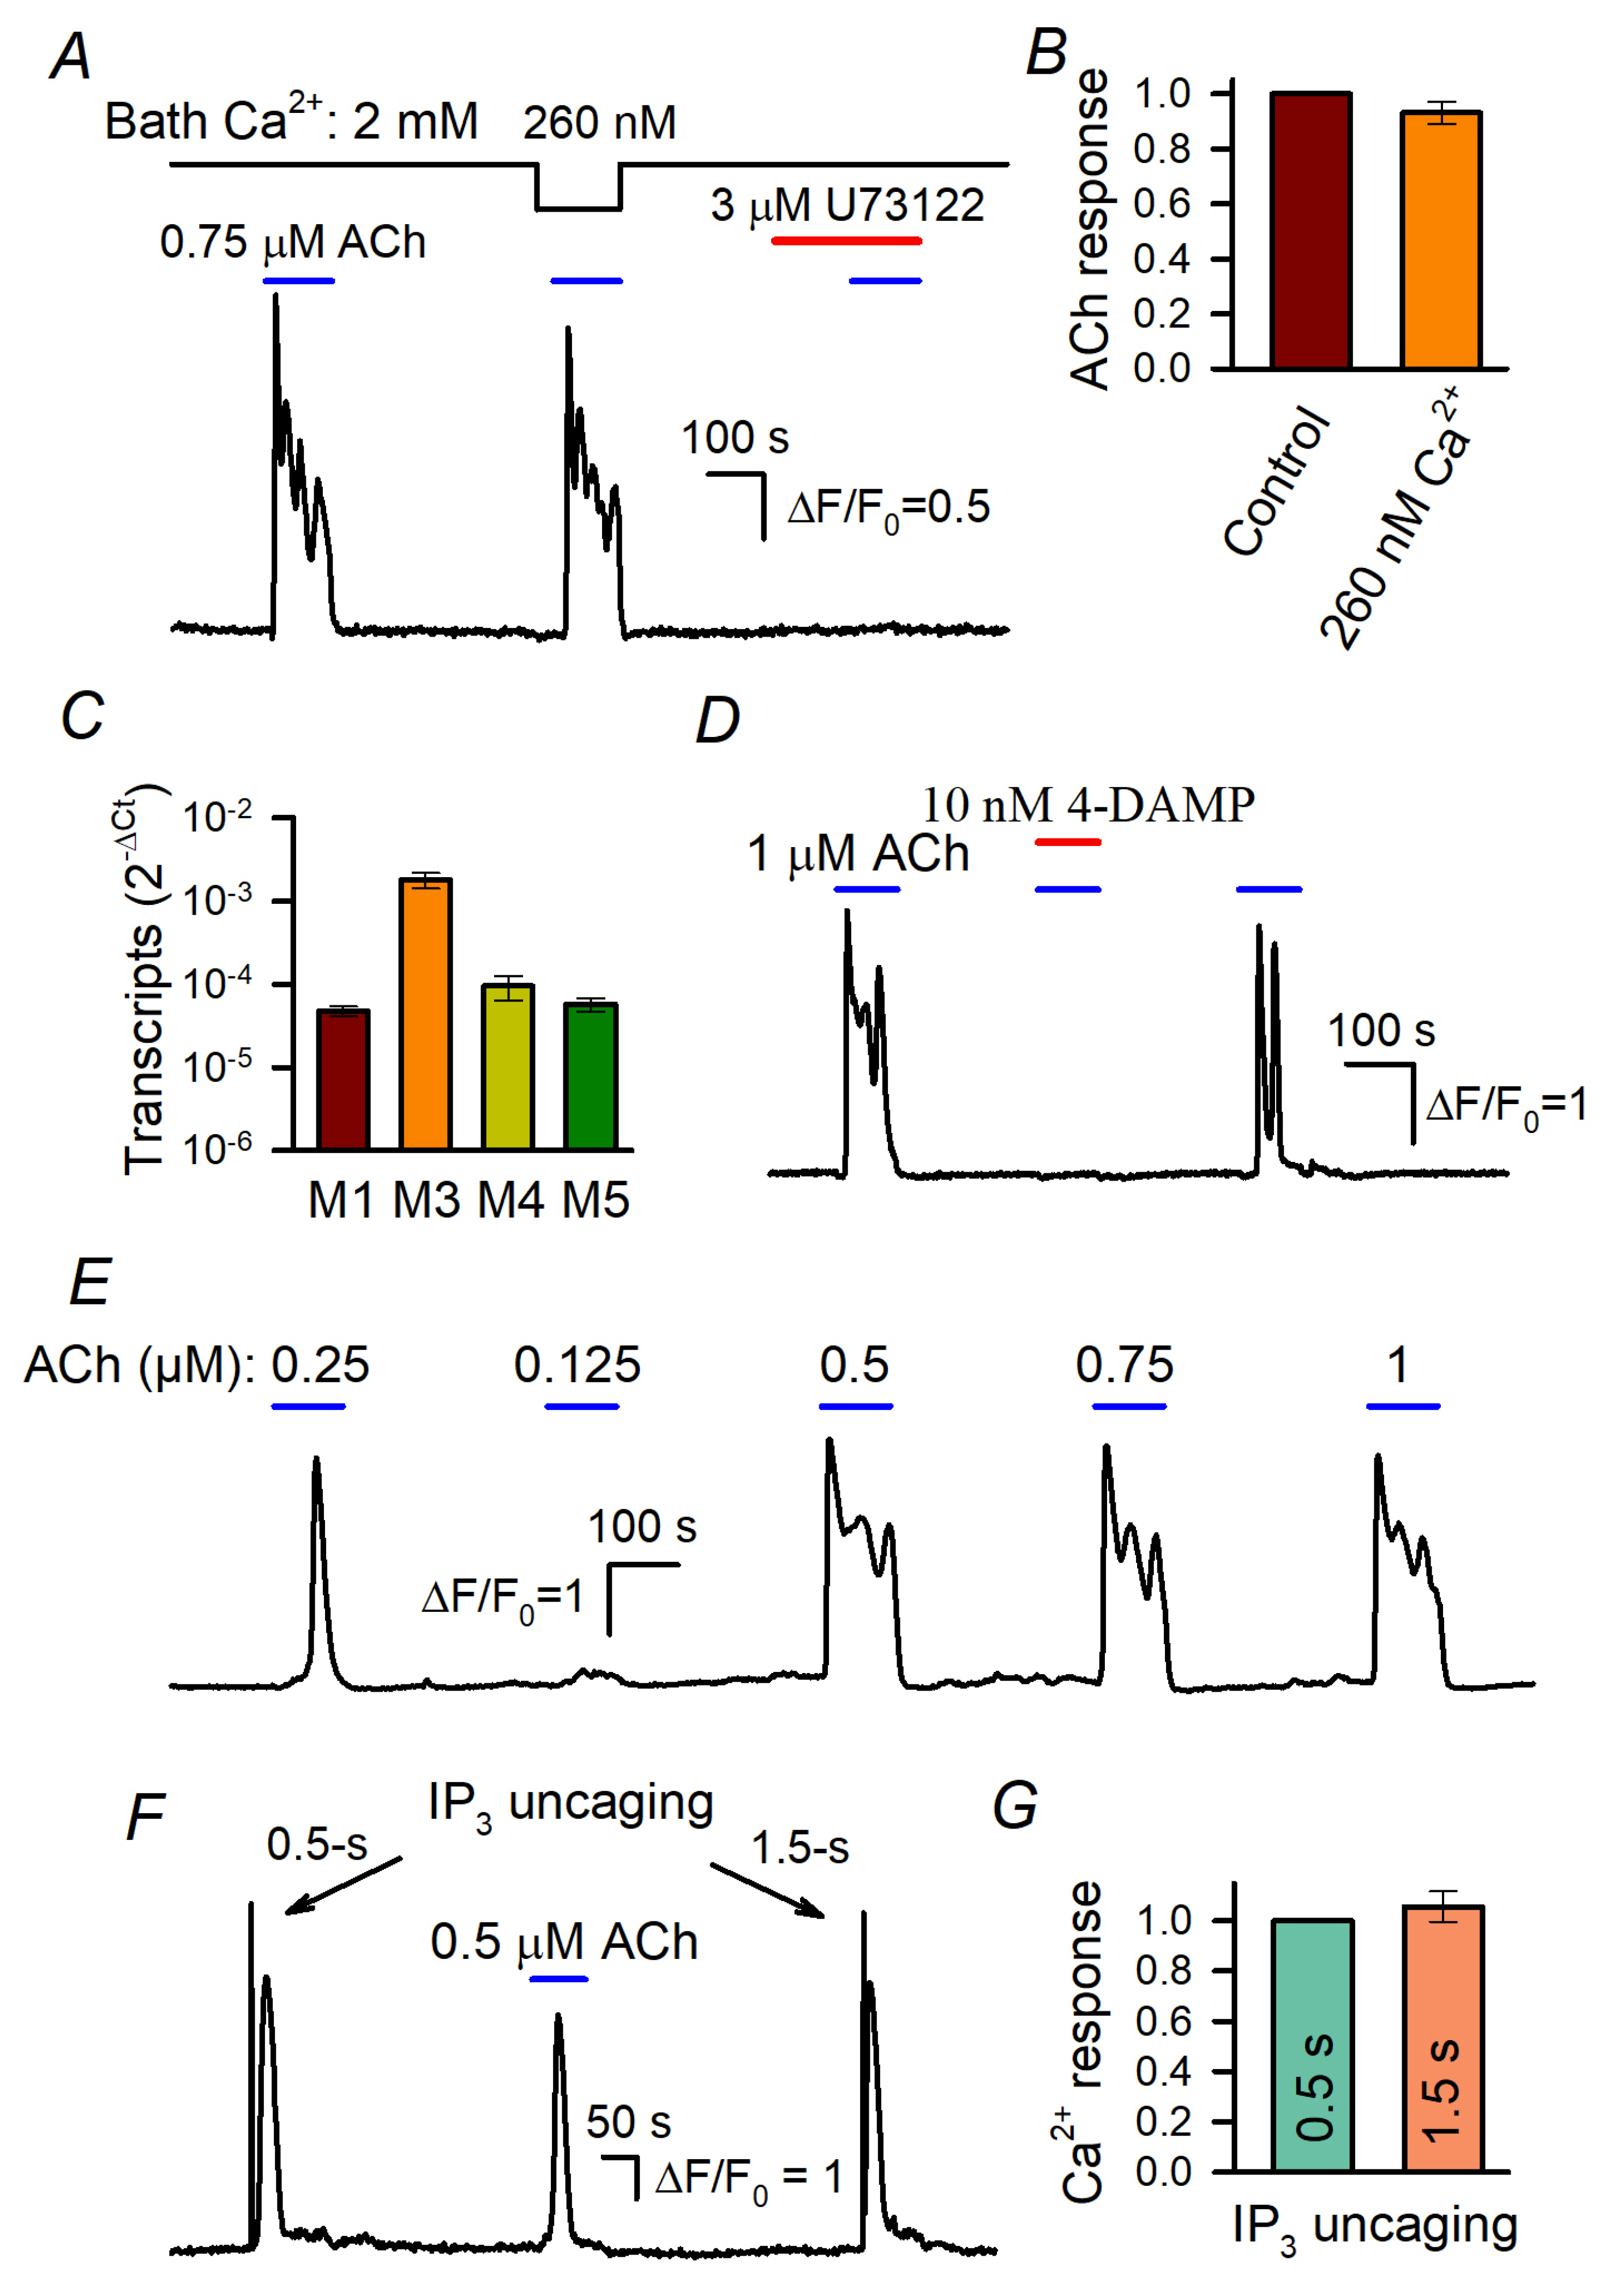
3.1. ACh Responses of WT-HEK Cells

In a particular experiment, 100–120 cells loaded with Fluo-8 were assayed simultaneously using Ca2+ imaging. When applied shortly, ACh elicited Ca2+ transients in WT-HEK (Figure 1A) and in cells of the derived lines (Figure 2A). In general, both Ca2+ release from intracellular Ca2+ store and Ca2+ entry mediated by a variety of Ca2+-permeable channels contributed to agonist-induced mobilization of cytosolic Ca2+. Although to our knowledge, HEK-293 cells do not express nicotinic ACh receptors, receptor-operated channels and store-operated channels (SOCs), which serve in apparently all cell types [6], contributed to the ACh responses.
It turned out that the decrease in bath Ca2+ from 2 mM to 260 nM affected cellular responses to ACh insignificantly (Figure 1A,B), thus indicating that IP3-driven Ca2+ release was mostly responsible for ACh-induced Ca2+ signals. The rationale for the abovementioned Ca2+ protocol was that the complete removal of bath Ca2+ with EGTA initiated dramatic rundown of cell responsivity during prolonged recordings. On the other hand, cells tolerated the reduction in extracellular Ca2+ to 260 nM, which proportionally, i.e., by the four orders of magnitude, decreased Ca2+ influx, in fact nullifying its contribution. In addition, the inhibition of PLC with U73122 (3 μM) rendered cells irresponsive to ACh (Figure 1A). These findings indicate that ACh transduction involved primarily muscarinic receptors that were coupled by the phosphoinositide cascade to IP3-driveen Ca2+ release rather than to Ca2+ entry.
The previous transcriptome analysis suggests that the M3-receptor was the predominant muscarinic isoform expressed in WT-HEK [42]. We confirmed this finding and also evaluated the M3 transcripts to be much more abundant compared to the other M-receptors (M1, M4, and M5) expressed in WT-HEK cells (Figure 1C and Figure S7). Consistently, ACh responses completely disappeared in the presence of 10 nM 4-DAMP (Figure 1C), an antagonist specific to the human M3 and M5 receptors [43].
The peculiar feature of ACh responses was their dose dependence. At concentrations below the threshold of 150–200 nM, ACh insignificantly affected intracellular Ca2+ in WT-HEK cells but the agonist elicited Ca2+ transients of similar magnitudes at a variety of higher doses (Figure 1E). This “all-or-nothing” fashion was also characteristic of agonist-induced Ca2+ responses in cells of several other types [29,30,31,32]. Such a step-like dose dependence should be intrinsic to agonist transduction that involves CICR, the mechanism capable of producing a large and global Ca2+ signal of universal shape, regardless of agonist concentrations [31]. The involvement of IP3R-mediated CICR in the generation of ACh responses (Figure 1E) was verified by the observation that 0.5 s and 1.5 s UV pulses elicited ACh response-like Ca2+ transients that were similar kinetically and by magnitude (Figure 1F,G), although the former should have uncaged a nearly three times smaller amount of IP3.

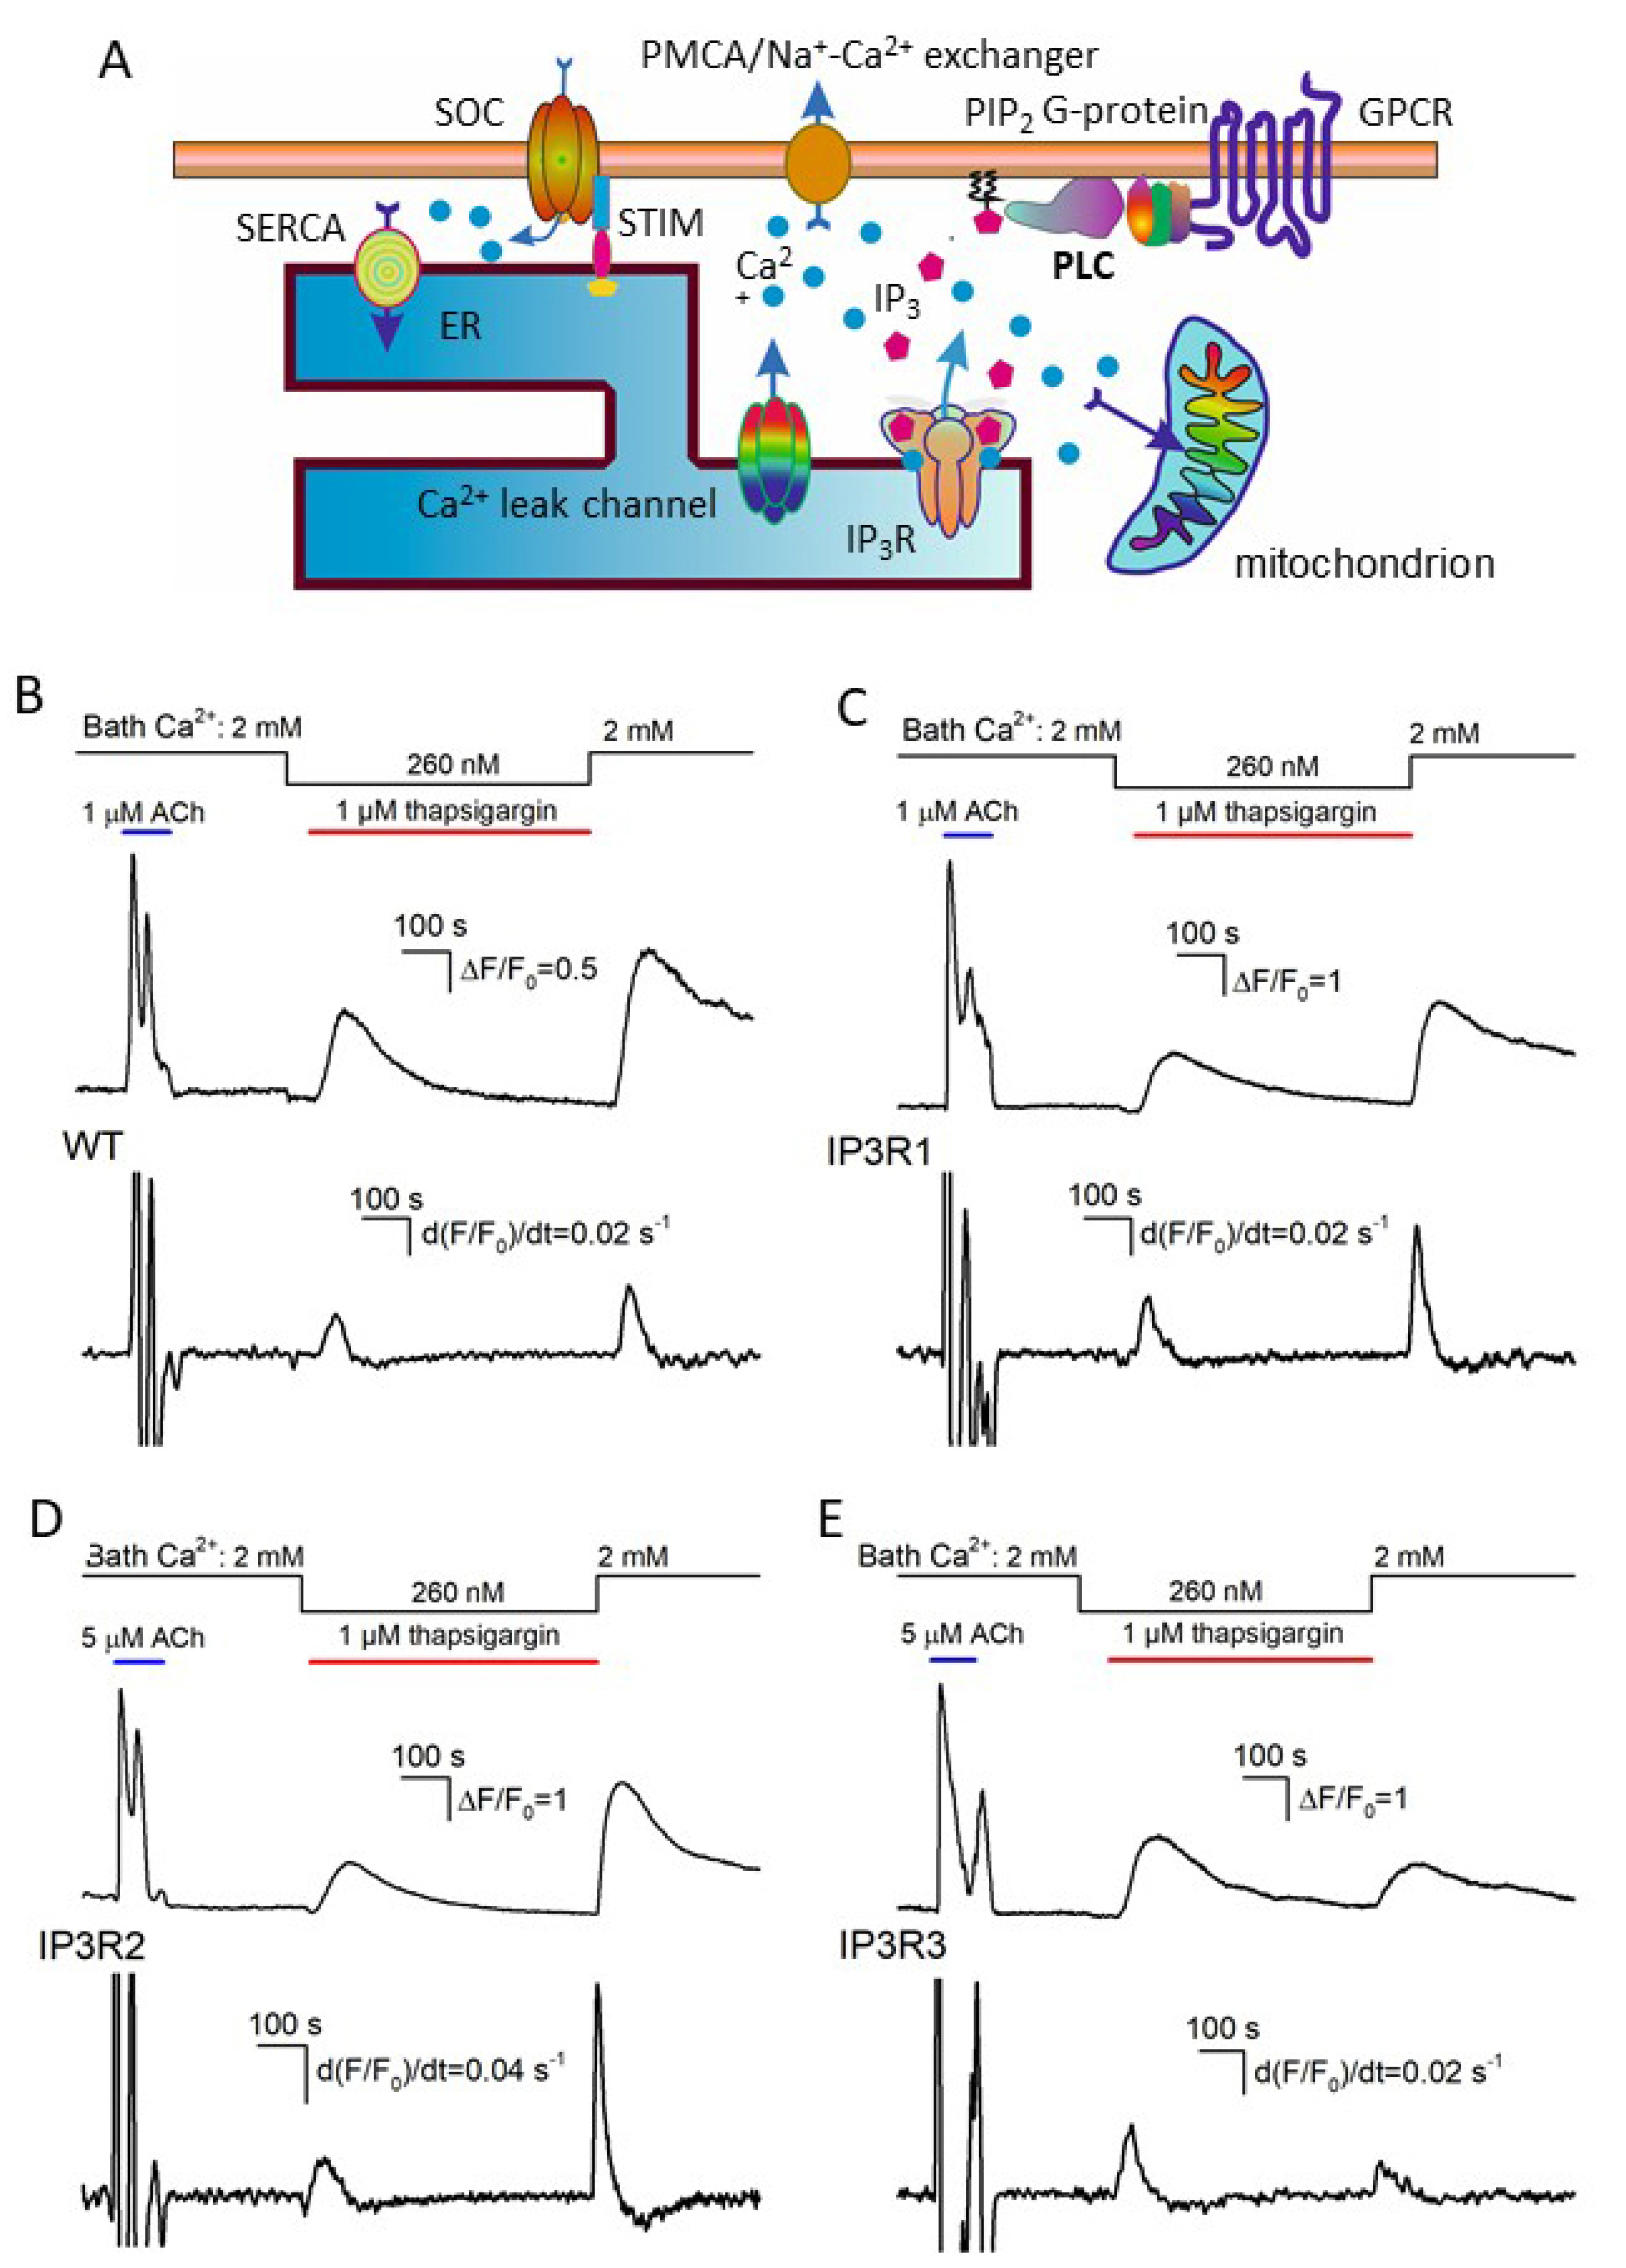
3.2. Responses of IP3R1-, IP3R2-, and IP3R3-HEK Cells to ACh

In designated experiments, we assayed IP3R1-HEK-, IP3R2-HEK-, and IP3R3-HEK cells and found that irrespective of the line, most (~90%) of them responded to brief ACh pulses with Ca2+ transients (Figure 2A). Similar to WT-HEK cells (Figure 1E), cells of each particular line responded to the agonist in an “all-or-nothing” manner (Figure 2A). Being associated with CICR (Figure 1F), the “all-or-nothing” responsivity of IP3R1-HEK-, IP3R2-HEK-, and IP3R3-HEK cells was consistent with the idea that each IP3R isoform was capable of mediating CICR [44,45]. Given the nearly step-like responsiveness of individual cells (Figure 1E and Figure 2A), their sensitivity to ACh could not be characterized by Ca2+ response magnitude. As an alternative dose dependence, each assayed population was evaluated by a fraction of cells responsive to the agonist at a particular concentration. After being averaged over all the experiments (n = 7–11) (Figure 2B, symbols), the data were fitted using the nonlinear regression approach and the Hill equation (Figure 2B, continuous lines):
F C = F 0 C n C 0.5 n + C n
where F(C) is the fraction of responsive cells at the given ACh concentration C, F0 is the maximal fraction of ACh responsive cells, C0.5 is the EC50 dose, and n is the Hill coefficient. Based on this approximation, EC50 for WT-, IP3R1-, IP3R2-, and IP3R3-HEK cells were estimated as 0.16 ± 0.006, 0.21 ± 0.007, 0.41 ± 0.013, and 1.01 ± 0.05 μM, respectively. Thus, by sensitivity to ACh, the assayed cell lines were ranked as WT-HEK ≈ IP3R2-HEK > IP3R1-HEK > IP3R3-HEK.
Consistent with our previous studies of agonist-induced Ca2+ signaling [30,31], cells of all assayed lines responded to ACh with evident delay relative to the moment of agonist application, depending on the dose of the agonist (Figure 2C). We determined the characteristic time of the response lag (τd) as a time interval necessary for a Ca2+ transient to reach the half magnitude (Figure 2C). The common feature of response lags was that τd markedly decreased with increasing agonist concentration (Figure 2C,D) in a cell-line-specific manner (Figure 2D). Being similarly sensitive to ACh (Figure 2B), WT-HEK and IP3R2-HEK cells showed quite similar dependencies of response lag on ACh concentration (Figure 2B). In the case of IP3R1-HEK and IP3R3-HEK cells, response lag versus ACh dose was shifted to the right (Figure 2D), consistent with lower sensitivities of both lines to ACh (Figure 2B).
Note that recently, we developed a mathematical model of agonist-induced Ca2+ signaling, which properly simulated cell responsivity of the “all-or-nothing” type [31]. This model predicted that for the phosphoinositide cascade with IP3R as the only type, its affinity to IP3 should be a key factor that determines the lag of Ca2+ responses. Note that based on their affinity to IP3, different IP3R isoforms follow the sequence IP3R2 > IP3R1 > IP3R3 [10,45,46,47]. It is therefore likely that only sensitivity of the particular IP3R isoform to IP3 determines the dose–response curve characteristic of the cell line wherein it is expressed (Figure 2B).

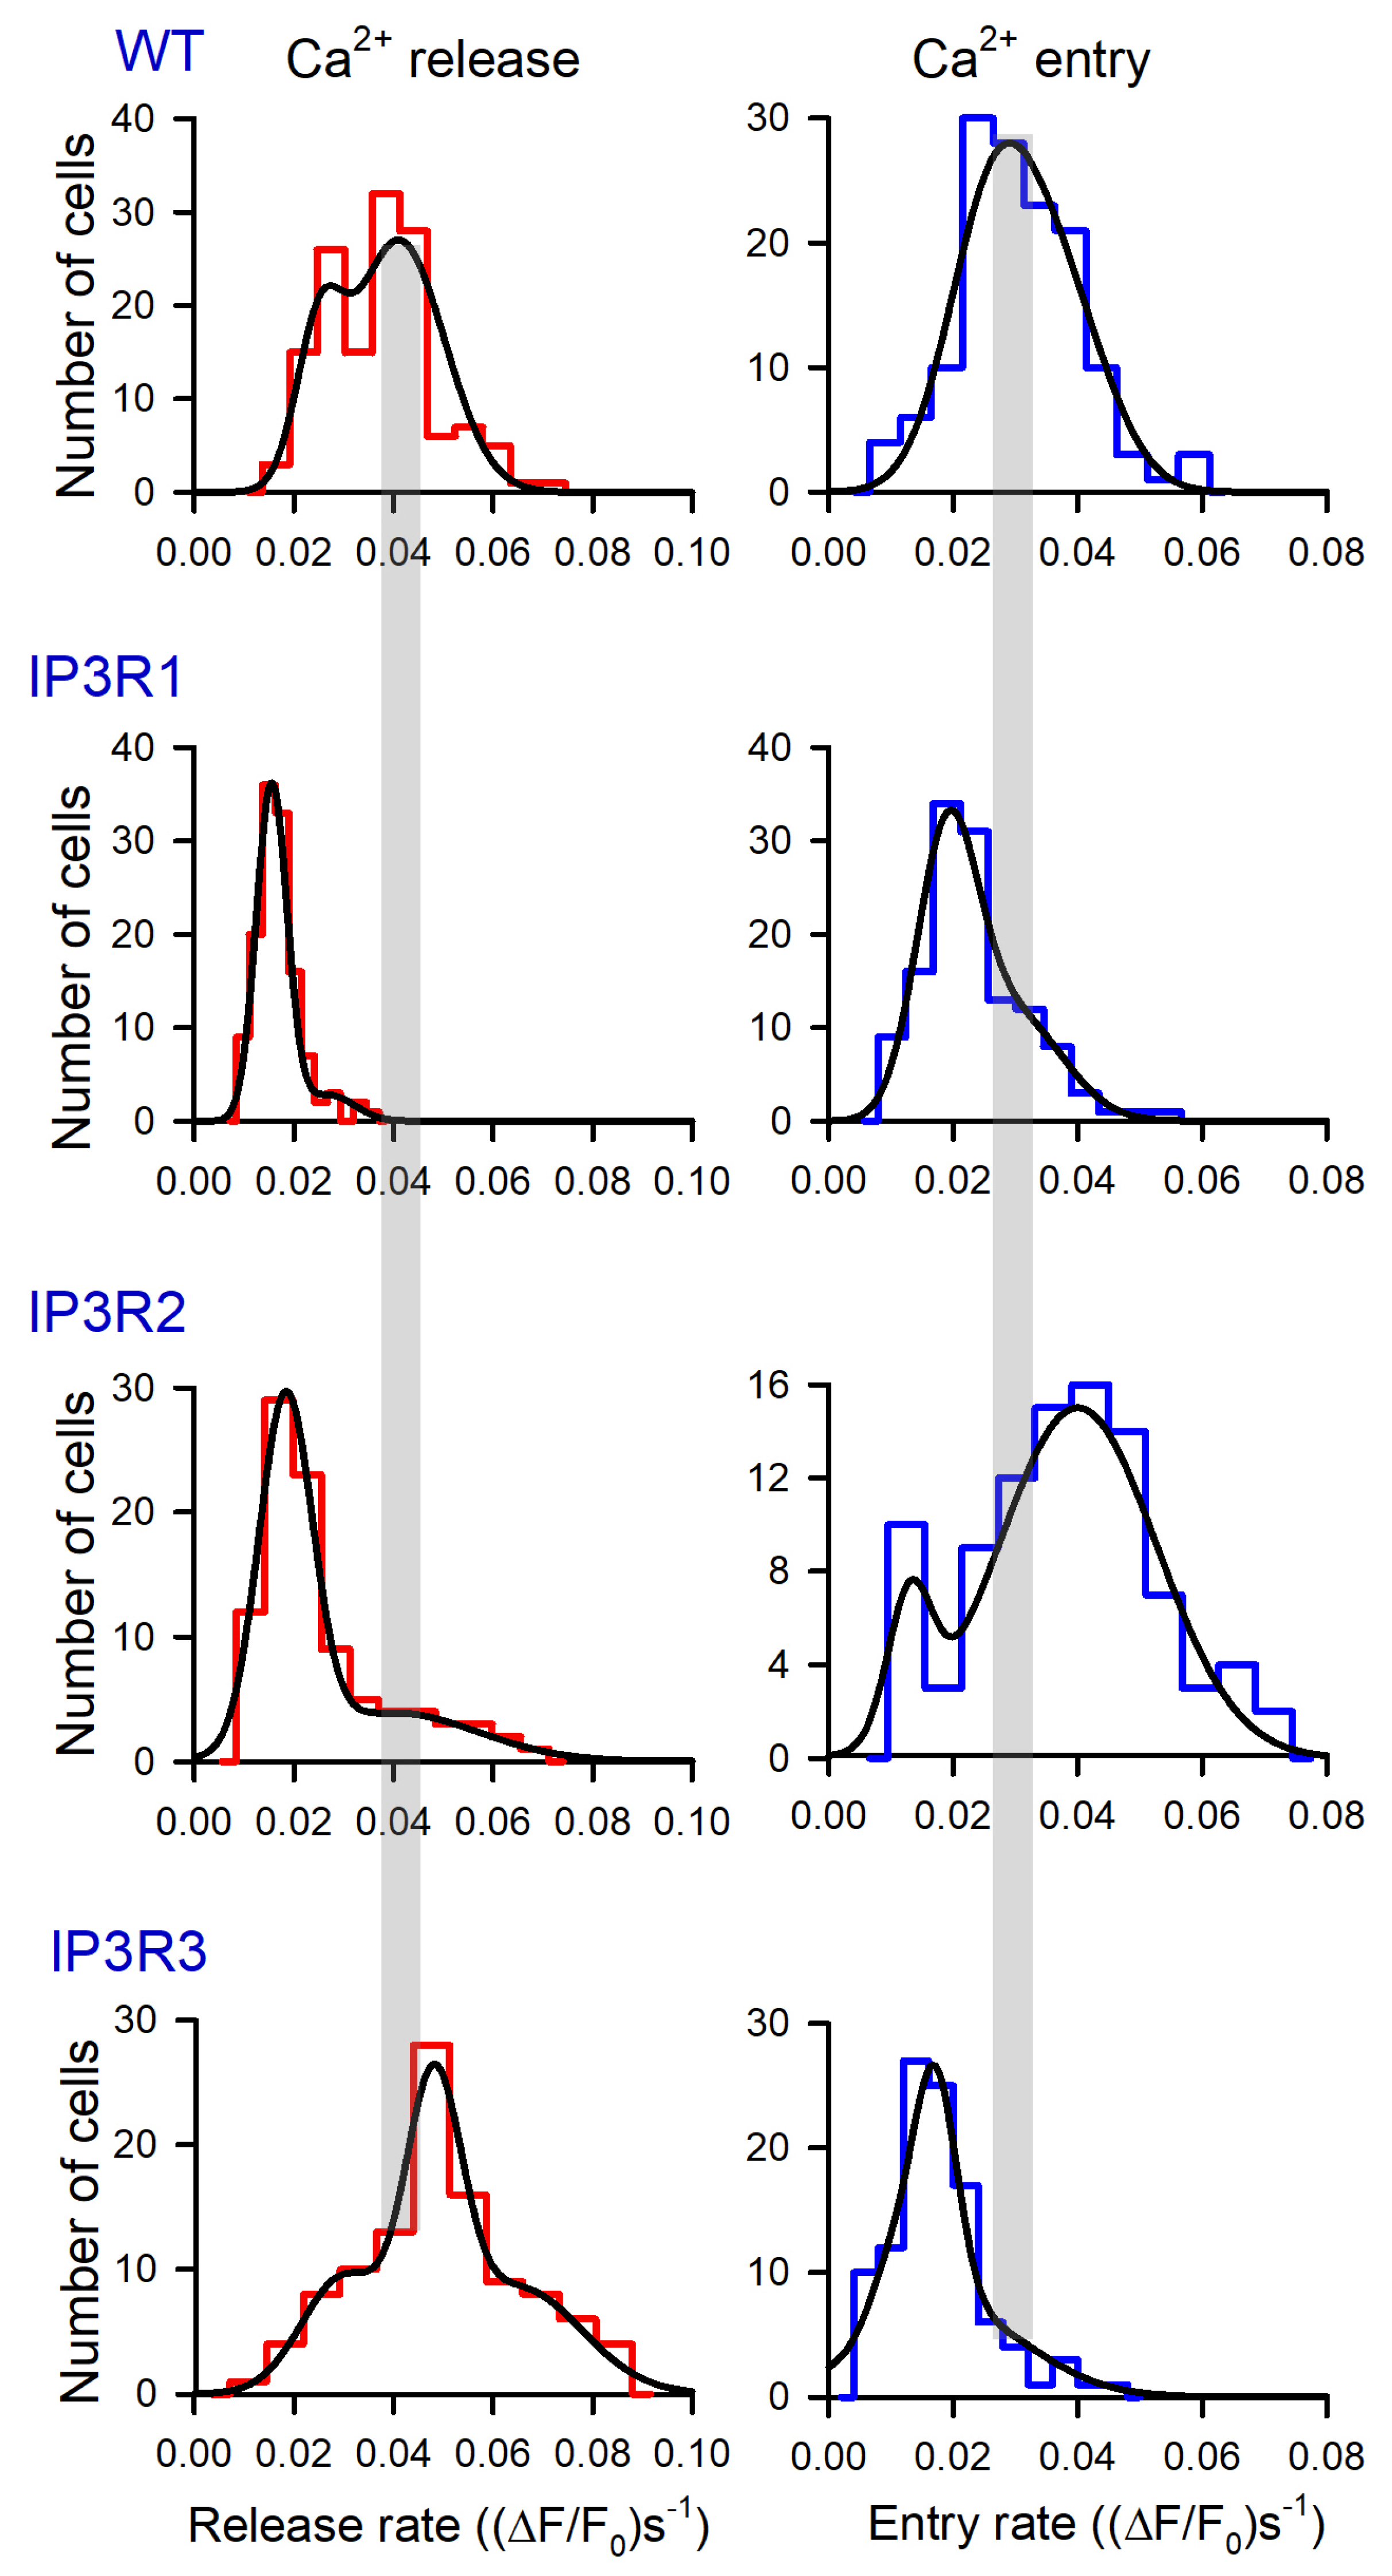
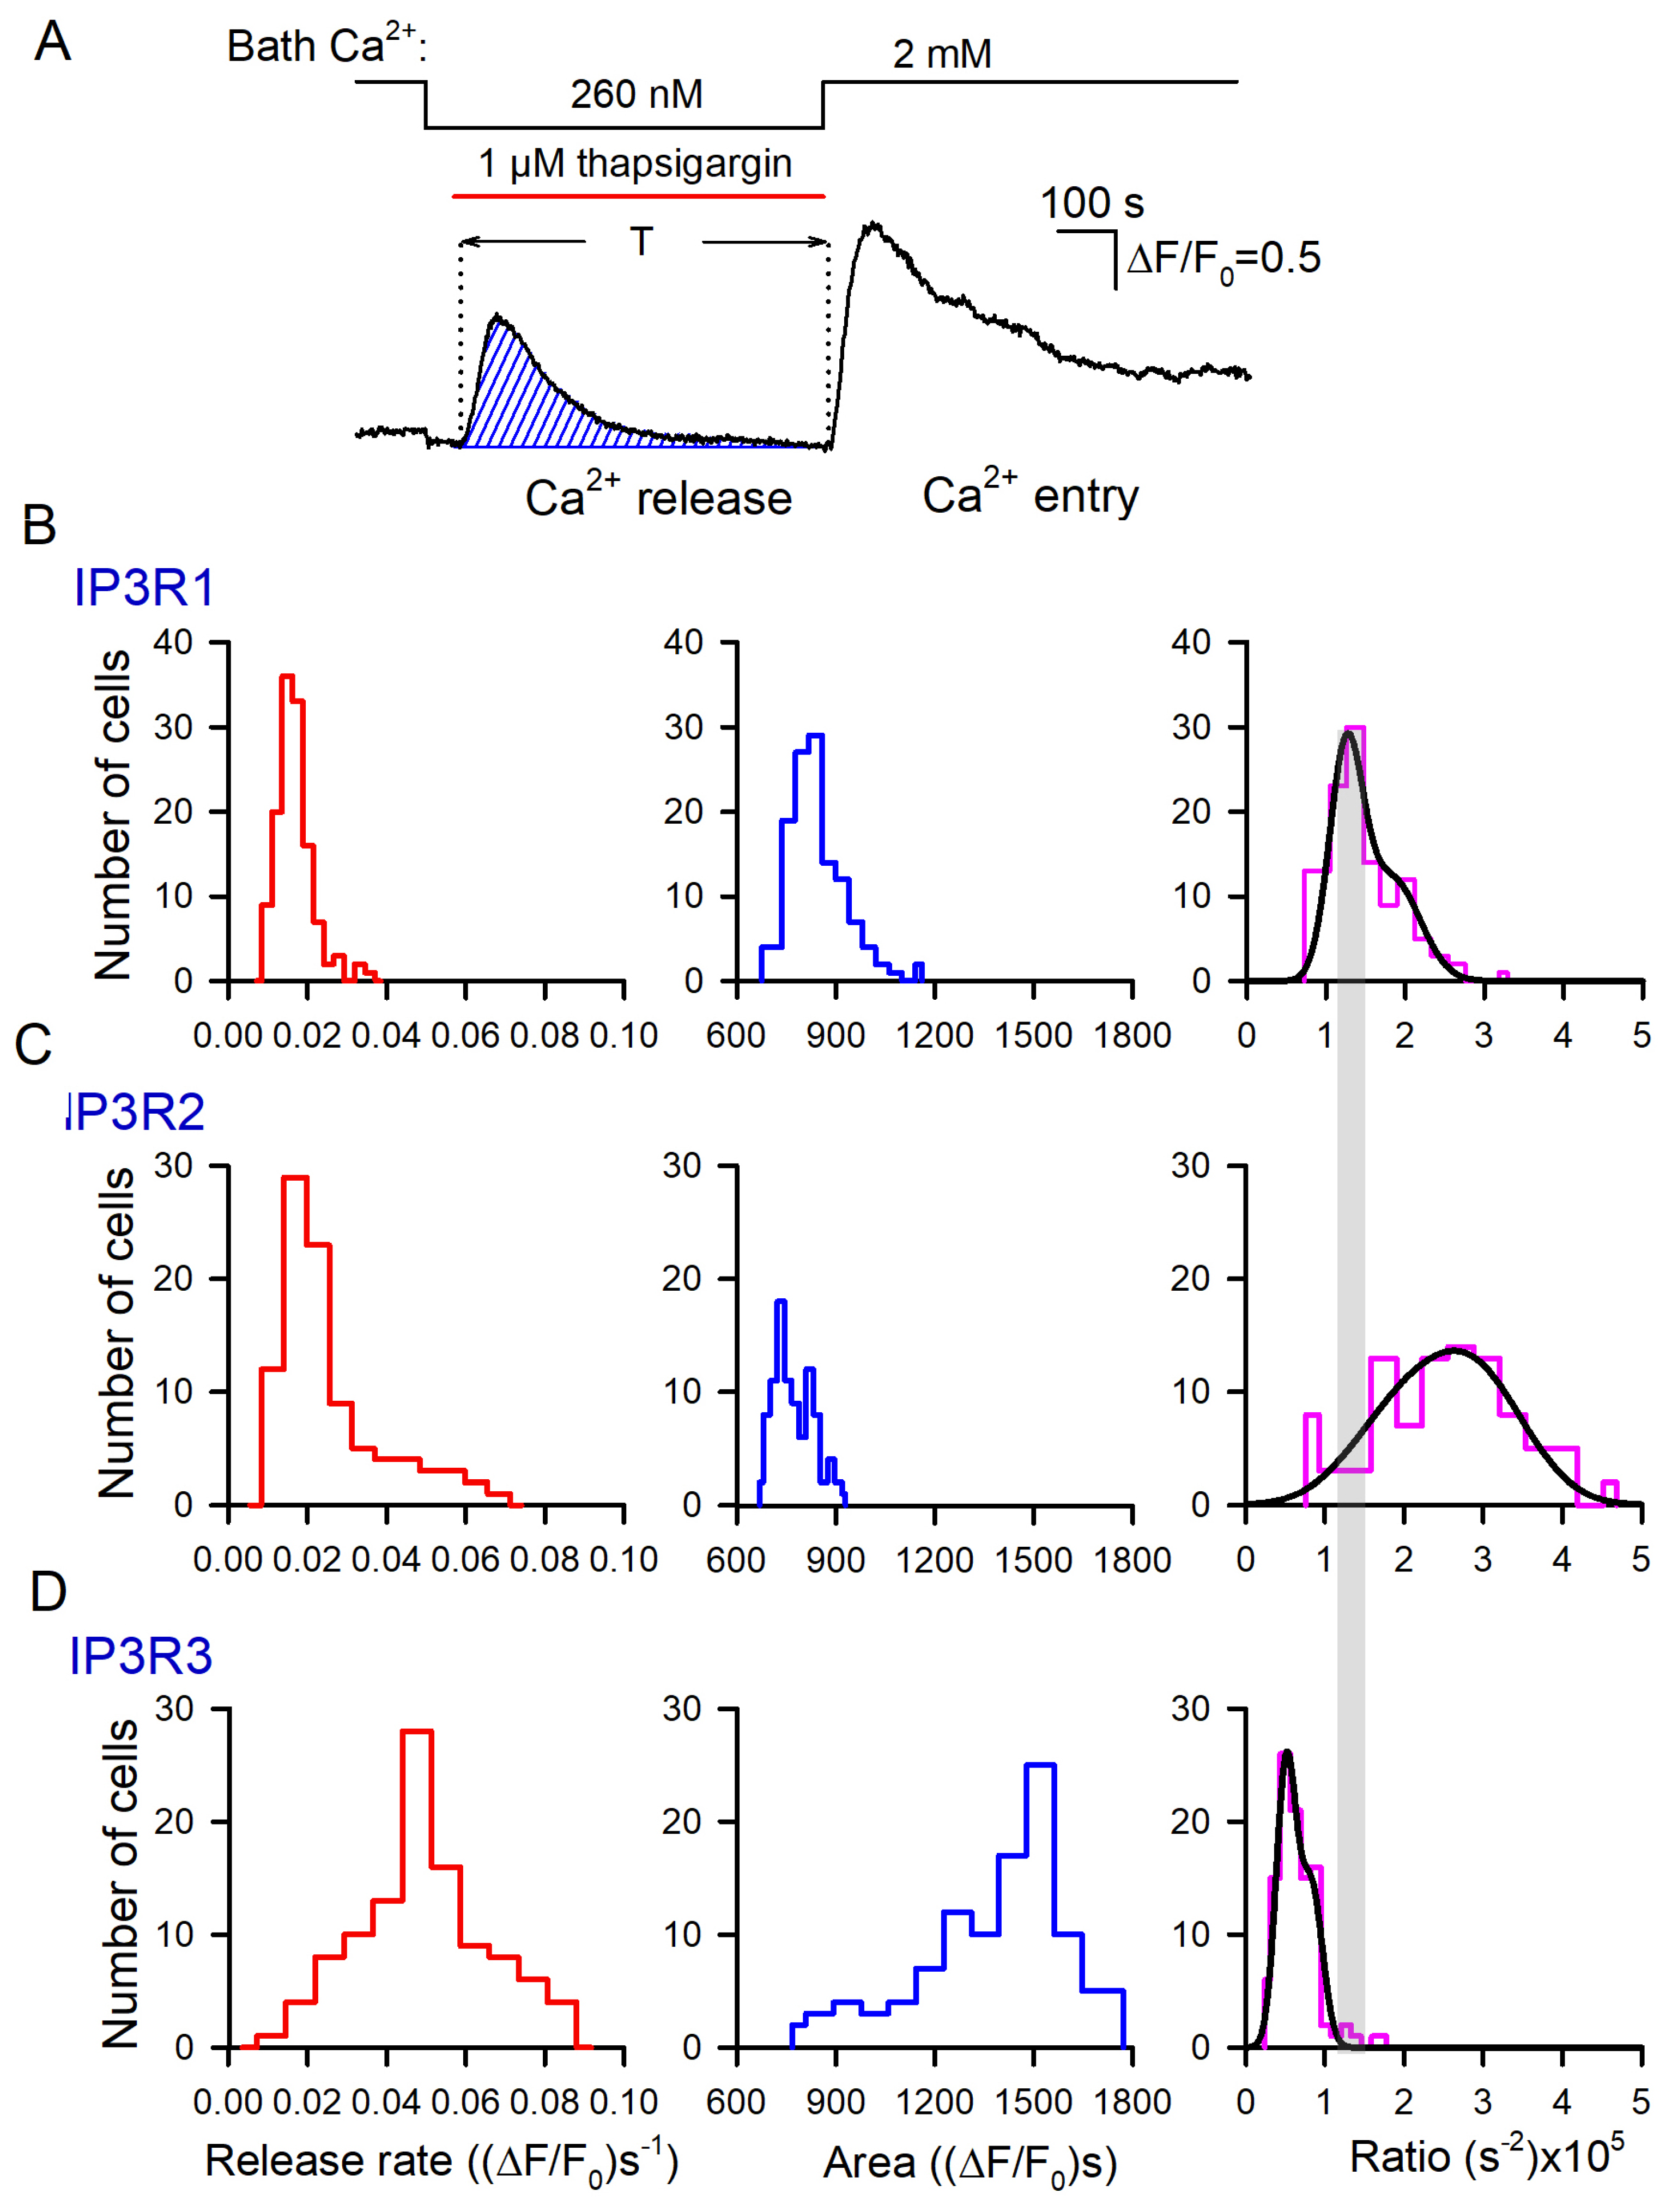
3.3. Thapsigargin Test of WT-, IP3R1-, IP3R2-, and IP3R3-HEK Cells

Several Ca2+-transporting systems are universally involved in Ca2+ homeostasis in resting and stimulated cells [46,47]. To interpret the experiments described below, we employed a simplified model of Ca2+ homeostasis in assayed cells (Figure 3A). It was suggested that a level of cytosolic Ca2+ was mainly determined by Ca2+ fluxes through the plasmalemma and ER membrane, although Ca2+-accumulating organelles, such as mitochondria, also could shape Ca2+ signals. As suggested in Figure 3A, IP3Rs, Ca2+ leak channels, and Ca2+-ATPase SERCA were pivotal players in ER, while SOCs, the Na+/Ca2+ exchanger, and Ca2+-ATPase PMCA mediated Ca2+ fluxes through the plasma membrane.
The inhibition of SERCA with thapsigargin is conventionally used to empty Ca2+ store through spontaneous Ca2+ release, thus initiating store-operated Ca2+ entry (SOCE) in unstimulated cells. We employed the classical thapsigargin test to clarify whether resting activity of IP3Rs was a factor of Ca2+ leakage from ER in assayed cells. In a typical experiment, cells were initially stimulated with 1 μM ACh, and Ca2+ homeostasis in a given cell was considered sufficiently robust if its Ca2+ response to the agonist was fast and exceeded 2 in terms of ΔF/F0 (Figure 3B–E, upper traces). Next, cells were treated with 1 μM thapsigargin with 260 nM Ca2+ in the bath that nullified a contribution of Ca2+ entry to intracellular Ca2+ signals. Under these conditions, thapsigargin-elicited Ca2+ transients were produced by Ca2+ leakage from ER, which emptied Ca2+ store and stimulated activity of SOCs, albeit SOCE was not evident at low bath Ca2+. Thapsigargin was applied for 600 s, which was a sufficient interval for intracellular Ca2+ to return apparently to the initial level. The restoration of bath Ca2+ to 2 mM initiated significant SOCE associated with a marked Ca2+ response in the cell cytosol (Figure 3B–E; upper fluorescence trace). To quantify Ca2+ release and Ca2+ entry, Ca2+ traces from individual cells (Figure 3B–E; upper traces) were differentiated, and maximal rates of Ca2+ release (Rr) and Ca2+ entry (Re) were determined as appropriate local maximums in the d(F/F0)/dt curves (Figure 3B–E; upward peaks in the bottom traces).
Based on these data, we generated a number of histograms to characterize distributions of Rr and Re among robust cells of different lines. Note that satisfactory fitting for all obtained histograms could not be achieved using a single Gaussian function. Instead, it normally required a combination of two or three Gaussians (Figure 4). This implied that each particular cellular line could include two to three cell subpopulations that differed in Ca2+ leakage and SOCE. The level of luminal Ca2+, activities of Ca2+ leak channels and Ca2+ pumps, and coupling of Ca2+store to SOCs may have varied from cell to cell.
The experimental histograms revealed dissimilarity between WT-, IP3R1-, IP3R2-, and IP3R3-HEK cells in both thapsigargin-induced Ca2+ release and SOCE. In particular, the Rr distributions for WT-HEK and IP3R3-HEK cells were wider and shifted positively compared to the Rr histograms obtained for IP3R1- and IP3R2-HEK cells (Figure 4, left panels). On average, Rr in WT-, IP3R1-, IP3R2-, and IP3R3-HEK cells was 0.037 ± 0.011, 0.017 ± 0.005, 0.026 ± 0.008, and 0.049 ± 0.013 (ΔF/F0)s−1 (mean ± S.D.), respectively. This indicates that Ca2+ leakage in WT- and IP3R3-HEK cells was more intensive than that in IP3R1- and IP3R2-HEK cells.
For SOCE observed after the 600 s depletion of Ca2+ store (Figure 4, right panels), averaged Rr was 0.031 ± 0.009, 0.023 ± 0.007, 0.038 ± 0.012, and 0.018 ± 0.006 (ΔF/F0)s−1 in WT-, IP3R1-, IP3R2-, and IP3R3-HEK cells, respectively. The histograms generated for Rr also demonstrated cell-line specificity (Figure 4, right panels). Although IP3R1- and IP3R3-HEK cells were comparable to the distributions (Figure 4, right IP3R1 and IP3R3 panels) and averaged values of SOCE rates, SOC activity was higher in IP3R2-HEK cells and in WT-HEK cells (Figure 4, right panels of WT and IP3R2). These findings point at the possibility that IP3R2 could be functionally coupled to Ca2+ channels that mediate SOCE in WT- and IP3R2-HEK cells. In contrast, in H4IIE liver cells, which also express all three IP3R isoforms, primarily type 1 and, to a lesser extent, type 3, but not type 2, participated in the activation of a CRAC current associated with SOCE [48].
In resting cells, spontaneous activity of IP3Rs could be a factor of Ca2+ leakage from Ca2+ store [46]. Being least active at rest, IP3R3 should have contributed to Ca2+ leakage to a lesser extent compared to the other IP3R subtypes. However, it turned out that just Ca2+ store in IP3R3-HEK cells was most leaky in terms of the initial rate of thapsigargin-induced Ca2+ release (Figure 4, left panels). Note, however, that the Ca2+ release rate depended not only on Ca2+ permeability of the reticular membrane but also on a level of stored Ca2+. Thus, the Ca2+ release rate could not serve as an independent measure of ER permeability to Ca2+. To address this issue, we developed a simplified kinetics model of Ca2+ signals triggered by thapsigargin at low bath Ca2+ (Figure S13) and found the Ca2+ permeability P of the ER membrane to be proportional to the ratio (Equation (S11)):
P ~ d C d t 0 0 T C d t  
where C is the concentration of cytosolic Ca2+, d C d t ( 0 ) is the initial rate of a Ca2+ rise triggered by thapsigargin applied at t = 0, 0 T C d t is the area under Ca2+ release curve, and T is the time interval necessary for cytosolic Ca2+ to return to the initial level (Figure 5A).
To employ this formalism, we suggested that Fluo-8 fluorescence was far below saturation. Indeed, normally, thapsigargin-induced Ca2+ responses did not exceed 2 (Figure 3A), while the dynamic range of Fluo-8 should have been 20 at least [49]. Therefore, the measured parameter F/F0 was nearly proportional to the concentration of cytosolic Ca2+. For each assayed cell, we evaluated both the initial rate of Ca2+ release (Figure 3B–E, bottom panels) and the area under the Ca2+-release trace (Figure 5A, hatched area).
The appropriate histograms of d C d t ( 0 ) and 0 T C d t obtained for particular IP3R isoforms are presented in Figure 5B–D (left and middle panels). As illustrated, thapsigargin induced much more massive Ca2+ release in IP3R3-HEK cells (Figure 5D, middle panel) compared to IP3R1-HEK and IP3R2-HEK cells (Figure 5B,C, middle panels). The individual ratios (Equation (2)) were calculated, and their distributions among cells of the particular subtype were generated (Figure 5B,C, right panels). For IP3R1-HEK, IP3R2-HEK, and IP3R3-HEK cells, the averaged ratios (Equation (2)) were 1.42 ± 0.49, 2.49 ± 0.94, and 0.64 ± 0.17, respectively, and the differences between them were statistically significant (p < 0.05, ANOVA test). Based on these values of the ratio (2), relative Ca2+ permeability of the ER membrane was estimated for IP3R1-HEK, IP3R2-HEK, and IP3R3-HEK cells as 1:1.75:0.45, respectively. Thus, based on Ca2+ permeability of the ER, assayed cells were arranged as IP3R2-HEK > IP3R1-HEK > IP3R3-HEK. This order was rather consistent with the values of the steady-state open probabilities of IP3R2, IP3R1, and IP3R3 found to be ~0.3, 0.1, and <0.1, respectively, at nearly resting conditions (100 nM Ca2+, 1 μM IP3) [19]. In agreement with the previous report [39], this conformity suggested that spontaneous activity of IP3Rs was an essential factor of Ca2+ leakage from the ER. Note that the total Ca2+ release for 600 s (Figure 5B–D, middle panels) indicated that even being least permeable to Ca2+ (Figure 5B–D, right panels), Ca2+ store in IP3R3-HEK cells lost a larger number of Ca2+ ions compared to IP3R2-HEK and IP3R1-HEK cells. It was possible only if a resting level of Ca2+ in IP3-regulated Ca2+ store in IP3R3-HEK cells was essentially higher than one in IP3R2-HEK and IP3R1-HEK cells, provided that the ER volume was invariable among the cell lines.

3.4. IP3R1-, IP3R2-, and IP3R3-HEK Cells with the Ca2+ Sensor R-CEPIA1er

To extend the experimental capability of the engineered lines, R-CEPIA1er, the Ca2+sensor with a reticular location [40], was heterologously expressed in IP3R1-, IP3R2-, and IP3R3-HEK cells. Being loaded with Fluo-8, R-CEPIA1er-positive cells allowed for simultaneous monitoring of cytosolic and reticular Ca2+ (Figure 6). ACh stimulated Ca2+ transients in the cell cytosol (Figure 5A–C, upper panels) and a synchronous drop in reticular Ca2+, which relaxed close to the resting level despite the agonist still being present in the bath (Figure 6A–C, bottom panels). The Ca2+ ionophore ionomycin (5 μM) applied at low bath Ca2+ (260 nM) also triggered cytosolic Ca2+ signals (Figure 6A–C), presumably by penetrating through plasmalemma and increasing Ca2+ permeability of the reticular membrane. In this case, the low steady-state level of the ionomycin response was achievable if Ca2+ fluxes mediated by SERCA and ionomycin were precisely balanced. The relative effects of the agonist and ionophore on reticular Ca2+ were quantified by the A1/A2 ratio, where magnitudes of Ca2+ signals elicited by ACh (A1) and ionomycin (A2) were determined as indicated in Figure 6B. As summarized in Figure 6D, ionomycin emptied Ca2+ store in IP3R1- and IP3R3-HEK cells to a much higher extent than ACh did (Figure 6A,C, bottom panels). In contrast, ACh and ionomycin dropped luminal Ca2+ in IP3R2-HEK cells to comparable levels (Figure 6B, bottom panels).
This phenomenon could be plausibly interpreted based on the recent finding that luminal Ca2+ inhibited activity of IP3Rs and related IP3-dependent Ca2+ signals in the cell cytosol [50]. This inhibitory effect was presumably mediated by the Ca2+-binding protein annexin A1 (ANXA1). With no ANXA1 bound, IP3-gated channels were sufficiently active, while at high luminal Ca2+ (>100 μM), ANXA1 interacted with IP3Rs, promoting their inhibition [50]. Given that ANXA1 is expressed in WT-HEK cells (Figure S8), the abovementioned ANXA1-mediated regulation could explain why ACh and ionomycin reduced luminal Ca2+ to close levels in IP3R2-HEK cells but not in IP3R1-HEK and IP3R3-HEK cells. Indeed, our findings suggest that at rest, ER permeability to Ca2+ was highest in IP3R2-HEK cells (Figure 5B–D, right panels), implying that a resting level of luminal Ca2+ should have been lower in these cells compared to IP3R1-HEK and IP3R3-HEK cells, provided that SERCA was similarly active in all cell subgroups. If so, IP3Rs in IP3R2-HEK cells operated in a mode characterized by a higher open probability at the same IP3 level [50], thus mediating higher Ca2+ release despite lower luminal Ca2+.

4. Discussion

The Ca2+ homeostasis in the ER is governed by a complex protein network, which ensures the steady-state Ca2+ level in the ER lumina at rest, precise Ca2+ release upon cell stimulation, and effective refilling of Ca2+ store [47,51,52,53]. At rest, the level of free Ca2+ in the ER lumina, which ranges between 300 and 800 μM [51], is determined by balance between passive Ca2+ leakage and active ER refilling by the SERCA pump [47]. The inhibition of SERCA with thapsigargin completely depletes a Ca2+ pool in the ER within minutes, indicating that Ca2+ constantly leaks from the ER [54]. Several mechanisms have been implicated in mediating Ca2+ leakage, including proteins from the transmembrane BAX inhibitor motif-containing (TMBIM) family, the antiapoptotic protein BCL-2, and a truncated version of SERCA pump SERCA1T [47,54]. The effective feedback mechanism preventing the overload of ER with Ca2+ involves TMCO1 proteins, which are capable of oligomerizing at high luminal Ca2+ to form transient Ca2+ leak channels [55]. Evidence exists that in resting cells, spontaneous activity of IP3Rs and ryanodine receptors (RyRs) could be responsible for a fraction of Ca2+ influx from the ER [47,54]. For instance, in HEK-293 cells, knockout of all three IP3R genes markedly slowed spontaneous Ca2+ release from the ER [39], indicating that resting activity of IP3Rs was a significant factor in Ca2+ leakage. On the other hand, our observations suggest that RyRs contributed negligibly to Ca2+ leakage from the ER in HEK-293 cells (Figure S12).
The sustained depletion of luminal Ca2+ is detrimental to cells, as it causes ER stress, inhibits protein synthesis, and provokes apoptosis [56,57]. Cells employ a number of mechanisms to counteract the prolonged depletion of Ca2+ store, including Ca2+-binding proteins buffering luminal Ca2+ [58], coupling of Ca2+ store depletion to activated SOCE [59], and active reloading of ER with SERCA [60]. The core mechanism of SOCE involves stromal interaction molecules (STIMs), basically STIM1 but also STIM2, which serve as sensors of ER Ca2+ and SOCE regulators [36]. Being initiated by Ca2+ store depletion, the dissociation of Ca2+ from STIM1 proteins causes their oligomerization and relocation to the specialized membrane contact sites between the plasma membrane and the ER, called the ER–PM junction. In this junction, the cytosolic domains in STIM1 oligomers have an unfurling and elongated conformation necessary to capture Orai channels located in the plasmalemma and enable their opening [36].
In cells of diverse types, IP3Rs represents the main conduit for stimulus-dependent Ca2+ release [3,9,46], and therefore they should be coupled to SOCs, at least functionally. The functional interaction was indeed demonstrated for IP3Rs and TRPC channels involved in SOCE [56,57,58,61,62] as well as between IP3Rs and ORAI1 [59,60]. Moreover, evidence exists that STIM proteins can directly interact with IP3Rs [36,63]. The recent findings point out that STIM1 forms a complex predominantly with activated IP3R [63]. Indeed, being a trigger of STIM1 oligomerization, a transient fall in intraluminal Ca2+ initiated by IP3 should be most pronounced just in the close vicinity of open IP3R.
The cell lines expressing merely one IP3R subtype represent a promising cellular model for the systematic assay of gating, regulation, pharmacology, and physiology of individual IP3R isoforms. The first vertebrate cellular model suitable for functional analysis of individual IP3R isotypes in the same cellular background was established based on chicken lymphoma-derived DT40 cells, wherein all three IP3R genes were disrupted (DT40-TKO cells) [33]. The heterologous expression of mammalian IP3Rs in DT40-TKO cells provided a deep insight into the functionality of individual IP3R isotypes. It was particularly demonstrated that constitutive Ca2+ release through IP3R to mitochondria is required for mitochondrial respiration and maintenance of normal cell bioenergetics [34]. It turned out that IP3R2 delivered Ca2+ to mitochondria most effectively, although each IP3R isotype can support local contact sites of ER and mitochondria [38]. The permeabilized cells expressing a particular IP3R subunit were employed to assay Ca2+ release stimulated by IP3 and its synthetic analogs. The dose–response curves generated for all IP3R subtypes yielded the first structure–activity relationships for the key IP3 analogues [35]. Reportedly, IP3-induced Ca2+ release was effective only if each IP3R monomer within the tetramer was occupied by IP3 [36].
Apart from DT40-TKO cells, IP3R-defficient HEK-293 and HeLa cells have also been generated by using CRISPR/Cas9 genome editing [36,37,39]. Being employed as a heterologous system for systematic expression and assay of mammalian IP3Rs, these model lines facilitated the acquisition of a number of interesting findings. It was particularly reported that upon IP3 uncaging, all three IP3R subtypes were capable of mediating Ca2+ puffs, relatively small and localized Ca2+ transients. The pathological mutations associated with dysfunction of IP3R1 disrupted IP3 binding, IP3-mediated gating, and its regulation by IP3R-modulatory proteins [37]. Being significantly reduced in HEK293-TKO cells, Ca2+ leakage from the ER and its refilling were rescued by overexpression of recombinant IP3R1 or IP3R3 [39].
In the present work, we developed our own cell lines suitable for the analysis of a role of individual IP3R isotypes in agonist-induced Ca2+ signaling. By inactivating two out of three IP3R genes in HEK-293 cells with CRISPS/Cas9 technology and employing cell selection methods, we generated three monoclonal cell lines, IP3R1-HEK, IP3R2-HEK, and IP3R3-HEK, with IP3R1, IP3R2, and IP3R3 being solely functional, respectively. The functional consequence of this meddling in the natural pattern of IP3R expression was evaluated by studying certain aspects of Ca2+ signaling in these genetically modified cells.
In each line, IP3R1-HEK, IP3R2-HEK, or IP3R3-HEK, cells responded to ACh with Ca2+ mobilization and exhibited “all-or-nothing” responsivity to the agonist (Figure 2), as was the case with WT-HEK cells (Figure 1D). Given this feature, a dose dependence of cell responses was characterized at the population level by the number of cells responsive to ACh at a particular concentration. Based on the EC50 doses obtained from these dose-response relationships (Figure 2B), ACh sensitivities of the genetically modified cells ranked as IP3R2-HEK > IP3R1-HEK > IP3R3-HEK. Response lags basically obeyed the same sequence (Figure 2C,D).
It should be noted that genome editing with RNA-guided nucleases, such as Cas9, can entail off-target DNA cleavage [61,62]. As an additional control, we compared assayed cells based on the expression of muscarinic receptors and several downstream signaling proteins that could be involved in ACh transduction, including Gq- and Gi1-3-proteins, which are known to couple a variety of GPCRs to G-protein-regulated PLCβ1-4 [56]. The relative expression levels were assessed using RT-qPCR (see Supplementary Materials).
In mammals, five genes encode muscarinic receptors of the M1–M5 subtypes. We identified M1, M3, M4, and M5 transcripts in WT-HEK cells, while M2 transcripts were undetectable (Figure S7A). Among them, the M3 isotype was dominant at the transcript level (Figure S7B). Consistently, physiological evidence validated the central role of the M3 receptor in mediating ACh-induced Ca2+ mobilization (Figure 1D). Although expression of the identified M receptors somewhat varied from line to line (Figure S9A), M3 transcript levels were statistically indistinguishable (Figure S9A, M3 panel). It thus appears that distinct sensitivities of IP3R1-, IP3R2-, and IP3R3-HEK cells to ACh (Figure 2B) were determined by a mechanism downstream of the M receptors.
Given that the M3 receptor primarily couples to the Gq protein [57], the distinct sensitivities of IP3R1-HEK, IP3R2-HEK, and IP3R3-HEK cells to ACh may be attributed to lineage-specific expression of Gq. It was found that the IP3R1-HEK/IP3R2-HEK and IP3R2-HEK/IP3R3-HEK pairs exhibited statistically indistinguishable levels of Gq expression (Figure S9B, Gq panel). On the other hand, the level of Gq transcripts in IP3R3-HEK cells was ~50% lower than in IP3R1-HEK cells (Figure S9B, Gq panel). These data revealed no correlation between a level of Gq expression in a particular cell line (Figure S9B, Gq panel) and its responsiveness to ACh (Figure 2B). In addition, levels of Gi1-3 transcripts in all assayed lines were statistically indistinguishable (Figure S9B, Gi panels). Hence, the different sensitivities of IP3R1-HEK, IP3R2-HEK, and IP3R3-HEK cells to ACh (Figure 2B) did not seem correlated with differences in their expression of G proteins (Figure S9B), which coupled M receptors to PLC.
Although expression of PLCβ1–4 was more scattered among cell populations, statistically significant deviations exhibited solely PLCβ3 transcripts (Figure S6C). Given, however, that compared to PLCβ1 and PLCβ2 the level of PLCβ3 transcripts was lower by a factor of 3–10 (Figure S8C), this PLC isoform was presumably a minor contributor to ACh signaling (Figure 2). In summary, the abovementioned results (Figures S7 and S8) indicate that the IP3R gene editing has had insignificant impact on the expression of proteins potentially crucial to ACh transduction.
Previously, we developed a mathematical model of agonist transduction that included the phosphoinositide signaling cascade and IP3-driven Ca2+ release through the only type of IP3Rs [31]. This model properly simulated the characteristic features of agonist-induced Ca2+ signaling, such as the “all-or-nothing” responsivity of cells (Figure 2A) and the dose dependence of the response lag (Figure 2D). In line with this model, a threshold agonist concentration in a step-like dose dependence of Ca2+ responses (Figure 4 in [31]) was determined by both a rate of IP3 production stimulated by an agonist and the affinity of IP3 binding to IP3Rs. Note that the expression analysis (Figure S9) suggests that the efficacy of the ACh transduction pathway, i.e., muscarinic receptor–G protein–PLC–IP3 production, was likely similar or nearly identical in IP3R1-, IP3R2-, and IP3R3-HEK cells. On the other hand, based on the revealed levels of IP3R transcripts (Figure S10), these cells were ranked as IP3R3-HEK > IP3R2-HEK > IP3R3-HEK, although based on ACh responsivity, they were ordered as IP3R2-HEK > IP3R1-HEK > IP3R3-HEK (Figure 2B). The last sequence aligned well with the affinities of the corresponding IP3Rs to IP3, which followed the order IP3R2 > IP3R1 > IP3R3 [7,11,58,59,60]. It thus appears that the IP3 affinity of an IP3R isoform operating in a particular cell line was a decisive factor that determined sensitivity of the assayed cells to ACh.

5. Conclusions

In this study, we generated our own monoclonal cell lines, IP3R1-HEK, IP3R2-HEK, and IP3R3-HEK, for further analysis of the role of individual IP3R isotypes in mediating various aspects of agonist-induced Ca2+ signaling. For instance, the IP3R3-HEK line could provide sufficient insight into why type II taste cells exclusively involve IP3R3 in sweet, bitter, and umami transduction [16]. We utilized the generated cellular models to verify several important findings reported earlier. Specifically, our data confirmed that each IP3R isoform could mediate the CICR process and contribute to Ca2+ leakage from Ca2+ store at rest. Furthermore, we developed a mathematical model, which allowed for the relative Ca2+ permeability of Ca2+ store to be estimated based on Ca2+ signals induced by thapsigargin in the cell cytosol. With this approach, relative Ca2+ permeabilities of Ca2+ store in IP3R1-HEK, IP3R2-HEK, and IP3R3-HEK cells were evaluated to be 1:1.75:0.45.
The engineered cells responded to ACh in strong correlation with the IP3 sensitivity of an IP3R isoform they expressed. Based on this correlation, any alteration in responsivity of the particular cell line, induced by a pharmacological agent targeting IP3Rs, could be attributed to a change in activity of the related IP3R isoform. We therefore anticipate that the developed cell lines, in combination with genetically encoded sensors (Figure 6), could provide a relatively straightforward and efficient means for assaying the activity, regulation, and pharmacology of individual IP3R isoforms.

Supplementary Materials

The following supporting information can be downloaded at: https://www.mdpi.com/article/10.3390/cells13070562/s1, Figure S1: Fragments of the sense and antisense sequences (374-441 bp) of the IP3R1 gene; Figure S2: Confirmation of biallelic mutations in cells transfected with the cAIO-GFP-sgRNA vector; Figure S3: Biallelic mutations in the IP3R1 gene revealed in the monoclone 12; Figure S4: Fragment (414-505 nucleotides) of the IP3R2 gene containing the protospacers (blue) and PAM (in red); Figure S5: Fragment (448-478 nucleotides) of the IP3R3 gene containing the protospacers (blue) and PAM (red); Figure S6: Expression of IP3Rs in WT-HEK cells; Figure S7: Expression of muscarinic receptors in WT-HEK cells; Figure S8: Representative RT-PCR analysis (n=3) of expression of human annexin A1 in WT-HEK cells; Figure S9: Expression of signaling proteins in cells of different lines; Figure S10: Expression of IP3Rs in cells of different lines; Figure S11: Western blots from WT-, IP3R1-, IP3R2-, and IP3R3-HEK cells; Figure S12: Ca2+ signals associated with SERCA inhibition and Ca2+ store depletion by thapsigargin; Figure S13: Kinetics model of Ca2+ homeostasis in a unstimulated cell; Table S1: Mutations of the targeted IP3R gene in cells of the HEK-IP3R1, HEK-IP3R2, and HEK-IP3R3 lines; Table S2: Primer sequences. [36,63,64,65,66,67,68]

Author Contributions

Conceptualization, S.S.K.; project administration, S.S.K.; formal analysis, E.N.K. and M.F.B.; investigation, E.N.K., E.E.K., O.A.R., N.P.K., N.V.K. and P.D.K.; methodology, S.S.K. and M.F.B.; writing—original draft, S.S.K. and M.F.B.; writing—review and editing, S.S.K., M.F.B. and E.E.K.; funding acquisition, S.S.K. All authors have read and agreed to the published version of the manuscript.

Funding

This work was supported by the Russian Science Foundation (grant 22-14-00031).

Institutional Review Board Statement

Not applicable.

Informed Consent Statement

Not applicable.

Data Availability Statement

The original contributions presented in the study are included in the article/Supplementary Materials, further inquiries can be directed to the corresponding author/s.

Acknowledgments

We are grateful to A.S. Kolesnikova for the careful reading of the manuscript and valuable comments. We also thank D.M. Potashnikova for her assistance in sorting cells on the FACSAria SORP cell sorter (M.V. Lomonosov Moscow State University Program of Development).

Conflicts of Interest

The authors disclose no conflicts of interest.

References

  1. Berridge, M.J. The inositol trisphosphate/calcium signaling pathway in health and disease. Physiol. Rev. 2016, 96, 1261–1296. [Google Scholar] [CrossRef]
  2. Lemmon, M.A.; Schlessinger, J. Cell signaling by receptor tyrosine kinases. Cell 2010, 141, 1117–1134. [Google Scholar] [CrossRef] [PubMed]
  3. Smith, H.A.; Thillaiappan, N.B.; Rossi, A.M. IP3 receptors: An “elementary” journey from structure to signals. Cell Calcium 2023, 113, 102761. [Google Scholar] [CrossRef] [PubMed]
  4. Huang, E.J.; Reichardt, L.F. Trk receptors: Roles in neuronal signal transduction. Annu. Rev. Biochem. 2003, 72, 609–642. [Google Scholar] [CrossRef] [PubMed]
  5. Cattaneo, F.; Guerra, G.; Parisi, M.; De Marinis, M.; Tafuri, D.; Cinelli, M.; Ammendola, R. Cell-surface receptors transactivation mediated by G protein-coupled receptors. Int. J. Mol. Sci. 2014, 15, 19700–19728. [Google Scholar] [CrossRef] [PubMed]
  6. Thillaiappan, N.B.; Chakraborty, P.; Hasan, G.; Taylor, C.W. IP3 receptors and Ca2+ entry. Biochim. Biophys. Acta Mol. Cell. Res. 2019, 1866, 1092–1100. [Google Scholar] [CrossRef] [PubMed]
  7. Chandrasekhar, R.; Alzayady, K.J.; Wagner, L.E., 2nd; Yule, D.I. Unique Regulatory Properties of Heterotetrameric Inositol 1,4,5-Trisphosphate Receptors Revealed by Studying Concatenated Receptor Constructs. J. Biol. Chem. 2016, 291, 4846–4860. [Google Scholar] [CrossRef] [PubMed]
  8. Wojcikiewicz, R.J.H. The making and breaking of inositol 1,4,5-trisphosphate receptor Tetramers. Messenger 2018, 6, 45–49. [Google Scholar] [CrossRef]
  9. Prole, D.L.; Taylor, C.W. Structure and function of IP3 receptors. Cold Spring Harb. Perspect. Biol. 2019, 11, a035063. [Google Scholar] [CrossRef]
  10. Hamada, K.; Mikoshiba, K. IP3 receptor plasticity underlying diverse functions. Annu. Rev. Physiol. 2020, 82, 151–176. [Google Scholar] [CrossRef]
  11. Mikoshiba, K. IP3 receptor/Ca2+ channel: From discovery to new signaling concepts. J. Neurochem. 2007, 102, 1426–1446. [Google Scholar] [CrossRef]
  12. Foskett, J.K.; White, C.; Cheung, K.H.; Mak, D.O. Inositol trisphosphate receptor Ca2+ release channels. Physiol. Rev. 2007, 87, 593–658. [Google Scholar] [CrossRef] [PubMed]
  13. Lipp, P.; Laine, M.; Tovey, S.C.; Burrell, K.M.; Berridge, M.J.; Li, W.; Bootman, M.D. Functional InsP3 receptors that may modulate excitation-contraction coupling in the heart. Curr. Biol. 2000, 10, 939–942. [Google Scholar] [CrossRef] [PubMed]
  14. Taylor, C.W.; Genazzani, A.A.; Morris, S.A. Expression of inositol trisphosphate receptors. Cell Calcium 1999, 26, 237–251. [Google Scholar] [CrossRef] [PubMed]
  15. Miyoshi, M.A.; Abe, K.; Emori, Y. IP3 receptor type 3 and PLCbeta2 are co-expressed with taste receptors T1R and T2R in rat taste bud cells. Chem. Senses 2001, 26, 259–265. [Google Scholar] [CrossRef] [PubMed]
  16. Clapp, T.R.; Stone, L.M.; Margolskee, R.F.; Kinnamon, S.C. Immunocytochemical evidence for co-expression of Type III IP3 receptor with signaling components of bitter taste transduction. BMC Neurosci. 2001, 2, 6. [Google Scholar] [CrossRef] [PubMed]
  17. Brann, J.H.; Dennis, J.C.; Morrison, E.E.; Fadool, D.A. Type-specific inositol 1,4,5-trisphosphate receptor localization in the vomeronasal organ and its interaction with a transient receptor potential channel, TRPC2. J. Neurochem. 2002, 83, 1452–1460. [Google Scholar] [CrossRef] [PubMed]
  18. Parys, J.B.; Vervliet, T. New Insights in the IP3 Receptor and Its Regulation. Adv. Exp. Med. Biol. 2020, 1131, 243–270. [Google Scholar] [PubMed]
  19. Mak, D.O.; Foskett, J.K. Inositol 1,4,5-trisphosphate receptors in the endoplasmic reticulum: A single-channel point of view. Cell Calcium 2015, 58, 67–78. [Google Scholar] [CrossRef]
  20. Mikoshiba, K. Role of IP3 receptor signaling in cell functions and diseases. Adv. Biol. Regul. 2015, 57, 217–227. [Google Scholar] [CrossRef]
  21. Wagner, L.E., 2nd; Yule, D.I. Differential regulation of the InsP₃ receptor type-1 and -2 single channel properties by InsP₃, Ca²⁺ and ATP. J. Physiol. 2012, 590, 3245–3259. [Google Scholar] [CrossRef] [PubMed]
  22. Taylor, C.W. Regulation of IP3 receptors by cyclic AMP. Cell Calcium 2017, 63, 48–52. [Google Scholar] [CrossRef]
  23. Kaplin, A.I.; Snyder, S.H.; Linden, D.J. Reduced nicotinamide adenine dinucleotide-selective stimulation of inositol 1,4,5-trisphosphate receptors mediates hypoxic mobilization of calcium. J. Neurosci. 1996, 16, 2002–2011. [Google Scholar] [CrossRef]
  24. Worley, P.F.; Baraban, J.M.; Supattapone, S.; Wilson, V.S.; Snyder, S.H. Characterization of inositol trisphosphate receptor binding in brain. Regulation by pH and calcium. J. Biol. Chem. 1987, 262, 12132–12136. [Google Scholar] [CrossRef] [PubMed]
  25. Taylor, C.W.; Laude, A.J. IP3 receptors and their regulation by calmodulin and cytosolic Ca2+. Cell Calcium 2002, 32, 321–334. [Google Scholar] [CrossRef] [PubMed]
  26. Ando, H.; Mizutani, A.; Matsu-ura, T.; Mikoshiba, K. IRBIT, a novel inositol 1,4,5-trisphosphate (IP3) receptor-binding protein, is released from the IP3 receptor upon IP3 binding to the receptor. J. Biol. Chem. 2003, 278, 10602–10612. [Google Scholar] [CrossRef]
  27. Schlossmann, J.; Ammendola, A.; Ashman, K.; Zong, X.; Huber, A.; Neubauer, G.; Wang, G.X.; Allescher, H.D.; Korth, M.; Wilm, M.; et al. Regulation of intracellular calcium by a signalling complex of IRAG, IP3 receptor and cGMP kinase Ibeta. Nature 2000, 404, 197–201. [Google Scholar] [CrossRef]
  28. Vanderheyden, V.; Devogelaere, B.; Missiaen, L.; De Smedt, H.; Bultynck, G.; Parys, J.B. Regulation of inositol 1,4,5-trisphosphate-induced Ca2+ release by reversible phosphorylation and dephosphorylation. Biochim. Biophys. Acta 2009, 1793, 959–970. [Google Scholar] [CrossRef]
  29. Kotova, P.D.; Bystrova, M.F.; Rogachevskaja, O.A.; Khokhlov, A.A.; Sysoeva, V.Y.; Tkachuk, V.A.; Kolesnikov, S.S. Coupling of P2Y receptors to Ca2+ mobilization in mesenchymal stromal cells from the human adipose tissue. Cell Calcium 2018, 71, 1–14. [Google Scholar] [CrossRef]
  30. Kotova, P.D.; Sysoeva, V.Y.; Rogachevskaja, O.A.; Bystrova, M.F.; Kolesnikova, A.S.; Tyurin-Kuzmin, P.A.; Fadeeva, J.I.; Tkachuk, V.A.; Kolesnikov, S.S. Functional expression of adrenoreceptors in mesenchymal stromal cells derived from the human adipose tissue. Biochim. Biophys. Acta 2014, 1843, 1899–1908. [Google Scholar] [CrossRef]
  31. Kaimachnikov, N.P.; Kotova, P.D.; Kochkina, E.N.; Rogachevskaja, O.A.; Khokhlov, A.A.; Bystrova, M.F.; Kolesnikov, S.S. Modeling of Ca2+ transients initiated by GPCR agonists in mesenchymal stromal cells. BBA Adv. 2021, 1, 100012. [Google Scholar] [CrossRef]
  32. Cherkashin, A.P.; Rogachevskaja, O.A.; Kabanova, N.V.; Kotova, P.D.; Bystrova, M.F.; Kolesnikov, S.S. Taste Cells of the Type III Employ CASR to Maintain Steady Serotonin Exocytosis at Variable Ca2+ in the Extracellular Medium. Cells 2022, 11, 1369. [Google Scholar] [CrossRef]
  33. Sugawara, H.; Kurosaki, M.; Takata, M.; Kurosaki, T. Genetic evidence for involvement of type 1, type 2 and type 3 inositol 1,4,5-trisphosphate receptors in signal transduction through the B-cell antigen receptor. EMBO J. 1997, 16, 3078–3088. [Google Scholar] [CrossRef] [PubMed]
  34. Cardenas, C.; Miller, R.A.; Smith, I.; Bui, T.; Molgo, J.; Muller, M.; Vais, H.; Cheung, K.H.; Yang, J.; Parker, I.; et al. Essential regulation of cell bioenergetics by constitutive InsP3 receptor Ca2+ transfer to mitochondria. Cell 2010, 142, 270–283. [Google Scholar] [CrossRef] [PubMed]
  35. Saleem, H.; Tovey, S.C.; Rahman, T.; Riley, A.M.; Potter, B.V.; Taylor, C.W. Stimulation of inositol 1,4,5-trisphosphate (IP3) receptor subtypes by analogues of IP3. PLoS ONE 2013, 8, e54877. [Google Scholar] [CrossRef] [PubMed]
  36. Alzayady, K.J.; Wang, L.; Chandrasekhar, R.; Wagner, L.E., 2nd; Van Petegem, F.; Yule, D.I. Defining the stoichiometry of inositol 1,4,5-trisphosphate binding required to initiate Ca2+ release. Sci. Signal. 2016, 9, ra35. [Google Scholar] [CrossRef] [PubMed]
  37. Ando, H.; Hirose, M.; Mikoshiba, K. Aberrant IP3 receptor activities revealed by comprehensive analysis of pathological mutations causing spinocerebellar ataxia 29. Proc. Natl. Acad. Sci. USA 2018, 115, 12259–12264. [Google Scholar] [CrossRef] [PubMed]
  38. Bartok, A.; Weaver, D.; Golenar, T.; Nichtova, Z.; Katona, M.; Bansaghi, S.; Alzayady, K.J.; Thomas, V.K.; Ando, H.; Mikoshiba, K.; et al. IP3 receptor isoforms differently regulate ER-mitochondrial contacts and local calcium transfer. Nat. Commun. 2019, 10, 3726. [Google Scholar] [CrossRef]
  39. Yue, L.; Wang, L.; Du, Y.; Zhang, W.; Hamada, K.; Matsumoto, Y.; Jin, X.; Zhou, Y.; Mikoshiba, K.; Gill, D.L.; et al. Type 3 Inositol 1,4,5-Trisphosphate receptor is a crucial regulator of calcium dynamics mediated by endoplasmic reticulum in HEK cells. Cells 2020, 9, 275. [Google Scholar] [CrossRef]
  40. Suzuki, J.; Kanemaru, K.; Ishii, K.; Ohkura, M.; Okubo, Y.; Iino, M. Imaging intraorganellar Ca2+ at subcellular resolution using CEPIA. Nat. Commun. 2014, 5, 4153. [Google Scholar] [CrossRef]
  41. Chiang, T.W.; le Sage, C.; Larrieu, D.; Demir, M.; Jackson, S.P. CRISPR-Cas9(D10A) nickase-based genotypic and phenotypic screening to enhance genome editing. Sci. Rep. 2016, 6, 24356. [Google Scholar] [CrossRef] [PubMed]
  42. Atwood, B.K.; Lopez, J.; Wager-Miller, J.; Mackie, K.; Straiker, A. Expression of G protein-coupled receptors and related proteins in HEK293, AtT20, BV2, and N18 cell lines as revealed by microarray analysis. BMC Genomics 2011, 12, 14. [Google Scholar] [CrossRef] [PubMed]
  43. Watson, N.; Daniels, D.V.; Ford, A.P.; Eglen, R.M.; Hegde, S.S. Comparative pharmacology of recombinant human M3 and M5 muscarinic receptors expressed in CHO-K1 cells. Br. J. Pharmacol. 1999, 127, 590–596. [Google Scholar] [CrossRef] [PubMed]
  44. Mataragka, S.; Taylor, C.W. All three IP3 receptor subtypes generate Ca2+ puffs, the universal building blocks of IP3-evoked Ca2+ signals. J. Cell. Sci. 2018, 131, jcs220848. [Google Scholar] [CrossRef] [PubMed]
  45. Lock, J.T.; Parker, I. IP3 mediated global Ca2+ signals arise through two temporally and spatially distinct modes of Ca2+ release. Elife 2020, 9, e55008. [Google Scholar] [CrossRef] [PubMed]
  46. Berridge, M.J.; Bootman, M.D.; Roderick, H.L. Calcium signalling: Dynamics, homeostasis and remodelling. Nat. Rev. Mol. Cell. Biol. 2003, 4, 517–529. [Google Scholar] [CrossRef]
  47. Carreras-Sureda, A.; Pihan, P.; Hetz, C. Calcium signaling at the endoplasmic reticulum: Fine-tuning stress responses. Cell Calcium 2018, 70, 24–31. [Google Scholar] [CrossRef]
  48. Jones, L.; Ma, L.; Castro, J.; Litjens, T.; Barritt, G.J.; Rychkov, G.Y. The predominant role of IP₃ type 1 receptors in activation of store-operated Ca2+ entry in liver cells. Biochim. Biophys. Acta 2011, 1808, 745–751. [Google Scholar] [CrossRef]
  49. Gee, K.R.; Brown, K.A.; Chen, W.N.; Bishop-Stewart, J.; Gray, D.; Johnson, I. Chemical and physiological characterization of fluo-4 Ca2+-indicator dyes. Cell Calcium 2000, 27, 97–106. [Google Scholar] [CrossRef] [PubMed]
  50. Vais, H.; Wang, M.; Mallilankaraman, K.; Payne, R.; McKennan, C.; Lock, J.T.; Spruce, L.A.; Fiest, C.; Chan, M.Y.; Parker, I.; et al. ER-luminal [Ca2+] regulation of InsP3 receptor gating mediated by an ER-luminal peripheral Ca2+-binding protein. Elife 2020, 9, e53531. [Google Scholar] [CrossRef] [PubMed]
  51. Zampese, E.; Pizzo, P. Intracellular organelles in the saga of Ca2+ homeostasis: Different molecules for different purposes? Cell. Mol. Life Sci. 2012, 69, 1077–1104. [Google Scholar] [CrossRef]
  52. Takeshima, H.; Venturi, E.; Sitsapesan, R. New and notable ion-channels in the sarcoplasmic/endoplasmic reticulum: Do they support the process of intracellular Ca²⁺ release? J. Physiol. 2015, 593, 3241–3251. [Google Scholar] [CrossRef]
  53. Liu, Q. TMBIM-mediated Ca2+ homeostasis and cell death. Biochim. Biophys. Acta Mol. Cell. Res. 2017, 1864, 850–857. [Google Scholar] [CrossRef]
  54. Camello, C.; Lomax, R.; Petersen, O.H.; Tepikin, A.V. Calcium leak from intracellular stores--the enigma of calcium signalling. Cell Calcium 2002, 32, 355–361. [Google Scholar] [CrossRef]
  55. Wang, Q.C.; Zheng, Q.; Tan, H.; Zhang, B.; Li, X.; Yang, Y.; Yu, J.; Liu, Y.; Chai, H.; Wang, X.; et al. TMCO1 Is an ER Ca2+ Load-Activated Ca2+ Channel. Cell 2016, 165, 1454–1466. [Google Scholar] [CrossRef]
  56. Jardín, I.; López, J.J.; Salido, G.M.; Rosado, J.A. Functional relevance of the de novo coupling between hTRPC1 and type II IP3 receptor in store-operated Ca2+ entry in human platelets. Cell Signal. 2008, 20, 737–747. [Google Scholar] [CrossRef]
  57. Tai, K.; Hamaide, M.C.; Debaix, H.; Gailly, P.; Wibo, M.; Morel, N. Agonist-evoked calcium entry in vascular smooth muscle cells requires IP3 receptor-mediated activation of TRPC1. Eur. J. Pharmacol. 2008, 583, 135–147. [Google Scholar] [CrossRef]
  58. Ahmad, M.; Ong, H.L.; Saadi, H.; Son, G.Y.; Shokatian, Z.; Terry, L.E.; Trebak, M.; Yule, D.I.; Ambudkar, I. Functional communication between IP3R and STIM2 at subthreshold stimuli is a critical checkpoint for initiation of SOCE. Proc. Natl. Acad. Sci. USA 2022, 119, e2114928118. [Google Scholar] [CrossRef] [PubMed]
  59. Woodard, G.E.; López, J.J.; Jardín, I.; Salido, G.M.; Rosado, J.A. TRPC3 regulates agonist-stimulated Ca2+ mobilization by mediating the interaction between type I inositol 1,4,5-trisphosphate receptor, RACK1, and Orai1. J. Biol. Chem. 2010, 285, 8045–8053. [Google Scholar] [CrossRef] [PubMed]
  60. Lur, G.; Sherwood, M.W.; Ebisui, E.; Haynes, L.; Feske, S.; Sutton, R.; Burgoyne, R.D.; Mikoshiba, K.; Petersen, O.H.; Tepikin, A.V. InsP₃ receptors and Orai channels in pancreatic acinar cells: Co-localization and its consequences. Biochem. J. 2011, 436, 231–239. [Google Scholar] [CrossRef] [PubMed]
  61. Kiselyov, K.; Xu, X.; Mozhayeva, G.; Kuo, T.; Pessah, I.; Mignery, G.; Zhu, X.; Birnbaumer, L.; Muallem, S. Functional interaction between InsP3 receptors and store-operated Htrp3 channels. Nature 1998, 396, 478–482. [Google Scholar] [CrossRef] [PubMed]
  62. Yuan, J.P.; Kiselyov, K.; Shin, D.M.; Chen, J.; Shcheynikov, N.; Kang, S.H.; Dehoff, M.H.; Schwarz, M.K.; Seeburg, P.H.; Muallem, S.; et al. Homer binds TRPC family channels and is required for gating of TRPC1 by IP3 receptors. Cell 2003, 114, 777–789. [Google Scholar] [CrossRef] [PubMed]
  63. Cho, S.W.; Kim, S.; Kim, Y.; Kweon, J.; Kim, H.S.; Bae, S.; Kim, J.S. Analysis of off-target effects of CRISPR/Cas-derived RNA-guided endonucleases and nickases. Genome Res. 2014, 24, 132–141. [Google Scholar] [CrossRef] [PubMed]
  64. Fu, Y.; Foden, J.A.; Khayter, C.; Maeder, M.L.; Reyon, D.; Joung, J.K.; Sander, J.D. High-frequency off-target mutagenesis induced by CRISPR-Cas nucleases in human cells. Nat. Biotechnol. 2013, 31, 822–826. [Google Scholar] [CrossRef] [PubMed]
  65. Kadamur, G.; Ross, E.M. Mammalian Phospholipase C. Annu. Rev. Physiol. 2013, 75, 127–154. [Google Scholar] [CrossRef]
  66. Kruse, A.; Kobilka, B.; Gautam, D.; Sexton, P.M.; Christopoulos, A.; Wess, J. Muscarinic acetylcholine receptors: Novel opportunities for drug development. Nat. Rev. Drug Discov. 2014, 13, 549–560. [Google Scholar] [CrossRef]
  67. Neher, E. The use of Fura-2 for estimating Ca buffers and Ca fluxes. Neuropharmacology 1995, 11, 1423–1442. [Google Scholar] [CrossRef]
  68. Saternos, H.C.; Almarghalani, D.A.; Gibson, H.M.; Meqdad, M.A.; Antypas, R.B.; Lingireddy, A.; AbouAlaiwi, W.A. Distribution and function of the muscarinic receptor subtypes in the cardiovascular system. Physiol. Genom. 2018, 50, 1–9. [Google Scholar] [CrossRef]
Figure 1. Stimulated Ca2+ signals in WT-HEK cells loaded with Fluo-8 4. (A) Evidence that Ca2+ release is mainly responsible for ACh-induced Ca2+ transients. Reduction in bath Ca2+ from 2 mM to 260 nM weakly affected Ca2+ responses to 0.75 μM ACh. The PLC inhibitor U73122 (3 μM) suppressed MSC responsivity to ACh. Here and below, the applications of compounds are indicated by the straight-line segments above the experimental trace; the data are presented as ΔF/F0, where ΔF = F − F0, F is the instant intensity of cell fluorescence, and F0 is the intensity of cell fluorescence obtained at the very beginning of a recording and averaged over a 20 s interval. (B) Summary of ACh responses at 2 mM and 260 nM Ca2+ in the bath. Each response at low extracellular Ca2+ was normalized to a response at 2 mM Ca2+ in the bath. The data are presented as a mean ± S.D. (81 cells). (C) Relative levels of muscarinic receptor transcripts in WT-HEK cells (mean ± S.D., n = 3) (see Supplementary Materials for details). (D) ACh responses were reversibly suppressed by the M3/M5 antagonist 4-DAMP at 10 nM. (E) Representative responses of WT-HEK cells (n = 256) to ACh applied at different doses, as indicated. (F,G) IP3 uncaging by 0.5 s and 1.5 s UV flashes elicited similar Ca2+ transients that were reminiscent of Ache responses. In (G), the data are presented as a mean ± S.D (26 cells).
Cells 13 00562 g001
Figure 2. Dose dependencies of agonist responses. (A) Representative Ca2+ responses of individual cells of the IP3R1-HEK (191 cells), IP3R2-HEK (178 cells), and IP3R3-HEK (164 cells), which were serially stimulated by ACh at the indicated concentrations. (B) Fractions of ACh-responsive cells in WT-HEK (256 cells), IP3R1-HEK (191 cells), IP3R2-HEK (178 cells), and IP3R3-HEK (164 cells) populations. The data are presented as mean ± S.D. The straight lines correspond to the approximation of experimental data for WT-HEK-, IP3R1-HEK-, IP3R2-HEK-, and IP3R3-HEK cells with Equation (1) at the following parameters, respectively: F0 = 81, 88, 88, and 89; C0.5 = 0.17, 0.21, 0.41, and 1.01 μM; and n = 2.7, 5.3, 3.4, and 4.2. (C) Representative Ca2+ transients elicited by ACh at 0.25 μM (near-threshold concentration) and 0.75 μM in the same WT-HEK cell. These ACh responses were delayed relative to the moment of agonist application by 52 s and 14 s, respectively. The characteristic time of the response delay (τd) was determined as a time interval necessary for a Ca2+ transient to reach the half-magnitude. (D) Response lag versus agonist concentration (mean ± S.D.). The data were collected from 61, 56, 58, and 49 cells of the WT-HEK, IP3R1-HEK, IP3R2-HEK, and IP3R3-HEK lines, respectively.
Cells 13 00562 g002
Figure 3. Ca2+ signals associated with SERCA inhibition and Ca2+ store depletion by thapsigargin. (A) Diagram showing the key contributors to intracellular Ca2+ signals. (BE) Upper traces, representative Ca2+ transients elicited in WT-HEK cells (n = 149) (B), IP3R1-HEK (n = 135) (C), IP3R2-HEK (n = 101) (D), and IP3R3-HEK (n = 117) (E) by 1 μM ACh in control, by 1 μM thapsigargin at 260 nM Ca2+ in the bath, and by 2 mM bath Ca2+ after 600 s depletion of Ca2+ store. The bottom panels show derivatives d ( F F 0 ) d t of the upper traces. The values of the first and second peaks were taken as measures for the rates of Ca2+ release (Rr) and Ca2+ entry (Re), respectively.
Cells 13 00562 g003
Figure 4. Distributions of Rr and Re values among populations of 149 WT-HEK-, 135 IP3R1-HEK-, 101 IP3R2-HEK-, and 117 IP3R3-HEK cells, as indicated. Each experimental histogram was fitted (straight lines) using the expression: N ( r ) = N 1 e ( r r 1 σ 1 ) 2 ) + N 2 e ( r r 2 σ 2 ) 2 + N 3 e ( r r 3 σ 3 ) 2 , where N(r) is the number of cells exhibiting Ca2+ release/entry rate equal to r, and Ni, ri, and σi are constants. In WT: left panel, N1 = 15, N2 = 27, N3 = 0; r1 = 2.5, r2 = 4.1; σ1 = 0.65, σ2 = 1.3. In WT: right panel, N1 = 21, N2 = 15, N3 = 0; r1 = 2.5, r2=3.7; σ1 = 0.99, σ2 = 1.1. In IP3R1: left panel, N1 = 36, N2 = 2.8, N3 = 0; r1 = 1.5, r2 = 2.7; σ1 = 0.44, σ2 = 0.73. In IP3R1: right panel, N1 = 29, N2 = 11, N3 = 0; r1 = 1.3, r2 = 4.1; σ1 = 0.71, σ2 = 1.1. In IP3R2: left panel, N1 = 28, N2 = 3.9, N3 = 0; r1 = 1.8, r2 = 4.0; σ1 = 0.76, σ2 = 2.4. In IP3R2: right panel, N1 = 6, N2 = 15, N3 = 0; r1 = 1.3, r2 = 4.1; σ1 = 0.51, σ2 = 1.8. In IP3R3: left panel, N1 = 9.3, N2 = 22, N3 = 8.5; r1 = 3.0, r2 = 4.8, r3 = 6.5; σ1 = 1.2, σ2 = 0.79, σ3 = 1.8. In IP3R3 right panel, N1 = 5, N2 = 19, N3 = 7; r1 = 1.0, r2 = 1.7, r3 = 1.9; σ1 = 0.49, σ2 = 0.5, σ2 = 1.8.
Cells 13 00562 g004
Figure 5. Evaluation of Ca2+ permeability of thapsigargin-sensitive Ca2+ store. (A) Bell-like Ca2+ signal produced by thapsigargin-induced Ca2+ release. The value of the hatched area, which corresponds to 0 T C d t in Equation (2), was calculated numerically. (BD) Distributions of Ca2+ release rates (left panels), areas under Ca2+ release curves (middle panels), and their ratio (right panels) among populations of 135 IP3R1-HEK-, 101 IP3R2-HEK-, and 117 IP3R3-HEK cells, as indicated. In the right panels, each experimental histogram was fitted using the expression (straight lines) N ( r ) = N 1 e ( r r 1 σ 1 ) 2 ) + N 2 e ( r r 2 σ 2 ) 2 , where N(r) is the number of cells characterized by the rate/area ratio equal to r, and Ni, ri, and σi are constants. In (B): N1 = 22, N2 = 12; r1 = 1.2 × 10⁻⁵, r2 = 1.7 × 10⁻⁵; σ1 = 0.29 × 10⁻⁵, σ2 = 0.63 × 10⁻⁵. In (C): N1 = 26, N2 = 14; r1 = 0.51 × 10⁻⁵, r2 = 0.83 × 10⁻⁵; σ1 = 0.18 × 10⁻⁵, σ2 = 0.21 × 10⁻⁵.
Cells 13 00562 g005
Figure 6. Concurrent monitoring of cytosolic and reticular Ca2+ in Fluo-8-loaded cells expressing the Ca2+ sensor R-CEPIA1er. (AC) Representative Ca2+ signals in the cytosol (upper panels) and in the ER (bottom panels) of 3 individual cells assayed simultaneously, which belong to the IP3R1-HEK (A) (59 cells), IP3R2-HEK (B) (71 cells), or IP3R3-HEK (C) (63 cells) line. In all cases, cells were sequentially stimulated by ACh at 2 mM Ca2+ and by 5 μM ionomycin at 260 nM Ca2+ in the bath. For the particular cell line, the ACh dose was chosen to exceed EC50 (Figure 2B) by a factor of about 5. (D) Ratios of R-CEPIA1er responses on cell stimulation by ACh (A1) and ionomycin (A2), whose magnitudes were determined as shown in (B). The data are presented as a mean ± S.D. (n = 17). The asterisk indicate the statistically significant difference (ANOVA test, p < 0.05). There was no statistically significant difference between IP3R1-HEK and IP3R3-HEK cells.
Cells 13 00562 g006
Disclaimer/Publisher’s Note: The statements, opinions and data contained in all publications are solely those of the individual author(s) and contributor(s) and not of MDPI and/or the editor(s). MDPI and/or the editor(s) disclaim responsibility for any injury to people or property resulting from any ideas, methods, instructions or products referred to in the content.

