Article

Genetic and Molecular Characterization of H9c2 Rat Myoblast Cell Line

by
Thomas Liehr
1,*,
Stefanie Kankel
1,
Katharina S. Hardt
2,
Eva M. Buhl
3,
Heidi Noels
4,5,
Diandra T. Keller
2,
Sarah K. Schröder-Lange
2 and
Ralf Weiskirchen
2,*
1
Institute of Human Genetics, Jena University Hospital, Friedrich Schiller University, D-07747 Jena, Germany
2
Institute of Molecular Pathobiochemistry, Experimental Gene Therapy and Clinical Chemistry (IFMPEGKC), RWTH University Hospital Aachen, D-52074 Aachen, Germany
3
Electron Microscopy Facility, Institute of Pathology, RWTH University Hospital Aachen, D-52074 Aachen, Germany
4
Institute for Molecular Cardiovascular Research (IMCAR), RWTH University Hospital Aachen, D-52074 Aachen, Germany
5
Department of Biochemistry, Cardiovascular Research Institute Maastricht, Maastricht University, 6211 Maastricht, The Netherlands
*
Authors to whom correspondence should be addressed.
Cells 2025, 14(7), 502; https://doi.org/10.3390/cells14070502
Submission received: 20 February 2025 / Revised: 19 March 2025 / Accepted: 26 March 2025 / Published: 28 March 2025

Abstract

:
This study presents a comprehensive genetic characterization of the H9c2 cell line, a widely used model for cardiac myoblast research. We established a short tandem repeat (STR) profile for H9c2 that is useful to confirm the identity and stability of the cell line. Additionally, we prepared H9c2 metaphase chromosomes and performed karyotyping and molecular cytogenetics to further investigate chromosomal characteristics. The genetic analysis showed that H9c2 cells exhibit chromosomal instability, which may impact experimental reproducibility and data interpretation. Next-generation sequencing (NGS) was performed to analyze the transcriptome, revealing gene expression patterns relevant to cardiac biology. Western blot analysis further validated the expression levels of selected cardiac genes identified through NGS. Additionally, Phalloidin staining was used to visualize cytoskeletal organization, highlighting the morphological features of these cardiac myoblasts. Our findings collectively support that H9c2 cells are a reliable model for studying cardiac myoblast biology, despite some genetic alterations identified resembling sarcoma cells. The list of genes identified through NGS analysis, coupled with our comprehensive genetic analysis, will serve as a valuable resource for future studies utilizing this cell line in cardiovascular medicine.

1. Introduction

H9c2 is a cell line derived from the embryonic rat heart, established in 1976 by B. W. Kimes and B.L. Brand [1]. It is widely used in cardiovascular research due to its ability to differentiate into skeletal and cardiac myocytes, with the latter induced by supplementation of all-trans-retinoic acid [2]. This cell line retains many characteristics of cardiac muscle cells, including the expression of cardiac-specific proteins such as troponin T and myosin heavy chains [3,4], making it an excellent model for studying heart development, function, and disease mechanisms, particularly in the context of hypertrophy and ischemia-reperfusion injury. Additionally, H9c2 cells are often employed in drug testing and toxicology studies due to their responsiveness to various pharmacological agents and their capacity for cellular signaling studies related to heart health and disease [5,6,7,8].
In addition to troponin T and myosin heavy chains, H9c2 cells express transcription factors such as GATA4 and Nkx2.5, which are crucial for cardiac development and function [9,10]. H9c2 cells have been studied for their response to stressors like hypoxia or oxidative stress [11,12], revealing insights into the molecular pathways involved in cardiomyocyte survival and apoptosis. Furthermore, researchers have utilized techniques such as CRISPR/Cas9 gene editing to manipulate specific genes within H9c2 cells to study their roles in cardiovascular diseases [13,14].
Overall, H9c2 has become a valuable tool to gain insights into cardiac biology and pathology. However, it is essential to consider its limitations as a model system when translating findings to in vivo situations. While H9c2 cells share many characteristics with primary cardiomyocytes, they may not fully replicate the complex genetic and functional properties of adult heart tissue and are considerably different from both primary neonatal cardiomyocytes and adult myocardium [15]. Therefore, findings from studies using this cell line should be interpreted with caution when considering their relevance to in vivo conditions.
Moreover, while H9c2 cells are widely used in cardiovascular research, it is important to note that their specific genetic characteristics and a standardized short tandem repeat (STR) profile have not been thoroughly established. This lack of comprehensive genetic characterization raises concerns regarding the potential for genetic drift or variability within the cell line, which could impact experimental reproducibility and reliability. Researchers using H9c2 cells should be aware of this limitation and consider verifying the identity of their cell lines through additional methods, such as DNA fingerprinting or other genomic analyses, to ensure consistency and accuracy in their studies.
In this study, we conducted a comprehensive genetic analysis of H9c2 cells. We established a karyotype and utilized multicolor fluorescence in situ hybridization (mFISH) to clarify the chromosomal makeup. Additionally, we established an STR profile with 31 species-specific markers to verify the identity and stability of the cell line. We also examined the transcriptome through mRNA sequencing (mRNA-Seq) using next-generation sequencing (NGS) and valuated the characteristic morphological traits of this rat heart cell line through electron microscopy, Western blotting, and Phalloidin staining.

2. Materials and Methods

2.1. Literature Search

The PubMed database was searched for papers that used H9c2 cells. The search was performed using the specific term “H9c2” to retrieve articles. No filters were applied, allowing for the identification of all studies related to the use of H9c2 cells in various experimental contexts.

2.2. Cell Culture

The rat cell line H9c2 was obtained from ATCC (CRL-1446) and cultured in Dulbecco's Modified Eagle’s Medium (DMEM, high glucose #D6171, Sigma-Aldrich, Merck, Taufkirchen, Germany) containing 1.5 g/L sodium bicarbonate, supplemented with 10% fetal bovine serum (#F7524, Sigma-Aldrich), 4 mM L-glutamine (#G7513, Sigma-Aldrich), and 1× penicillin/streptomycin (DE17-602E, Lonza, Cologne, Germany). The medium was changed every 2–3 days, and cells were split using Accutase® solution (A6964-100ML, Sigma-Aldrich) at a ratio of 1:3 when they reached confluence. All experiments were carried out at passages 2–4 after receiving the cells from ATCC. The cells were maintained at 37 °C in an environment with 95% air and 5% CO2.

2.3. Mycoplasma Testing

The identification of possible Mycoplasma species contaminations in cell culture supernatants was performed utilizing the Venor®GeM OneStep kit (#11-8050, Minerva Biolabs GmbH, Berlin, Germany) following the manufacturer’s instructions. Briefly, 2 µL of fresh medium (medium (-)), 2 µL of supernatant from H9c2 cell cultures, or 2 µL of the positive control provided with the kit were used for PCR. The PCR protocol included an initial cycle at 94 °C for 2 min, followed by 39 cycles at 94 °C for 30 s, 55 °C for 30 s, and 72 °C for 30 s, ending with a cooling phase at 4 °C. Subsequently, the PCR products were analyzed on a standard 2% agarose gel in 1× TAE buffer consisting out of 40 mM Tris, 20 mM acetic acid, and 1 mM EDTA (pH 8.6) for 50 min at 90 V, with ethidium bromide added for visualization. The resulting amplicons were then examined using a standard gel imaging system (Intas Science Imaging GmbH, Göttingen, Germany).

2.4. Short Tandem Repeat (STR) Profiling

The STR profiling and evaluation for interspecies contamination in H9c2 cells were performed using the cell line authentication service offered by IDEXX (Kornwestheim, Germany) through the CellCheckTM Rat system. This system employs a dinucleotide repeat assay to generate a genetic profile of the cells, consisting of 31 unique STR markers that are specific to different species.

2.5. Preparation of H9c2 Metaphase Chromosomes, Karyotyping, and Molecular Cytogenetics

Chromosomes from H9c2 cells were prepared following a standard protocol for metaphase preparation, with some modifications [16]. H9c2 cells were incubated at 37 °C in T25 flasks until they achieved a semi-confluent state. After treatment with KaryoMAX colcemid solution (#15212012, Gibco, ThermoFisher Scientific, Schwerte, Germany), the cells were detached from the flask surface using a gentle trypsin–EDTA solution (#T4174, Sigma-Aldrich) and collected in a centrifuge tube. Following a brief centrifugation step, the cells underwent hypotonic treatment with 0.56% KCl for 30 min at 37 °C before being fixed in a mixture of acetic acid and methanol (1:3). Chromosome spreads were then air-dried from the fixed cell suspension and used for mFISH as described before [17]. To detect interchromosomal rearrangements with the chromosomes of H9c2, the commercially available rat probe set 22xRat (MetaSystems, Altlussheim, Germany) was employed. It is important to note that due to the specific design of this probe set, chromosomes 13 and 14 cannot be distinguished after FISH analysis [18]. For analysis, 30 metaphases were examined using a Zeiss Axioplan microscope equipped with the ISIS software package, version 6.1.1, MetaSystems). To create standard chromosome banding patterns, metaphases were sorted according to FISH signals and counterstained with 4′,6-diamidino-2-phenylindole (DAPI), then transformed into an “inverted DAPI-banding” pattern with a single click in the software used.

2.6. Virtual Comparative Genomic Hybridization

By analyzing the data obtained from mFISH along with inverted DAPI-banding, we were able to identify approximate losses and gains of chromosomal regions in rat chromosomes. These regions were subsequently mapped to their estimated molecular positions based on Rat RGSC 5.0/rn5 using the UCSC genome browser. Employing the “View, In Other Genomes” feature allowed us to translate these regions into the human genome (build: GRCh37/hg19) and determine homologous regions with corresponding gains or losses.

2.7. Next-Generation Sequencing and Data Analysis

High-molecular-weight cellular RNA from five 100 mm2 plates of H9c2 cells, which were grown to 80% confluence, was isolated using a CsCl2 density gradient centrifugation protocol [19]. The concentration, purity, and quality of the purified RNA were assessed using standard UV spectroscopy and the Agilent 4200 TapeStation platform (Agilent Technologies Inc., Waldbronn, Germany). After depleting ribosomal RNA, mRNA was converted into a sequencing library using the NEBNext Multiplex Oligos for Illumina Index Primers Set 1 kit. Sequencing was performed on the Illumina platform (Illumina Inc., San Diego, CA, USA) with pre-filled cartridges (MiSeq Reagent kit V2, 300-cycles) from Illumina, and the results were converted into FASTQ data files. The cDNA library construction and sequencing took place at the IZKF Genomic Facility of the University Hospital Aachen. FASTQ files were generated using bcl2fastq (Illumina) before downstream analyses. Samples were processed using the nf-core/RNA-seq pipeline version 3.12 [20] in Nextflow 23.10.0 [21]. Lane-level reads were trimmed with Trim Galore 0.6.7 [22], aligned to the Rattus norvegicus (Rnor_6.0) reference transcriptome using STAR 2.7.9a [23], and quantified at gene and transcript levels with Salmon v1.10.1 [24], resulting in length-normalized Transcripts Per Million (TPM) values.

2.8. Electron Microscopic Cell Analysis

Electron microscopic analysis of H9c2 cells was performed following established protocols [25]. Cells were fixed in 1× phosphate-buffered saline (PBS) with 3% glutaraldehyde, washed with 0.1 M Soerensen’s phosphate buffer, and post-fixed in 1% osmium tetroxide. Dehydration was achieved using a series of ethanol solutions (30% to 100%), followed by incubation in propylene oxide and Epon resin mixtures, which were polymerized at 90 °C for two hours. Ultrathin sections (90–100 nm) were cut, stained with uranyl acetate and lead citrate, and examined with a Zeiss Leo 906 transmission electron microscope (Carl Zeiss AG, Oberkochen, Germany) at 60 kV. Images were captured at specified magnifications (2156×, 10,000×, 21,560×, and 27,800×), respectively.

2.9. Western Blot Analysis

Protein extracts, quantification, and Western blot analysis were performed following established protocols. Protein samples (50 µg/lane) were heated at 80 °C for 10 min and separated using 4–12% Bis-Tris gels (Invitrogen, Thermo Fisher Scientific, Schwerte, Germany) under reducing conditions with 2-(N-morpholino)ethanesulfonic acid (MES) running buffer. The proteins were transferred onto a 0.45 µm nitrocellulose membrane (#GE10600002, AmershamTM Protran® Western-Blotting Membranes, Merck), with transfer efficiency verified by Ponceau S staining. Blocking was carried out in Tris-buffered saline containing 0.1% Tween 20 and 5% non-fat milk powder. The membranes were incubated with primary antibodies and detection was achieved using horseradish peroxidase-conjugated secondary antibodies and chemiluminescence (Supersignal™ West Dura extended duration substrate, #34076, Thermo Fisher Scientific, Schwerte, Germany). As a positive control, we used protein extracts generated from the heart of a female rat that was homogenized in an MM400 mixer mill (Retsch GmbH, Haan, Germany) using an established protocol [26]. Details of the antibodies used in our study are provided in Table 1.

2.10. Phalloidin Stain

Microfilament staining was conducted according to previously established methods [27]. In summary, 30,000 H9c2 cells were plated on glass coverslips placed in a 24-well plate. After a 48 h incubation period, the medium was removed, and the cells were rinsed with phosphate-buffered saline (PBS) before being fixed in 3.7% paraformaldehyde (pH 7.4) for 20 min in the dark. Subsequently, the cells were permeabilized using a precooled solution of 0.1% sodium citrate and 0.1% Triton X-100 for 3 min on ice. After additional washes in PBS, nonspecific binding sites were blocked with PBS containing 50% fetal bovine serum (FBS) and 0.5% bovine serum albumin (BSA) for one hour at room temperature. Under exclusion of light, the cells were then stained with an Alexa Fluor™ 488 Phalloidin conjugate for 20 min, followed by nuclear counterstaining with 200 ng/mL DAPI solution (#D1306, Thermo Fisher Scientific) for 15 min. Finally, samples were mounted using PermaFluor™ aqueous mounting medium (#TA-030-FM, Thermo Fisher Scientific) and observed under a Nikon Eclipse E80i fluorescence microscope equipped with the NIS-Elements Vis software package (version 3.22.01). For detailed protocol instructions, please refer to [27].

3. Results

3.1. Usage of H9c2 Cells in Biomedical Research

H9c2 cells play a crucial role in biomedical research, especially in the study of cardiovascular diseases and cardiac physiology. Their ability to differentiate into cardiomyocyte-like cells makes them a valuable model for investigating various aspects of heart function, drug responses, and disease mechanisms [2]. The widespread use of H9c2 cells is evident by their inclusion in 7334 studies listed on PubMed as of 12 February 2025. This extensive research highlights the importance of H9c2 cells in advancing our understanding of cardiac biology and developing therapeutic strategies for heart-related conditions.

3.2. Phenotypic Appearance of H9c2 Cells

The phenotypic characteristics of H9c2 cells, as observed through light microscopy, show a distinct morphology typical of cardiac progenitor cells (Figure 1). These cells often have a fibroblast-like appearance with elongated and spindle-shaped structures, allowing them to form a dense and flat monolayer when cultured. Under optimal growth conditions, H9c2 cells exhibit prominent cytoplasmic extensions and can sometimes cluster together, indicating their ability to spontaneously differentiate into cardiomyocyte-like cells.

3.3. Electron Microscopic Analysis of H9c2 Cells

When observing H9c2 cells through electron microscopy, it becomes apparent that these cells have a well-developed cytoplasm abundant in mitochondria, vacuoles, lipid droplets, and lysosomes, indicating high metabolic activity (Figure 2). The presence of a significant amount of rough endoplasmic reticulum (rER) suggests a high level of protein synthesis, supporting the metabolic demands of these cells.

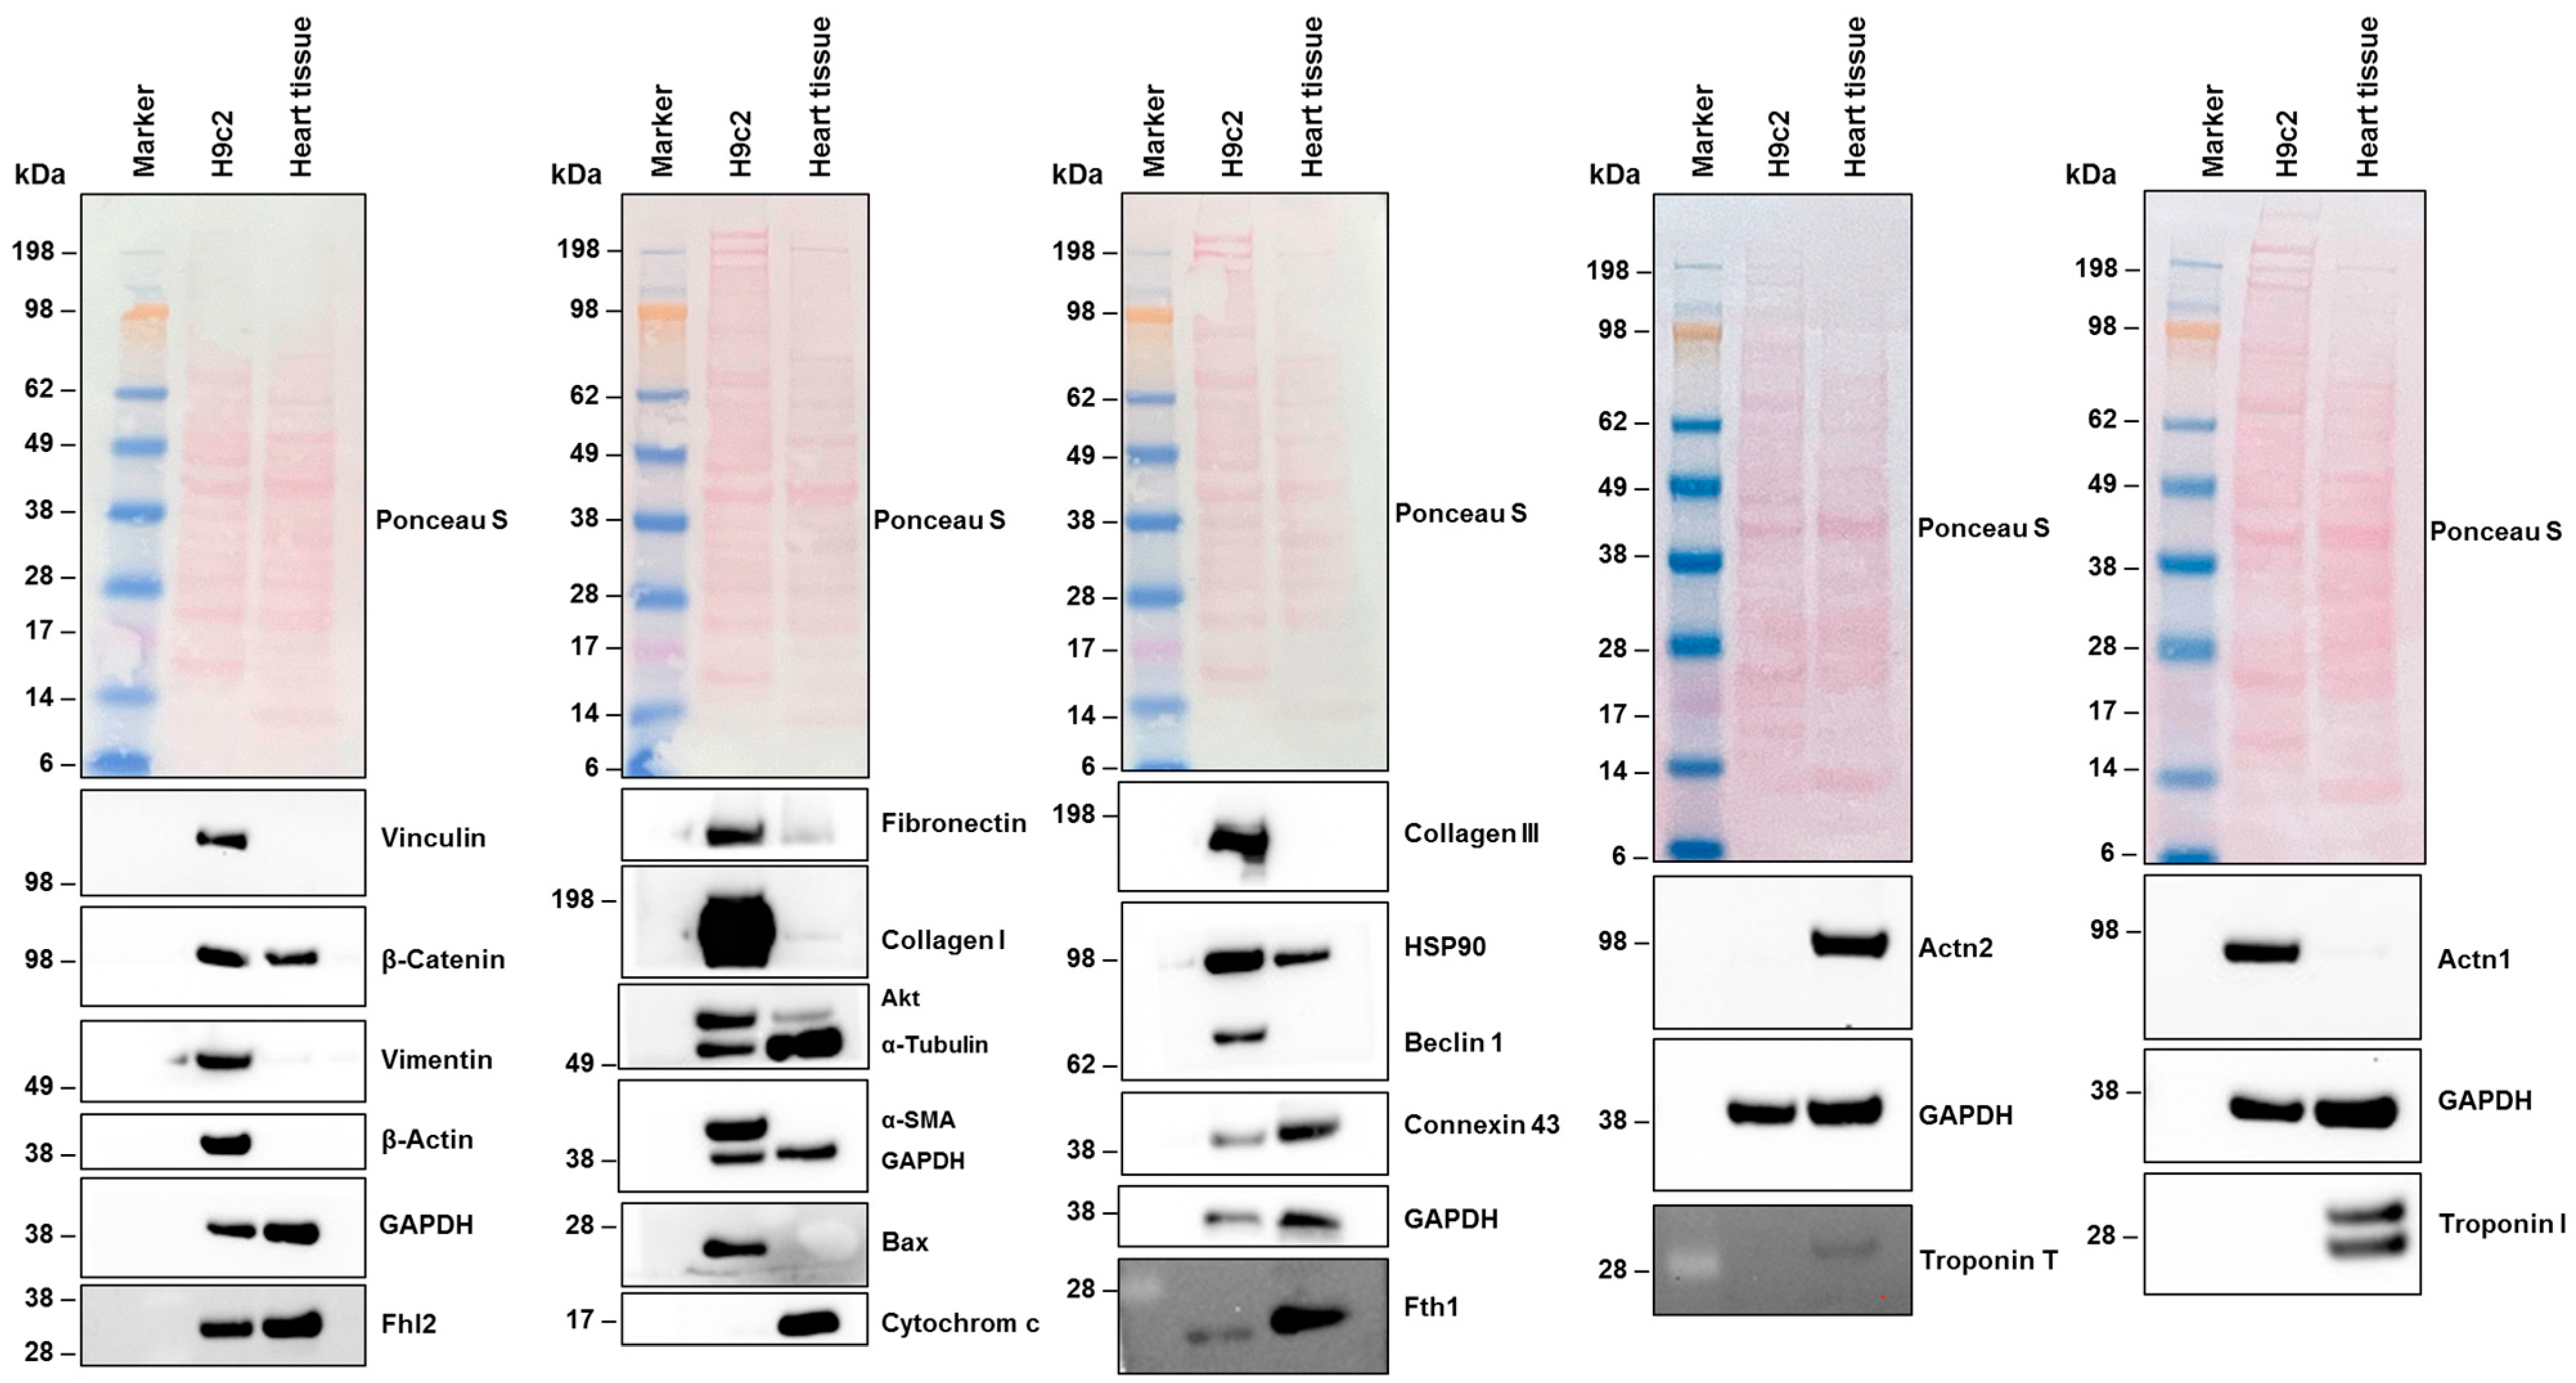
3.4. Expression of Typical Fibroblast Markers in H9c2 Cells

3.4.1. Next-Generation Sequencing

To analyze the expression profile of H9c2 cells without bias, we conducted next-generation sequencing (NGS) mRNA sequencing. This method provided a comprehensive overview of the gene expression in this cell line. Our investigations revealed a diverse gene expression profile that indicates their cardiac lineage and functional potential. Notably, we found the expression of various members of the myosin family, which play critical roles in muscle contraction and cellular motility (Table 2).
The presence of these myosin genes suggests that H9c2 cells retain key features associated with cardiac muscle function, highlighting their potential as an excellent model for studying contractile mechanisms and heart development. Furthermore, the differential expression of specific myosin isoforms may provide insights into the regulatory pathways governing cardiomyocyte differentiation and maturation.
In our NGS analysis of H9c2 cells, we identified several additional classical markers of cardiomyocytes, further confirming their cardiac lineage and functional properties. Among the marker genes detected were genes that are known to be either cardiomyocyte-specific or functionally relevant in cardiomyocytes. Examples include Actn1, Actc1, Adipoq, Adipor1, Adipor2, Alcam, Ankrd1, Atp2a2, Anxa5, Anxa6, Bdnf, Bmp4, Cav2, Cav3, Cdh2, Cpt1a, Csrp2, Ctnnb1, Des, Dmd, Eno3, Fabp3, Fgf2, Fhl2, Gata-4, Gata-6, Gja1, Hand2, Il11ra, Igf1, Lox, Mef2c, Mfn2, Mitf, Mov10l1, Notch1, Nkx2-5, Pde1a, Pde4d, Pygm, Rgd1565355 (CD36), Ryr2, Sgpl1, Tnnc1, Tnni3, Tnnt1, Tnnt2, Tpm1, Trpv1, Ttn, and Pnmt (Table 3). The expression of these genes indicates key processes involved in cardiac development and function. This comprehensive gene expression profile highlights the utility of H9c2 cells as a relevant model for investigating cardiomyocyte biology and offers insights into the molecular mechanisms underlying heart physiology and pathology.
However, we found no expression of the natriuretic peptides Nppa (atrial natriuretic factor, ANF), Nppb (brain natriuretic peptide, BNP), and Nppc (natriuretic peptide, type C, CNP) genes, which are abundantly expressed in the atrial and ventricular myocardium during embryonic and fetal stages and are relevant in cardiac remodeling (Table S1) [29,30].
Additionally, there were no transcripts found for Pou5f1 (OCT4), a factor of pluripotency that drives the dedifferentiation of adult cardiomyocytes into a fetal state [31]. The transcription factor Hand1 (eHAND), marking cardiac progenitor cells, was also not expressed in H9c2 (Table S1) [32]. In contrast, the closely related Hand2 (dHand), which alone is sufficient to promote differentiation onset, was expressed in H9c2 cells [33]. Furthermore, Fgf23 and Cxcr4, typically expressed by cardiac myocytes and important for cardiogenesis [34,35] were not found to be expressed in H9c2 cells.

3.4.2. Analysis of Protein Expression and Cytoskeletal Organization in H9c2 Cells

Our NGS data of H9c2 cells has shown the expression of a variety of genes previously associated with cardiomyocyte functionality. In addition to those mentioned above, we identified the expression of vinculin (Vcl) [36], β-catenin (Ctnnb1) [37], vimentin (Vim) [38], β-actin (Actb) [39], four and a half LIM domain 2 (Fhl2) [40], fibronectin (Fn1) [41], collagen type I α 2 chain (Col1a2) [42], AKT serine/threonine kinase 1 (Akt1) [43], tubulin α1A (Tuba1) [44], α-smooth muscle actin (Acta2) [45], BCL2-associated X (Bax) [46], cytochrome c (Cycs) [47], collagen type III α1 (Col3a1) [42], heat shock protein 90 (Hsp90aa1) [48], beclin 1 (Becn1) [49], gap junction protein α1 (Gja1) [50], and ferritin heavy chain 1 (Fth1) [51] (Table S2).
Western blot analysis confirmed the expression of all these genes in H9c2 cells (Figure 3). Specifically, vinculin, vimentin, β-actin, fibronectin, collagen type I, AKT, Bax, collagen type III, and beclin 1 showed increased expression in H9c2 cells compared to their expression in total heart cell extracts from female rats. Additionally, we found protein expression of actinin, alpha 1 (Actn1), but no expression of actinin, alpha 2 (Actn2). These findings align with the NGS data (Table 3). Furthermore, troponin I, which was expressed at overall low quantities in NGS (0.52 TPM), and troponin T, which was expressed in similar mRNA quantities to Actn1, was undetectable at the protein level in H9c2 cells. However, these proteins were present in extracts of heart tissue, confirming the functionality of the antibodies used.
One characteristic feature of cardiomyocytes is the presence of a non-contractile, densely packed cytoskeleton composed of cytoplasmic actin, microtubules, and intermediate filaments. This cytoskeleton plays crucial roles in the electrical and mechanical coupling of cardiomyocytes [39].
Specifically, actin is a vital component of sarcomeres in cardiomyocytes that can transition between a monomeric (G-actin) and a polymeric filamentous (F-actin) form. Staining H9c2 cells with Alexa Fluor 488TM-labeled Phalloidin conjugate resulted in the labeling of F-actin filaments, displaying the typical bundle morphology of these large and flat growing cells (Figure 4).

3.5. Karyotype Based on Molecular Cytogenetic Analyses

The karyotype of the rat cell line H9c2 reveals a chromosomal composition characterized by significant aneuploidy and structural abnormalities (Figure 5).
The karyogram analysis revealed a chromosome count ranging from 74 to 81, indicating a triploid status (3n), commonly seen in transformed cell lines. Among the chromosomes, two X chromosomes are present, with one showing notable deletions between bands q2 and q3. Additionally, there is an extra copy of chromosome 1, and a small derivative of chromosome 1 with loss of the entire long arm distal from subband q12. In addition to three copies of chromosome 2, there is an additional derivative of chromosome 2 with the loss of the entire long arm starting at subband q13. Notably, there are no normal chromosomes; instead, three additional derivatives of chromosome 12 are present, consisting predominantly of the short arm of chromosome 12 and the long arm of chromosome 3. The karyotype also includes three copies of chromosome 20 material. However, one chromosome 20 underwent a fission event, leading to two derivative chromosomes 20: one consisting of the long arm and one of the short arm of a normal chromosome 20. One extra copy each of chromosomes 6, 9, and 14 is present. Finally, a derivative chromosome 12 involving both the X chromosome and chromosome 12 was identified.
Overall, this karyotype reflects the genetic changes that occur during the adaptation or transformation processes typical for H9c2 cells. These chromosomal abnormalities may have implications for their behavior in research contexts, particularly in studies related to cardiac function or disease models.

3.6. Virtual Comparative Genomic Hybridization

We conducted virtual Comparative Genomic Hybridization (vCGH), a powerful tool for analyzing genomic alterations in cell lines. The motivation behind performing vCGH in H9c2 cells stems from the need to gain a deeper understanding of the genetic landscape and chromosomal abnormalities, such as gains, losses, and structural rearrangements, that contribute to the cellular characteristics of H9c2 cells. These alterations may impact their behavior and responsiveness in experimental settings.
The results of the vCGH analysis on H9c2 cells reveal significant genomic alterations, including both gains and losses across various chromosomes (Table 4).
Starting with the gains, there is a notable duplication in the region from 1pter to 1q12, which corresponds to several human chromosomal regions, including 6q22.31 to q27 and others, indicating a complex gain involving multiple loci. Additionally, there is an increase in copy number from 1q12 to 1qter, suggesting further amplification in this chromosome segment that spans multiple human regions, such as 10q23.2 to q26.3 and others. The analysis also identified gains on chromosome 2, with a specific increase noted from 2pter to q13. Chromosome 6 exhibits a gain from its short arm (p) to the long arm (q), while chromosome 9 shows an overall gain from pter to qter. Furthermore, there is a significant amplification involving chromosome 12, where four additional copies were detected in the region extending from pter to q12.
Losses are equally prominent in this karyotype; specifically, there is a substantial deletion observed on chromosome 3 from pter to q11, resulting in three missing copies. Additionally, the X chromosome displays a loss between bands Xq2 and Xq3.
Nevertheless, the visualization of the vCGH analysis demonstrates that the gains in this cell line are more prominent than the losses (Figure 6).
Most cardiac cancers in humans are secondary, with intimate and undifferentiated sarcomas being the most common primary ones. Interestingly, amplification of MDM2 (12q15), MDM4 (1q32.1), and CDK6 (7q21.2) is frequently observed, along with PDGFRA (4q12), CDK4 (12q14.1), and TERT (5p15.33) in humans [54]. In the H9c2 cell line, an increase in copy numbers is seen in regions containing CDK6 (four additional copies), PDGFRA (one additional copy), and TERT (two additional copies). The loss of 9q material is also associated with human sarcomas [55,56].
These results indicate significant chromosomal rearrangements within H9c2 cells, which could be a hint at the evolution of the original embryonic rat heart cells toward malignant, potentially immortal cells similar to human sarcoma. The methylation pattern of H9c2 cells may also be similar to that of intimal and undifferentiated cardiac sarcomas, as described by [54]. Additionally, mutation analyses in MDM2 (12q15), MDM4 (1q32.1), CDK4 (12q14.1), and TERT may be of interest to check for known mutations with oncogenic potential.

3.7. Short Tandem Repeat Analysis

Subsequently, we conducted STR profiling on H9c2 cells to assess their genetic stability and establish a marker panel for verifying the authenticity of this cell line. It is important to note that despite the widespread use of H9c2 cells in cardiovascular research, there is no published STR profile available for them, highlighting the significance of our analysis. We employed a comprehensive panel of 31 markers located across 20 autosomes of the rat genome for the STR profiling (Table 5).
The STR profile we have established for H9c2 cells is unique and distinctly differs from those of other rat cell lines, such as CFSC-2G, HSC-T6, PAV-1, and Rat-1, which we reported previously [19,25,57,58]. This differentiation highlights the genetic uniqueness of H9c2 cells and reinforces their identity as a distinct cell line.

4. Discussion

In this study, we conducted a comprehensive genetic characterization of the H9c2 cell line, commonly used in cardiovascular research. A significant contribution of our work is establishing a unique STR profile for H9c2 cells. This genetic fingerprint enables quick and reliable confirmation of the identity of this cell line, preventing issues related to misidentification or cross-contamination in biomedical research. It also helps assess the genetic stability of the cell line and addresses previous concerns about potential genetic drift, which can affect experimental reproducibility [59].
Additionally, our karyotyping and molecular cytogenetic analyses revealed complex chromosomal characteristics typical of transformed cell lines. We identified significant chromosomal alterations in H9c2 cells, including aneuploidy and structural abnormalities common in transformed cell lines. The karyotype showed chromosome counts ranging from 74 to 81, indicating a triploid status. Notable findings included deletions on chromosomes X and 2, and additional copies of chromosomes 1, 6, and 9. We also observed derivative chromosomes from translocations involving chromosomes 3 and 12. These chromosomal changes may impact the cellular behavior of H9c2 cells, affecting their proliferation, differentiation potential, and response to experimental conditions. Understanding these genetic changes is crucial for accurately interpreting research outcomes when using H9c2 cells in cardiovascular studies.
Chromosomal changes during routine cell culture can influence cellular behavior, including proliferation, differentiation, and response to stressors [60]. Genetic factors play a crucial role in cardiovascular research, where cellular responses and disease outcomes can vary significantly based on the genetic context and cell state [61,62].
NGS analysis and Western blot analysis provided valuable insights into the transcriptomic landscape of H9c2 cells. Our findings indicate that these cells retain key features associated with cardiac lineage, as shown by the expression of various myosin genes and other cardiomyocyte-specific markers. These findings align with previous proteomic investigations of H9c2 cells, suggesting that this cell line is a suitable model for very immature myogenic cells with skeletal muscle commitment [15]. The determined gene expression profile can now be used by researchers to analyze molecular pathways and identify potential key regulatory networks in H9c2 cells.
Nevertheless, despite their advantages as an in vitro model system, it is essential to acknowledge certain limitations associated with H9c2 cells. While they exhibit many characteristics similar to primary cardiomyocytes, they do not fully replicate the complexity of adult heart tissue or its microenvironment. For instance, our analysis showed a lack of expression for natriuretic peptides, markers typically abundant in mature cardiomyocytes, which may affect their utility in specific applications related to heart failure or hypertrophy studies [63]. Consequently, findings derived from H9c2 studies should be interpreted cautiously when extrapolating to in vivo conditions.
We should acknowledge that our NGS data were obtained from H9c2 cells cultured under basal conditions without the addition of substances such as retinoic acid, which are known to drive the differentiation of the expression profile toward mature cardiomyocytes [2]. It is evident that differentiation involves the activation of specific signaling pathways that regulate gene expression essential for cardiac development, including the upregulation of cardiac-specific transcription factors like GATA4 and NKx2.5 [9,10]. Additionally, the transformation influences cellular morphology, promoting structural changes characteristic of mature cardiomyocytes, such as the formation of sarcomeres and enhanced contractility. Furthermore, this differentiation process is associated with alterations in metabolic activity as cells transition from glycolytic to oxidative phosphorylation metabolism, crucial for the energy demands of functional heart tissue. Therefore, it is important to note that the NGS data presented in our study are specific only to the undifferentiated state of H9c2 cells. It is now crucial to analyze the mRNA expression profile of H9c2 cells in different cellular states. This analysis has the potential to identify novel pathways that drive the differentiation process.
The absence of Oct4 expression in H9c2 cells under the chosen culture conditions suggests that they have likely passed the pluripotent stage and are now committed to a differentiated state, which aligns with their origin as embryonic cardiac myoblasts. This is in contrast to induced pluripotent stem cells (iPSCs), where Oct4 can be reintroduced to convert differentiated cells back to a pluripotent state [64,65,66].
Moreover, analysis of representative cardiac-specific proteins showed that H9c2 cells exhibited a strong expression of Actn1, while Actn2 was only expressed at a low level at the mRNA level and virtually absent at the protein level. Similarly, we found no expression of troponin I (Tnni3) at the mRNA and protein levels under the chosen culture conditions. Interestingly, we observed mRNA expression of troponin T (Tnnt2) but failed to detect TNNT2 protein expression in H9c2 cells. Conducting a differential expression analysis comparing H9c2 cells to other cardiac or non-cardiac cell lines, or studying gene expression changes throughout differentiation processes, could provide valuable insights into the regulatory pathways controlling cardiomyocyte differentiation and maturation. These comparative studies may help pinpoint key genes and networks involved in cardiac development and diseases. Additionally, future research on DNA methylation patterns could offer further understanding of the epigenetic control of gene expression in H9c2 cells and how they differ from primary cardiac cells. Furthermore, further in-depth studies investigating the expression changes in H9c2 cells in response to various stimuli, such as pro-inflammatory cytokines (IL-1β, IL-6, TNF-α) and endotoxins like lipopolysaccharide (LPS), would be an intriguing avenue for future research. These studies could offer valuable insights into the molecular mechanisms of cardiac inflammation and stress responses, thereby enhancing the utility of H9c2 cells as a model for cardiac disease and therapeutic interventions.
In sum, while H9c2 cells are widely utilized across numerous studies within cardiovascular research, with over 7000 publications citing their use, e.g., [67,68,69], there remains a need for ongoing validation and characterization efforts among different laboratories to ensure consistency in results across various experimental settings. Therefore, we encourage researchers utilizing this cell line to consider both its strengths and limitations carefully while exploring innovative approaches to enhance its applicability within cardiovascular medicine. Future investigations focusing on gene editing techniques or co-culture systems with primary cardiomyocytes could further elucidate mechanisms underlying cardiac function and disease processes using H9c2-derived models.

5. Conclusions

In conclusion, this study provides a thorough genetic characterization of the H9c2 cell line, which serves as an important model for cardiac myoblast research. By establishing a comprehensive short tandem repeat (STR) profile and karyotype, we have confirmed the identity and stability of H9c2 cells, addressing concerns regarding genetic drift that may affect experimental reproducibility. The use of NGS has elucidated a diverse gene expression profile that supports the cardiac lineage of H9c2 cells, revealing key markers associated with cardiomyocyte functionality and development. H9c2 cells exhibit significant morphological and biochemical characteristics typical of cardiac myoblasts, including the expression of essential proteins involved in muscle contraction and cytoskeletal organization. While acknowledging their limitations as an in vitro model compared to primary cardiomyocytes, our work highlights the relevance of H9c2 cells in cardiovascular research. The established genetic resources from this study will not only facilitate future investigations into cardiac function but also support the ongoing efforts to develop therapeutic strategies for heart-related conditions and to use H9c2 cells in research aiming to understand the complexities of cardiac biology and pathology.

Supplementary Materials

The following supporting information can be downloaded at https://www.mdpi.com/article/10.3390/cells14070502/s1, Figure S1: Testing for Mycoplasma spp. infection in H9c2 cells using the Venor®GeM OneStep PCR detection kit; Figure S2: Chromatograms of the short tandem repeat (STR) profile for the 31 variant markers in H9c2 cells; Table S1: Gene expression in H9c2 cells as assessed by next-generation sequencing; Table S2: Molecular correlates of mRNA expression in H9c2 cells.

Author Contributions

Conceptualization, T.L. and R.W.; methodology, S.K., K.S.H., E.M.B., D.T.K., S.K.S.-L. and R.W.; validation, T.L. and R.W.; formal analysis, T.L., S.K., K.S.H., E.M.B., D.T.K., S.K.S.-L. and R.W.; investigation, S.K., K.S.H., E.M.B., S.K.S.-L. and R.W.; resources, T.L., H.N. and R.W.; data curation, T.L., S.K., K.S.H., E.M.B., S.K.S.-L. and R.W.; writing—original draft preparation, R.W.; writing—review and editing, T.L., S.K., K.S.H., E.M.B., H.N., D.T.K., S.K.S.-L. and R.W.; visualization, T.L., K.S.H., E.M.B., S.K.S.-L. and R.W.; supervision, T.L. and R.W.; project administration, T.L. and R.W.; funding acquisition, R.W. All authors have read and agreed to the published version of the manuscript.

Funding

R.W. is supported by grants from the German Research Foundation (project WE2554/17-1) and the Deutsche Krebshilfe (grant 70115581). R.W. and H.N. are further supported by grants from the Interdisciplinary Centre for Clinical Research within the Faculty of Medicine at the RWTH Aachen University (grants PTD 1-5 and PTD1-12).

Institutional Review Board Statement

Not applicable.

Informed Consent Statement

Not applicable.

Data Availability Statement

The original contributions presented in this study are included in the article/Supplementary Materials. Further inquiries can be directed to the corresponding authors.

Acknowledgments

The authors would like to thank Sabine Weiskirchen from the RWTH University Hospital Aachen for preparing the graphical abstract for this paper. Additionally, we are grateful to Julia Steitz (RWTH University Hospital Aachen) for supplying surplus female hearts from untreated wild-type rats, which were provided to us in accordance with the 3R principle from prior experiments. In addition, the authors would like to thank Claudia Krusche from the Institute of Molecular and Cellular Anatomy, and Peter Boor from the Institute of Pathology at RWTH University Hospital Aachen for providing antibodies for cardiac marker proteins.

Conflicts of Interest

R.W. is a Section Editor-in-Chief for Cells and an Associate Editor of Livers, both of which are journals published by MDPI. All other authors declare no conflicts of interest.

Abbreviations

The following abbreviations are used in this manuscript:
DAPI4′,6-diamidino-2-phenylindole
mFISHmulticolor fluorescence in situ hybridization
mRNA-SeqmRNA sequencing
NGSnext-generation sequencing
STRshort tandem repeat
TPMTranscripts Per Million
vCGHvirtual Comparative Genomic Hybridization

References

  1. Kimes, B.W.; Brandt, B.L. Properties of a clonal muscle cell line from rat heart. Exp. Cell Res. 1976, 98, 367–381. [Google Scholar] [CrossRef]
  2. Suhaeri, M.; Subbiah, R.; Van, S.Y.; Du, P.; Kim, I.G.; Lee, K.; Park, K. Cardiomyoblast (h9c2) differentiation on tunable extracellular matrix microenvironment. Tissue Eng. Part A 2015, 21, 1940–1951. [Google Scholar] [CrossRef]
  3. Branco, A.F.; Pereira, S.P.; Gonzalez, S.; Gusev, O.; Rizvanov, A.A.; Oliveira, P.J. Gene expression profiling of H9c2 myoblast differentiation towards a cardiac-like phenotype. PLoS ONE 2015, 10, e0129303. [Google Scholar] [CrossRef]
  4. Rishiq, A.; Islam, O.; Golomb, E.; Gilon, D.; Smith, Y.; Savchenko, I.; Eliaz, R.; Foo, R.S.; Razin, E.; Tshori, S. The role played by transcription factor E3 in modulating cardiac hypertrophy. Int. Heart J. 2021, 62, 1358–1368. [Google Scholar] [CrossRef] [PubMed]
  5. Li, G.M.; Chen, J.R.; Zhang, H.Q.; Sun, C.; Chen, G.R.; Xiong, Q.Y.; Cao, X.Y.; Yu, L.; Lin, Z.W.; Qin, J.Y.; et al. Rhein activated Fas-induced apoptosis pathway causing cardiotoxicity in vitro and in vivo. Toxicol. Lett. 2022, 363, 67–76. [Google Scholar] [CrossRef] [PubMed]
  6. Wang, Q.; Chen, W.; Yang, X.; Song, Y.; Sun, X.; Tao, G.; Wang, H.; Zhao, N.; Huang, Y.; Chai, E.; et al. Inhibition of miRNA-1-mediated inflammation and autophagy by Astragaloside IV improves lipopolysaccharide-induced cardiac dysfunction in rats. J. Inflamm. Res. 2022, 15, 2617–2629. [Google Scholar] [CrossRef]
  7. Huang, J.P.; Cheng, M.L.; Wang, C.H.; Huang, S.S.; Hsieh, P.S.; Chang, C.C.; Kuo, C.Y.; Chen, K.H.; Hung, L.M. Therapeutic potential of cPLA2 inhibitor to counteract dilated-cardiomyopathy in cholesterol-treated H9C2 cardiomyocyte and MUNO rat. Pharmacol. Res. 2020, 160, 105201. [Google Scholar] [CrossRef]
  8. Isa, H.I.; Ferreira, G.C.H.; Crafford, J.E.; Botha, C.J. Epoxyscillirosidine induced cytotoxicity and ultrastructural changes in a rat embryonic cardiomyocyte (H9c2) cell line. Toxins 2019, 11, 284. [Google Scholar] [CrossRef]
  9. Zheng, M.; Zhu, J.; Lu, T.; Liu, L.; Sun, H.; Liu, Z.; Tian, J. p300-mediated histone acetylation is essential for the regulation of GATA4 and MEF2C by BMP2 in H9c2 cells. Cardiovasc. Toxicol. 2013, 13, 316–322. [Google Scholar] [CrossRef]
  10. Si, L.; Shi, J.; Gao, W.; Zheng, M.; Liu, L.; Zhu, J.; Tian, J. Smad4 mediated BMP2 signal is essential for the regulation of GATA4 and Nkx2.5 by affecting the histone H3 acetylation in H9c2 cells. Biochem. Biophys. Res. Commun. 2014, 450, 81–86. [Google Scholar] [CrossRef]
  11. He, Z.; Zhou, Y.; Li, S.; Li, W.; Zhang, Y.; Guo, C.; Guo, Z.; Wei, B.; Bi, Y. Bioactive peptides and evaluation of cardiac cytoprotective effects of red millet yellow wine as functional food. Foods 2024, 13, 4111. [Google Scholar] [CrossRef] [PubMed]
  12. Qiu, X.; Yao, Y.; Chen, Y.; Li, Y.; Sun, X.; Zhu, X. TRPC5 promotes intermittent hypoxia-induced cardiomyocyte injury through oxidative stress. Nat. Sci. Sleep 2024, 16, 2125–2141. [Google Scholar] [CrossRef]
  13. Cai, C.; Sang, C.; Du, J.; Jia, H.; Tu, J.; Wan, Q.; Bao, B.; Xie, S.; Huang, Y.; Li, A.; et al. Knockout of tnni1b in zebrafish causes defects in atrioventricular valve development via the inhibition of the myocardial wnt signaling pathway. FASEB J. 2019, 33, 696–710. [Google Scholar] [CrossRef]
  14. Wen, X.; Iwata, K.; Ikuta, K.; Zhang, X.; Zhu, K.; Ibi, M.; Matsumoto, M.; Asaoka, N.; Liu, J.; Katsuyama, M.; et al. NOX1/NADPH oxidase regulates the expression of multidrug resistance-associated protein 1 and maintains intracellular glutathione levels. FEBS J. 2019, 286, 678–687. [Google Scholar] [CrossRef] [PubMed]
  15. Lenčo, J.; Lenčová-Popelová, O.; Link, M.; Jirkovská, A.; Tambor, V.; Potůčková, E.; Stulík, J.; Šimůnek, T.; Štěrba, M. Proteomic investigation of embryonic rat heart-derived H9c2 cell line sheds new light on the molecular phenotype of the popular cell model. Exp. Cell Res. 2015, 339, 174–186, Erratum in Exp. Cell Res. 2016, 343, 267. https://doi.org/10.1016/j.yexcr.2016.02.007. [Google Scholar] [CrossRef] [PubMed]
  16. Hamta, A.; Adamovic, T.; Samuelson, E.; Helou, K.; Behboudi, A.; Levan, G. Chromosome ideograms of the laboratory rat (Rattus norvegicus) based on high-resolution banding, and anchoring of the cytogenetic map to the DNA sequence by FISH in sample chromosomes. Cytogenet. Genome. Res. 2006, 115, 158–168. [Google Scholar] [CrossRef]
  17. Liehr, T. Multicolor-FISH—Methods and applications. In Cytogenetics and Molecular Cytogenetics; Liehr, T., Ed.; Taylor and Francis: Milton Park, UK, 2022; pp. 151–156, eBook; ISBN 9781003223658. [Google Scholar]
  18. MetaSystems Probes. Available online: https://metasystems-probes.com/en/probes/mfish/d-1525-060-di/ (accessed on 11 January 2025).
  19. Liehr, T.; Kankel, S.; Buhl, E.M.; Schröder-Lange, S.K.; Weiskirchen, R. Genetic characteristics of the rat fibroblast cell line Rat-1. Cells 2024, 14, 21. [Google Scholar] [CrossRef]
  20. Ewels, P.A.; Peltzer, A.; Fillinger, S.; Patel, H.; Alneberg, J.; Wilm, A.; Garcia, M.U.; Di Tommaso, P.; Nahnsen, S. The nf-core framework for community-curated bioinformatics pipelines. Nat. Biotechnol. 2020, 38, 276–278. [Google Scholar] [CrossRef]
  21. Di Tommaso, P.; Chatzou, M.; Floden, E.W.; Barja, P.P.; Palumbo, E.; Notredame, C. Nextflow enables reproducible computational workflows. Nat. Biotechnol. 2017, 35, 316–319. [Google Scholar] [CrossRef]
  22. Krueger, F.; James, F.; Ewels, P.; Afyounian Schuster-Boeckler, B. FelixKrueger/TrimGalore: v0.6.7—DOI via Zenodo. Available online: https://zenodo.org/records/5127899 (accessed on 20 February 2025).
  23. Dobin, A.; Davis, C.A.; Schlesinger, F.; Drenkow, J.; Zaleski, C.; Jha, S.; Batut, P.; Chaisson, M.; Gingeras, T.R. STAR: Ultrafast universal RNA-seq aligner. Bioinformatics 2013, 29, 15–21. [Google Scholar] [CrossRef]
  24. Patro, R.; Duggal, G.; Love, M.I.; Irizarry, R.A.; Kingsford, C. Salmon provides fast and bias-aware quantification of transcript expression. Nat. Methods 2017, 14, 417–419. [Google Scholar] [CrossRef]
  25. Nanda, I.; Schröder, S.K.; Steinlein, C.; Haaf, T.; Buhl, E.M.; Grimm, D.G.; Weiskirchen, R. Rat hepatic stellate cell line CFSC-2G: Genetic markers and short tandem repeat profile useful for cell line authentication. Cells 2022, 11, 2900. [Google Scholar] [CrossRef]
  26. Schröder, S.K.; Tag, C.G.; Kessel, J.C.; Antonson, P.; Weiskirchen, R. Immunohistochemical detection of estrogen receptor-beta (ERβ) with PPZ0506 antibody in murine tissue: From pitfalls to optimization. Biomedicines 2022, 10, 3100. [Google Scholar] [CrossRef] [PubMed]
  27. Schröder, S.K.; Tag, C.G.; Weiskirchen, S.; Weiskirchen, R. Phalloidin staining for F-actin in hepatic stellate cells. Methods Mol. Biol. 2023, 2669, 55–66. [Google Scholar] [CrossRef]
  28. Kodama, M.; Furutani, K.; Kimura, R.; Ando, T.; Sakamoto, K.; Nagamori, S.; Ashihara, T.; Kurachi, Y.; Sekino, Y.; Furukawa, T.; et al. Systematic expression analysis of genes related to generation of action potentials in human iPS cell-derived cardiomyocytes. J. Pharmacol. Sci. 2019, 140, 325–330. [Google Scholar] [CrossRef] [PubMed]
  29. Man, J.; Barnett, P.; Christoffels, V.M. Structure and function of the Nppa-Nppb cluster locus during heart development and disease. Cell Mol. Life Sci. 2018, 75, 1435–1444. [Google Scholar] [CrossRef] [PubMed]
  30. Dickinson, Y.A.; Moyes, A.J.; Hobbs, A.J. C-type natriuretic peptide (CNP): The cardiovascular system and beyond. Pharmacol. Ther. 2024, 262, 108708. [Google Scholar] [CrossRef]
  31. Chen, Y.; Lüttmann, F.F.; Schoger, E.; Schöler, H.R.; Zelarayán, L.C.; Kim, K.P.; Haigh, J.J.; Kim, J.; Braun, T. Reversible reprogramming of cardiomyocytes to a fetal state drives heart regeneration in mice. Science 2021, 373, 1537–1540. [Google Scholar] [CrossRef]
  32. Okubo, C.; Narita, M.; Inagaki, A.; Nishikawa, M.; Hotta, A.; Yamanaka, S.; Yoshida, Y. Expression dynamics of HAND1/2 in in vitro human cardiomyocyte differentiation. Stem Cell Rep. 2021, 16, 1906–1922. [Google Scholar] [CrossRef]
  33. Guo, H.; Hang, C.; Lin, B.; Lin, Z.; Xiong, H.; Zhang, M.; Lu, R.; Liu, J.; Shi, D.; Xie, D.; et al. HAND factors regulate cardiac lineage commitment and differentiation from human pluripotent stem cells. Stem Cell Res. Ther. 2024, 15, 31. [Google Scholar] [CrossRef]
  34. Eitner, F.; Richter, B.; Schwänen, S.; Szaroszyk, M.; Vogt, I.; Grund, A.; Thum, T.; Heineke, J.; Haffner, D.; Leifheit-Nestler, M. Comprehensive expression analysis of cardiac fibroblast growth factor 23 in health and pressure-induced cardiac hypertrophy. Front. Cell Dev. Biol. 2022, 9, 791479. [Google Scholar] [CrossRef] [PubMed]
  35. Agarwal, U.; Ghalayini, W.; Dong, F.; Weber, K.; Zou, Y.R.; Rabbany, S.Y.; Rafii, S.; Penn, M.S. Role of cardiac myocyte CXCR4 expression in development and left ventricular remodeling after acute myocardial infarction. Circ. Res. 2010, 107, 667–676. [Google Scholar] [CrossRef] [PubMed]
  36. Merkel, C.D.; Li, Y.; Raza, Q.; Stolz, D.B.; Kwiatkowski, A.V. Vinculin anchors contractile actin to the cardiomyocyte adherens junction. Mol. Biol. Cell. 2019, 30, 2639–2650. [Google Scholar] [CrossRef]
  37. Quaife-Ryan, G.A.; Mills, R.J.; Lavers, G.; Voges, H.K.; Vivien, C.J.; Elliott, D.A.; Ramialison, M.; Hudson, J.E.; Porrello, E.R. β-Catenin drives distinct transcriptional networks in proliferative and nonproliferative cardiomyocytes. Development 2020, 147, dev193417. [Google Scholar] [CrossRef]
  38. Kondo, T.; Takahashi, M.; Yamasaki, G.; Sugimoto, M.; Kuse, A.; Morichika, M.; Nakagawa, K.; Sakurada, M.; Asano, M.; Ueno, Y. Immunohistochemical analysis of vimentin expression in myocardial tissue from autopsy cases of ischemic heart disease. Leg. Med. 2022, 54, 102003. [Google Scholar] [CrossRef]
  39. Grimes, K.M.; Prasad, V.; McNamara, J.W. Supporting the heart: Functions of the cardiomyocyte’s non-sarcomeric cytoskeleton. J. Mol. Cell Cardiol. 2019, 131, 187–196. [Google Scholar] [CrossRef]
  40. Stathopoulou, K.; Schnittger, J.; Raabe, J.; Fleischer, F.; Mangels, N.; Piasecki, A.; Findlay, J.; Hartmann, K.; Krasemann, S.; Schlossarek, S.; et al. CMYA5 is a novel interaction partner of FHL2 in cardiac myocytes. FEBS J. 2022, 289, 4622–4645. [Google Scholar] [CrossRef]
  41. Ong, L.P.; Bargehr, J.; Knight-Schrijver, V.R.; Lee, J.; Colzani, M.; Bayraktar, S.; Bernard, W.G.; Marchiano, S.; Bertero, A.; Murry, C.E.; et al. Epicardially secreted fibronectin drives cardiomyocyte maturation in 3D-engineered heart tissues. Stem Cell Rep. 2023, 18, 936–951. [Google Scholar] [CrossRef] [PubMed]
  42. Heras-Bautista, C.O.; Mikhael, N.; Lam, J.; Shinde, V.; Katsen-Globa, A.; Dieluweit, S.; Molcanyi, M.; Uvarov, V.; Jütten, P.; Sahito, R.G.A.; et al. Cardiomyocytes facing fibrotic conditions re-express extracellular matrix transcripts. Acta Biomater. 2019, 89, 180–192. [Google Scholar] [CrossRef]
  43. Komati, H.; Nemer, M. Repairing hearts with AKT. Proc. Natl. Acad. Sci. USA 2015, 112, 13131–13132. [Google Scholar] [CrossRef]
  44. Vite, A.; Caporizzo, M.A.; Corbin, E.A.; Brandimarto, J.; McAfee, Q.; Livingston, C.E.; Prosser, B.L.; Margulies, K.B. Extracellular stiffness induces contractile dysfunction in adult cardiomyocytes via cell-autonomous and microtubule-dependent mechanisms. Basic Res. Cardiol. 2022, 117, 41. [Google Scholar] [CrossRef] [PubMed]
  45. Potta, S.P.; Liang, H.; Winkler, J.; Doss, M.X.; Chen, S.; Wagh, V.; Pfannkuche, K.; Hescheler, J.; Sachinidis, A. Isolation and functional characterization of alpha-smooth muscle actin expressing cardiomyocytes from embryonic stem cells. Cell Physiol. Biochem. 2010, 25, 595–604. [Google Scholar] [CrossRef] [PubMed]
  46. Hou, Q.; Hsu, Y.T. Bax translocates from cytosol to mitochondria in cardiac cells during apoptosis: Development of a GFP-Bax-stable H9c2 cell line for apoptosis analysis. Am. J. Physiol. Heart Circ. Physiol. 2005, 289, H477–H487. [Google Scholar] [CrossRef]
  47. van Beek-Harmsen, B.J.; van der Laarse, W.J. Immunohistochemical determination of cytosolic cytochrome C concentration in cardiomyocytes. J. Histochem. Cytochem. 2005, 53, 803–807. [Google Scholar] [CrossRef] [PubMed]
  48. Dabravolski, S.A.; Sukhorukov, V.N.; Kalmykov, V.A.; Orekhov, N.A.; Grechko, A.V.; Orekhov, A.N. Heat Shock Protein 90 as Therapeutic Target for CVDs and Heart Ageing. Int. J. Mol. Sci. 2022, 23, 649. [Google Scholar] [CrossRef]
  49. Zheng, D.; Zhang, M.; Liu, T.; Zhou, T.; Shen, A. Osteoprotegerin prompts cardiomyocyte hypertrophy via autophagy inhibition mediated by FAK/BECLIN1 pathway. Life Sci. 2021, 264, 118550. [Google Scholar] [CrossRef]
  50. Basheer, W.A.; Fu, Y.; Shimura, D.; Xiao, S.; Agvanian, S.; Hernandez, D.M.; Hitzeman, T.C.; Hong, T.; Shaw, R.M. Stress response protein GJA1-20k promotes mitochondrial biogenesis, metabolic quiescence, and cardioprotection against ischemia/reperfusion injury. JCI Insight 2018, 3, e121900. [Google Scholar] [CrossRef]
  51. Mohr, M.E.; Li, S.; Trouten, A.M.; Stairley, R.A.; Roddy, P.L.; Liu, C.; Zhang, M.; Sucov, H.M.; Tao, G. Cardiomyocyte-fibroblast interaction regulates ferroptosis and fibrosis after myocardial injury. iScience 2024, 27, 109219. [Google Scholar] [CrossRef]
  52. ISCN. ISCN 2020: An International System for Human Cytogenomic Nomenclature (2020) Reprint of Cytogenetic and Genome Research 2020, Vol. 160, No. 7–8; McGowan-Jordan, J., Hastings, R.J., Moore, S., Eds.; Karger: Basel, Switzerland, 2020; ISBN 978-3-318-06706-4. [Google Scholar] [CrossRef]
  53. ISCN. ISCN 2024: An International System for Human Cytogenomic Nomenclature (2024); McGowan-Jordan, J., Hastings, R.J., Moore, S., Eds.; Karger: Basel, Switzerland, 2024; ISBN 978-3-318-07330-0. [Google Scholar] [CrossRef]
  54. Koelsche, C.; Benhamida, J.K.; Kommoss, F.K.F.; Stichel, D.; Jones, D.T.W.; Pfister, S.M.; Heilig, C.E.; Fröhling, S.; Stenzinger, A.; Buslei, R.; et al. Intimal sarcomas and undifferentiated cardiac sarcomas carry mutually exclusive MDM2, MDM4, and CDK6 amplifications and share a common DNA methylation signature. Mod. Pathol. 2021, 34, 2122–2129. [Google Scholar] [CrossRef]
  55. Lamszus, K.; Kluwe, L.; Matschke, J.; Meissner, H.; Laas, R.; Westphal, M. Allelic losses at 1p, 9q, 10q, 14q, and 22q in the progression of aggressive meningiomas and undifferentiated meningeal sarcomas. Cancer Genet. Cytogenet. 1999, 110, 103–110. [Google Scholar] [CrossRef]
  56. Carneiro, A.; Francis, P.; Bendahl, P.O.; Fernebro, J.; Akerman, M.; Fletcher, C.; Rydholm, A.; Borg, A.; Nilbert, M. Indistinguishable genomic profiles and shared prognostic markers in undifferentiated pleomorphic sarcoma and leiomyosarcoma: Different sides of a single coin? Lab. Investig. 2009, 89, 668–675, Erratum in Lab. Investig. 2009, 89, 840. [Google Scholar] [CrossRef] [PubMed]
  57. Nanda, I.; Steinlein, C.; Haaf, T.; Buhl, E.M.; Grimm, D.G.; Friedman, S.L.; Meurer, S.K.; Schröder, S.K.; Weiskirchen, R. Genetic characterization of rat hepatic stellate cell line HSC-T6 for in vitro cell line authentication. Cells 2022, 11, 1783. [Google Scholar] [CrossRef]
  58. Gäberlein, K.; Schröder, S.K.; Nanda, I.; Steinlein, C.; Haaf, T.; Buhl, E.M.; Sauvant, P.; Sapin, V.; Abergel, A.; Weiskirchen, R. Genetic characterization of rat hepatic stellate cell line PAV-1. Cells 2023, 12, 1603. [Google Scholar] [CrossRef]
  59. Ben-David, U.; Siranosian, B.; Ha, G.; Tang, H.; Oren, Y.; Hinohara, K.; Strathdee, C.A.; Dempster, J.; Lyons, N.J.; Burns, R.; et al. Genetic and transcriptional evolution alters cancer cell line drug response. Nature 2018, 560, 325–330. [Google Scholar] [CrossRef] [PubMed]
  60. Zaaijer, S.; Groen, S.C.; Sanjana, N.E. Tracking cell lineages to improve research reproducibility. Nat. Biotechnol. 2021, 39, 666–670. [Google Scholar] [CrossRef]
  61. Koenig, A.L.; Shchukina, I.; Amrute, J.; Andhey, P.S.; Zaitsev, K.; Lai, L.; Bajpai, G.; Bredemeyer, A.; Smith, G.; Jones, C.; et al. Single-cell transcriptomics reveals cell-type-specific diversification in human heart failure. Nat. Cardiovasc. Res. 2022, 1, 263–280. [Google Scholar] [CrossRef] [PubMed]
  62. Salzillo, C.; La Verde, M.; Imparato, A.; Molitierno, R.; Lucà, S.; Pagliuca, F.; Marzullo, A. Cardiovascular diseases in public health: Chromosomal abnormalities in congenital heart disease causing sudden cardiac death in children. Medicina 2024, 60, 1976. [Google Scholar] [CrossRef]
  63. Goetze, J.P.; Bruneau, B.G.; Ramos, H.R.; Ogawa, T.; de Bold, M.K.; de Bold, A.J. Cardiac natriuretic peptides. Nat. Rev. Cardiol. 2020, 17, 698–717. [Google Scholar] [CrossRef]
  64. Zhu, S.; Li, W.; Zhou, H.; Wei, W.; Ambasudhan, R.; Lin, T.; Kim, J.; Zhang, K.; Ding, S. Reprogramming of human primary somatic cells by OCT4 and chemical compounds. Cell Stem Cell. 2010, 7, 651–655. [Google Scholar] [CrossRef]
  65. Patel, I.; Parchem, R.J. Regulation of Oct4 in stem cells and neural crest cells. Birth Defects Res. 2022, 114, 983–1002. [Google Scholar] [CrossRef]
  66. Wang, H.; Cao, N.; Spencer, C.I.; Nie, B.; Ma, T.; Xu, T.; Zhang, Y.; Wang, X.; Srivastava, D.; Ding, S. Small molecules enable cardiac reprogramming of mouse fibroblasts with a single factor, Oct4. Cell Rep. 2014, 6, 951–960. [Google Scholar] [CrossRef] [PubMed]
  67. Hescheler, J.; Meyer, R.; Plant, S.; Krautwurst, D.; Rosenthal, W.; Schultz, G. Morphological, biochemical, and electrophysiological characterization of a clonal cell (H9c2) line from rat heart. Circ. Res. 1991, 69, 1476–1486. [Google Scholar] [CrossRef] [PubMed]
  68. Watkins, S.J.; Borthwick, G.M.; Arthur, H.M. The H9C2 cell line and primary neonatal cardiomyocyte cells show similar hypertrophic responses in vitro. Vitr. Cell. Dev. Biol. Anim. 2011, 47, 125–131. [Google Scholar] [CrossRef] [PubMed]
  69. Zordoky, B.N.; El-Kadi, A.O. H9c2 cell line is a valuable in vitro model to study the drug metabolizing enzymes in the heart. J. Pharmacol. Toxicol. Methods 2007, 56, 317–322. [Google Scholar] [CrossRef]
Figure 1. Light microscopic appearance of H9c2 cells. (A,B) In culture, H9c2 cells typically have a fibroblast-like morphology, with elongated and spindle-shaped cells that can form a confluent monolayer. They also show a high degree of adherence to the culture substrate, allowing them to grow in a dense configuration. The magnifications are as follows: 100× (A) and 200× (B). The scale bars represent 100 µm.
Cells 14 00502 g001
Figure 2. Electron microscopic appearance of H9c2 cells. (AF) H9c2 cells display an elongated spindle-shaped morphology with a centrally located nucleus (N). Mitochondria (M) are visible as elongated or spherical organelles with double membranes and cristae. The cytoplasm contains lipid droplets (LD), lysosomes (Ly), ribosomes (R), and vesicles (V). The endoplasmic reticulum (rER) of H9c2 cells forms a network of membranous tubules and flattened sacs, with rough endoplasmic reticulum identifiable by ribosomes on its surface. The images were captured at (A) 2156×, (B) 10,000×, (C,D) 21,560×, and (E,F) 27,800×, respectively.
Cells 14 00502 g002
Figure 3. Protein expression in H9c2 cells. Cell protein extracts were prepared from H9c2 cells and rat heart tissue. The proteins (50 µg protein per lane) were then analyzed by Western blot to determine the expression of specific proteins. Ponceau S staining and probing with a glyceraldehyde 3-phosphate dehydrogenase (GAPDH)-specific antibody were used as controls to ensure equal protein loading. Size markers are indicated on the left margin of each Western blot.
Cells 14 00502 g003
Figure 4. F-actin cytoskeleton staining in H9c2 cells. The cytoskeleton of cultured H9c2 cells was labeled with Alexa Fluor 488TM-labeled Phalloidin conjugate (green) and nuclei were counterstained with DAPI (blue). Images were captured using a Nikon Eclipse E80i fluorescence microscope at 200×, 400×, or 600× magnification. Scale bars at the different magnifications are indicated in the images.
Cells 14 00502 g004
Figure 5. Karyogram analysis and mFISH results of the H9c2 cell line. The left panel displays a representative image of inverted DAPI-banding. The right panel shows a representative mFISH result of the same metaphase, generated using the commercially available 22xRat probe. In this analysis, interchromosomal rearrangements in H9c2 chromosomes are visible as color changes within single chromosomes. The color code for each chromosome is provided at the bottom of this panel. Evaluation of this analysis, according to the International System for Human Cytogenomic Nomenclature (ISCN) nomenclature, revealed the following karyotype [52,53]: 74-81<3n>,X,del(X)(q2?q3?),+1,+del(1)(q?12),del(2)(q?13),−3,−3,−3,+6,+9,+der(12)t(3;12)(q11;q1?2)×3,+der(12)(X;12)(q?3;q1?2),+14,del(20)(q10),+del(20)(p10)[cp12].
Cells 14 00502 g005
Figure 6. Virtual Comparative Genomic Hybridization results for the H9c2 cell line, translated into the human genome. Copy number alterations are depicted using a color code, with shades of red representing losses and green indicating gains.
Cells 14 00502 g006
Table 1. Primary and secondary antibodies used for Western blot analysis, listed in alphabetical order 1.
AntibodyCat. no.CompanyDilutionClonality
α-Actinin 16487Cell Signaling Technology, Leiden, The Netherlands1:1000r mAb
α-Actinin 2A7811Sigma-Aldrich, Merck, Taufkirchen, Germany1:10,000m mAb
α-SMACBL171-ISigma-Aldrich, Merck, Taufkirchen, Germany1:1000m mAb
α-Tubulin (B-7)sc-5286Santa Cruz, Santa Cruz, CA, USA1:1000m mAb
β-ActinA5441Sigma-Aldrich, Merck, Taufkirchen, Germany1:10,000m mAb
β-Catenin (E-5)sc-7963Santa Cruz, Santa Cruz, CA, USA1:1000m mAb
Acsl14047SCell Signaling Technology, Leiden, The Netherlands1:1000r pAb
Akt (pan) (11E7)4685Cell Signaling Technology, Leiden, The Netherlands1:1000r mAb
Bax2772SCell Signaling Technology, Leiden, The Netherlands1:1000r pAb
Beclin-1 (D40C5)3495Cell Signaling Technology, Leiden, The Netherlands1:1000r mAb
Collagen I14695-1-APProteintech, Chromo Tek GmbH, Planegg-Martinsried, Germany1:1000r pAb
Collagen III22734-1-APProteintech, Chromo Tek GmbH, Planegg-Martinsried, Germany1:1000r pAb
Connexin 43 (C-20)sc-6560-RSanta Cruz, Santa Cruz, CA, USA1:1000r pAb
Cytochrome c (D18C7)11940Cell Signaling Technology, Leiden, The Netherlands1:1000r mAb
Ferritin heavy chain (B-12)sc-376594Santa Cruz, Santa Cruz, CA, USA1:500m mAb
Fhl2AF4758R&D Systems, Bio-Techne, Abingdon, UK1:500g pAb
FibronectinAB1954Sigma-Aldrich, Merck, Taufkirchen, Germany1:3000r pAb
GAPDH (6C5)sc-32233Santa Cruz, Santa Cruz, CA, USA1:1000m mAb
HSP90 (C45G5)4877Cell Signaling Technology, Leiden, The Netherlands1:1000r mAb
Troponin I (cardiac)ab209809Abcam, Cambridge, UK1:1000r mAb
Troponin T (cardiac)5593Cell Signaling Technology, Leiden, The Netherlands1:1000r pAb
Vimentinab92547Abcam, Cambridge, UK1:3000r mAb
Vinculin66305-1-IgProteintech, Chromo Tek GmbH, Planegg-Martinsried, Germany1:5000m mAb
Goat anti-rabbit IgG (H+L), HRP31460Invitrogen, Thermo Fisher Scientific, Schwerte, Germany1:5000g
Goat anti-mouse IgG (H+L), HRP31430Invitrogen, Thermo Fisher Scientific, Schwerte, Germany1:5000r
Mouse anti-goat IgG (H+L), HRP31400Invitrogen, Thermo Fisher Scientific, Schwerte, Germany1:5000m
1 Abbreviations: g, goat; m, mouse; mAb, monoclonal antibody; pAb, polyclonal antibody; r, rabbit.
Table 2. Myosin gene expression in H9c2 cells supporting their cardiac origin.
Transcript Id 1Gene IdGeneGene DescriptionTPM
ENSRNOT00000018097
ENSRNOT00000119402
ENSRNOT00000112334
ENSRNOT00000017838
ENSRNOT00000119402
ENSRNOG00000013262Myl1myosin light chain 15.163359
0.648313
1.223487
1.103736
0.648313
ENSRNOT00000072480
ENSRNOT00000101539
ENSRNOG00000050675Myl4myosin light chain 442.672105
0.14434
ENSRNOT00000089074
ENSRNOT00000099810
ENSRNOT00000082518
ENSRNOT00000094248
ENSRNOT00000107790
ENSRNOT00000085644
ENSRNOG00000054140Myl6myosin light chain 61846.647426
874.627113
25.302537
24.381243
19.012288
11.635463
ENSRNOT00000048453ENSRNOG00000028837LOC120093525myosin light chain 6B43.718117
ENSRNOT00000027445ENSRNOG00000020246Myl9myosin light chain 91155.386796
ENSRNOT00000023944
ENSRNOT00000112797
ENSRNOG00000017645Myl11myosin light chain 11285.690465
0.824397
ENSRNOT00000021048
ENSRNOT00000111518
ENSRNOT00000105340
ENSRNOT00000117541
ENSRNOT00000108694
ENSRNOT00000048125
ENSRNOG00000015278Myl12bmyosin light chain 12B624.478983
396.879829
166.614506
95.549881
0.898159
0.864107
ENSRNOT00000004236ENSRNOG00000065740Myh2myosin heavy chain 20.672346
ENSRNOT00000004147
ENSRNOT00000115161
ENSRNOG00000046276Myh3myosin heavy chain 3103.894988
0.387361
ENSRNOT00000004295
ENSRNOT00000082871
ENSRNOT00000045718
ENSRNOG00000049695Myh4myosin heavy chain 433.85847
0.142894
0.086715
ENSRNOT00000115198ENSRNOG00000025757Myh6myosin heavy chain 60.050162
ENSRNOT00000024186ENSRNOG00000016983Myh7myosin heavy chain 70.048688
ENSRNOT00000025859ENSRNOG00000018997Myh7bmyosin heavy chain 7B0.608836
ENSRNOT00000105953ENSRNOG00000068010Myh8myosin heavy chain 80.080643
ENSRNOT00000037611
ENSRNOT00000007398
ENSRNOT00000116925
ENSRNOT00000119854
ENSRNOG00000049236Myh9myosin heavy chain 9859.802126
397.860041
10.572224
0.960109
ENSRNOT00000105761
ENSRNOT00000113616
ENSRNOT00000065895
ENSRNOG00000002886Myh10myosin heavy chain 1083.625491
31.943467
19.761232
ENSRNOT00000084608
ENSRNOT00000112644
ENSRNOG00000057880Myh11myosin heavy chain 114.104926
1.264626
ENSRNOT00000118051ENSRNOG00000067378Myh13myosin heavy chain 130.010706
ENSRNOT00000091760ENSRNOG00000020014Myh14myosin heavy chain 140.04009
ENSRNOT00000090307ENSRNOG00000061038Myh15myosin heavy chain 151.364068
ENSRNOT00000106031ENSRNOG00000004177Myo1amyosin IA0.158265
ENSRNOT00000068433
ENSRNOT00000108379
ENSRNOT00000118845
ENSRNOG00000048152Myo1bmyosin Ib1.012463
0.817926
0.124786
ENSRNOT00000117022
ENSRNOT00000036666
ENSRNOT00000108756
ENSRNOT00000101210
ENSRNOG00000004072Myo1cmyosin 1C256.059864
57.901436
15.070173
5.120976
ENSRNOT00000004609
ENSRNOT00000108255
ENSRNOG00000003276Myo1dmyosin ID92.963065
0.537064
ENSRNOT00000104863ENSRNOG00000061928Myo1emyosin IE56.688608
ENSRNOT00000011513
ENSRNOT00000110236
ENSRNOG00000008409Myo1fmyosin IF1.427103
0.040403
ENSRNOT00000119331ENSRNOG00000059140Myo1gmyosin IG0.101252
ENSRNOT00000078807ENSRNOG00000047191Myo1hmyosin IH0.037109
ENSRNOT00000109142
ENSRNOT00000082288
ENSRNOT00000102636
ENSRNOT00000091789
ENSRNOG00000058866Myo5amyosin VA25.016567
9.28073
8.944404
0.299799
ENSRNOT00000094389
ENSRNOT00000019512
ENSRNOG00000014104Myo5bmyosin Vb5.440433
1.151928
ENSRNOT00000120263
ENSRNOT00000108142
ENSRNOT00000112254
ENSRNOG00000011852Myo6myosin VI25.109277
1.384369
0.20236
ENSRNOT00000019053
ENSRNOT00000103282
ENSRNOG00000013641Myo7amyosin VIIA26.382815
11.975166
ENSRNOT00000046864ENSRNOG00000015035Myo7bmyosin VIIb0.009858
ENSRNOT00000104304
ENSRNOT00000103923
ENSRNOT00000015963
ENSRNOT00000118561
ENSRNOG00000011619Myo9amyosin IXA6.65948
4.352163
3.013147
0.953695
ENSRNOT00000045099
ENSRNOT00000083651
ENSRNOT00000081321
ENSRNOG00000016256Myo9bmyosin IXb16.306978
15.395789
1.48221
ENSRNOT00000065897
ENSRNOT00000102421
ENSRNOG00000010161Myo10myosin X61.874959
1.946731
ENSRNOT00000079133ENSRNOG00000059219Myo15amyosin XVA0.017051
ENSRNOT00000035001ENSRNOG00000042445Myo15bmyosin XVB0.023935
ENSRNOT00000088919
ENSRNOT00000109794
ENSRNOT00000102240
ENSRNOT00000110549
ENSRNOT00000100376
ENSRNOG00000033101Myo18amyosin XVIIIa17.10711
14.92682
13.895175
0.924955
0.563736
ENSRNOT00000098133ENSRNOG00000048430Myo18bmyosin XVIIIb0.048917
ENSRNOT00000003886
ENSRNOT00000119574
ENSRNOG00000002852Myo19myosin XIX8.602543
1.680903
ENSRNOT00000050443
ENSRNOT00000110793
ENSRNOT00000041328
ENSRNOT00000114924
ENSRNOG00000018630LOC108351137glyceraldehyde-3-phosphate dehydrogenase2955.510839
902.439425
147.63458
41.959217
1 For comparison of transcript levels of the listed genes, the expression of glyceraldehyde-3-phosphate dehydrogenase (LOC108351137) is shown. This gene is known to have consistent expression in the human heart, regardless of the presence of heart failure, and regardless of the specific part of the heart [28]. The complete mRNA expression profile of H9c2 cells observed by NGS can be found in Table S1. TPM, Transcripts Per Million.
Table 3. Selected gene expression in H9c2 cells supporting their cardiac origin.
Transcript Id 1Gene IdGeneGene DescriptionTPM
ENSRNOT00000091560
ENSRNOT00000079824
ENSRNOT00000088795
ENSRNOT00000112260
ENSRNOG00000056756Actn1actinin, alpha 1360.869674
121.742056
95.274999
1.456574
ENSRNOT00000101663
ENSRNOT00000101075
ENSRNOG00000017833Actn2actinin, alpha 20.988042
0.866778
ENSRNOT00000011773
ENSRNOT00000116592
ENSRNOG00000008536Actc1actin, alpha, cardiac muscle 129.680643
0.241854
ENSRNOT00000089988ENSRNOG00000001821Adipoqadiponectin, C1Q and collagen domain containing0.088185
ENSRNOT00000005551
ENSRNOT00000119052
ENSRNOT00000102094
ENSRNOG00000004143Adipor1adiponectin receptor 1219.61476
0.5584
0.233142
ENSRNOT00000010556ENSRNOG00000007990Adipor2adiponectin receptor 291.021116
ENSRNOT00000104562
ENSRNOT00000002738
ENSRNOG00000001989Alcamactivated leukocyte cell adhesion molecule34.73353
10.607857
ENSRNOT00000108356
ENSRNOT00000025258
ENSRNOT00000120144
ENSRNOT00000097402
ENSRNOT00000117221
ENSRNOT00000108831
ENSRNOG00000018598Ankrd1ankyrin repeat domain 11099.57145
696.594054
536.462968
127.375767
125.63322
0.202132
ENSRNOT00000024347
ENSRNOT00000001738
ENSRNOG00000001285Atp2a2ATPase sarcoplasmic/endoplasmic reticulum Ca2+ transporting 2163.17185
128.264822
ENSRNOT00000019554
ENSRNOT00000111490
ENSRNOT00000109811
ENSRNOT00000108710
ENSRNOT00000113833
ENSRNOT00000116052
ENSRNOG00000014453Anxa5annexin A5326.883008
326.883008
7.961338
1.032791
0.881536
0.076392
ENSRNOT00000106165
ENSRNOT00000111975
ENSRNOT00000096029
ENSRNOT00000014464
ENSRNOT00000119845
ENSRNOG00000010668Anxa6annexin A6292.28195
104.941243
68.292397
2.736565
1.174227
ENSRNOT00000073636
ENSRNOT00000080190
ENSRNOG00000047466Bdnfbrain-derived neurotrophic factor22.063067
2.770632
ENSRNOT00000083268
ENSRNOT00000012957
ENSRNOG00000009694Bmp4bone morphogenetic protein 441.067185
28.953671
ENSRNOT00000080271ENSRNOG00000057713Cav2caveolin 238.392081
ENSRNOT00000007601ENSRNOG00000005798Cav3caveolin 335.815516
ENSRNOT00000115561ENSRNOG00000015602Cdh2cadherin 20.034055
ENSRNOT00000019652ENSRNOG00000014254Cpt1acarnitine palmitoyltransferase 1A21.367628
ENSRNOT00000080598
ENSRNOT00000067011
ENSRNOT00000097951
ENSRNOG00000003772Csrp2cysteine and glycine-rich protein 246.077184
15.957459
5.717219
ENSRNOT00000101345
ENSRNOT00000079085
ENSRNOG00000054172Ctnnb1catenin beta 1148.736322
133.524514
ENSRNOT00000026860ENSRNOG00000019810Desdesmin4.863506
ENSRNOT00000081061
ENSRNOT00000034372
ENSRNOT00000094721
ENSRNOT00000091467
ENSRNOT00000109716
ENSRNOG00000046366Dmddystrophin5.83409
4.877158
4.242989
3.755658
2.561635
ENSRNOT00000005612
ENSRNOT00000118138
ENSRNOT00000096738
ENSRNOG00000004078Eno3enolase 333.28236
24.245848
0.551336
ENSRNOT00000017325ENSRNOG00000012879Fabp3
(H-Fabp)
fatty acid binding protein 313.928079
ENSRNOT00000023388ENSRNOG00000017392Fgf2fibroblast growth factor 21.080419
ENSRNOT00000114387
ENSRNOT00000101412
ENSRNOT00000023014
ENSRNOG00000016866Fhl2four and a half LIM domains 277.911289
59.661397
45.106886
ENSRNOT00000014320ENSRNOG00000010708Gata4GATA binding protein 44.261875
ENSRNOT00000081399ENSRNOG00000023433Gata6GATA binding protein 611.70926
ENSRNOT00000001054
ENSRNOT00000100494
ENSRNOG00000000805Gja1gap junction protein, alpha 199.918567
17.905309
ENSRNOT00000079552ENSRNOG00000060448Hand2
(dHand)
heart and neural crest derivatives expressed 270.427748
ENSRNOT00000118307
ENSRNOT00000085680
ENSRNOT00000005995
ENSRNOG00000004517Igf1insulin-like growth factor 122.187026
1.599373
1.449521
ENSRNOT00000020885
ENSRNOT00000117668
ENSRNOG00000015068Il11rainterleukin 11 receptor subunit alpha 128.250421
0.130904
ENSRNOT00000019844ENSRNOG00000014426Loxlysyl oxidase279.086949
ENSRNOT00000076230
ENSRNOT00000076992
ENSRNOT00000076481
ENSRNOT00000075931
ENSRNOT00000076136
ENSRNOG00000033134Mef2cmyocyte enhancer factor 2C21.461792
10.307472
2.878599
2.158897
0.445899
ENSRNOT00000055680ENSRNOG00000046424Mfn2mitofusin 265.615575
ENSRNOT00000051121ENSRNOG00000008658MitfMelanocyte inducing transcription factor3.362071
ENSRNOT00000042686ENSRNOG00000031093Mov10l1Mov10 like RISC complex RNA helicase 10.030013
ENSRNOT00000028155ENSRNOG00000020747Nkx2-5NK2 homeobox 50.319419
ENSRNOT00000026212
ENSRNOT00000104296
ENSRNOG00000019322Notch1notch receptor 18.838129
0.095737
ENSRNOT00000090547
ENSRNOT00000102686
ENSRNOG00000054212Pde1aphosphodiesterase 1A1.752889
0.660082
ENSRNOT00000111781
ENSRNOT00000101684
ENSRNOT00000113369
ENSRNOT00000066384
ENSRNOT00000110594
ENSRNOT00000112056
ENSRNOG00000042536Pde4dphosphodiesterase 4D9.706262
7.996515
2.912791
1.736483
0.588956
0.028455
ENSRNOT00000073486ENSRNOG00000046057Pnmtphenylethanolamine-N-methyltransferase0.161158
ENSRNOT00000028636ENSRNOG00000021090Pygmglycogen phosphorylase, muscle associated20.312461
ENSRNOT00000008319
ENSRNOT00000075962
ENSRNOT00000067543
ENSRNOT00000091249
ENSRNOG00000005906Rgd1565355 (CD36)similar to fatty acid translocase/CD360.680231
0.346115
0.162213
0.109615
ENSRNOT00000111439ENSRNOG00000017060Ryr2ryanodine receptor 20.00405
ENSRNOT00000084391ENSRNOG00000000565Sgpl1sphingosine-1-phosphate lyase 1122.518127
ENSRNOT00000025606
ENSRNOT00000094646
ENSRNOG00000018943Tnnc1troponin C1, slow skeletal and cardiac type140.282686
69.212851
ENSRNOT00000110513ENSRNOG00000018250Tnni3troponin I3, cardiac type0.528838
ENSRNOT00000034957
ENSRNOT00000058843
ENSRNOG00000028041Tnnt1troponin T1, slow skeletal type86.297291
4.163693
ENSRNOT00000084986
ENSRNOT00000108522
ENSRNOT00000047682
ENSRNOT00000050284
ENSRNOG00000033734Tnnt2troponin T2, cardiac type385.200438
161.390324
130.206578
6.04521
ENSRNOT00000057641
ENSRNOT00000024575
ENSRNOT00000048044
ENSRNOT00000090288
ENSRNOT00000085894
ENSRNOT00000024617
ENSRNOT00000099012
ENSRNOT00000040808
ENSRNOT00000112475
ENSRNOT00000024493
ENSRNOG00000018184Tpm1tropomyosin 1609.160335
394.939461
348.84129
309.385315
250.542706
70.487194
62.960197
23.306842
9.964889
9.432292
ENSRNOT00000026493ENSRNOG00000019486Trpv1transient receptor potential cation channel, subfamily V, member 10.210286
ENSRNOT00000108121
ENSRNOT00000101577
ENSRNOT00000107188
ENSRNOT00000114553
ENSRNOG00000069271Ttntitin2.315625
1.775349
0.597153
0.459324
ENSRNOT00000027487
ENSRNOT00000076187
ENSRNOG00000020276Tnnt2troponin I2, fast skeletal type10.186619
0.503748
ENSRNOT00000014127
ENSRNOT00000079275
ENSRNOG00000010390Hmbshydroxymethylbilane synthase27.1177
0.615926
ENSRNOT00000096774
ENSRNOT00000035628
ENSRNOG00000008195Ywhaztyrosine 3-monooxygenase/tryptophan 5-monooxygenase activation protein, zeta529.169941
197.545795
1 For comparison of transcript levels of the listed genes, the expression of hydroxymethylbilane synthase (Hbms) and tyrosine 3-monooxygenase/tryptophan 5-monooxygenase activation protein, zeta (Ywhaz) are depicted. These genes are frequently used as housekeeping genes in gene expression studies in human cardiomyoctes [28]. The complete mRNA expression profile of H9c2 cells observed by NGS can be found in Table S1. TPM, Transcripts Per Million.
Table 4. Losses and gains of chromosomal regions in H9c2 cells based on mFISH and inverted DAPI-banding analyses 1.
Rat RGSC 5.0/rn5Human GRCh37/hg19
Gain
1pter->1q?12 (+2) =>
1pter->1q12
1-755158066q22.31q27
5pterp15.31
5q15q15
1q12->1qter (+1)75515807-29009421610q23.2q26.3
11q12.1q14.3
15q25.1qter
11p15.4p15.2
19q12q13.33
9q21.11q21.31
9pterp24.1
16p12.3p11.2
2pter->q?13 => (+1)
2pter->2q13
1-408828135q14.1q15
6pter->6qter (+1)1-15689750814q12q32.33
2pterp16.3
7p21.2p15.3
7q22.3q31.1
9pter->9qter (+1)1-1215495912q32.1qter
6p21.2q13
2q11.2q12.2
18p11.32p11.22
5q21.1q22.1
+12pter->q1?2 (+4) =12pter->q121-3124770913q12.13q13.2
7pterp22.1
7q11.21q11.22
7q21.2q22.1
7q11.23q11.23
14pter->14qter (+1)1-1151517014pter->q22.1
2p16.2p14
7p13p12.1
22q12.1q12.3
1p22.2p22.1
Xq3?->Xqter (+1) =>
Xq34->Xqter
111295344-154597545Xq22.3q37.3
Loss
3pter->3q11 (−3)1-229003719q33.2q34.3
2q13q13
Xq2?->Xq3? (−1) =>
Xq22->Xq34
57322686-111295344Xp22.11q22.3
1 For each region, the cytogenetic span and approximate molecular span in the rat genome are provided, along with the approximate cytogenetic span when projected onto the human genome. In cases where breakpoints were not exactly determined, they were transformed into the most likely regions of copy number alterations (CNAs) as highlighted by a => number of gains or losses indicated in curly brackets. The question mark (?) in karyotype analysis indicates uncertainty in identifying a chromosome or chromosome structure. In this case, the breakpoint region cannot be definitively defined.
Table 5. STR-based DNA profiling of H9c2 cells using 31 species-specific STR markers.
Allele Sizes (bp) in
SNMarker Name 1Location on ChromosomeH9c2CFSC-2GHSC-T6PAV-1Rat-1
1731211194, 203194194211, 213
282195236234234, 238232, 236
322127126127128129
443250, 252268, 270238236, 238250, 252
533160160, 182160, 162162178, 182
6264148150166154162
7194174180175179176, 178
8815127130, 134130, 132130128
9346193184, 189188182, 187184, 189
10307192, 194188, 192186, 192192186
11248258, 260260249, 253254, 259247, 249
12599143, 145145143, 146, 180145, 148176, 178
13629154166177166154
141101041059696, 10596
155510205, 207210, 214210, 218210, 218203, 205
163611263222234222228
176711161154, 156165165165, 167
181312121121121, 135121121
193513203197197, 203203203
204213149125127144, 156154, 156
217014175158, 175175, 179158, 175158
226115128128128128110
237915172172, 180172172172
249016172, 174159, 161174175159, 161
256916143138139136, 139148
267817151, 153136, 151147, 151147, 149136, 140
271518232232232232238
281618243251, 260247, 251251247, 251
297519140144144, 184144, 184144
309620240210210, 212210208, 210
319120221221205, 211211, 225219, 221
1 Testing was conducted using the CellCheckTM Rat Panel (IDEXX BioAnalytics, Columbia, MO, USA).
Disclaimer/Publisher’s Note: The statements, opinions and data contained in all publications are solely those of the individual author(s) and contributor(s) and not of MDPI and/or the editor(s). MDPI and/or the editor(s) disclaim responsibility for any injury to people or property resulting from any ideas, methods, instructions or products referred to in the content.

